
Submitted:
22 January 2025
Posted:
23 January 2025
You are already at the latest version
Abstract
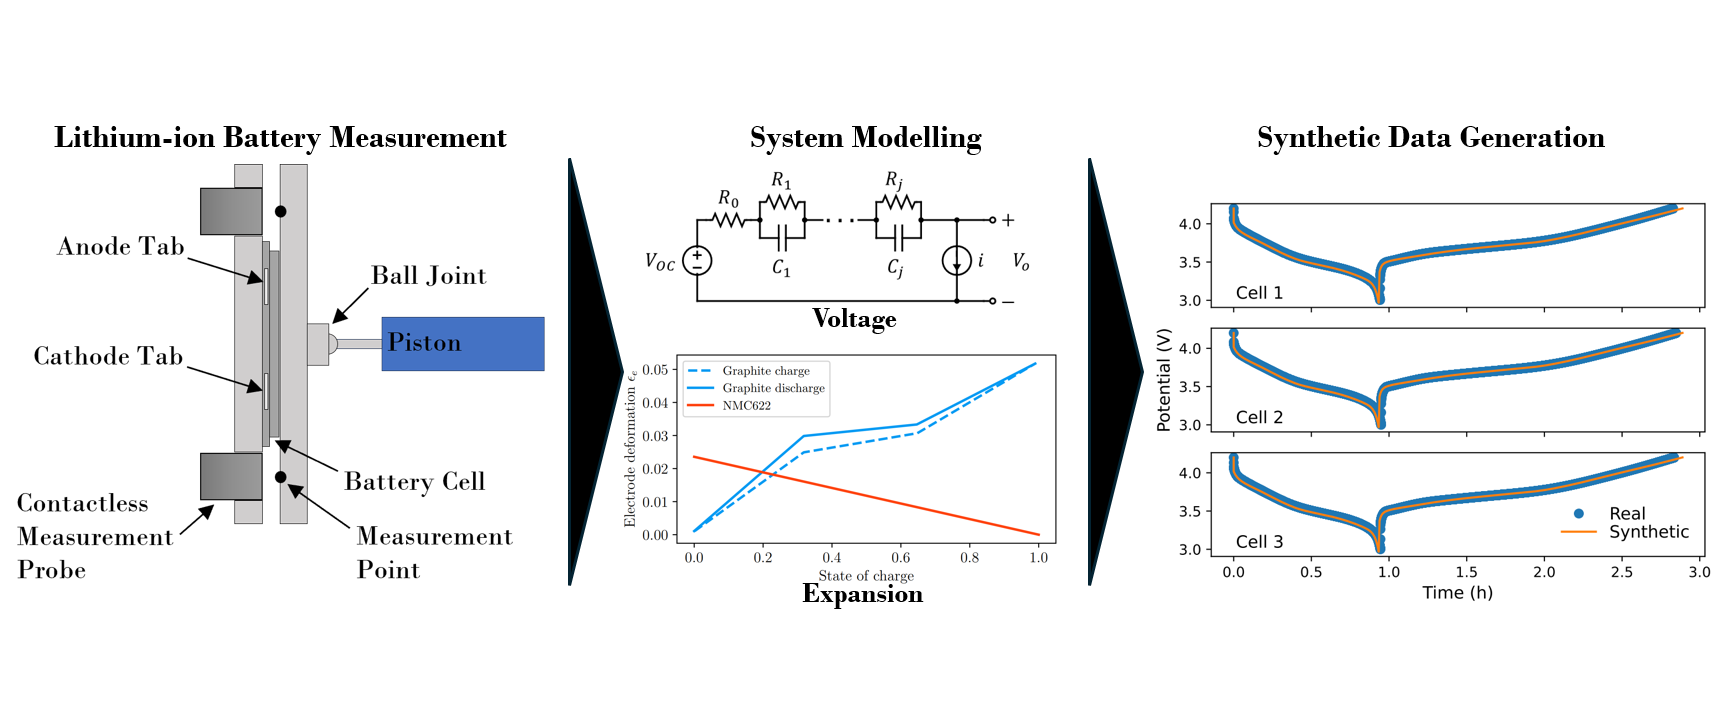
Lithium-ion batteries are a key technology in supply chains for modern electric vehicles. The production of lithium-ion batteries is complex and can be prone to defects. As such, the detection of defective batteries at end-of-line is critical to ensure performance and safety for the consumer. Existing end-of-line testing relies heavily on electrical measurements for identifying defective cells. However, it is possible that not all pertinent information is encoded within the electrical measurements alone. Reversible expansion in lithium-ion cells is an indicator of lithiation within the cell, while irreversible expansion is a consequence of the ageing process, unexpected expansion may indicate the presence of undesirable defects.. By measuring expansion in addition to electrical measurements, we aim to make better and faster quality predictions during end-of-line testing, thereby facilitating the early detection of potential defects.. To make these predictions, we implement artificial intelligence algorithms to extract information from the measurements. The training of these networks requires large amounts of training data, which is expensive to produce. In this paper, we demonstrate a first order physical modelling approach for generating synthetic data to pretrain artificial intelligence algorithms that perform anomaly detection on lithium-ion battery cells at end-of-line. By pretraining the artificial intelligence network using synthetic data, we can leverage existing physical models to reduce the amount of training data required.
Keywords:
Lithium-ion Battery
; End-of-Line Testing
; System modelling
; Artificial Intelligence
; Cell expansion
; Cell Defects
1. Introduction
The production of lithium-ion batteries is a critical process in the manufacturing of modern electric vehicles. Lithium-ion battery technology requires complex, multi-step processes to generate cells, in which defects are likely to arise in various stages. These defects can have effects ranging from poor electrical performance to catastrophic thermal runaway, both of which must be avoided. Even a small number of defective cells can pose significant dangers to people and infrastructure; this underscores the necessity to identify and mitigate potential safety risks as much as possible to avoid both loss of trust in the technology and economic consequences for manufacturers.
As such, end-of-line testing is an important step in ensuring the safety and performance of products that contain lithium-ion battery cells. Existing end-of-line testing approaches typically rely on electrical and temperature measurements during battery cell testing. Lithium-ion battery cells experience reversible swelling due to the intercalation and deintercalation of lithium-ions into and out of the active materials within the cell. In addition to the unavoidable ageing process, irreversible expansion can occur due to undesirable gas formation, formation of the sei and lithium plating, among other undesirable events within the cell. By characterizing the volume expansion of these cells, in addition to standard electrical and temperature measurements, there lies the possibility of gaining additional insights into the quality of cells during final testing.
The resulting data from these end-of-line tests will be complex multivariate time series data. Artificial intelligence algorithms have shown promise in extracting meaningful information from multivariate time series data, such as those we are collecting. These algorithms typically require a large amount of training data, which for end-of-line battery testing is expensive and time consuming to generate. In this paper, we propose a first-order physical model to generate synthetic cycling data for pre-training and evaluating the usefulness of artificial intelligence networks.The intention of this synthetic data is for the pre-training and evaluation of unsupervised methods, therefore we only must consider the modelling of normal, and not defective, lithium-ion battery cells.
2. Background
End-of-line testing is an ubiquitous step performed at the end of the battery manufacturing process. Not only to remove defective cells, but also to assign grades indicating performance. End-of-line testing can involve visual inspection and various electrical measurements to ensure the cell meets design requirements [1,2,3]. Currently, there is no universally accepted standard for these end-of-line tests, and each cell manufacturer employs its own procedures.
In addition to electrical measurements, one could also measure the volume expansion of the battery cell to gain greater insights. Volume expansion in lithium-ion cells has irreversible and reversible manifestations; both modes of expansion provide valuable information regarding potential performance and manufacturing defects. Manufacturing defects could include issues such as uneven electrode coating, metal particle contamination, poor electrode sheet alignment, and compromised separator material, among others [4]. Irreversible expansion can be caused by the formation of the sei layer, results of gas formation, or lithium plating, all of which are a result of undesirable electrochemical reactions occurring within the cell [5,6]. Reversible expansion is inherent during charge/discharge cycles because it is a product of the intercalation of lithium ions between the positive and negative electrodes [7]. A number of researchers have measured battery expansion during ageing, however the goal of their research was to validate battery expansion models, rather than to identify defects within the cells [8,9].
To extract information from the multivariate time series generated during end-of-line tests, artificial intelligence methods have shown promise in both anomaly detection and classification applications [10,11]. Artificial intelligence is already being used for assessing performance and quality in lithium-ion batteries. When large amounts of training data are available, ai algorithms can glean more information from datasets than is possible with more traditional data analysis techniques [12]. One of the most common use cases for ai in lithium-ion battery applications is for rul predictions [13,14]. In rul applications, large datasets can be generated using relatively few batteries. These datasets typically include information on time, current, voltage, and temperature, and are collected over several months through continuous charging and discharging of the batteries. Some researchers have attempted to use artificial intelligence to improve quality assurance. In comparison to rul prediction, where multiple datasets can be generated from a single battery, quality assurance prediction necessitates one battery cell for every training sample. Generating a dataset that includes both normal and abnormal cells is particularly challenging and costly because it is rare to find multiple cells displaying the same type and position of defects. Moreover, these cells must be managed under the strictest safety conditions due to their potential risk of fire and explosion [4,15]. The controlled introduction of relevant defects is also very time-consuming and safety-critical [16]. To circumvent expensive and time-consuming dataset generation, some researchers are developing quality assurance predictors trained on synthetic data. Jia et al. created an internal short circuit classifier, trained on nearly exclusively simulation data [17]. Another example is the work of Turetskyy et al., who trained a neural network to solve for unknown parameters in electrochemical models, using simulated voltage and current curves, as well as electrode information [18]. Both works showed accurate predictions on computer generated training data.
3. Methods and Materials
3.1. Measurement During Cell Cycling
The pouch cells used in this study have a nominal capacity of 1 and are composed of a nmc cathode and an artificial graphite anode. The cells have a dimension of 66 mm by 51 mm by 3 mm. Cycling was performed using a Basytec CTS Standard battery tester. To avoid inducing thermal expansion Cycling was performed with C charge current and 1 C discharge current. Data from the battery tester was acquired with a sampling rate of 1 . The recorded cycles are conducted on new, unaged cells.
In our previous study, the pouch cells were cycled without any external pressure [19]. These measurements were performed to assess the homogeneity of swelling across the cell’s surface during cycling. However, in practice, pouch cells are nearly always cycled under compression to prevent delamination and ensure good contact between the various components within the cell [20,21,22].
A testing setup, developed by Fraunhofer ISE [23], was used to compress the battery cell in a vertical position. The apparatus is shown in Figure 1. To achieve compression, the test rig is composed of two pressure plates: one fixed and one moveable. A pneumatic cylinder applies a defined force against the moveable pressure plate and holds it in place. At the connection point between the movable pressure plate and the pneumatic cylinder piston, a ball joint is utilized. This ball joint allows the pressure plate to move in the direction of the piston as the cell expands uniformly, and rotate with respect to any non-uniform expansion of the battery cell. Three displacement sensors, which are connected to the fixed pressure plate, can measure this uniform or non-uniform movement of the moveable pressure plate. We utilize chromatic confocal point sensors produced by Precitec Optronik GmbH with a 2 measurement range, a linearity of 260 , and a measurement spot size of 6 . This design enables the measurement of the spatially resolved expansion and contraction of the battery cell.
To ensure constant temperature conditions, the entire cycling program was performed in a climate chamber, a KB 720 produced by Binder GmbH, held at a temperature of 25 °C.
3.2. Cell Characterization
To perform equivalent circuit modelling, an open circuit voltage (OCV) curve is necessary. This curve was generated by charging the battery cell up to its upper cut-off voltage of with a charging rate of C/10. A resting phase of 1 was implemented to ensure thermal equilibrium after charging the battery cell. Discharging was then carried out with a discharge rate of C/10 in steps of 2 % dod until reaching the lower cut-off voltage of . These dod steps were determined using coulomb counting. After every 2 % dod discharge step, a resting phase of 1 was performed. A voltage drop can be seen at the beginning of the rest phase. This resting phase is then used to determine a thermal equilibrium as well as a load-free voltage level. At the end of the rest phase the voltage level is taken to be the OCV at the corresponding soc. The measurement used to generate the OCV curve discharge is shown below in Figure 2.
3.3. Modelling
To simplify the modelling and reduce the effects of thermal expansion in the battery cell, the cycling was performed at relatively low currents, which kept heat generation negligible during the measurements. As such, no thermal modelling has been performed, and thermal contributions have not been considered in the electrical or expansion models.
3.3.1. Equivalent Thevenin Circuit Model
When modelling the electrical behaviour of lithium-ion cells, one could use either an electrochemical model, or an equivalent circuit model [24,25]. The most common approach to electrochemical modelling is to utilize a p2d interpretation of the dynamics inside the cell [26,27,28]. While p2d models offer a physical way to model the electrical behaviour cell, developing these models is complex and computationally expensive. The goal of this publication is to develop a first order method for generating synthetic data, rather than to generate the most accurate representation of the electrochemical dynamics within a lithium-ion cell. We therefore opt to implement an ecm to generate synthetic electrical data in favour of making use of an electrochemical model. ecm are widely used to model the voltage output of a cell under different loading conditions [25,29,30,31]. The circuit diagram for the ecm is shown in Figure 3, where an integer number, n, of rc pairs in series are used to reproduce the transient voltage response of the cell during charge and discharge.
Starting from Kirchoff’s second rule, we generate the following expression for the output voltage
It has been demonstrated that the resistors in the rc pairs, , have a soc dependency [25,30,31], and we therefore must select an expression such that
where will be selected during model fitting.
Next, we require an expression for the current through the resistive element in the rc pair. This gives
where is the sampling period, k is the integer-valued time step, is the current through the resistive element, is the time constant for the rc pair, and i is the applied current [30]. For any rc pair, the time constant is given by
The state of charge is updated using current counting. This gives the expression
where is the nominal capacity of the battery cell in , which is multiplied by 3600 to convert the measurement to .
3.3.2. Expansion Model
To develop an expansion model, we consider first the expansion behaviour of an unconstrained cell, as outlined in Krause et al. [32], prior to considering the expansion behaviour of a compressed cell.
Before considering the expansion of the composite cell, we first look to the expansion behaviour of the individual electrode materials during lithiation. The cell being modelled has a graphite anode and a nmc cathode. The electrode deformation as a function of lithiation is taken from Clerici et al. [32] for graphite and Quilty et al. [33] for nmc. The lithiation curves for both electrode materials were taken at 1 C. Electrode deformation is plotted as a function of soc in Figure 4. Note that nmc demonstrates a linear relationship between expansion and lithiation. In addition, this material exhibits no hysteresis between charge and discharge. In contrast, the expansion of graphite is more complex, due to the different stages of graphite lithiation.
The expansion of an uncompressed cell is given by
where M is the number of electrode pairs, is the constraint ratio of the battery case, and are the electrode deformation for the anode and cathode respectively (shown in Figure 4 for a graphite anode and an nmc cathode), and are the active volume fractions for the respective electrodes, and are the respective electrode thicknesses.
Now that we have an expression for the expansion of an uncompressed cell, we can consider the effect of the application of a compressive force on the total expansion. We start with the balance of forces in the system at an arbitrary point , as shown in Figure 5. This yields the balance of forces
If the plate was not moving and the system were at equilibrium we would have
However, the system is not in equilibrium, so we must develop representations for all forces in the system.
While we could model as an air spring, because the displacement is relatively small, we assume that is a constant. is dependent on the unconstrained expansion calculated in equation 6. We treat the cell as an expanding object with a Young’s modulus E and an area A, to give
We are ultimately measuring the movement of a plate with mass m. This gives the differential equation
Since this equation is difficult to solve analytically, we implement Euler’s method, yielding
where z is the displacement at point in the z direction, and represent the first and second derivative with respect to time, and h represents the step size, also with respect to time.
3.3.3. Model fitting
The models for both the electrical and expansion behaviour have now been established. Next we must develop a fitting methodology, starting with the parameters that must be fit. It is useful to split the fitting process by whether the cell is charging or discharging. This will leave us with two sets of fitting parameters. For clarity, we further split the parameters into those needed for the electrical model and expansion model. For the electrical model we need to fit the parameters, with all variables being defined above. In total, there are 27 parameters that need to be fit for the electrical model, as is fit only for either charge or discharge, depending on which is performed first.
Out of convenience, is chosen to be of the form
where ,, and must be fit for each RC-pair.
For the expansion model, we fit a separate set of parameters for each of the three sensor positions. In the expansion model, we bundle some of the variables in the expansion model to single parameters to be fit. This is shown below.
Since there are three sensors, and we need a set of parameters for both charge and discharge, this gives 30 parameters that need to be fit for the expansion model.
In total, we have 57 parameters that need to be fit. Fitting is performed using the Scipy optimize package, using the Nelder-Mead method.
4. Results and Analysis
4.1. Measurement
For the purpose of generating model parameters for synthetic data generation, we cycle nine cells. To obtain equivalent circuit model parameters, voltage curves from all nine cells was utilized. For the expansion model the information of two from the nine cells is used. The electrical data collected in the original campaign is used to both verify the model fitting, and to generate parameters for synthetic data generation. At this time, the limited expansion data is used only to verify model fitting.
4.2. Model fitting
To verify that the models developed in the previous section accurately represent the experimental data, we fit the models using data from the two cells that provided both voltage and expansion curves. In Figure 6a, we present the fitted model alongside the experimental voltage curves. The results clearly show a strong agreement between the model and the data.. We next examine the residuals, shown in Figure 6b. While it is clear that there are certain segments of the voltage curve that are fit better than others, the mean absolute error is less than 6 with a maximum residual of 24 .
We next fit the model developed for cell expansion during cycling. As we measure cell expansion at three points, we must fit the model to the data taken at each of the measurement locations. The overlay of the model on the measurement data taken using the three optical probes in shown in Figure 7a. The corresponding residuals are shown in Figure 7b. The mean absolute error between the model and the measurement data is , , and for data taken using measurement probes 1, 2, and 3, respectively. The maximum residual is , 1 , and for data taken using measurement probes 1, 2, and 3, respectively. The mean absolute error corresponds to a percentage error of 2 , , and 1 relative to the average measurement for probes 1, 2, and 3 respectively. The residuals are evenly distributed about zero, implying a good fit to the measurement data.
4.3. Synthetic Data Generation
To demonstrate the synthetic data generation methodology, the electrical model is fit using data from nine identical battery cells, generating nine different sets of fitting parameters. During initial inspection of values, it was discovered that for this specific battery cell type, the model could be simplified. During charge, the values fit for the terms were on the order of less than . Due to the small terms, the input to the exponential function used to calculate approaches zero. This means that the transient resistance values can be represented as
This simplification does not hold during discharge, and equation 13 continues to be a reasonable representation of the transient resistance values when fitting the model to data taken during discharge.
To assess how the model is being fit to data taken from different battery cells, it is useful to visualize the distribution of parameters fit in each instance. Plotting the distributions is also useful in assessing whether any of the cells being used for model fitting are outliers. In order to effectively visualize the distribution of each fitting parameter, we scale each parameter to the mean, and represent each individual fit parameter as a percentage deviation from the mean.
Figure 8 shows violin plots for both discharge and charge parameters, as detailed in the previous section. The distributions demonstrate that there is at least one battery cell with fit parameters that appear to be outlying. When looking at these distributions, it may be useful to consider that the mean value of each of these parameters are of different orders of magnitude. The mean and standard deviation of the model parameters are shown in Table 1.
The distributions, plotted in blue, are generated by fitting a kernel density estimation to the values generated by refitting the electrical model for each of the nine battery cells. Practically, this is achieved using the gaussian_kde function from the Python Scipy package.
From these distributions, we can then randomly generate parameters to be fed back into the electrical model, generating a synthetic voltage curve for a battery cycle. An example of this is shown in Figure 9, where voltage curves measured from three cells during discharge are plotted alongside the synthetically generated curve, demonstrating our approach to synthetic data generation.
5. Discussion
We have demonstrated models that are capable of representing the change in electric potential and change in thickness that occurs when lithium-ion cells are cycled. The models proposed are relatively simple when compared to others in the literature. It is assumed that simplifying a model may result in reduced accuracy. When considering the electrical behaviour of a lithium-ion cell, p2d models offer a more physical representation than is possible with an equivalent circuit model, however they are far more complex implement [26,27]. Similarly, researchers such as Clerici et al., have demonstrated more sophisticated approaches to modelling cell expansion, however these approaches require techniques such as finite element analysis, a computationally expensive endeavour [32]. In this work, we accept that a decrease in complexity, comes with a decrease in accuracy. That being said, the models developed are suitable for our use case.
In principle, these models, and by extension, the synthetic data generation methodology, could be applied to other lithium-ion battery chemistries and formats and other cycling conditions. Both the electrical and expansion models would need to be adjusted to account for the varying electrode and electrolyte materials. In the case of prismatic and cylindrical cells, the casing itself applies the required pressure during cycling, rather than relying on external forces to apply pressure. This would likely require revisions in the expansion model. When considering other cycling conditions, particularly at higher charge and discharge rates, it is important to note that neither the electrical or expansion models take into account the effects of temperature. In our use case, slow cycling is desirable, as it prevents premature aging in the cells [34]. As a result of cycling slowly, we see negligible fluctuations in temperature. Therefore, we are free to ignore temperature effects. If one wanted to cycle the cells at a higher current, or in an environment with fluctuating temperatures, a thermal model would need to be developed.
The goal of developing the models presented in this work is not to generate the most accurate representation of lithium-ion battery cell behaviour across all cycling conditions, but to create an easily deployable model for the purpose of generating synthetic data. Synthetic data is ultimately used to help an artificial intelligence algorithm learn features that it can expect to encounter in real data, and therefore does not need to be a perfect representation of the real system.
It is, however, important that the parameters we sample from are representative of battery cells exhibiting normal behaviour. From the violin plots shown in Figure 8, it becomes apparent that the width of the distribution for each parameter is parameter dependent. The differing widths of the parameter distributions can at least partially be attributed to varying orders of magnitude for each parameter, as shown in Table 1. Parameters with a very small magnitude are more likely to have a wider distribution. This is the case when we examine the value in Figure 8b and Table 1b. It is also useful to consider how a given parameter contributes to the output of the model. For instance in Figure 8a, has a wide distribution compared to other parameters. When we examine how contributes to the eventual calculation of , we must recall its use as a bias term in equation 13, where ,, and are used to calculate during discharge. In the case of the term, the component is an order of magnitude larger than , therefore the model output, , is relatively insensitive to the value of , leading to a wider distribution. Variance in the widths for different parameters is therefore explainable, and is not a cause for concern in generating synthetic data from the parameter distributions.
It is important to consider the possibility of outliers in the distributions, as this could cause a deviation from normal cell behaviour in synthetically generated data. Upon further inspection of the fit parameters, it appears that two battery cells are contributing to the non-symmetric shape of the parameter distributions. More battery cells will be cycled to assess whether the two identified cells are outliers, or if the true parameter distributions are wider than those generated by fitting to only nine cells. By fitting the models using more cells, we can minimize the effect of outliers, and ensure the quality of the distributions that parameters are sampled from.
6. Conclusions
We have established the need for end-of-line testing in lithium-ion battery production, the benefits of an expansion measurement in addition to existing electrical measurements, and the suitability of ai algorithms in extracting information from multi-sensor testing data. The limitations of using real battery cells to generate sufficient training data for the effective use of ai algorithms have also been introduced.
To address these limitations, we have established a methodology for generating synthetic data that can be used to train unsupervised ai algorithms. We first made expansion and voltage measurements on nine compressed 1 lithium ion cells under low current cycling conditions. These measurements were then used to parametrise an equivalent circuit model and model for compressed cell expansion. Finally, the distribution of parameters from fitting models with data from multiple cells was then be sampled from, and passed back to the models to generate synthetic data.
This work allows for the production of large datasets without having to cycle a large number of battery cells. Anomaly detection algorithms for the purpose of identifying abnormal cells during end-of-line testing in lithium-ion battery production can then be pre-trained using the synthetic dataset. Real data can then later be used to retrain the models, reducing the number of cells that ultimately need to be cycled to train algorithms for end-of-line testing.
Author Contributions
Conceptualization, C.H., M.K., and L.P.B; methodology, T.K. and J.R; software, D.N. and T.K.; validation, T.K.; formal analysis, T.K. and J.R.; investigation, T.K., D.N. and J.R.; resources, D.N.; data curation, D.N.; writing—original draft preparation, T.K., D.N. and J.R.; writing—review and editing, T.K.,D.N.,J.R.,L.P.B.,M.K. and C.H.; visualization, T.K. and J.R.; supervision, C.H., M.K.; project administration, L.P.B.; funding acquisition, L.P.B.; All authors have read and agreed to the published version of the manuscript.
Funding
This research was funded by the German Federal Ministry for Economic Affairs and Climate Action under the project acronym QUAZE and number 16BZF361B.
Institutional Review Board Statement
Not applicable.
Acknowledgments
In this section you can acknowledge any support given which is not covered by the author contribution or funding sections. This may include administrative and technical support, or donations in kind (e.g., materials used for experiments).
Conflicts of Interest
Authors Tessa Krause and Johannes Rittmann were employed by the company Precitec GmbH & Co., KG. The remaining authors declare that the research was conducted in the absence of any commercial or financial relationships that could be construed as a potential conflict of interest.
Abbreviations
The following abbreviations are used in this manuscript:
| AI | artificial intelligence |
| DoD | depth of discharge |
| ECM | equivalent circuit model |
| NMC622 | LiNi0.6 Mn0.2 Co0.2 |
| OCV | open circuit voltage |
| P2D | pseudo 2-dimensional |
| RC | resistor-capacitor |
| RUL | remaining useful lifetime |
| SEI | solid electrolyte interphase |
| SoC | state of charge |
References
- Wolter, M.; Fauser, G.; Bretthauer, C.; Roscher, M.A. End-of-line testing and formation process in Li-ion battery assembly lines. In Proceedings of the International Multi-Conference on Systems, Signals & Devices. IEEE; 3 2012; pp. 1–3. [Google Scholar] [CrossRef]
- Stock, S.; Pohlmann, S.; Günter, F.J.; Hille, L.; Hagemeister, J.; Reinhart, G. Early Quality Classification and Prediction of Battery Cycle Life in Production Using Machine Learning. Journal of Energy Storage 2022, 50. [Google Scholar] [CrossRef]
- Roth, T.; Streck, L.; Graule, A.; Niehoff, P.; Jossen, A. Relaxation Effects in Self-Discharge Measurements of Lithium-Ion Batteries. Journal of The Electrochemical Society 2023, 170, 020502. [Google Scholar] [CrossRef]
- Chen, W.; Han, X.; Pan, Y.; Yuan, Y.; Kong, X.; Liu, L.; Sun, Y.; Shen, W.; Xiong, R. Defects in Lithium-Ion Batteries: From Origins to Safety Risks. Green Energy and Intelligent Transportation, 1002. [Google Scholar] [CrossRef]
- Rowden, B.; Garcia-Araez, N. A review of gas evolution in lithium ion batteries. Energy Reports 2020, 6, 10–18. [Google Scholar] [CrossRef]
- Liu, Q.; Du, C.; Shen, B.; Zuo, P.; Cheng, X.; Ma, Y.; Yin, G.; Gao, Y. Understanding undesirable anode lithium plating issues in lithium-ion batteries. RSC Advances 2016, 6, 88683–88700. [Google Scholar] [CrossRef]
- Krause, T.; Nusko, D.; Pitta Bauermann, L.; Vetter, M.; Schäfer, M.; Holly, C. Methods for Quantifying Expansion in Lithium-Ion Battery Cells Resulting from Cycling: A Review. Energies 2024, 17, 1566. [Google Scholar] [CrossRef]
- Rieger, B.; Erhard, S.V.; Rumpf, K.; Jossen, A. A New Method to Model the Thickness Change of a Commercial Pouch Cell during Discharge. Journal of The Electrochemical Society 2016, 163, A1566–A1575. [Google Scholar] [CrossRef]
- Rieger, B.; Schlueter, S.; Erhard, S.; Schmalz, J.; Reinhart, G.; Jossen, A. Multi-scale investigation of thickness changes in a commercial pouch type lithium-ion battery. Journal of Energy Storage 2016, 6, 213–221. [Google Scholar] [CrossRef]
- Li, G.; Jung, J.J. Deep learning for anomaly detection in multivariate time series: Approaches, applications, and challenges. Information Fusion 2023, 91, 93–102. [Google Scholar] [CrossRef]
- Middlehurst, M.; Schäfer, P.; Bagnall, A. Bake off redux: a review and experimental evaluation of recent time series classification algorithms. Data Mining and Knowledge Discovery 2024, 38, 1958–2031. [Google Scholar] [CrossRef]
- Guo, K.; Yang, Z.; Yu, C.H.; Buehler, M.J. Artificial intelligence and machine learning in design of mechanical materials. Materials Horizons 2021, 8, 1153–1172. [Google Scholar] [CrossRef]
- Hasib, S.A.; Islam, S.; Chakrabortty, R.K.; Ryan, M.J.; Saha, D.K.; Ahamed, M.H.; Moyeen, S.I.; Das, S.K.; Ali, M.F.; Islam, M.R.; et al. A Comprehensive Review of Available Battery Datasets, RUL Prediction Approaches, and Advanced Battery Management. IEEE Access 2021, 9, 86166–86193. [Google Scholar] [CrossRef]
- Wu, Y.; Li, W.; Wang, Y.; Zhang, K. Remaining Useful Life Prediction of Lithium-Ion Batteries Using Neural Network and Bat-Based Particle Filter. IEEE Access 2019, 7, 54843–54854. [Google Scholar] [CrossRef]
- Bravo Diaz, L.; He, X.; Hu, Z.; Restuccia, F.; Marinescu, M.; Barreras, J.V.; Patel, Y.; Offer, G.; Rein, G. Review—Meta-Review of Fire Safety of Lithium-Ion Batteries: Industry Challenges and Research Contributions. Journal of The Electrochemical Society 2020, 167, 090559. [Google Scholar] [CrossRef]
- Huang, L.; Liu, L.; Lu, L.; Feng, X.; Han, X.; Li, W.; Zhang, M.; Li, D.; Liu, X.; Sauer, D.U.; et al. A review of the internal short circuit mechanism in lithium-ion batteries: Inducement, detection and prevention. International Journal of Energy Research 2021, 45, 15797–15831. [Google Scholar] [CrossRef]
- Jia, Y.; Li, J.; Yao, W.; Li, Y.; Xu, J. Precise and fast safety risk classification of lithium-ion batteries based on machine learning methodology. Journal of Power Sources 2022, 548, 232064. [Google Scholar] [CrossRef]
- Turetskyy, A.; Laue, V.; Lamprecht, R.; Thiede, S.; Krewer, U.; Herrmann, C. Artificial Neural Network enabled P2D Model Deployment for End-of-Line Battery Cell Characterization. In Proceedings of the 2019 IEEE 17th International Conference on Industrial Informatics (INDIN). IEEE; 7 2019; pp. 53–58. [Google Scholar] [CrossRef]
- Krause, T.; Nusko, D.; Pitta Bauermann, L.; Schäfer, M.; Vetter, M.; Holly, C. Synthetic data generation for hybrid AI end-of-line testing for lithium-ion battery production. In Proceedings of the EVS37 International Electric Vehicle Symposium and Exhibition, Seoul, Republic of Korea; 4 2024. [Google Scholar]
- Müller, V.; Scurtu, R.G.; Memm, M.; Danzer, M.A.; Wohlfahrt-Mehrens, M. Study of the influence of mechanical pressure on the performance and aging of Lithium-ion battery cells. Journal of Power Sources 2019, 440, 227148. [Google Scholar] [CrossRef]
- Deich, T.; Storch, M.; Steiner, K.; Bund, A. Effects of module stiffness and initial compression on lithium-ion cell aging. Journal of Power Sources 2021, 506, 230163. [Google Scholar] [CrossRef]
- Cannarella, J.; Arnold, C.B. Stress evolution and capacity fade in constrained lithium-ion pouch cells. Journal of Power Sources 2014, 245, 745–751. [Google Scholar] [CrossRef]
- Nusko, D.; Bruch, M.; Pitta Bauermann, L. Verfahren und Vorrichtung zur Qualitätsprüfung einer elektrochemischen Zelle, 2024.
- Han, S.; Tang, Y.; Khaleghi Rahimian, S. A numerically efficient method of solving the full-order pseudo-2-dimensional (P2D) Li-ion cell model. Journal of Power Sources 2021, 490, 229571. [Google Scholar] [CrossRef]
- Bruch, M.; Millet, L.; Kowal, J.; Vetter, M. Novel method for the parameterization of a reliable equivalent circuit model for the precise simulation of a battery cell’s electric behavior. Journal of Power Sources 2021, 490, 229513. [Google Scholar] [CrossRef]
- Laue, V.; Röder, F.; Krewer, U. Practical identifiability of electrochemical P2D models for lithium-ion batteries. Journal of Applied Electrochemistry 2021, 51, 1253–1265. [Google Scholar] [CrossRef]
- Yu, Z.; Tian, Y.; Li, B. A simulation study of Li-ion batteries based on a modified P2D model. Journal of Power Sources 2024, 618, 234376. [Google Scholar] [CrossRef]
- Jokar, A.; Rajabloo, B.; Désilets, M.; Lacroix, M. Review of simplified Pseudo-two-Dimensional models of lithium-ion batteries. Journal of Power Sources 2016, 327, 44–55. [Google Scholar] [CrossRef]
- Hu, X.; Li, S.; Peng, H. A comparative study of equivalent circuit models for Li-ion batteries. Journal of Power Sources 2012, 198, 359–367. [Google Scholar] [CrossRef]
- Hua, X.; Zhang, C.; Offer, G. Finding a better fit for lithium ion batteries: A simple, novel, load dependent, modified equivalent circuit model and parameterization method. Journal of Power Sources 2021, 484. [Google Scholar] [CrossRef]
- Liaw, B.Y.; Nagasubramanian, G.; Jungst, R.G.; Doughty, D.H. Modeling of lithium ion cells - A simple equivalent-circuit model approach. In Proceedings of the Solid State Ionics, Vol. 175; 11 2004; pp. 835–839. [Google Scholar] [CrossRef]
- Clerici, D.; Mocera, F.; Somà, A. Electrochemical–mechanical multi-scale model and validation with thickness change measurements in prismatic lithium-ion batteries. Journal of Power Sources 2022, 542, 231735. [Google Scholar] [CrossRef]
- Quilty, C.D.; Wheeler, G.P.; Wang, L.; McCarthy, A.H.; Yan, S.; Tallman, K.R.; Dunkin, M.R.; Tong, X.; Ehrlich, S.; Ma, L.; et al. Impact of Charge Voltage on Factors Influencing Capacity Fade in Layered NMC622: Multimodal X-ray and Electrochemical Characterization. ACS Applied Materials and Interfaces 2021, 13, 50920–50935. [Google Scholar] [CrossRef] [PubMed]
- Leng, F.; Tan, C.M.; Pecht, M. Effect of Temperature on the Aging rate of Li Ion Battery Operating above Room Temperature. Scientific Reports 2015, 5, 12967. [Google Scholar] [CrossRef]
Figure 1.
Simplified drawing of battery cell test rig (patent pending: [23]). The left drawing shows a side view of the test stand. The dashed line represents the outline of the battery cell. Points 1, 2, and 3 indicate the sensor positions for contactless distance measurements using chromatic confocal point measurement. The right drawing shows the front view of the test stand, where components, such as the piston and ball joint, required for cell compression are illustrated. Points 1,2, and 3 again represent the projected positions of the contactless measurement probe.
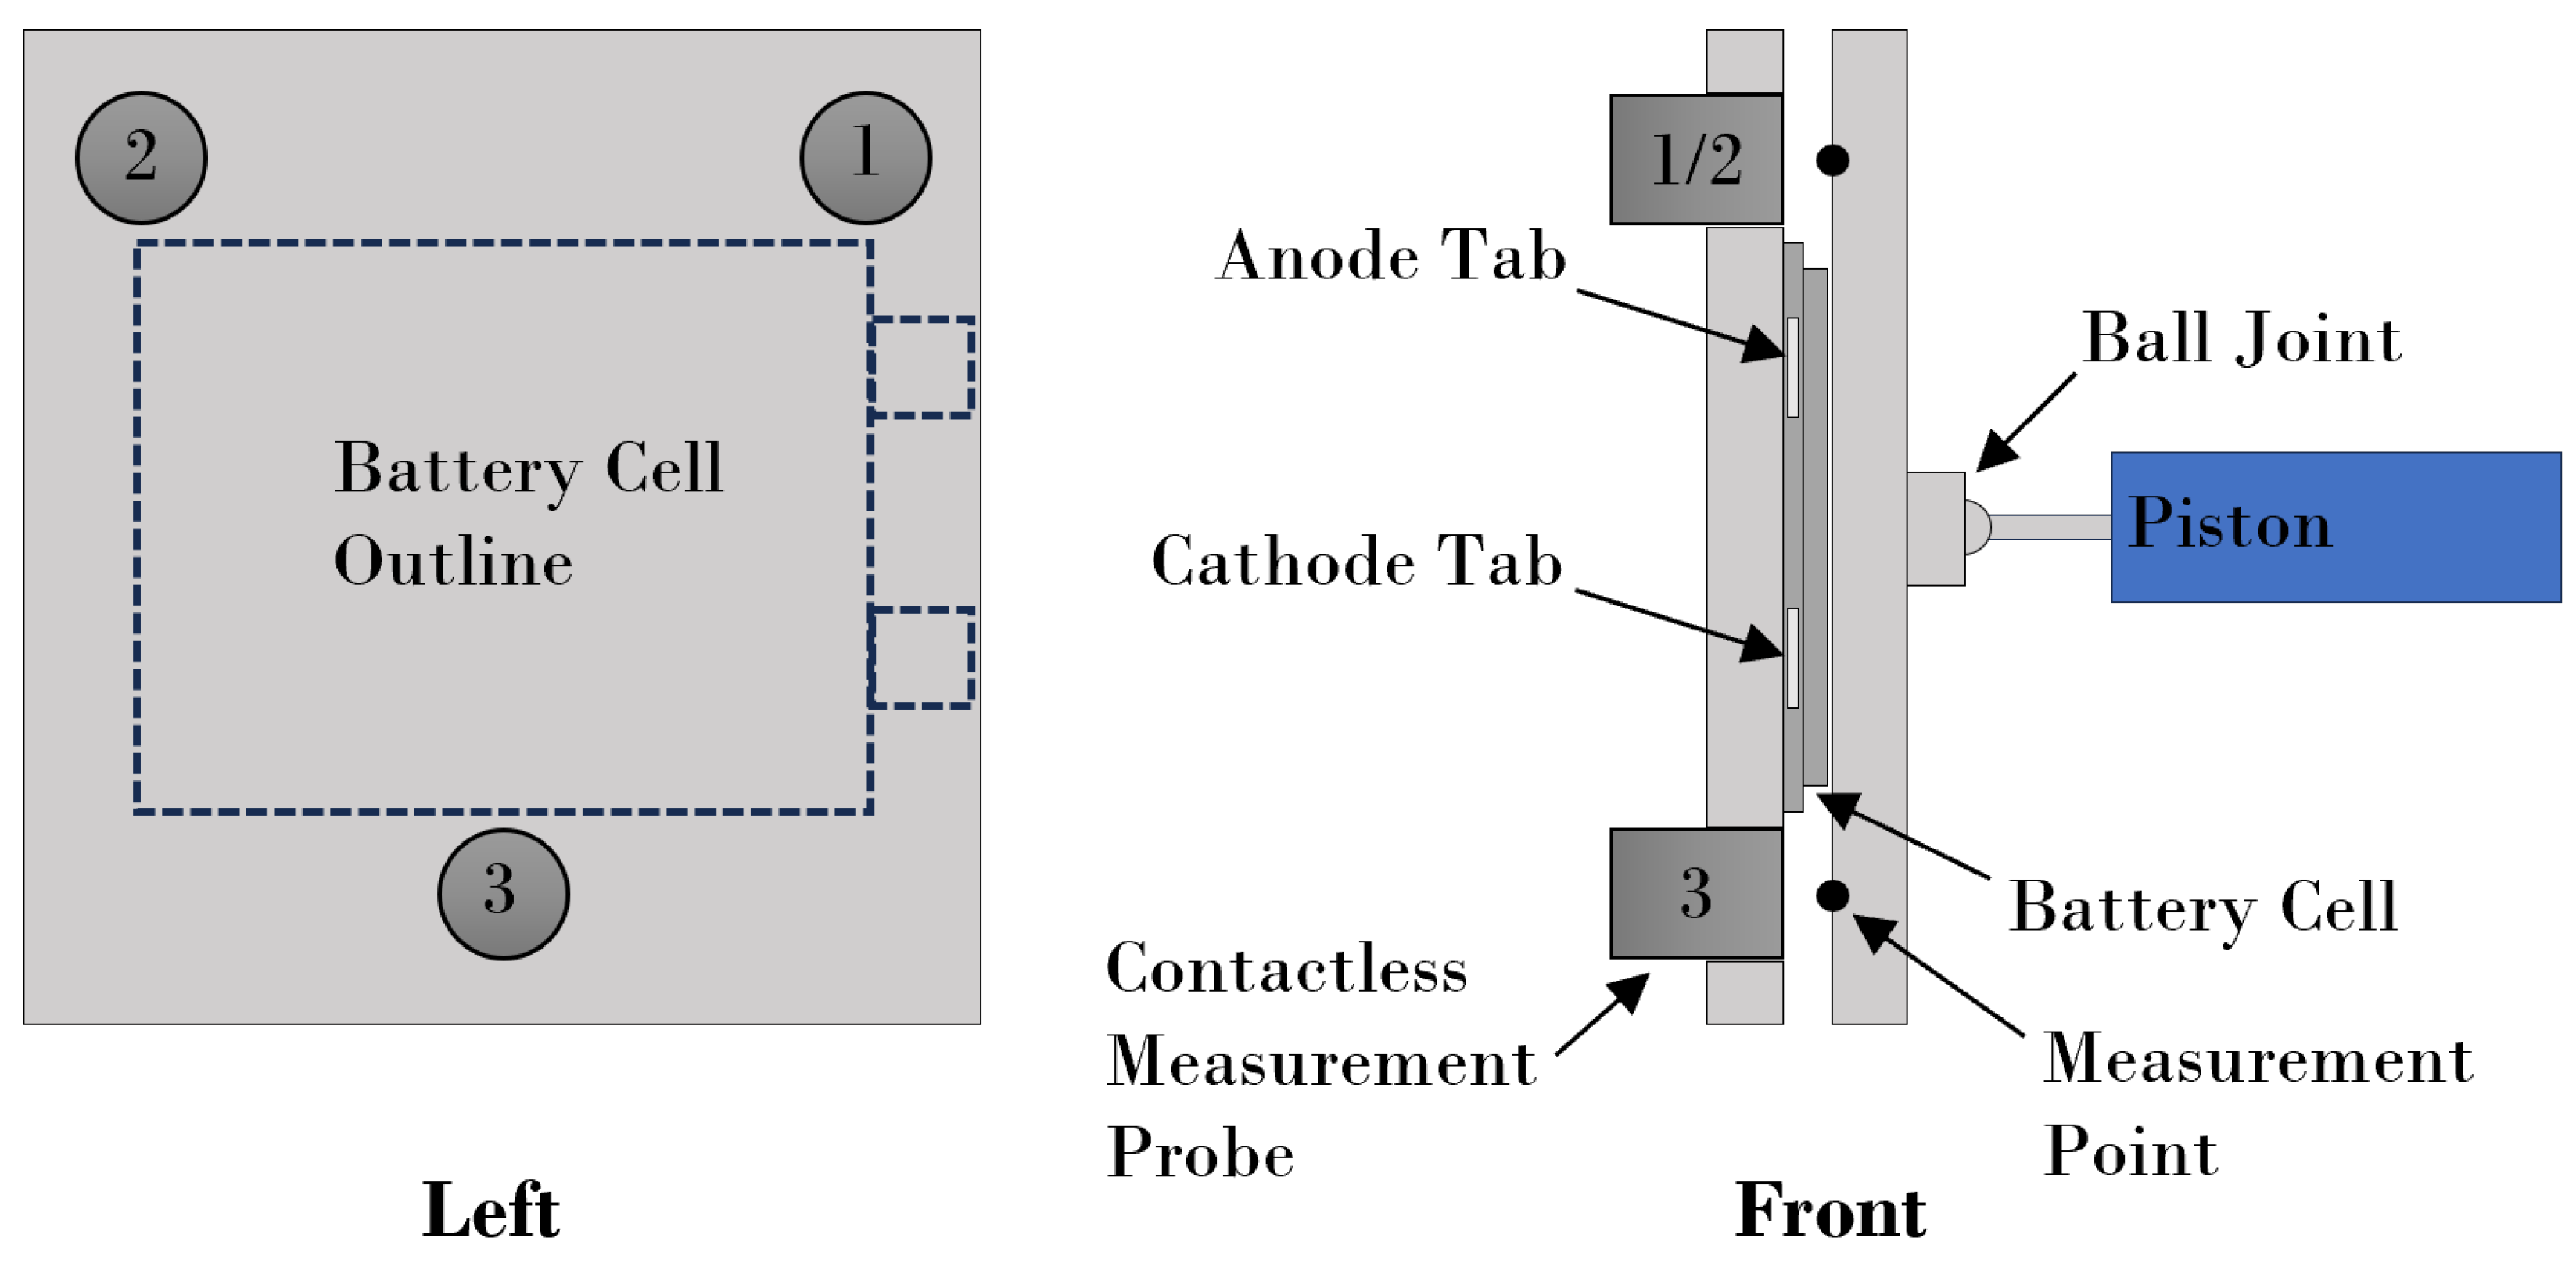
Figure 2.
Current and voltage measurement data for open circuit voltage curve generation. Black dots denote points where open circuit voltage values were taken.
Figure 2.
Current and voltage measurement data for open circuit voltage curve generation. Black dots denote points where open circuit voltage values were taken.
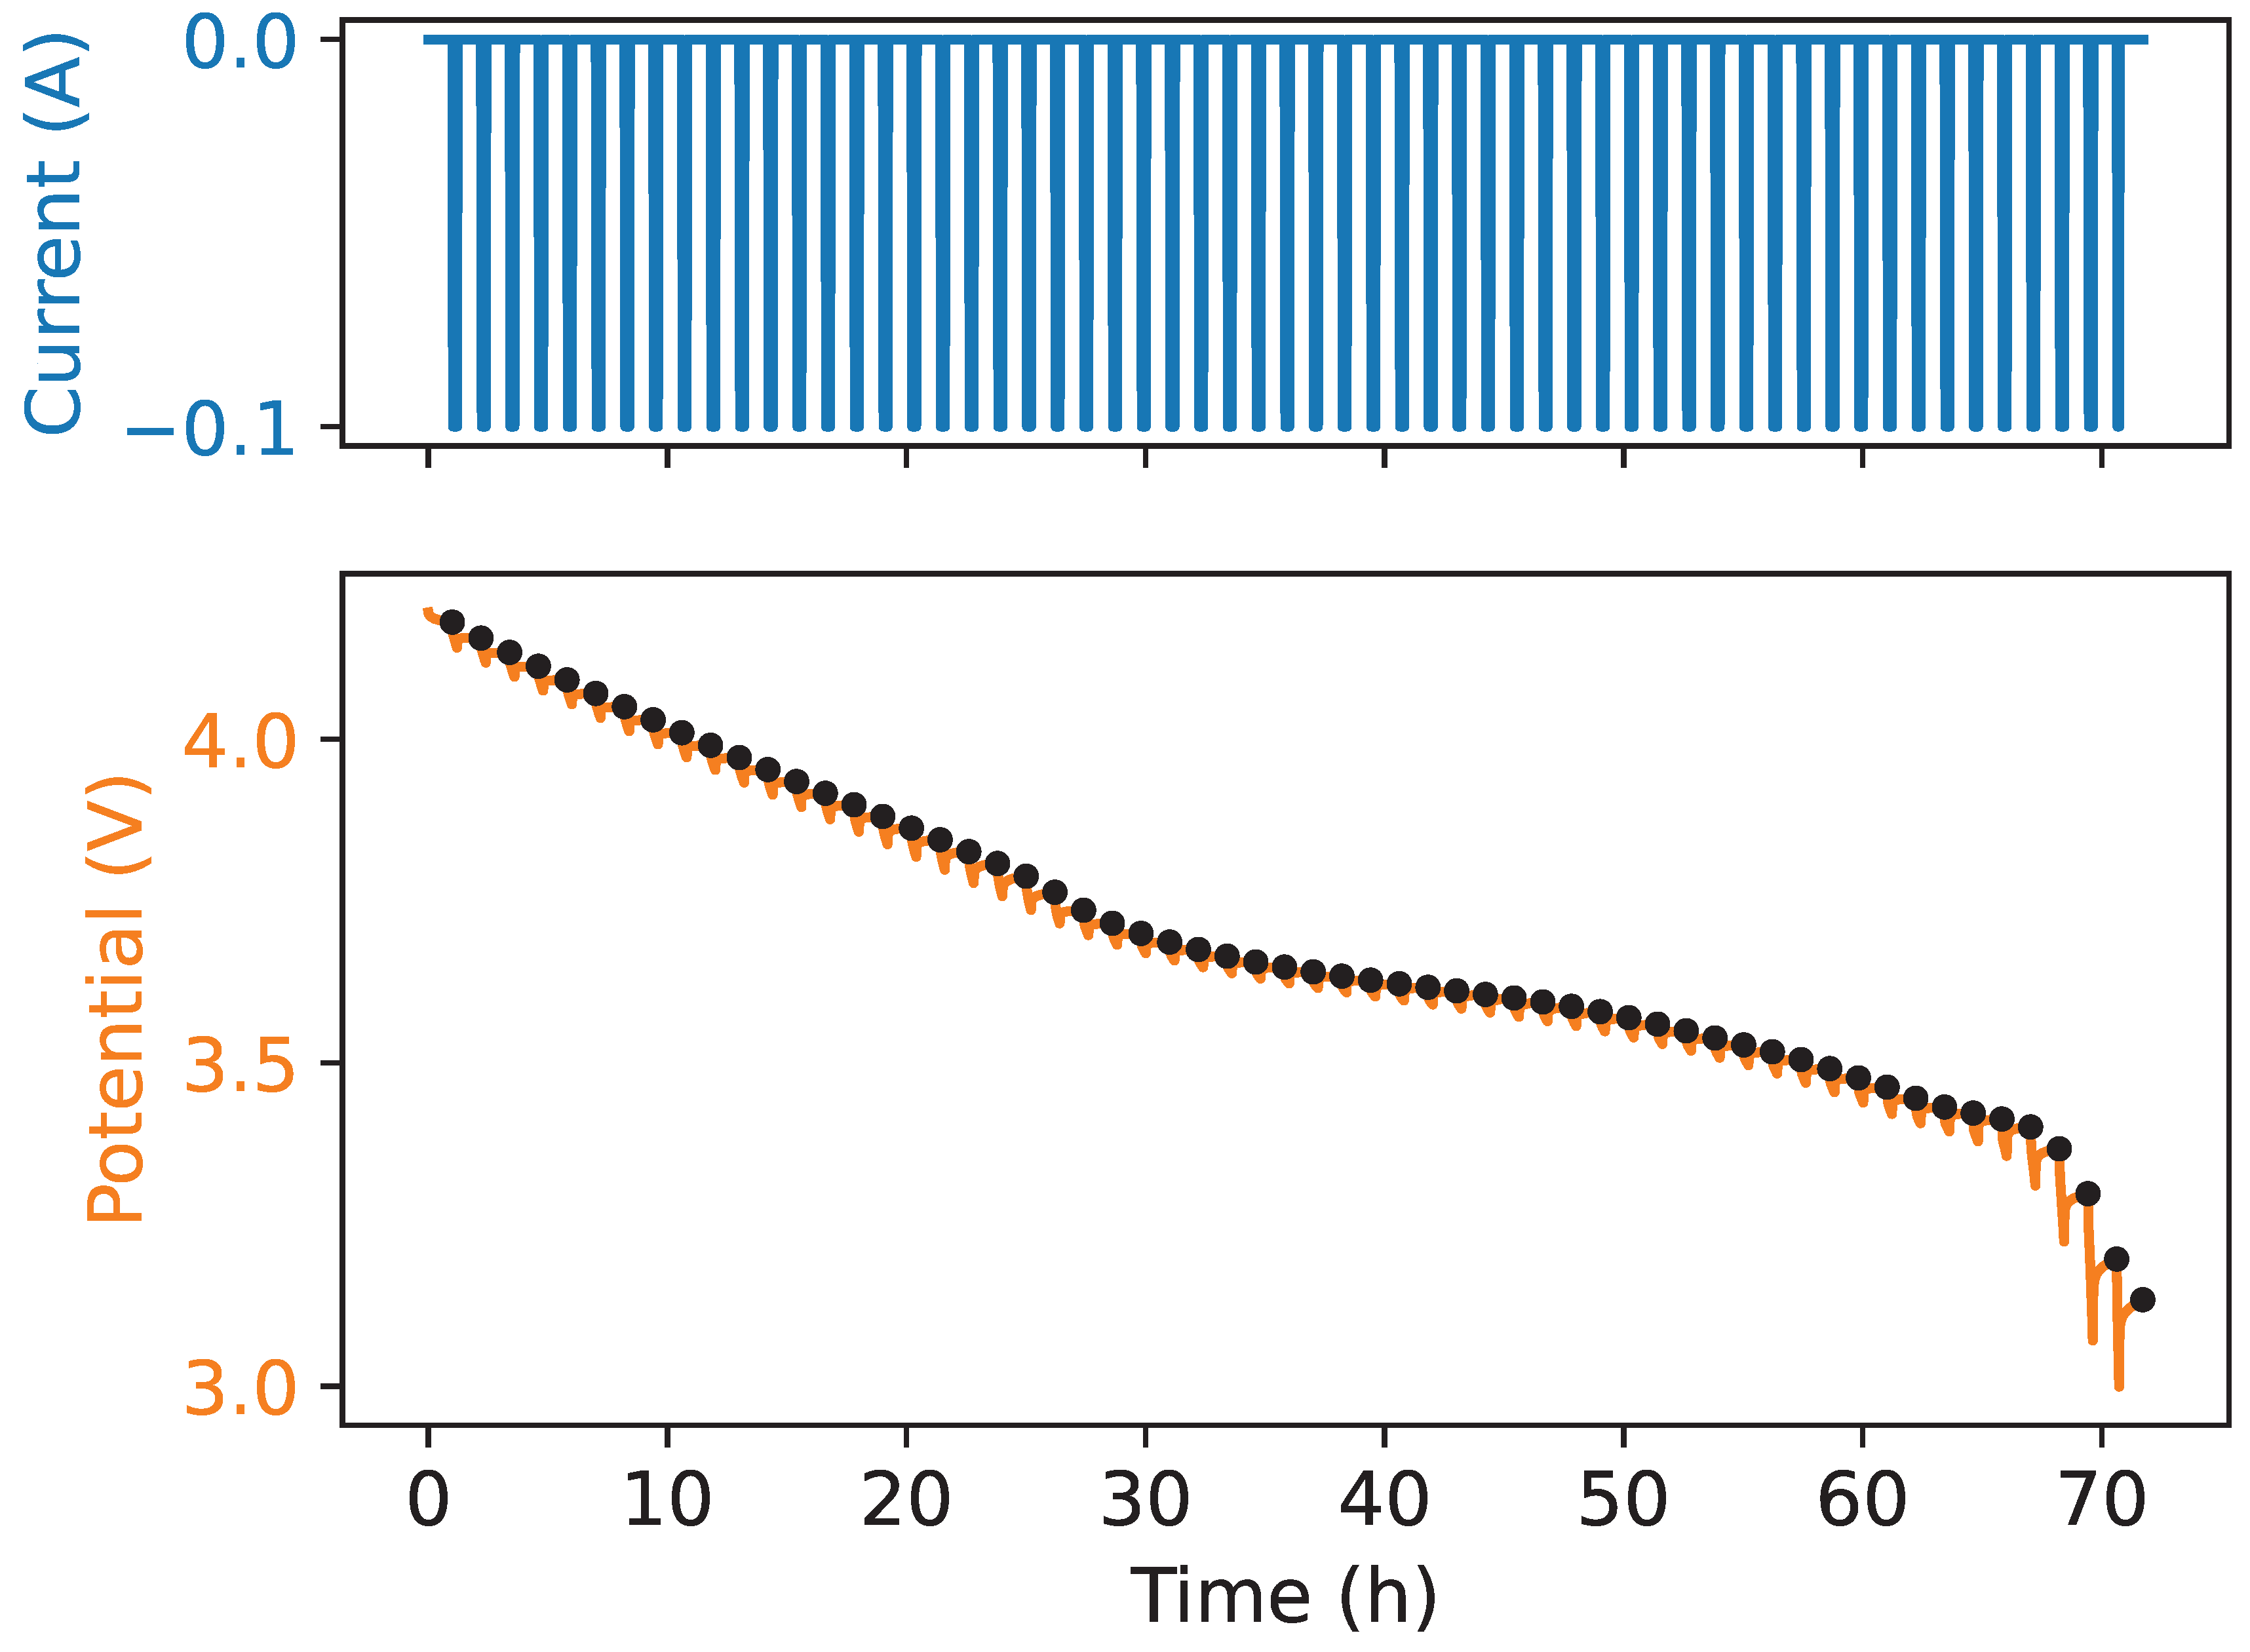
Figure 3.
Equivalent circuit model for a lithium-ion battery with an arbitrary number of resistor-capacitor elements.
Figure 3.
Equivalent circuit model for a lithium-ion battery with an arbitrary number of resistor-capacitor elements.
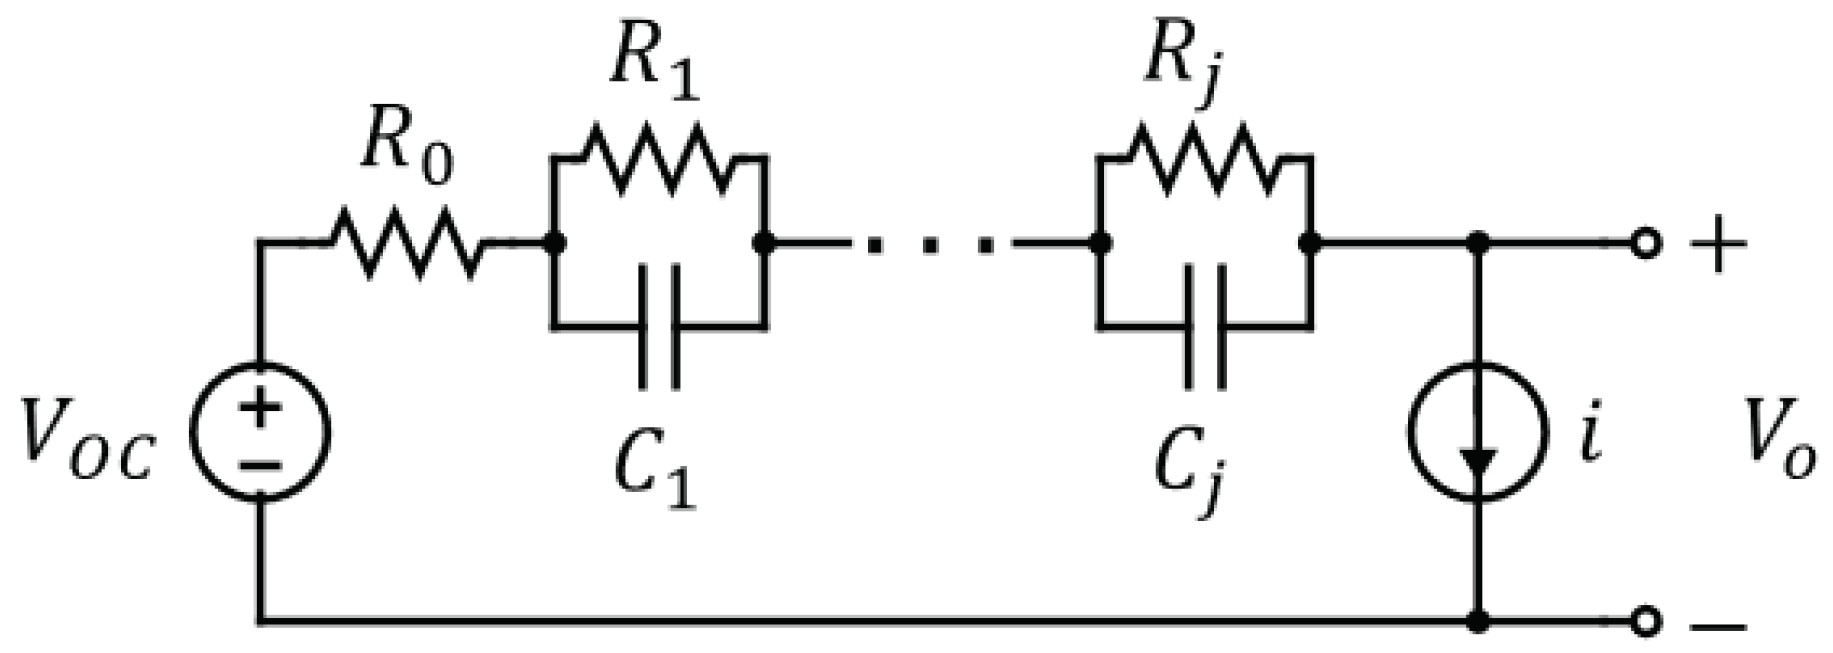
Figure 4.
Volume deformation ratios , for graphite and NMC622 as a function of state of charge. Curves are generated from data in [32] for graphite, and from [33] for nmc.
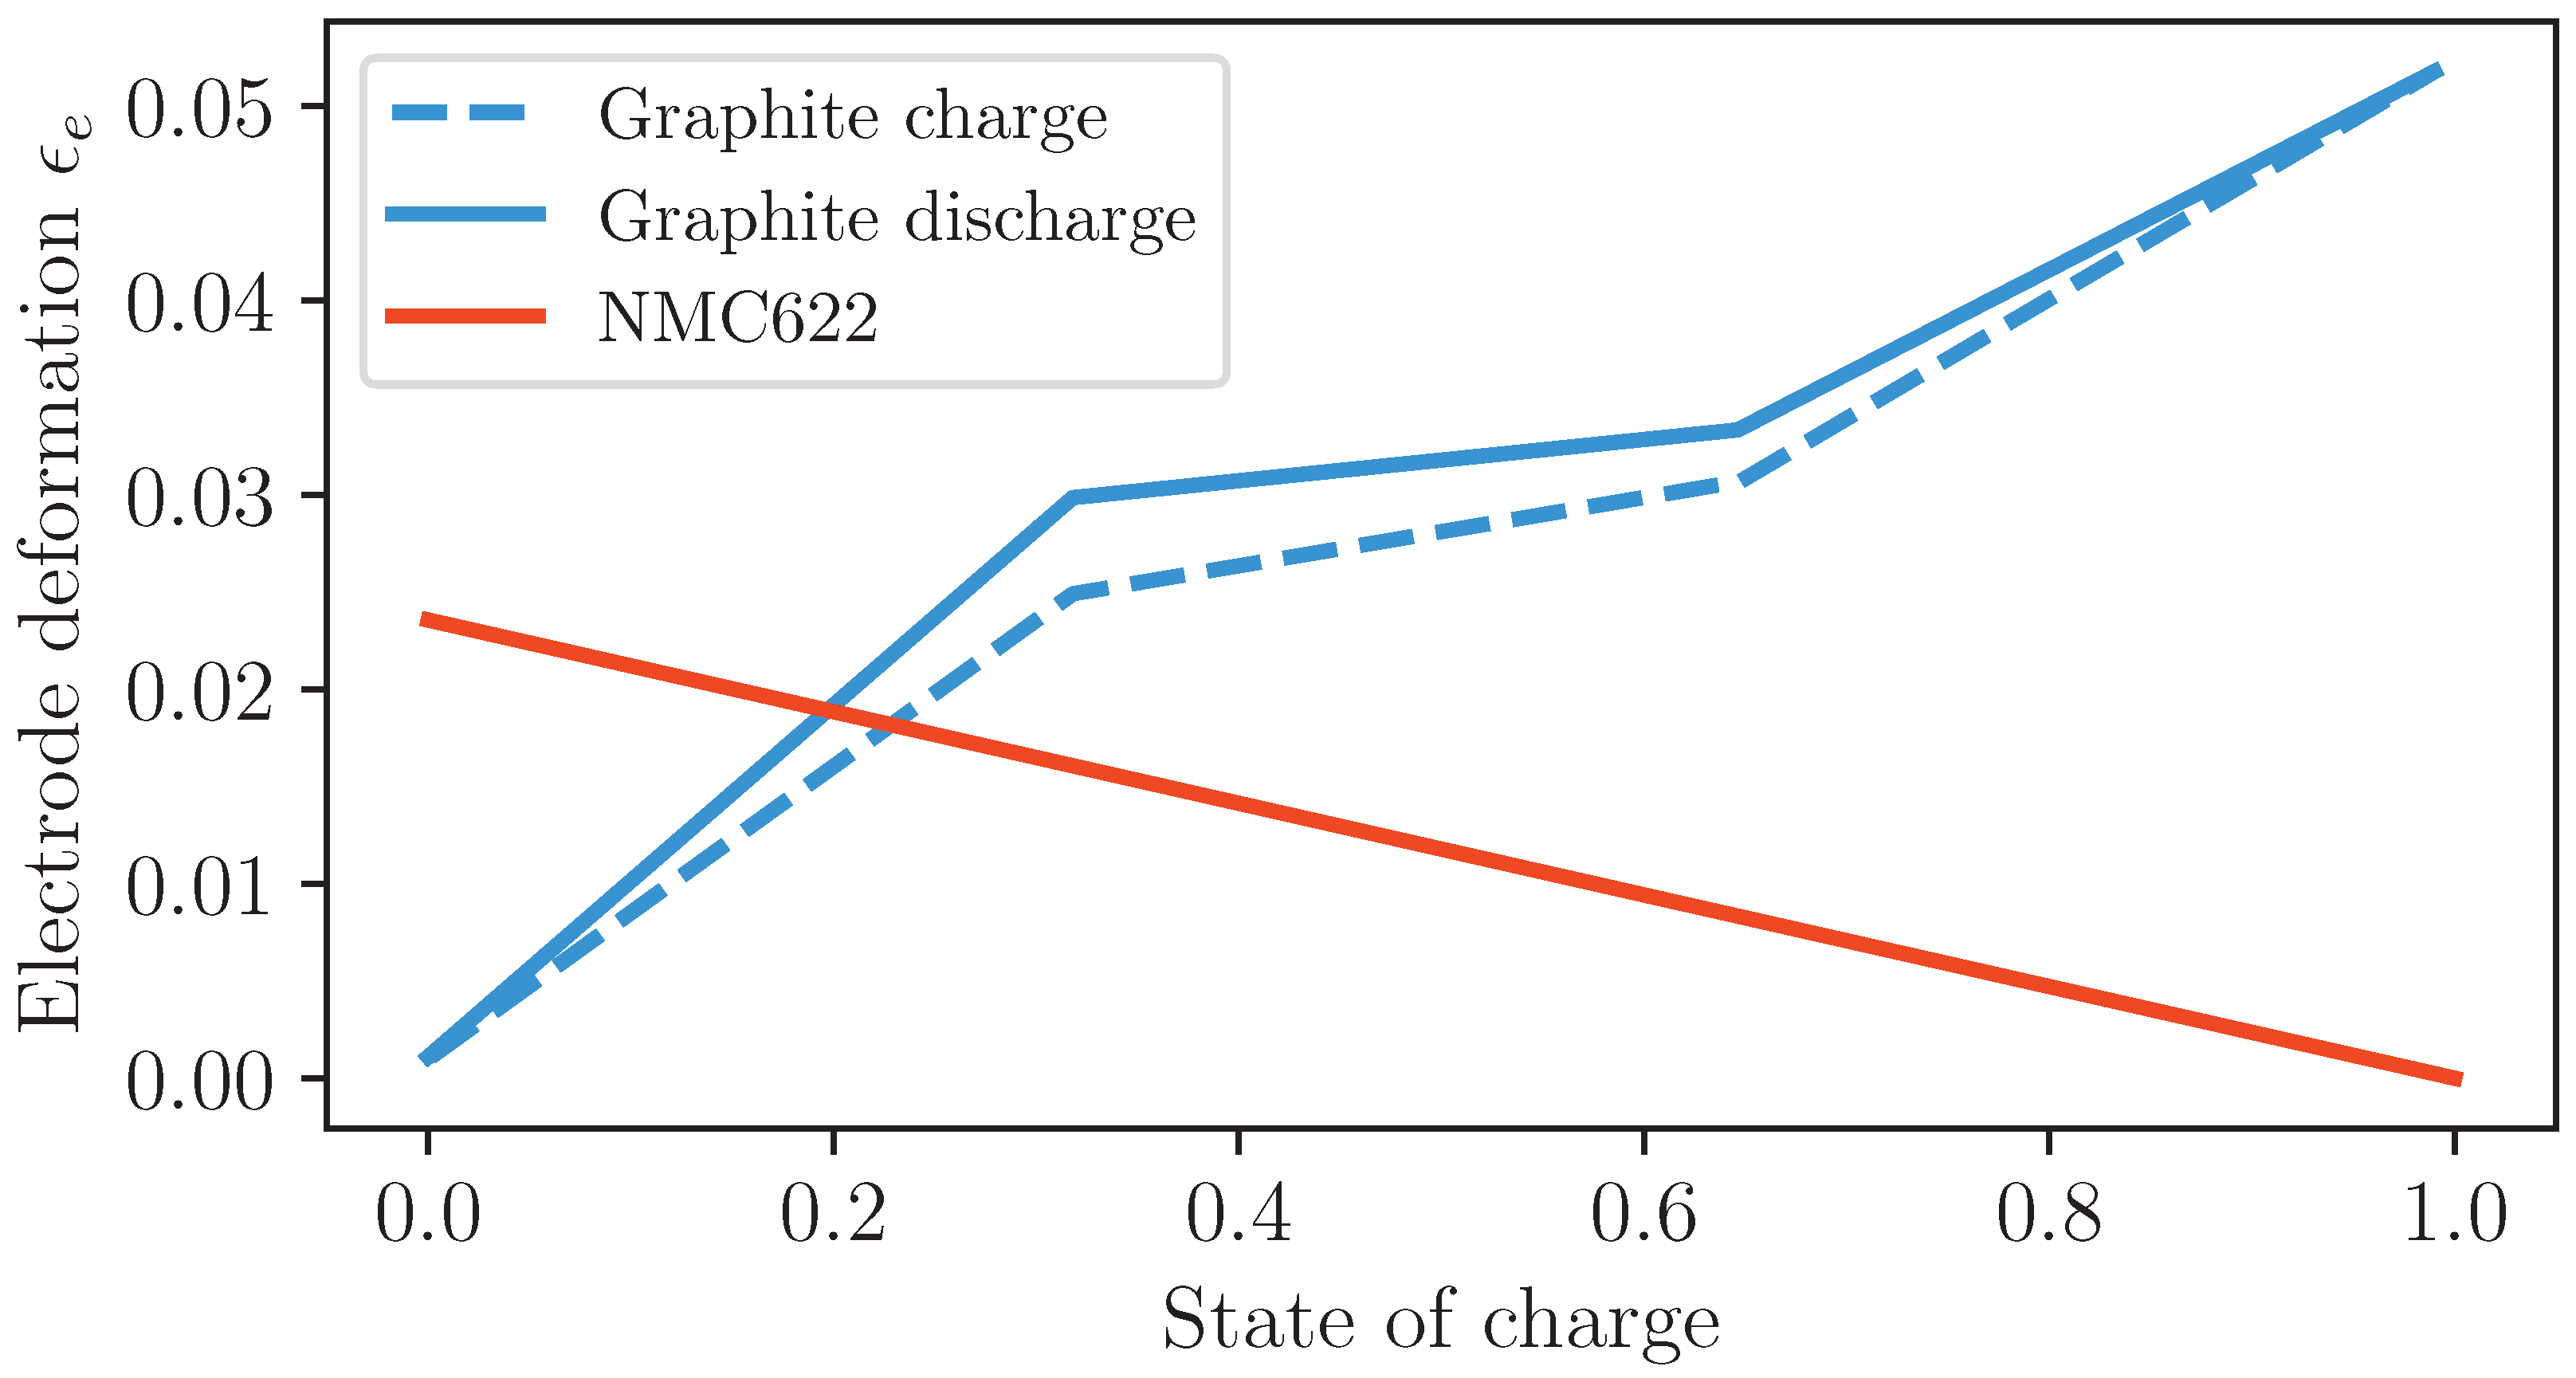
Figure 5.
Force diagram at a point on the pressure plate (right) which is compressing a battery cell against a fixed plate (left).
Figure 5.
Force diagram at a point on the pressure plate (right) which is compressing a battery cell against a fixed plate (left).
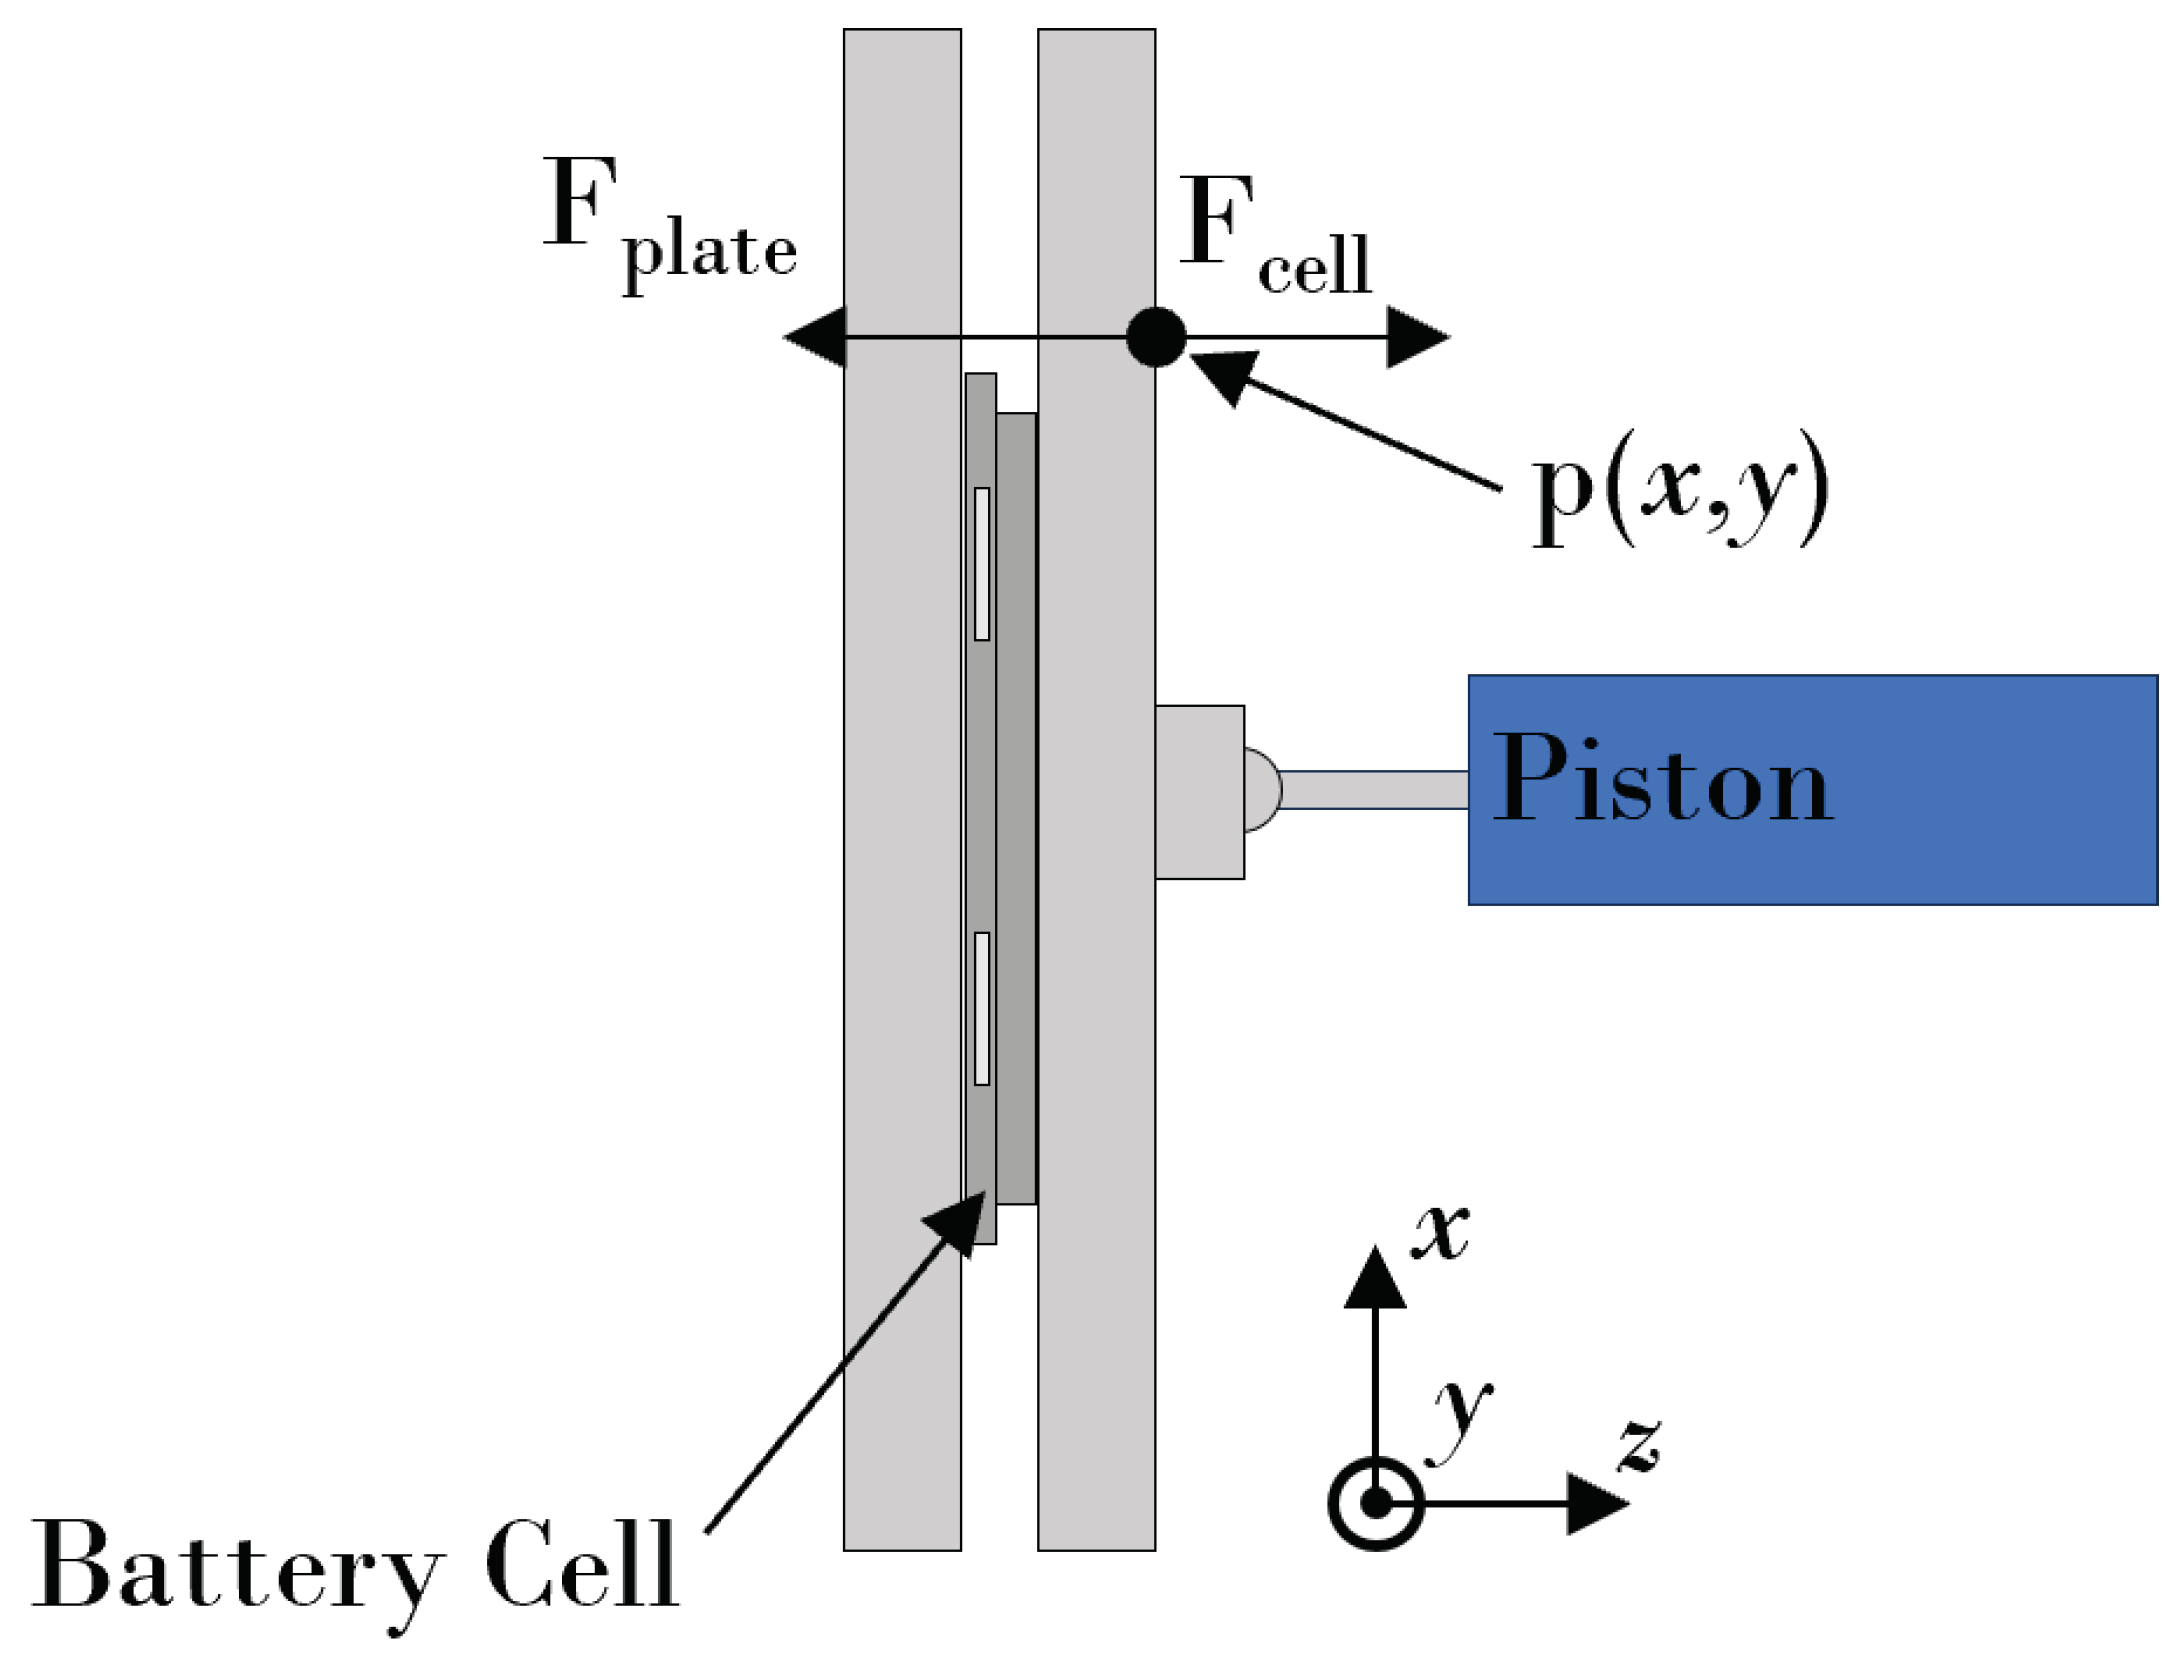
Figure 6.
(a) Voltage measurements, plotted in blue, and the fit model (), plotted in orange for a lithium-ion battery cell discharged at 1 C and charged at 0.5 C. (b) The residuals corresponding to the difference between the experimental data and the model shown in (a)
Figure 6.
(a) Voltage measurements, plotted in blue, and the fit model (), plotted in orange for a lithium-ion battery cell discharged at 1 C and charged at 0.5 C. (b) The residuals corresponding to the difference between the experimental data and the model shown in (a)
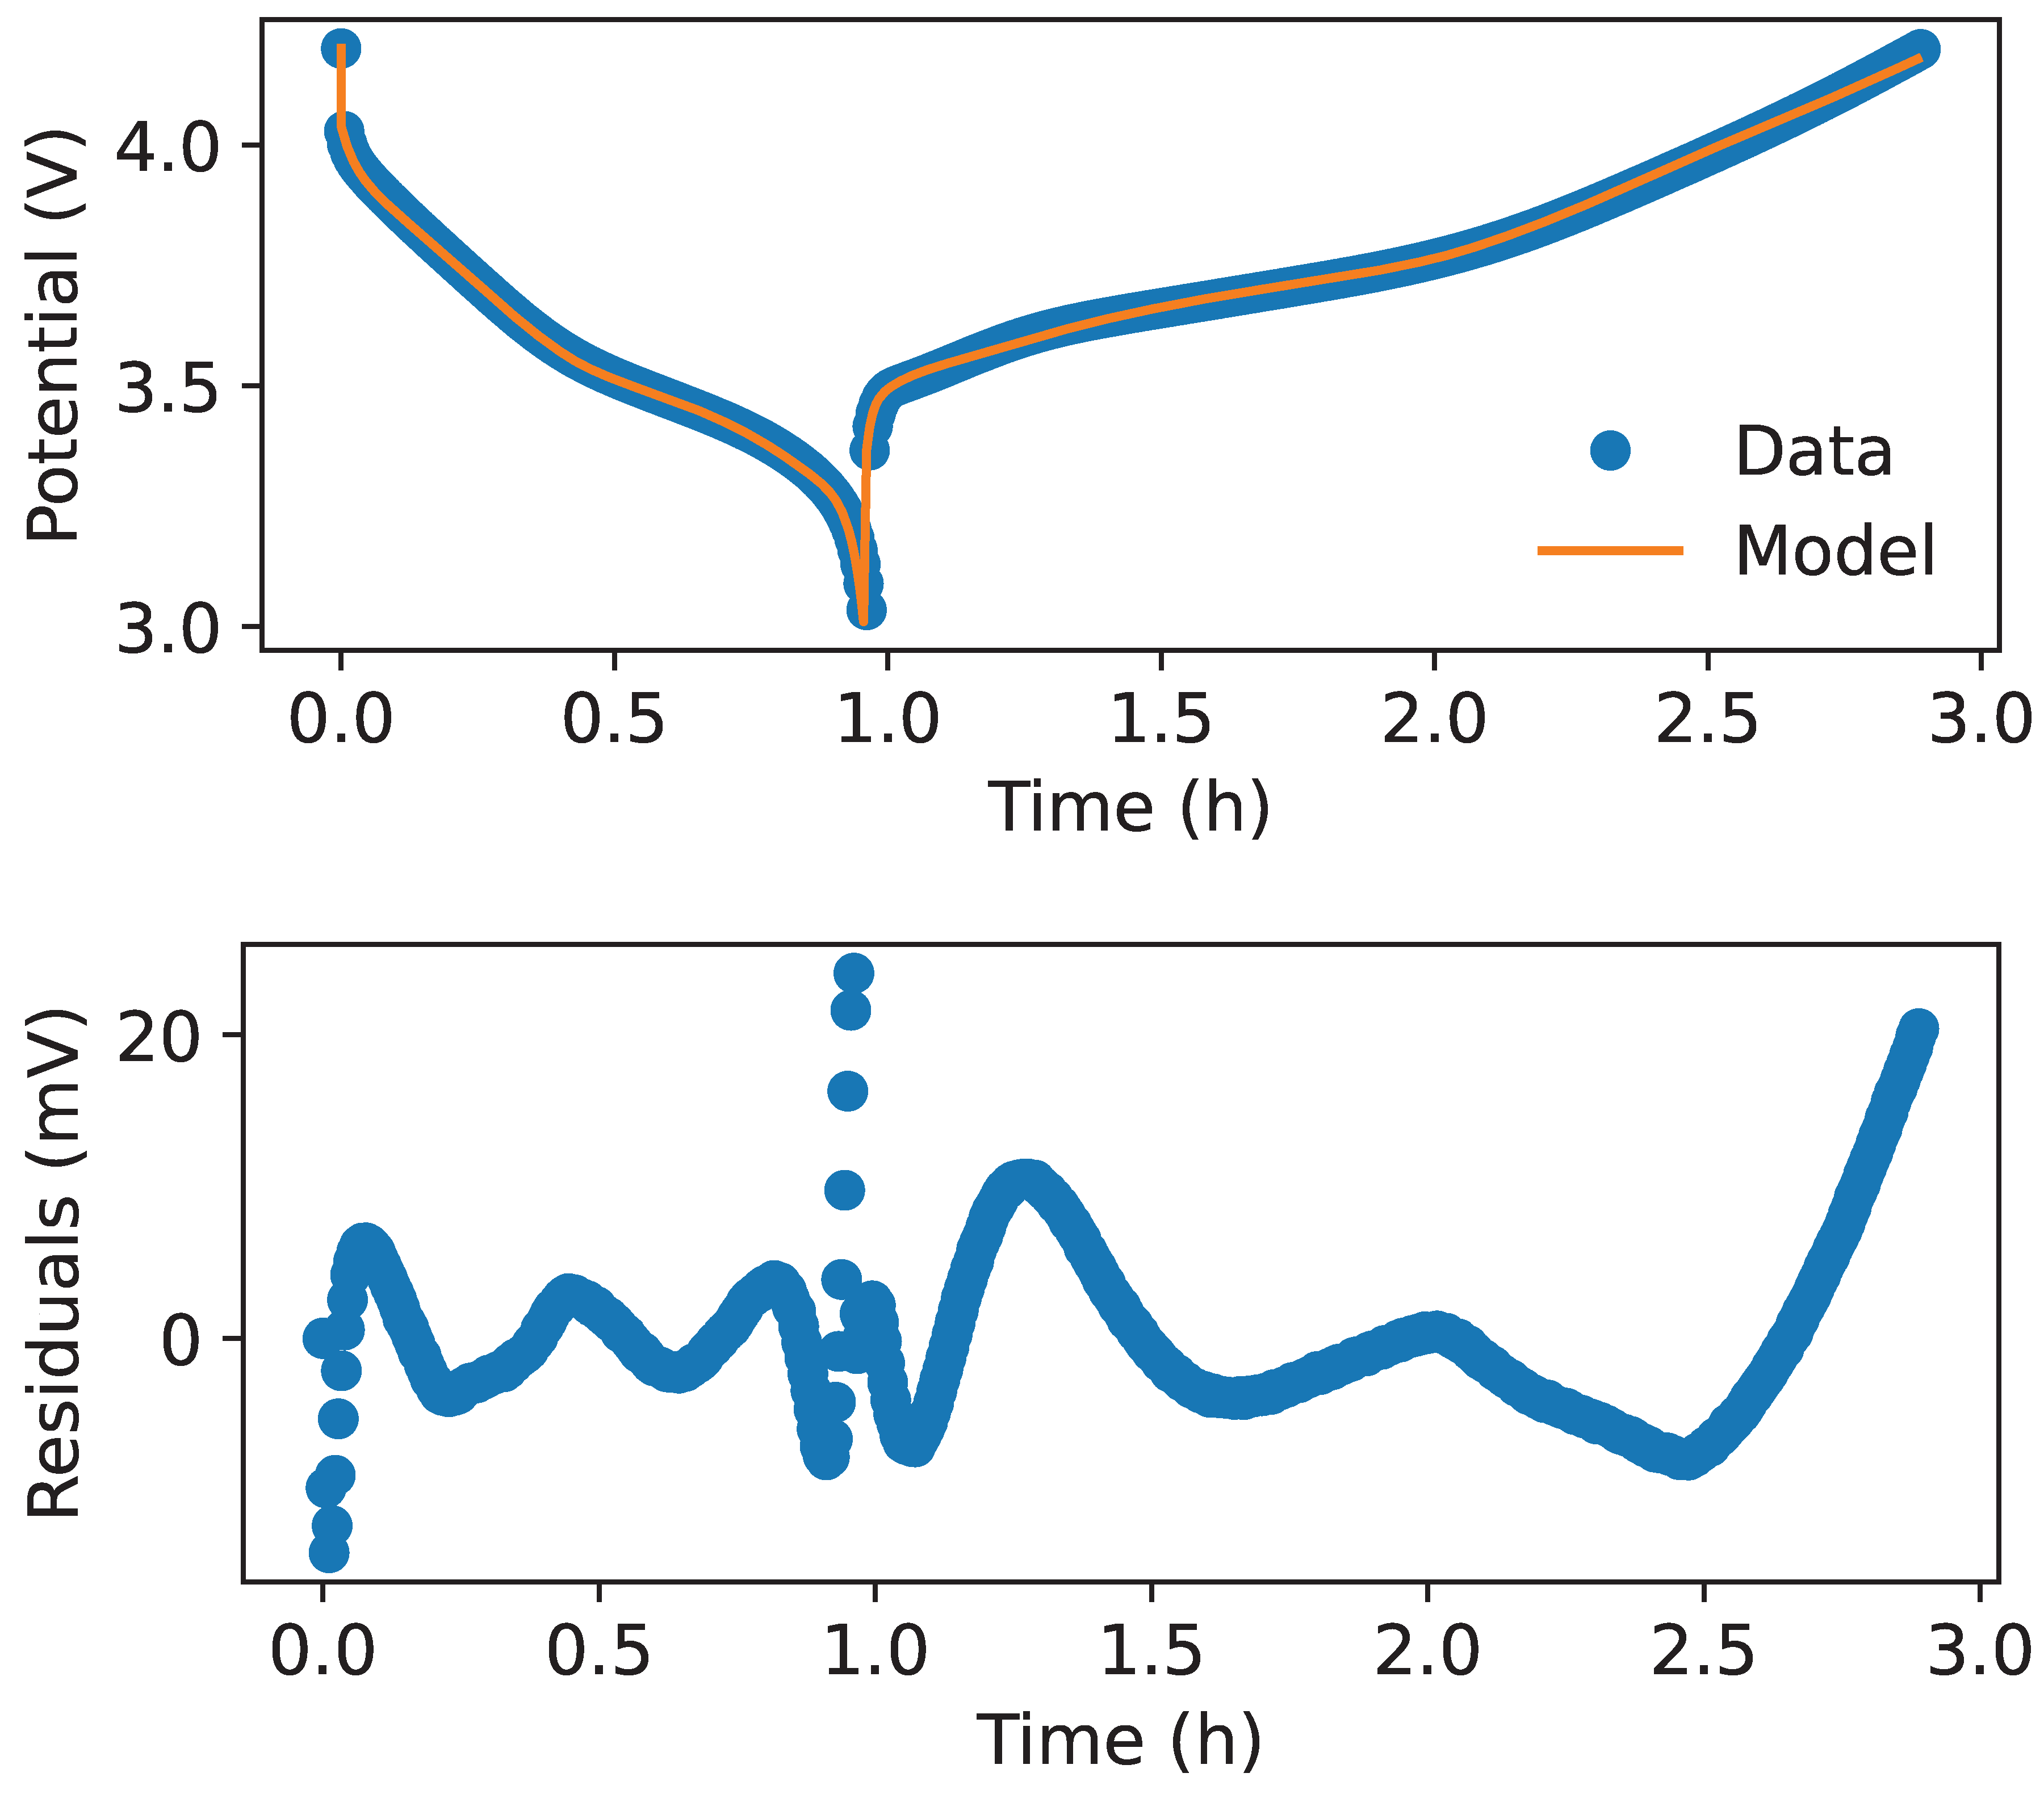
Figure 7.
(a) Expansion measurements taken at three different points, plotted in blue, and the fit model, plotted in orange for a lithium-ion battery cell discharged at 1 C and charged at 0.5 C. (b) The residuals corresponding to the difference between the experimental data and the model shown in (a). For details on the positioning of the probes, see Figure 1.
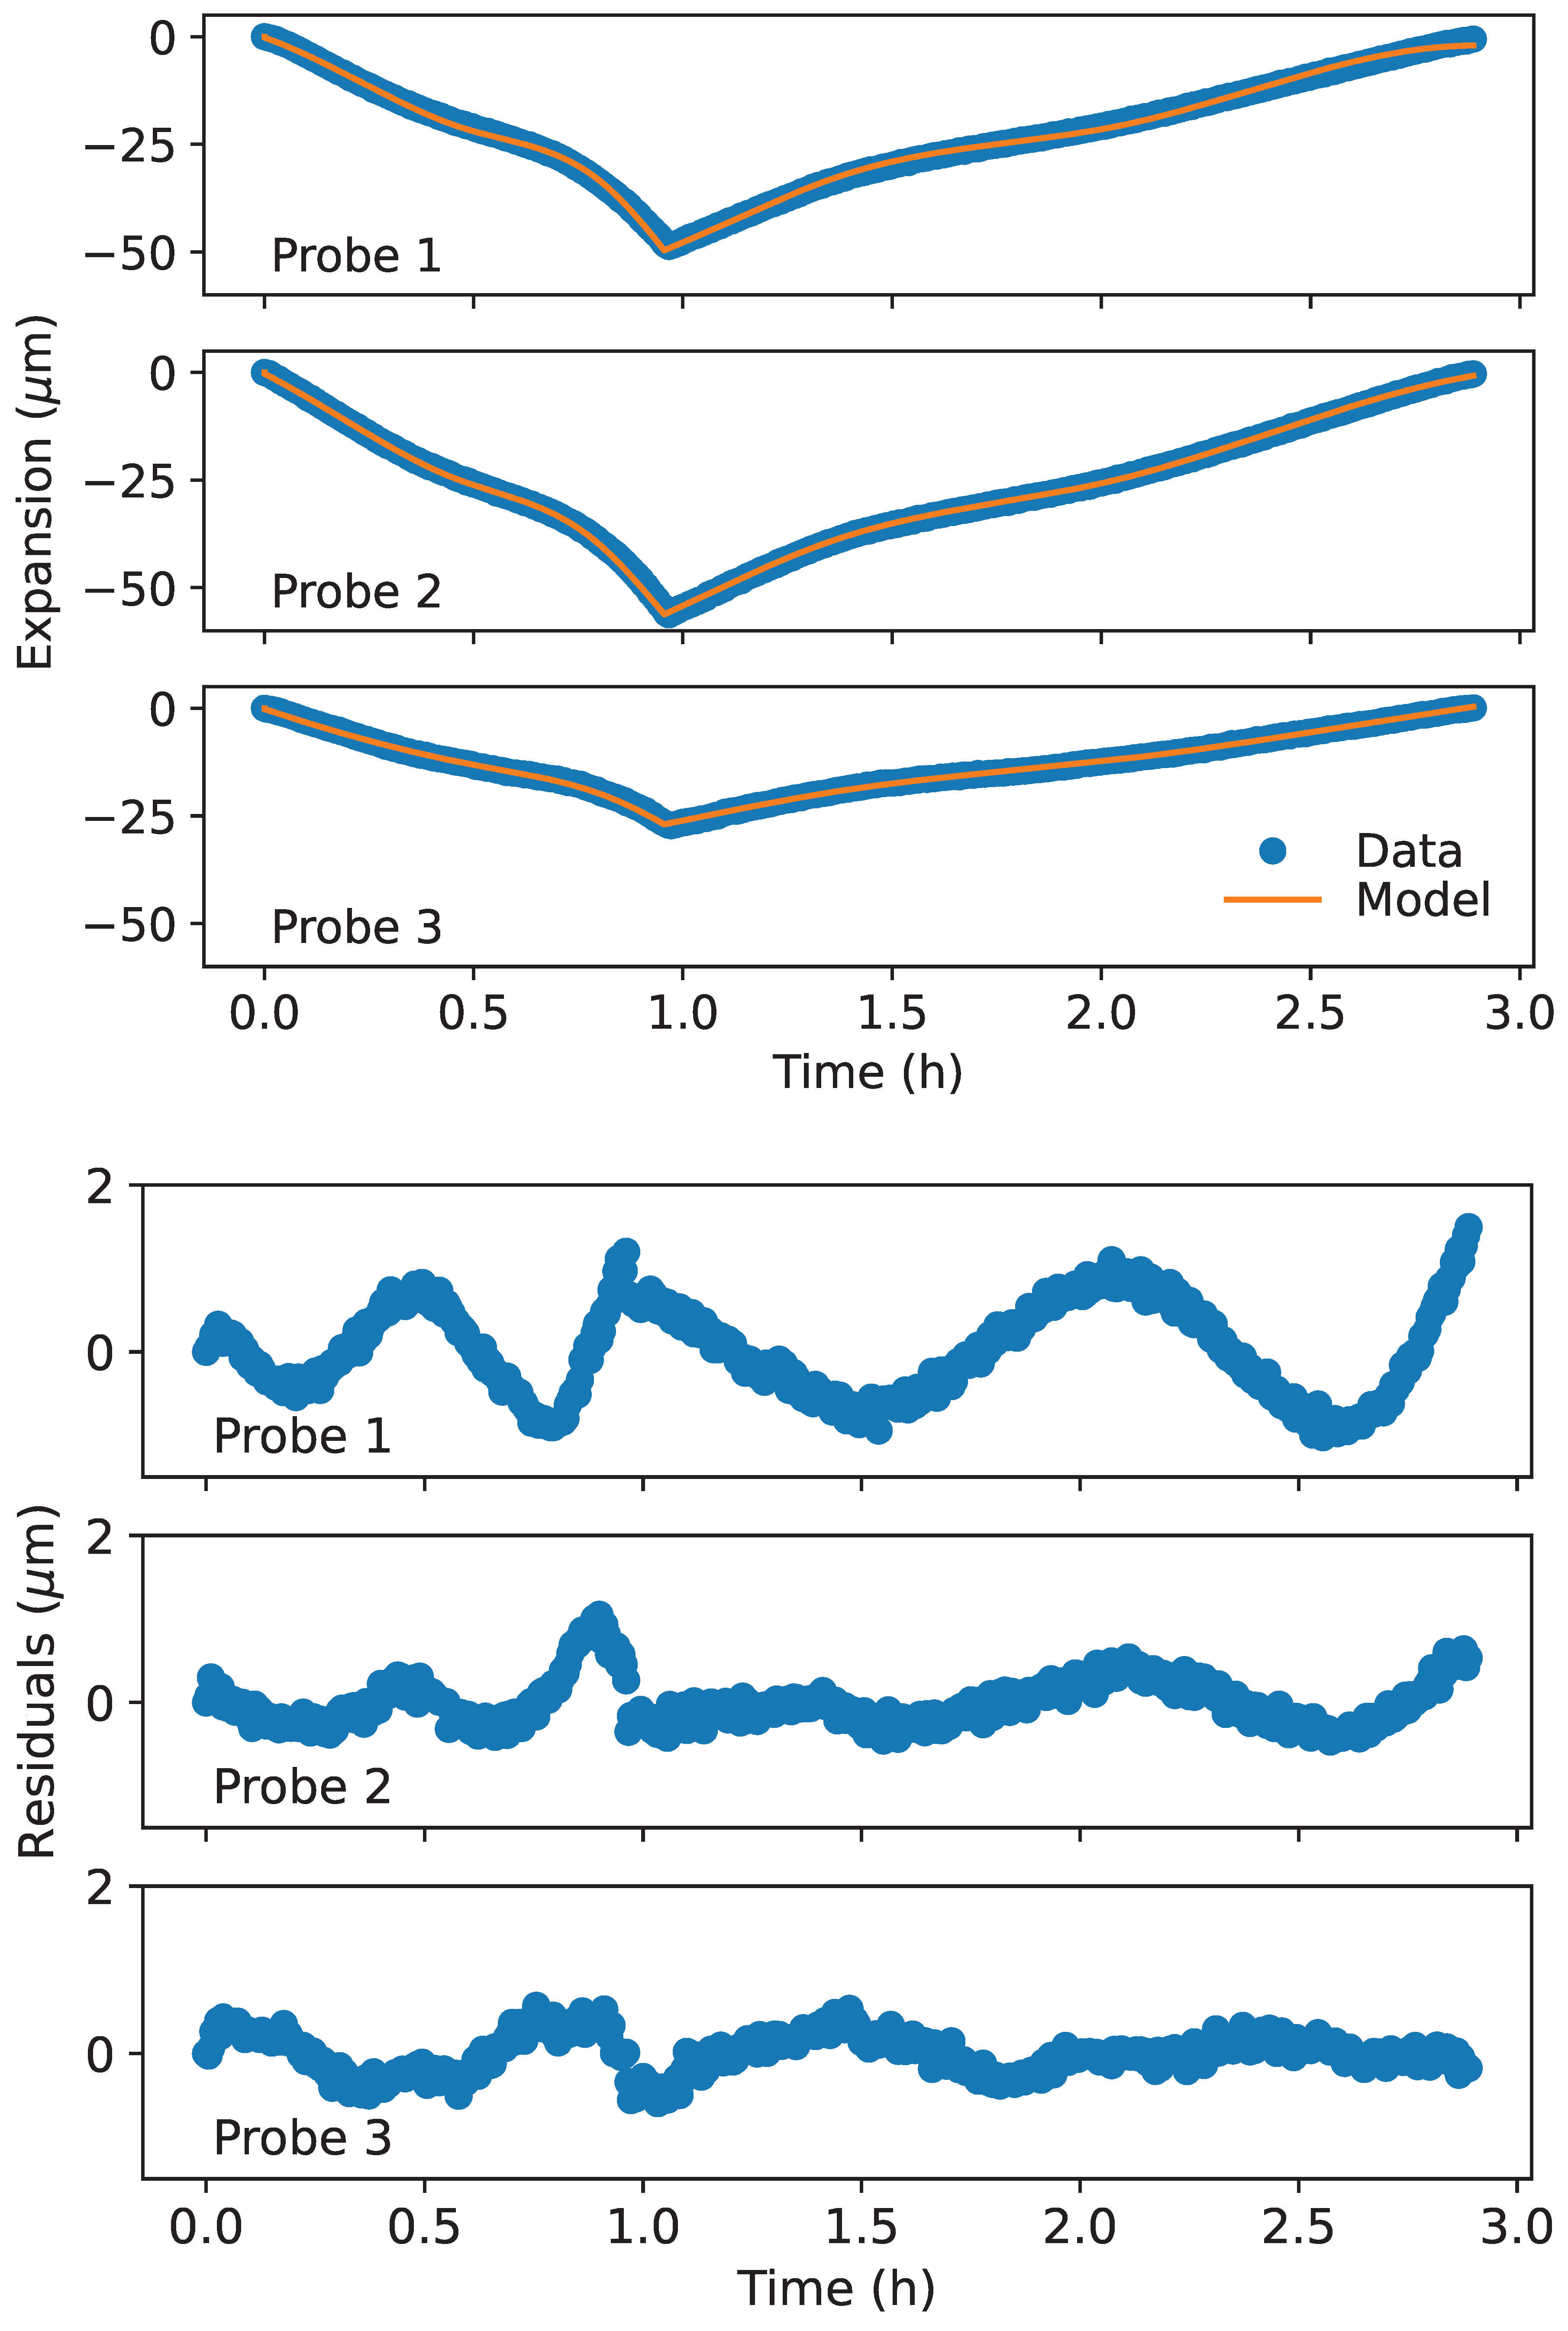
Figure 8.
Violin plots for model parameters for the discharge (a) and charge (b) mode generated by fitting voltage curves from nine lithium-ion battery cells.
Figure 8.
Violin plots for model parameters for the discharge (a) and charge (b) mode generated by fitting voltage curves from nine lithium-ion battery cells.
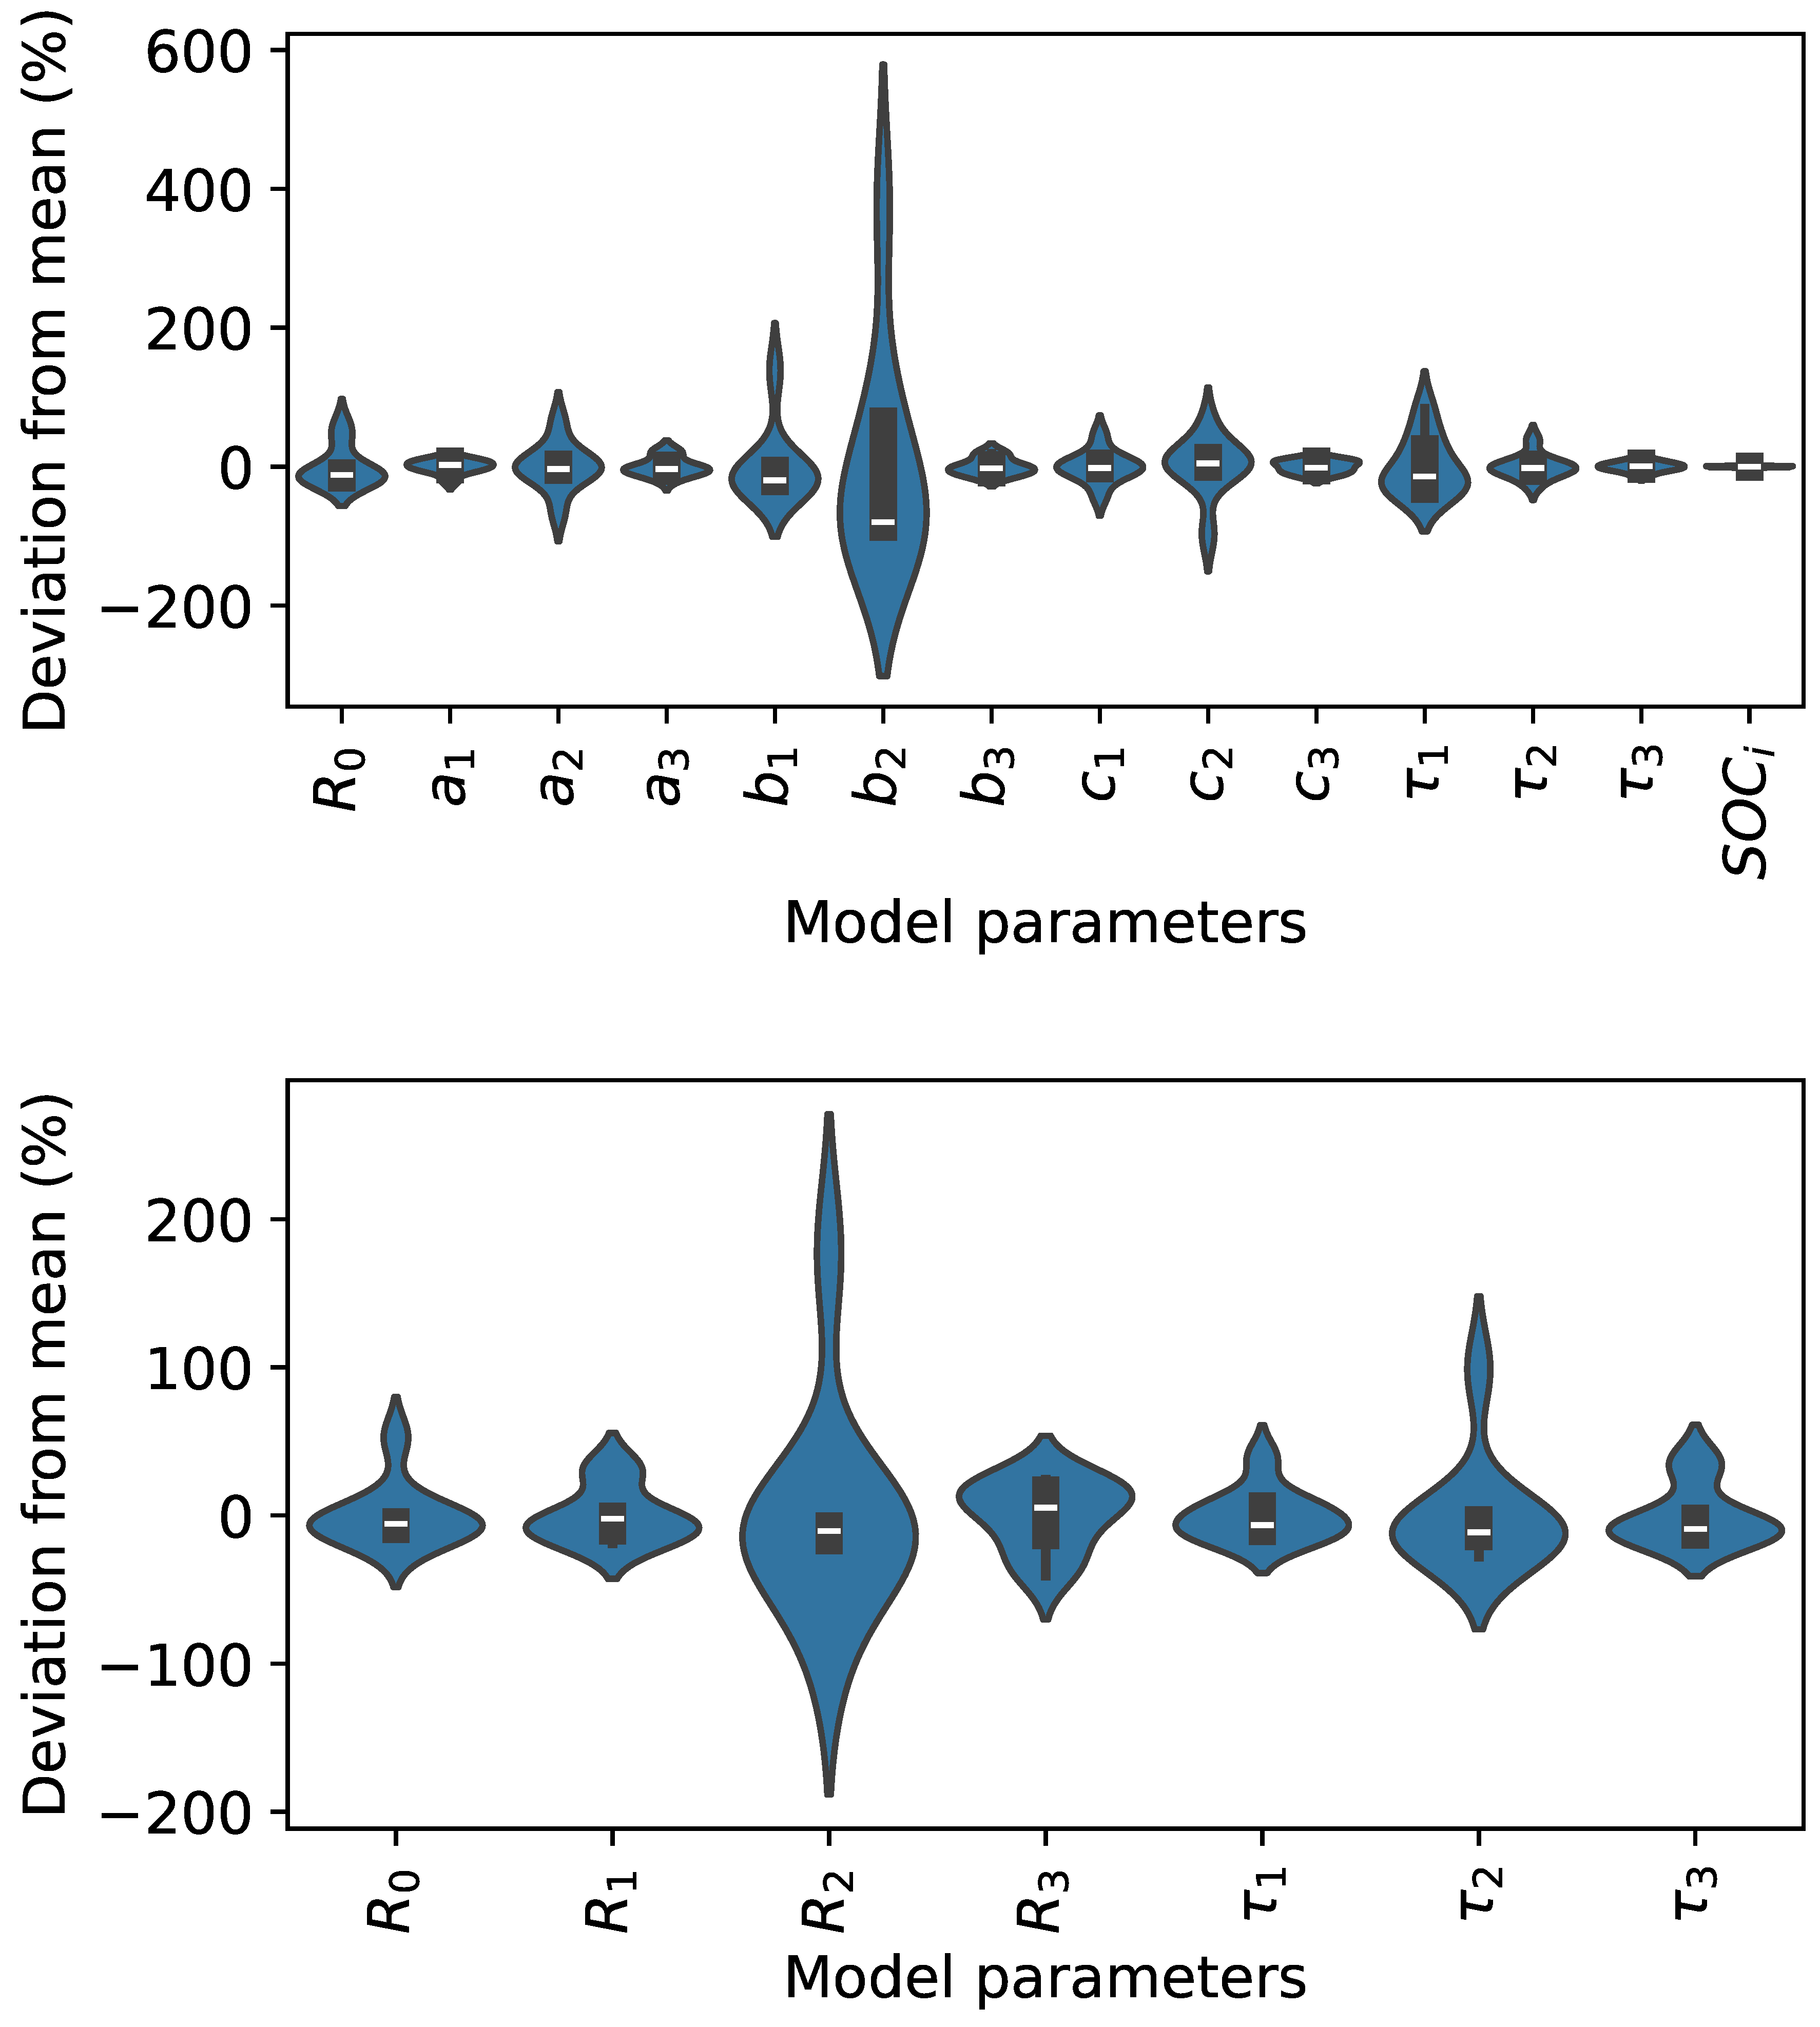
Figure 9.
A comparison of voltage curves taken from three real battery cells during cycling (plotted in blue) each overlaid with the same synthetically generated voltage curve (plotted in orange).
Figure 9.
A comparison of voltage curves taken from three real battery cells during cycling (plotted in blue) each overlaid with the same synthetically generated voltage curve (plotted in orange).
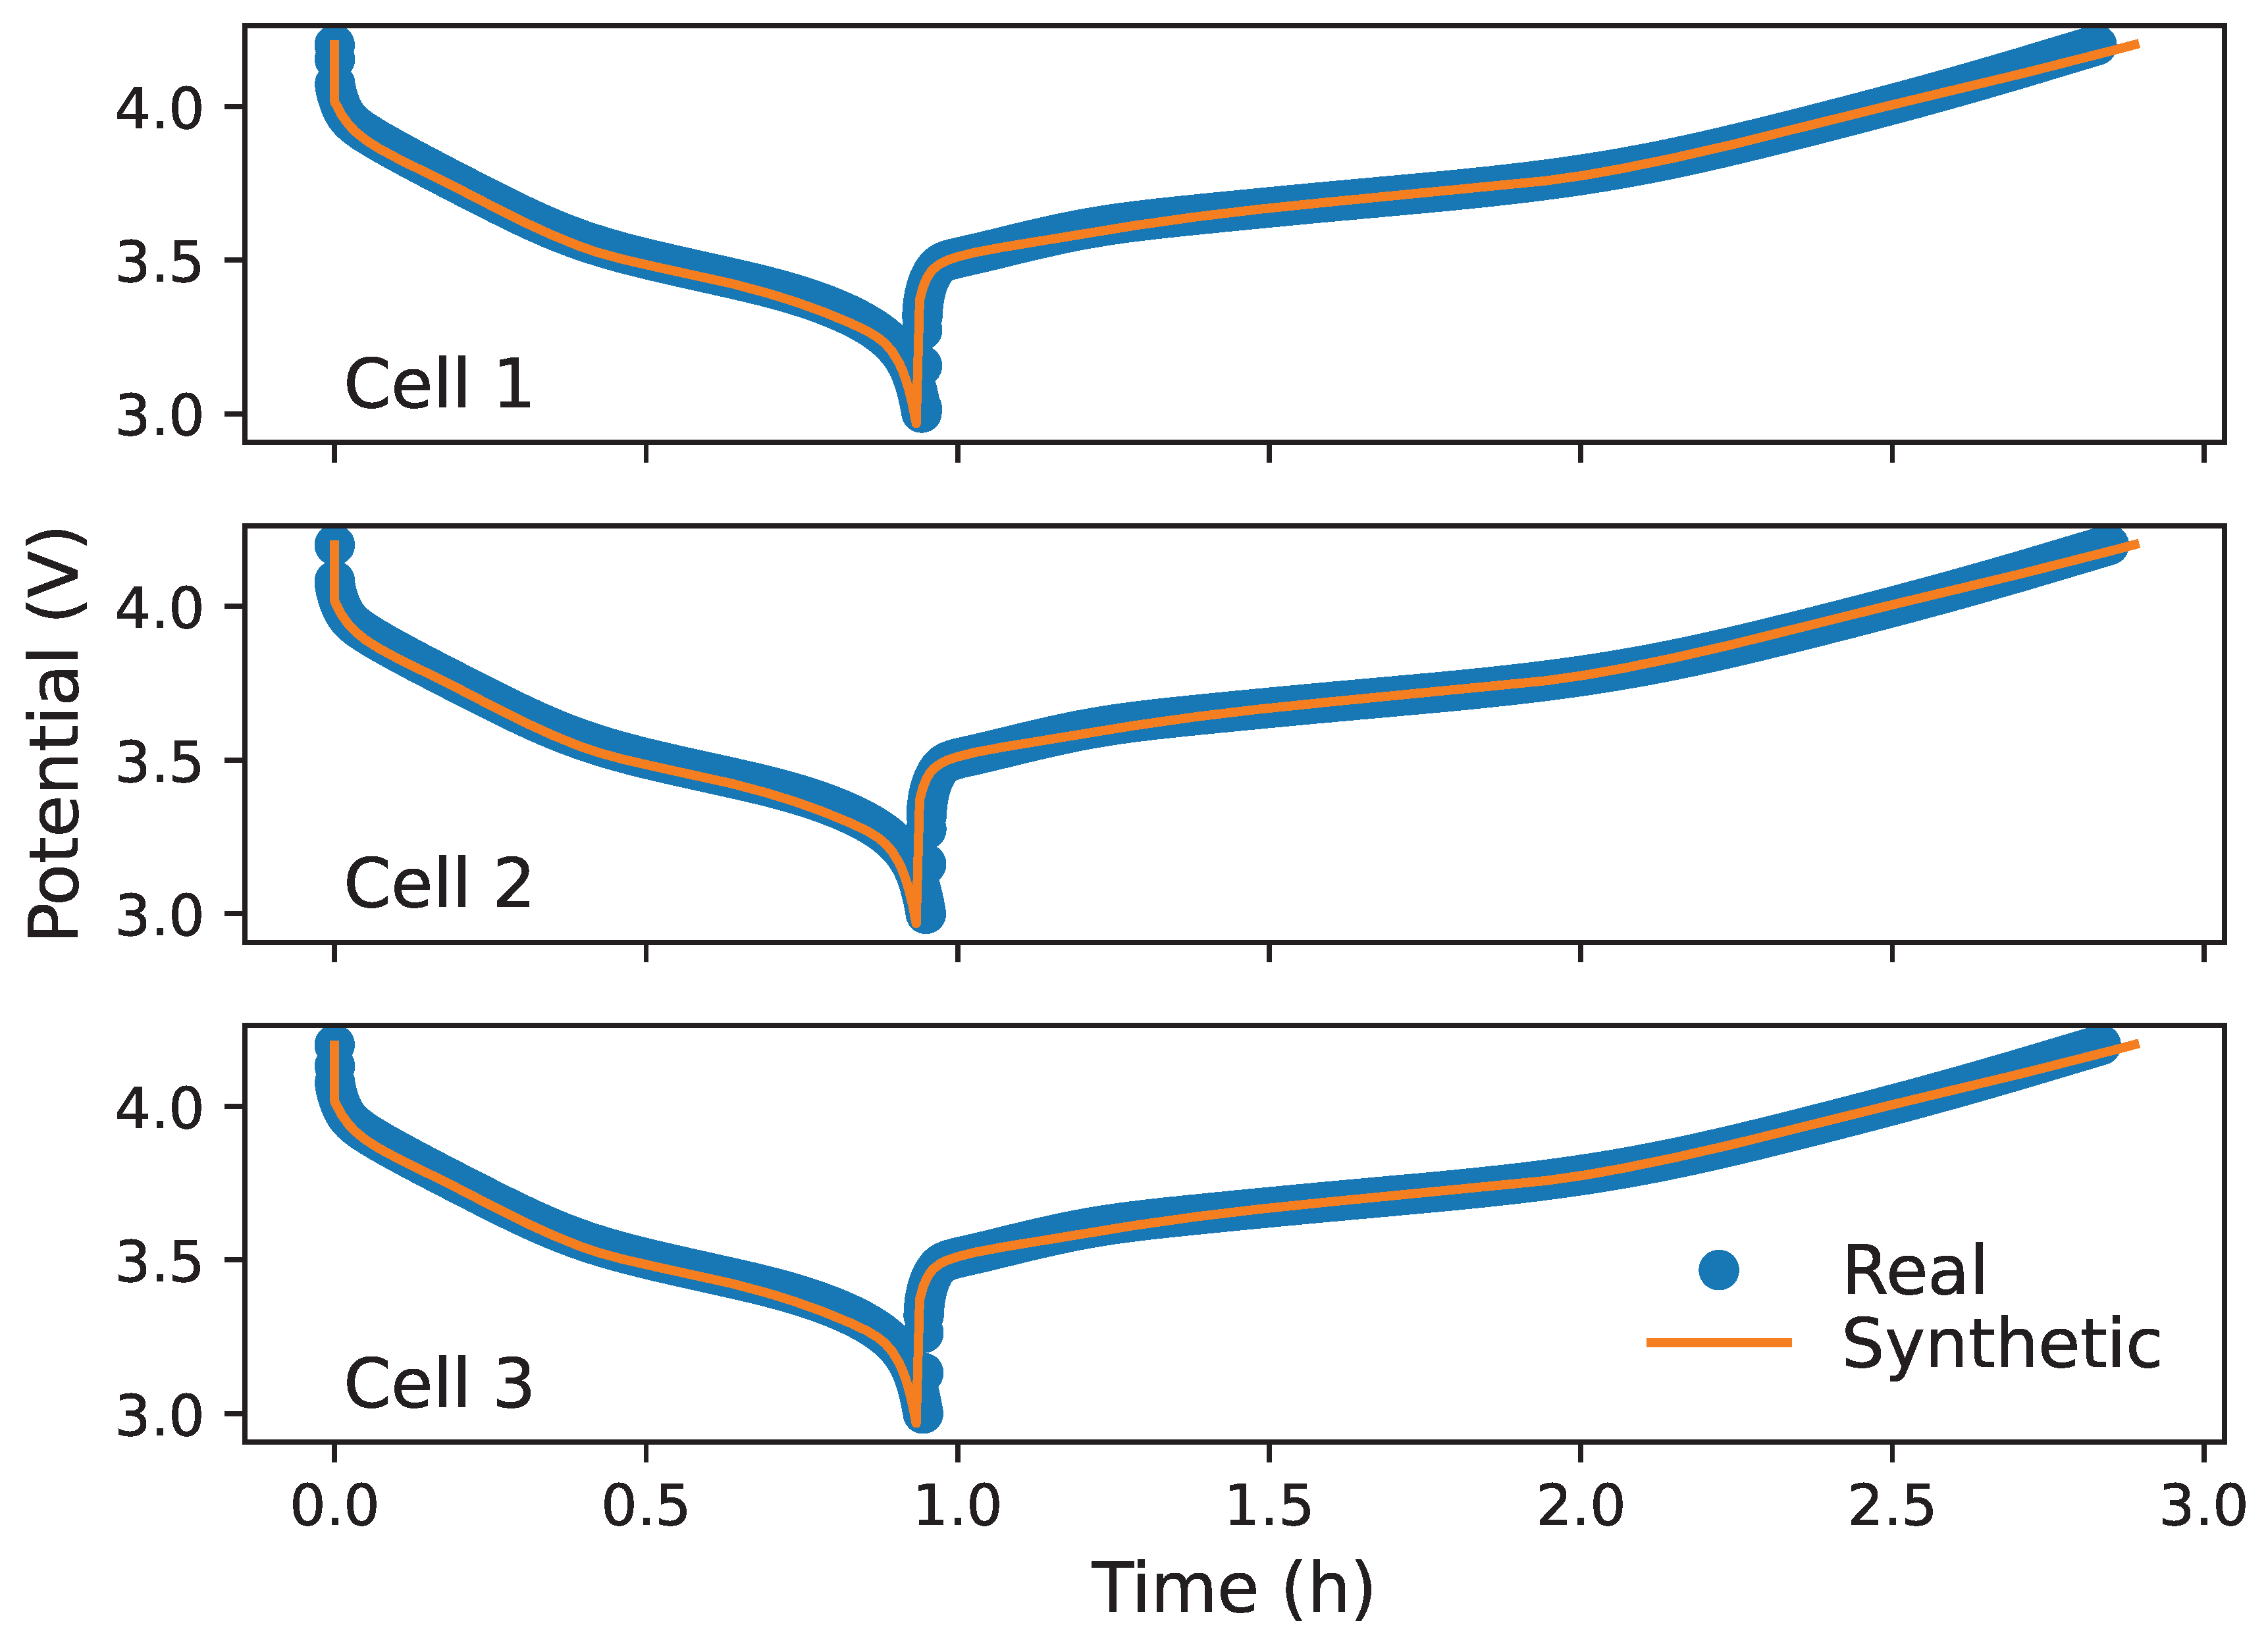

Table 1.
Mean and standard deviation of model parameters for the discharge (a) and charge (b) mode generated by fitting voltage curves from nine lithium-ion battery cells.
Table 1.
Mean and standard deviation of model parameters for the discharge (a) and charge (b) mode generated by fitting voltage curves from nine lithium-ion battery cells.
| (a) | ||
|---|---|---|
| Mean | Std | |
| (b) | ||
| Mean | Std | |
Disclaimer/Publisher’s Note: The statements, opinions and data contained in all publications are solely those of the individual author(s) and contributor(s) and not of MDPI and/or the editor(s). MDPI and/or the editor(s) disclaim responsibility for any injury to people or property resulting from any ideas, methods, instructions or products referred to in the content. |
© 2025 by the authors. Licensee MDPI, Basel, Switzerland. This article is an open access article distributed under the terms and conditions of the Creative Commons Attribution (CC BY) license (http://creativecommons.org/licenses/by/4.0/).
Copyright: This open access article is published under a Creative Commons CC BY 4.0 license, which permit the free download, distribution, and reuse, provided that the author and preprint are cited in any reuse.


