I. Introduction
Cardiovascular diseases including myocardial ischemia are reportedly causing death worldwide [
1,
2]. The preliminary cause of myocardial ischemia (MI) is atherosclerosis, blood clot and coronary artery spasm which depends on the blockage rate. An easy and well-known available method of acquiring diagnostic information on numerous heart conditions, to be specific a myocardial electrical activity through the ST- waveform in ECG signal to detect coronary artery diseases (CAD) has therapeutic significance[
3,
4].
Coronary artery disease (CAD) is the most recurrent heart disorder that leads to myocardial ischemia. CAD occurs deposition of unhealthy fats, known as plaques, on the inner walls of the coronary arteries, causing them to become narrow and restricting blood flow.
Among the Cardiovascular diseases (CVDs), globally, coronary artery disease (CAD), is the prominent cause of human life loss with an unfulfilled requirement to lower such a precious loss [
1], [
2]. During coronary artery disease (CAD) an accumulation of atherosclerotic plaques occurs in the epicardial arteries which can be obstructive or non-obstructive. Electrocardiography (ECG), which measures the electrical activity of heart is capable of detecting CAD and is hence widely used [
4]. Repolarization abnormalities of ECG signals for CAD or myocardial ischemia (MI) are clear/direct indications, especially during ST-segment depressions [
5]. Left bundle branch block i.e., the Q waves in the ECG signal can be another indirect parameter for CAD during a resting ECG. For such patients having no significant ischemia changes during resting ECG, an exercise ECG test is suitable for measuring the initial, middle, and post-ECG exercise to strengthening oxygen consumption of the heart [
5]. During such test, the limitation of the coronary blood flow due to obstructive CAD may cause an ischemia change in the ECG. However, contraction of heart muscles, baseline wander, or interference from the power line will interfere with ECG signals during such analysis [
6]. If CAD cannot be detected by clinical assessment, a noninvasive coronary computed tomography is recommended to establish the diagnosis in such conditions [
5].
The significance of myocardial ischemia lies in the potential consequences it can have on heart health. When the heart muscle doesn't receive enough oxygen and nutrients due to reduced blood flow, it may not function optimally causing significant pain in chest and severe discomfort, known as angina, under such conditions when the individual undergoes physical exertion or some emotional stress.
Furthermore, in case conditions when there is a complete blockage or very restricted blood flow for longer duration, it can potentially cause a heart attack which is known as myocardial infarction in medical terms. During myocardial infarction, some portion of the heart muscles got severely affected due to insufficient supply of oxygen and got permanently damaged. This condition leads to life-threatening arrhythmias or in some cases a heart failure.
Timely diagnosing and controlling myocardial ischemia is utmost important to restrain or minimize its long-term effects. Patients conjecture of myocardial ischemia conduct various laboratory or medical diagnostic tests/examinations, like electrocardiogram (ECG/EKG), stress tests to make the heart pump blood at faster rate, echocardiogram, coronary angiography for dynamic x-rays of heart, or cardiac MRI scans. Sometimes treatment suggested by physician may include lifestyle changes or medications to manage risk factors. For such cases where medications are not sufficient invasive procedures may be suggested such as cardiac angioplasty in which cardiac stent are placed or coronary artery bypass grafting (CABG) to restore blood flow and by pass the blockage.
The purpose of this research is to detect the variations in the ECG signal of such patients suffering from myocardial ischemia by following standard recording procedure of ECG after 5 min walking and 5 min jogging. After analyzing the ECG there is an evident difference in the height of PR segment and J point. This allows us to distinguish between the normal ECG and a patient suffering from myocardial Ischemic. Moreover, the myocardial ischemic patient’s ECG followed a similar pattern which can be easily visualized and recognized from the enhancement of j point and T wave of the myocardial patient’s ECG recorded after walking and running.
II. Literature Review
For many years, cardiologists have utilized electrocardiography (also known as an ECG or EKG) as a primary diagnostic tool to evaluate the electrical activity of the heart. The ECG waveform reflects the electrical activities that take place during the cardiac cycle and provide important details about how the heart is working and any potential problems.
Several research studies have been conducted and established an automated methods for the detection of MI by examining ECG data [
2,
7,
8,
9,
10,
11,
12]. An efficient algorithm for ECG signal analysis with average detection accuracy of approximately 95.6% and sensitivity of 96.5% was achieved by using harmonic phase distribution pattern for MI detection from the ECG data [
7]. An accuracy of 96.1% was achieved by analyzing the MI ECG signal and normal ECG signal using multi-resolution properties of the wavelet transform [
8]. Another approach is using support vector machine (SVM) classifier, by using the 12-lead ECG data for the detection of MI signals achieved a accuracy, sensitivity and specificity of 96.99% [
9]. Extracting time domain features of the ECG signal and detecting MI signals using kNN classifier yielded sensitivity of 99.97% [
10]. However, adopting classical machine learning techniques can degrade the performance on validation due to the overfitting. There are some major deficiencies associated with the existing machine learning an deep learning techniques such as longer authentication time required due to the complex computational algorithms, quality of ECG signal and sensitivity to its quality and requirement of ECG data recorded using multiple ECG leads.
Here, we propose detection of MI signal based to the features extracted from a single lead ECG signal recorded using MAX30001. By employing advanced signal processing techniques to extract the essential information from the preprocessed signal, to locate the R-peaks in the ECG signal was used to extract features present in the ECG signal. It was found that the amplitude of the R-peaks incase of MI patients is very less than the amplitudes in case of healthy individuals i.e. ranging from 1.8 to 2.5 mV. The J-points begins immediately after 0.09 seconds of R-peak, by adding the offset to the R-peak locations, that serves as a reference point to locate the ST segments in the ECG signal. The elevation of j-points in MI ECG is also an indication that the patient is suffering from cardiac disorder. The second comparison between the healthy ECG ST segment and Mi patient ECG is that it has a short duration which can be caused by other ECG issues and depends on patients history but it also links towards MI.
III. Materials and Methods
Data Acquisition:
During the first phase includes the collection of high-accuracy electrocardiogram (ECG) data from various group of people using MAX30001 equipment. The MAX30001 is a device used to record ECG data from the patient in real time. This device requires low-power to operate. A single-channel analogue front-end (AFE) for ECG recording and is famous for its remarkable features and capabilities [
13]. The high-resolution analog-to-digital converter available in the MAX30001 gadget made it easier to transform analogue ECG impulses into digital format, allowed us to precisely and accurately record the heart's minute electrical fluctuations and ensuring that no data is lost during the acquisition process.
Preprocessing of ECG Signals:
The ECG data acquired form the MAX30001 device has noises such as interference from different frequencies, baseline drift, electrode contact noise, polarization noise, muscle noise and motion artifacts. Removal of these noises are crucial for studying the ECG signal. To get rid of the unwanted noises, the signals were preprocessed using different filter. Preprocessing enhances the quality of the signal that provides more accurate representation of the heart’s behavior/electrical activity. However, over filtering of ECG signals can lead to distortion of the signals. Keeping this in mind following filters were chosen.
1) Butterworth High-Pass Filter:
To get rid from the low frequency noises a high-pass Butterworth filter was used. To apply a high pass filter, we processed the signal in time domain. The selection of the cutoff frequency is a crucial factor in the high-pass filter's design. To apply a high pass filter, the signal was processed in time domain. The selection of the cutoff frequency is a crucial factor in the high-pass filter's design. A cutoff frequency of 0.5Hz was selected as it is effective in removing slow variations often caused due to patient motion artifacts, electrode movement, respiration or electrode contact issues. By using this cutoff frequency, the filter attenuates all motion artifacts. The order of the filter affects how steep the roll-off is, so a second order filter was selected. The end result was a filtered ECG signal with substantially less low-frequency noises [
14].
2) Butterworth Low Pass Filter:
A low-pass filter attenuates or filters out high-frequency components while allowing low-frequency components to pass. The low-pass filter selectively reduces high-frequency noise, such as muscle artefacts and high-frequency interference, in the context of ECG signal processing while maintaining the crucial low-frequency components linked to heart activity [
15]. For applying low pass filter, the signal was reconstructed in time domain. A cutoff of 20Hz frequency was chosen when designing a low-pass filter.
3) Baseline Wander Removal Filter:
In biomedical applications like electrocardiograms (ECGs), [
17] baseline wander can make it difficult to precisely detect and analyze significant characteristics of the signal. [
3] so our third filter was a baseline wander removal filter which uses particular algorithm. A additional filtering step after the initial high pass filtering using 0.5 Hz is essential as the real time data acquired had a lot of baseline wander which was still not being removed after the initial filtering because their frequency are slightly above 0.5Hz. A baseline wander removal filter with a cutoff frequency of 0.15Hz was used to target the residual baseline wander components. This enhances the overall signal quality.
4) Wavelet sym4 Denoise Filter:
The final step of the preprocessing phase involves using the wavelet transform to decompose the signal into various frequency sub bands. This offers a time-frequency representation of the input signal. The Sym4 wavelet is made to successfully capture both smooth and oscillatory aspects of a signal [18]. The equation for MODWT wavelet decomposition and reconstruction is given in equation (1) and (2) respectively.
where W
j d(
k) is the wavelet coefficients at scale j and location k,
x(
m) is the input signal and
ψj,k d(
k )is the discrete wavelet function at scale j and location k. Each wavelet coefficient suppresses the noise components utilizing the thresholding technique hence removing any of the left noise which was not previously eliminated by the filters.
IV. Result and Discussion
By analyzing the real time ECG signals using Discrete wavelet transformation better results are obtained compared to the results obtained from application of Pan Tompkins algorithm. It helped in extracting the R-peaks point, segmentation of ST segment, PR segment and RT segment. The implementation of wavelet transformation proved more effective and accurate compared to thresholding method mentioned in previous research papers. One Important finding was the difference between the height of PR segment and J point allowing to distinguish between a normal ECG and a Myocardial Ischemic patient’s ECG.
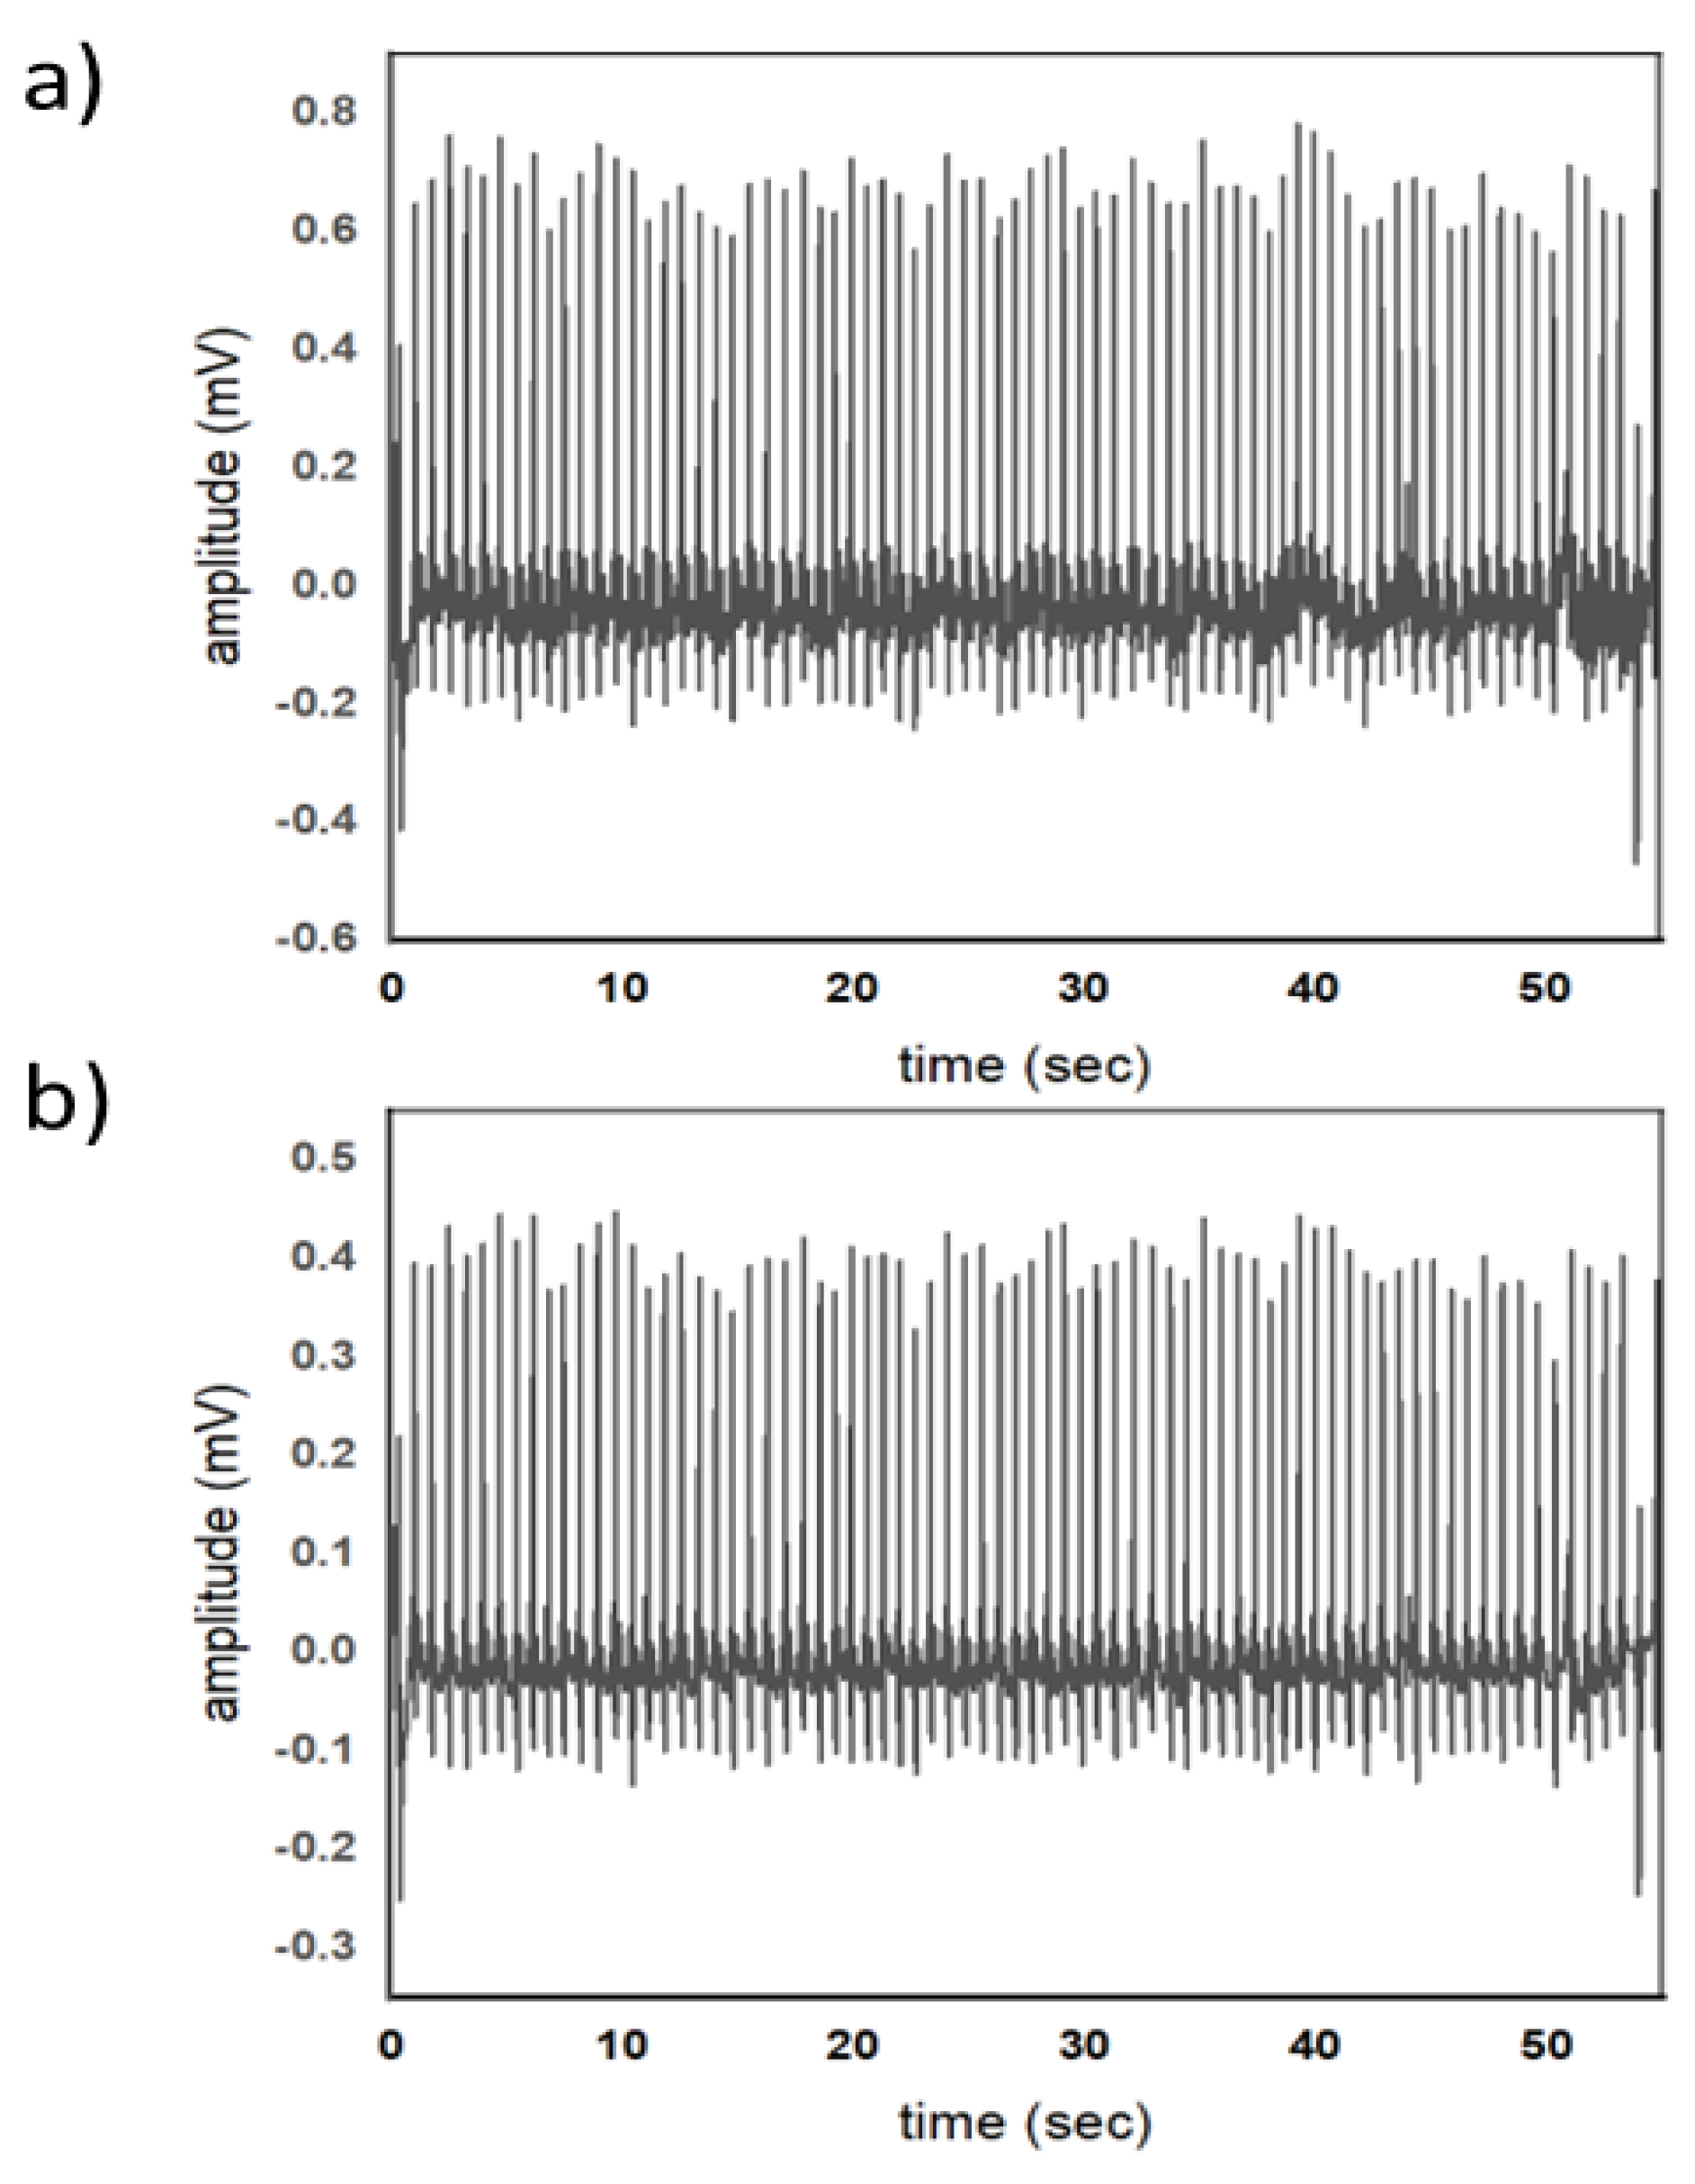
Figure 1, shows an ECG signal of a 21 years old person. Fid 1a, shows an ECG of a healthy individual recorded using MAX30001 kit. The signal is a raw data while
Figure 1b shows a processed ECG signal using accustom written code in MATLAB. Four filters such a Butter worth high pass, Butter worth low pass, baseline wander removal and denoising using sym4 wavelet are used. The benefit of preprocessing the ECG data is that it offers more refined and noise reduced representation of the heart electrical activity of a human heart.
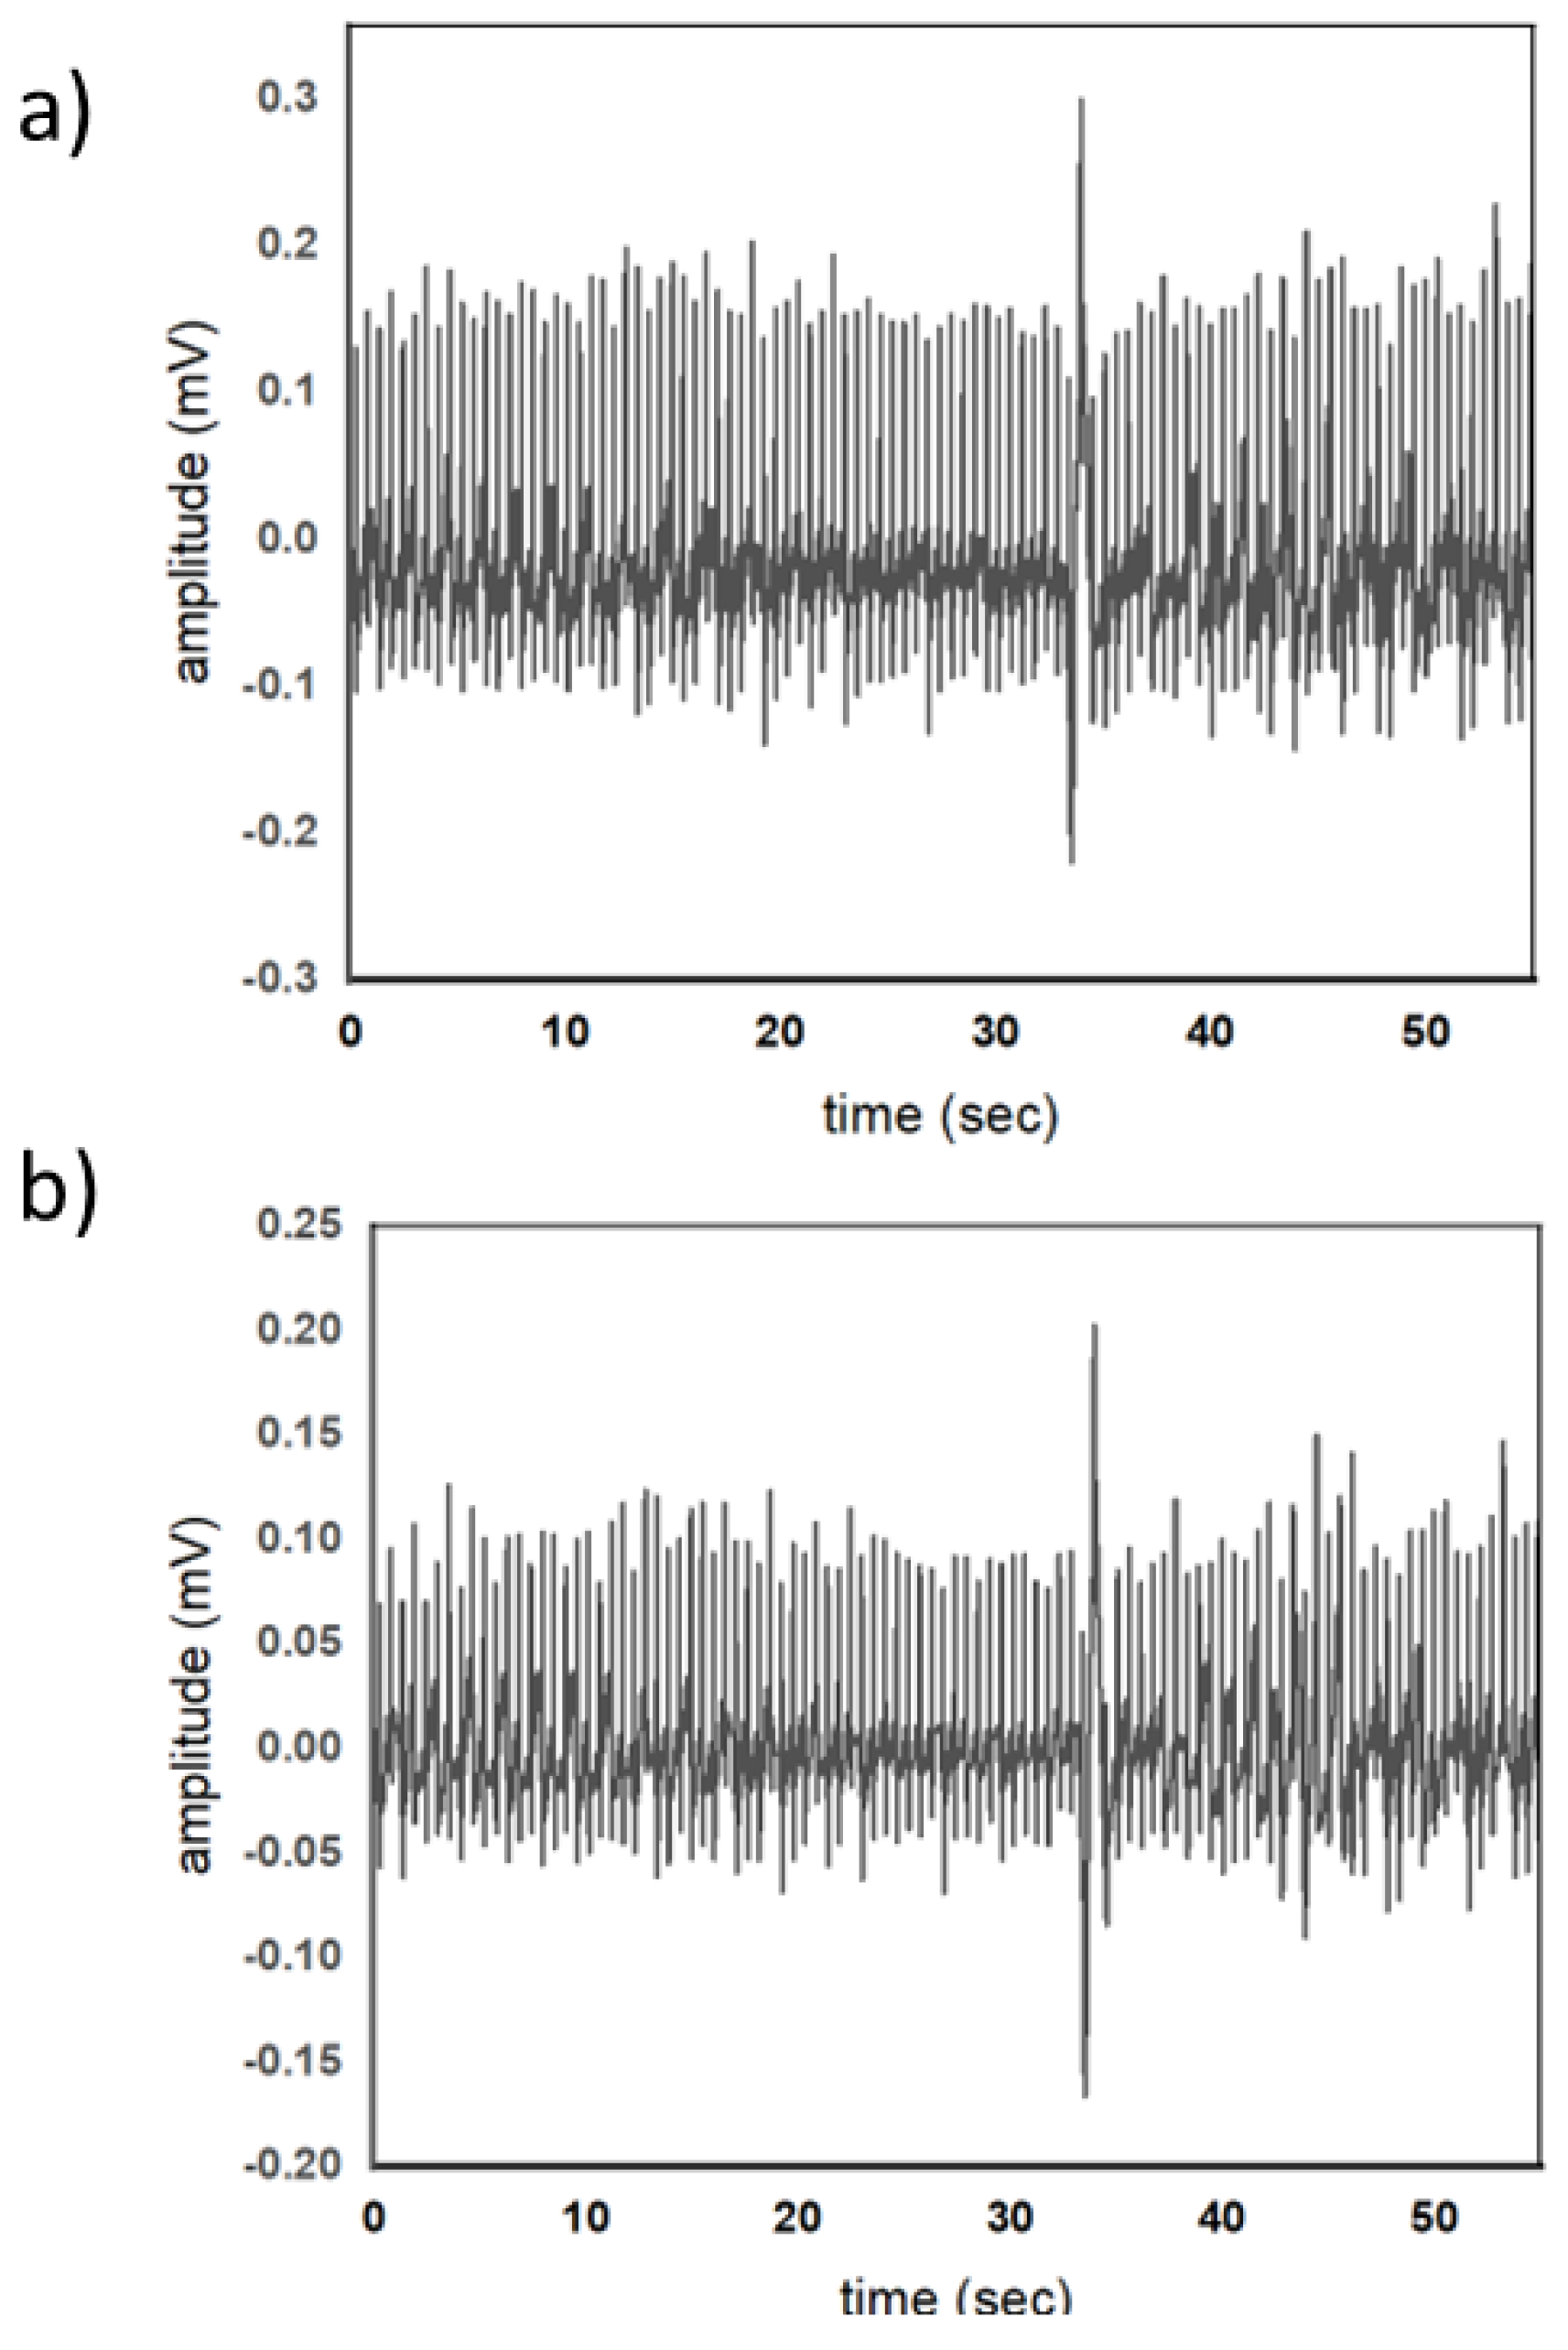
Figure 2, shows an ECG signal of a 56-year-old patient suffering from myocardial ischemia. Fig a, is ECG is of 56 years old mi patient. This data represents the electrical activity of the heart muscle when it is undergoing ischemia, a condition characterized by reduced blood flow to the heart. This is also passed through the same filters to have a fair comparison between a normal ecg and a MI patient’s ECG.
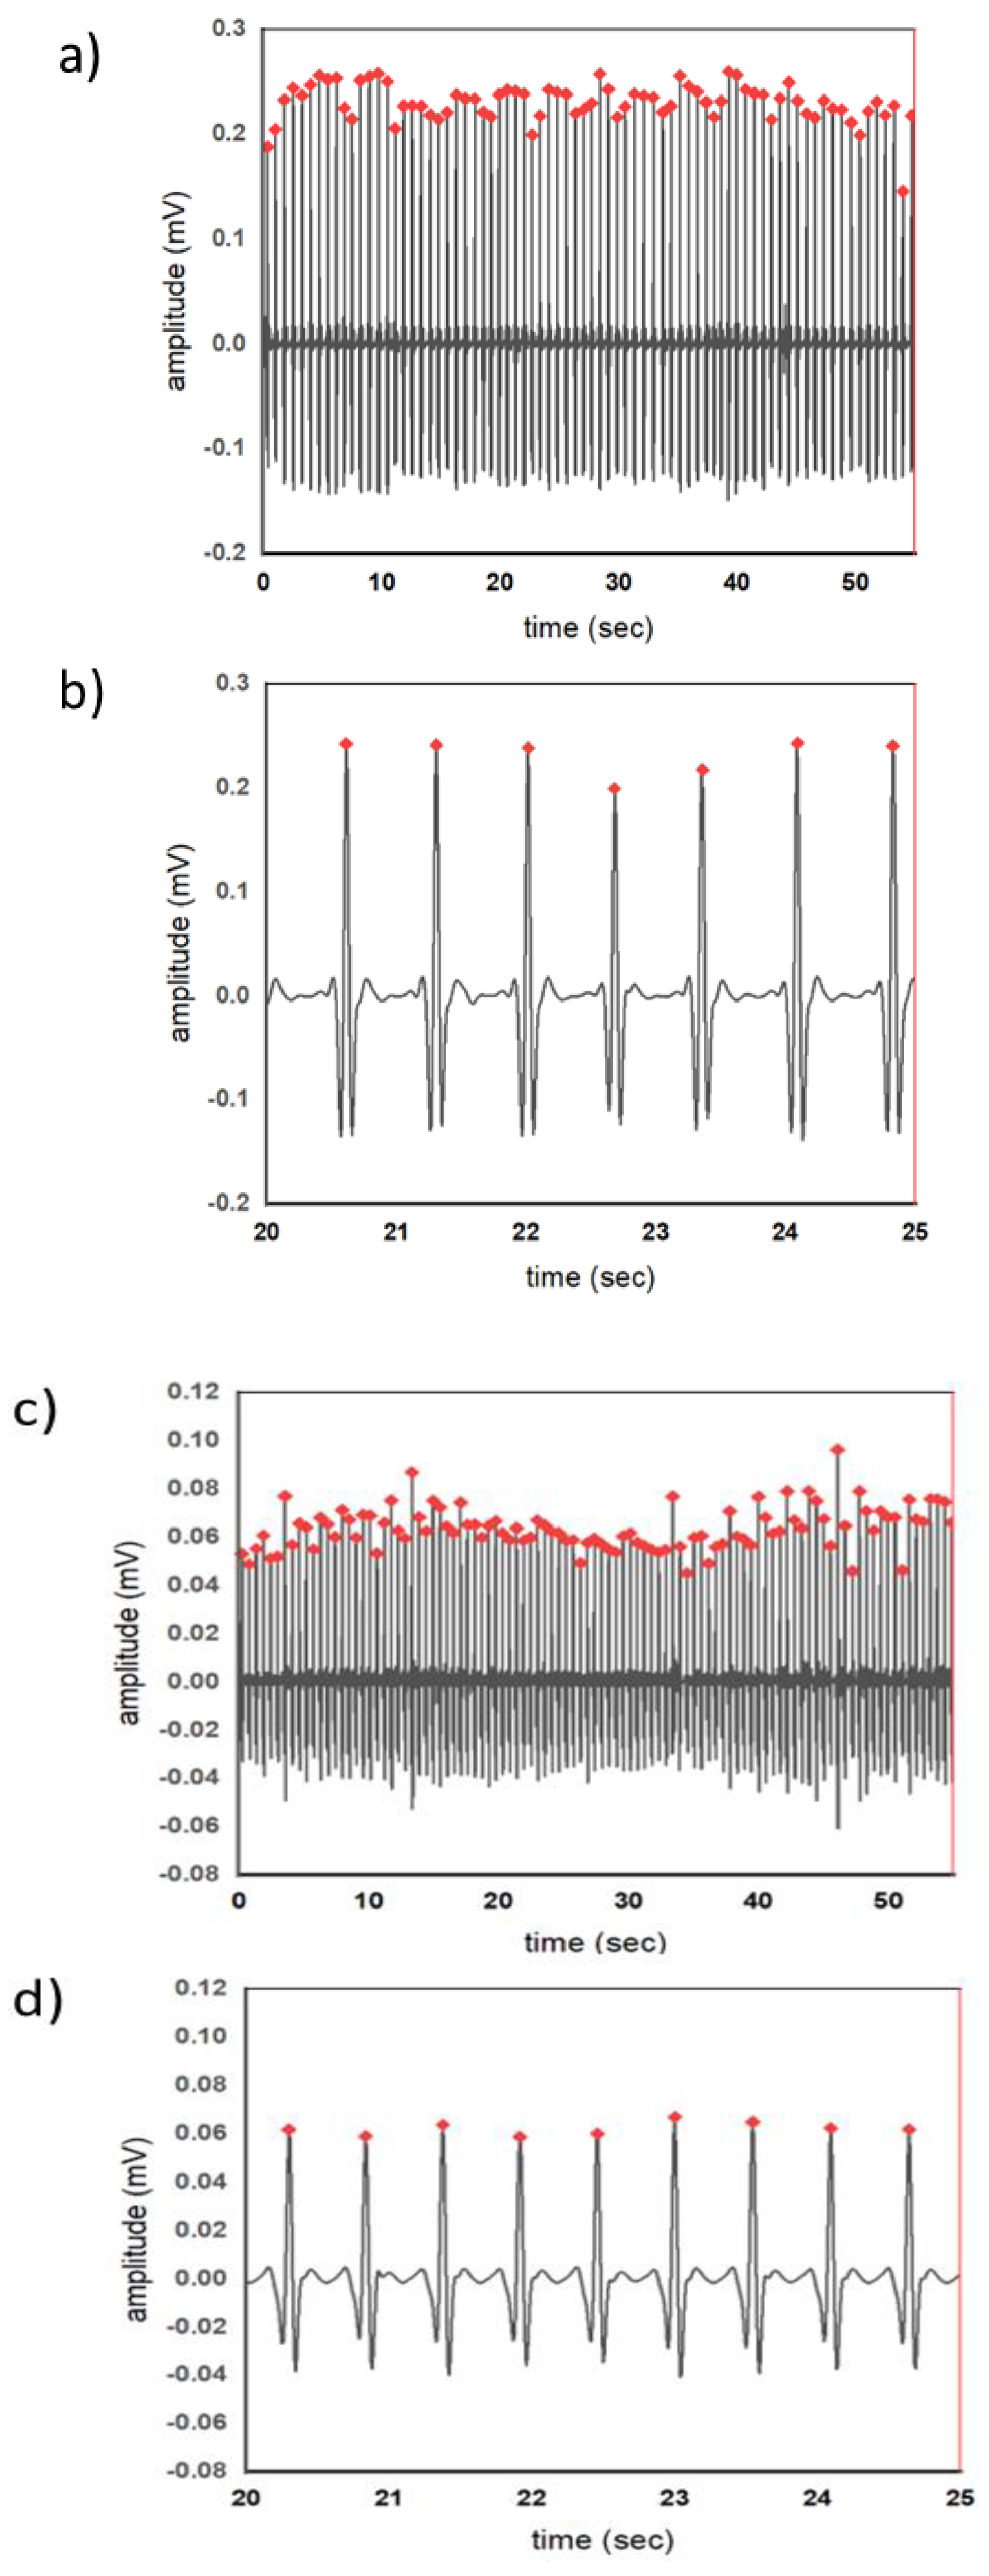
Figure 3, displays the locations of R-peaks in a normal ECG signal as well as in MI patient. R-peaks are the high points in the ECG waveform which represent the ventricular depolarization. These peaks are critical reference points for measuring intervals and segments such as the PR interval, ST segment and j-point. The amplitude of the r peak also plays an important role in assessing of disease. As evident form the wave forms that the amplitude of R-peaks in MI patients is significant reduced as compared to that of R-peaks of a normal individual with no myocardial ischemia.
Figure 3a & b, shows the ECG wave forms of a normal individual with actual filtered wave form and zoom-in wave form with the R-peaks respectively. The R-peaks amplitude lies in the range of 1.8 mV to 2.5 mV.
Figure 3c & d, shows R-peaks in ECG signals from patients with Myocardial Ischemia. The R-peaks represent the heart's electrical activity, and irregularity in their pattern can signal issues related to ischemia. Detecting these changes is critical for diagnosing cardiac conditions as they provide clues about the impact of ischemia on the heart's electrical behavior. Upon comparison of R-peaks of normal ECG and Myocardial Ischemia, it was observed that the R peaks in MI patients had a lower amplitude. This means that the heart's electrical signals in MI patients are weaker or altered. This observation indicates that MI can lead to reduced R-peak amplitudes, which is a characteristic that differentiates MI patients from individuals with a healthy heart.
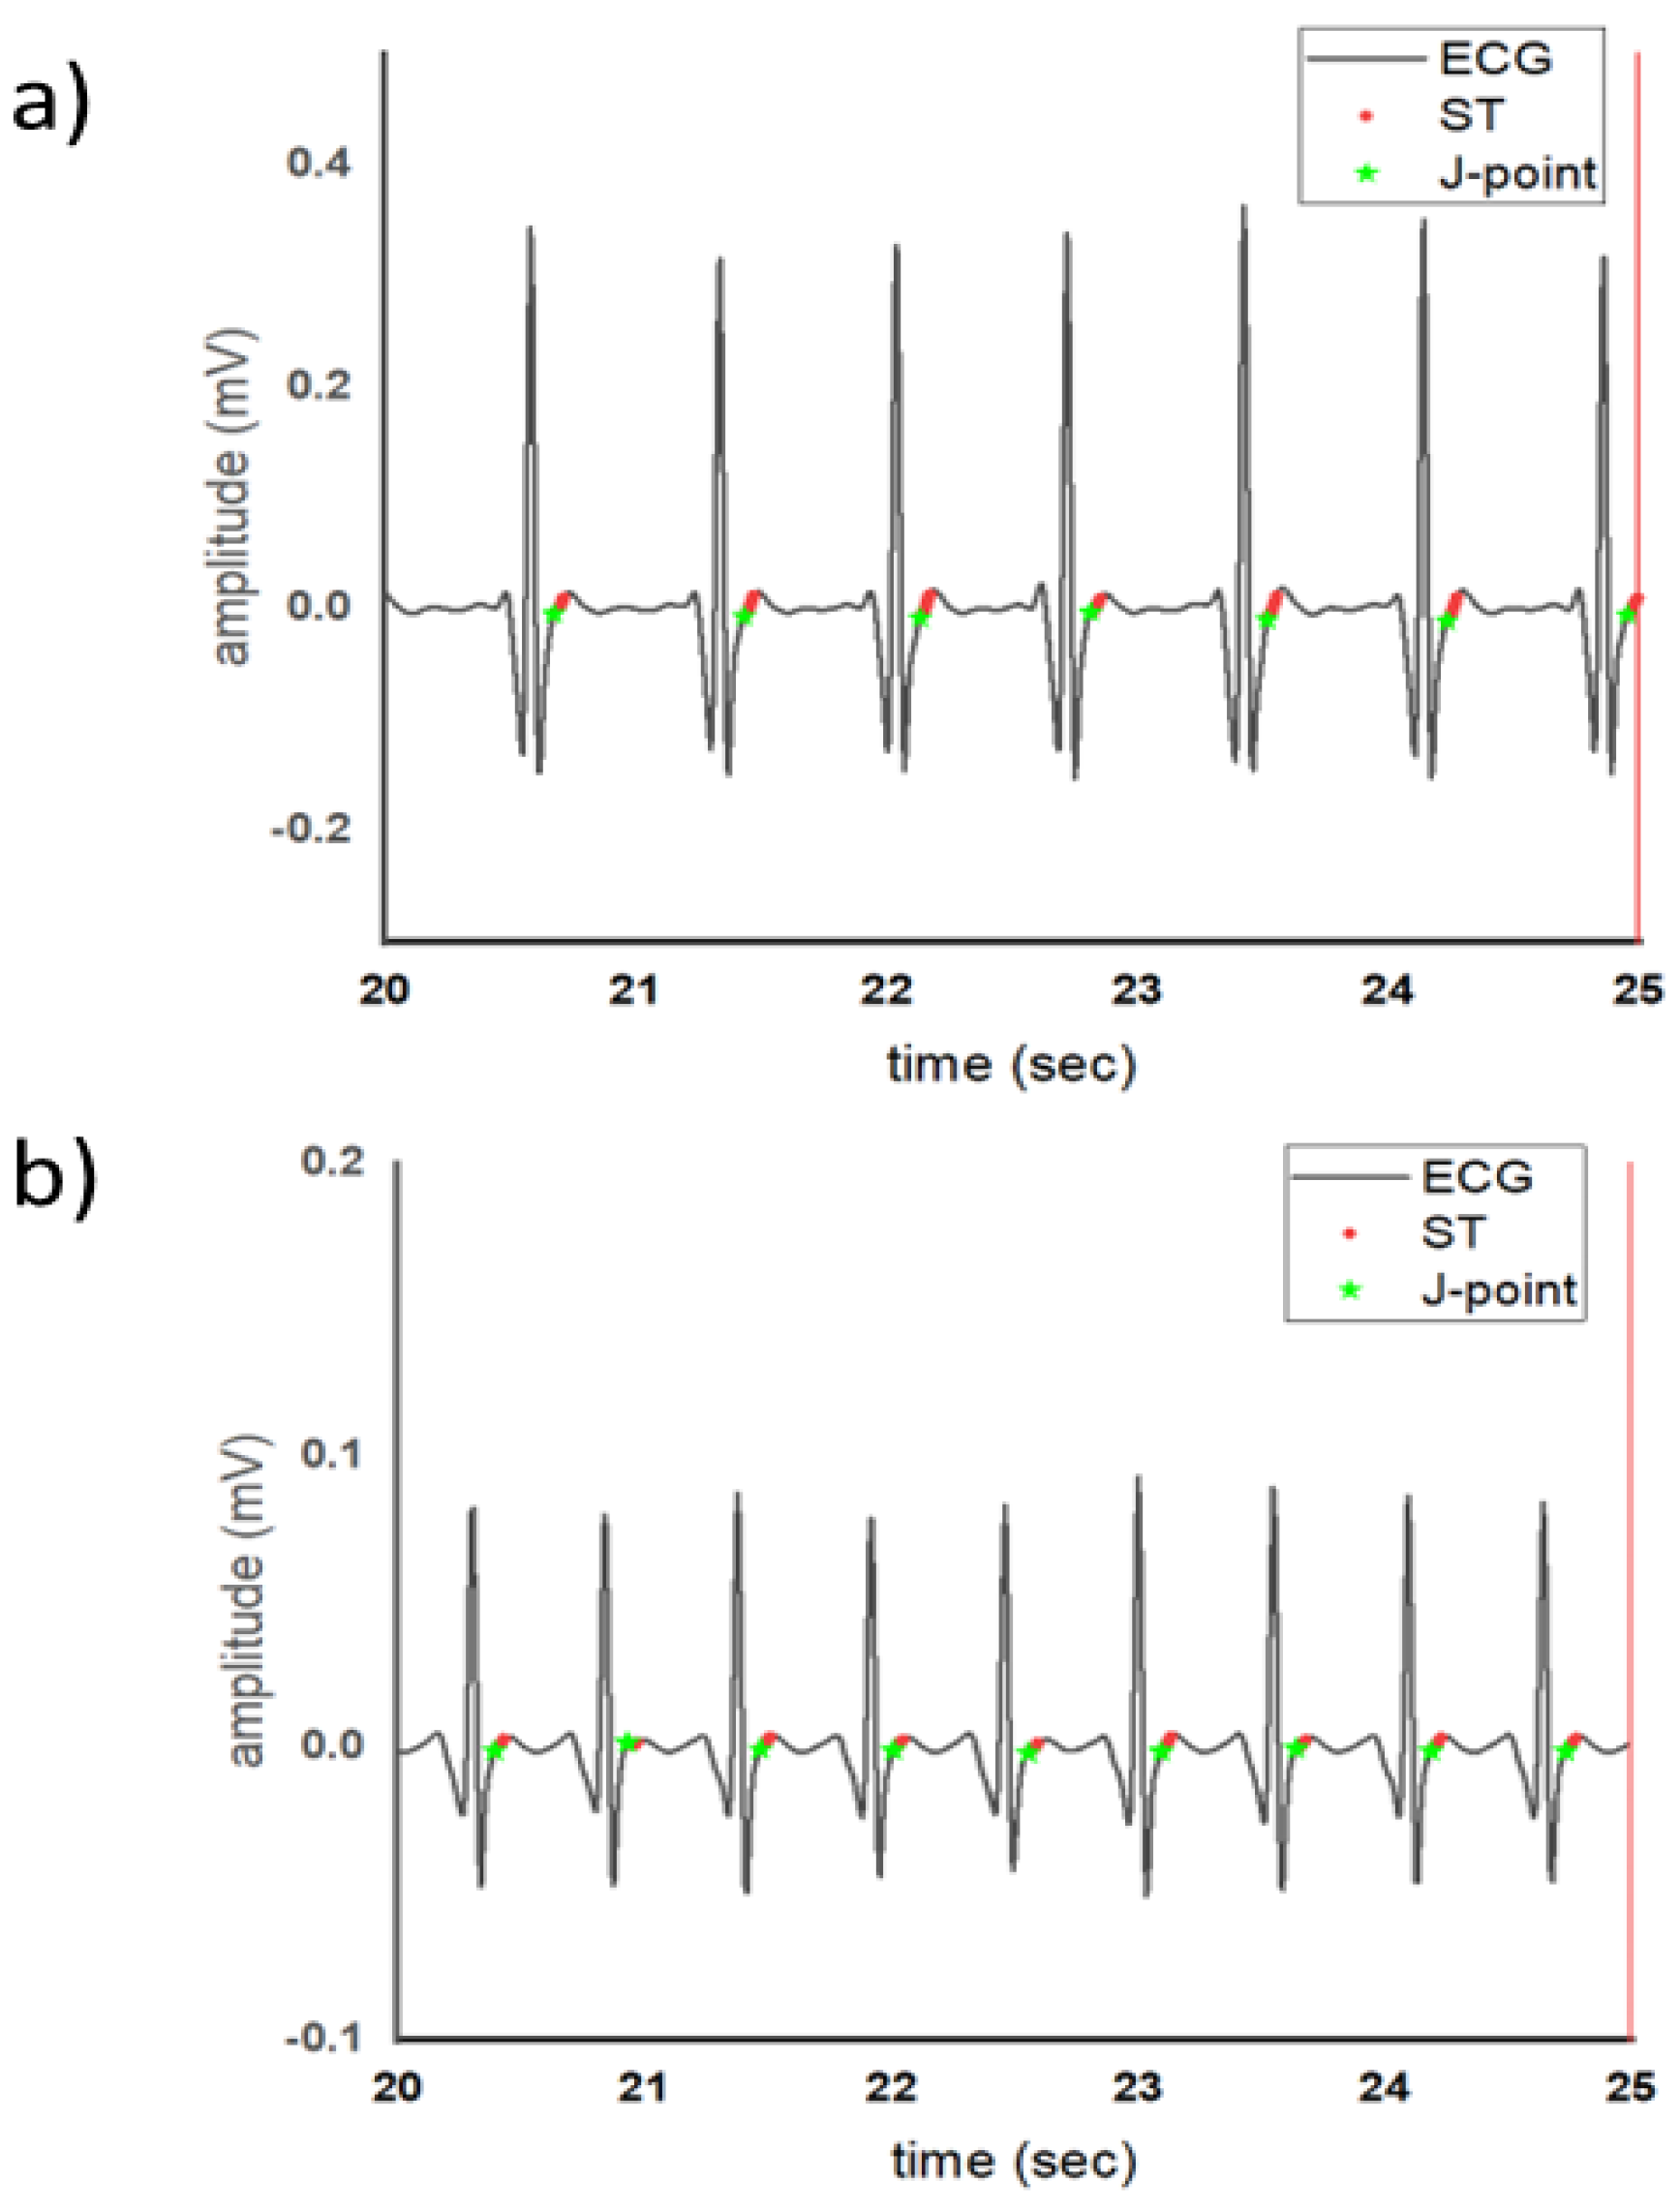
The J point represents the junction between the end of the QRS complex which is the depolarization of the ventricles and the start of the ST segment which is the beginning of ventricular repolarization. The j point holds importance in cardiac evaluation as it is the point in the heart electrical activity in which the hearts shifts from depolarization to repolarization. In a healthy heart this shift is well coordinated and stable which indicates that there is no issues affecting the hearts electrical activity as shown in
Figure 4a. In the ECG of patient with MI the j point has a alterations. It may be elevated or depressed. This depends on type and the extent of myocardial ischemia that which point of the heart is getting less blood supply and is being affected by it. When comparing the ECG the j point in the healthy ECG is at the base line however the one in MI patients ECG it is position above the baseline which means that it is elevated as shown in
Figure 4b. The ST segment represents the period between ventricular depolarization and repolarization. It is the moment the hearts ventricles are at a brief neutral state before they begin to repolarize. The deviation or elevation of this segment hold a greater importance in cardiac assessment. In the ECG of MI patients fig 4b, the ST segment displays slight depression. This depression indicates that the repolarization phase is affected due to the presence of ischemia. The second comparison between the healthy ECG ST segment and Mi patient ECG is that it has a short duration which can be caused by other ECG issues and depends on patients history but it also links towards MI.
V. Conclusion
This article addresses the issue of lack of awareness of cardiovascular diseases by implementing advanced techniques for preprocessing, feature extraction and segmentation of real-time ECG signals. It is observed that the amplitude of R-peaks for MI patients reduces significantly, the difference in R-peaks interval for MI patients is comparatively more than a healthy individual.
References
- V. Gupta, M. Mittal, and V. Mittal, “An Efficient Low Computational Cost Method of R-Peak Detection,” Wirel. Pers. Commun., vol. 118, no. 1, pp. 359–381, 2021. [CrossRef]
- G. A. Roth et al., “Global Burden of Cardiovascular Diseases and Risk Factors, 1990-2019: Update From the GBD 2019 Study,” J. Am. Coll. Cardiol., vol. 76, no. 25, pp. 2982–3021, 2020. [CrossRef]
- F. feng Li et al., “Pulse signal analysis of patients with coronary heart diseases using Hilbert-Huang transformation and time-domain method,” Chin. J. Integr. Med., vol. 21, no. 5, pp. 355–360, 2015. [CrossRef]
- B. Lenka, “Electrocardiogram Signals Using Hilbert- Huang Transform,” pp. 1156–1159, 2015.
- F. J. Neumann et al., “2019 ESC Guidelines for the diagnosis and management of chronic coronary syndromes,” Eur. Heart J., vol. 41, no. 3, pp. 407–477, 2020. [CrossRef]
- Karagiannis and P. Constantinou, “Noise-assisted data processing with empirical mode decomposition in biomedical signals,” IEEE Trans. Inf. Technol. Biomed., vol. 15, no. 1, pp. 11–18, 2011. [CrossRef]
- D. Sadhukhan, S. Pal, and M. Mitra, “Automated identification of myocardial infarction using harmonic phase distribution pattern of ECG Data,” IEEE Trans. Instrum. Meas., vol. 67, no. 10, pp. 2303–2313, 2018. [CrossRef]
- E. S. Jayachandran, P. Joseph K., and R. Acharya U., “Analysis of myocardial infarction using discrete wavelet transform,” J. Med. Syst., vol. 34, no. 6, pp. 985–992, 2010. [CrossRef]
- K. Dohare, V. Kumar, and R. Kumar, “Detection of myocardial infarction in 12 lead ECG using support vector machine,” Appl. Soft Comput. J., vol. 64, pp. 138–147, 2018. [CrossRef]
- M. Arif, I. A. Malagore, and F. A. Afsar, “Detection and localization of myocardial infarction using K-nearest neighbor classifier,” J. Med. Syst., vol. 36, no. 1, pp. 279–289, 2012. [CrossRef]
- L. Sun, Y. Lu, K. Yang, and S. Li, “ECG analysis using multiple instance learning for myocardial infarction detection,” IEEE Trans. Biomed. Eng., vol. 59, no. 12, pp. 3348–3356, 2012. [CrossRef]
- P. C. Chang, J. J. Lin, J. C. Hsieh, and J. Weng, “Myocardial infarction classification with multi-lead ECG using hidden Markov models and Gaussian mixture models,” Appl. Soft Comput. J., vol. 12, no. 10, pp. 3165–3175, 2012. [CrossRef]
- S. Critcher and T. J. Freeborn, “Multi-Site Impedance Measurement System based on MAX30001 Integrated-Circuit,” pp. 381–386, 2020.
- U. G. Gangkofner, P. S. Pradhan, and D. W. Holcomb, “Optimizing the High-Pass Filter Addition Technique for Image Fusion,” vol. 74, no. 9, pp. 1107–1118, 2008.
- J. Karki, “Active Low-Pass Filter Design,” no. February, pp. 1–23, 2023.
- https://www.mathworks.com/help/wavelet/ref/imodwt.html.
- https://www.mathworks.com/help/wavelet/ref/modwt.html.
|
Disclaimer/Publisher’s Note: The statements, opinions and data contained in all publications are solely those of the individual author(s) and contributor(s) and not of MDPI and/or the editor(s). MDPI and/or the editor(s) disclaim responsibility for any injury to people or property resulting from any ideas, methods, instructions or products referred to in the content. |
© 2025 by the authors. Licensee MDPI, Basel, Switzerland. This article is an open access article distributed under the terms and conditions of the Creative Commons Attribution (CC BY) license (http://creativecommons.org/licenses/by/4.0/).