1. Introduction
Pyrolysis is a major thermochemical conversion technology utilized in converting biomass to liquid and solid fuels as well as other valuable bioproducts. It involves the thermal decomposition of biomass in a non-oxidative condition at an elevated temperature of 400 – 600 ℃ to produce bio-oil, biochar, and non-condensable gases [
1]. Pyrolysis can be classified as fast, intermediate, or slow pyrolysis, based on the heating rate, residence time, and products yield. Fast pyrolysis is a high temperature process which involves rapid heating of biomass in the absence of oxygen within a short residence time, leading to high bio-oil yield. Meanwhile, slow pyrolysis occurs at a slow heating rate and longer residence time, with an intent to have high biochar yield [
1].
Lignocellulosic biomass is structurally composed of cellulose, hemicellulose, and lignin [
2]. Each component exhibits a unique thermal decomposition characteristic and produces various gaseous volatile compounds. For example, hemicellulose decomposes at a temperature of 250 – 350 ºC to produce biochar, CO, CO2, H2O, and volatile anhydrosugars. The thermal decomposition of cellulose occurs at a temperature of 350 – 500 ºC and its decomposition products are levoglucosan and anhydrocellulose while lignin decomposes at 280 – 550 ºC to produce phenol, biochar, and tar [
3,
4]. Therefore, the variation in the structural chemical compositions of lignocellulosic biomass can significantly influence its pyrolysis products yield and qualities, which has necessitated several investigations attempting to elucidate the thermal decomposition behaviors of these structural chemical components [
5,
6,
7,
8].
Given that pyrolysis is a heterogenous reaction, thermal decomposition kinetics
provide useful insights into the complete reaction mechanisms taking place during this process, accounting for the change occurring in the structural chemical compositions of the biomass at certain temperature and heating rate [
9,
10]. It also provides intrinsic information needed for the design, retrofitting, operation, and process parameter optimization of thermochemical conversion equipment [
11,
12]. Furthermore, thermal decomposition kinetics provides information about the thermal behaviors of biomass, which can serve to enhance research on forest fires and fuel hazard, where knowledge of fuel ignition and release of volatile content are fundamental to the combustion of biomass [
13].
An important parameter that is estimated from thermal decomposition kinetics of biomass is the activation energy. Activation energy defines the minimum amount of energy required to initiate a chemical reaction. Rego et al. [
14] investigated the pyrolysis kinetics of short rotation coppice poplar at pyrolysis temperature of 500 ℃ and heating rates of 10-50 K/min using isoconversional approaches of Flynn-Wall-Ozawa (FWO) and Kissinger-Akahira-Sunose (KAS). The authors reported similar activation energies of 81 – 301 kJ/mol and 90 – 306 kJ/mol for the FWO and KAS models, respectively. The values of activation energy peaked at a conversion range of 40 – 60%, which was related to the full conversion of cellulose concomitantly with lignin decomposition. Dong and Cai [
15] employed the Friedman isoconversional approach to investigate the pyrolysis kinetics of sweet sorghum bagasse at pyrolysis temperature of 927 ℃ and heating rates of 15, 25, and 35 K min-1. The authors reported activation energies of 150 – 320 kJ/mol at a conversion range of 5 – 85%. The variation of the activation energies with the conversion range was attributed to the combination effect of thermal decomposition of biopolymer components (cellulose, hemicellulose, and lignin) of the sweet sorghum bagasse.
In this study, the thermal decomposition behaviors of Kanlow Switchgrass and Public Miscanthus harvested from reclaimed mine land using isoconversional methods were investigated and the results are aimed at elucidating the reaction mechanisms taking place during the pyrolysis of these biomass feedstocks with respect to their structural chemical compositions and how these factors influenced their pyrolysis products distribution and properties, which were reported in the previous work of the authors [
1]. The choice of these biomass feedstocks is due to the fact that they are C4 perennial lignocellulosic biomasses, produced with the sole intent of thermochemically or biochemically converting them into biofuel and bioproducts. These plants are specifically selected for bioenergy purposes because of their high biomass yield potentials, high water and nutrient use efficiency (due to their C4 photosynthetic pathway), resistance to biotic and abiotic stresses, high lignin and cellulose contents, and their good combustion qualities [
16,
17]. The innate abilities of these biomasses to thrive on poor quality soils and still have high biomass yield,
have led to their production on marginal lands to prevent competition for cultivable lands between energy and food production [
1].
2. Materials and Methods
2.1. Materials
Public Miscanthus and Kanlow Switchgrass were obtained from the Alton site, a reclaimed mine land in Upshur County, West Virginia. The biomass samples were air-dried for 3 days and thereafter oven-dried at a temperature of 103 ℃ for 24 h. The oven-dried samples were subsequently ground to a particle size < 1 mm using Retsch Grindomix (Model: GM 200). A comparison of the physicochemical characteristics of the biomass samples in this study and other found in literature are presented in
Table 1.
2.2. Thermogravimetric Analysis
Thermogravimetric analysis was carried out using a thermogravimetric analyzer (TGA) (Model: Q50, TA Instruments, Schaumburg, IL, USA). About 8 – 12 mg of the samples were loaded into a platinum sample holder and heated from 30 ℃ to 700 ℃ in the combustion chamber at three heating rates of 5, 15, and 25 ℃/min under nitrogen flow of 30 cm3/min. The temperature-weight loss data for each experiment was automatically recorded by the software provided by the equipment manufacturer and later downloaded as a Microsoft Excel file for subsequent analysis.
2.3. Thermal Decomposition Kinetics
Lignocellulosic biomass is majorly made up of cellulose, hemicellulose, and lignin. Therefore, the thermal decomposition kinetics of lignocellulosic biomass assumes three independent decomposition reactions involving each of the biopolymer constituents of the biomass [
10]. Therefore, the rate of conversion, dX/dt, in thermal decomposition is generally expressed with this equation [
10]:
Where X is the fractional conversion at time t; mo, m, and mf are the initial sample mass, current sample mass and final sample mass, respectively.
The reaction rate constant k is also generally described by the Arrhenius equation as:
f(X) is a reaction model that can take various mathematical forms depending on the physical mechanism. When the samples are subjected to constant heating rate of α, then
Eq. (1) can be rewritten as
Where A is pre-exponential factor; E is activation energy; R is universal gas constant and T is absolute temperature in K.
2.4. Kinetic Analysis
Three isoconversional kinetic methods were used in this study and this includes Friedman, Ozawa-Flynn-Wall, and Kissinger-Akhira-Sunrose methods. The isoconversional methods can be differential or integral in approach. Friedman method is a differential isoconversional method. According to isoconversion principle, the degree of conversion for a reaction is assumed to be constant. Therefore, the rate of reaction depends exclusively on the reaction temperature [
9].
2.4.1. Friedman Method
The differential isoconversional method of Friedman [
23] is obtained by taking the natural logarithm of Eq. (5) resulting in Eq. (6);
The activation energy E, was determined by the linear relationship between ln[α(dX/dt)] and 1/T. The slope of this relationship yields –E/R, from which the activation energy corresponding to each conversion was estimated.
2.4.2. Ozawa-Flynn-Wall (OFW) Method
The Ozawa-Flynn-Wall method is an integral isoconversional technique that assumes that the activation energy remains constant throughout the duration of the reaction [
9]. This method estimates the activation energy based on Doyle’s approximation and it is shown in Eq. 7.
Plots of log (α) against 1/T for the different heating rate give a parallel line for each conversion and the activation energy is obtained from slope .
2.4.3. Kissinger-Akahira-Sunrose (KAS) Method
The Arrhenius equation for KAS is given in equation 8 [
24];
The plot of versus 1/T will result in slope and intercept used in calculating the activation energy and pre-exponential factor.
3. Results and Discussion
3.1. Thermogravimetric Analysis
Figure 1 shows the thermogravimetric (TG) and differential thermogravimetric (DTG) curves of Kanlow Switchgrass and Public Miscanthus at heating rates of 5, 15, and 25 °C/min. The TG curves showed that the thermal decomposition process for both biomasses can be divided into three broad stages based on the temperature range, namely moisture & light volatile release (< 200 ℃), devolatilization & biochar formation (200 – 400 ℃), and poly-condensation & biochar aromatization (> 400 ℃) [
9,
17]. A percent weight loss of <10% can be observed for both biomasses in the moisture and light volatile release stage. This low weight loss is due to the significant elimination of the biomasses’ moisture contents during the oven-drying process, which was conducted prior to the thermal decomposition process.
A significant weight loss (~75%) can be observed in the devolatilization and biochar formation stage of the thermal decomposition process. This is the stage where the cellulose and hemicellulose contents of the biomasses were thermally decomposed, to produce both condensable vapors and non-condensable gases like CO2, CO, and H2O [
17]. Also, in this stage, there was a slight increase in the weight loss rate as the heating rate increased. This effect is attributable to increased thermal lag at higher heating rate [
10].
The residual weight obtained after the completion of the thermal decomposition process was estimated from the TG curves to be 18 – 19% and 20 – 21% for Kanlow Switchgrass and Public Miscanthus, respectively. This residual weight represents the biochar yield obtained during pyrolysis and it is greatly influenced by the lignin content of the biomass. Lignin decomposes at temperature between 280 – 550 ℃ and therefore the uncarbonized lignin remaining after thermal decomposition contributes to the biochar yield. In this present study, the lignin content of Public Miscanthus was ~1% higher than that of Kanlow Switchgrass. This difference may have contributed to the higher residual weight of Public Miscanthus.
The residual weight representing biochar yield is considered to generally match the sum of biomass’ fixed carbon and ash contents [
25]. The sum of the fixed carbon and ash contents of Kanlow Switchgrass and Public Miscanthus (
Table 1) were 18.24% and 19.43%, respectively. These values are within the range of the values obtained for the residual weights of both biomass samples after the thermal decomposition process. However, a higher biochar yield of ~30% was reported in a previous work by the authors [
1] for the pyrolysis of these two biomass samples at a temperature of 500 ℃. The disparity in the biochar yields is due to the difference in the temperatures for both pyrolysis processes. As the pyrolysis temperature increase, more lignin is decomposed, thereby resulting in lower biochar yield.
The differential thermogravimetric (DTG) curves provide a visual depiction of the stages of pyrolysis reactions and the fractional conversion rates. It shows the thermal events detailing the decomposition of the biomass constituents (cellulose, hemicellulose, and lignin). There was a shift in the peaks of the DTG curves for both biomasses to the right (higher temperature) as the heating rate increased. Heating rate has been identified as one of the critical parameters that plays a significant role in the composition and distribution of pyrolysis products. This is because heating rate can influence both the primary and secondary reactions taking place during pyrolysis by changing the heat and mass transfer [
26]. A low heating-rate pyrolysis will lead to a longer residence time and minimal secondary reaction, thereby leading to higher biochar yield while a fast-heating rate pyrolysis will lead to primary volatiles undergoing secondary reactions via polymerization to form biochar or cracking to form lighter volatiles [
17,
26].
The DTG curve peaks correspond to the peak temperatures at which the cellulose decomposition took place [
11]. For Kanlow Switchgrass, the peak temperature increased from 338 °C to 361 °C as the heating rate increased from 5 °C/min to 25 °C/min. Similarly, the peak temperature for Public Miscanthus increased from 332 °C to 358 °C as the heating rate increased from 5 °C/min to 25 °C/min. Oginni et al. [
27] reported a similar trend for the thermal decomposition of White Pine and Norway Spruce needles such that an increase in heating rate from 5 to 25 °C/min led to an increase in peak temperatures of White Pine (333 – 358 °C) and Norway Spruce (321 – 343 °C). It is worth noting that these peak temperatures are within the temperature range (240 – 350 °C) for the thermal decomposition of cellulose. The decomposition of cellulose is marked with the production of levoglucosan, anhydrocellulose, and condensable volatiles along with permanent gases like CO2, CO, and H2O [
2,
4].
The hemicellulose decomposition is generally represented by the shoulder peak to the left of the DTG curve. This is visible in the DTG curve for Kanlow Switchgrass but not distinctive in the DTG curve for Public Miscanthus, which may be attributed to its lower hemicellulose content. The hemicellulose decomposition is similar to that of cellulose, producing a variety of anhydrosugars, light volatile organic compounds, char, and permanent gases like H2O, CO2, and CO [
4]. The non-distinctive shoulder peak was also observed by Cortes and Bridgwater [
18] for the pyrolysis of miscanthus and its acid hydrolysis residue at a pyrolysis temperature of 900 ℃ and heating rates of 2.5 – 25 ℃/min.
It is noteworthy that in a demineralized sample (ash free), the anhydrosugars produced during hemicellulose decomposition, transform into vapor phase with little or no biochar formation due to the non-catalytic effect of mineral matter. However, in the presence of ash, these anhydrosugars rapidly decompose to form a substantial part of the biochar [
4]. The chemical composition of the biomass samples in this study showed that both biomasses have ash content of about 3 – 4% [
2]. This implies that the catalytic effect of the ash content would result in hemicellulose decomposition contributing to the biochar formation.
The flat right tails of the DTG curves represent the decomposition of the lignin content, which is known to occur over a wide range of temperatures. The thermal decomposition of lignin leads to significant biochar formation and liberation of large fractions of volatiles, which constitute tar [
4]. According to Mohan [
2], lignin pyrolysis produces more biochar than cellulose or hemicellulose.
3.2. Kinetic Analysis
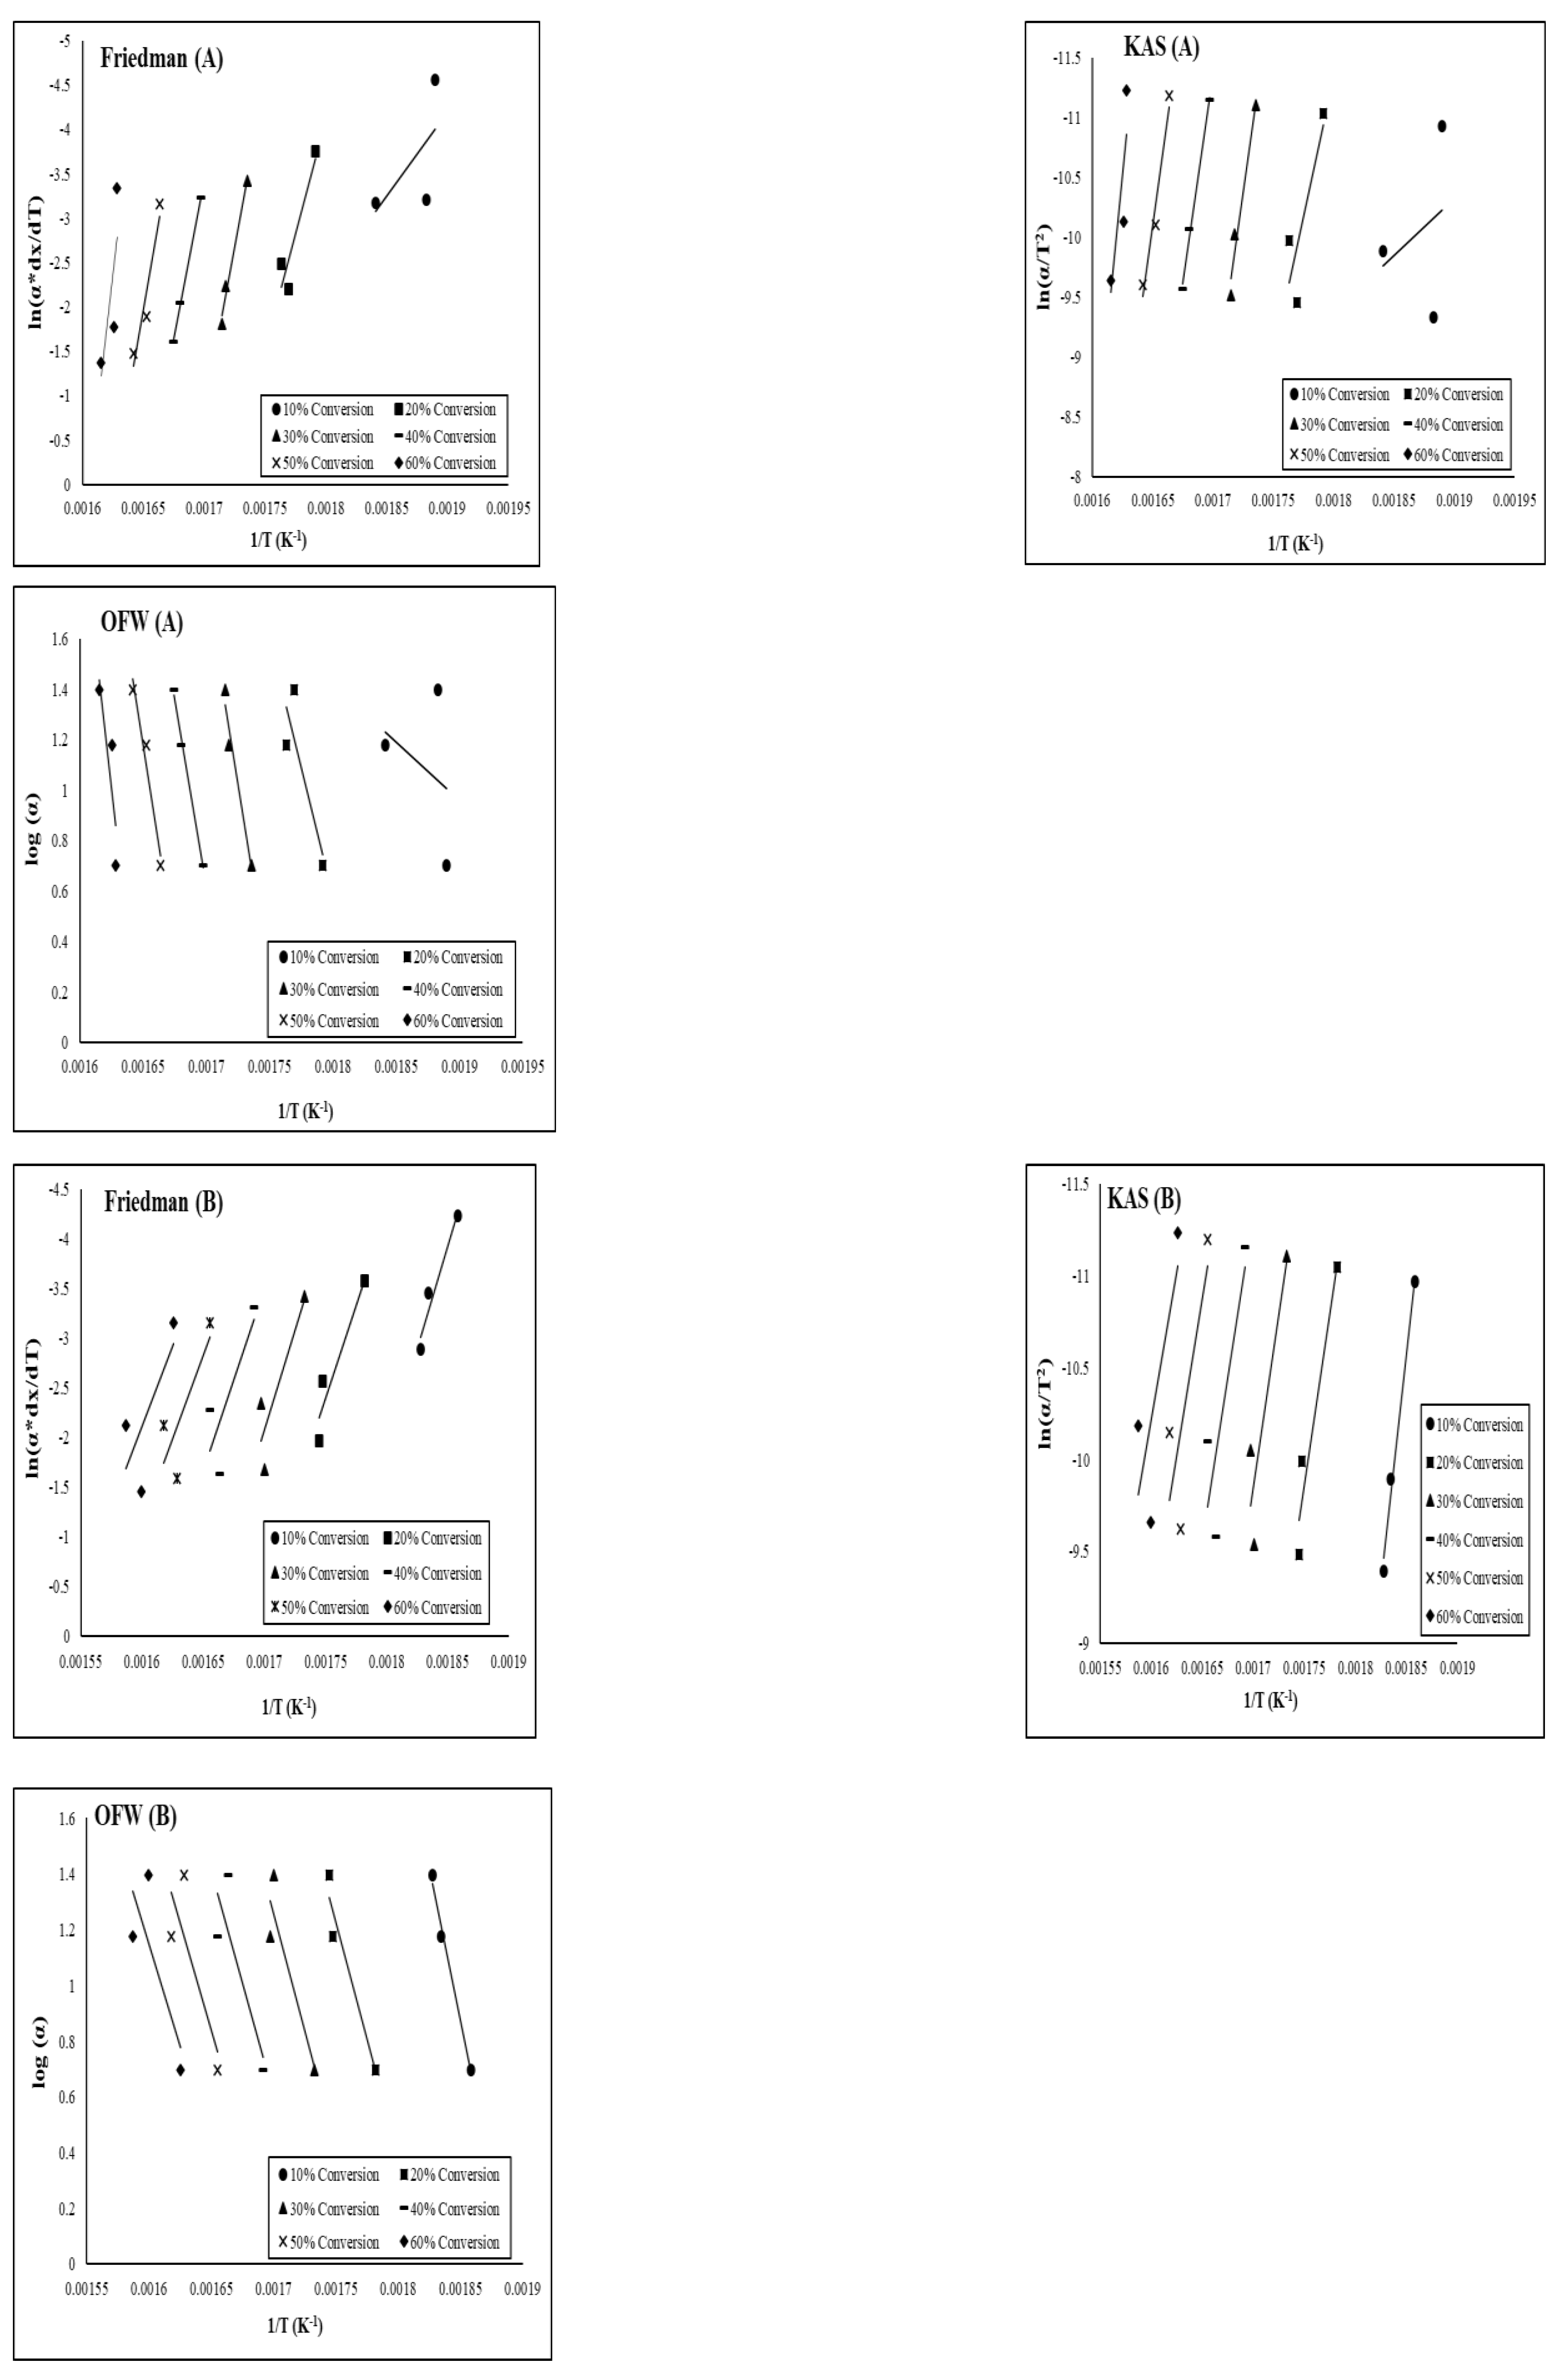
Figure 2 show the Arrhenius plots which were used in estimating the activation energies for both biomass samples between the fractional conversion range of 0.1 and 0.6 using the three isoconversional methods. The activation energies obtained from the three isoconversional methods are shown in
Table 2. For Public Miscanthus, the average activation energies were 568.63 kJ/mol, 508.87 kJ/mol, and 493.11 kJ/mol for Friedman, KAS, and OFW methods respectively while for Kanlow Switchgrass, the activation energies were 306.28 kJ/mol, 314.53 kJ/mol, and 308.21 kJ/mol for Friedman, KAS and OFW methods, respectively. The average activation energies for Public Miscanthus from the three methods were higher than the ones for Kanlow Switchgrass.
The activation energy represents the amount of energy that the biomass molecules have to acquire in order to undergo chemical reaction occurring during the pyrolysis process [
4] and a high activation energy is an indication that the reaction requires high temperature or longer reaction time [
12]. This implies that the thermal decomposition of Public Miscanthus was slower due to the increase in its activation energies whereas the thermal decomposition of Kanlow Switchgrass increased as its activation energies decreased. Also, the higher activation energies recorded for Public Miscanthus can be attributed to its higher extractive and lignin contents in comparison to the Kanlow Switchgrass. Jin et al. [
25] reported a similar observation where the activation energy of yellow poplar bark was higher than the activation energies of the yellow poplar heartwood and sapwood. The authors attributed the higher activation energy of the bark sample to its higher content of extractives and lignin in comparison to that of sapwood and heartwood.
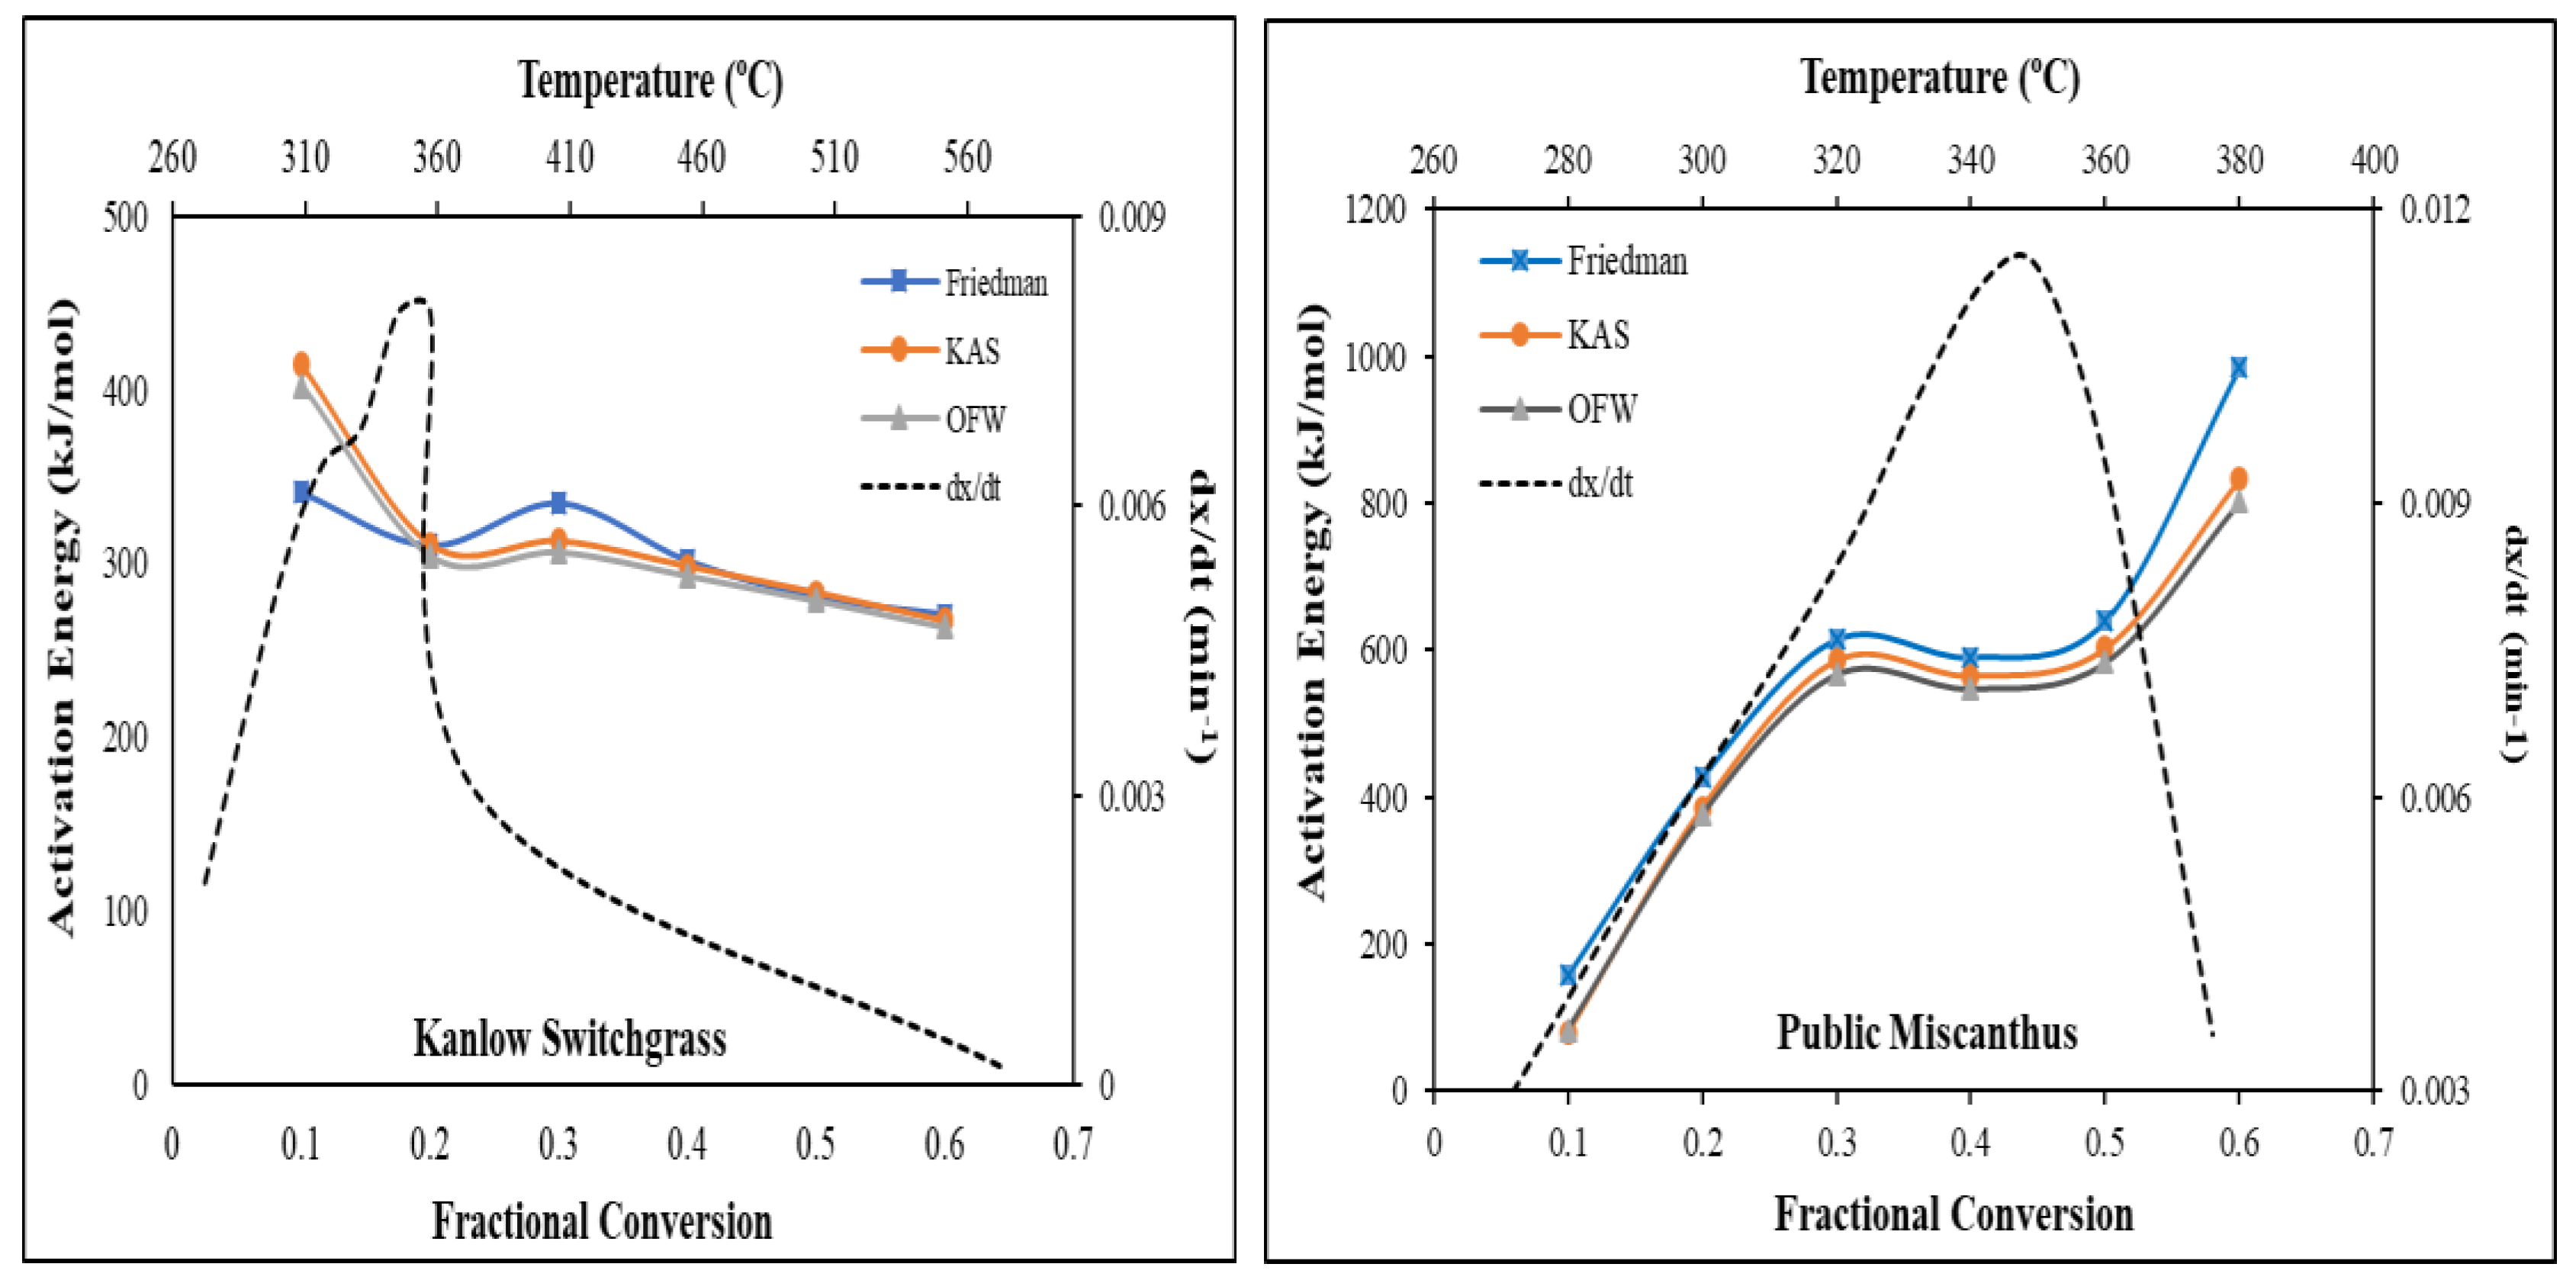
Figure 3 shows the activation energy as a function of the fractional conversion from 0.1 to 0.6 for Kanlow Switchgrass and Public Miscanthus. The activation energies from the three isoconversional methods for Public Miscanthus can be seen to increase with the fractional conversion. The activation energies obtained from the Friedman method were the highest while the Ozawa-Flynn-Wall method had the lowest activation energies. However, for the Kanlow Switchgrass, the activation energies decreased with the fractional conversion. The difference in the activation energy values obtained from isoconversional methods can be attributed to the estimation approach of each method. Friedman method is a differential isoconversional approach, which assumes that the thermal decomposition of biomass is independent of temperature and depends only on the rate of weight loss. Whereas Ozawa-Flynn-Wall method is an integral isoconversional approach with an assumption that the activation energy remains constant throughout the duration of the reaction [
9].
It is also worth noting that the activation energy plots for both biomass samples can be separated into different fractional conversion zones. For Public Miscanthus, three fractional conversion zones can be identified; <0.3 fractional conversion, 0.3 – 0.5 fractional conversion and >0.5 fractional conversion while two fractional conversion zones were identified for Kanlow Switchgrass; <0.2 fractional conversion and > 0.2 fractional conversion. These fractional conversion zones can be explained in the light of their zone temperatures and the chemical composition of the biomass.
For Public Miscanthus, the activation energy below 0.3 fractional conversion zone ranged between 78.59 – 614.48 kJ/mol for all the three isoconversional methods and the fractional zone temperature reached 320 ºC, which is the temperature range for moisture evolution, extractive decomposition, and light volatile matter release [
25]. Within this same temperature range, the thermal decomposition of the hemicellulose and cellulose occurs. The activation energy for the second fractional conversion zone (0.3 – 0.5) ranged between 566.87 and 639.80 kJ/mol and the zone temperature was between 320 and 360 ℃. In this zone, the predominant event was the thermal decomposition of the cellulose and hemicellulose. According to Gaur and Reed [
4], the thermal degradation of hemicellulose starts at temperature below 200 ⁰C and by 350 ℃, most of the hemicellulose undergoes the devolatilization process. Meanwhile for cellulose, its decomposition can be divided into three stages. The first takes place below 250 ℃, where the devolatilization of the cellulose polymer is slow and is affected markedly by the structure of the cellulose fiber. At temperature above 250 ⁰C, the cellulose polymer begins to decompose rapidly, forming condensable volatiles with non-condensable gases like CO, CO2, and H2O. In the third fractional conversion zone, the thermal decomposition of the cellulose continues, (which defines its third decomposition stage) where the release of most of the volatile products from cellulose occurs and continues till about 500 ℃. Above 500 ℃, the volatile products undergo gas-phase pyrolysis, producing a variety of non-condensable gases [
4]. The activation energy for this fractional zone was calculated to be 801.93 – 984.09 kJ/mol for all the three isoconversional methods. However, the thermal decomposition of lignin occurred across all the fractional conversion zones. The lignin component decomposes between temperature of 280 and 550 ⁰C. The aliphatic side chains start splitting off from the aromatic rings in the lignin at a temperature of about 300 ⁰C and the carbon – carbon linkage between the lignin structural units is cleaved from 370 to 400 ⁰C [
28].
For Kanlow Switchgrass, in the first fractional conversion zone (<0.2), the activation energy was between 304.49 – 414.23 kJ/mol for all the three isoconversional methods and the zone temperature was up to 360 ºC. As explained earlier, at this temperature, the predominant events would be moisture evolution, extractive, hemicellulose and cellulose decomposition. In the second fractional conversion zone, the activation energy can be seen to decrease to the range of 263.73 and 270.40 kJ/mol for all the three isoconversional methods. In this fractional zone, the predominant event taking place would be cellulose and lignin decomposition. The reduction in the activation energy within this fractional conversion range can be attributed to the fact that peak thermal decomposition temperature was attained at the fractional conversion range < 0.2 and resulting in ~75% weight loss. Thereafter, the pyrolysis process proceeded at a slower rate, hence the reduction in the activation energy. The reduction in activation energy with increased fraction conversion was observed by Rego et al. [
14] in the pyrolysis kinetics of short rotation coppice poplar biomass. Similarly, Jin et al. [
25] investigated the pyrolysis kinetics of physical components of wood and wood polymers using isoconversional method and reported a similar pattern of thermal events occurring at the various fractional conversion zones. The authors reported a three degradation zones for the three wood components, namely sapwood, heartwood, and bark.
4. Conclusions
The study investigated the thermal decomposition behaviors of Public Miscanthus and Kanlow Switchgrass using isoconversional methods. Three broad stages based on the temperature range were identified in the TG curves, namely moisture & light volatile release, devolatilization & biochar formation, and poly-condensation & biochar aromatization. Significant weight loss (~75%) took place in the devolatilization and biochar formation stage. The DTG curves showed that an increase in the heating rate resulted in a shift in the peak temperatures. These curves also showed the stages of thermal decomposition of the chemical components of the biomass. Activation energies for the two biomass feedstocks changed with the fractional conversion. With the high activation energies reported for the two biomasses, their thermal decomposition would require a longer residence time or higher temperature.
Author Contributions
For research articles with several authors, a short paragraph specifying their individual contributions must be provided. The following statements should be used Conceptualization, O.O. and K.T.; methodology, O.O.; validation, O.O., K.T.; formal analysis, O.O.; investigation, O.O.; resources, K.T.; data curation, O.O.; writing—original draft preparation, O.O.; writing—review and editing, O.O. and K.T.; visualization, O.O.; supervision, K.T.; project administration, K.T.; funding acquisition, K.T. All authors have read and agreed to the published version of the manuscript.
Funding
This research was funded by USDA National Institute of Food and Agriculture, McIntire Stennis Project, grant number WVA00118, 1007044.
Conflicts of Interest
The authors declare no conflicts of interest. The funders had no role in the design of the study; in the collection, analyses, or interpretation of data; in the writing of the manuscript; or in the decision to publish the results.
References
- Oginni, O.; Singh, K.; Zondlo, J.W. Pyrolysis of dedicated bioenergy crops grown on reclaimed mine land in West Virginia. Journal of Analytical and Applied Pyrolysis 2017, 123, 319–329. [Google Scholar]
- Mohan, D.; Pittman, C.U.; Steele, P.H. ; Pyrolysis of wood/biomass for bio-oil: A critical review. Energy & Fuels 2006, 20, 848–889. [Google Scholar]
- Raveendran, K.; Ganesh, A.; Khilar, K.C. Pyrolysis characteristics of biomass and biomass components. Fuel 1996, 75, 987–998. [Google Scholar]
- Gaur, S.; Reed, T.B. Thermal data for natural and synthetic fuels; Marcel Decker, Inc.: New York, NY, 1998. [Google Scholar]
- Li, C.; Zhang, J.; Gu, J.; Yuan, H.; Chen, Y. Insight into the role of varied acid-base sites on fast pyrolysis kinetics and mechanism of cellulose. Waste Management 2021, 135, 140–149. [Google Scholar]
- Lin, Y.-Y.; Chen, W.-H.; Colin, B.; Lin, B.-J.; Leconte, F.; Petrissans, A.; Petrissans, M. Pyrolysis kinetics of potassium-impregnated rubberwood analyzed by evolutionary computation. Bioresource Technology 2021, 319, 124145. [Google Scholar]
- Collard, F.X.; Blin, J. A review on pyrolysis of biomass constituents: Mechanisms and composition of the products obtained from the conversion of cellulose, hemicelluloses and lignin. Renewable and Sustainable Energy Reviews 2014, 38, 594–608. [Google Scholar]
- Amini, E.; Safdari, M.-S.; Johnson, N.; Weise, D.R.; Fletcher, T.H. Pyrolysis kinetics of wildland vegetation using model-fitting methods. Journal of Analytical and Applied Pyrolysis 2021, 157, 105167. [Google Scholar]
- White, J.E.; Catallo, W.J.; Legendre, B.L. Biomass pyrolysis kinetics: A comparative critical review with relevant agricultural residue case studies. Journal of Analytical and Applied Pyrolysis 2011, 91, 1–33. [Google Scholar]
- Lee, S.B.; Fasina, O. TG-FTIR analysis of switchgrass pyrolysis. Journal of Analytical and Applied Pyrolysis 2009, 86, 39–43. [Google Scholar] [CrossRef]
- Fasina, O.; Littlefield, B. TG-FTIR analysis of pecan shells thermal decomposition. Fuel Processing Technology 2012, 102, 61–66. [Google Scholar]
- Mishra, R.K.; Mohanty, K. Pyrolysis kinetics and thermal behavior of waste sawdust biomass using thermogravimetric analysis. Bioresource Technology 2018, 251, 63–74. [Google Scholar] [CrossRef] [PubMed]
- Niu, H.; Liu, N. Thermal decomposition of pine branch: Unified kinetic model on pyrolytic reactions in pyrolysis and combustion. Fuel 2015, 160, 339–345. [Google Scholar] [CrossRef]
- Rego, F.; Dias, A.P.S.; Casquilho, M.; Rosa, F.C.; Rodrigues, A. Pyrolysis kinetics of short rotation coppice poplar biomass. Energy 2020, 207, 118191. [Google Scholar] [CrossRef]
- Dong, Z.; Cai, J. Isoconversional kinetic analysis of sweet sorghum bagasse pyrolysis by modified logistic mixture model. Journal of the Energy Institute 2018, 91, 513–518. [Google Scholar] [CrossRef]
- Lewandowski, I.; Scurlock, J.M.O.; Lindvall, E.; Christou, M. The development and current status of perennial rhizomatous grasses as energy crops in the US and Europe. Biomass and Bioenergy 2003, 25, 335–361. [Google Scholar] [CrossRef]
- Oginni, O.; Singh, K. Pyrolysis characteristics of Arundo donax harvested from a reclaimed mine land. Industrial Crops and Products 2019, 133, 44–53. [Google Scholar] [CrossRef]
- Cortes, A.M.; Bridgwater, A.V. Kinetic study of the pyrolysis of miscanthus and its acid hydrolysis residue by thermogravimetric analysis. Fuel Processing Technology 2015, 138, 184–193. [Google Scholar] [CrossRef]
- Sadaka, S.; Liechty, H.; Pelkki, M.; Blazier, M. Pyrolysis and combustion kinetics of raw and carbonized cottonwood and switchgrass agroforests. Bioresources 2015, 10, 4498–4518. [Google Scholar] [CrossRef]
- Sadaka, S.; Sharara, M.A.; Ashworth, A.; Keyser, P.; Allen, F.; Wright, A. Characterization of biochar from switchgrass carbonization. 2014; 7, 548–567. [Google Scholar]
- Mohamed, B.; Bi, X.; Li, L.Y.; Leng, L.; Salama, E.-S.; Zhou, H. Bauxite residue as a catalyst for microwave-assisted pyrolysis of switchgrass to high quality bio-oil and biochar. Chemical Engineering Journal 2021, 426, 131294. [Google Scholar] [CrossRef]
- Chaganti, V.N.; Ganjegunte, G.; Meki, M.N.; Kiniry, J.R.; Niu, G. Switchgrass biomass yield and composition and soil quality as affected by treated wastewater irrigation in an arid environment. Biomass and Bioenergy 2021, 151, 106160. [Google Scholar] [CrossRef]
- Friedman, H.L. Kinetics of thermal degradation of char-forming plastics from thermogravimetry. Application to a phenolic plastic. Journal of Polymer Science Part C: Polymer Symposia 1964, 6, 183–195. [Google Scholar] [CrossRef]
- Soria-Verdugo, A.; Goos, E.; García-Hernando, N.; Riedel, U. Analyzing the pyrolysis kinetics of several microalgae species by various differential and integral isoconversional kinetic methods and the Distributed Activation Energy Model. Algal Research 2018, 32, 11–29. [Google Scholar] [CrossRef]
- Jin, W.; Singh, K.; Zondlo, J. Pyrolysis kinetics of physical components of wood and wood-polymers using isoconversion method. Agriculture 2013, 3, 12–32. [Google Scholar] [CrossRef]
- Xiong, Z.; Wang, Y.; Syed-Hassan, S.S.A.; Hu, X.; Han, H.; Su, S.; Xu, K.; Jiang, L.; Guo, J.; Berthold, E.E.S.; Hu, S.; Xiang, J. Effects of heating rate on the evolution of bio-oil during its pyrolysis. Energy Conversion and Management 2018, 163, 420–427. [Google Scholar] [CrossRef]
- Oginni, O.; Singh, K. Effect of carbonization temperature on fuel and caffeine adsorption characteristics of white pine and Norway spruce needle derived biochars. Industrial Crops and Products 2021, 162, 113261. [Google Scholar] [CrossRef]
- Dietenberger, M.A.; Hasburgh, L.E. Wood products: Thermal degradation and fire, in: Reference Module in Materials Science and Materials Engineering, Elsevier, 2016.
|
Disclaimer/Publisher’s Note: The statements, opinions and data contained in all publications are solely those of the individual author(s) and contributor(s) and not of MDPI and/or the editor(s). MDPI and/or the editor(s) disclaim responsibility for any injury to people or property resulting from any ideas, methods, instructions or products referred to in the content. |
© 2025 by the authors. Licensee MDPI, Basel, Switzerland. This article is an open access article distributed under the terms and conditions of the Creative Commons Attribution (CC BY) license (http://creativecommons.org/licenses/by/4.0/).