Preprint
Communication

This version is not peer-reviewed.

Including Small Fires in Global Historical Burned Area Products: We Should Dig More into the Landsat Archive

A peer-reviewed article of this preprint also exists.

Submitted:

06 February 2025

Posted:

06 February 2025

Read the latest preprint version here

Abstract

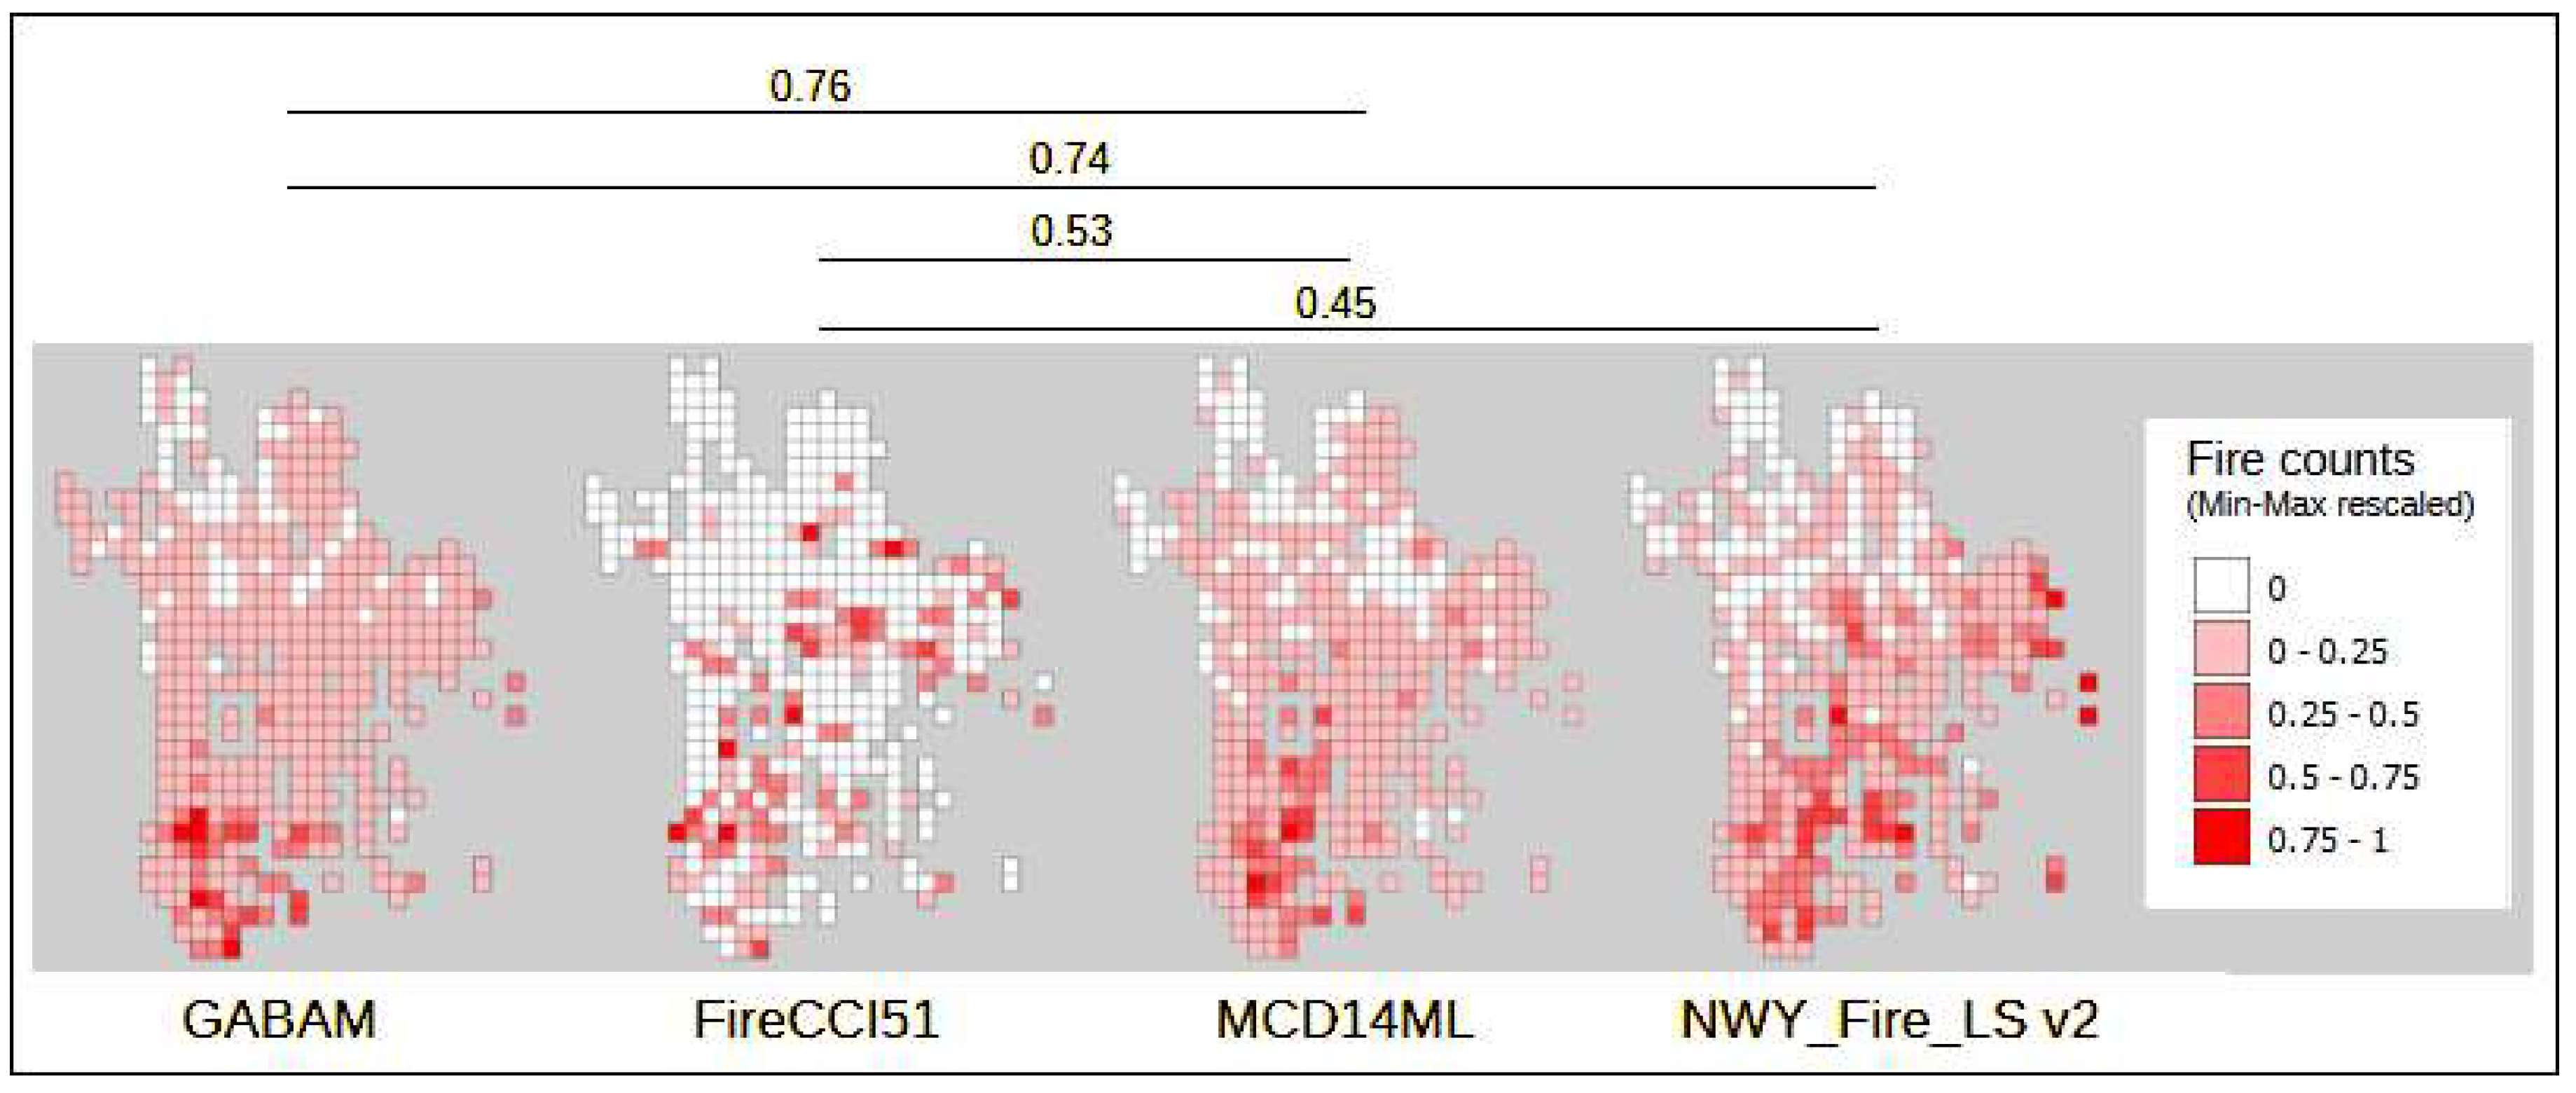
Despite advancements in satellite-derived fire analysis, reconstructing the past remains constrained by historical data limitations. Algorithms for extracting burned area information at the global scale continue to evolve, but complex landscapes and small fires are often excluded, mainly due to sensor spatial resolution. We evaluated the burned area detection capabilities of two recent global products, MODIS FireCCI51 and the Landsat-based GABAM, in a challenging mountainous region over the period 2001-2019. Overall, the spatio-temporal distribution of burn counts within 10 km mesh grid covering the study area correlated well for GABAM (Spearman R: 0.76 and 0.74) and discretely for FireCCI51 (R: 0.53 and 0.45) against two benchmark datasets. Fire event detection performance in the sampled squares in this specific landscape was limited for FireCCI51, despite its reported improvements globally (User’s Accuracy: 0.83, Producer’s Accuracy: 0.08). Conversely, GABAM exhibited relatively strong detection capabilities with reduced commission errors (User’s Accuracy: 0.85, Producer’s Accuracy: 0.68). This evaluation highlights the importance of Landsat-based approaches for global burned area assessments. Landsat's long, consistent time-series and higher spatial resolution offer significant advantages, as reported by the numerous local and regional applications. Yet, its potential for global assessments has been underutilized, hindered by difficulties in handling big amounts of data and the scarcity of analyzable images within a fire year. Nonetheless, the development of GABAM may serve as a proof of concept, demonstrating how the Landsat archive and powerful cloud computing can enhance global burned area mapping, improving accuracy, including small fires, and extending time-series. We encourage researchers to integrate Landsat into global fire extraction routines for comprehensive past fire history reconstruction.

Keywords: 
;  ;  ;  ;  ;  ;  

1. Introduction

The rapid development of Earth Observation technology has enabled an era of continuous, global-scale monitoring of both sea and land surface dynamics, as well as atmospheric processes [1]. However, reconstructing long-term trends and predicting future changes requires consistent and comparable time series data. While some long-term satellite datasets exist, their applicability can be limited by the sensors' original design. A prime example is burned area mapping [2], where several global inventories leveraging various satellite data sources have been released, such as the ESA’s Climate Change Initiative Fire Disturbance (FireCCI) suite (thirteen datasets available on https://climate.esa.int/en/projects/fire/) and the MODIS Standard Fire series (Active Fire and Burned Area products retrievable on https://modis-fire.umd.edu), among the most widely used. These products serve as base inputs for integrated, higher-level models like the Global Fire Emissions Database (currently at version 5, see https://www.globalfiredata.org).
Despite continuous improvements of burned area inventories, two key requirements for meeting the fire monitoring objectives defined by GCOS (Global Climate Observing System) Essential Climate Variables (https://gcos.wmo.int/en/essential-climate-variables/fire) persist: achieving higher spatial resolution and extending time series data [3,4,5]. Several researchers emphasize the importance of including small fires due to their local environmental impacts, especially in mountainous regions, their role in defining recent fire regimes and their recent shifts, as well as quantifying regional and global atmospheric emissions and forest loss [6,7,8,9,10,11]. While specific user communities may prioritize one improvement over the other, achieving both with the data accumulated in the past satellite history remains challenging. Addressing the issue of dataset length, FireCCILT11 by Oton et al. [12] combines data from different sensors spanning in total 36 years, but at the relatively coarse spatial resolution (0.05 degrees). Efforts to include smaller fires often integrate information from thermal sensors, allowing detection of fires below the nominal resolution of final products [8,13]. Additionally, images from the Landsat program, offering the longest-running consistent multispectral data at 30 m resolution since the mid-1980s, has been employed to build historical burned area datasets. However, despite the potential applicability to the global scale, these initiatives focused on restricted regions. Prominent examples among numerous ones are the MapBiomas Fire product from Brazil [14], the Burned Area Essential Climate Variable (BAECV, developed by Hawbaker et al. [15] and the Monitoring Trends in Burn Severity (MTBS) program for the conterminous United States [16] (see https://www.mtbs.gov). To date, the only freely-available, consistent global burned area product developed using the historical Landsat archive is the Global Annual Burned Area Maps (GABAM) by Long et al. [17].
Validating burned area inventories derived from satellite data is crucial for assessing their reliability, usability, and guiding future enhancements. While robust validation protocols for global products that specifically consider the localized and temporary spatiotemporal nature of burned areas have been established and continually evolve [18,19,20], sampling design often focus on major terrestrial biomes. For example, a standard database of burned areas distributed globally to be used as reference sites has been created and can be updated with new additions [21]. This inventory, called BARD, used a random sampling approach stratified across terrestrial ecoregions as defined by Olson’s classification [22]. However, in some cases, systematic or convenience sampling was used to account for rarer land cover classes and particular fire season conditions. We argue that this type of adaptations to improve inclusivity of all burning conditions on Earth should be encouraged. By considering works that focus on specific regions with challenging mapping conditions, we can provide valuable insights into global burned area products strengths and limitations.
This study aims to evaluate two recently released global burned area products: GABAM [17] and FireCCI51 [13] in a fire-prone mountainous area with frequent, small fires. We selected them based on three attributes: they offer global coverage, span at least two decades prior to the Sentinel-2 era, and have a relatively high spatial resolution. Given the difficulties associated with burned area detection in this region [23] and more generally, remote sensing application in heterogeneous landscapes [24,25,26], this study contributes to a more comprehensive understanding of these new inventories' capabilities and limitations, providing valuable insights for future advancements in global burned area extraction approaches using satellite imagery.

2. Materials and Methods
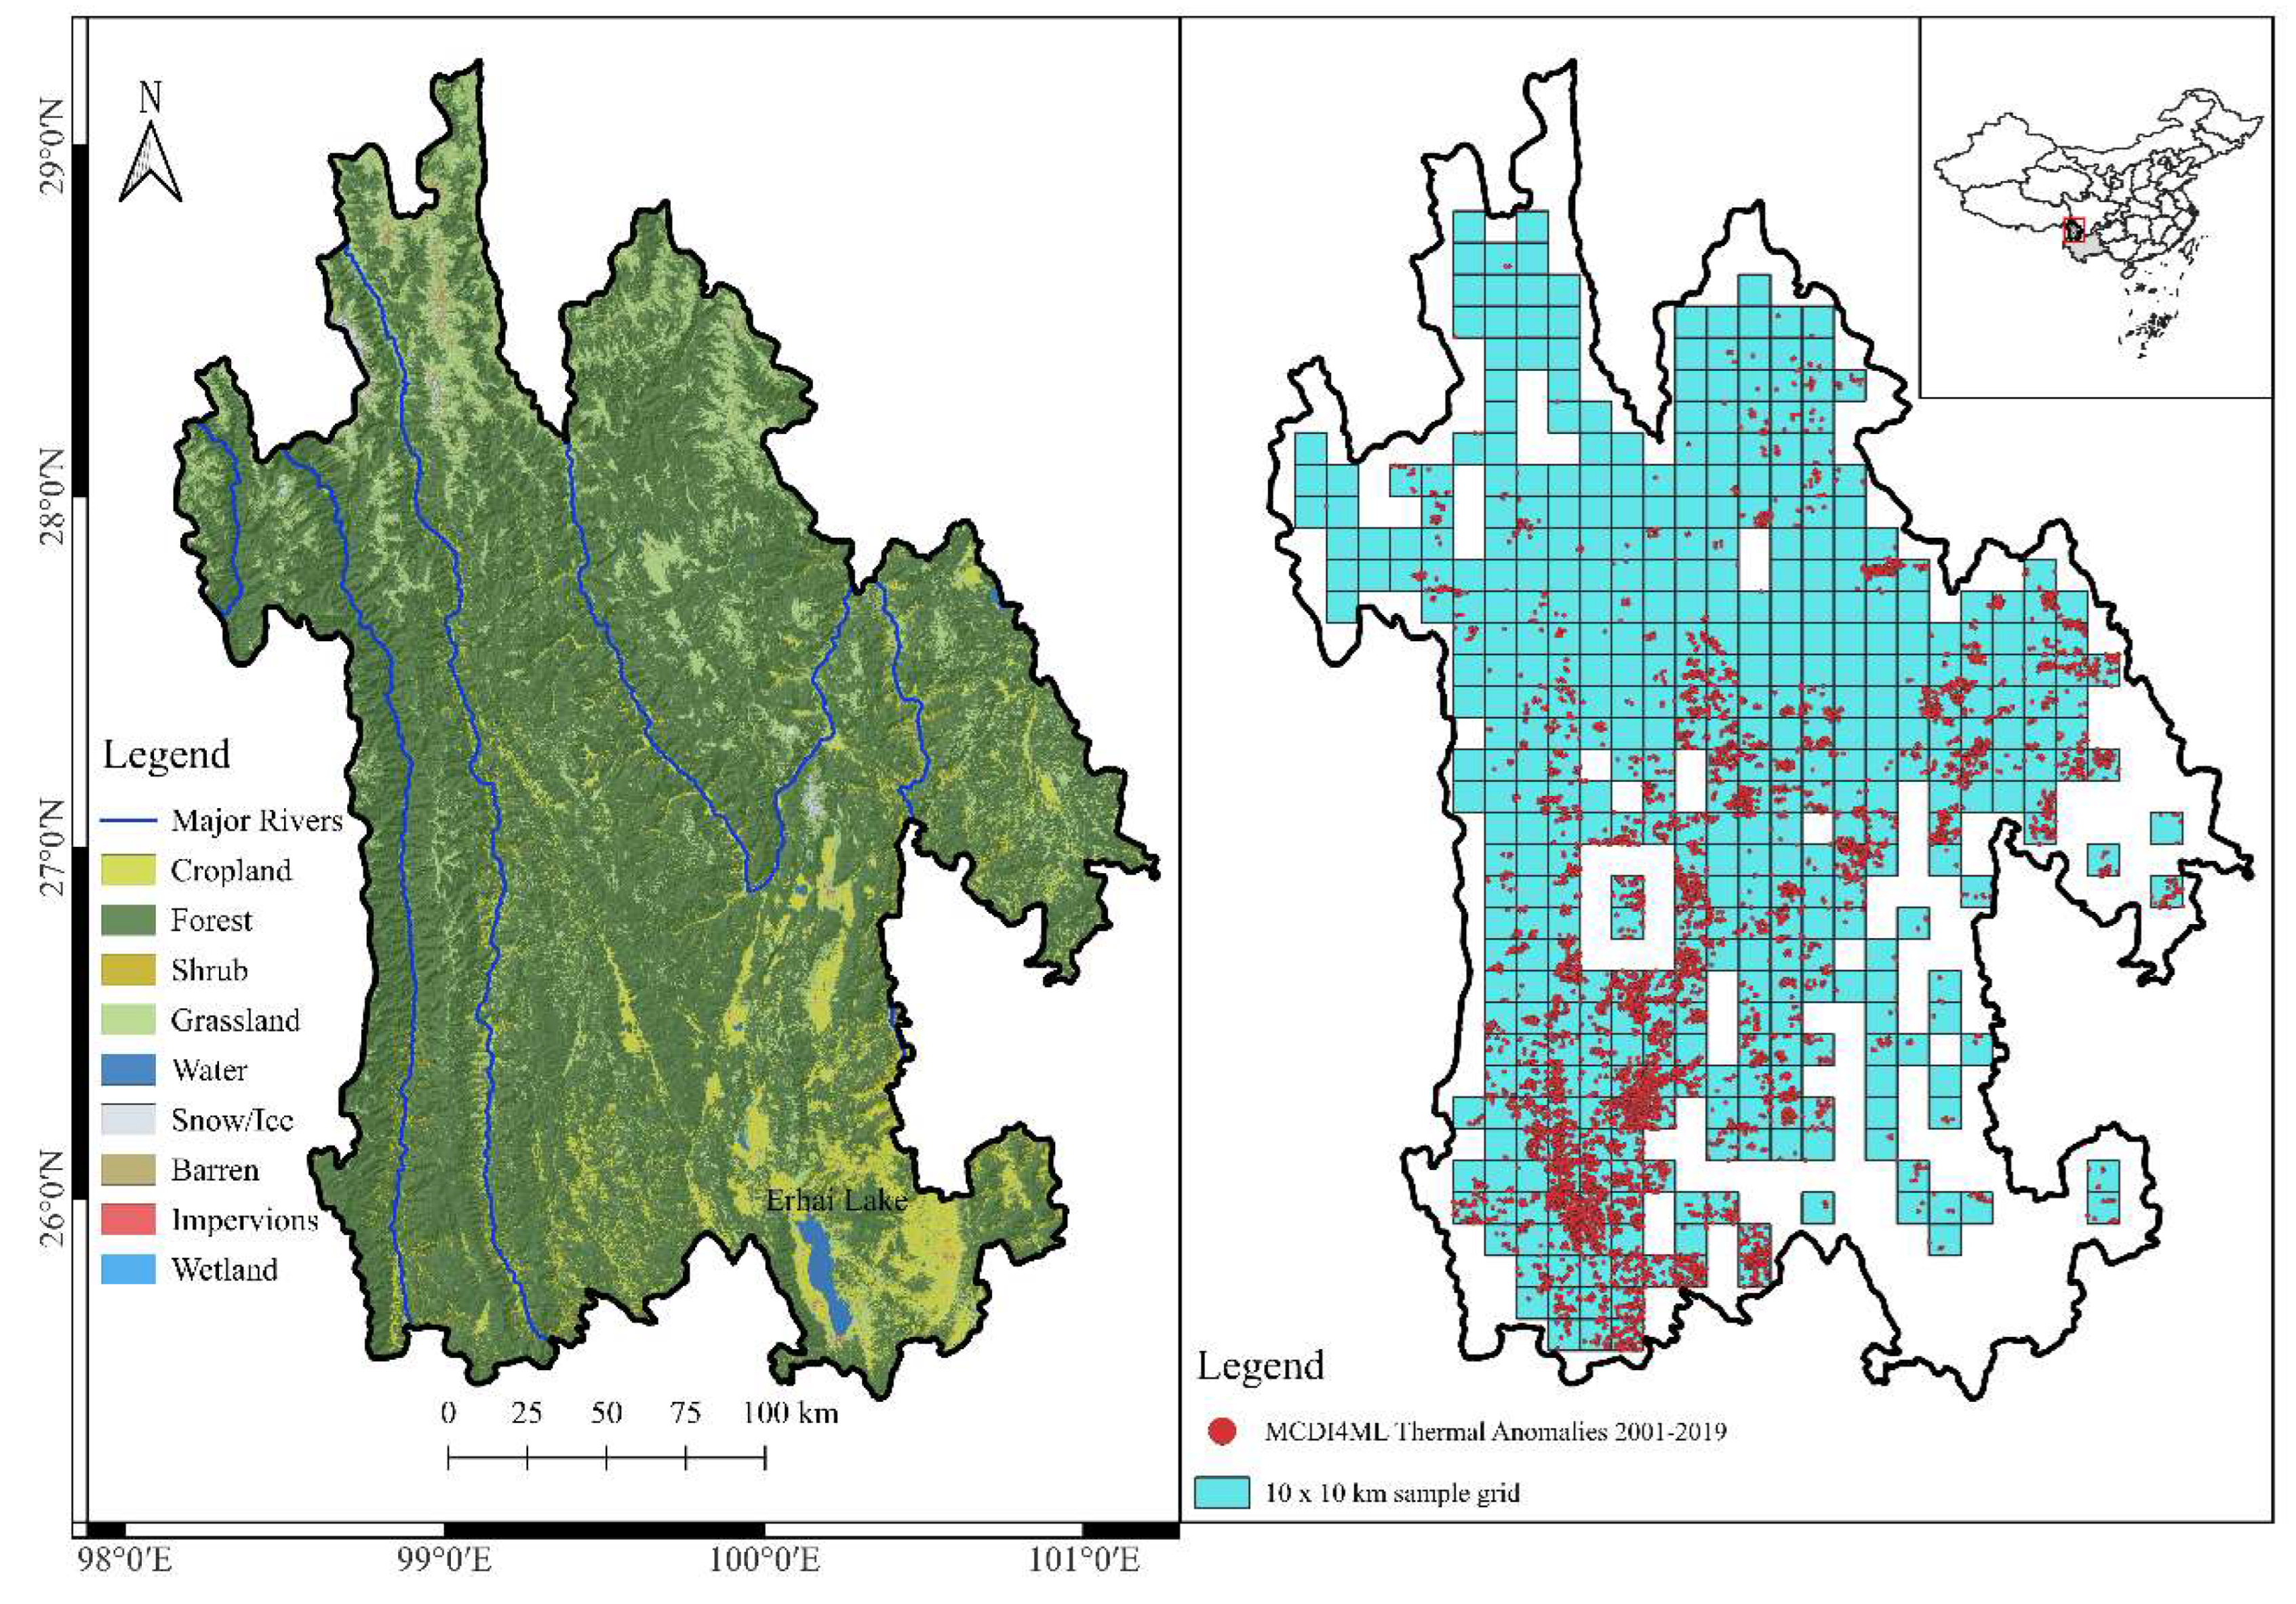
2.1. Study Region

Northwest Yunnan is a mountainous region in southwest China located between approximately 24.5°N - 29.5°N latitude and 98°E – 101.5°E longitude, covering an area of over 67,000 square km, almost as big as a country such as Sierra Leone (Figure 1a). The region is renowned for its rich biological and cultural diversity dwelling within a highly heterogeneous landscape. The dominant vegetation types include needleleaved forests (Pinus, Picea, Abies), subtropical evergreen broadleaved forests (Lithocarpus, Castanopsis, Quercus), as well as shrubs, grasslands, arid savannas, and alpine meadows [27,28]. The climate is under the influence of the East Asian monsoon providing distinct wet and dry seasons. The dry season, from November to May, coupled with drought and wind, elevates the region's susceptibility to fire [29]. The prevalence of fire-adapted Pinus yunnanensis [30] further exacerbates this risk. Annually, unauthorized human-caused fires (negligence, accidents) burn relatively small patches of wildland, making northwest Yunnan a hotspot for fire activity in Yunnan province and China as a whole [31].

2.2. Dataset Selection and Processing

FireCCI51 was developed by Lizundia-Loiola and colleagues [13] as part of the ESA Fire Disturbance Climate Change Initiative framework. The algorithm combines information from both MODIS thermal channels and near-infrared reflectances, as well as land cover maps from the Land Cover CCI project, generates spatio-temporal clusters of potential fires that will be then filtered according to adaptive thresholds, and finally applies a contextual region growing algorithm to detect the perimeter on the burned patches. We obtained the monthly pixel products, which have a spatial resolution of 250 meters and cover the period 2001-2020. Those products provide information on detection time, confidence level, and the land cover for burned pixels.
GABAM [17] is a Landsat-based product generated using Google Earth Engine. Its burned area map generation routine includes the computation of spectral indices from the images’ reflectance bands, a Random Forest model [32] calculating per-pixel burn probabilities, and a Region Growing step to obtain final burn perimeters. The product consists of annual binary grids (burned/unburned) with a 30-meter spatial resolution, spanning 1985 to 2021.
Following Fornacca et al. [33], we aggregated neighboring burned pixels from the original raster products to form vector polygons representing single fire events. Although FireCCI51 provides detection date and time for each burned pixel, to insure comparability with GABAM the temporal window for the aggregation was set to one calendar year. Moreover, we established a minimum burned area of 1 pixel (62,500 square m) from the lower resolution dataset (i.e. FireCCI51), after verifying the existence of such small detections. Consequently, smaller polygons in the GABAM dataset were excluded from the analyses. Finally, due to uncertainties in burned area detection within agricultural areas and for consistency with previous evaluations in this region [33], we excluded polygons detected over agricultural fields using the decadal GlobeLand30 [34] and the annual LC_cci v2.0.7 [35] land cover datasets.

2.3. Validation Method

To evaluate the products' ability to detect burned areas, we conducted a year-by-year assessment from 2001 to 2019 using a 10-km grid overlaying the study area as in [23]. Based on GlobeLand30, sample squares with more than 50% non-vegetated land cover (bare, snow, urban, water) as well as agricultural land were excluded, resulting in 430 valid squares (Figure 1b). We categorized sample squares by high and low fire frequency with adapted thresholds for each year based on MODIS MCD14ML thermal anomalies detections [36] within vegetated areas. Because of the extremely skewed distributions resulting from the localized nature of fire occurrences, the majority of sample squares didn’t include any thermal anomalies. Therefore, for each year, we excluded these squares from the threshold calculation and set the minimum amount of detections necessary to qualify as “high fire frequency” to that of the 0.75 percentile of the number of square samples. Afterwards, ten sample squares were randomly selected each year, evenly divided between high and low fire frequency squares.
For each selected sample square, three analysts visually interpreted all available Landsat and Sentinel-2 (post-2015) images and digitized all detected burned areas to be used as reference. MCD14ML thermal anomalies and NWY_Fire_LS v2 (Fornacca et al. 2020, available on https://github.com/DavideFornacca/Fire), a fire inventory previously generated for northwest Yunnan using a specific fire extraction routine, aided with the manual mapping. The latter model has an omission error of 20% and commission error of 22% in its v1, while v2 included an extensive visual revision of the dataset aiming at removing wrong detections, significantly decreasing errors of commission (no specific metric provided). Due to the data gap between the decommissioning of Landsat 5 and the launch of Landsat 8, the years 2012 and 2013 were excluded from this evaluation.
Performance was assessed by comparing the polygons mapped by the two models with the reference polygons. Successful detection (True Positives or TP) occurred when modeled and reference polygons overlapped. Non detected fire events were tagged as False Negatives (FN) while erroneously mapped fires were counted as False Positives (FP). Based on these metrics, we calculated User’s Accuracy ( U A = T P | T P + F P ), indicating the percentage of predicted positive cases that were correct, and Producer’s Accuracy ( P A = T P T P + F N ), reflecting how well the actual positive cases were identified by the model. To evaluate the impact of burned area size, we classified reference fire events into three categories, < 25 ha (approximately four FireCCI51 pixels), 25-100 ha, and > 100 ha and calculated PA for each. Finally, we assessed the spatial distribution of fires predicted by the two models as compared with MCD14ML and NWY_Fire_LS v2 by the means of correlation of fire counts within each 10-km sample grid. This analysis was done for the period 2001-2018, not including 2011, 2012 and 2013, to match the temporal coverage of the benchmark dataset NWY_Fire_LS v2.
Giving the particular obstacles for burned area detection in this kind of landscape, in particular fading burn scars that significantly limit the delimitation of full perimeters, we focused our assessment on fire counts by size without evaluating of the precision of the polygons mapped by the two models.
All operations were performed using Google Earth Engine (https://earthengine.google.com/), the Python programming language ,and QGIS software (https://www.qgis.org/).

3. Results

Of the 170 samples distributed across 17 years, 101 squares included at least one fire event. This demonstrates the effectiveness of stratified sampling using third-party fire frequencies data in maximizing the statistical representativeness of burned patches [20]. In total, 198 fire events were recorded. FireCCI51 detected only 15 of these (PA = 0.08), while GABAM identified 135 (PA = 0.68). Both products achieved a User’s Accuracy of over 0.83 (Table 1). When looking at different fire sizes, FireCCI51 exhibited a noticeable decline in detection probability (PA) as burned area decreased, while GABAM performed consistently with fires smaller than 100 ha and significantly improved detection of larger fires (Table 2).
The correlation of fire frequency distribution within the 10-km with the two reference datasets showed was highly significant (p-value y 0.001) for both models. However the coefficient were much higher for GABAM (Figure 2).

4. Discussion

Given the challenges of burned area detection in this complex landscape, such as small fires, heterogeneous and fragmented landscape, frequent cloud cover, and fast recovery of burned scars [23], our evaluation focused on simple fire event detection without assessing perimeter accuracy. This approach provides insights into a model's ability to quantify fire frequencies but not mapped burn areas. The results highlighted contrasting capabilities between two leading global burned area products. FireCCI51 is an improved version of its predecessor FireCCI41, acknowledged for better including smaller fires and increasing burned area estimation globally [13]. However, we found higher errors of omissions than FireCCI41 in rugged landscapes [33]. Limited performance of the current FireCCI51 was also reported in Mediterranean landscapes [37] and in the Amazon [38]. Spatial resolution and the trade-off between omission and commission errors significantly impact product performance in specific environments. Automated algorithms designed for global burned area extraction must concurrently accommodate diverse vegetation and landscape conditions, making it difficult to achieve optimal and consistent results across all scenarios. GABAM, using the Landsat archive, offers higher spatial resolution than FireCCI51, which is based on MODIS images. However, this comes at the cost of temporal revisiting hindering certain applications such as the early detection and monitoring of ongoing fires [2,5]. Cloud cover further limits analyzable scenes, especially in regions with persistent cloudiness, seriously limiting the detection of rapidly recovering burn scars [39,40] and the analysis of seasonality trends, because day-of-burns cannot be accurately and systematically determined. Despite these challenges, GABAM demonstrated relatively strong performance, comparable to the local dataset from Fornacca and colleagues [23]. Other validations have reported higher burned area mapped by GABAM with low commission error as compared to other global products, including FireCCI51 [38]. However, an analysis by Zubkova et al. [41] in three protected areas of South Africa, highlighted missing data issues in GABAM due to persistent cloud cover and inabilities in detecting scars in areas that burn frequently. During our evaluation, we observed frequent artifacts in GABAM likely due to issues with Landsat scene alignment, WRS-2 edges overlaps, and the use of Landsat-7 images post-SLC instrument failure. Moreover, the documentation of GABAM, beyond the prototype year 2015 [17] and a few selected years [42], lacks comprehensive information on time-series generation, uncertainties assessment, and extensive independent validation. These issues need to be addressed in future productions that can reach high quality and reliability standards and be potentially considered as input for higher level models, such as fire emissions and fire-enabled dynamic global vegetation models.

5. Conclusions: The Invaluable Legacy of LANDSAT

While contemporary Earth Observation infrastructures offer higher spatial and temporal resolution data as well as radar sensors able to ‘see’ through the clouds, reconstructing past land surface dynamics necessitates historical data collected by earlier missions. Unfortunately, the usability of the data from these different missions present serious limitations due to satellite orbit pattern and sensor specs, designed for different purposes. Although MODIS data has been instrumental in numerous applications, its availability since 2000 limits its historical scope. Moreover, the importance of small fires for improving estimations of atmospheric emissions and for assessing impacts in regions characterized by complex landscapes and has been repeatedly stated by researchers and requested by the wider user community [4]. Landsat, with nearly four decades of consistent data and moderate spatial resolution, stands as the most valuable historical resource for the scientific community. Surprisingly, its full potential for reconstructing past fire records at the global scale hasn't been fully realized. While several long-term burned area products based on Landsat have been developed regionally, GABAM is the only global effort released up to now. Our analyses underscore two key points:
  • Coarse resolution data has limitations for burned area quantification and other potential applications, such as quantifying greenhouses emissions, due to their substantial underestimation of contributions from small fires.
  • Despite several caveats, GABAM can be considered as a proof of concept demonstrating the feasibility of harnessing the Landsat archive to generate significantly improved global burned area assessments.
The datacube structure and computing power of Google Earth Engine enable large-scale data processing, making it accessible to a broader user community. Furthermore, state of the art machine learning algorithms and time-series analysis tools are programmable within the same platform. We urge researchers, across various Earth science disciplines, to harness the invaluable Landsat archive and integrated it with other data to further our understanding of past global land surface phenomena.

Author Contributions

Davide Fornacca: Conceptualization, D.F and W.X.; methodology, D.F.; validation, W.X.; formal analysis, D.F., Y.Y. and X.L.; investigation, D.F.; resources, W.X.; data curation, D.F., Y.Y. and X.L.; writing—original draft preparation, D.F.; writing—review and editing, D.F., Y.Y., X.L. and W.X.; visualization, D.F., Y.Y.; supervision, W.X..; project administration, W.X.; funding acquisition, D.F and W.X. All authors have read and agreed to the published version of the manuscript.

Funding

This work was supported by the Swiss National Science Foundation (P500PB_214369), the National Natural Science Foundation of China (3241101652), and the Project for Talent and Platform of Science and Technology in Yunnan Province Science and Technology Department (202105AM070008; 202205AM070007).

Data Availability Statement

All dataset are freely available on the Internet. References and links are mentioned in the manuscript.

Acknowledgments

The authors would like to express their gratitude and admiration to all individuals contributing to the advancement of Earth Observation science and deepening our understanding of nature.

Conflicts of Interest

The authors declare no conflicts of interest.

References

  1. Zhao, Q.; Yu, L.; Du, Z.; Peng, D.; Hao, P.; Zhang, Y.; Gong, P. An overview of the applications of earth observation satellite data: impacts and future trends. Remote Sens. 2022, 14. [Google Scholar] [CrossRef]
  2. Chuvieco, E.; Aguado, I.; Salas, J.; García, M.; Yebra, M.; Oliva, P. Satellite remote sensing contributions to wildland fire science and management. Curr. For. Reports 2020, 6, 81–96. [Google Scholar] [CrossRef]
  3. Pettinari, M. L.; Lizundia-Loiola, J.; Khairoun, A.; Roteta, E.; Storm, T.; Boettcher, M.; Danne, O.; Brockmann, C.; Chuvieco, E. Global and continental burned area detection from remote sensing: the FireCCI products. In EGU General Assembly 2023; Vienna, Austria, 2023.
  4. Chuvieco, E.; Mouillot, F.; van der Werf, G. R.; San Miguel, J.; Tanasse, M.; Koutsias, N.; García, M.; Yebra, M.; Padilla, M.; Gitas, I.; Heil, A.; Hawbaker, T. J.; Giglio, L. Historical background and current developments for mapping burned area from satellite Earth observation. Remote Sens. Environ. 2019, 225, 45–64. [Google Scholar] [CrossRef]
  5. Mouillot, F.; Schultz, M. G.; Yue, C.; Cadule, P.; Tansey, K.; Ciais, P.; Chuvieco, E. Ten years of global burned area products from spaceborne remote sensing-A review: Analysis of user needs and recommendations for future developments. Int. J. Appl. Earth Obs. Geoinf. 2014, 26, 64–79. [Google Scholar] [CrossRef]
  6. van der Velde, I. R.; van der Werf, G. R.; van Wees, D.; Schutgens, N. A. J.; Vernooij, R.; Houweling, S.; Tonucci, E.; Chuvieco, E.; Randerson, J. T.; Frey, M. M.; Borsdorff, T.; Aben, I. Small fires, big impact: evaluating fire emission estimates in southern Africa using new satellite imagery of burned area and carbon monoxide. Geophys. Res. Lett. 2024, 51. [Google Scholar] [CrossRef]
  7. van Wees, D.; van der Werf, G. R.; Randerson, J. T.; Andela, N.; Chen, Y.; Morton, D. C. The role of fire in global forest loss dynamics. Glob. Chang. Biol. 2021, 27, 2377–2391. [Google Scholar] [CrossRef] [PubMed]
  8. Randerson, J. T.; Chen, Y.; Van der Werf, G. R.; Rogers, B. M.; Morton, D. C. Global burned area and biomass burning emissions from small fires. J. Geophys. Res. Biogeosciences 2012, 117, 1–23. [Google Scholar] [CrossRef]
  9. Ramo, R.; Roteta, E.; Bistinas, I.; van Wees, D.; Bastarrika, A.; Chuvieco, E.; van der Werf, G. R. African burned area and fire carbon emissions are strongly impacted by small fires undetected by coarse resolution satellite data. Proc. Natl. Acad. Sci. U. S. A. 2021, 118. [Google Scholar] [CrossRef]
  10. Liu, T.; Mickley, L. J.; Marlier, M. E.; DeFries, R. S.; Khan, M. F.; Latif, M. T.; Karambelas, A. Diagnosing spatial biases and uncertainties in global fire emissions inventories: Indonesia as regional case study. Remote Sens. Environ. 2020, 237, 111557. [Google Scholar] [CrossRef]
  11. Khairoun, A.; Mouillot, F.; Chen, W.; Ciais, P.; Chuvieco, E. Coarse-resolution burned area datasets severely underestimate fire-related forest loss. Sci. Total Environ. 2024, 920, 170599. [Google Scholar] [CrossRef]
  12. Otón, G.; Lizundia-Loiola, J.; Pettinari, M. L.; Chuvieco, E. Development of a consistent global long-term burned area product (1982–2018) based on AVHRR-LTDR data. Int. J. Appl. Earth Obs. Geoinf. 2021, 103. [Google Scholar] [CrossRef]
  13. Lizundia-Loiola, J.; Otón, G.; Ramo, R.; Chuvieco, E. A spatio-temporal active-fire clustering approach for global burned area mapping at 250 m from MODIS data. Remote Sens. Environ. 2020, 236, 111493. [Google Scholar] [CrossRef]
  14. Souza, C. M.; Z. Shimbo, J.; Rosa, M. R.; Parente, L. L.; A. Alencar, A.; Rudorff, B. F. T.; Hasenack, H.; Matsumoto, M.; G. Ferreira, L.; Souza-Filho, P. W. M.; de Oliveira, S. W.; Rocha, W. F.; Fonseca, A. V.; Marques, C. B.; Diniz, C. G.; Costa, D.; Monteiro, D.; Rosa, E. R.; Vélez-Martin, E.; Weber, E. J.; Lenti, F. E. B.; Paternost, F. F.; Pareyn, F. G. C.; Siqueira, J. V.; Viera, J. L.; Neto, L. C. F.; Saraiva, M. M.; Sales, M. H.; Salgado, M. P. G.; Vasconcelos, R.; Galano, S.; Mesquita, V. V.; Azevedo, T. Reconstructing three decades of land use and land cover changes in Brazilian biomes with Landsat archive and Earth Engine. Remote Sens. 2020, 12, 2735. [CrossRef]
  15. Hawbaker, T. J.; Vanderhoof, M. K.; Schmidt, G. L.; Beal, Y. J.; Picotte, J. J.; Takacs, J. D.; Falgout, J. T.; Dwyer, J. L. The Landsat Burned Area algorithm and products for the conterminous United States. Remote Sens. Environ. 2020, 244, 111801. [Google Scholar] [CrossRef]
  16. Eidenshink, J.; Schwind, B.; Brewer, K.; Zhu, Z.; Quayle, B.; Howard, S. A project for Monitoring Trends in Burn Severity. Fire Ecol. Spec. Issue 2007, 3. [Google Scholar] [CrossRef]
  17. Long, T.; Zhang, Z.; He, G.; Jiao, W.; Tang, C. 30 m Resolution global annual burned area mapping based on Landsat images and Google Earth Engine. Remote Sens. 2019, 11, 489. [Google Scholar] [CrossRef]
  18. Boschetti, L.; Roy, D. P.; Hoffmann, A. A.; Humber, M. L. Collection 6 MODIS Burned Area product User’s guide - Version 1.0. User Guid. 2016, Version 1., 1–12. [Google Scholar]
  19. Padilla, M.; Stehman, S. V.; Chuvieco, E. Validation of the 2008 MODIS-MCD45 global burned area product using stratified random sampling. Remote Sens. Environ. 2014, 144, 187–196. [Google Scholar] [CrossRef]
  20. Padilla, M.; Olofsson, P.; Stehman, S. V.; Tansey, K.; Chuvieco, E. Stratification and sample allocation for reference burned area data. Remote Sens. Environ. 2017, 203, 240–255. [Google Scholar] [CrossRef]
  21. Franquesa, M.; Vanderhoof, M. K.; Stavrakoudis, D. G.; Gitas, I. Z.; Roteta, E.; Padilla, M.; Chuvieco, E. Development of a standard database of reference sites for validating global burned area products. Earth Syst. Sci. Data 2020, 12, 3229–3246. [Google Scholar] [CrossRef]
  22. Olson, D. M.; Dinerstein, E.; Wikramanayake, E. D.; Burgess, N. D.; Powell, G. V. N.; Underwood, E. C.; D’Amico, J. A.; Itoua, I.; Strand, H. E.; Morrison, J. C.; Loucks, C. J.; Allnutt, T. F.; Ricketts, T. H.; Kura, Y.; Lamoreux, J. F.; Wettengel, W. W.; Hedao, P.; Kassem, K. R. Terrestrial ecoregions of the world: A new map of life on Earth. Bioscience 2001, 51, 933–938. [Google Scholar] [CrossRef]
  23. Fornacca, D.; Ren, G.; Xiao, W. Small fires, frequent clouds, rugged terrain and no training data: A methodology to reconstruct fire history in complex landscapes. Int. J. Wildl. Fire 2020. [Google Scholar] [CrossRef]
  24. Schneiderbauer, S.; Zebisch, M.; Steurer, C. Applied Remote Sensing in Mountain Regions: A Workshop Organized by EURAC in the Core of the Alps. Mt. Res. Dev. 2007, 27, 286–287. [Google Scholar] [CrossRef]
  25. Weiss, D. J.; Walsh, S. J. Remote Sensing of Mountain Environments. Geogr. Compass 2009, 3, 1–21. [Google Scholar] [CrossRef]
  26. Ward, E.; Buytaert, W.; Peaver, L.; Wheater, H. Evaluation of precipitation products over complex mountainous terrain: A water resources perspective. Adv. Water Resour. 2011, 34, 1222–1231. [Google Scholar] [CrossRef]
  27. Tang, C. Q.; Ohsawa, M. Ecology of subtropical evergreen broad-leaved forests of Yunnan, southwestern China as compared to those of southwestern Japan. J. Plant Res. 2009, 122, 335–350. [Google Scholar] [CrossRef]
  28. Tang, C. Q. The subtropical vegetation of southwestern China: Plant distribution, diversity and ecology; Plant and Vegetation; Springer Netherlands: Dordrecht, Netherlands, 2015; ISBN 978-94-017-9740-5. [Google Scholar]
  29. Zhang, Z.; Long, T.; He, G.; Wei, M.; Tang, C.; Wang, W.; Wang, G.; She, W.; Zhang, X. Study on global burned forest areas based on landsat data. Photogramm. Eng. Remote Sensing 2020, 86, 503–508. [Google Scholar] [CrossRef]
  30. Pausas, J. G.; Su, W.; Luo, C.; Shen, Z. A shrubby resprouting pine with serotinous cones endemic to southwest China. Ecology 2021, 102, 1–4. [Google Scholar] [CrossRef]
  31. Xiong, Q.; Luo, X.; Liang, P.; Xiao, Y.; Xiao, Q.; Sun, H.; Pan, K.; Wang, L.; Li, L.; Pang, X. Fire from policy, human interventions, or biophysical factors? Temporal–spatial patterns of forest fire in southwestern China. For. Ecol. Manage. 2020, 474. [Google Scholar] [CrossRef]
  32. Breiman, L. Random Forests. Mach. Learn. 2001, 45, 5–32. [Google Scholar] [CrossRef]
  33. Fornacca, D.; Ren, G.; Xiao, W. Performance of Three MODIS Fire Products (MCD45A1, MCD64A1, MCD14ML), and ESA Fire_CCI in a Mountainous Area of Northwest Yunnan, China, Characterized by Frequent Small Fires. Remote Sens. 2017, 9, 1131. [Google Scholar] [CrossRef]
  34. Chen, J.; Chen, J.; Liao, A.; Cao, X.; Chen, L.; Chen, X.; He, C.; Han, G.; Peng, S.; Lu, M.; Zhang, W.; Tong, X.; Mills, J. Global land cover mapping at 30 m resolution: A POK-based operational approach. ISPRS J. Photogramm. Remote Sens. 2015, 103, 7–27. [Google Scholar] [CrossRef]
  35. ESA Land Cover CCI Product User Guide Version 2. Tech. Rep. 2017.
  36. Giglio, L.; Schroeder, W.; Justice, C. O. The collection 6 MODIS active fire detection algorithm and fire products. Remote Sens. Environ. 2016, 178, 31–41. [Google Scholar] [CrossRef] [PubMed]
  37. Katagis, T.; Gitas, I. Z. Assessing the accuracy of MODIS MCD64A1 C6 and FireCCI51 burned area products in Mediterranean ecosystems. Remote Sens. 2022, 14. [Google Scholar] [CrossRef]
  38. Pessôa, A. C. M.; Anderson, L. O.; Carvalho, N. S.; Campanharo, W. A.; Silva Junior, C. H. L.; Rosan, T. M.; Reis, J. B. C.; Pereira, F. R. S.; Assis, M.; Jacon, A. D.; Ometto, J. P.; Shimabukuro, Y. E.; Silva, C. V. J.; Pontes-Lopes, A.; Morello, T. F.; Aragão, L. E. O. C. Intercomparison of burned area products and its implication for carbon emission stimations in the Amazon. Remote Sens. 2020, 12, 3864. [Google Scholar] [CrossRef]
  39. Fornacca, D.; Ren, G.; Xiao, W. Evaluating the best spectral indices for the detection of burn scars at several post-fire dates in a mountainous region of northwest Yunnan, China. Remote Sens. 2018, 10, 1196. [Google Scholar] [CrossRef]
  40. Lu, B.; He, Y.; Tong, A. Evaluation of spectral indices for estimating burn severity in semiarid grasslands. Int. J. Wildl. Fire 2016, 25, 147–157. [Google Scholar] [CrossRef]
  41. Zubkova, M.; Lötter, M.; Bronkhorst, F.; Giglio, L. Assessment of the effectiveness of coarse resolution fire products in monitoring long-term changes in fire regime within protected areas in South Africa. Int. J. Appl. Earth Obs. Geoinf. 2024, 132. [Google Scholar] [CrossRef]
  42. Zhang, Z.; Long, T.; He, G.; Wei, M.; Tang, C.; Wang, W.; Wang, G.; She, W.; Zhang, X. Study on global burned forest areas based on landsat data. Photogramm. Eng. Remote Sensing 2020, 86, 503–508. [Google Scholar] [CrossRef]
Figure 1. Map of northwest Yunnan (a); and sampling grid used for the validation (b).
Preprints 148464 g001
Figure 2. Fire counts distribution within 10-km square units and Spearman Rho correlation between assessed model and reference benchmarks. Fire counts were Min-Max rescaled to allow comparison, while correlation were all significant at the 0.001 threshold.
Preprints 148464 g002
Table 1. Burned area detection metrics for two global burned area products. TP: True Positives, FN: False Negatives, FP: False Positives, PA: Producer’s Accuracy, UA: User’s Accuracy, NaN: Not a Number (caused by “divide-by-zero” error).
FireCCI51 GABAM
Year Low - high
threshold
High frequency
sample squares
Reference
fires
TP FN FP PA UA TP FN FP PA UA
2001 2 23 8 0 8 0 0 NaN 6 2 5 0.75 0.55
2002 2 7 7 0 7 0 0 NaN 6 1 1 0.86 0.86
2003 3 20 13 1 12 0 0.08 1 7 6 4 0.54 0.64
2004 4 26 10 0 10 0 0 NaN 8 2 3 0.8 0.73
2005 4 17 18 0 18 0 0 NaN 2 16 0 0.11 1
2006 7 39 18 3 15 1 0.17 0.75 14 4 1 0.78 0.93
2007 6 34 15 0 15 0 0 NaN 14 1 1 0.93 0.93
2008 3 16 11 0 11 0 0 NaN 9 2 4 0.82 0.69
2009 6 41 8 2 6 0 0.25 1 7 1 0 0.88 1
2010 10 43 18 1 17 0 0.06 1 14 4 0 0.78 1
2011 4 11 10 0 10 0 0 NaN 9 1 0 0.9 1
2014 30 86 14 6 8 1 0.43 0.86 11 3 1 0.79 0.92
2015 4 24 8 2 6 1 0.25 0.67 7 1 1 0.88 0.88
2016 3 7 7 0 7 0 0 NaN 5 2 0 0.71 1
2017 5 12 12 0 12 0 0 NaN 6 6 2 0.5 0.75
2018 2 8 9 0 9 0 0 NaN 2 7 0 0.22 1
2019 3 14 12 0 12 0 0 NaN 8 4 0 0.67 1
Overall study period 198 15 183 3 0.08 0.83 135 63 23 0.68 0.85
Table 2. Burned area detection capabilities for different fire sizes. BA: Burned Area, TP: True Positives, PA: Producer’s Accuracy.
BA < 25 ha
(n = 41)
BA 25-100 ha
(n = 71)
BA > 100 ha
(n = 86)
TP PA TP PA TP PA
GABAM 26 0.63 42 0.59 67 0.78
FireCCI51 0 0 4 0.06 11 0.13
Disclaimer/Publisher’s Note: The statements, opinions and data contained in all publications are solely those of the individual author(s) and contributor(s) and not of MDPI and/or the editor(s). MDPI and/or the editor(s) disclaim responsibility for any injury to people or property resulting from any ideas, methods, instructions or products referred to in the content.
Copyright: This open access article is published under a Creative Commons CC BY 4.0 license, which permit the free download, distribution, and reuse, provided that the author and preprint are cited in any reuse.
Prerpints.org logo

Preprints.org is a free preprint server supported by MDPI in Basel, Switzerland.

Subscribe

Disclaimer

Terms of Use

Privacy Policy

Privacy Settings

© 2026 MDPI (Basel, Switzerland) unless otherwise stated