Preprint
Article

This version is not peer-reviewed.

SR-FTIR Biomolecular Characterization of the Hippocampus: the Role of Tenascin C in Adult Neurogenesis in the Subgranular Zone

A peer-reviewed article of this preprint also exists.

Submitted:

17 February 2025

Posted:

19 February 2025

You are already at the latest version

Abstract

To better understand adult neurogenesis, the biomolecular specificity of the subgranular zone should be investigated in comparison to other layers of the hippocampus. Adult neurogenesis occurs at a reduced rate in adulthood compared to the period of development, but it can be increased with exposure to enriched environment. This can be used to investigate the regulatory role of molecules present in the extracellular matrix, such as tenascin C. This study using Synchrotron radiation Fourier Transform Infrared spectroscopy (SR-FTIR) shows that the differences between the hippocampal layers in adolescence are maintained as subtle and significant in adulthood. Moreover, we have detected biomolecular changes that accompany the process of neurogenesis under the influence of enriched environment, while these effects are lacking in mice with a gene ablation for tenascin C.

Keywords: 
;  ;  ;  

1. Introduction

The nervous system possesses the capacity to respond to experience or injury via structural or functional modification — a phenomenon known as neuronal plasticity — which involves changes in gene transcription, cell composition, morphology and excitability. For example, the hippocampus shows a specific form of neuronal plasticity since the modification of dendritic complexity, synapse number and formation of entirely novel neuronal connections occurs not only during development but also in adulthood during neurogenesis. Namely, the principal neurons in the hippocampus, the pyramidal cells in CA1 and CA3 and granule neurons in the dentate gyrus (DG), have distinctive cell morphology, neurogenic potential, synaptic connections and signaling pathways, and resistance to damaging conditions [1,2].
The biomolecular composition of the cell — including macromolecules such as lipids, proteins, nucleic acids and carbohydrates — is the basis and product of the biochemical processes that take place within it. Appositely, FTIR spectroscopy measures the absorption of IR light by chemical bonds and provides information about the content, structure and conformation of macromolecules. Furthermore, coupling FTIR spectroscopy with a synchrotron (SR) infrared beam is suitable for studying biological samples since it is non-destructive and label-free [3]. These advantages allow for the acquisition of information from an intact sample without altering biological structures. Therefore, SR-FTIR spectroscopy is applicable for the biomolecular characterization of layers in the hippocampus tissue. Thus, Dudala and colleagues used SR-FTIR to investigated the distribution of proteins and lipids in the molecular, multiform, and granular layer of the rat hippocampus [4] while a more detailed study used FTIR imaging to monitor the molecular changes in the rat hippocampus after traumatic brain injury and to investigate the protein/lipid dynamics, the metabolic ratio, and the oxidative stress parameters [5].
Adult neurogenesis is a distinctive feature of the adult hippocampus that allows for continuous adaptation of hippocampal circuitry accompanying the generation of new neurons [6]. The extracellular matrix molecules in the SGZ have an important role in adult neurogenesis and one of the specifically enriched molecules is tenascin C (TnC) [7]. TnC is a regulatory glycoprotein that is highly expressed in the extracellular matrix during development and tissue remodeling. The role of TnC in the regulation of adult neurogenesis in the hippocampus is still being investigated, but there are a number of studies that confirm its role in the processes related to adult neurogenesis (reviewed in [8]).
Furthermore, adult hippocampal neurogenesis is a process highly sensitive to experience [9], such as the one induced by the exposure to enriched environment (EE), a protocol known to induce brain structural and functional plasticity. Thus, EE can contribute to the survival of new granule neurons in the rat SGZ [10]. Also, physical activity such as running increases cell proliferation and survival of newborn neurons in the rat SGZ [11]. We hypothesized that genetic modifications, in interaction with environmental factors, shape the composition of the adult neurogenic niche. Although specific properties of the microenvironment where adult neurogenesis takes place are described in the literature [7,12,13], the biomolecular changes accompanying this neuronal development are still unknown.
One previous study described biomolecular changes in the hippocampus in the early postnatal period and adulthood, which were monitored using FTIR spectroscopy [14]. They reported an accumulation of saturated and unsaturated lipids, as well as of compounds containing phosphate and carbonyl groups, during the juvenescence lifetime. Also, a time point at around two months of age was labeled as critical when the initial rapid changes slowed down, leading to a more stable biochemical environment. This stage is marked by the stabilization of protein and lipid levels and by a decrease in the difference among regions, indicating that the key phases of the postnatal brain development have been successfully completed. In other words, this is a time point when adult neurogenesis exhibits a drastic decrease in rate in rodents [15].
In the first part of the present study, high-resolution SR-FTIR spectroscopy was employed, to investigate CA1, CA3 and granular zone (GZ) layers, compared to the SGZ where adult neurogenesis takes place. In the second part of the study, the biomolecular composition of the SGZ in the adult hippocampus was investigated under different conditions of exposure to EE and in the absence of TnC. Semiquantitative analysis revealed that in the adult hippocampus subtle changes in the distribution of main biomolecules and changes in their composition in hippocampal layers are present, and that the SGZ is significantly different from CA3. Further investigation of the SGZ showed that exposure to EE leads to alterations in the composition of proteins and nucleic acids, with TNC in the extracellular matrix being needed for EE to exert its effects.

2. Materials and Methods

2.1. Animals

The first part of this study was performed on C57BL/6J mice, and the second part on constitutive tenascin-C-deficient (TnC KO) mice [16] and their wild type littermates. Experiments were performed on two months old adult males. The number of experimental animals per group was 3-4 mice. The experimental procedures were in accordance with the NIH Guide for Care and Use of Laboratory Animals (1985) and the European Communities Council Directive (86/609/EEC). Experiments were approved by the local Ethics Committee. The authorization reference number is EK-BF -2020/02. All efforts were made to minimize animal suffering and to reduce the number of animals used.

2.2. Experimental Paradigm for Enriched Environment

In the current study we used EE as an experimental paradigm to provide enhanced sensory, cognitive, and motor stimuli. Males of TnC deficient mice and their wild type littermates were housed in groups of 8 animals per cage in larger cages (54 × 39 × 27 cm) containing various objects (boxes, ladders, balls, tunnels, tubes, and running wheels) that differed in composition, shape, size, texture, and brightness of color. The locations of the objects and the outlets for food and water were changed daily, and each week one object was replaced by another. We started the exposure to EE at the juvenile stage, around P21 [17] and housed the animals for 4 weeks with ad libitum access to food and water. For standard conditions (SC), 4 animals per cage were housed in conventional cages (32 × 20 × 13 cm) without objects but with ad libitum access to food and water at fixed positions. Mice were kept under a 12:12 h light/dark cycle.

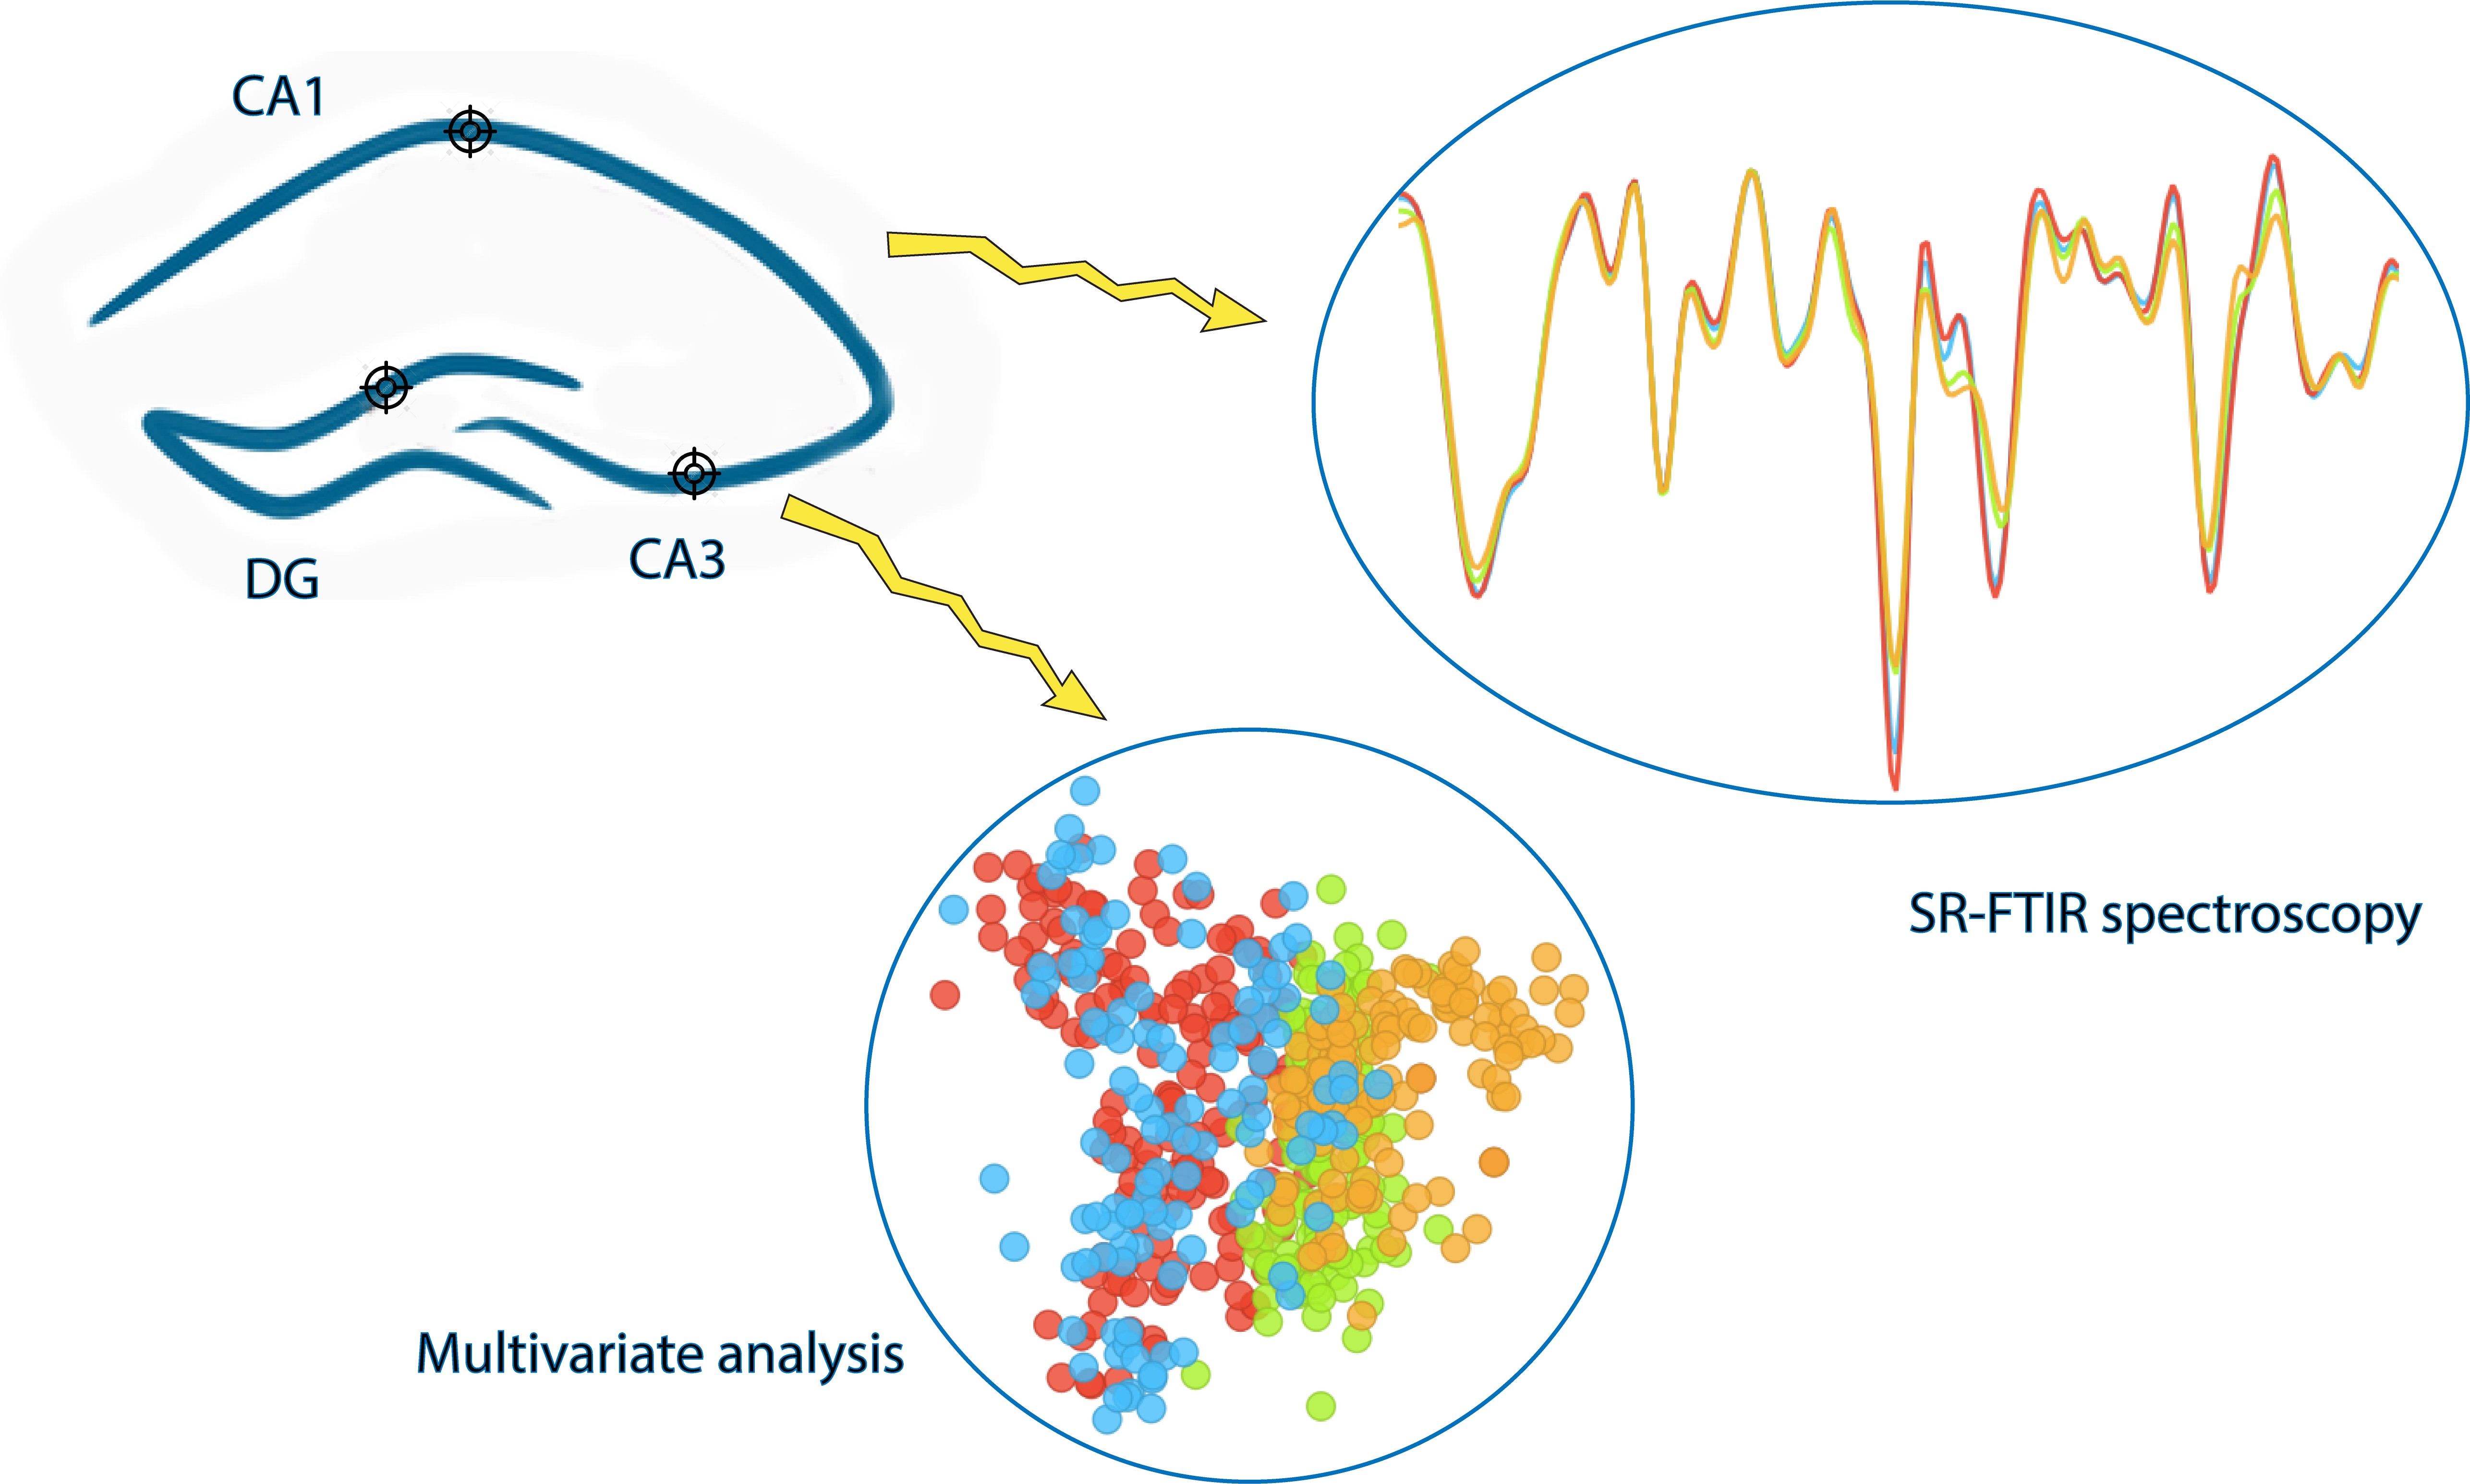
2.3. Synchrotron-Based FTIR Spectroscopy and Imaging

2.3.1. Tissue Preparation

Animals were sacrificed around 8 weeks of age. Animals were sacrificed by cervical dislocation and the brains were rapidly isolated and frozen at -80 °C. Coronal sections of the dorsal hippocampus were collected on a cryostat (CM1850, Leica Microsystems, Wetzlar, Germany) of 16 µm thickness and attached to 10 mm Ø × 0.5 mm CaF2 slides (Silson Ltd., Northampton, England). The samples were freeze-dried for 24 h in the lyophilizer (TOPT-10C, Toption Instrument CO., Ltd., China) and then slowly brought to room temperature and stored over silica gel before measurements. The tissues were imaged with a bright field microscope to investigate the tissue integrity and to determine the regions of interest.

2.3.2. SR-FTIR Spectroscopy

Synchrotron-radiation light source was employed to collect individual spectra from different hippocampal layers. Samples were analyzed at the MIRAS BL01 beamline (ALBA Synchrotron, Spain) by using the 3000 Hyperion microscope coupled to a Vertex 70v spectrometer and liquid nitrogen cooled mercury cadmium telluride (MCT) detector. IR spectra were collected in transmission mode using the 36x Schwarzschild objective/condenser and an aperture size of 12 × 12 μm. Approximately 40–50 spectra were collected from each region of interest in the 4000-800 cm-1 mid-infrared range at a spectral resolution of 4 cm−1 with 128 scans per spectrum. IR spectra were collected using Opus software (version 8.2, Bruker Company, Germany). OPUS software 7.5 was used for data acquisition and initial analysis. Quasar 9.1 (Orange-Spectroscopy, 0.8.0; Bioinformatics Laboratory, University of Ljubljana) was used for subsequent analysis of spectra.

2.3.3. Data Analysis

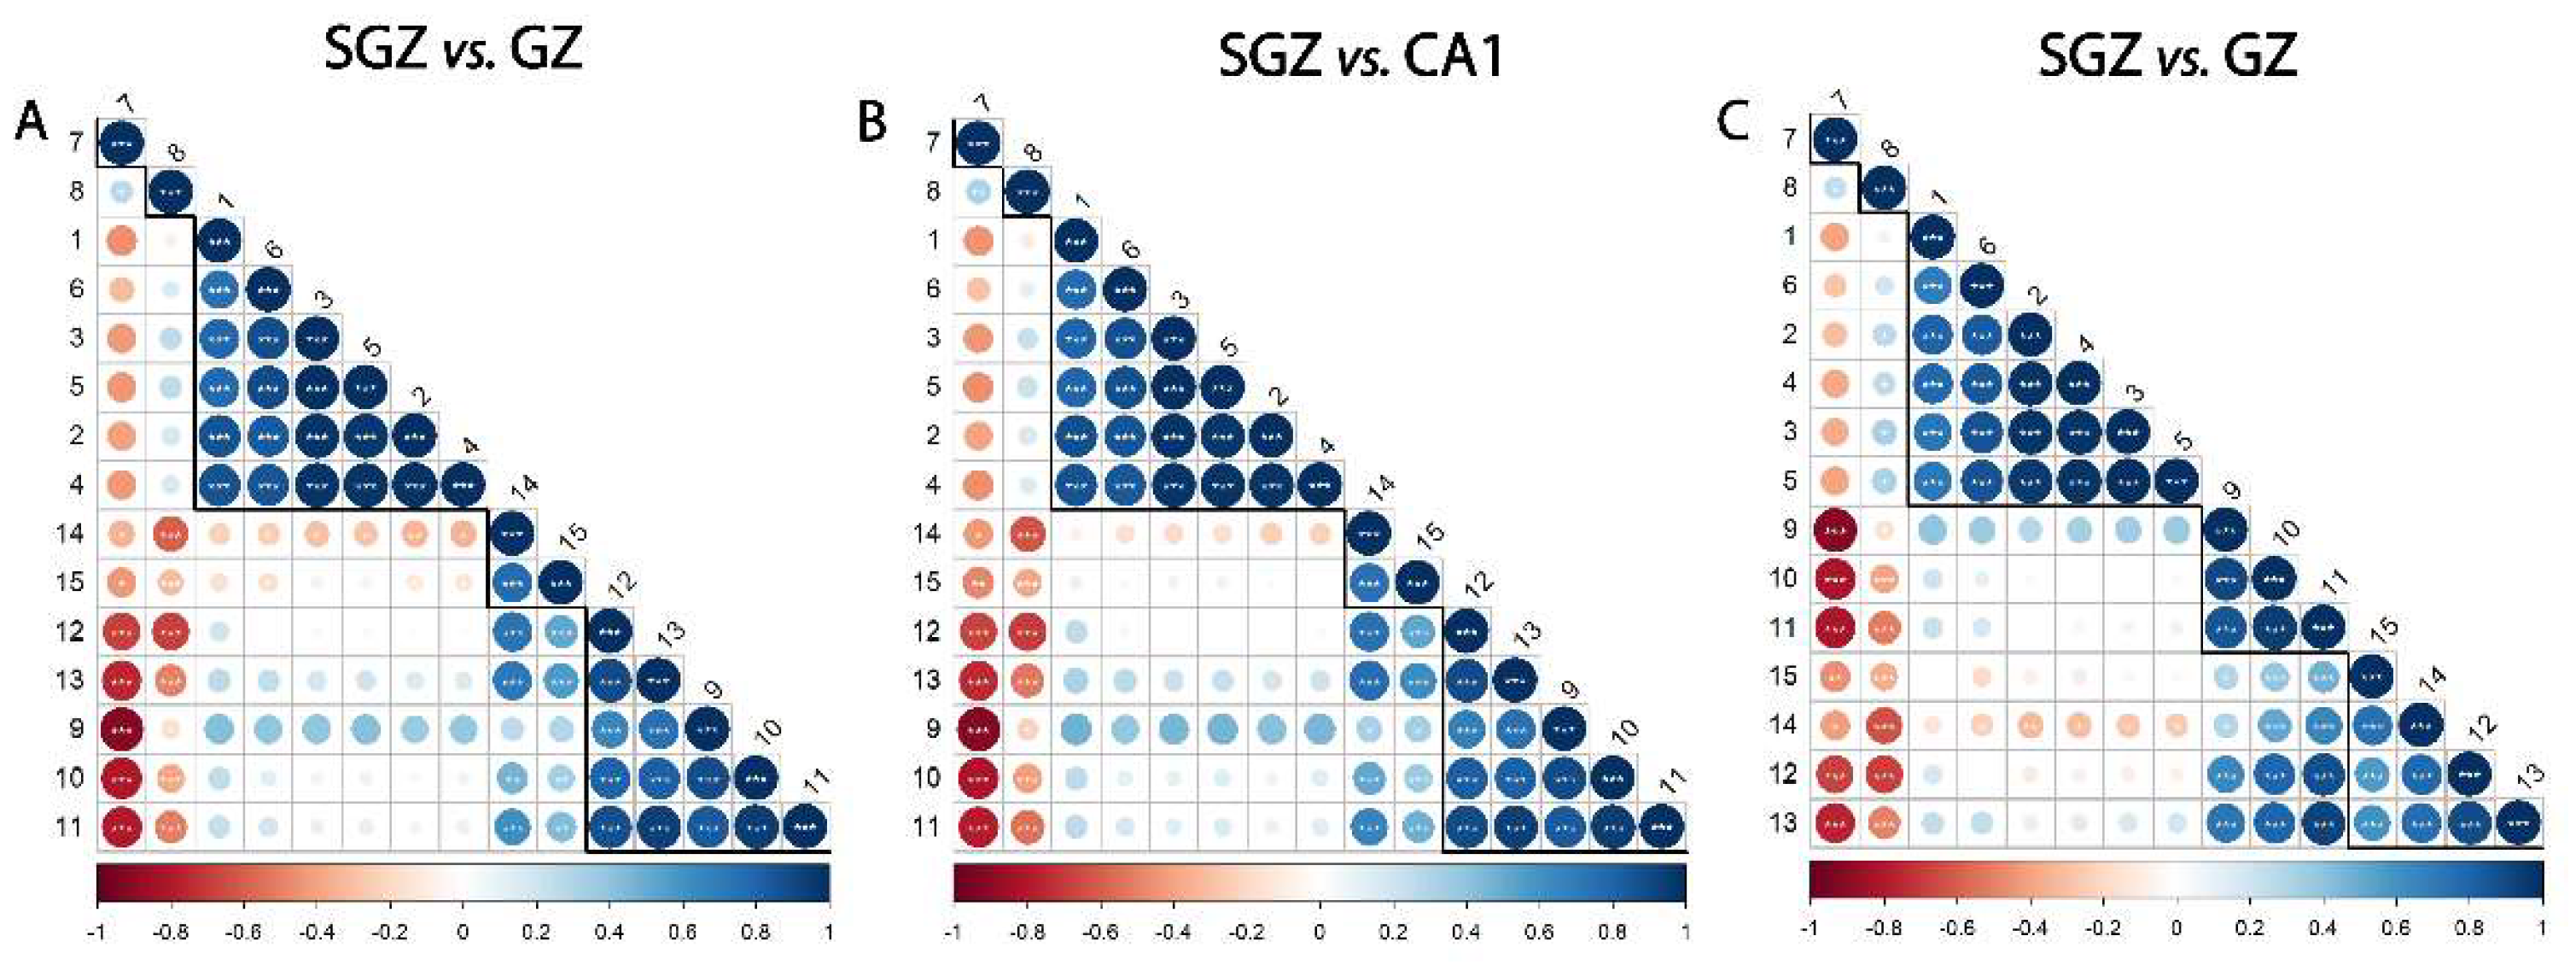
2.3.3.1. Correlation Analysis

Correlation analysis served as a key statistical approach to examine how distinct IR absorption bands relate to one another within the freeze-dried hippocampal tissue spectrum. Within the analyzed range of 3100–800 cm-1, we identified 15 distinct peaks/bands, each associated with a specific vibrational mode of a functional group. These selected peaks were then subjected to correlation analysis between experimental groups and the control group (SGZ), allowing us to discern patterns of peak clustering in relation to the control. By performing hierarchical cluster analysis (HCA) (see below) on Pearson’s correlation coefficients, we delineated main clusters that reflect the grouping tendencies of these functional group-related bands. We computed both Pearson’s correlation coefficients and their statistical significance using the rcorr (0.92) function from the Hmisc (5.1-3) package in R (4.4.0). The resulting correlation matrix was visualized through a correlogram generated by the corrplot function from the corrplot package, enabling a clearer interpretation of the clustering patterns and relationships among these IR spectral features [18].

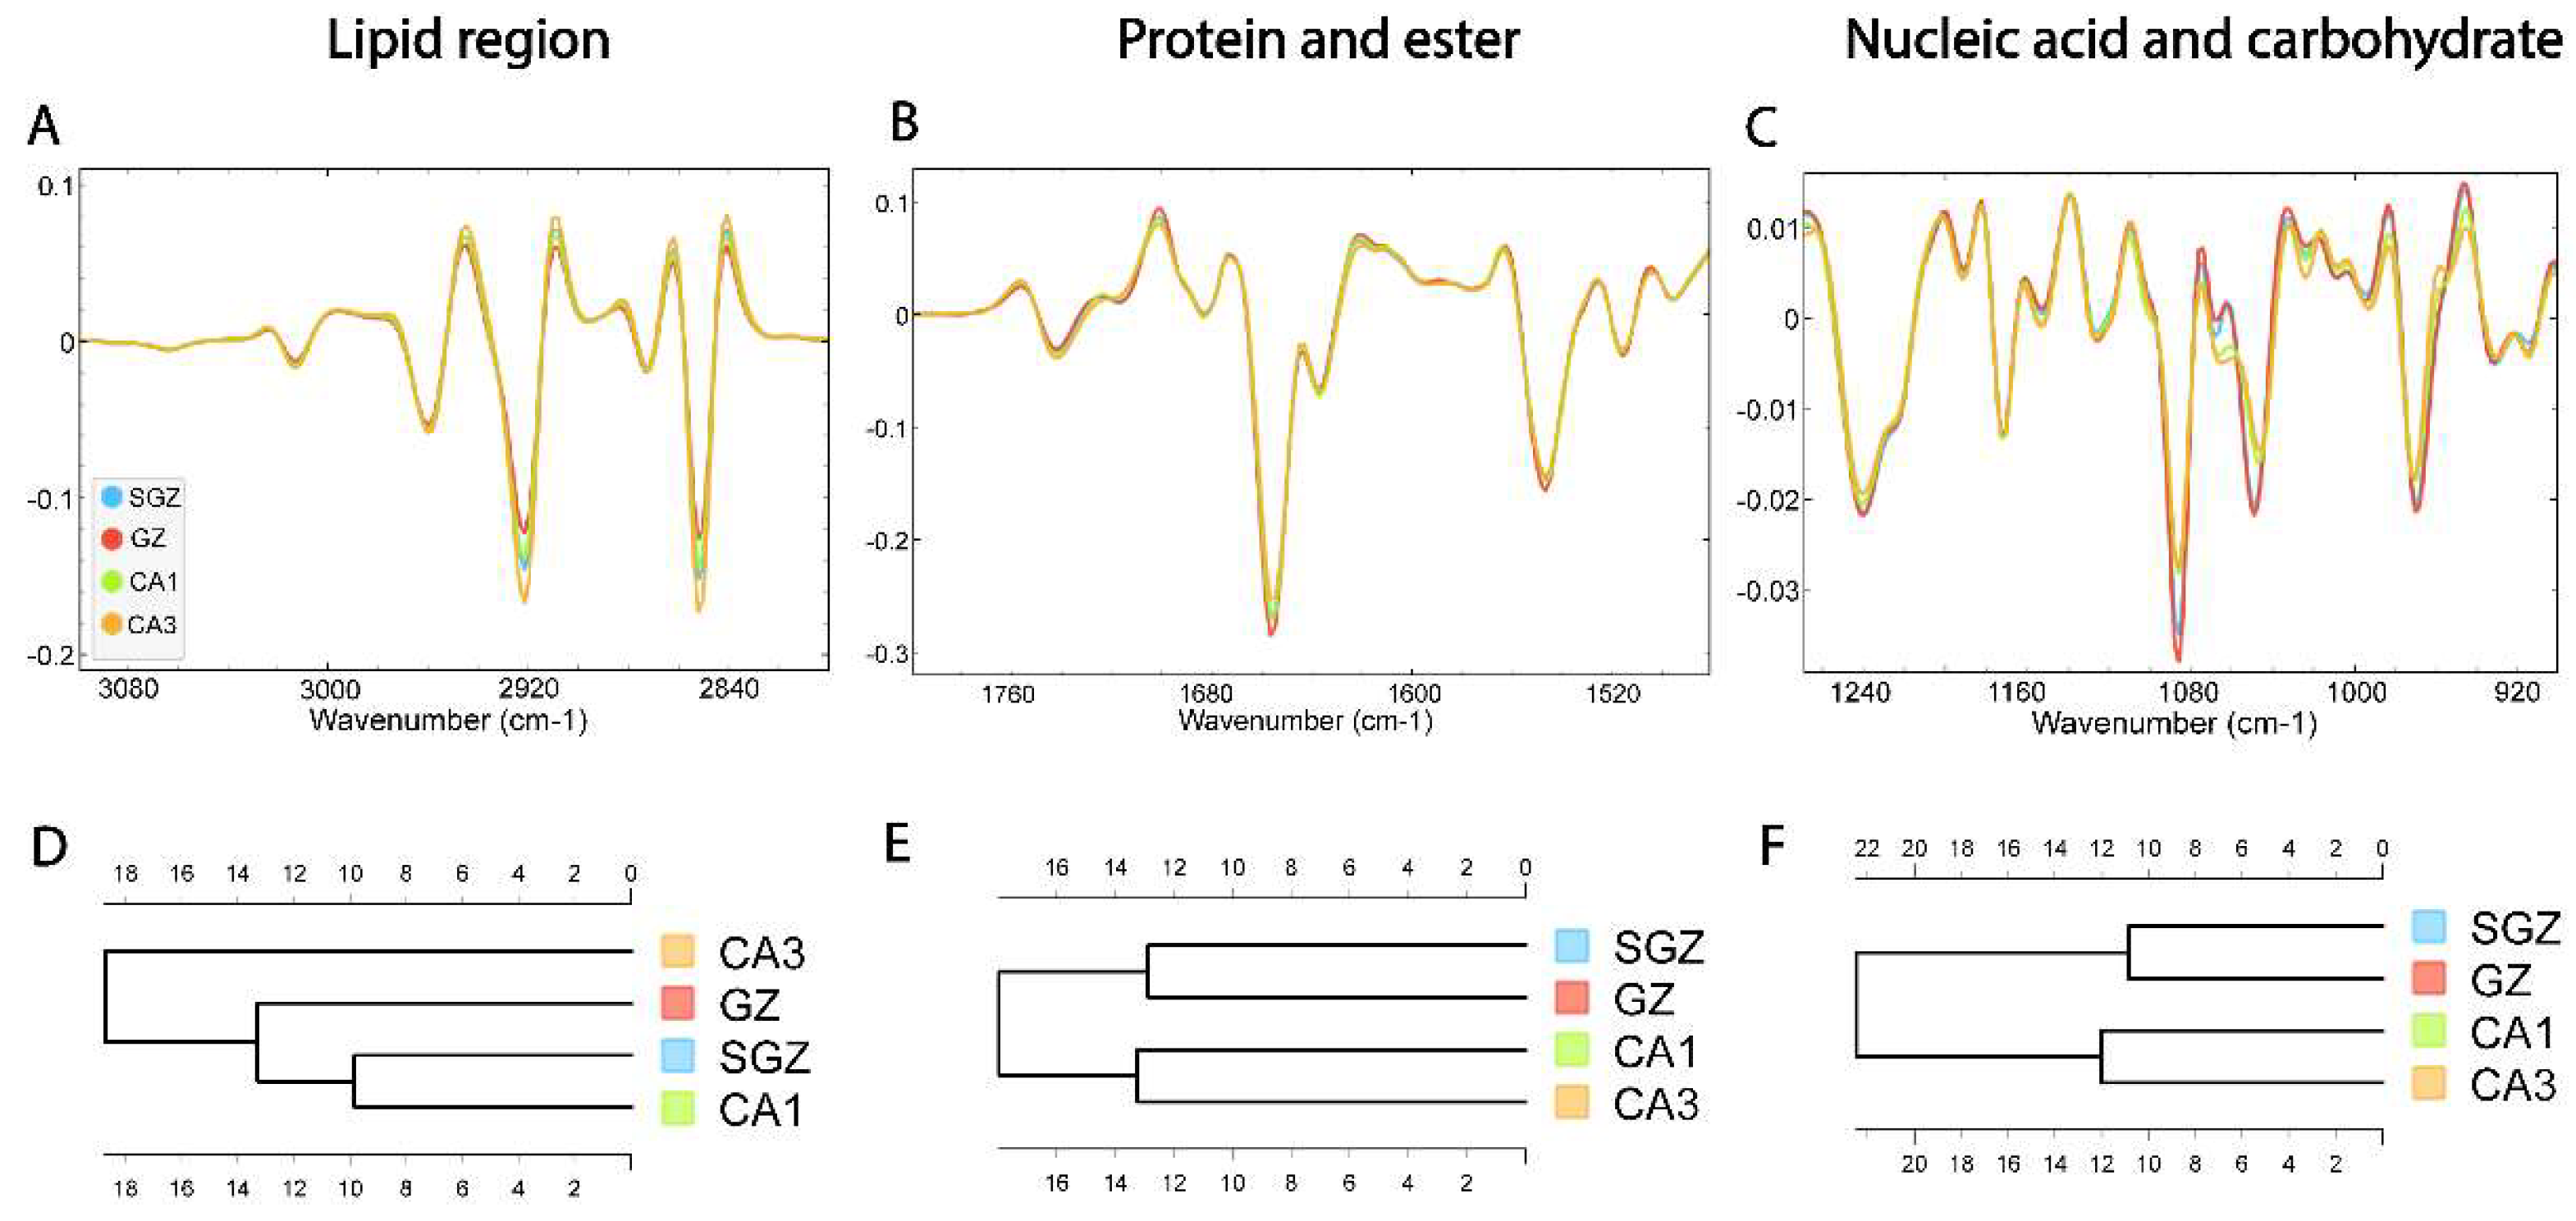
2.3.3.2. Hierarchical Cluster Analysis

To uncover the intricate biomolecular relationships within distinct hippocampal layers or experimental groups, HCA was employed to compare the spectral profiles. In preparation for this similarity-based clustering, we applied a second derivative transformation and vector normalization to the raw spectra, following established procedures [19]. These preprocessing steps enhanced subtle differences and enabled a more reliable wavenumber-by-wavenumber comparison across all groups.
The entire spectral range was divided into three key intervals — lipid (3100–2800 cm-1), protein and ester (1800–1480 cm-1), and nucleic acid and carbohydrate (1270–800 cm-1) — to emphasize distinct biochemical signatures. To determine how clusters should form or split, Euclidean distances were calculated between the average spectra of these selected regions or experimental groups, yielding a matrix of pairwise differences. The resulting distance matrix was then visualized as a dendrogram, constructed using Ward’s linkage to reveal the clustering [20]. As clusters emerged along a heterogeneity scale, spectra with greater similarity converged into cohesive groups, thus highlighting underlying biochemical patterns among the hippocampal layers or experimental groups, respectively.

2.3.3.3. Principal Component Analysis

Principal component analysis (PCA) is commonly used as it provides dimensionality reduction for interpreting and visualizing the structure of high-dimensional data. Besides dimensionality reduction, PCA is also utilized for feature selection, in combination with other analysis techniques [20]. The term “PCA (factor) loadings” refers to the coefficients or weights associated with each original variable. They were useful in determining the relationship between the original variables (in this case, wavenumbers) and the new, reduced set of variables (the principal components - PC). In this sense, large (either positive or negative) loadings indicate that a particular wavenumber is highly correlated with a principal component (in all experimental groups, as hypothesized). It also indicates that wavenumbers with comparable loadings contribute in an equivalent manner to the formation of the respective principal components. The sign and magnitude of the factor loadings may therefore provide information about the underlying structure and dynamics of the data (which could indicate that they are part of the same feature or process).
PCA was conducted on pre-processed spectral data encompassing key biomolecular domains: lipids (3100-2800 cm-1), protein and ester (1800-1480 cm-1) and nucleic acids and carbohydrate absorption (1270-800 cm-1). Before this analysis, raw spectra spanning 3100–800 cm-1 were refined using a second derivative transformation (Savitzky–Golay filter, 9-point smoothing, third-order polynomial) and vector normalization. By applying the second derivative, baseline contributions are effectively reduced, and broad, overlapping absorption bands become more distinctly resolved.

2.3.3.4. Linear Discriminant Analysis

Building upon the principal components obtained through PCA, a supervised classification approach — Linear discriminant analysis (LDA) — was then applied to enhance class separation and highlight subtle differences among the hippocampal layers or experimental groups, respectively [21,22].By projecting the data onto directions that maximize the separation between predefined classes, LDA addresses the limitations of PCA, which as an unsupervised method does not consider class differences [23]. The resulting PC-LDA score plots offer a clearer visual representation of how each layer’s or experimental group’s spectra diverge along the discriminant axes.
To further distinguish the factors underlying these separations, cluster vectors were derived from the PC-LDA loadings. These vectors detail the contribution of each PC to class differentiation, allowing us to pinpoint the specific spectral regions that are most influential in distinguishing the hippocampal layers or experimental groups, respectively [24].

2.3.3.5. Random Forest

In addition, we extend our supervised learning framework by incorporating a Random Forest (RF) classification approach to FTIR spectral data obtained from distinct brain regions and experimental conditions, aiming to refine our statistical modeling of class distinctions [25]. RF is an advanced ensemble machine learning method that constructs multiple decision trees during training and aggregates their outputs to produce a classification result. Beyond class prediction, it also assigns importance ranking to each feature — a particularly valuable attribute when dealing with FTIR data, where wavenumbers serve as features. Moreover, its resilience to overfitting and capacity to handle large feature sets make RF especially suitable for this type of spectral analysis.
Our RF models were trained using Quasar [25] on labeled spectral datasets, leveraging bootstrap aggregation (“bagging”) to enhance generalization and accuracy. By incorporating random subsets of both samples and features, the model reduces variance across its constituent trees and improves classification performance.
For the analysis, we employed second derivative spectra with vector normalization, focusing on three key spectral intervals: lipid (3100–2800 cm-1), protein and esters (1800–1480 cm-1), and nucleic acid and carbohydrate (1270–800 cm-1) regions. Within each region, RF identified the most influential wavenumbers — the specific spectral features that maximize the discriminative power between classes — thus providing insight into the biochemical differences underlying each classification.

2.3.3.5. Statistics

For numerical comparisons of band area and peak positions of absorption bands associated with lipids, proteins and nucleic acids were analyzed. Raw spectra were preprocessed by performing rubber band baseline correction and vector normalization. Afterwards, functional groups were separately analyzed by calculating the bend area on Table 1. The significance of the differences among different groups were calculated using the Kruskal-Wallis test with Dunn’s post hoc test in Graph Pad Prism 6 software (Northampton, MA, USA). Differences were considered significant with p < 0.05.

2.4. Immunofluorescence

2.4.1. Tissue Preparation and Immunostaining

Adult animals were anesthetized by intraperitoneal injection of ketamine (0.1 ml/100 g b.w.) and xylazine (0.01 ml/100 g b.w.). Transcardial perfusion was performed under anesthesia with PBS followed by a 4% formaldehyde solution (Sigma-Aldrich) in PBS. Brains were postfixed in 4% formaldehyde solution for 48 h at 4°C. Tissues were cryopreserved in 30% sucrose solution in 0.1 M phosphate buffer, pH 7.4 at 4°C and frozen at -80°C. Coronal sections of 30-µm thickness were cut with a cryostat (CM1850, Leica Microsystems, Wetzlar, Germany) and placed on slides (Superfrost Plus, Menzel Glaser, Germany). After washing in PBS, the sections were incubated for 45 minutes at room temperature in the blocking solution containing 5% non-immune donkey serum and 0.2% Triton X-100 in PBS. Sections were then incubated with the primary rabbit anti-tenascin C antibody (TnC, 1:500, AbDSerotec, Duesseldorf, Germany) overnight at 4˚C. After washing in PBS, the sections were incubated with the secondary antibody donkey anti-rabbit AlexaFluor 488 (1:200, Invitrogen, Carlsbad, USA). After washing in PBS at room temperature, slides were dried and covered with coverslip mounting medium (Mowiol, Sigma Aldrich). For all immunohistochemical reactions, the sections from all experimental groups were processed in parallel. In addition, TO-PRO 3 (1:2000; Invitrogen, Cat. No. T3605) nuclear staining was used to identify the corresponding regions in all experimental groups.

2.4.1. Tissue Preparation and Immunostaining

2D images of immunostained sections were acquired with a confocal laser scanning microscope (Zeiss LSM 510) where Argon multiline laser (457, 478, 488 and 514 nm) was used for the excitation of Alexa Fluor 488, and Helium-Neon laser (633 nm) for the excitation of TO-PRO3. Laser intensity, pinhole aperture, scanning speed, digital gain, and offset were kept constant throughout the acquisition. After acquisition, images were processed in ImageJ software. To estimate the density of the TnC signal, we calculated the ratio of the mean TnC signal intensity and analyzed the area of the SGZ. We used the parametric Student’s t-test (with Welch’s correction) for statistical analysis with Graph Pad Prism 6 software (Northampton, MA, USA).

3. Results

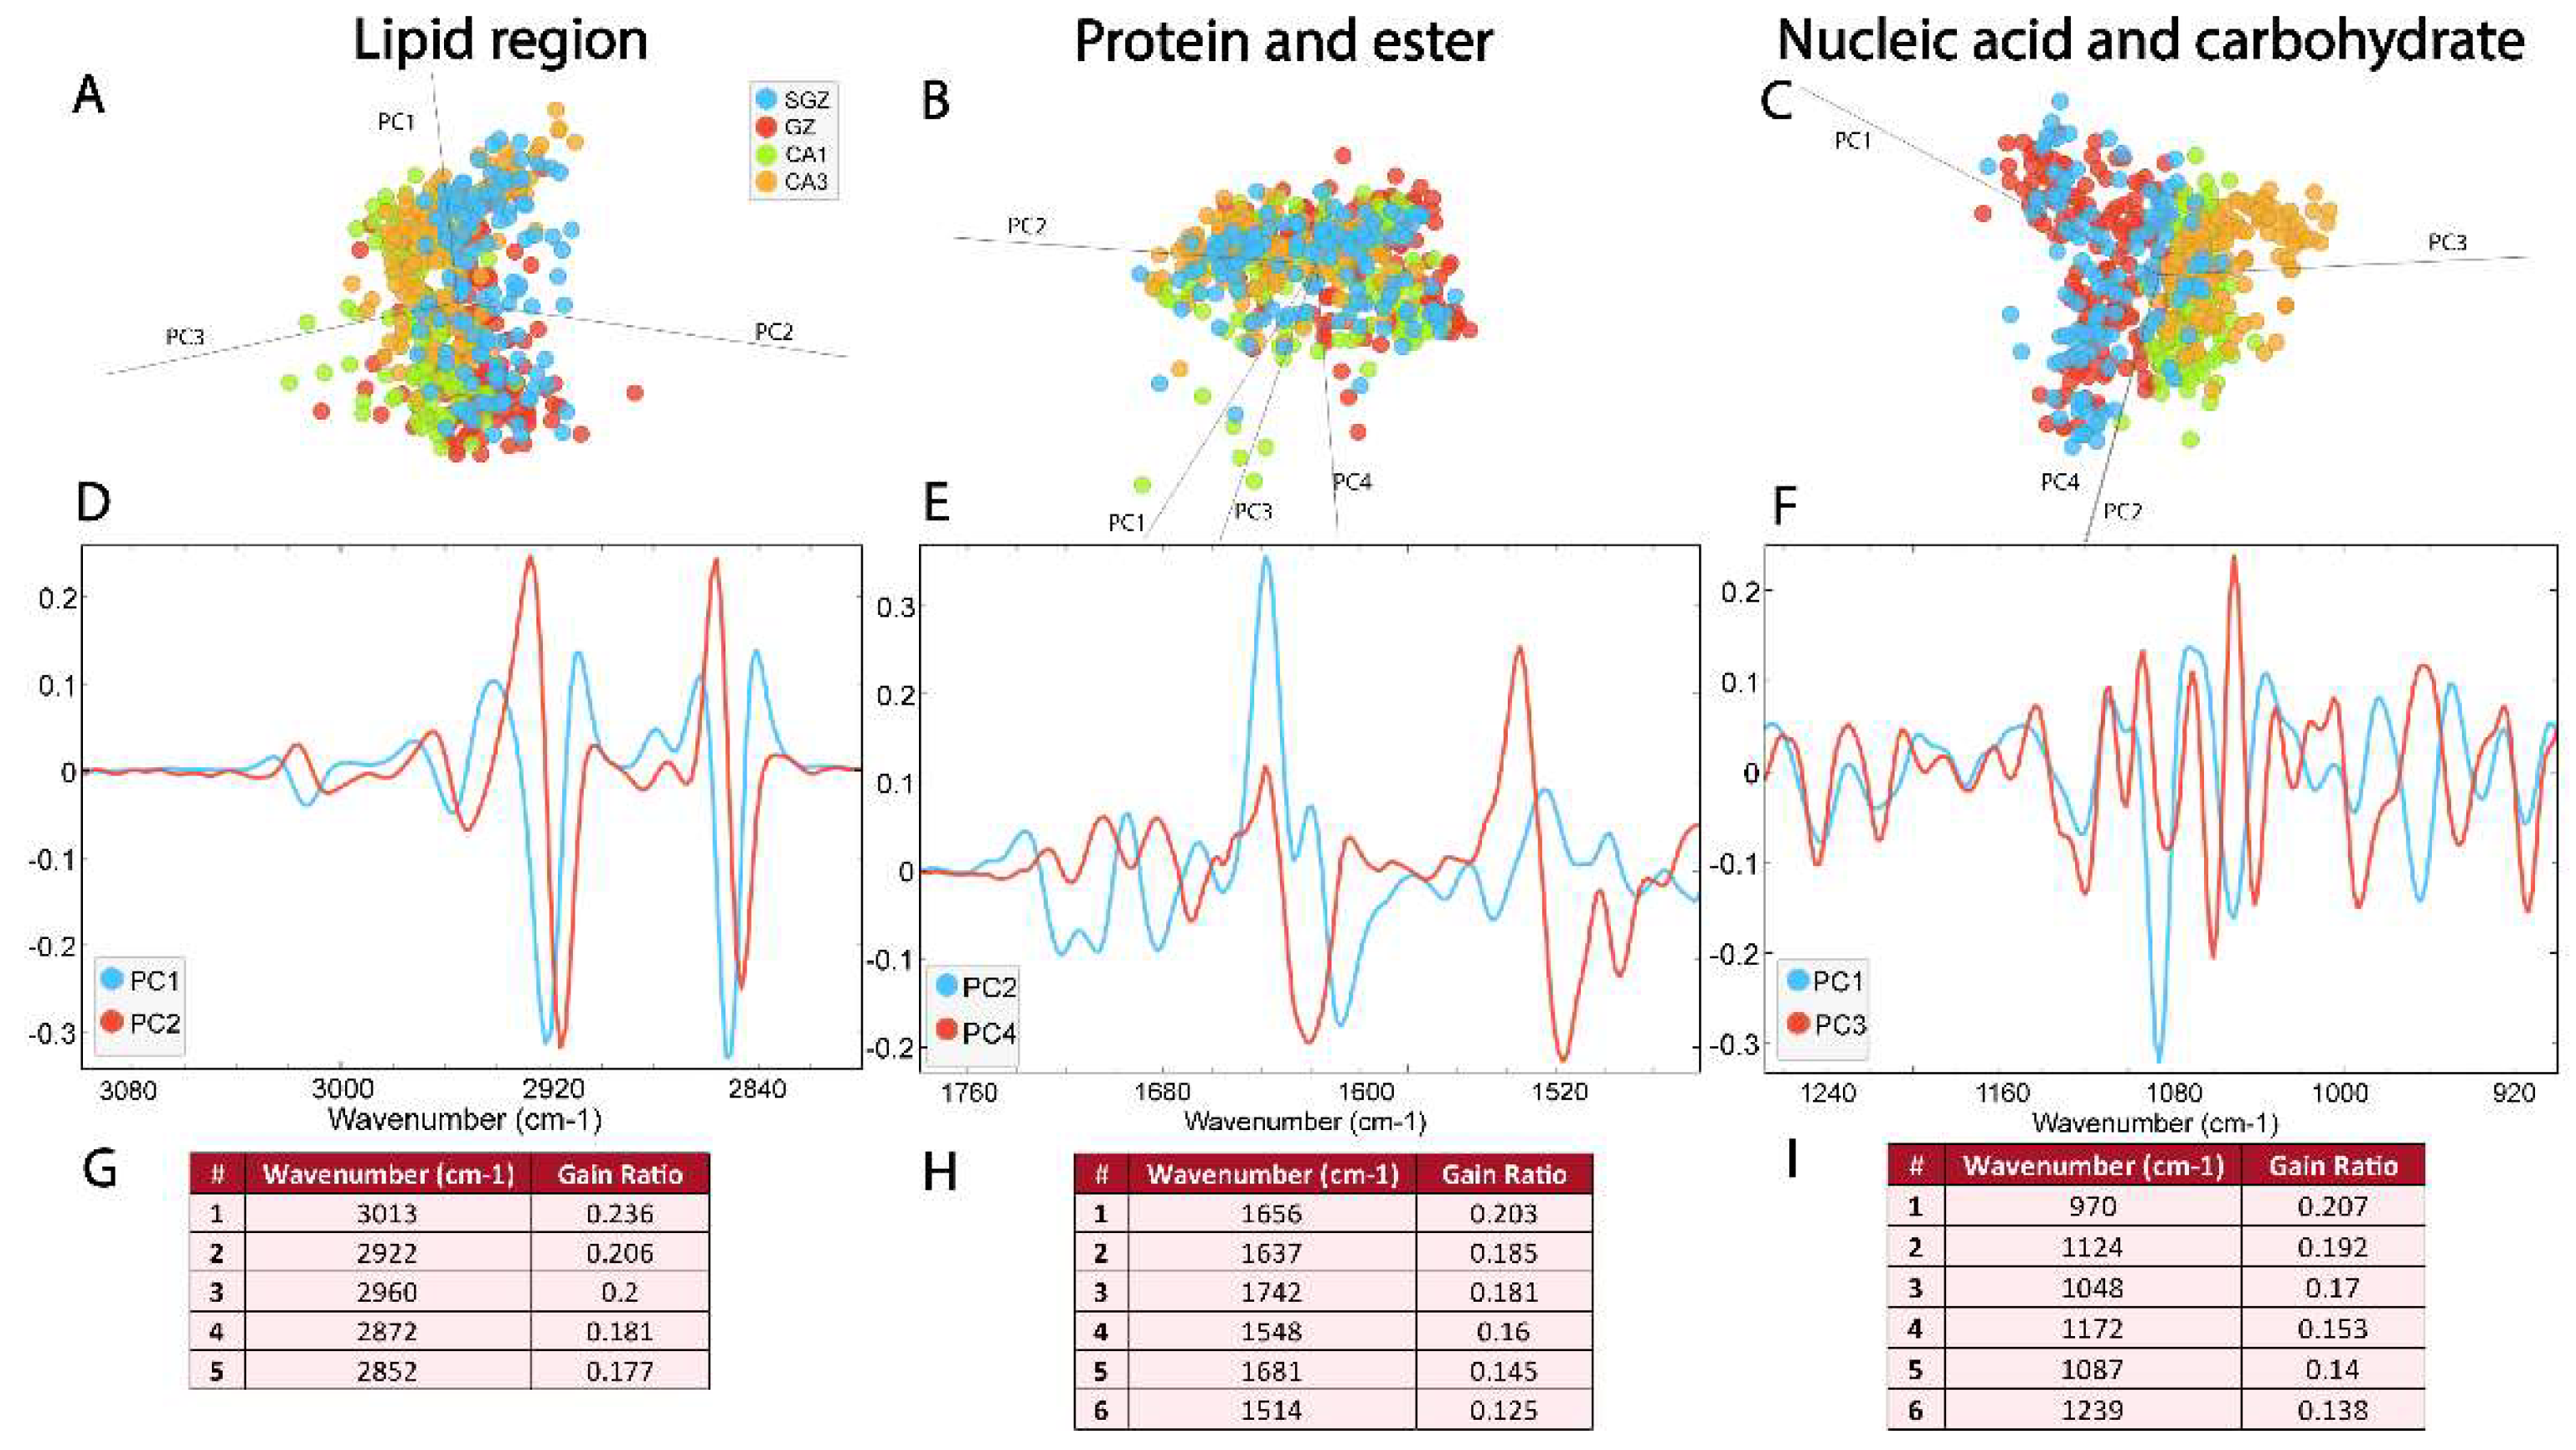
3.1. Correlation Analysis of FTIR Spectral Data Between Hippocampal Layers

The whole spectrum (3100-800 cm-1) of the freeze-dried hippocampus tissue was characterized with 15 bands (Figure 1) which were assigned to specific vibrational modes of functional groups (Table 1). The SGZ, GZ, CA1 and CA3 layers contained all 15 peaks so the variation patterns at these specific bands within the spectra were analyzed. Peak correlation analysis was performed between pairs of data, using always the SGZ as control group (Figure 2). Consequently, peaks were grouped into clusters based on Pearson’s correlation coefficient. The SGZ vs. GZ and SGZ vs. CA1 comparison showed the same pattern of clustering, while SGZ vs. CA3 comparison pointed to a different clustering of peaks originating from the nucleic acid absorption region of the spectra. Namely, five main clusters were found with significant Pearson’s correlation coefficients greater than 0.58 for all band pairs (Figure 2). Clusters 1 and 2 (counting from the top of the matrix) were comprised of single peaks 7 and 8, corresponding to Amide I and Amide II bands, respectively. The third cluster consisted of peaks 1 to 6, all assigned to lipids. The main difference in the correlation plots was observed in the clustering of peaks 12 and 13, primary related to the nucleic acid and carbohydrate content. More specifically, in the case of SGZ vs. GZ and SGZ vs. CA1 comparison, peaks 12 and 13 were clustered together with peaks 9, 10 and 11, assigned to proteins. However, in the SGZ vs. CA3 comparison, peaks 12 and 13 were clustered together with peaks 14 and 15 that originate from vibrations from nucleic acids bonds, which indicates that nucleic acids contribute to a greater extent.
The correlation analysis showed that the peaks originating from proteins and lipids always formed the same clusters, while the differences between the spectra were in the fingerprint range (1400-800 cm-1) and related to the peaks associated with nucleic acids. Comparison of the SGZ with GZ and CA1 resulted in the same clustering of peaks, indicating the similarities of the spectra. The specificities in the CA3 spectrum led to different clustering in the SGZ vs. CA3 comparison in the nucleic acid region, pointing out that the CA3 is the most different layer from the SGZ. Following correlation analysis, HCA was conducted on the processed spectra. The dendrograms were constructed based on average spectra of selected spectral regions — lipid (3100-2800 cm-1), protein and ester (1800-1480 cm-1) and nucleic acid and carbohydrate (1270-800 cm-1) — originating from different hippocampal layers (Figure 3A-C). The dendrogram based on spectra acquired in the lipid region revealed that the SGZ has the highest degree of similarity with CA1 (Figure 3D). In the protein and nucleic acids region the same clustering pattern was observed. The SGZ and GZ layers were grouped together into the first main cluster, and CA1 and CA3 formed the second one (Figure 3E, F).
In summary, depending on the biomolecular spectral origin, hierarchical clustering analysis revealed that the SGZ closely resembled the GZ in protein and nucleic acid composition and CA1 in lipid composition. On the other hand, CA3 consistently did not form a cluster with the SGZ.

3.2. Similarity of Hippocampal Layers

Following correlation analysis, HCA was conducted on the processed spectra. The dendrograms were constructed based on average spectra of selected spectral regions — lipid (3100-2800 cm-1), protein and ester (1800-1480 cm-1) and nucleic acid and carbohydrate (1270-800 cm-1) — originating from different hippocampal layers (Figure 3A-C). The dendrogram based on spectra acquired in the lipid region revealed that the SGZ has the highest degree of similarity with CA1 (Figure 3D). In the protein and nucleic acids region the same clustering pattern was observed. The SGZ and GZ layers were grouped together into the first main cluster, and CA1 and CA3 formed the second one (Figure 3E, F).
In summary, depending on the biomolecular spectral origin, hierarchical clustering analysis revealed that the SGZ closely resembled the GZ in protein and nucleic acid composition and CA1 in lipid composition. On the other hand, CA3 consistently did not form a cluster with the SGZ.

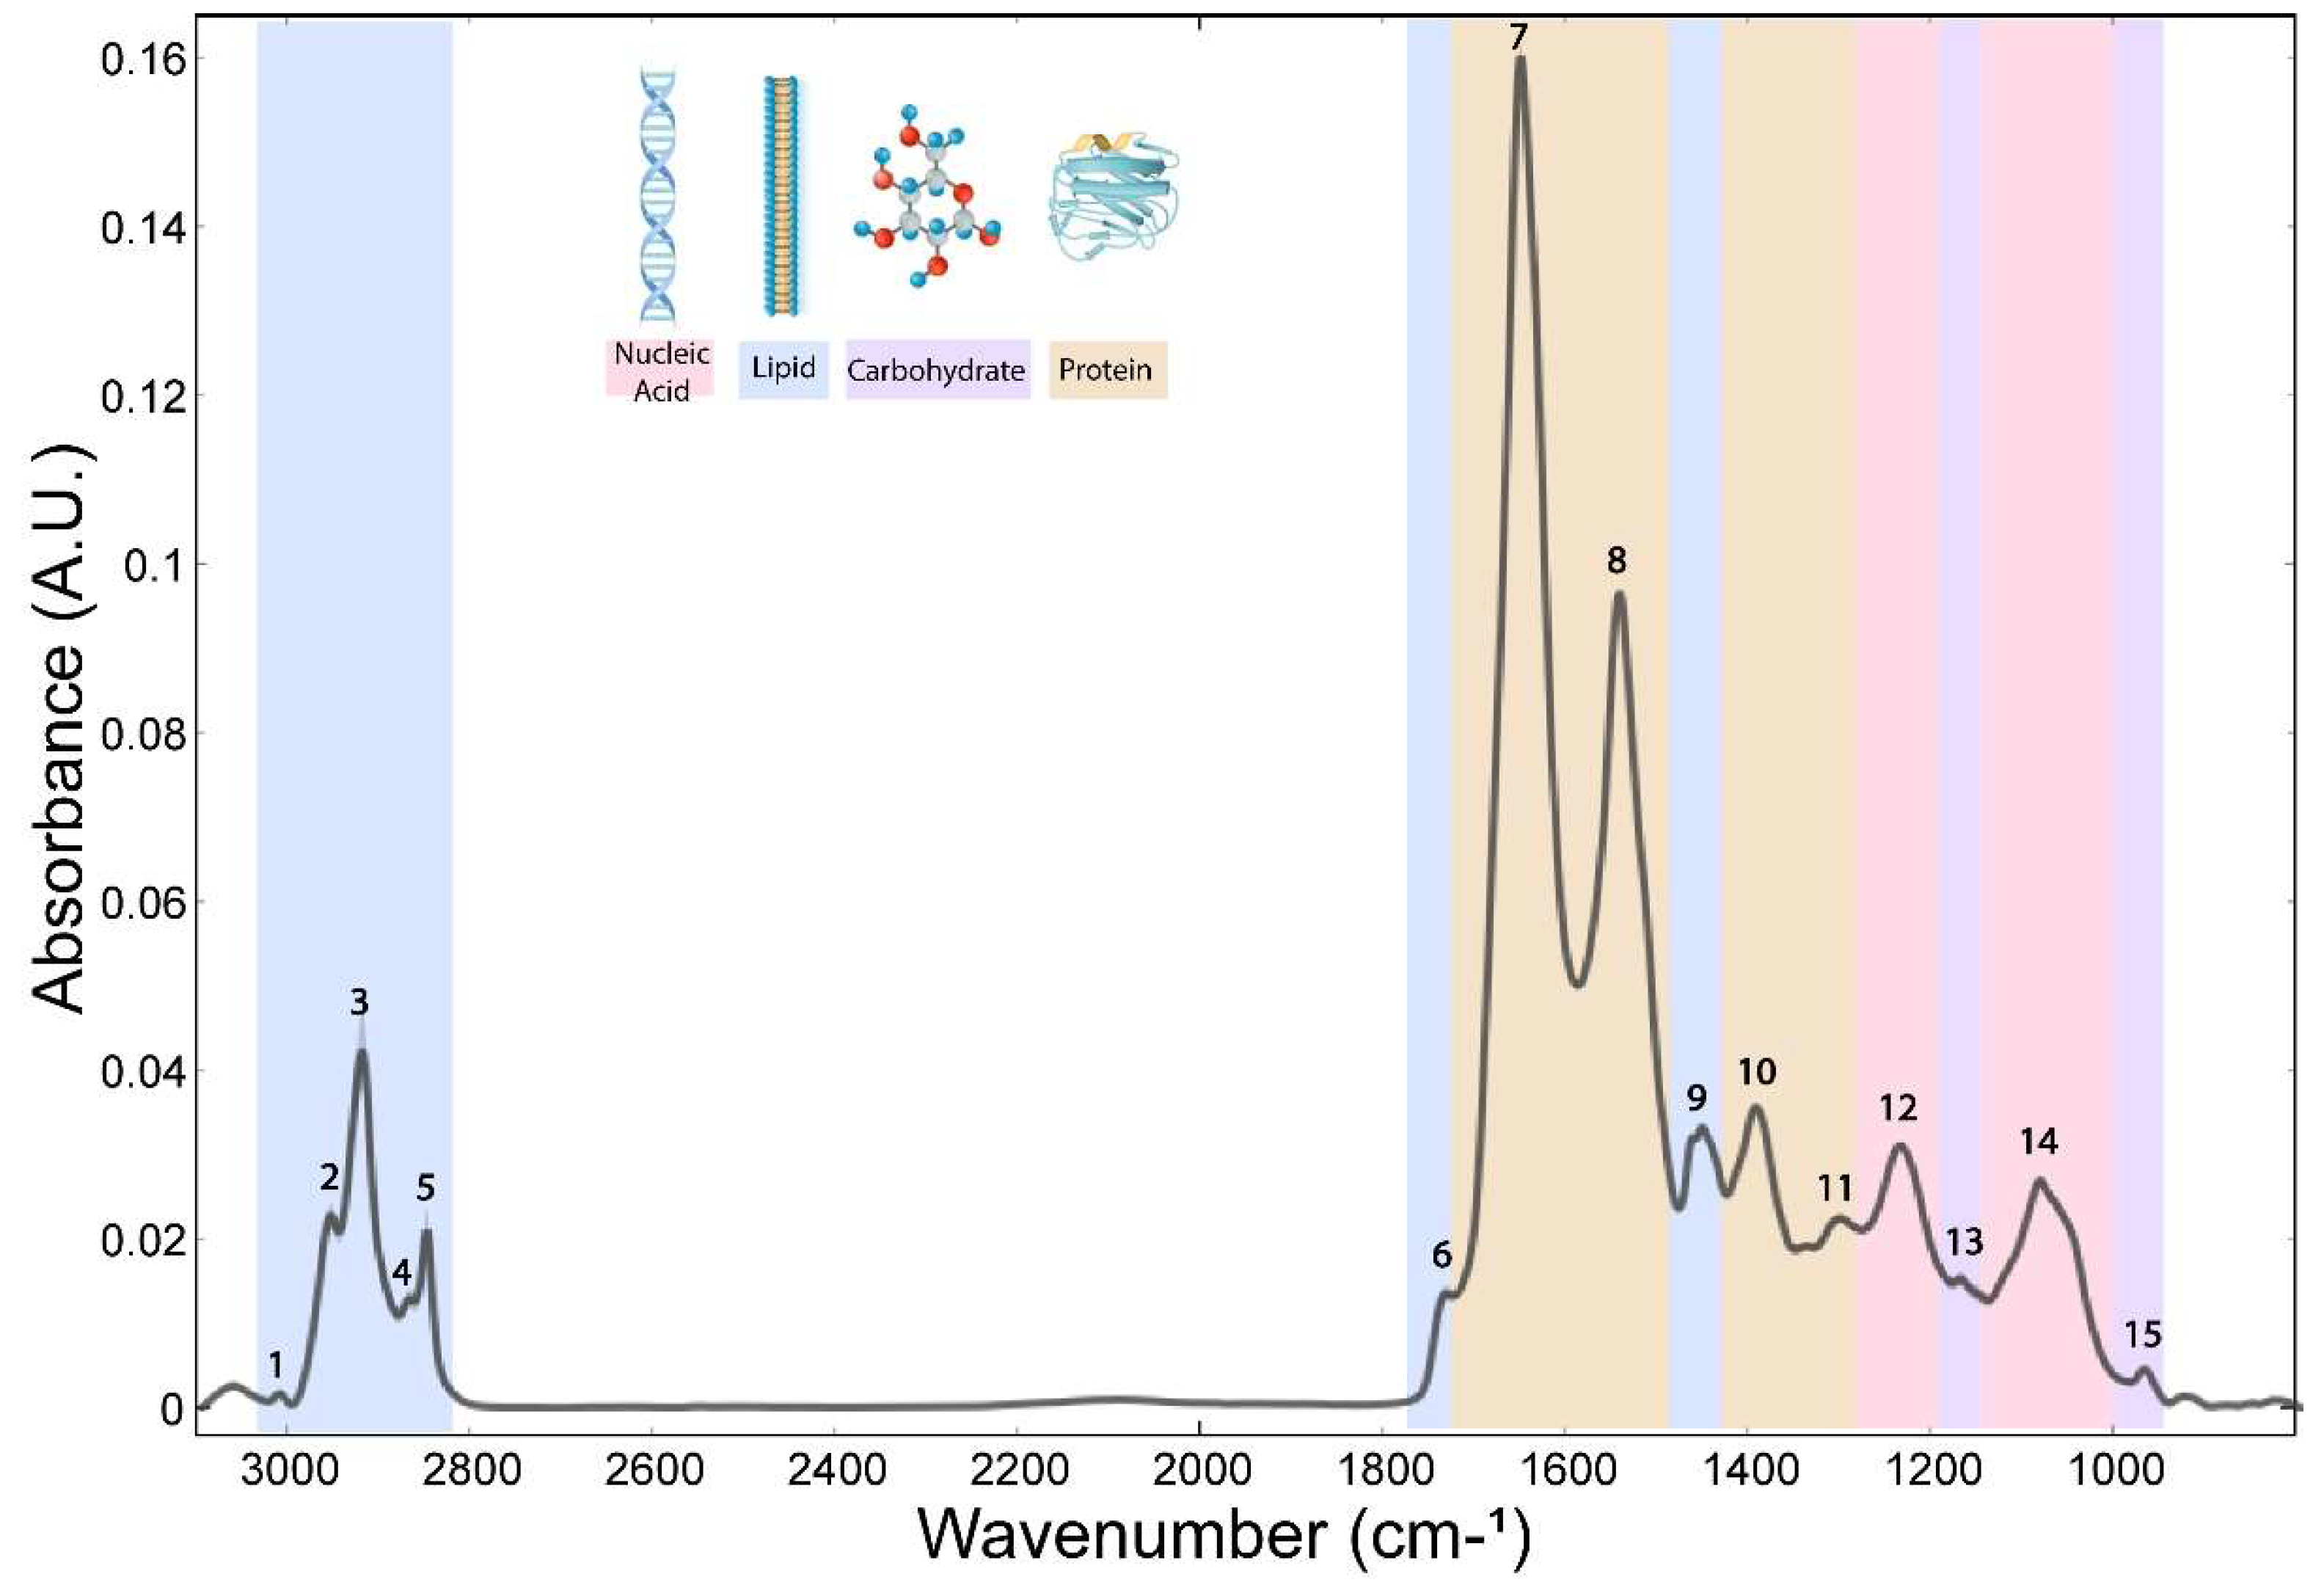
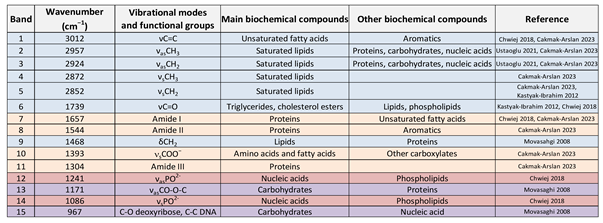
3.2. Biomolecular Characterization of Hippocampal Layers

Further analysis focused on examining the differences between the layers. It is important to highlight that the spectra of the SGZ, GZ, CA1 and CA3 show high qualitative similarity, in terms of presence of specific bands, so the variability of the data originated from the differences detected in the position and intensity of specific bands.
PCA analysis was supplemented with LDA in order to maximize the differences between predefined classes, thereby improving the visual separation between the groups [22]. Also, RF classification was used to understand which bands are the most important for classification.
The PCA-LDA score plots showed that the first three principal components, which accounted for 98% of the variance, contributed to the separation of the data within the lipid region (3100-2800 cm-1) (Figure 4A, SI Figure S1A). Loadings plot showed a contribution of νs and νasCH2 bands located on PC1 and PC2 (Figure 4A), as well as CH3 and C=C bands. They also pointed out to the minima at ∼2922 cm−1, ∼2852 cm−1, ∼2956 cm−1 for PC1 (and PC2 as well) and a maximum at ∼2872 cm−1 (Figure 4D, SI Table S1). In agreement with these results, RF classification confirmed that bands originating from saturated lipids were the most important features for the origin of the biomolecular differences in hippocampal structural formations. Specifically, CH2 bands received the highest feature importance ranking in the RF classification, followed by CH3 and C=C bending bands. (Figure 4G).
Within the protein and ester region, bands originating from carbonyl groups, as well as Amide I and II were detected. Figure 4B illustrates the distribution of the data in this region (1800–1480 cm-1), as described by the first four principal components, which account for 97% of the data variance. The average spectra of the second derivatives and the score plots exhibit prominent overlap (Figure 3, 4B, SI Figure S1B). However, the loadings plots revealed differences between four hippocampal layers in the secondary protein structure, identifying peak maxima for PC2 at ~1656 cm-1, ~1637 cm-1, ~1514 cm-1 and ~1681 cm-1, and for PC4 at ~1742 cm-1, ~1548 cm-1 (Figure 4E, SI Table S1). Furthermore, RF classification ranked peaks at ~1656 cm-1 and ~1637 cm-1 from Amide I band, corresponding to α-helix and β-sheet, respectively, as the most important features explaining the differences among the layers (Figure 4H).
The most prominent differences between four hippocampal layers were detected in the nucleic acid region (1270-800 cm-1) where proteins and carbohydrates also contribute to absorption. The PCA-LDA score plots demonstrated separation of the layers based on four PCs, which account for 97% of data variance (Figure 4C, SI Figure S1C). Analysis of individual absorbance contributions to PCA showed relevant vibrational bands at ~1086 cm-1, ~1046 cm-1, ~970 cm-1, ~1172 cm-1, and ~1243, cm−1, observed as minima on PC1 (Figure 4F, SI Table S1). Furthermore, RF rankings indicated that peaks at ~1086 cm-1 and ~1046 cm-1 from νs phosphate band — corresponding to nucleic acid and carbohydrate — and ~970 cm-1 — corresponding to nucleic acids — have the largest contribution to classification (Figure 4I).
In essence, the main peaks ranked by RF classification correspond to the most significant peaks observed in the PCA loadings plot (Figure 4 G, H, I). As our results demonstrate, multivariate analysis (Figure 3 and 4) successfully separated the SGZ, GZ, CA1, and CA3 hippocampal layers based on their biomolecular fingerprints and confirmed the feasibility of detecting subtle differences in the hippocampal layers using SR-FTIR.
When significant spectral differences are present, the integrated band area method is commonly used for analysis, enabling straightforward interpretation. We thus examined integrated band areas to assess relative changes in biomolecule content within hippocampal layers. This analysis aimed to compare our findings with those of Chwiej and colleagues in order to validate SR-FTIR spectroscopy for identifying hippocampal layers [14].
We analyzed the integrated band area of the absorption bands in the 2800–3100 cm-1 range to detect changes in lipid content. The C=C band (~3014 cm-1), provides information about the unsaturated lipid content. Lipid peroxidation primarily takes place at the double bond sites of polyunsaturated fatty acids, causing a decrease in the amount of unsaturated lipids. As seen from Table 2A, there are significant differences in the unsaturated lipid content in different layers of the hippocampus. Nevertheless, SGZ and CA1 layers show no significant difference in C=C band content, which is in accordance with the HCA results that showed the greatest similarity between these two layers in the lipid region (3100-2800 cm-1). The same trend was observed in the case of the carbonyl ester (~1742 cm-1) (Table 2B) referring to the content of carbonyl groups in triglycerides or cholesterol esters in this group.
Nucleic acids mainly absorb in the spectral area between 1270 and 800 cm-1, with a contribution from phospholipids, with the changes in the shape, position or intensity of associated bands providing information about structural integrity of nucleic acids. This study reports minor changes in the band area of νs and νas PO2- , and C-O deoxyribose bends, and significant changes in the position of νs PO2- band (Table 2 C-F).

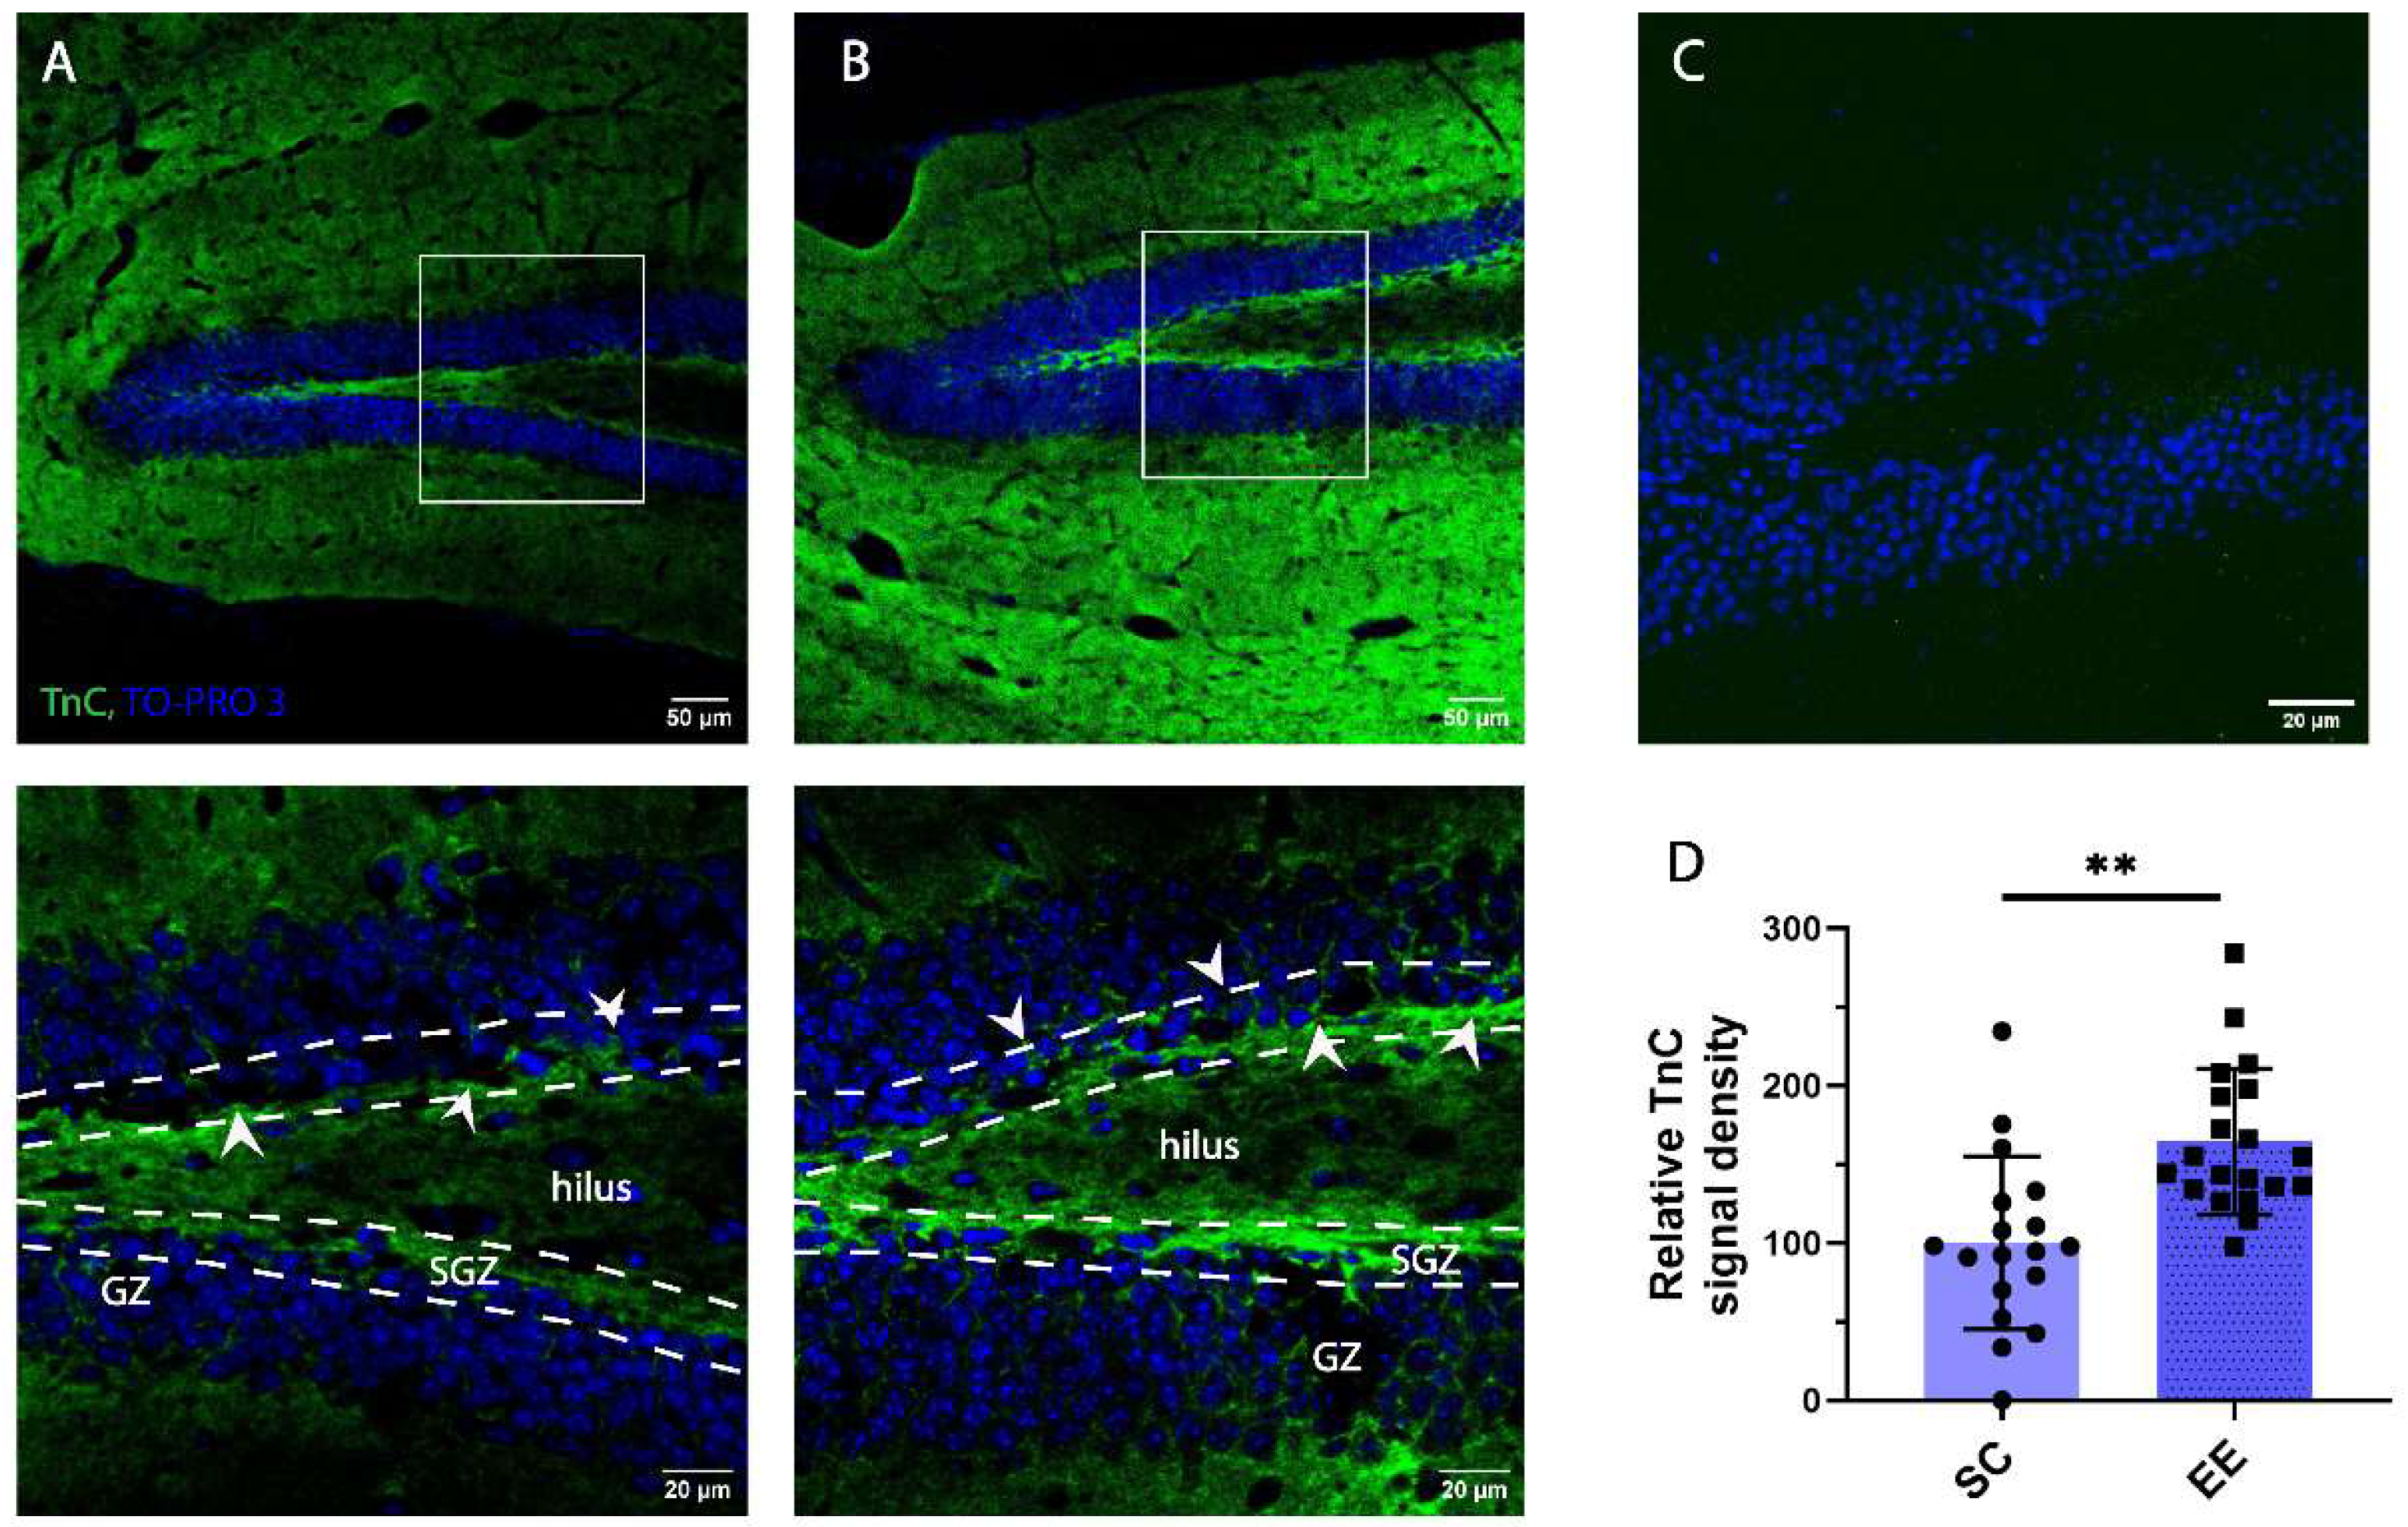
3.3. Expression of Tenascin C in Adult SGZ

TnC expression has been reported to decrease with age and to be restricted to areas of functional plasticity and active neurogenesis [26]. To localize the expression of TnC in the DG of adult mice, we used immunostaining for TnC, and TO-PRO 3 as a counterstaining. We found that TnC expression in the DG hilus is localized as a dense formation along the GZ, but also around the granule cells in the first few cell layers of the GZ (arrows in Figure 5). TnC immunostaining was undetectable in adult TnC KO mice (Figure 5C), confirming the specificity of the antibody.
To address the question of whether EE affects the expression of TnC in the DG of adult mice, we compared samples of wild type mice housed in two different conditions — EE and SC. After comparing the immunostained slides from EE and SC, we found that EE had a positive effect on the expression of TnC in the SGZ of adult wild type mice by increasing the density of the TnC signal (Figure 5D).

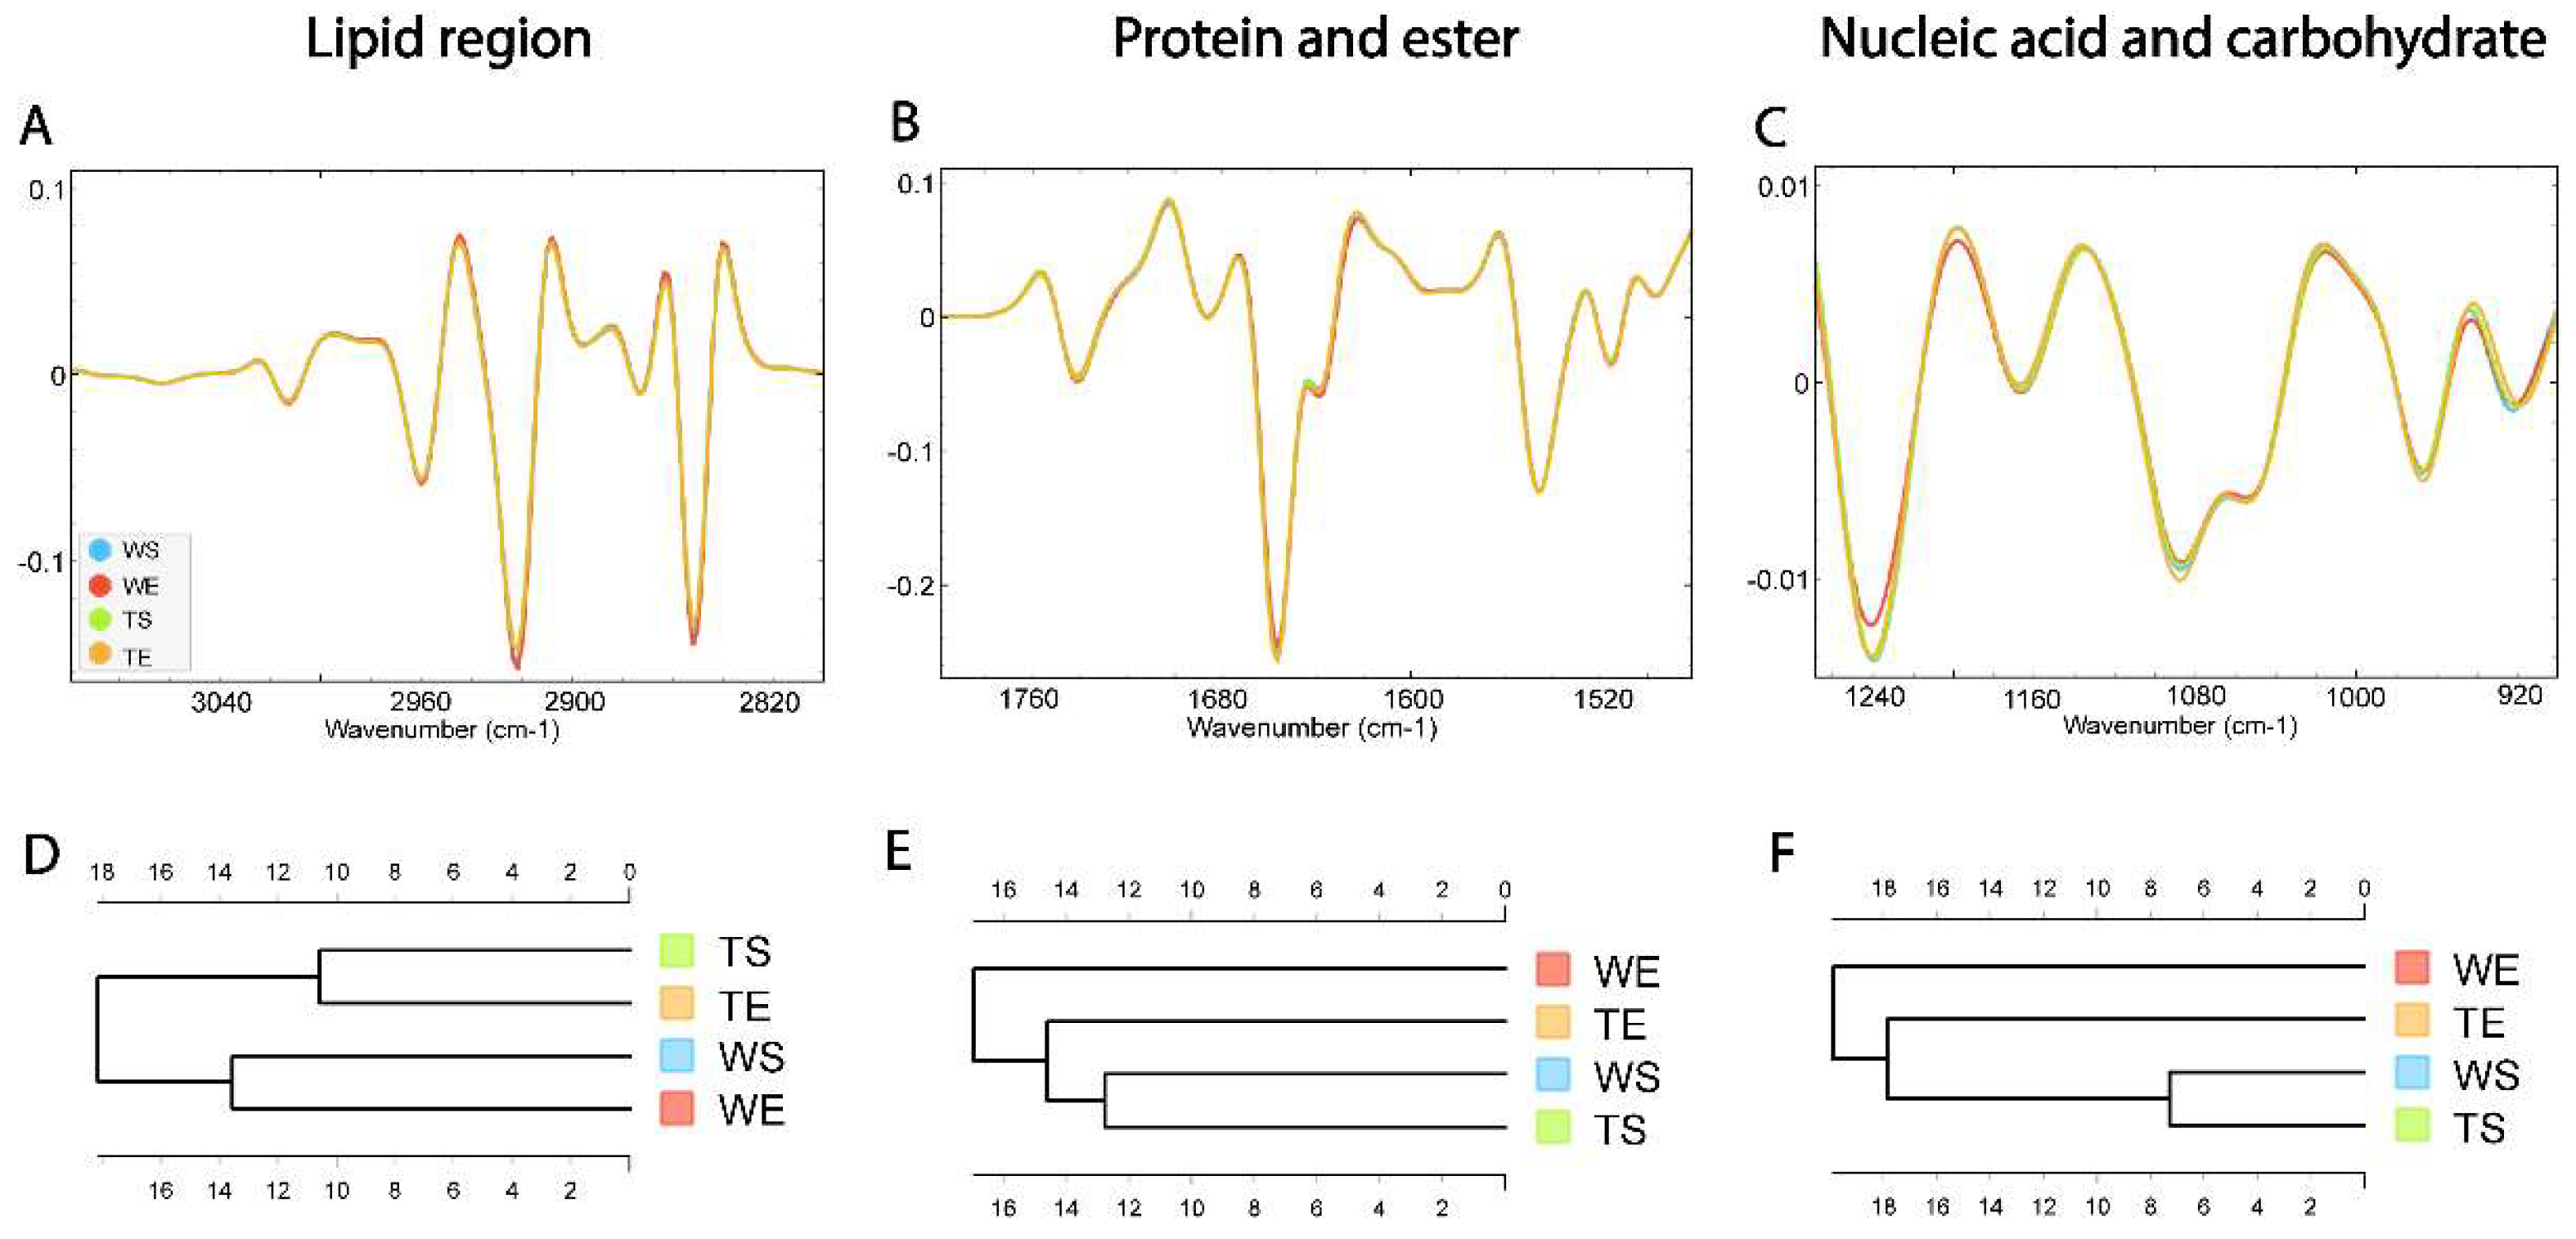
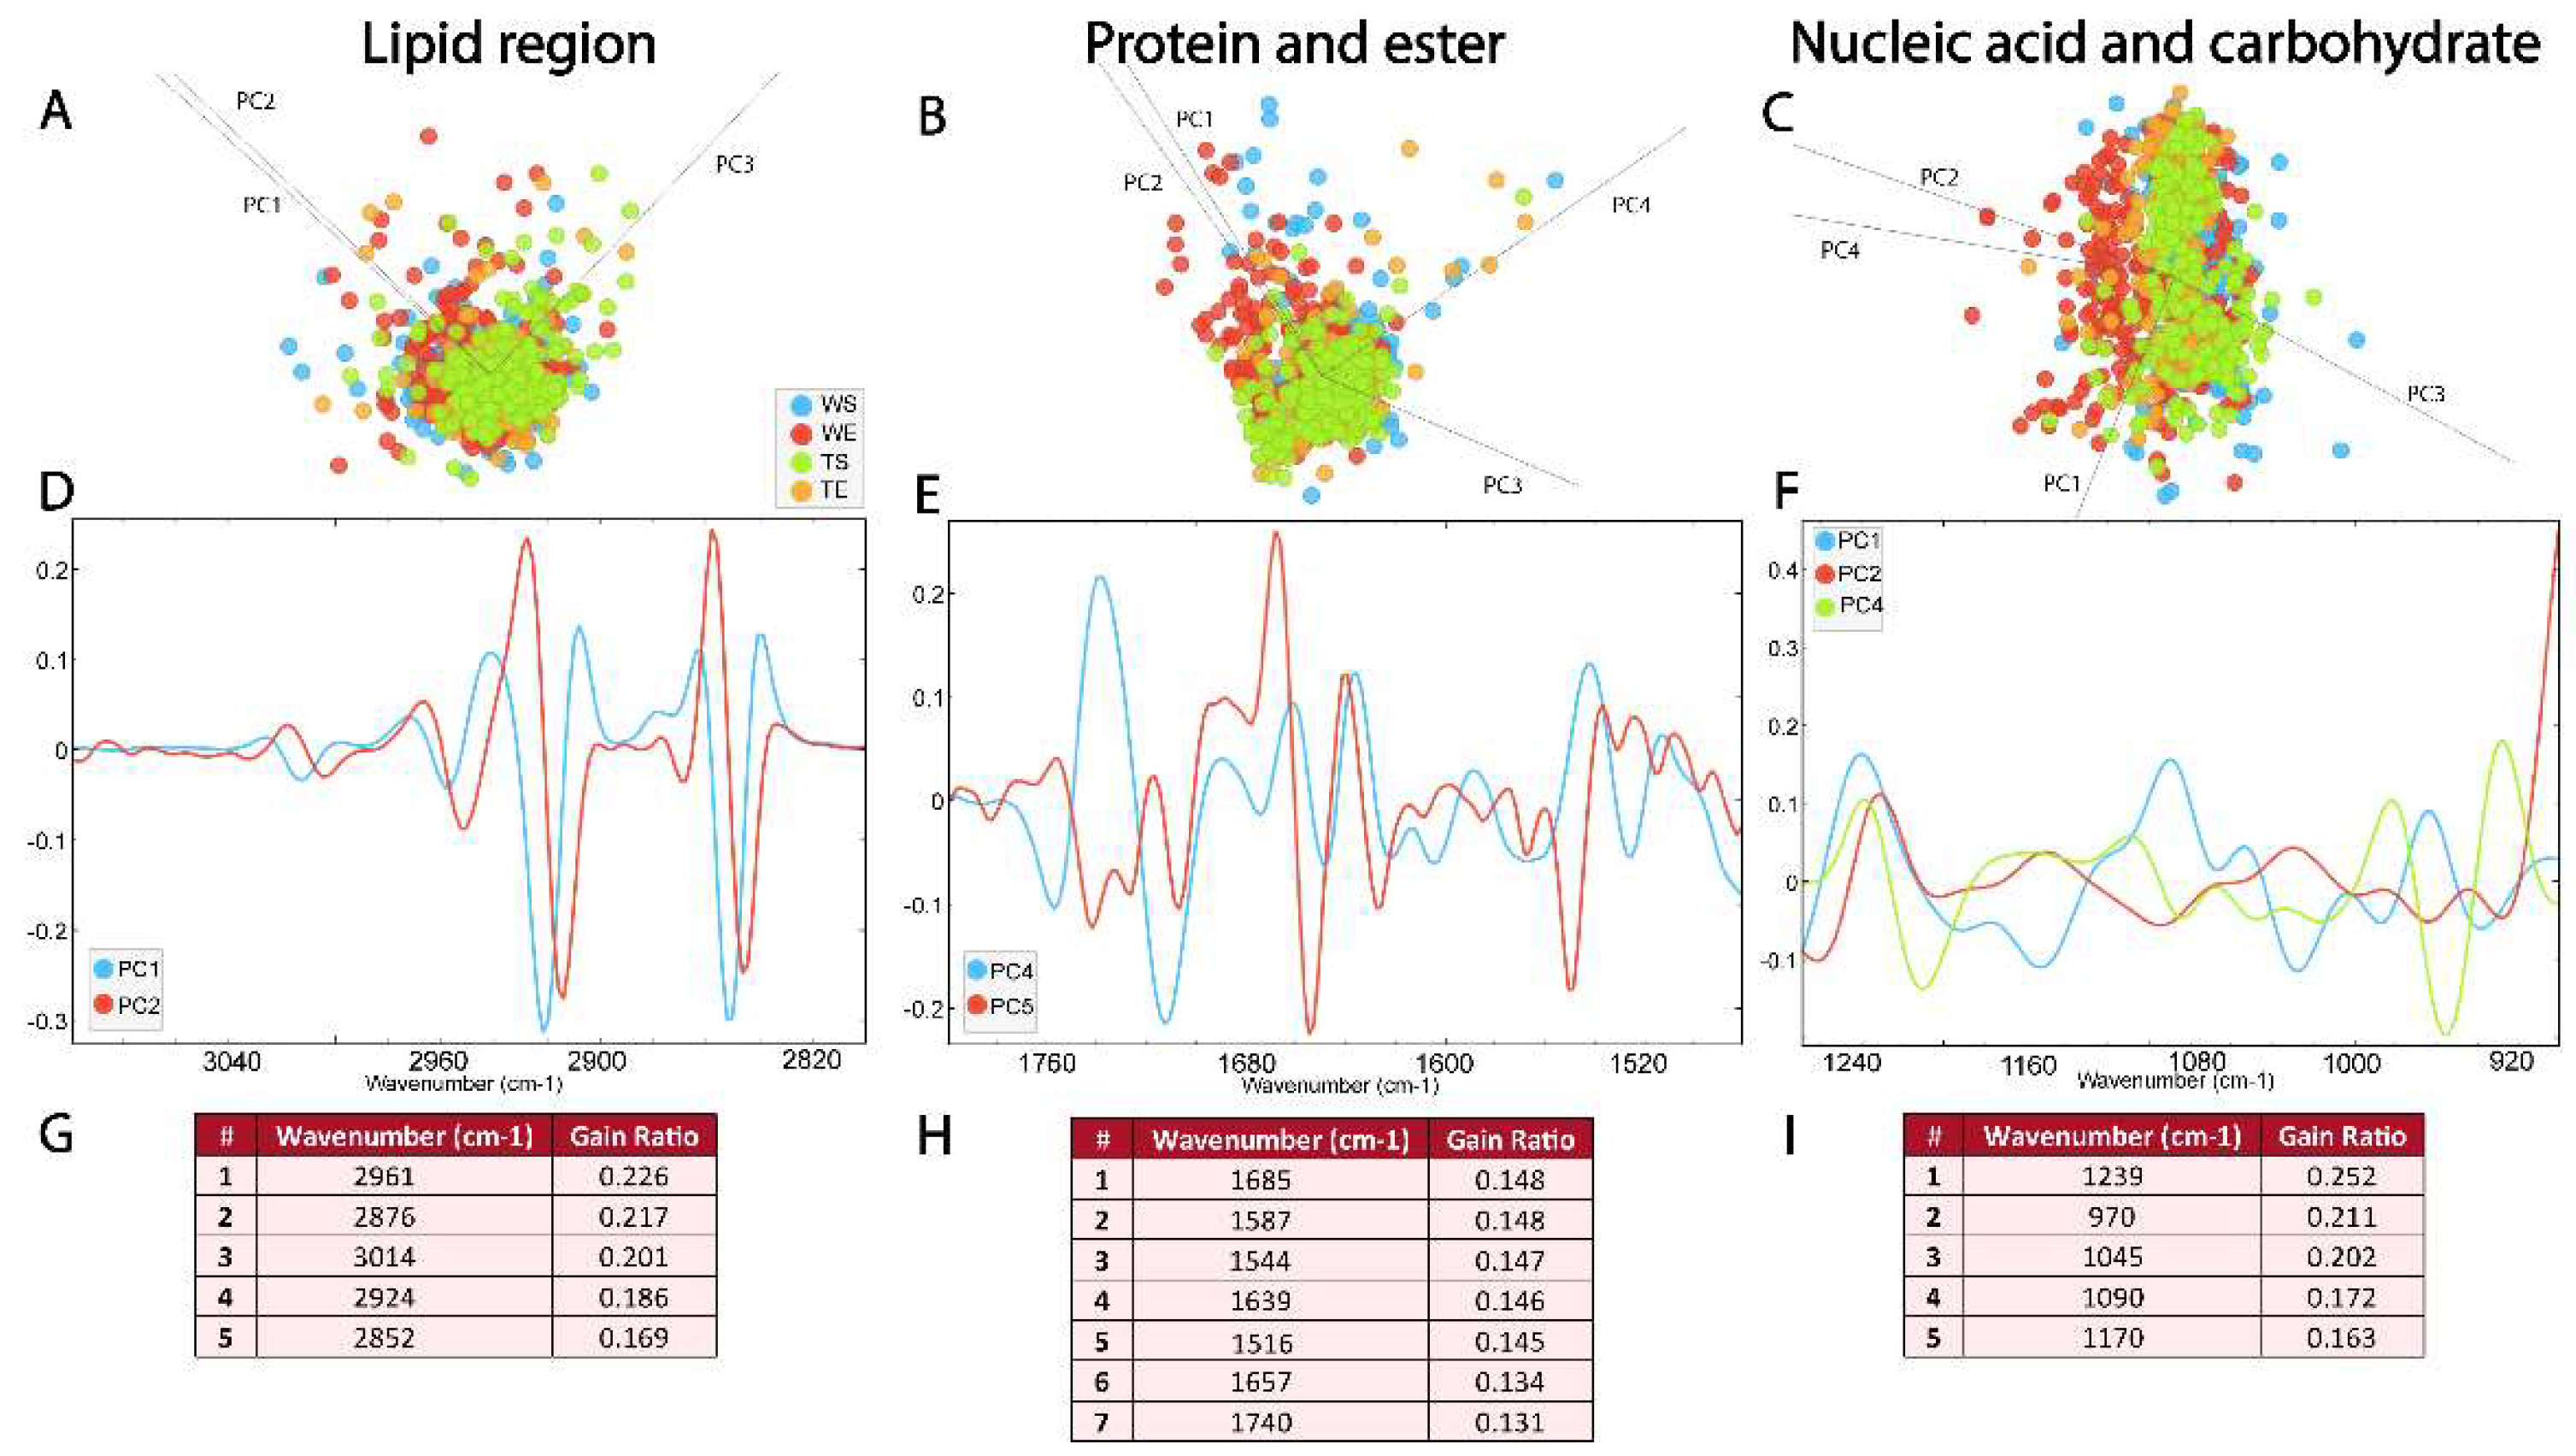
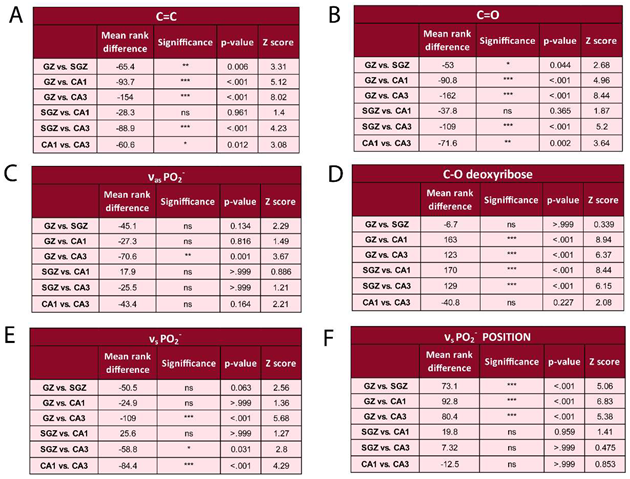
3.4. Comparison of the Biomolecular Composition of the SGZ in Different Experimental Conditions

HCA was conducted on the processed spectra and the dendrograms were constructed based on averaged spectra of selected spectral regions — lipid (3100-2800 cm-1), protein and ester (1800-1480 cm-1) and nucleic acid and carbohydrate (1270-800 cm-1) originating from different experimental groups — wild type mice housed in standard conditions (WS), wild type mice house in enriched environment (WE), TnC-deficient mice housed in standard conditions (TS) and TnC-deficient mice housed in enriched environment (TE) (Figure 6A-C).
The dendrogram based on spectra acquired in the lipid region revealed that WS and WE groups formed one cluster, while TS and TE formed the other one (Figure 6D). The effect of the genotype was apparent regardless of the effect of the environment. In the protein and ester (1800-1480 cm-1) and nucleic acid and carbohydrate region (1270-900 cm-1) WE group formed a separated cluster, indicating the influence of EE on composition of these two groups of molecules. Also, TE group was clustered closer to the group of WS and TS than to WE (Figure 6E, F).

3.4. Biomolecular Profile of the SGZ Depends on the Environmental Conditions and Expression of TnC

Figure 7 represents the biomolecular FTIR spectra of the SGZ in different experimental groups. As previously mentioned in the case of FTIR characterization of hippocampal layers, the spectra acquired in the SGZ of different experimental groups exhibited similar FTIR signature, with all previously detected peaks present. Therefore, the analyzed differences involved subtle variations in band intensities, which were examined and distinguished using multivariate analysis methods, specifically PCA-LDA and RF classification.
PCA-LDA score plots illustrate the distribution of the data within the lipid region (3100-2800 cm-1) across different experimental groups, with three PCs accounting for 96% of variance (Figure 7A, SI Figure S1 D). Loadings plot showed a contribution of νs and νasCH2 bands in PC1 and PC2 (Figure 7A), as well as CH3 and C=C bands. Loadings plot pointed out to minima at ∼2922 cm−1, ∼2852 cm−1, ∼2956 cm−1 and ∼2872 cm−1 for PC1 and PC2 (Figure 7D, SI Table S2). RF classification showed that νas CH3 and C=C absorbance bands had the highest rank, followed by νs and νas CH2 bends (Figure 7G). The differences between experimental groups in the lipid region, which were recorded as minima in the loadings plot and as peaks with the highest ranks in RF classification, can therefore be attributed to the νas CH3 and C=C bands.
The spectral range between 1800–1480 cm-1 was analyzed to detect changes in ester and protein content. As illustrated in Figure 7B, the average second derivative spectra in the protein and ester regions exhibit prominent overlap (Figure 7B, SI Figure S1 E). The PCA-LDA score plots illustrate the distribution of the data, with four PCs accounting for 96% variance. The loadings plot showed the differences in the secondary protein structure and loadings plots pointed out to maximum in PC4 at ~1742 cm-1, ~1637 cm-1, and minimum at ~1681 cm-1, ~1656 cm-1, ~1548 cm-1, ~1516 cm-1 (Figure 7E, SI Table S2). Interestingly, peaks at ~1685 cm-1 and ~1639 cm-1 and 1516 cm-1, corresponding to β-turn, β-sheet and Tyrosine amino acid residue, were ranked as the most significant for RF classification (Figure 7H). In addition to the presence of bands originating from the α-helix, the bands originating from the β-sheet stood out as the most important features for the differences between the experimental groups.
In the PCA-LDA analysis, the distribution of the data in the nucleic acid region (1270-900 cm-1) is represented with four PCs accounting for 95% of variance (Figure 7C, SI Figure S1 F). Analysis of the contribution of individual absorbances to the PCA in the nucleic acid spectral region (1270-900 cm-1) revealed prominent differences in vibrational bands at ~1239, cm−1 ~1090 cm-1, ~1045 cm-1, ~970 cm-1, which were observed as maxima on PC1 (Figure 7E, SI Table S2). RF rankings indicated that peaks at ~1239 cm-1, ~1045 cm-1, and ~970 cm-1, all corresponding to nucleic acid, make the largest contribution to classification (Figure 7I). Indicating the significance of the composition and organization of the nucleic acids for the generation of differences between experimental groups.

4. Discussion

FTIR spectroscopy was successfully used for characterization of the hippocampus that has undergone traumatic brain injury [5], systematic inflammation [27], or underlying pathology [4,28], where drastic changes are easily detectable with FTIR spectroscopy. Also, the technique was used to study physiological conditions, such as aging and development. It was shown that the changes in the biomolecular composition of the hippocampal layers are significant during development, while they decrease during aging, as do the differences between the layers [14]. The present study succeeded in using SR-FTIR spectroscopy as a novel approach to detect differences in biomolecular composition between hippocampal layers that are present during development and persist, to a reduced, subtle extent, in adulthood. The differences detected in the adult hippocampus between SGZ, GZ, CA1 and CA3 layers corroborated subtle differences described in [14]. Moreover, using the high-resolution SR-FTIR spectroscopy enabled characterization of the SGZ layer, in spite of its suttle thin cellular structure between the hilus and granule cells.
Similarity among the layers was observed in the spectra regarding the presence of all peaks, which can be attributed to the common building molecules of the pyramidal and granular layers. The differences were subtle but detectable and can be related to different metabolic and physiological processes taking place in these layers. Namely, CA3 was the most distinctive and it was never clustered together with the SGZ (Figure 2, Table 2, Figure 3). The biggest differences were in the nucleic acid region (1270-800 cm-1), with the most prominent contribution of νas PO2- and C-O deoxyribose bends, assigned to phosphodiester and deoxyribose stretching in the DNA. Pointing out differences in DNA organization and structure in different hippocampal layers (Dučić et al., 2023). Correlation analysis showed that there is a different clustering of peaks between SGZ and CA3, only in this spectral region (Figure 2; peaks 12 & 13).
Based on PCA-LDA, layers SGZ and GZ, and CA1 and CA3, were grouped together, (Figure 3E, 4F, S1). Results revealed a similar content of nucleic acids in the SGZ and GZ, as well as in CA1 and CA3 (Table 2D), which can be related to the density of cells in these layers. Besides the apparent difference in the type of neurons present in these layers, adult neurogenesis and accompanying processes are exclusively related to the SGZ and GZ. All pyramidal neurons are generated during development, while granular neurons are continuously generated in the SGZ during adulthood. Due to the intense changes during development, the differences between these layers in the biomolecular composition are more pronounced compared to the adult period, when a certain biomolecular balance is established. It was observed that during development there is an accumulation of biomolecular components in most cell layers of the hippocampus, except in the granular layer in case of phosphate compounds [14]. This supports the hypothesis that the biomolecular changes in the whole hippocampus are closely related to the rate of neurogenesis that changes with age.
Differences in the composition of lipids were mostly connected to νs CH2 and νas CH2 bends assigned to saturated lipids (Figure 4G). The content of C=C and carbonyl bonds present in unsaturated lipids, which are considered as parameters that indicate the oxidative state of the cell, were highest in the CA3 (Table 2A, B). CA3 pyramidal cells are relatively resistant to ischemic damage and cell death compared to CA1 (Siesjo et al., 1995), due to the fact that CA1 pyramidal cells are more susceptible to ischemic damage because of their high energy dependence. Therefore, the content of double bonds in CA3 can be related to balanced energy consumption and generation of free radicals that cause oxidative stress. Additionally, the content of double bonds in the SGZ was increased compared to GZ (Table 2A, B). Other studies reported higher levels of oxidative stress parameters in the SGZ than in GZ, indicating localized hypoxia in the SGZ [12]. They connected metabolic conditions in the SGZ with a critical role of this structure in the early and activity-independent survival of adult hippocampal newborn cells.
The changes in Amide I indicate subtle differences between hippocampal layers in protein secondary structure and organization (Figure 4B). However, in cases of injury or pathology such as neurodegeneration, a large decrease in total lipid and total protein content was documented [5,29]. The present study was performed under physiological conditions, so subtle differences were expected and confirmed.
In order to check biomolecular composition of the SGZ under altered conditions we followed by SR-FTIR spectroscopy the effects of EE with or in absence of TnC. Exposure to EE induces apparent metabolic changes at the cellular level, as revealed by various omics techniques that offer high chemical resolution and selective detection of specific compounds [30] [13]. Exposure to EE leads to altered expression of many different groups of genes, especially those related to synaptic plasticity [31]. Even though as previously emphasized the use of SR-FTIR spectroscopy involves collecting information from the bulk tissue and providing general information about the present biomolecules, the differences present here could also be revealed with the HCA approach revealing the changes induced in the above experimental conditions.
As for TnC, its localization and expression in the SGZ and its increase after exposure to EE was revealed. Expression of TnC in the hippocampus was already described under conditions of long-term potentiation [32]. That study reported the expression of TnC in the strata oriens and radiatum of the CA1, stratum oriens of the CA3 and within a narrow area at the inner surface of the granule cell layer in the dentate gyrus. Also, a more recent study investigated a single cells transcriptome of NSCs from the dentate gyrus and showed that the TnC gene is among the „SGZ enriched“ genes [33]. The present study confirms accumulation of TnC between the hilus and granular cell layer and, in addition, the presence of TnC particularlly within the SGZ (Figure 5). The close association of TnC and the cells in the SGZ suggest that this regulatory protein contributes to NSC maintenance in the local microenvironment. We also showed that exposure to EE leads to increased expression of TnC in the SGZ. A positive effect of EE on TnC expression was previously reported in the deep cerebellar nuclei, brain region that, in addition to the hippocampus, takes part in neuronal plasticity [34]. The SR-FTIR spectroscopy data revealed that the effects of EE on protein and nucleic acid content in the SGZ could be correlated with the congruent increased expression of TnC. The present study, however, reports no effect of TnC itself on the content of proteins and nucleic acids in the SGZ. Nevertheless, under the influence of EE, in which the expression of TnC is increased an effect is observed. Considering the way in which the WE group differs from the other experimental groups as revealed by HCA, one can discuss the effect of EE on the composition of nucleic acids. The largest differences in the nucleic acid region, as revealed by SR-FTIR spectroscopy, were related to νas PO2- , νs PO2- (Figure 7I), suggesting differences in DNA expression and probably epigenetic modification [19]. This finding can is congruent with the positive influence of EE on the survival of new cells in neurogenesis [10].
In general, differences in the protein region are observed in the secondary structures of proteins. Peaks related to both α-helix and β-sheets were located on the same PC (Figure 7E). However, a more detailed analysis showed a significant contribution of the bands associated specifically with the β-sheets. This finding is particularly intriguing, given that the β-sheets are typically associated with protein aggregation in neurodegeneration. This assertion can be further supported by the presence of a Tyrosine band, which is also associated with oxidative stress [35]. Interesting findings were already published with FTIR spectroscopy, such as the dominance of α-helix bands in the spectra of human mezenhymal stem cells during cell differentiation [3].
In addition, differences in the lipid structures also contribute to the distinguished profile of the SGZ, while νas CH3 and C=C bends present the most important of the observed changes (Figure 7I). Also, HCA showed that the two genotypes (wild type and TnC KO) were similar regardless of the environmental influence (EE or SC). The transition between immature and mature neurons is accompanied by the changes in their lipid metabolism, increasing de novo lipogenesis and decreasing β-oxidation [36]. Therefore, the potential role of TnC can be related to the regulation of this transitional process.

5. Conclusions

With the use of SR-FTIR supported by multivariate analysis discrete differences were revealed between the layers in the adult hippocampus, that represent residual changes largely expressed during development. These differences between layers can be characterized by biomolecular composition using high-resolution SR-FTIR spectroscopy. The rate of changes in the hippocampal layers follows the rate of neurogenesis, these effects being enhanced under the influence of EE. It was shown that the above processes were accompanied by corresponding changes on the biomolecular level, which were dependent on the presence of TnC.

Author Contributions

Conceptualization, M.K. and V.S.; methodology, M.K., V.S., T.D.; software, A.K.; validation, M.K.; formal analysis, M.K., A.K.; investigation, M.K., T.D.; resources, T.D., P.A.; writing—original draft preparation, M.K.; writing—review and editing, A.K., V.S., T.D., P.A.; visualization, M.K., A.K.; supervision, T.D.; funding acquisition, P.A. All authors have read and agreed to the published version of the manuscript.

Funding

This work was also supported by the Ministry of Education, Science and Technological Development of Republic of Serbia, Contract No. 451-03-68/2022-14/200178, Grant ID 4242, Science Fund Republic of Serbia and by the EU Horizon 2020 MSCA Grant Agreement No. 778405.

Institutional Review Board Statement

The study was conducted in accordance with the NIH Guide for Care and Use of Laboratory Animals (1985) and the European Communities Council Directive (86/609/EEC). Experiments were approved by the local Ethics Committee. The authorization reference number is EK-BF -2020/02.

Data Availability Statement

The raw data supporting the conclusions of this article will be made available by the authors on request.

Acknowledgments

We thank Alba Synchrotron light source for beamtime allocation. We would like to thank Danijela Bataveljić for the help during sample preparation.

Conflicts of Interest

The authors declare no conflicts of interest.

Abbreviations

The following abbreviations are used in this manuscript:
DG Dentate gyrus
FTIR Fourier transform infrared
SR Synchrotron radiation
SGZ Subgranular zone
TnC Tenascin C
EE Enriched environment
SC Standard condition
GZ Granular zone
TnC KO Tenascin-C-deficient
HCA Hierarchical cluster analysis
PCA Principal component analysis
PC Principal component
LDA Linear discriminant analysis
RF Random forest
WS Wild type mice housed in standard conditions
WE Wild type mice house in enriched environment
TS TnC-deficient mice housed in standard conditions
TE TnC-deficient mice housed in enriched environment

References

  1. A Alkadhi, K. Cellular and Molecular Differences Between Area CA1 and the Dentate Gyrus of the Hippocampus. Mol. Neurobiol. 2019, 56, 6566–6580. [Google Scholar] [CrossRef] [PubMed]
  2. Hörtnagl, H.; Berger, M.; Sperk, G.; Pifl, C. Regional heterogeneity in the distribution of neurotransmitter markers in the rat hippocampus. Neuroscience 1991, 45, 261–272. [Google Scholar] [CrossRef] [PubMed]
  3. Miller, L.M.; Dumas, P. From structure to cellular mechanism with infrared microspectroscopy. Curr. Opin. Struct. Biol. 2010, 20, 649–656. [Google Scholar] [CrossRef] [PubMed]
  4. J. Dudała, K. J. Dudała, K. Janeczko, Z. Setkowicz, D. Eichert, and J. Chwiej, “The use of SR-FTIR microspectroscopy for a preliminary biochemical study of the rat hippocampal formation tissue in case of pilocarpine induced epilepsy and neutroprotection with FK-506,” Nukleonika, vol. 57, no. 4, pp. 615–619, 2012.
  5. Ustaoglu, S.G.; Ali, M.H.M.; Rakib, F.; Blezer, E.L.A.; Van Heijningen, C.L.; Dijkhuizen, R.M.; Severcan, F. Biomolecular changes and subsequent time-dependent recovery in hippocampal tissue after experimental mild traumatic brain injury. Sci. Rep. 2021, 11, 1–13. [Google Scholar] [CrossRef]
  6. van Praag, H.; Schinder, A.F.; Christie, B.R.; Toni, N.; Palmer, T.D.; Gage, F.H. Functional neurogenesis in the adult hippocampus. Nature 2002, 415, 1030–1034. [Google Scholar] [CrossRef]
  7. Kjell, J.; Fischer-Sternjak, J.; Thompson, A.J.; Friess, C.; Sticco, M.J.; Salinas, F.; Cox, J.; Martinelli, D.C.; Ninkovic, J.; Franze, K.; et al. Defining the Adult Neural Stem Cell Niche Proteome Identifies Key Regulators of Adult Neurogenesis. Cell Stem Cell 2020, 26, 277–293.e8. [Google Scholar] [CrossRef]
  8. Tucić, M.; Stamenković, V.; Andjus, P. The Extracellular Matrix Glycoprotein Tenascin C and Adult Neurogenesis. Front. Cell Dev. Biol. 2021, 9. [Google Scholar] [CrossRef]
  9. Cope, E.C.; Gould, E. Adult Neurogenesis, Glia, and the Extracellular Matrix. 24. [CrossRef]
  10. Brown, J.; Cooper-Kuhn, C.M.; Kempermann, G.; Van Praag, H.; Winkler, J.; Gage, F.H.; Kuhn, H.G. Enriched environment and physical activity stimulate hippocampal but not olfactory bulb neurogenesis. Eur. J. Neurosci. 2003, 17, 2042–2046. [Google Scholar] [CrossRef]
  11. van Praag, H.; Shubert, T.; Zhao, C.; Gage, F.H. Exercise Enhances Learning and Hippocampal Neurogenesis in Aged Mice. J. Neurosci. 2005, 25, 8680–8685. [Google Scholar] [CrossRef]
  12. Chatzi, C.; Schnell, E.; Westbrook, G.L.; States, U. Localized hypoxia within the subgranular zone determines the early survival of newborn hippocampal granule cells. eLife 2015, 4, e08722. [Google Scholar] [CrossRef]
  13. Cembrowski, M.S.; Wang, L.; Sugino, K.; Shields, B.C.; Spruston, N.; States, U. Hipposeq: a comprehensive RNA-seq database of gene expression in hippocampal principal neurons. eLife 2016, 5, e14997. [Google Scholar] [CrossRef] [PubMed]
  14. Chwiej, J.G.; Ciesielka, S.W.; Skoczen, A.K.; Janeczko, K.J.; Sandt, C.; Planeta, K.L.; Setkowicz, Z.K. Biochemical Changes Indicate Developmental Stage in the Hippocampal Formation. ACS Chem. Neurosci. 2018, 10, 628–635. [Google Scholar] [CrossRef] [PubMed]
  15. Arellano, J.I.; Duque, A.; Rakic, P. A coming-of-age story: adult neurogenesis or adolescent neurogenesis in rodents? Front. Neurosci. 2024, 18, 1383728. [Google Scholar] [CrossRef]
  16. Evers, M.R.; Salmen, B.; Bukalo, O.; Rollenhagen, A.; Bösl, M.R.; Morellini, F.; Bartsch, U.; Dityatev, A.; Schachner, M. Impairment of L-type Ca2+Channel-Dependent Forms of Hippocampal Synaptic Plasticity in Mice Deficient in the Extracellular Matrix Glycoprotein Tenascin-C. J. Neurosci. 2002, 22, 7177–7194. [Google Scholar] [CrossRef] [PubMed]
  17. Cancedda, L.; Putignano, E.; Sale, A.; Viegi, A.; Berardi, N.; Maffei, L. Acceleration of Visual System Development by Environmental Enrichment. J. Neurosci. 2004, 24, 4840–4848. [Google Scholar] [CrossRef]
  18. de Magalhães, C.R.; Carrilho, R.; Schrama, D.; Cerqueira, M.; da Costa, A.M.R.; Rodrigues, P.M. Mid-infrared spectroscopic screening of metabolic alterations in stress-exposed gilthead seabream (Sparus aurata). Sci. Rep. 2020, 10, 1–9. [Google Scholar] [CrossRef]
  19. Dučić, T.; Sanchez-Mata, A.; Castillo-Sanchez, J.; Algarra, M.; Gonzalez-Munoz, E. Monitoring oocyte-based human pluripotency acquisition using synchrotron-based FTIR microspectroscopy reveals specific biomolecular trajectories. Spectrochim. Acta Part A: Mol. Biomol. Spectrosc. 2023, 297, 122713. [Google Scholar] [CrossRef]
  20. Crase, S.; Hall, B.; Thennadil, S.N. Cluster Analysis for IR and NIR Spectroscopy: Current Practices to Future Perspectives. Comput. Mater. Contin. 2021, 69, 1945–1965. [Google Scholar] [CrossRef]
  21. Koehler, A.; Scroferneker, M.L.; de Souza, N.M.P.; de Moraes, P.C.; Pereira, B.A.S.; Cavalcante, R.d.S.; Mendes, R.P.; Corbellini, V.A. Rapid Classification of Serum from Patients with Paracoccidioidomycosis Using Infrared Spectroscopy, Univariate Statistics, and Linear Discriminant Analysis (LDA). J. Fungi 2024, 10, 147. [Google Scholar] [CrossRef]
  22. Osman, S.O.M.; Saad, A.S.I.; Tadano, S.; Takeda, Y.; Konaka, T.; Yamasaki, Y.; Tahir, I.S.A.; Tsujimoto, H.; Akashi, K. Chemical Fingerprinting of Heat Stress Responses in the Leaves of Common Wheat by Fourier Transform Infrared Spectroscopy. Int. J. Mol. Sci. 2022, 23, 2842. [Google Scholar] [CrossRef]
  23. Pereira, D.C.; Pupin, B.; Borma, L.d.S. Influence of sample preparation methods on FTIR spectra for taxonomic identification of tropical trees in the Atlantic forest. Heliyon 2024, 10, e27232. [Google Scholar] [CrossRef] [PubMed]
  24. Chen, L.; Holman, H.-Y.N.; Hao, Z.; Bechtel, H.A.; Martin, M.C.; Wu, C.; Chu, S. Synchrotron Infrared Measurements of Protein Phosphorylation in Living Single PC12 Cells during Neuronal Differentiation. Anal. Chem. 2012, 84, 4118–4125. [Google Scholar] [CrossRef]
  25. Toplak, M.; Read, S.T.; Sandt, C.; Borondics, F. Quasar: Easy Machine Learning for Biospectroscopy. Cells 2021, 10, 2300. [Google Scholar] [CrossRef]
  26. Ferhat, L.; Louis, N.C.A.; Jorquera, I.; Niquet, J.; Khrestchatisky, M.; Ben-Ari, Y.; Represa, A. Transient increase of tenascin-C in immature hippocampus: astroglial and neuronal expression. J. Neurocytol. 1996, 25, 53–66. [Google Scholar] [CrossRef] [PubMed]
  27. Cakmak-Arslan, G.; Kaya, Y.; Mamuk, S.; Akarsu, E.S.; Severcan, F. The investigation of the molecular changes duringlipopolysaccharide-induced systemic inflammation on rat hippocampus by usingFTIRspectroscopy. J. Biophotonics 2024, 17, e202300541. [Google Scholar] [CrossRef] [PubMed]
  28. Chwiej, J.; Dulinska, J.; Janeczko, K.; Dumas, P.; Eichert, D.; Dudala, J.; Setkowicz, Z. Synchrotron FTIR micro-spectroscopy study of the rat hippocampal formation after pilocarpine-evoked seizures. J. Chem. Neuroanat. 2010, 40, 140–147. [Google Scholar] [CrossRef]
  29. Andjus, P.; Stamenković, S.; Dučić, T. Synchrotron radiation-based FTIR spectro-microscopy of the brainstem of the hSOD1 G93A rat model of amyotrophic lateral sclerosis. Eur. Biophys. J. 2019, 48, 475–484. [Google Scholar] [CrossRef]
  30. McNair, K.; Broad, J.; Riedel, G.; Davies, C.; Cobb, S. Global changes in the hippocampal proteome following exposure to an enriched environment. Neuroscience 2007, 145, 413–422. [Google Scholar] [CrossRef]
  31. Carulli, D.; Foscarin, S.; Rossi, F. Activity-Dependent Plasticity and Gene Expression Modifications in the Adult CNS. Front. Mol. Neurosci. 2011, 4, 15205. [Google Scholar] [CrossRef]
  32. Nakic, M.; Manahan-Vaughan, D.; Reymann, K.G.; Schachner, M. Long-term potentiationin vivo increases rat hippocampal tenascin-C expression. J. Neurobiol. 1998, 37, 393–404. [Google Scholar] [CrossRef]
  33. Shin, J.; Berg, D.A.; Zhu, Y.; Shin, J.Y.; Song, J.; Bonaguidi, M.A.; Enikolopov, G.; Nauen, D.W.; Christian, K.M.; Ming, G.-L.; et al. Single-Cell RNA-Seq with Waterfall Reveals Molecular Cascades underlying Adult Neurogenesis. Cell Stem Cell 2015, 17, 360–372. [Google Scholar] [CrossRef] [PubMed]
  34. Stamenkovic, V.; Stamenkovic, S.; Jaworski, T.; Gawlak, M.; Jovanovic, M.; Jakovcevski, I.; Wilczynski, G.M.; Kaczmarek, L.; Schachner, M.; Radenovic, L.; et al. The extracellular matrix glycoprotein tenascin-C and matrix metalloproteinases modify cerebellar structural plasticity by exposure to an enriched environment. Anat. Embryol. 2016, 222, 393–415. [Google Scholar] [CrossRef] [PubMed]
  35. Josifovska, N.; Andjelic, S.; Lytvynchuk, L.; Lumi, X.; Dučić, T.; Petrovski, G. Biomacromolecular Profile in Human Primary Retinal Pigment Epithelial Cells—A Study of Oxidative Stress and Autophagy by Synchrotron-Based FTIR Microspectroscopy. Biomedicines 2023, 11, 300. [Google Scholar] [CrossRef] [PubMed]
  36. Maffezzini, C.; Calvo-Garrido, J.; Wredenberg, A.; Freyer, C. Metabolic regulation of neurodifferentiation in the adult brain. Cell. Mol. Life Sci. 2020, 77, 2483–2496. [Google Scholar] [CrossRef]
Figure 1. Average FTIR spectra acquired in hippocampal layers of freeze-dried tissue. The numbers indicate peaks assigned to a specific chemical bond (related to Table 1) and classified to main biomolecular compounds – lipids, proteins and ester, nucleic acids and carbohydrates indicated by band colors.
Preprints 149622 g001
Figure 2. SGZ and CA3 layers show distinctive clustering patterns. Correlation analysis of (a) SGZ vs GZ, (b) SGZ vs CA1, (c) SGZ vs CA3. Peaks are grouped and ordered by hierarchical clustering with Ward’s linkage. Numbers on the axes denote the peaks assigned to biomolecules, using the same annotation as in Table 1. The degree of pairwise correlation, as indicated by Pearson's correlation coefficient, is represented through a combination of a color gradient and varying circle sizes, with the colors reflecting the nature of the correlation (positive or negative) and circle size the value of the coefficient. The significance of the correlation is indicated by the label * inside the circle (*p ≤ 0.05, **p ≤ 0.01, ***p ≤ 0.001). Bold lines indicate clusters.
Preprints 149622 g002
Figure 3. The average FTIR spectra of freeze-dried hippocampus tissue in the SGZ, GZ, CA1 and CA3 layers. (A) lipid spectral region 3100-2800 cm-1, (B) protein and ester 1800-1480 cm-1 and (C) nucleic acid and carbohydrate 1270-800 cm-1. Hierarchical clustering of SGZ, GZ, CA1 and CA3 layers using Euclidian’s distance based on their average spectra in the lipid (D), protein (E) and nucleic acid (F) regions.
Preprints 149622 g003
Figure 4. SGZ, GZ, CA1 and CA3 layers differ in the biomolecular composition, the most prominently in the nucleic acid region. PCA-LDA score plots with PCs show the distribution of spectral data of different hippocampal regions in (A) lipid spectral region 3100-2800 cm-1, (B) protein and ester 1800-1480 cm-1 and (C) nucleic acid and carbohydrates 1270-800 cm-1. Loading plots (D, E, F) show the contribution of individual absorbance to the PCAs of the selected PCs. RF classification (G, H, I) shows the ranking of the peaks that contribute the most to the data classification.
Preprints 149622 g004
Figure 5. EE increases expression of TnC in the SGZ of adult wild type mice. A-B Representative confocal images of immunofluorescence staining for extracellular matrix glycoprotein TnC (green) and TO-PRO3 as a nuclear staining (blue) in the DG of wild type mice housed in SC (A top and bottom) and EE (B top and bottom). Note the localization of TnC around the SGZ indicated by white arrows. Scale bars 50 µm (left) and 20 µm (right). (C) Immunostaining for TnC in TnC-/- mice. (D) Quantification of the pixel density for TnC (n = 3 mice/group). Statistical difference was determined by Student’s t-test. Bars represent normalized mean ±SD. **p ≤ 0.01.
Preprints 149622 g005
Figure 6. The average FTIR spectra of freeze-dried hippocampus tissue of the SGZ in (A) lipid spectral region 3100-2800 cm-1, (B) protein and ester 1800-1480 cm-1 and (C) nucleic acid and carbohydrate 1270-800 cm-1. Hierarchical clustering of different experimental groups using Euclidian distance based on their average spectra are presented in the lipid (D) protein and ester (E) and nucleic acid and carbohydrate (F) regions. Wild type mice housed in standard conditions - WS, wild type mice house in enriched environment - WE, TnC-deficient mice housed in standard conditions - TS, TnC-deficient mice housed in enriched environment - TE.
Preprints 149622 g006
Figure 7. Absence of TnC leads to subtle changes in FTIR spectra of the adult SGZ. PCA-LDA score plots with PCs (describing ~99% of variance) showing the distribution of spectral data of different experimental groups (see Fig. 6) in (A) lipid 3100-2800 cm-1, (B) protein and ester 1800-1480 cm-1 and (C) nucleic acids and carbohydrate region 1270-900 cm-1. Loading plots (D, E, F) show the contribution of individual absorbance to the PCAs of the selected PCs. RF classification (G, H, I) shows the ranking of the peaks that contribute the most to the data classification.
Preprints 149622 g007
Table 1. Assignment of spectral bands to molecular vibrations of functional groups and biochemical compounds, based on similar biological systems described in the literature. Note for table ν - bond stretch; s – symmetric vibration; as – asymmetric vibration; δ - bending vibration. Color code as in Figure 1.
Preprints 149622 i001
Table 2. Integrated band area median values of spectra of SGZ, GZ, CA1 and CA3 layers at specific wavelengths ranges related to the bond vibrations in specific molecules. Kruskal - Walis, (*p ≤ 0.05, **p ≤ 0.01, ***p ≤ 0.001, ns – nonsignificant). Also see Figure 1.
Preprints 149622 i002
Disclaimer/Publisher’s Note: The statements, opinions and data contained in all publications are solely those of the individual author(s) and contributor(s) and not of MDPI and/or the editor(s). MDPI and/or the editor(s) disclaim responsibility for any injury to people or property resulting from any ideas, methods, instructions or products referred to in the content.
Copyright: This open access article is published under a Creative Commons CC BY 4.0 license, which permit the free download, distribution, and reuse, provided that the author and preprint are cited in any reuse.
Prerpints.org logo

Preprints.org is a free preprint server supported by MDPI in Basel, Switzerland.

Subscribe

Disclaimer

Terms of Use

Privacy Policy

Privacy Settings

© 2025 MDPI (Basel, Switzerland) unless otherwise stated