
Submitted:
18 February 2025
Posted:
19 February 2025
You are already at the latest version
Abstract
A facile solvo-hydrothermal method was developed to synthesize sub-100 nm diameter TiO2/α-Fe2O3@SiO2 nanorods (TiO2/HNRs@SiO2). Thermal annealing of TiO2/HNRs@SiO2 activated the photosensitizing crystalline TiO2 domains containing mixed anatase and rutile phases. Photocatalytic decomposition of methylene blue (MB) was performed using thermally the annealed TiO2/HNRs@SiO2 photocatalysts was successfully demonstrated with ~95% MB removal efficiency achieved under mild conditions of pH = ~7 and room temperature using ~150 min of solar irradiation. The enhanced removal efficiency was attributed to the rapid adsorption of MB onto the TiO2/HNRs@SiO2 surface via favorable electrostatic interactions and the synergistic integration of α-Fe2O3 and TiO2 into nanorod heterostructures with bandgaps of 1.99–2.03 eV, allowing them to absorb visible light for efficient photocatalytic degradation reactions. This study provides insights into designing photocatalysts with improved selectivity for sustainable water treatment and environmental remediation.
Keywords:
TiO2
; α-Fe2O3
; nanorods
; photocatalysts
; methylene blue
; photodegradation
1. Introduction
Water pollution is a critical environmental issue that poses severe risks to ecosystems, human health, and global water resources. Industrial effluent containing harmful organic dyes is a significant challenge among the various contributors to water contamination [1,2]. These effluents, primarily from industries such as textiles, leather, paper, and plastics, introduce hazardous compounds into aquatic ecosystems, disrupting ecological balance and endangering the health of communities reliant on these water sources.
The textile and dyeing industries are among the largest consumers of synthetic dyes, producing millions of tons annually to meet global demand. During dyeing and finishing processes, a significant proportion of these toxic dyes, often exceeding 200,000 tons, are lost to wastewater streams, accounting for 17–20% of water pollution, according to the World Health Organization (WHO) [3]. These effluents are rich in complex organic dyes, heavy metals, and auxiliary chemicals, making them one of the most challenging wastewater types to treat effectively. Other sectors, such as cosmetics, pharmaceuticals, and food processing, contribute to the release of dyes into water systems, further compounding the issue.
Organic dyes are chemically stable compounds that resist degradation under light, heat, and microbial activity. Although these properties are advantageous in industrial applications, they also make dyes persistent in the environment. Many dyes have complex aromatic structures, making them difficult to break down through conventional chemical and biological processes [4,5]. Furthermore, some dyes are toxic, mutagenic, and carcinogenic, posing significant risks to aquatic ecosystems and human health [6,7,8].
The presence of organic dyes in water systems has widespread consequences on aquatic ecosystems [9]. Dyes reduce light penetration in water, affecting photosynthetic organisms such as algae and aquatic plants. This disruption cascades through the food chain, affecting fish and other aquatic species. In addition, the toxicity of certain dyes directly harms aquatic organics, causing harmful substances to accumulate and magnify in aquatic ecosystems. Furthermore, dye degradation in water often involves microbial activity, which consumes dissolved oxygen. This can lead to hypoxic or anoxic conditions known as dead zones, where aquatic life cannot survive.
Exposure to dye-contaminated water presents serious health risks. Direct contact with dye-contaminated water can cause skin irritation, respiratory problems, and other allergic reactions. In addition, many dyes are classified as carcinogenic or mutagenic, posing risks of cancer, genetic mutations, and other chronic conditions. Conventional wastewater treatment processes have limitations and challenges in dealing with dye-containing effluents [10]. For example, physical methods, such as filtration and sedimentation, are often inefficient for removing dissolved dyes. Chemical treatments, such as ozonation and oxidation, are energy- and cost-intensive. These treatment processes also produce secondary waste, such as toxic sludge, which requires further disposal.
Photocatalysis is a promising solution for degrading organic dyes into harmless byproducts because of its efficiency, cost-effectiveness, and environmental compatibility [11]. In particular, titanium dioxide (TiO2)-based photocatalysis has attracted considerable attention owing to its strong oxidative power, chemical stability, and non-toxicity [12,13]. Indeed, TiO2-based photocatalysts showed remarkable efficiency in degrading a wide range of organic dyes, including those with azo- (e.g., methyl orange, Congo red), anthraquinone (e.g., reactive blue), and xanthene (e.g., rhodamine B)-based structures [14,15,16,17]. They break down their complex aromatic structures under relatively mild conditions, eliminating the need for harsh conditions and converting them into non-toxic byproducts. Despite their advantages, TiO2-based photocatalysts have a few challenges to overcome. TiO2 has a bandgap of approximately 3.2 eV. Hence, it absorbs light in the ultraviolet (UV) region, constituting only ~5% of the solar spectrum, limiting its efficiency under natural sunlight [18,19]. In addition, the rapid recombination of electron–hole pairs reduces the photocatalytic efficiency of TiO2 [20,21,22]. Furthermore, TiO2 nanoparticles aggregate in aqueous solution environments, reducing the effective surface area for photocatalysis [23].
This paper describes a simple route to prepare TiO2-based hematite (α-Fe2O3) nanocomposite photocatalysts, called TiO2/α-Fe2O3@SiO2 nanorods (TiO2/HNRs@ SiO2). The process involved synthesizing hydrated goethite (α-FeOOH) nanorods (GNRs) via facile solvo-hydrothermal reactions, passivating their surface with silica (SiO2), growing a thin layer of amorphous TiO2 on the SiO2, and transforming the core of the nanorod from α-FeOOH to α-Fe2O3 simultaneously under hydrothermal conditions. Finally, TiO2/HNRs@SiO2 were annealed thermally to activate TiO2/HNRs@SiO2 for the photocatalytic degradation of organic dye such as methylene blue (MB). The mean size and diameter of the GNRs were 374.6 ± 127.6 μm and 50.0 ± 25.1 nm, respectively. The passivation of SiO2 on the surface of GNRs resulted in a mean thickness of 9.6 ± 2.2 nm. The hydrothermal growth of amorphous TiO2 on the passivated SiO2 on the GNRs passivation resulted in the formation of TiO2/HNRs@SiO2 containing branched nanostructured TiO2 with flower-like morphologies grown on the SiO2 layer. Thermal annealing activated TiO2/HNRs@SiO2 by transforming the amorphous TiO2 into crystalline domains containing anatase and rutile TiO2 mixed phases. The photocatalytic degradation of MB using thermally annealed TiO2/HNRs@SiO2 photocatalysts was demonstrated under relatively mild conditions of pH = ~7, resulting in a removal efficiency of ~95% after less than ~150 min of solar irradiation. The effects of the thermal annealing temperatures, dye concentrations, the zeta potentials of the photocatalysts, and the solution pH on the removal efficiencies were studied systematically to optimize the photocatalytic reactions. The improved removal efficiency was attributed to the rapid adsorption of MB onto TiO2/HNRs@SiO2 facilitated by favorable electrostatic interactions and the integration of multiple materials into the nanorods, such as thermally transformed α-Fe2O3 making a junction with TiO2 into heterostructures to improve charge separation. These properties result in a narrower bandgap for enhanced visible light absorption and higher photostability for enhancing the performance of nanorod photocatalysts. In addition, the SiO2 coating serves as a structural support, promoting dispersion and preventing agglomeration, and a passivation barrier, preventing the formation of ilmenite (FeTiO3) from thermal annealing, which lowers the photocatalytic performance. The flower-like morphologies of the nanocomposite catalysts enhance the photocatalytic efficiency by providing larger effective surface areas.
2. Experimental
2.1. Materials
Iron(III) nitrate nonahydrate (Fe(NO3)3•9H2O, >99%, KANTO, Japan), tetraethyl orthosilicate (TEOS) (98%, Acros organics, Belgium), titanium(IV) isopropoxide (Ti(C3H7O)4, >99%, Samchun, Korea) and methylene blue (MB, 97%, Samchun, Korea) were purchased and used as received. All other chemicals, including the solvents used, such as absolute ethanol (>99%, Daejung, Korea), 1N sodium hydroxide solution (Daejung, Korea), diethylenetriamine (DETA) (98.5%, Samchun, Korea), aqueous ammonium hydroxide solution (NH4OH, 28–30%, Daejung, Korea) and isopropanol were of analytical ACS regent grade and used as received.
2.2. Preparation of Goethite (α-FeOOH) Nanorods (GNRs)
The GNRs were synthesized using a slight modification of the methodology reported elsewhere [24]. Typically, 2.0 g Fe(NO3)3·9H2O was dissolved in 25 ml deionized water and stirred vigorously at 1000 rpm for 5 min at room temperature. Subsequently, 16 ml 1N sodium hydroxide solution was added. Finally, the mixture was transferred to a 75 ml Teflon-lined stainless-steel autoclave, sealed, and heated to 160 ℃ under autogenic pressure for 24 h. After the autoclaved materials were cooled to room temperature, the obtained GNRs were rinsed several times with ethanol and triply distilled water before drying overnight at 60 ℃.
2.3. Preparation of SiO2 Coated GNRs (GNRs@SiO2)
SiO2 serves as the structural support of the nanorod, promoting dispersion and preventing agglomeration [25,26,27]. The SiO2 coating on the surface of GNRs was carried out using a modified version of the method reported elsewhere [28]. A 0.1 g sample of the as-prepared GNRs was dispersed into a solution containing 15 ml of deionized water, 60 ml of anhydrous ethanol, and 3 ml of an aqueous ammonium hydroxide solution under ultrasonication for 10 min at room temperature. Subsequently, 0.2 ml TEOS in 18 ml ethanol was added under ultrasonication for 30 min to form GNRs@SiO2. The products were collected by centrifugation, rinsed twice with absolute ethanol and triply distilled water, and dried overnight in an oven at 60 ℃.
2.4. Preparation of TiO2/SiO2 Coated Hematite (α-Fe2O3) Nanorods (TiO2/HNRs@SiO2)
A 0.3 g sample of GNRs@SiO2 and 135 μL of DETA were added to 50 ml of isopropanol under ultrasonication for 3 min, followed by adding 2 mL of TTIP. After 5 min of ultrasonic irradiation, the mixture was transferred to a 75 ml Teflon-lined stainless-steel autoclave, sealed, and held at 200 ℃ for 20 h [29]. After cooling the autoclave to room temperature, the precipitates were collected, rinsed repeatedly with absolute ethanol and triply distilled water, and then dried overnight at 60 ℃.
2.5. Thermal Annealing of TiO2/HNRs@SiO2 for Photocatalytic Applications
Samples of TiO2/HNRs@SiO2 were thermally annealed in a furnace under air at 400, 600, and 800 ℃ for 2 h to obtain TiO2/HNRs@SiO2_400, TiO2/HNRs@SiO2_600, and TiO2/HNRs@SiO2_800 photocatalysts, respectively.
2.6. Material Characterization
X-ray powder diffraction (XRD, X’Pert-MPD, Philips Inc., USA) was performed using monochromatic Cu Kα1 radiation (λ = 0.15405 nm) operated at 1.2kW power (40kV, 30 mA). Quantitative diffraction data analysis was conducted using the FullProf software [30]. The full diffraction patterns were refined iteratively using the Rietveld refinement to minimize the residuals between the calculated and experimental data [31]. The quality of the fit between the calculated and observed XRD patterns was judged using R-factors such as the weighted profile residual Rwp, the statistically expected residual Rexp, χ2(= Rwp2/ Rexp2), and the corresponding goodness-of-the-fit (GoF), as shown in Tables S1, which validated the structural model of the main phases from the ICSD database [32]. The results were normalized to the total percentage of all phases considered in the Rietveld refinement (i.e., 100%).
The sizes and morphologies of GNRs, GNRs@SiO2, and TiO2/HNRs@SiO2 thermally annealed at different temperatures were examined by field emission scanning electron microscopy (FESEM, Supra 40, Zeiss International, Germany) at accelerating voltages ranging from 5 to 10 kV and by transmission electron microscopy (TEM, Hitachi H-7600, Hitachi High-tech, Germany). High-resolution TEM (HRTEM, TALOS F200X FEI & Thermo Fisher Scientific Electron Microscopy Solutions, USA) was performed at an accelerating voltage of 200 kV.
Fourier transformation infrared (FT-IR, Nicolet Summit X, Thermo Fisher Scientific Inc., USA) spectroscopy of GNRs, GNRs@SiO2, and TiO2/HNRs@SiO2 thermally annealed at different temperatures was performed using a KBR pellet and attenuated total reflection (ATR) techniques.
X-ray photoelectron spectroscopy (XPS, ESCALAB 250, Thermo Fisher Scientific Inc., USA) of GNRs, GNRs@SiO2, and TiO2/HNRs@SiO2 thermally annealed at different temperatures was performed using a monochromatic X-ray excitation source of Al anode Kα radiation (1486.6 eV). The binding energies were calibrated to the C 1s line of carbon at 284.6 eV before the actual measurements.
Ultraviolet-visible diffuse reflectance spectroscopy (UV-VIS DRS, V-770, JASCO Inc., Japan) was performed to determine the optical band gap (Eg) of thermally annealed TiO2/HNRs@SiO2. The zeta potentials of TiO2/HNRs@SiO2 thermally annealed at different temperatures were measured in triplicate as a function of the solution pH using a Zetasizer (Nano ZSP, Malvern Instruments, UK) equipped with a 633 nm He-Ne laser at ambient temperatures.
N2 adsorption-desorption measurements of TiO2/HNRs@SiO2 thermally annealed at different temperatures were performed on a Quantachrome Autosorb-iQ surface area and pore size analyzer (Quantachrome Instruments, USA). The TiO2/HNRs@SiO2 samples were degassed at 100 ℃ for 10 h before the measurements. The Brunauer–Emmett–Teller (BET) method was used to calculate the specific surface areas. The pore size distributions of thermally annealed TiO2/HNRs@SiO2 were calculated from the desorption branches of their isotherms using the Barrett–Joyner–Halenda (BJH) method.
2.7. Photocatalytic Activity of Thermally Annealed TiO2/HNRs@SiO2
The organic dye, MB, was removed by photocatalytic decomposition under equilibrium batch conditions. A series of solutions containing predetermined concentrations of MB was prepared by diluting a standard stock solution. All experiments were conducted in duplicate under ambient conditions at 25 ℃. Briefly, 30 mL of 5–15 mg/L MB solution was added to individual 100 mL beakers containing different amounts of TiO2/HNRs@SiO2 photocatalysts thermally annealed at different temperatures. The samples were mixed using a magnetic stirrer at 200 rpm for 30 min under dark conditions (i.e., 30 min before light irradiation) to establish equilibrium of the suspension. The samples were irradiated using a solar simulator (LCS-100, Model 94011A, Oriel) with 100 mW/cm2 (100 mJ/(s·cm2)) solar irradiance that is composed of ~54% infrared (> 700 nm), ~43% visible (400–700 nm), and ~3% ultraviolet (< 400 nm) light for 150 min. At each 30-minute interval, the samples were centrifuged to remove the TiO2/HNRs@SiO2 photocatalysts. The remaining solutions were analyzed by spectrophotometry (JP/UV-3600 UV-VIS spectrometer, Shimadzu, Japan) at λ = 664 nm to determine the photodecomposition of MB by quantifying the amount of MB dyes remaining in the solution.
The effects of different photocatalyst dosages and pH values were investigated in the range of 25–100 mg/L and pH 4.0–10.0 with an initial dye concentration of 10 mg/L at 25 ℃. The optimal pH value for yielding the maximum photocatalytic removal efficiency for the remaining experiments was determined. Scavenger tests were conducted using 0.02 mol/L tert-butanol (t-BuOH) and ethylenediaminetetraacetate (EDTA) as chemical scavengers to detect the reactive species, such as ∙OH and h+ from photoexcited TiO2/HNRs@SiO2, respectively.
2.8. Statistical Analysis
Statistical analyses were conducted using Origin 8 and Microsoft Office Excel 2016. The statistical comparisons were analyzed using a Student’s t-test and two-way ANOVA (*P < 0.05, **P < 0.01, and ***P < 0.001)
3. Results and Discussion
Morphologies and Crystal Structures
Figure 1 presents the strategy for preparing TiO2/HNRs@SiO2 from GNRs. First, it involves the hydrothermal synthesis of GNRs. Second, it uses a SiO2 coating on the surface of GNRs to form GNRs@SiO2. The SiO2 coating serves dual purposes: to promote dispersion and prevent agglomeration and passivate the surface of the Fe-containing nanorod core to prevent ilmenite (FeTiO3) formation from the thermal annealing process, which lowers the photocatalytic performance. Third, it involves growing amorphous TiO2 on the GNRs@SiO2 surface and simultaneously transforming the GNRs to HNR under hydrothermal conditions to form TiO2/HNRs@SiO2. Finally, they are annealed thermally to form photocatalytically active TiO2/HNRs@SiO2.
Figure 2A–C presents the representative FESEM and inset TEM images of GNRs, GNRs@SiO2, and TiO2/HNRs@SiO2 before thermal annealing, showing the unique morphologies of the SiO2 coating on the GNRs and flower-like TiO2 nanostructures grown on the SiO2. The XRD patterns (Figure 2D) of the GNRs and GNRs@SiO2 revealed major diffraction peaks at 2θ = ~21.3, 33.3, 34.8, 36.7, and 53.3°, corresponding to the (110), (130), (021), (111), and (221) planes of α-FeOOH (JCPDS No. 29-0713) [24], respectively, with an orthorhombic crystal structure because of the inner core of GNRs. The XRD patterns of TiO2/HNRs@SiO2 (Figure 2D) showed peaks at 2θ = ~24.1, 33.1, 35.6, and 54.0°, which were indexed to the (012), (104), (110), and (116) planes of α-Fe2O3 (JCPDS No. 33-0664) with a rhombohedral crystal structure [33]. Their peak intensities were less pronounced than those of α-Fe2O3 because of the inner core of TiO2/HNRs@SiO2, possibly due to the presence of an amorphous TiO2 coating.
The FT-IR spectra of GNRs and GNRs@SiO2 (Figure 2E) exhibited the IR bands at 894 and 794 cm–1, which were assigned to Fe–O vibrational modes for α-FeOOH [24] before thermal annealing. These IR bands disappeared in the FT-IR spectrum of TiO2/HNRs@SiO2 (Figure 2E), suggesting a complete thermal transformation of the inner core from α-FeOOH to α-Fe2O3. In addition, the IR bands at 1085 and 472 cm–1 in the FT-IR spectra of GNRs@SiO2 and TiO2/HNRs@SiO2, which were assigned to symmetric bending Si–O–Si vibrational modes in SiO2, indicated the presence of SiO2 coating on the nanorods [34].
Figure 3 shows representative FESEM images and the corresponding XRD patterns of TiO2/HNRs@SiO2 thermally annealed at 400, 600, and 800 ℃. The XRD patterns of thermally annealed TiO2/HNRs@SiO2 (Figure 3D) confirmed the major diffraction peaks for the anatase (JCPDS No. 21-1276) and rutile (JCPDS No. 21-1272) phases of TiO2 [35]. The relative fraction of the rutile and anatase TiO2 phases in the thermally annealed TiO2/HNRs@SiO2 was determined quantitatively from the Rietveld refinement, respectively [31,36]. Figure S1 presents a typical result of the refinement, and Table S1 lists the relative quantities of the phases modeled with the Rietveld refinement. All refinements consistently produced converged GoF values of less than 1.40, indicating excellent refinement quality [37]. The relative anatase/rutile TiO2 fraction in the TiO2/HNRs@SiO2 was 100/0, 81.4/18.6, and 6.3/93.7 (%/%) at annealing temperatures of 400, 600, and 800 ℃, respectively. Hence, the ratio between rutile and anatase TiO2 increases as the annealing temperature increases.
The survey XPS spectra of TiO2/HNRs@SiO2 thermally annealed at 400, 600, and 800 ℃ over the full energy range confirmed the presence of Fe, Ti, O, and Si. (Figure S2) High-resolution XPS spectra of TiO2/HNRs@SiO2 annealed at 400, 600, and 800 ℃ (Figures S3 and S4) were deconvoluted to obtain their best fits and the following binding energies (BEs) summarized in Table S2. Two peaks at approximately 723.2 and 710.2 eV with a peak separation of 13.0 eV (Figure S3) from TiO2/HNRs@SiO2 annealed at 400, 600, and 800 ℃ were consistent with the doublet of Fe(III) 2p1/2 and 2p3/2 reported for hematite nanostructures [33]. In addition, two peaks at approximately 464.2 and 458.5 eV with a peak separation of 5.7 eV (Figure S3) from TiO2/HNRs@SiO2 annealed at 400 ℃ were in excellent agreement with the doublet of Ti(IV) 2p1/2 and 2p3/2 reported for nanostructured anatase TiO2 [38]. In addition, the shoulder peak at 460.6 eV from TiO2/HNRs@SiO2 annealed at 600 and 800 ℃ was assigned to Ti(III) 2p1/2, which was in good agreement with Ti(III) because of the presence of Ti2O3 or oxygen vacancies [39,40]. The O 1s peak at 529.7 eV was similar to the BE of the lattice oxygen in anatase and rutile TiO2 [41]. The other O 1s peaks at 531.7 and 532.8 eV were assigned to the presence of Ti2O3 or non-lattice oxygen mixed with the Fe–O–Si/Ti–O–Si and Si–O–Si moieties, respectively [42,43,44,45]. The Si 2p peaks at 101.6 and 103.3 eV were assigned to the presence of silicon suboxides (i.e., Fe–O–Si or Ti–O–Si) and fully oxidized silicon (i.e., Si–O–Si), respectively [42,44,46]. Our findings suggest that the samples become oxygen-rich and develop oxygen vacancies as the annealing temperature increases, leading to the partial conversion of Ti4+ to Ti3+, which is attributed to the transitioning of the anatase into the rutile phase [47]. In addition, these results are consistent with those from the XRD patterns of TiO2/HNRs@SiO2 annealed at 400, 600, and 800 ℃.
Figure 4A presents UV-VIS DRS spectra of TiO2/HNRs@SiO2 annealed at 400, 600, and 800 ℃. Their optical spectra included strong absorption in the visible wavelength region. The optical bandgap (Eg) was estimated using the Tauc’s equation [48]:
where h, ν, B, and n are Planck’s constant (4.1357 × 10⁻¹⁵ eV·s), light frequency, a constant, and a coefficient associated with the electronic transition (i.e., n = 2 for indirect allowed transitions). Figure 4B presents the plots of (αhν)2 versus hν. The value of Eg, was determined by extrapolating the straight-line portion of plots of the energy axis (Figure 4B). The Eg value TiO2/HNRs@SiO2 annealed at 400, 600, and 800 ℃ was 1.99, 1.99 and 2.03 eV, respectively. These results suggest that thermally activated TiO2/HNRs@SiO2 photocatalysts improve the light absorption characteristics in the visible region of the solar spectrum compared to pure TiO2 systems, likely due to the formation of TiO2/α-Fe2O3 heterostructures. α-Fe2O3 has a relatively narrow bandgap (i.e., ~1.9–2.2 eV) compared to traditional TiO2-based photocatalysts with a wide bandgap (i.e., ~3.0–3.2 eV). Despite its favorable narrow bandgap, α-Fe2O3 suffers from rapid electron–hole recombination, which limits its photocatalytic efficiency. The narrow bandgap of thermally activated TiO2/HNRs@SiO2 indicates the formation of TiO2/α-Fe2O3 heterostructures to improve light absorption and charge separation, highlighting their suitability and efficiency under natural sunlight.
αhν = B(hν – Eg)n
Figure 5A and B present the photocatalytic MB degradation kinetics using thermally activated TiO2/HNRs@SiO2 as a function of the TiO2/HNRs@SiO2 dosage and MB concentration under ~150 min solar irradiation. First, the removal efficiency via photocatalytic decomposition using TiO2/HNRs@SiO2 annealed at 400 ℃ increased to ~83.8% as the TiO2/HNRs@SiO2 dosage was increased from 25 to 100 mg/mL under solar irradiation using a 10 mg/L MB concentration at pH = ~7 and 25 ℃. Second, the removal efficiency increased to ~95% as the MB concentration was decreased from 15 to 5 mg/L using 75 mg/L TiO2/HNRs@SiO2 annealed at 400 ℃ at pH = ~7 and 25 ℃. These results suggest that higher MB concentrations lead to more adsorbed MB molecules, leaving fewer active sites available and reducing the number of photons reaching the photocatalyst surface, which lowers the photoinduced generation of reactive oxygen species (ROS), such as hydroxyl, superoxide, and peroxide radicals [3].
Figure 6A–C show the photocatalytic MB degradation kinetics of TiO2/HNRs@SiO2 activated by annealing at 400, 600, and 800 ℃ as a function of the solution pH = 4, 7, and 10, respectively. First, the removal efficiency of TiO2/HNRs@SiO2 annealed at 400 ℃ was ~43.8% at pH = 4.0. The removal efficiency decreased slightly to ~31.0% at pH = 4.0 as the annealing temperature was increased to 600 ℃. The removal efficiency of TiO2/HNRs@SiO2 annealed at 800 ℃ was ~28.8%, similar to that at 600 ℃. Second, the removal efficiencies of activated TiO2/HNRs@SiO2_400 increased up to ~89.2% as the solution pH was increased from 4.0 to 10.0. These results were comparable to or marginally higher than those reported for TiO2 nanoparticles [49], bismuth nanoparticles coated on silicon nanowires [50], NiSe 2-ZnO nanocomposites [51], and Ni-ZIF-8 metal-organic frameworks [52], highlighting the effectiveness of TiO2/HNRs@SiO2 photocatalysts (Table S3).
Photocatalytic MB degradation involves the adsorption of MB molecules onto the surface of activated TiO2/HNRs@SiO2. The photocatalytic experiments include 30 min to reach adsorption–desorption equilibrium in the dark, followed by irradiation of the light source to initiate the photoreaction. The improved removal efficiency at a pH > 7 was attributed to the enhanced interactions between the MB molecules and activated TiO2/HNRs@SiO2. The nature of the interactions was noncovalent and could be described either by physical or electrostatic adsorption. The physical adsorption of MB increases as the specific surface area of the activated TiO2/HNRs@SiO2 increases. Hence, the specific surface areas of activated TiO2/HNRs@SiO2 were determined from their low-temperature N2 adsorption-desorption isotherms using the BET model. Figure S5 presents the N2 sorption isotherms of activated TiO2/HNRs@SiO2. The shape of the TiO2/HNRs@SiO2 isotherm annealed at 400 ℃ was similar to that of the characteristic type IV isotherm described in the IUPAC classification [53]. In contrast, the TiO2/HNRs@SiO2 isotherms annealed at 600 and 800 ℃ were similar to those of the characteristic type II isotherm described in the IUPAC classification [53]. The measured specific surface areas of TiO2/HNRs@SiO2 annealed at 400, 600, and 800 ℃ were 281.1, 89.7, and 36.8 m2/g, respectively (Table S4). Hence, the amount of MB adsorbed on the surface of activated TiO2/HNRs@SiO2 is proportional to its specific surface area. Figure S6 shows the zeta potentials of TiO2/HNRs@SiO2 annealed at 400, 600, and 800 ℃. Considering the pKa of MB (pKa = ~3.8), the predominant MB species are cationic in aqueous solutions at pH > 3.8 [54]. The zeta potential of TiO2/HNRs@SiO2 annealed at 400, 600, and 800 ℃ was –29.4 ± 0.6, –24.7 ± 0.5 and –30.7 ± 0.7 mV at pH = ~7.0, respectively. Therefore, higher MB adsorption occurred on the surface of negatively charged, activated TiO2/HNRs@SiO2. Furthermore, the superior MB removal efficiency of TiO2/HNRs@SiO2 annealed at 400 ℃ compared to 600 ℃ and 800 ℃ was attributed to the higher adsorption, driven by the synergistic effects of increased specific surface area and enhanced electrostatic interactions (e.g., higher negative zeta potentials) at neutral and higher pH. The MB molecules must be in close proximity to the active sites of the photocatalytic TiO2/HNRs@SiO2 in order for the photoreaction to occur. Accordingly, higher adsorption ensures that more MB molecules are localized on the photocatalyst surface, allowing direct interactions with the photochemically induced ROS, providing the rationale for enhanced removal efficiency.
The adsorption–desorption equilibrium of MB molecules on the active sites of the photocatalytic TiO2/HNRs@SiO2 under dark conditions dictates the initial amount of MB molecules that will be photodegraded when the photoirradiation starts. Electron–hole pairs are formed when the photocatalysts are exposed to light with an energy equal to or greater than their band gap. Electrons and holes, if not recombined, participate in surface reactions to generate ROS that attack and break down the adsorbed MBs into smaller intermediates and ultimately to CO2, H2O, and other non-toxic compounds. Three assumptions were proposed to establish adsorption equilibrium, a rate-determining step for the photocatalytic MB degradation kinetics. First, the rate of MB desorption is relatively insignificant and can be neglected, leading to adsorption as an irreversible process. Second, the MB concentration in solution is relatively constant during adsorption. Third, the photodegradation, followed by the desorption of photochemically decomposed intermediates, is relatively faster than the adsorption. These assumptions suggest that the total removal efficiency can be estimated as the sum of two factors: 1) the adsorption of MB under dark conditions (i.e., dark efficiency) and 2) the photochemical decomposition of the adsorbed MB when exposed to light (i.e., light efficiency). Table S5 lists these efficiencies. For example, TiO2/HNRs@SiO2 annealed at 400 ℃ exhibited an increase in removal efficiency from 33.8% in the dark to 75.4% after exposure to light. TiO2/HNRs@SiO2 annealed at 600 and 800 ℃ showed much lower dark efficiencies of 5.6 and 7.7%, which improved to 51.4 and 55.1% under light, respectively. The net light efficiency of TiO2/HNRs@SiO2 annealed at 400, 600, and 800 ℃ from photochemical decomposition was 41.6, 45.8, and 47.4%, respectively. These results suggest that the photochemical decomposition efficiency increased slightly as the annealing temperature increased, likely because of the rutile-to-anatase TiO2 ratio of thermally annealed TiO2/HNRs@SiO2. In particular, with its higher rutile content, TiO2/HNRs@SiO2 annealed at 800 ℃ exhibited enhanced light efficiency because the visible light absorption and charge transfer characteristics improved at a higher rutile-to-anatase ratio [55]. These findings are consistent with previous studies highlighting the significant impact of the anatase-to-rutile mixed ratio on photocatalytic performance [55,56,57].
Figure S7 presents the results of scavenger tests to identify and evaluate the contributions of different reactive species involved in the photocatalytic degradation of MB. Scavengers such as t-BuOH and EDTA react selectively with particular reactive species, such as hydroxyl radicals (HO·) and photogenerated holes (h+), respectively. The removal efficiency of MB by TiO2/HNRs@SiO2 annealed at 400 ℃ decreased by 6.7 and 31.7% after adding t-BuOH and EDTA, respectively, compared to the control without scavengers. EDTA captures h+, reducing its availability for the direct oxidation of MB and ·OH generation by h+ or water oxidation, suggesting that h+ plays a significant role in breaking down MB during photocatalysis [58].
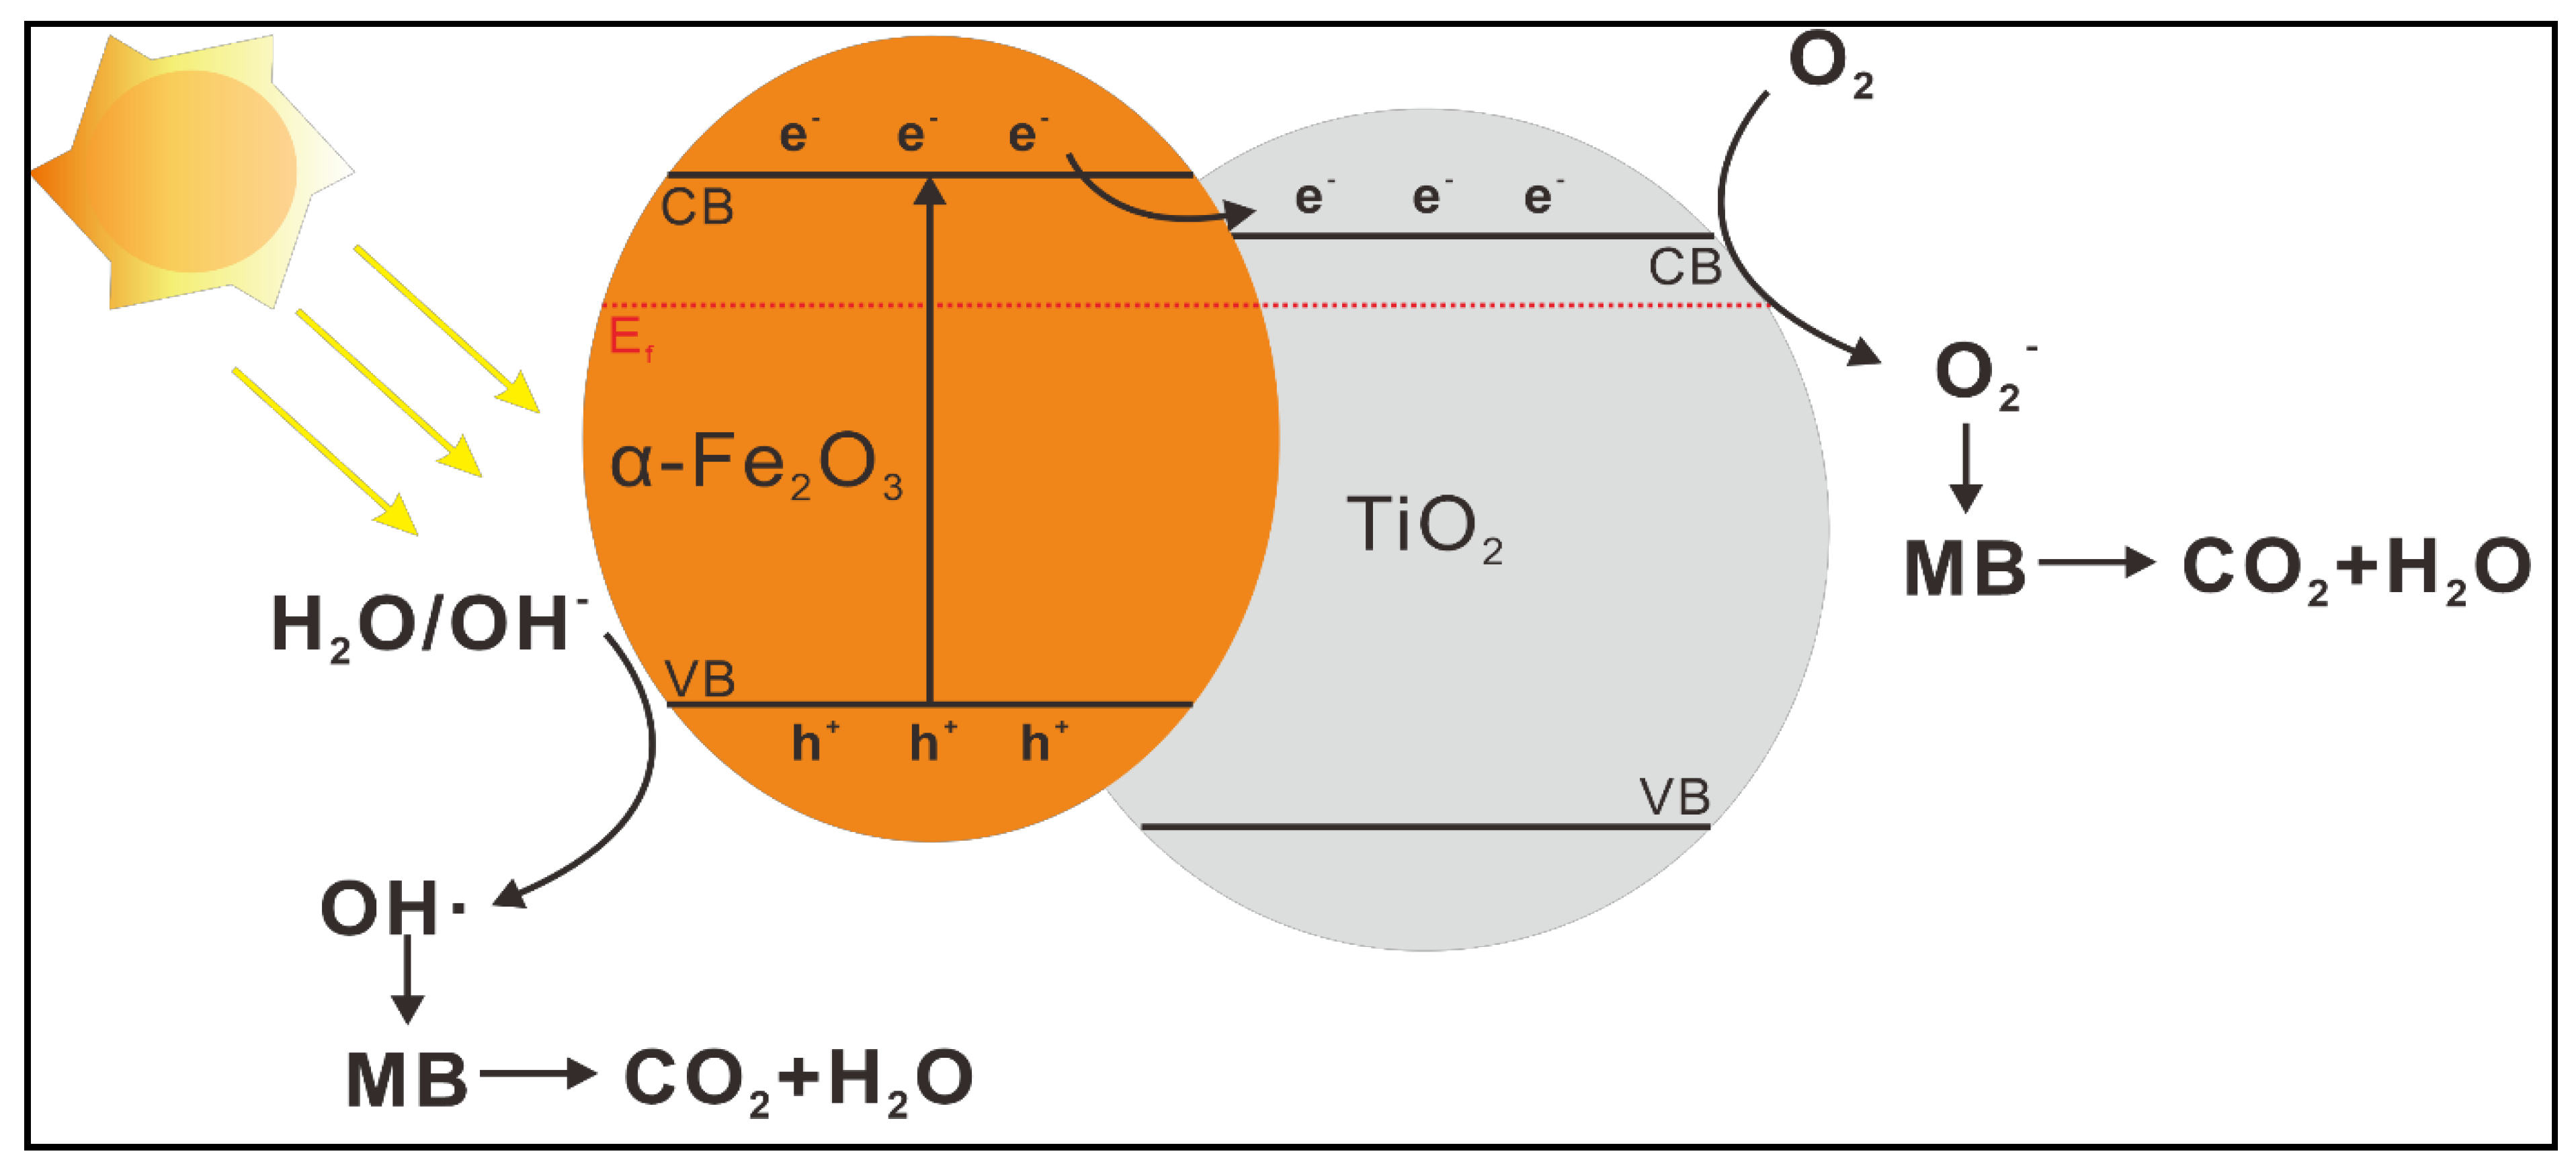
Figure 7 outlines the potential mechanism for photocatalytic MB decomposition using activated TiO2/HNRs@SiO2 nanocomposite photocatalysts. An electron–hole pair is produced when TiO2/HNRs@SiO2 nanocomposite photocatalysts are irradiated with visible light. The TiO2/α-Fe2O3 heterostructures within the nanorods facilitate the charge separation, effectively reducing their recombination. The resulting photogenerated electrons (e–) can react with dissolved oxygen to form superoxide radicals (O2·–), while the photogenerated holes (h+) react with water or hydroxide ions (H2O/OH–) to produce hydroxyl radicals (HO·). These can be pathways to generate reactive oxygen species that can promote the efficient breakdown of MB dyes.
4. Conclusions
This paper reported the facile synthesis of sub-100 nm diameter TiO2/α-Fe2O3@SiO2 nanorods (TiO2/HNRs@SiO2) from hydrated α-FeOOH nanorods (GNRs) via solvo-hydrothermal reactions. The surface of the GNRs was passivated with SiO2, and a thin layer of amorphous TiO2 was grown on the SiO2. Simultaneously, the nanorod core was transformed from α-FeOOH to α-Fe2O3 under hydrothermal conditions. Thermal annealing of TiO2/HNRs@SiO2 transformed amorphous TiO2 into photosensitizing crystalline TiO2 domains containing an anatase and rutile mixed phase. The photocatalytic decomposition of MB using thermally annealed TiO2/HNRs@SiO2 photocatalysts was confirmed, and the conditions for the photocatalytic reaction, such as thermal annealing temperatures, MB concentrations, and pH, were optimized. Approximately ~95% MB removal efficiency was achieved under mild conditions of pH = ~7 and room temperature with ~150 min of solar irradiation. The enhanced removal efficiency was attributed to the rapid adsorption of MB onto the surface of TiO2/HNRs@SiO2 via favorable electrostatic interactions and the synergistic integration of multiple materials, such as α-Fe2O3 and TiO2, into nanorod heterostructures with a narrow bandgap, allowing them to absorb visible light for efficient photocatalytic reactions from the improved charge separation.
Considering their potential for solar-driven advanced water treatment and sustainable environmental remediation, optimizing the synthesis of synergistic nanorod heterostructures for visible-light activation with the desired photocatalytic properties is an important goal for developing next-generation photocatalysts with enhanced selectivity and reusability. Engineering phase junctions within the photocatalysts can improve light absorption, boosting charge separation efficiency. In addition, optimizing the charge carrier dynamics by tuning the band alignment within the photocatalysts to improve the photocatalytic reactions will form an integral part of an ongoing study–a promising future research direction toward that goal.
Supplementary Materials
The following supporting information can be downloaded at the website of this paper posted on Preprints.org.
Author Contributions
Yujeong Jeong: methodology, investigation, resource, data curation, formal analysis, writing–original draft, and visualization. Kyubeom Lee: methodology, investigation, resource, data curation, and writing–review and editing. Gaeun Kim: methodology, investigation, resource, data curation, and writing–review and editing. Eun-Hye Jang: methodology, investigation, resource, data curation, and writing–review and editing. Youngson Choe: writing–review. Seok Kim: writing–review. Sungwook Chung: conceptualization, writing–original draft, writing–review and editing, visualization, supervision, project administration, and funding acquisition.
Acknowledgments
This work was supported by a 2-Year Research Grant of Pusan National University.
References
- Verma, N.; Chundawat, T.S.; Chandra, H.; Vaya, D. An efficient time reductive photocatalytic degradation of carcinogenic dyes by TiO2-GO nanocomposite. Materials Research Bulletin 2023, 158, 112043. [Google Scholar] [CrossRef]
- Lingamdinne, L.P.; Koduru, J.R.; Karri, R.R. A comprehensive review of applications of magnetic graphene oxide based nanocomposites for sustainable water purification. Journal of environmental management 2019, 231, 622–634. [Google Scholar] [CrossRef]
- Fiaz, M.; Sohail, M.; Nafady, A.; Will, G.; Wahab, M.A. A facile two-step hydrothermal preparation of 2D/2D heterostructure of Bi2WO6/WS2 for the efficient photodegradation of methylene blue under sunlight. Environmental Research 2023, 234, 116550. [Google Scholar] [CrossRef]
- Chen, H.; Yu, X.; Wang, X.; He, Y.; Zhang, C.; Xue, G.; Liu, Z.; Lao, H.; Song, H.; Chen, W. Dyeing and finishing wastewater treatment in China: State of the art and perspective. Journal of Cleaner Production 2021, 326, 129353. [Google Scholar] [CrossRef]
- Naseem, K.; Farooqi, Z.H.; Begum, R.; Wu, W.; Irfan, A.; Al-Sehemi, A.G. Silver nanoparticles engineered polystyrene-poly (n-isopropylmethacrylamide-acrylic acid) core shell hybrid polymer microgels for catalytic reduction of Congo red. Macromolecular Chemistry and Physics 2018, 219, 1800211. [Google Scholar] [CrossRef]
- Anjugam Vandarkuzhali, S.A.; Pugazhenthiran, N.; Mangalaraja, R.; Sathishkumar, P.; Viswanathan, B.; Anandan, S. Ultrasmall plasmonic nanoparticles decorated hierarchical mesoporous TiO2 as an efficient photocatalyst for photocatalytic degradation of textile dyes. ACS omega 2018, 3, 9834–9845. [Google Scholar] [CrossRef] [PubMed]
- Tkaczyk, A.; Mitrowska, K.; Posyniak, A. Synthetic organic dyes as contaminants of the aquatic environment and their implications for ecosystems: A review. Science of the total environment 2020, 717, 137222. [Google Scholar] [CrossRef] [PubMed]
- Li, W.; Mu, B.; Yang, Y. Feasibility of industrial-scale treatment of dye wastewater via bio-adsorption technology. Bioresource technology 2019, 277, 157–170. [Google Scholar] [CrossRef]
- Kolya, H.; Kang, C.-W. Toxicity of Metal Oxides, Dyes, and Dissolved Organic Matter in Water: Implications for the Environment and Human Health. Toxics 2024, 12, 111. [Google Scholar] [CrossRef]
- Periyasamy, A.P. Recent advances in the remediation of textile-dye-containing wastewater: prioritizing human health and sustainable wastewater treatment. Sustainability 2024, 16, 495. [Google Scholar] [CrossRef]
- Rafiq, A.; Ikram, M.; Ali, S.; Niaz, F.; Khan, M.; Khan, Q.; Maqbool, M. Photocatalytic degradation of dyes using semiconductor photocatalysts to clean industrial water pollution. Journal of Industrial and Engineering Chemistry 2021, 97, 111–128. [Google Scholar] [CrossRef]
- Ouda, M.; Kadadou, D.; Swaidan, B.; Al-Othman, A.; Al-Asheh, S.; Banat, F.; Hasan, S.W. Emerging contaminants in the water bodies of the Middle East and North Africa (MENA): A critical review. Science of the Total Environment 2021, 754, 142177. [Google Scholar] [CrossRef]
- Hieu, V.Q.; Phung, T.K.; Nguyen, T.-Q.; Khan, A.; Doan, V.D.; Tran, V.A. Photocatalytic degradation of methyl orange dye by Ti3C2–TiO2 heterojunction under solar light. Chemosphere 2021, 276, 130154. [Google Scholar] [CrossRef] [PubMed]
- Motamedisade, A.; Heydari, A.; Osborn, D.; Alotabi, A.S.; Andersson, G.G. Au9 clusters deposited as co-catalysts on S-modified mesoporous TiO2 for photocatalytic degradation of methyl orange. Applied Surface Science 2024, 655, 159475. [Google Scholar] [CrossRef]
- Saeed, M.; Asghar, H.; Khan, I.; Akram, N.; Usman, M. Synthesis of TiO2-g-C3N4 for efficient photocatalytic degradation of Congo Red dye. Catalysis Today 2025, 447, 115154. [Google Scholar] [CrossRef]
- Yusuff, A.S.; Popoola, L.T.; Gbadamosi, A.O.; Igbafe, A.I. Coal fly ash-supported ZnO-promoted TiO2 towards UV photocatalytic degradation of anthraquinone dye: Parametric optimization, kinetics and mechanism studies. Materials Today Communications 2024, 38, 107999. [Google Scholar] [CrossRef]
- Hamza, M.A.; El-Sayed, A.; El-Shazly, A.N.; Elmahgary, M.G. Efficient utilization of ceramic waste (cyclone dust waste) for enhancing the photocatalytic performance of TiO2 nanoparticles toward Rhodamine B photodegradation. Journal of Cleaner Production 2024, 434, 140341. [Google Scholar] [CrossRef]
- Zhang, L.; Zhang, J.; Yu, H.; Yu, J. Emerging S-scheme photocatalyst. Advanced materials 2022, 34, 2107668. [Google Scholar] [CrossRef]
- Ghamarpoor, R.; Fallah, A.; Jamshidi, M. A review of synthesis methods, modifications, and mechanisms of ZnO/TiO2-based photocatalysts for photodegradation of contaminants. ACS omega 2024, 9, 25457–25492. [Google Scholar] [CrossRef]
- Rafique, M.; Hajra, S.; Irshad, M.; Usman, M.; Imran, M.; Assiri, M.A.; Ashraf, W.M. Hydrogen production using TiO2-based photocatalysts: a comprehensive review. ACS omega 2023, 8, 25640–25648. [Google Scholar] [CrossRef]
- Mandzy, N.; Grulke, E.; Druffel, T. Breakage of TiO2 agglomerates in electrostatically stabilized aqueous dispersions. Powder technology 2005, 160, 121–126. [Google Scholar] [CrossRef]
- Herrmann, J.-M. Heterogeneous photocatalysis: fundamentals and applications to the removal of various types of aqueous pollutants. Catalysis today 1999, 53, 115–129. [Google Scholar] [CrossRef]
- Degabriel, T.; Colaço, E.; Domingos, R.F.; El Kirat, K.; Brouri, D.; Casale, S.; Landoulsi, J.; Spadavecchia, J. Factors impacting the aggregation/agglomeration and photocatalytic activity of highly crystalline spheroid-and rod-shaped TiO2 nanoparticles in aqueous solutions. Physical Chemistry Chemical Physics 2018, 20, 12898–12907. [Google Scholar] [CrossRef]
- Amani-Ghadim, A.R.; Alizadeh, S.; Khodam, F.; Rezvani, Z. Synthesis of rod-like α-FeOOH nanoparticles and its photocatalytic activity in degradation of an azo dye: Empirical kinetic model development. Journal of Molecular Catalysis A: Chemical 2015, 408, 60–68. [Google Scholar] [CrossRef]
- Ullah, S.; Ferreira-Neto, E.P.; Pasa, A.A.; Alcântara, C.C.; Acuña, J.J.; Bilmes, S.A.; Ricci, M.L.M.; Landers, R.; Fermino, T.Z.; Rodrigues-Filho, U.P. Enhanced photocatalytic properties of core@ shell SiO2@ TiO2 nanoparticles. Applied Catalysis B: Environmental 2015, 179, 333–343. [Google Scholar] [CrossRef]
- Rasalingam, S.; Peng, R.; Koodali, R.T. Removal of hazardous pollutants from wastewaters: applications of TiO2-SiO2 mixed oxide materials. Journal of Nanomaterials 2014, 2014, 617405. [Google Scholar] [CrossRef]
- Periyat, P.; Baiju, K.; Mukundan, P.; Pillai, P.; Warrier, K. High temperature stable mesoporous anatase TiO2 photocatalyst achieved by silica addition. Applied Catalysis A: General 2008, 349, 13–19. [Google Scholar] [CrossRef]
- Liu, H.; Ji, S.; Yang, H.; Zhang, H.; Tang, M. Ultrasonic-assisted ultra-rapid synthesis of monodisperse meso-SiO2@Fe3O4 microspheres with enhanced mesoporous structure. Ultrasonics sonochemistry 2014, 21, 505–512. [Google Scholar] [CrossRef]
- Chen, J.S.; Tan, Y.L.; Li, C.M.; Cheah, Y.L.; Luan, D.; Madhavi, S.; Boey, F.Y.C.; Archer, L.A.; Lou, X.W. Constructing hierarchical spheres from large ultrathin anatase TiO2 nanosheets with nearly 100% exposed (001) facets for fast reversible lithium storage. Journal of the American Chemical Society 2010, 132, 6124–6130. [Google Scholar] [CrossRef]
- Rodriguezcarvajal, J. Recent Advances in Magnetic-Structure Determination by Neutron Powder Diffraction. Physica B: Condensed Matter 1993, 192, 55–69. [Google Scholar] [CrossRef]
- Rietveld, H.M. A Profile Refinement Method for Nuclear and Magnetic Structures. J Applied Crystallography 1969, 2, 65–71. [Google Scholar] [CrossRef]
- Sakata, M.; Cooper, M. An analysis of the Rietveld refinement method. J Applied Crystallography 1979, 12, 554–563. [Google Scholar] [CrossRef]
- Jeong, Y.; Kim, B.; Sathiyavahisan, L.P.; Mahadi, R.; Lee, K.; Jang, E.-H.; Choe, Y.; Oh, Y.-K.; Chung, S. Preparation of Two-Dimensional Fe3O4 Nanodisks and Nanosheets Transformed from α-Fe2O3 Analogues and Their Applications in Magnetic Field-Assisted Microalgal Harvesting Biorefinery Processes. ACS Sustainable Chemistry & Engineering 2023, 12, 2018–2027. [Google Scholar]
- Moon, G.; Lee, N.; Kang, S.; Park, J.; Kim, Y.-E.; Lee, S.-A.; Chitumalla, R.K.; Jang, J.; Choe, Y.; Oh, Y.-K. Hydrothermal synthesis of novel two-dimensional α-quartz nanoplates and their applications in energy-saving, high-efficiency, microalgal biorefineries. Chemical Engineering Journal 2021, 413, 127467. [Google Scholar] [CrossRef]
- Wang, Y.-H.; Dang, V.-H.; Huang, H.J.; Wu, J.C. New viewpoints of magnetic-field influence on photocatalysis via 2-propanol oxidation. Catalysis Communications 2023, 179, 106691. [Google Scholar] [CrossRef]
- Ha, P.S.; Youn, H.-J.; Jung, H.S.; Hong, K.S.; Park, Y.H.; Ko, K.H. Anatase–rutile transition of precipitated titanium oxide with alcohol rinsing. Journal of Colloid and Interface Science 2000, 223, 16–20. [Google Scholar] [CrossRef]
- Post, J.E.; Bish, D.L. Rietveld refinement of crystal structures using powder X-ray diffraction data. Modern powder diffraction 1989, 20, 277–308. [Google Scholar]
- Cao, J.; Song, X.-Z.; Kang, X.; Dai, Z.; Tan, Z. One-pot synthesis of oleic acid modified monodispersed mesoporous TiO2 nanospheres with enhanced visible light photocatalytic performance. Advanced Powder Technology 2018, 29, 1925–1932. [Google Scholar] [CrossRef]
- Kim, H.J.; Kim, J.; Hong, B. Effect of hydrogen plasma treatment on nano-structured TiO2 films for the enhanced performance of dye-sensitized solar cell. Applied surface science 2013, 274, 171–175. [Google Scholar] [CrossRef]
- Bharti, B.; Kumar, S.; Lee, H.-N.; Kumar, R. Formation of oxygen vacancies and Ti3+ state in TiO2 thin film and enhanced optical properties by air plasma treatment. Scientific reports 2016, 6, 32355. [Google Scholar] [CrossRef]
- Chong, R.; Fan, Y.; Du, Y.; Liu, L.; Chang, Z.; Li, D. Hydroxyapatite decorated TiO2 as efficient photocatalyst for selective reduction of CO2 with H2O into CH4. International Journal of Hydrogen Energy 2018, 43, 22329–22339. [Google Scholar] [CrossRef]
- Xiong, J.; Li, G.; Hu, C. Treatment of methylene blue by mesoporous Fe/SiO2 prepared from rice husk pyrolytic residues. Catalysis Today 2020, 355, 529–538. [Google Scholar] [CrossRef]
- Tissot, H.; Li, L.; Shaikhutdinov, S.; Freund, H.-J. Preparation and structure of Fe-containing aluminosilicate thin films. Physical Chemistry Chemical Physics 2016, 18, 25027–25035. [Google Scholar] [CrossRef]
- Liu, B.; Zhang, W.; Zhang, Q.; Guan, Y.; Lu, Z. Synergistic Promotion of the Photocatalytic Preparation of Hydrogen Peroxide (H2O2) from Oxygen by Benzoxazine and Si─ O─ Ti Bond. Small 2023, 19, 2303907. [Google Scholar] [CrossRef]
- Zhong, N.; Shima, H.; Akinaga, H. Mechanism of the performance improvement of TiO2-x-based field-effect transistor using SiO2 as gate insulator. AIP advances 2011, 1. [Google Scholar] [CrossRef]
- Ma, H.-P.; Yang, J.-H.; Yang, J.-G.; Zhu, L.-Y.; Huang, W.; Yuan, G.-J.; Feng, J.-J.; Jen, T.-C.; Lu, H.-L. Systematic study of the SiOx film with different stoichiometry by plasma-enhanced atomic layer deposition and its application in SiOx/SiO2 super-lattice. Nanomaterials 2019, 9, 55. [Google Scholar] [CrossRef]
- Byrne, C.; Fagan, R.; Hinder, S.; McCormack, D.E.; Pillai, S.C. New approach of modifying the anatase to rutile transition temperature in TiO2 photocatalysts. RSC Advances 2016, 6, 95232–95238. [Google Scholar] [CrossRef]
- Tauc, J. Optical properties and electronic structure of amorphous Ge and Si. Materials research bulletin 1968, 3, 37–46. [Google Scholar] [CrossRef]
- Bopape, D.A.; Tetana, Z.N.; Mabuba, N.; Motaung, D.E.; Hintsho-Mbita, N.C. Biosynthesis of TiO2 nanoparticles using Commelina benghanlensis for the photodegradation of methylene blue dye and antibiotics: Effect of plant concentration. Results in Chemistry 2023, 5, 100825. [Google Scholar] [CrossRef]
- Naffeti, M.; Zaïbi, M.A.; Nefzi, C.; García-Arias, A.V.; Chtourou, R.; Postigo, P.A. Highly efficient photodegradation of methylene blue by a composite photocatalyst of bismuth nanoparticles on silicon nanowires. Environmental Technology & Innovation 2023, 30, 103133. [Google Scholar]
- Khan, S.U.; Hussain, R.; Ali, Z.; Maryam, R.; Hussain, A.; Alajmi, M.F.; ur Rahman, S.; Zulfiqar, S.; Cochran, E.W. Facile synthesis of NiSe2–ZnO nanocomposites for enhanced photocatalysis and wastewater remediation. RSC advances 2024, 14, 28626–28637. [Google Scholar] [CrossRef]
- Zulfa, L.L.; Hidayat, A.R.P.; Utomo, W.P.; Subagyo, R.; Kusumawati, E.N.; Kusumawati, Y.; Hartanto, D.; Widyastuti, W.; Ediati, R. Facile synthesis of Ni-ZIF-8 with improved photodegradation performance for methylene blue. Case Studies in Chemical and Environmental Engineering 2024, 10, 100828. [Google Scholar] [CrossRef]
- Sing, K.S. Reporting physisorption data for gas/solid systems with special reference to the determination of surface area and porosity (Recommendations 1984). Pure and applied chemistry 1985, 57, 603–619. [Google Scholar] [CrossRef]
- Salazar-Rabago, J.J.; Leyva-Ramos, R.; Rivera-Utrilla, J.; Ocampo-Perez, R.; Cerino-Cordova, F.J. Biosorption mechanism of Methylene Blue from aqueous solution onto White Pine (Pinus durangensis) sawdust: Effect of operating conditions. Sustainable Environment Research 2017, 27, 32–40. [Google Scholar] [CrossRef]
- Ding, L.; Yang, S.; Liang, Z.; Qian, X.; Chen, X.; Cui, H.; Tian, J. TiO2 nanobelts with anatase/rutile heterophase junctions for highly efficient photocatalytic overall water splitting. Journal of colloid and interface science 2020, 567, 181–189. [Google Scholar] [CrossRef] [PubMed]
- Li, J.; Xu, X.; Liu, X.; Qin, W.; Wang, M.; Pan, L. Metal-organic frameworks derived cake-like anatase/rutile mixed phase TiO2 for highly efficient photocatalysis. Journal of Alloys and Compounds 2017, 690, 640–646. [Google Scholar] [CrossRef]
- Xia, X.; Peng, S.; Bao, Y.; Wang, Y.; Lei, B.; Wang, Z.; Huang, Z.; Gao, Y. Control of interface between anatase TiO2 nanoparticles and rutile TiO2 nanorods for efficient photocatalytic H2 generation. Journal of Power Sources 2018, 376, 11–17. [Google Scholar] [CrossRef]
- Trenczek-Zajac, A.; Synowiec, M.; Zakrzewska, K.; Zazakowny, K.; Kowalski, K.; Dziedzic, A.; Radecka, M. Scavenger-supported photocatalytic evidence of an extended type I electronic structure of the TiO2@Fe2O3 interface. ACS Applied Materials & Interfaces 2022, 14, 38255–38269. [Google Scholar]
Figure 1.
Schematic diagram of the preparation of TiO2/HNRs@SiO2 nanocomposite photocatalysts from α-FeOOH nanorods (GNRs) via facile solvo-hydrothermal reactions.
Figure 1.
Schematic diagram of the preparation of TiO2/HNRs@SiO2 nanocomposite photocatalysts from α-FeOOH nanorods (GNRs) via facile solvo-hydrothermal reactions.
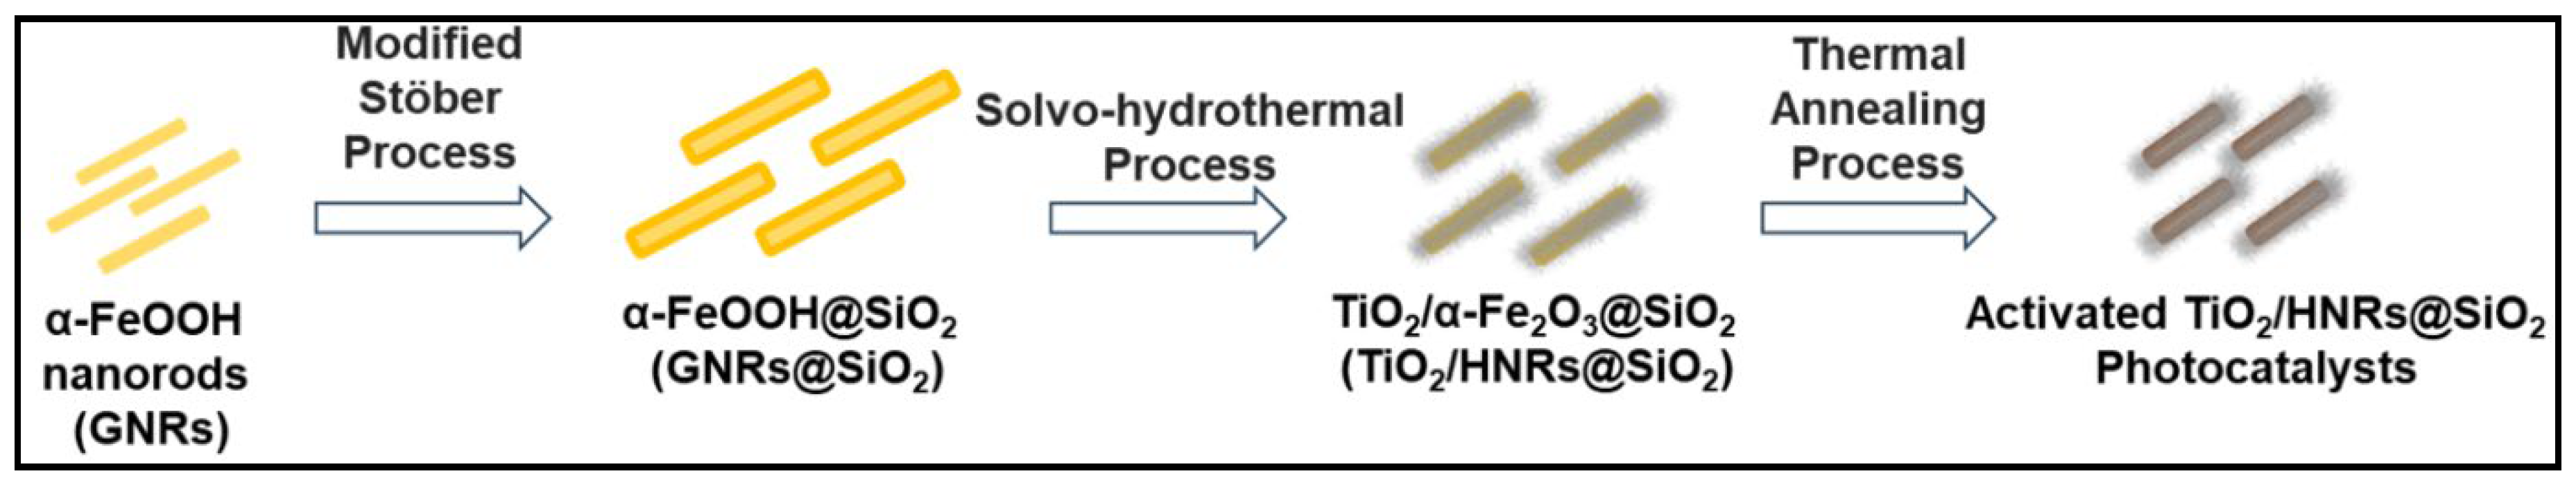
Figure 2.
Representative FESEM and inset TEM images of (A) as-synthesized α-FeOOH nanorods (GNRs), (B) SiO2 coated α-FeOOH nanorods (GNRs@SiO2) and (C) hydrothermally grown TiO2 deposited on the SiO2 coated α-Fe2O3 nanorods (TiO2/HNRs@SiO2) of which the core was thermally transformed from α-FeOOH. Figures D and E are their corresponding powder XRD patterns and FT-IR spectra.
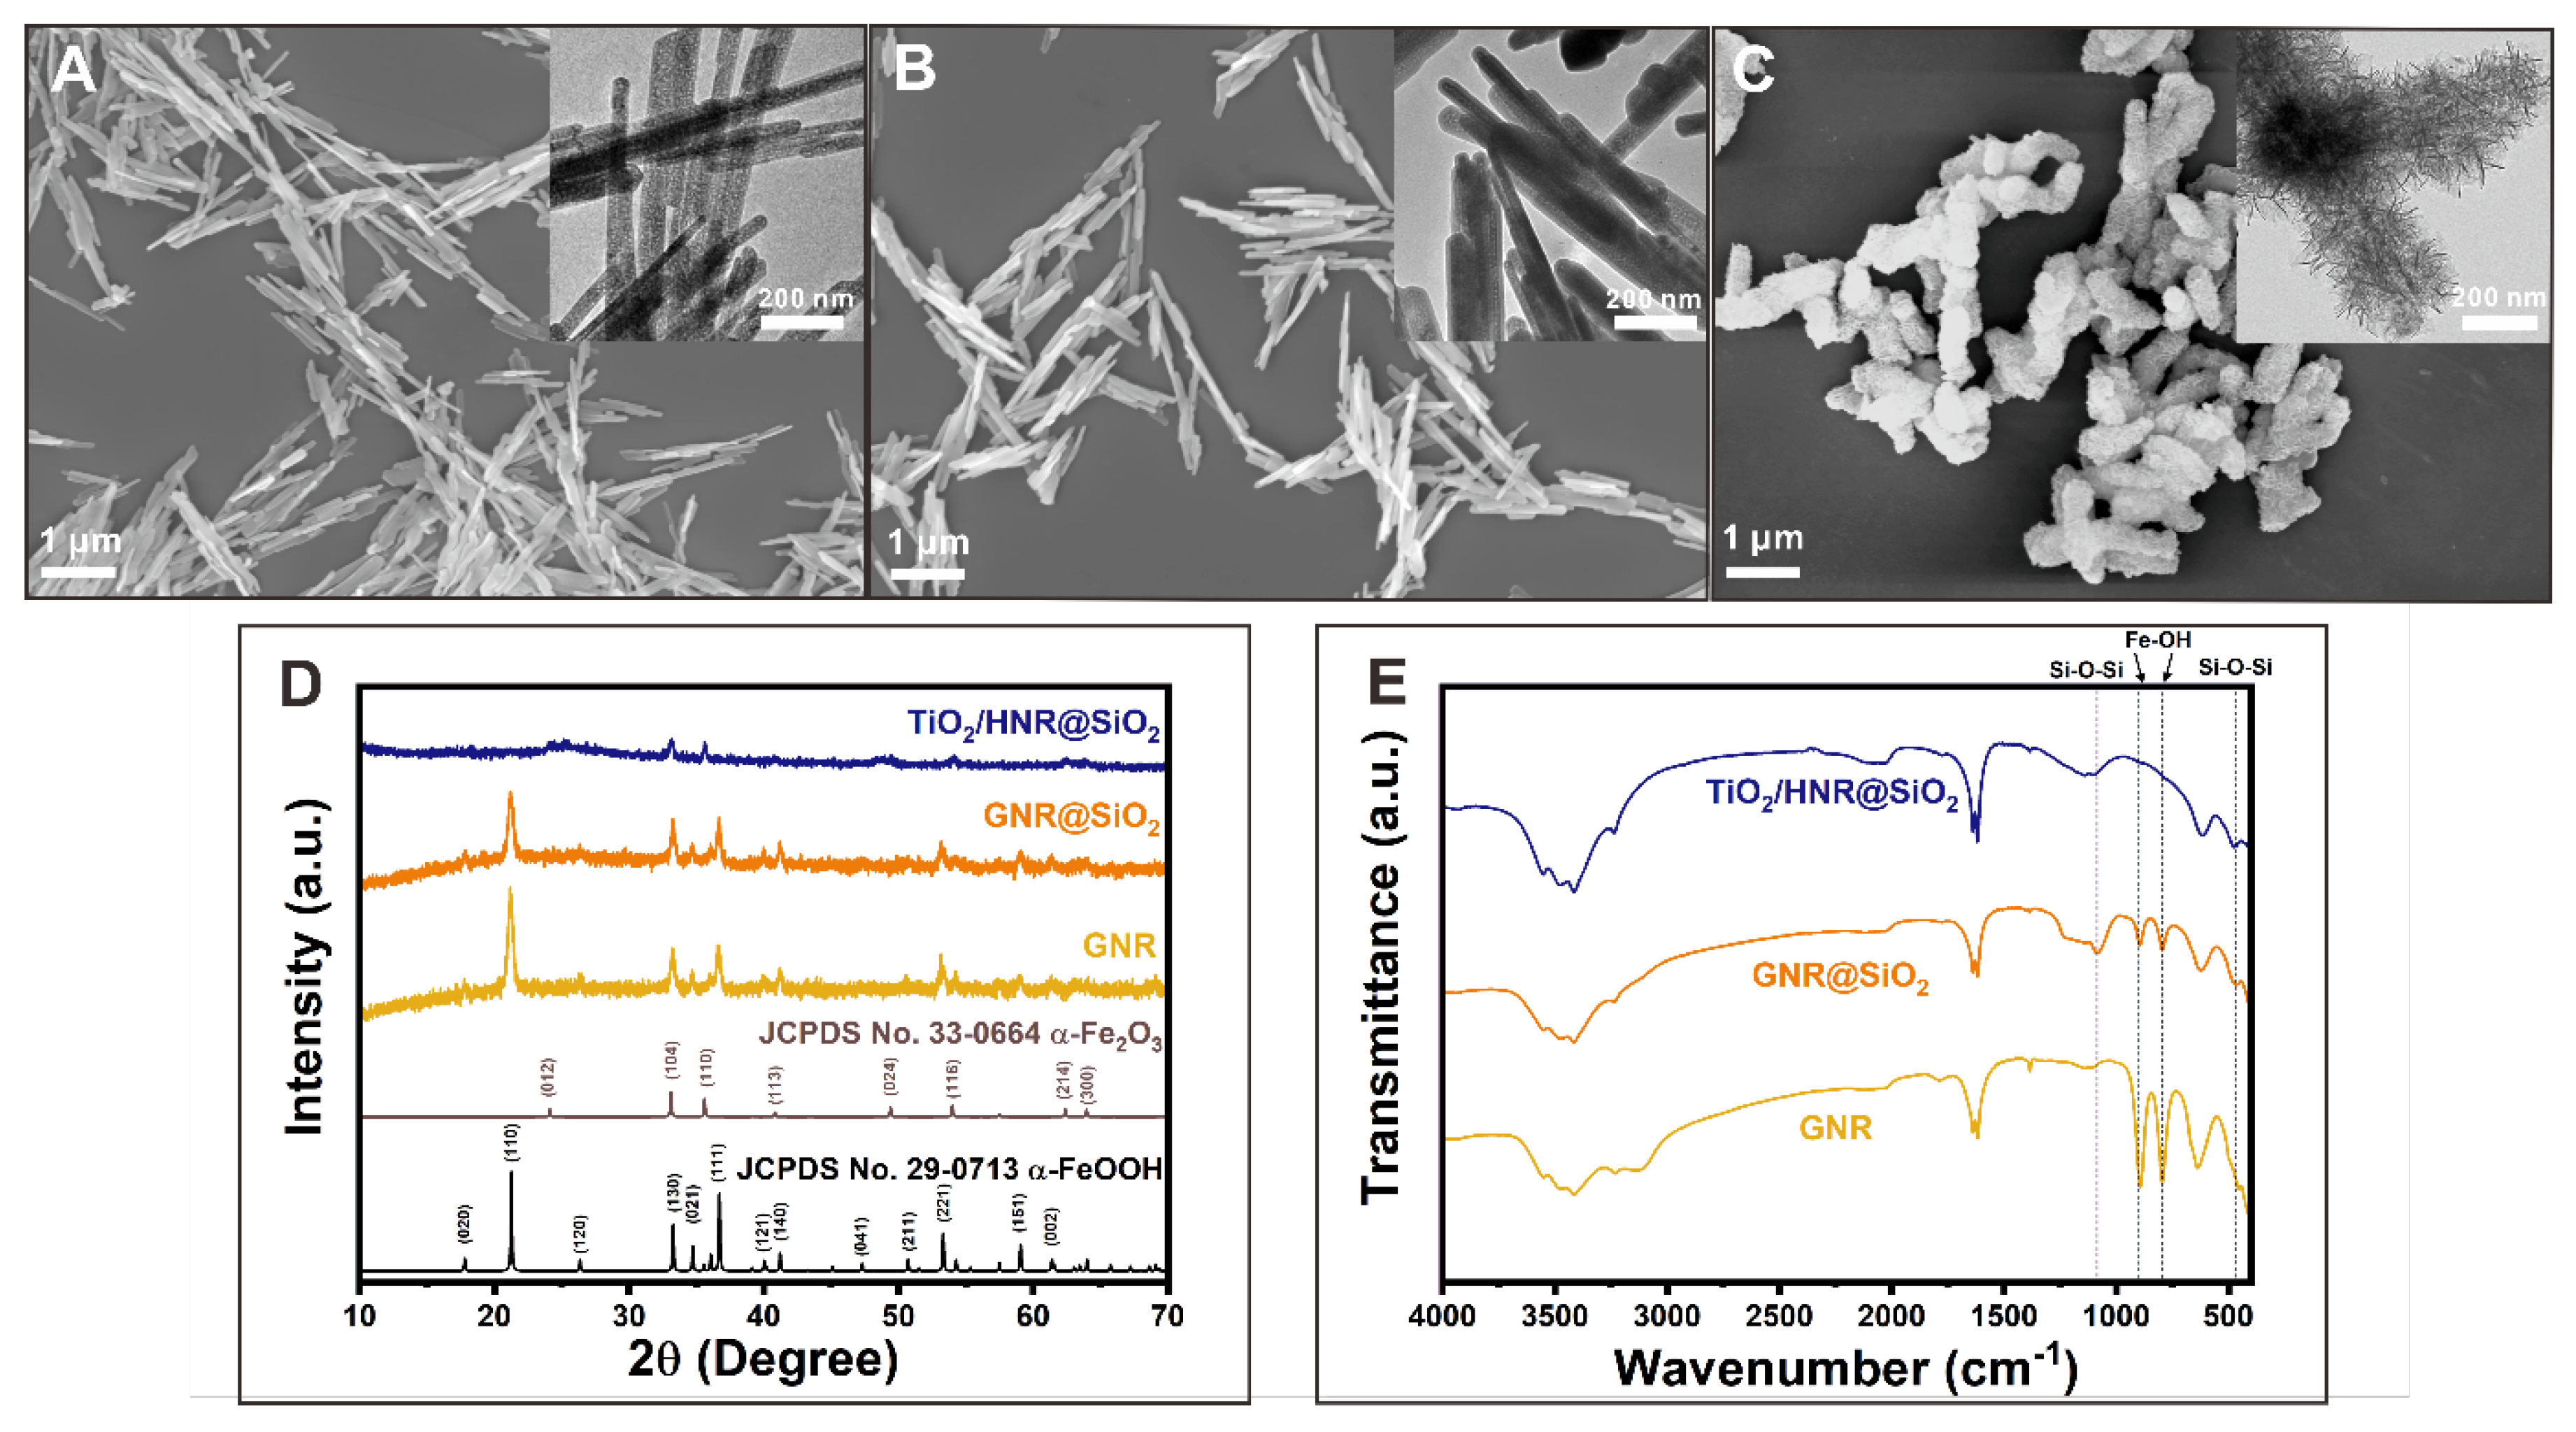
Figure 3.
Representative FESEM images of activated TiO2/HNRs@SiO2 nanocomposite photocatalysts thermally annealed at (A) 400 ℃, labeled as TiO2/HNRs@SiO2_400; (B) 600 ℃, labeled as TiO2/HNRs@SiO2_600; and (C) 800 ℃, labeled as TiO2/HNRs@SiO2_800, exhibiting their unique flower-like morphologies of crystalline TiO2 grown on the nanorod structures. The corresponding powder XRD patterns show the evolution of forming mixed anatase and rutile TiO2 phases in the α-Fe2O3 nanorod heterostructures at different thermal annealing temperatures.
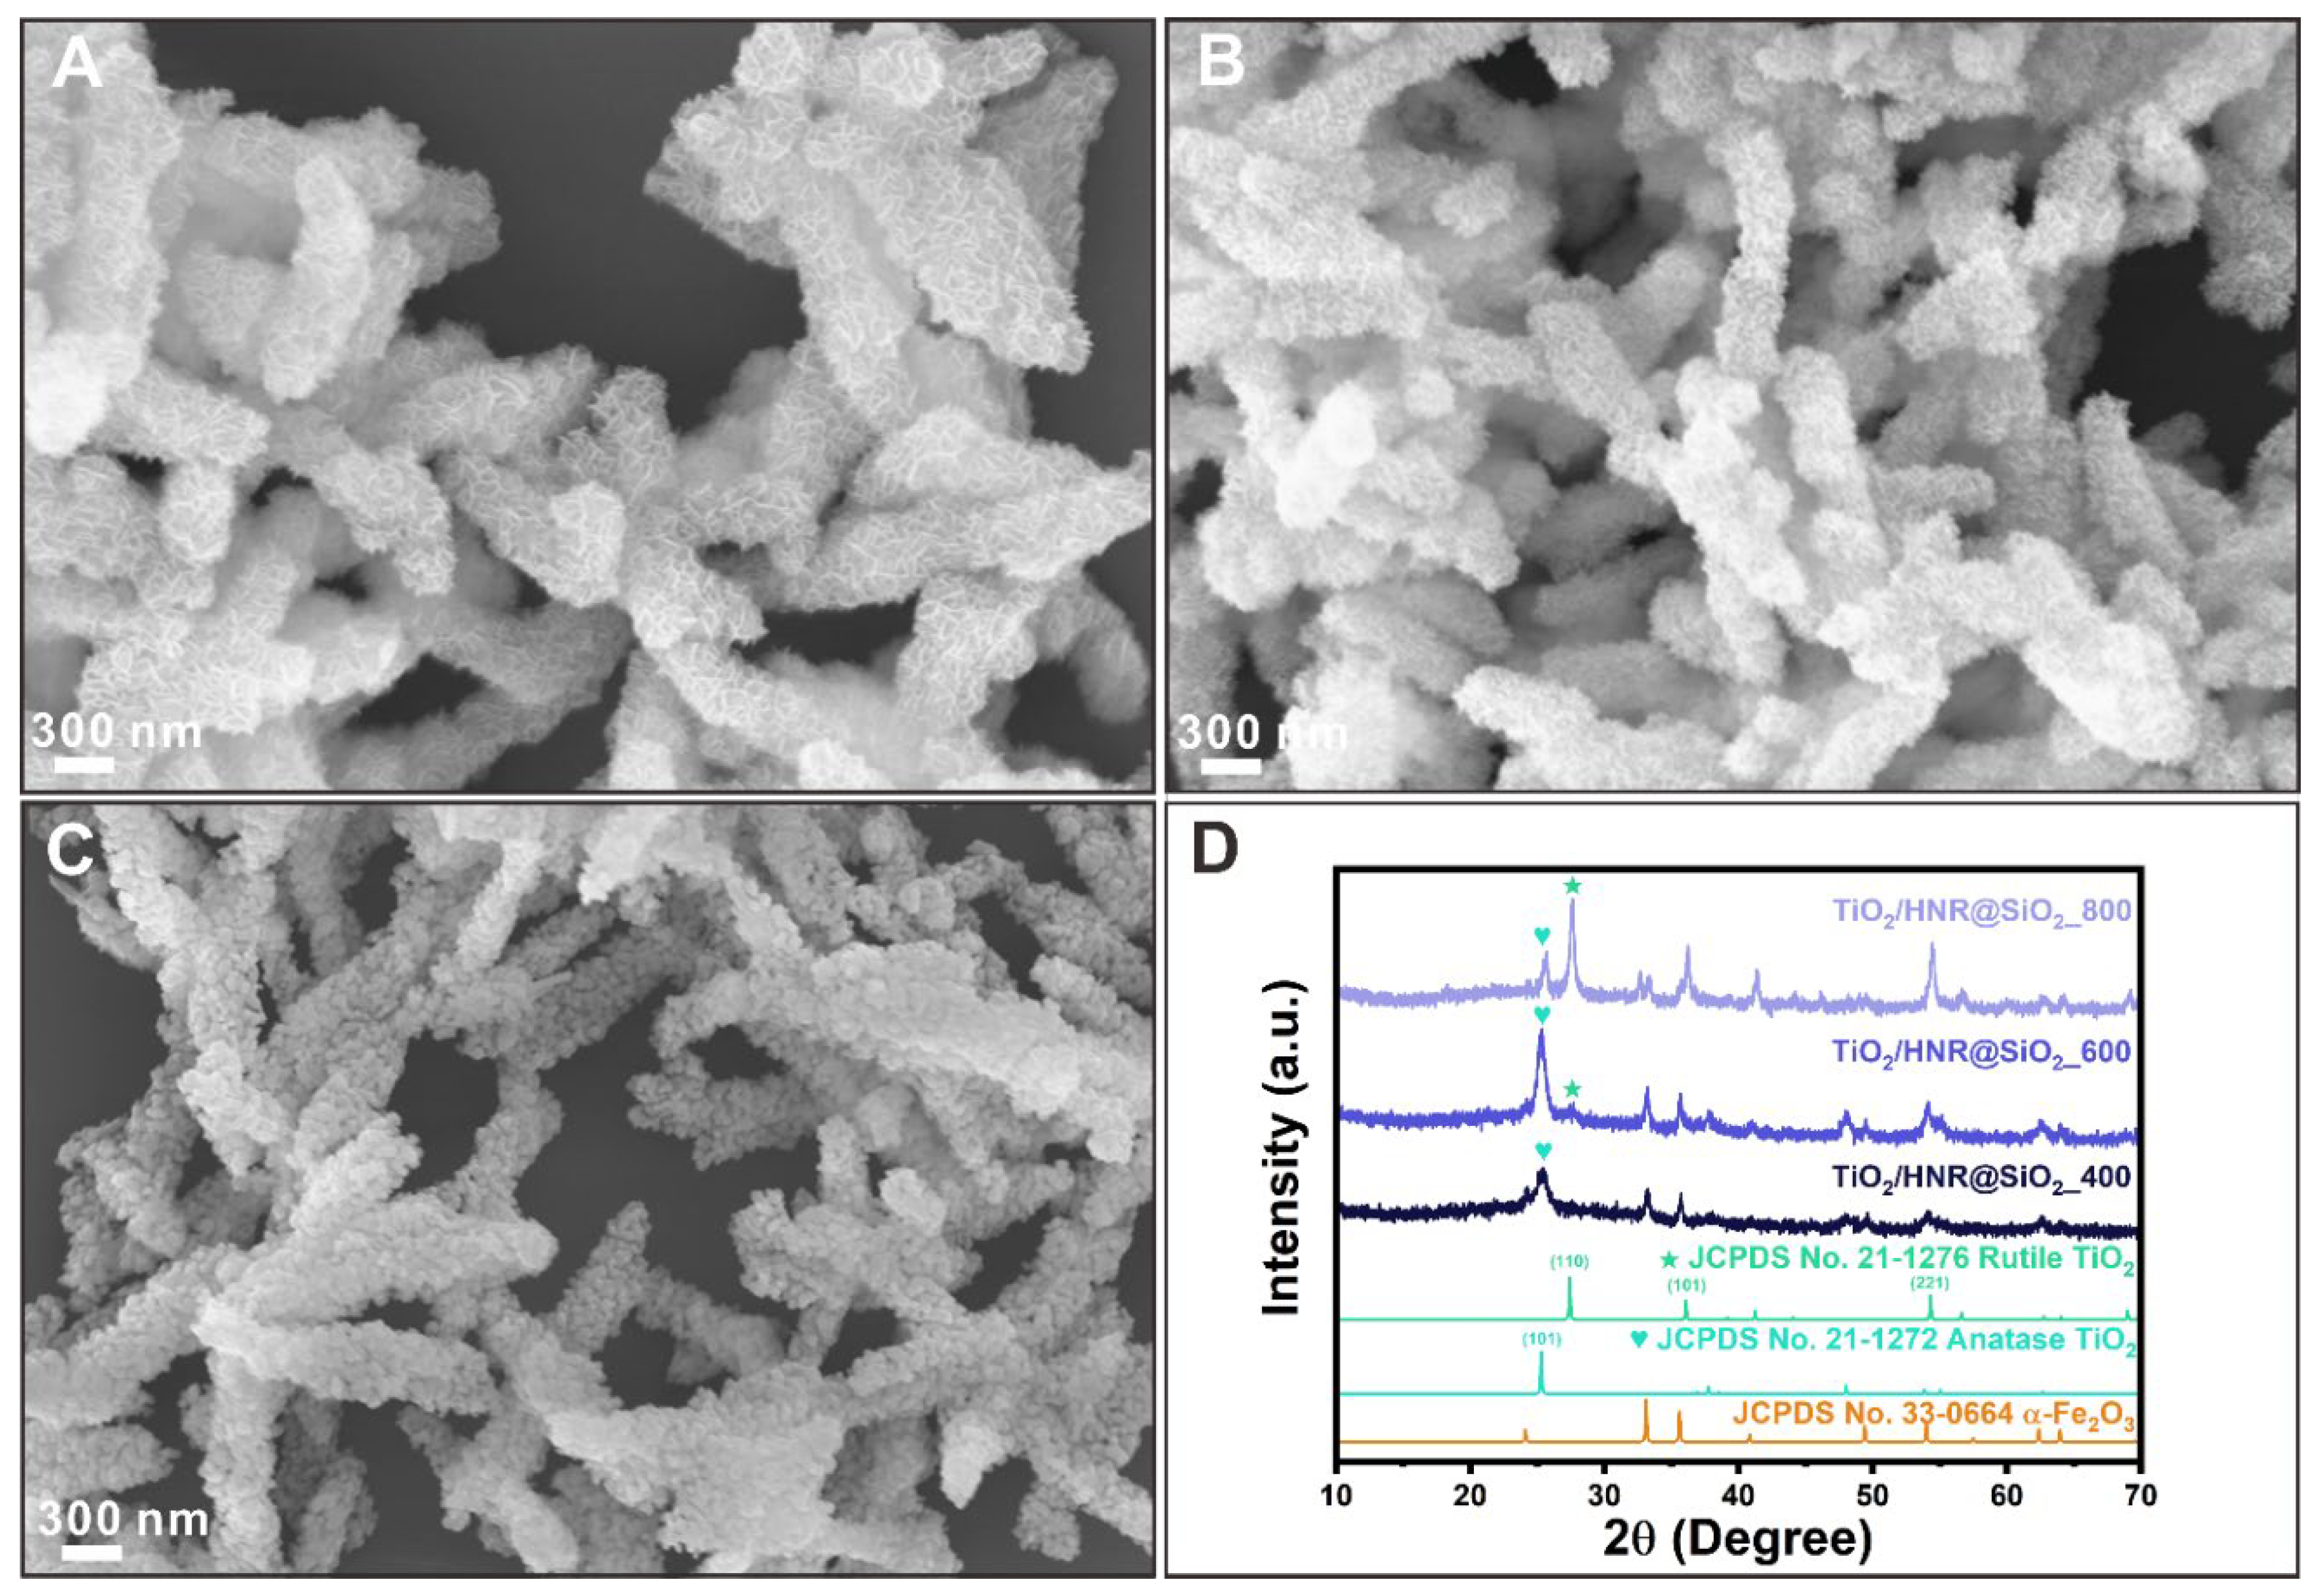
Figure 4.
(A) UV-VIS DRS spectra and (B) Tauc’s plots of as-synthesized TiO2/HNRs@SiO2 nanocomposite photocatalysts thermally annealed at 400 ℃, labeled as TiO2/HNRs@SiO2_400; 600 ℃, labeled as TiO2/HNRs@SiO2_600; and 800 ℃, labeled as TiO2/HNRs@SiO2_800.
Figure 4.
(A) UV-VIS DRS spectra and (B) Tauc’s plots of as-synthesized TiO2/HNRs@SiO2 nanocomposite photocatalysts thermally annealed at 400 ℃, labeled as TiO2/HNRs@SiO2_400; 600 ℃, labeled as TiO2/HNRs@SiO2_600; and 800 ℃, labeled as TiO2/HNRs@SiO2_800.
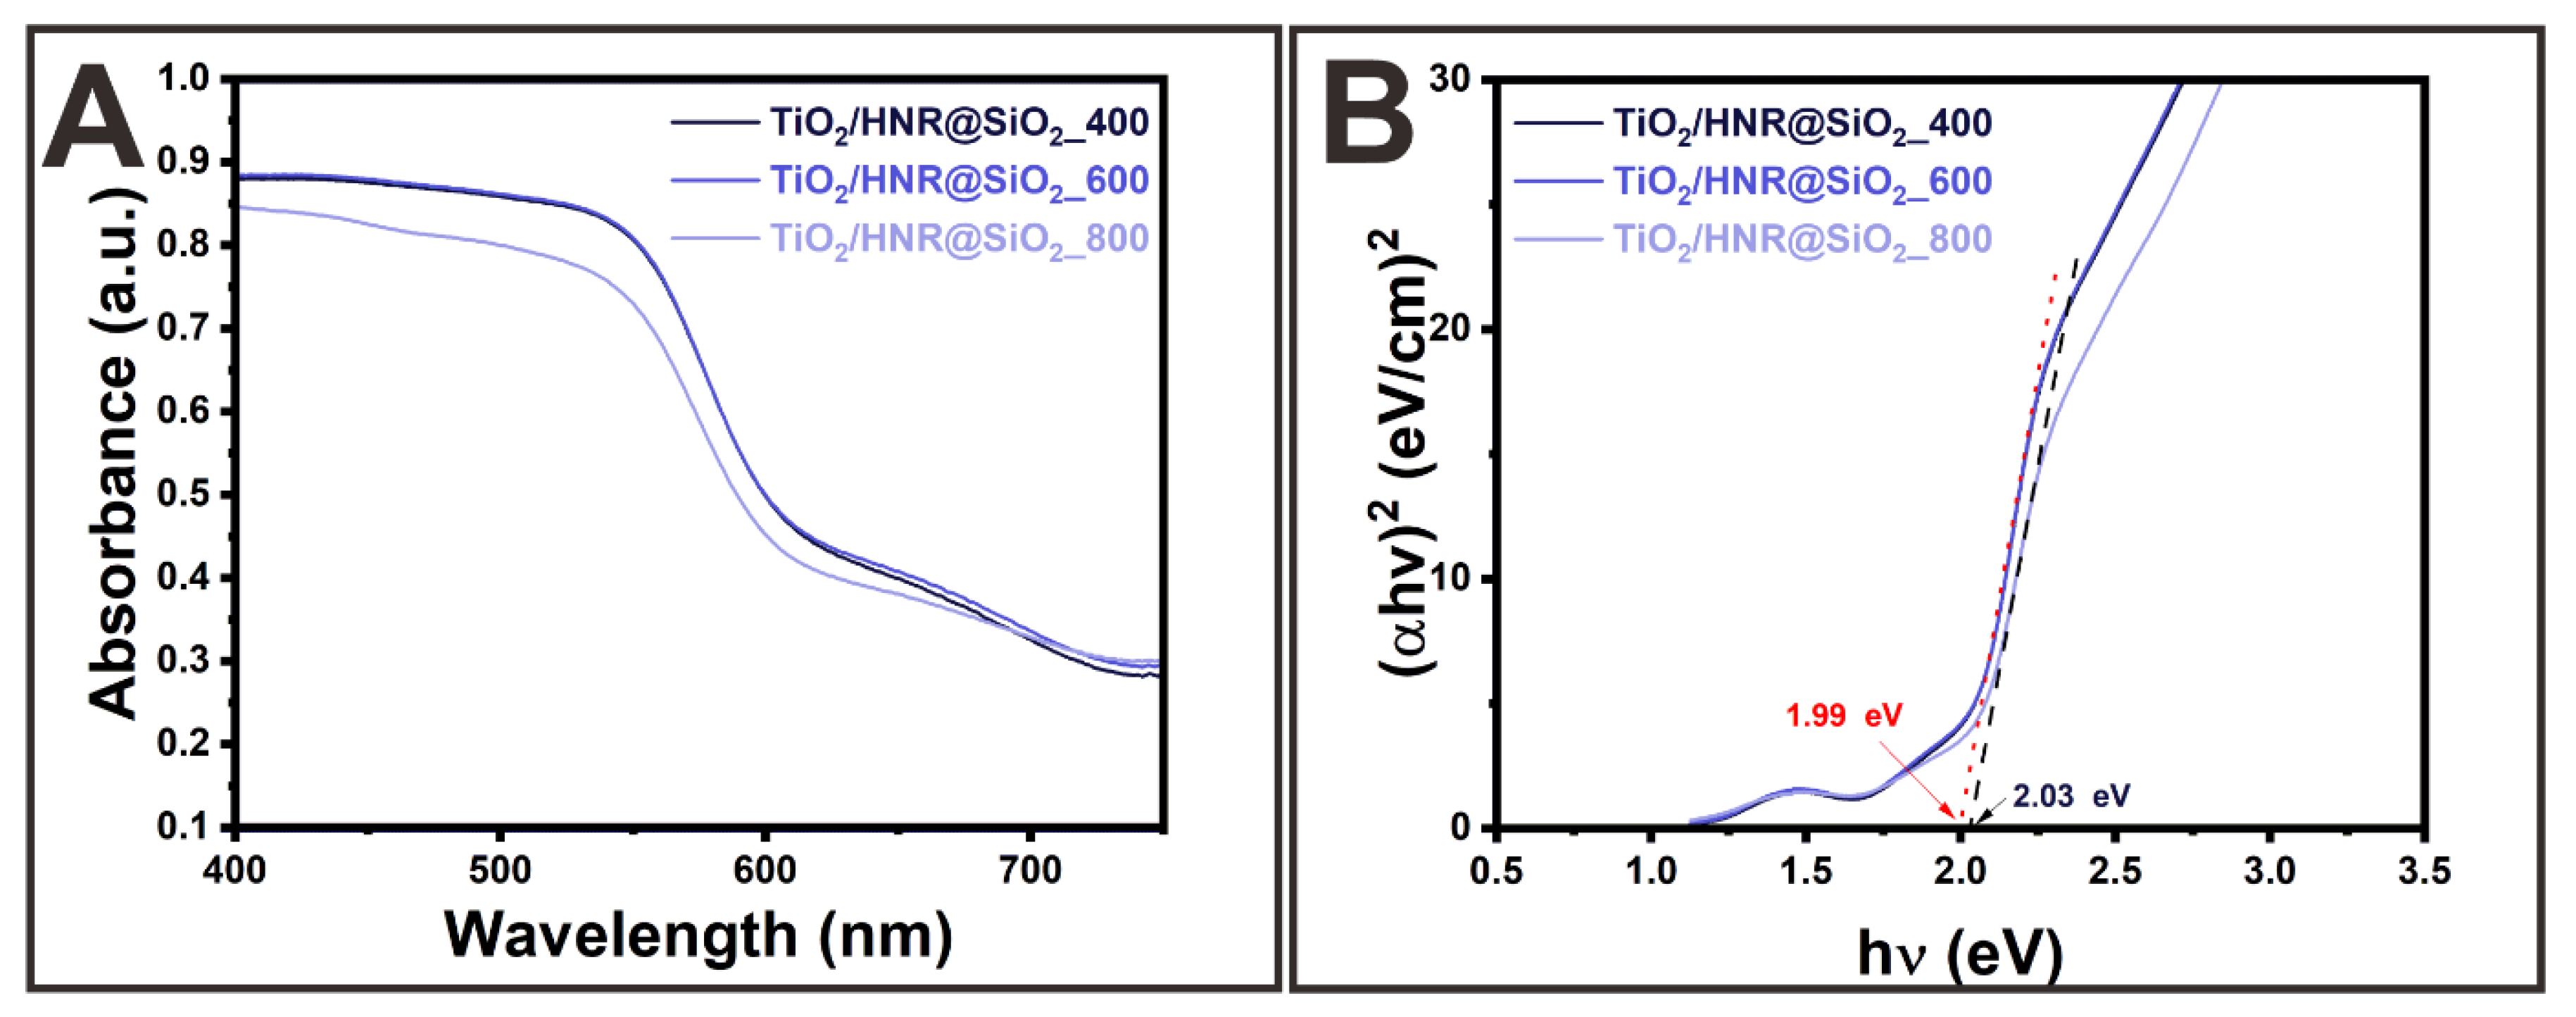
Figure 5.
Photocatalytic degradation kinetics of MB using activated TiO2/HNRs@SiO2 annealed at 400 ℃ as a function of (A) TiO2/HNRs@SiO2 dosage and (B) MB concentration under ~150 min of solar irradiation.
Figure 5.
Photocatalytic degradation kinetics of MB using activated TiO2/HNRs@SiO2 annealed at 400 ℃ as a function of (A) TiO2/HNRs@SiO2 dosage and (B) MB concentration under ~150 min of solar irradiation.
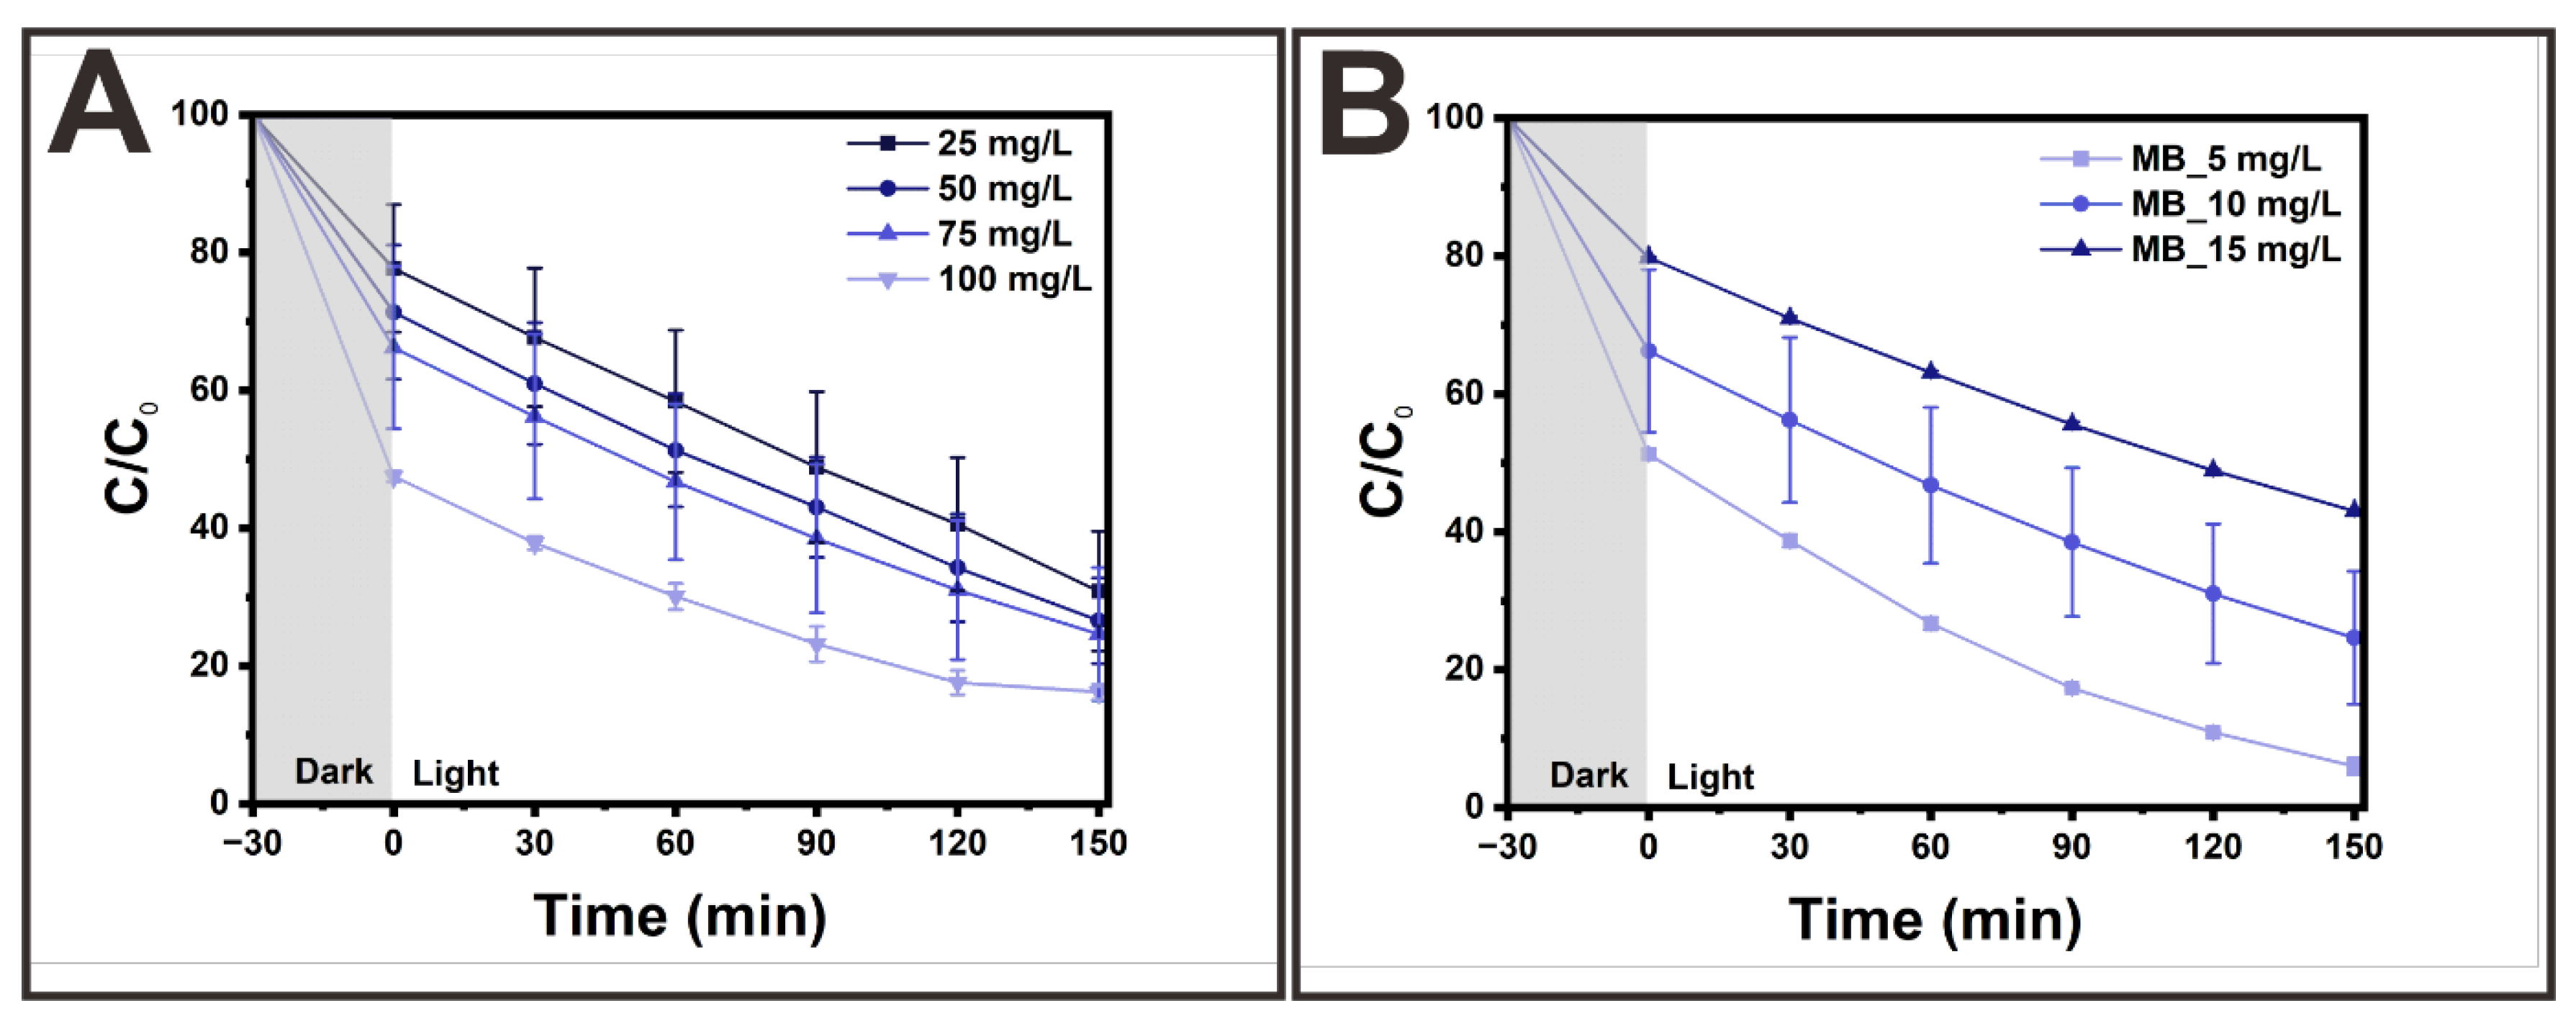
Figure 6.
Photocatalytic degradation kinetics of MB using TiO2/HNRs@SiO2 nanocomposite photocatalysts thermally annealed at 400 ℃, labeled as TiO2/HNRs@SiO2_400; 600 ℃, labeled as TiO2/HNRs@SiO2_600; and 800 ℃, labeled as TiO2/HNRs@SiO2_800 at (A) pH = 4, (B) pH = 7, and (C) pH = 10.
Figure 6.
Photocatalytic degradation kinetics of MB using TiO2/HNRs@SiO2 nanocomposite photocatalysts thermally annealed at 400 ℃, labeled as TiO2/HNRs@SiO2_400; 600 ℃, labeled as TiO2/HNRs@SiO2_600; and 800 ℃, labeled as TiO2/HNRs@SiO2_800 at (A) pH = 4, (B) pH = 7, and (C) pH = 10.
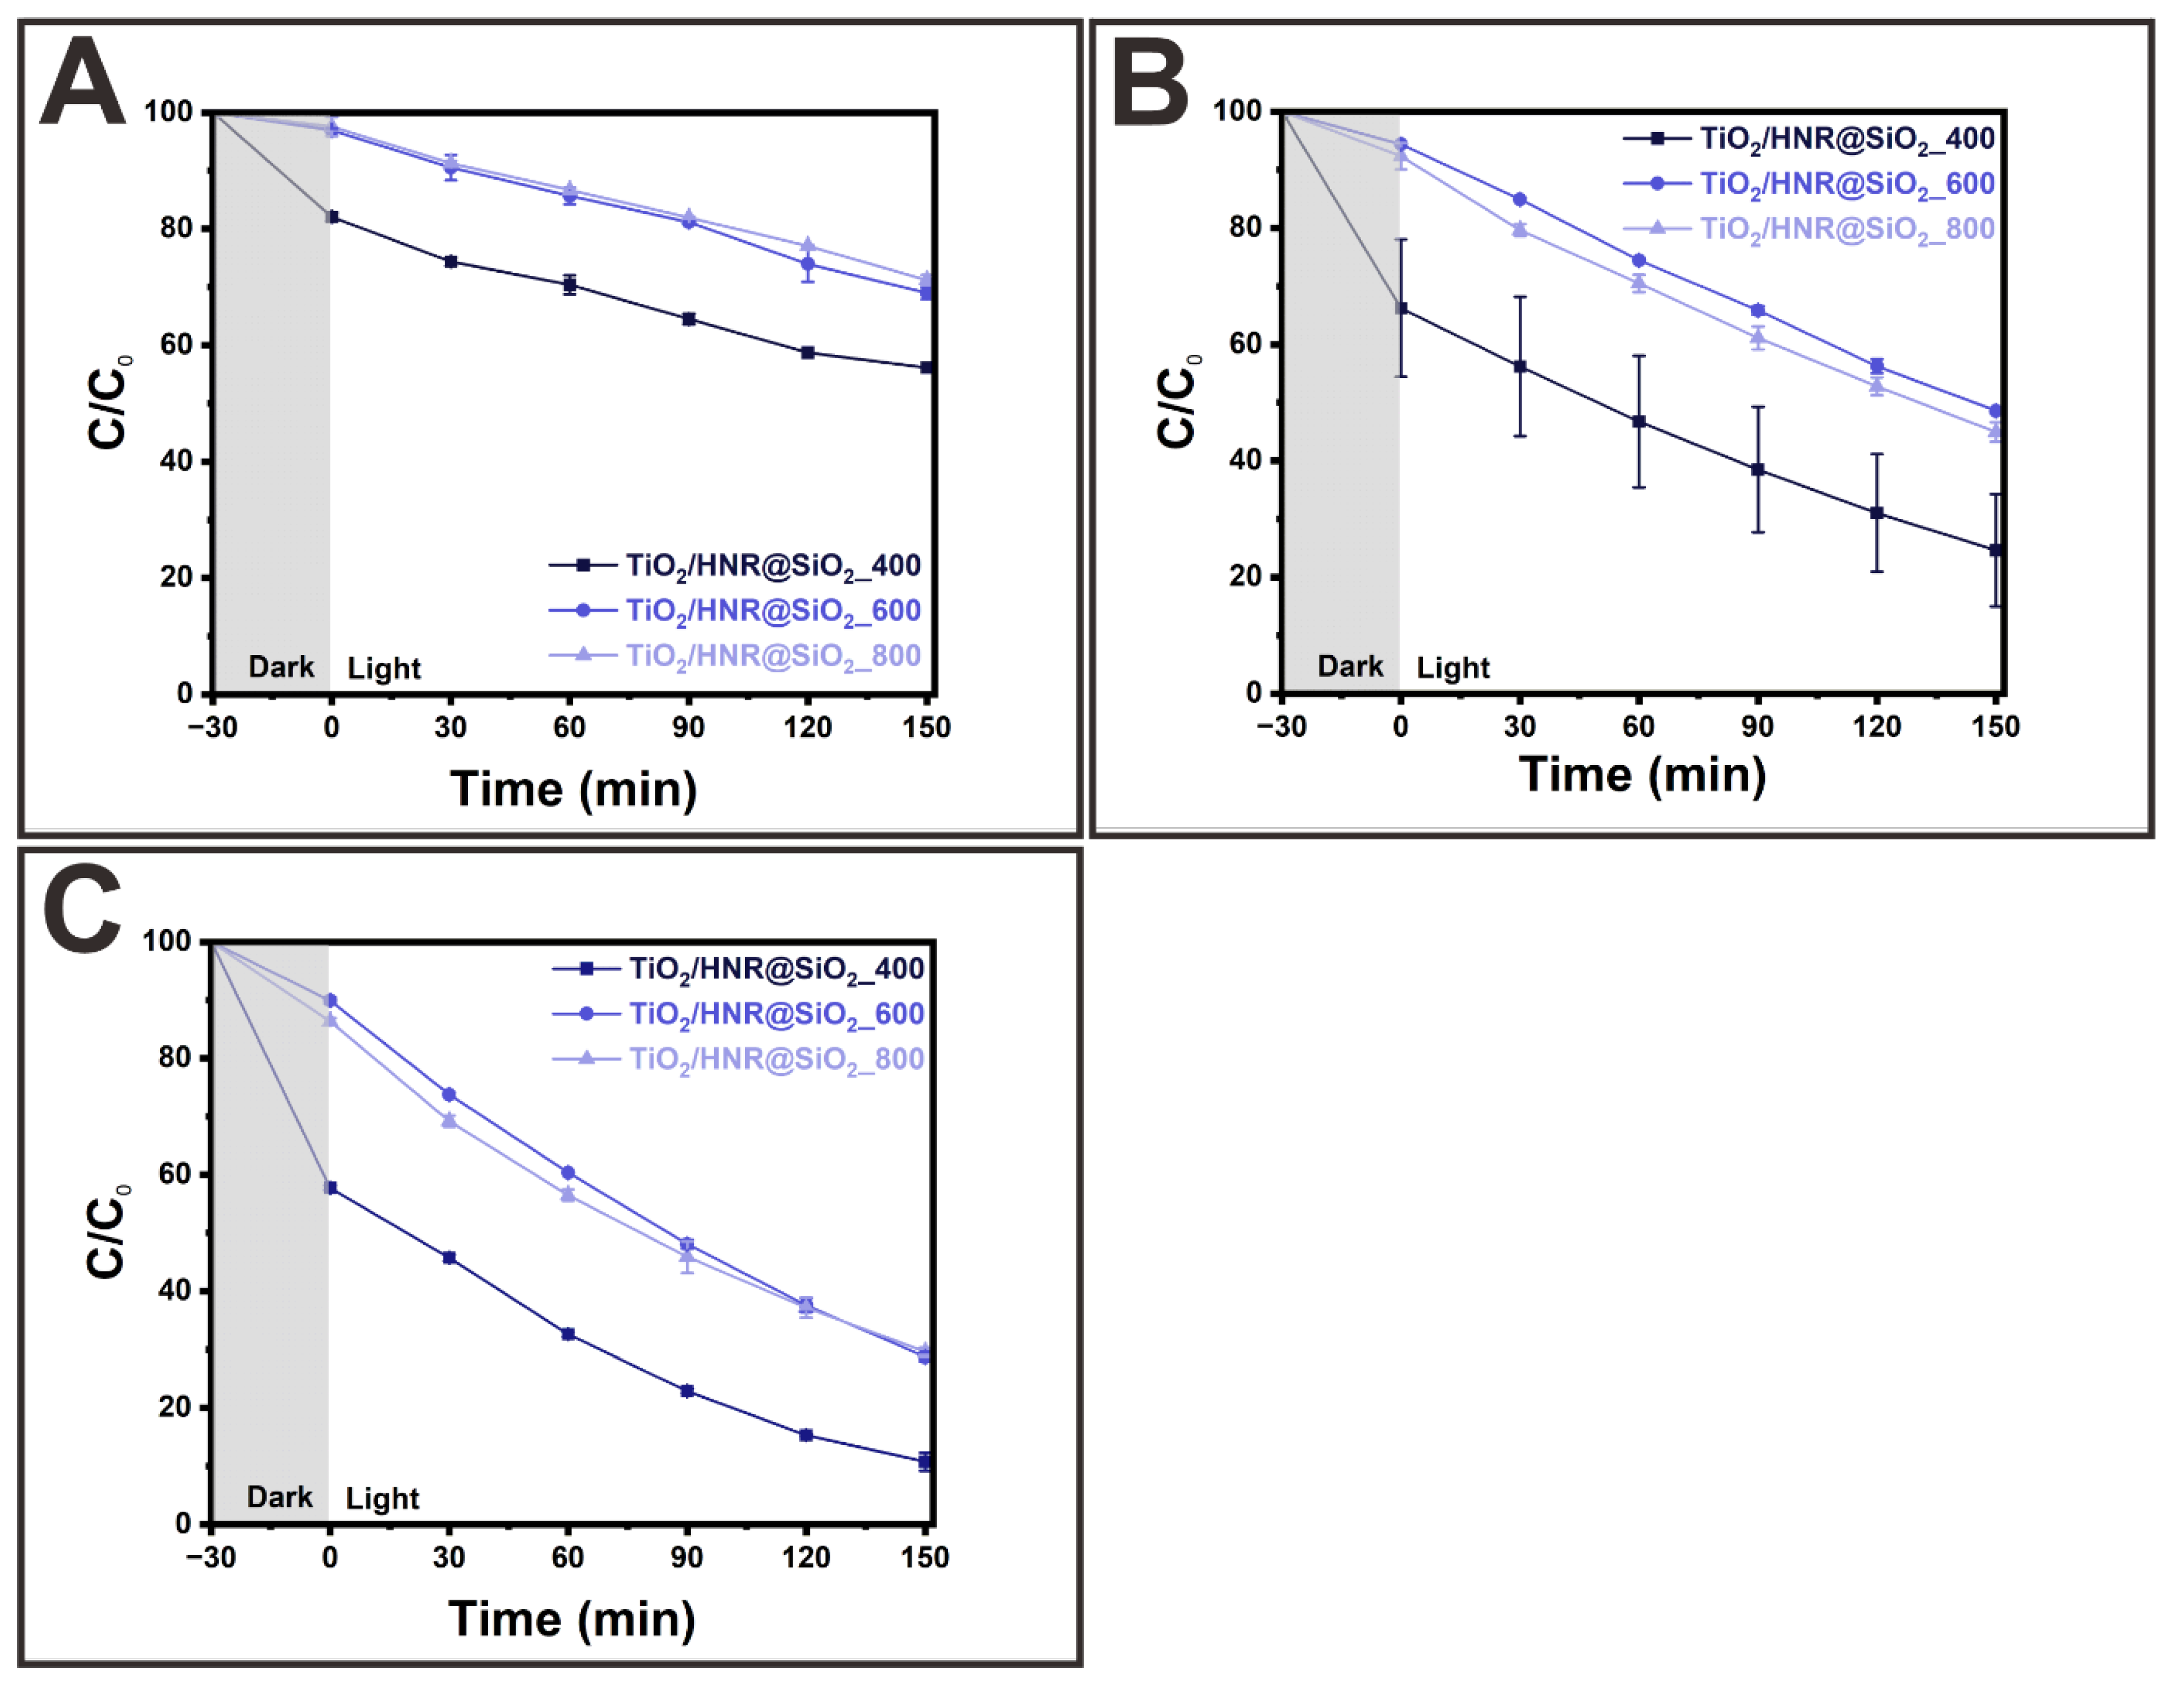
Figure 7.
Schematic diagram of the photocatalytic MB decomposition mechanism using activated TiO2/HNRs@SiO2 nanocomposite photocatalysts.
Figure 7.
Schematic diagram of the photocatalytic MB decomposition mechanism using activated TiO2/HNRs@SiO2 nanocomposite photocatalysts.
Disclaimer/Publisher’s Note: The statements, opinions and data contained in all publications are solely those of the individual author(s) and contributor(s) and not of MDPI and/or the editor(s). MDPI and/or the editor(s) disclaim responsibility for any injury to people or property resulting from any ideas, methods, instructions or products referred to in the content. |
© 2025 by the authors. Licensee MDPI, Basel, Switzerland. This article is an open access article distributed under the terms and conditions of the Creative Commons Attribution (CC BY) license (http://creativecommons.org/licenses/by/4.0/).
Copyright: This open access article is published under a Creative Commons CC BY 4.0 license, which permit the free download, distribution, and reuse, provided that the author and preprint are cited in any reuse.


