
Submitted:
18 February 2025
Posted:
19 February 2025
You are already at the latest version
Abstract
After the 1982–1984 subsidence phase, ground uplift at Campi Flegrei Caldera resumed in 2005, while volcanic-tectonic earthquakes have steadily increased in frequency and intensity since 2020, with a significant intensification observed since 2023. This rise in seismic activity enabled us to conduct a new tomography using data collected from 2020 to June 2024. In this work, we used 4,161 local earthquakes (41,272 P-phases and 14,683 S-phases) processed with the tomoDDPS code, considering 388,166 P and 107,281 S differential times to improve earthquake locations and velocity models. Compared to previous tomographic studies, our 3D velocity models provide higher-resolution images of the central caldera's structure down to ~4 km depth. Additionally, we separately inverted datasets for 2020–2022 (moderate seismicity) and 2023–2024 (intense seismicity), identifying velocity variations (ranging from 5% to 10%) between these periods. These changes observed in 2023–2024 support the existence of two pressurized sources at different depths. One, located at 3–4 km depth beneath Pozzuoli and offshore, could represent either a magma intrusion enriched in supercritical fluids or an accumulation of pressurized, high-density fluids—a finding that aligns with recent ground deformation studies and modeled source depths. Furthermore, the upward migration of magmatic fluids interacting with the geothermal system generated a secondary, shallower pressurized source at approximately 2 km depth (beneath the Solfatara-Piscirelli area). Overall, these processes are responsible for the recent acceleration in uplift, increased seismicity and gases from the fumarolic field, and changes in crustal elastic properties through stress variations and fluid/gas migration.
Keywords:
Campi Flegrei caldera
; seismic tomography
; time-lapse tomography
; magmatic intrusion
; fluid migration
; Bradyseism
1. Introduction
The Campi Flegrei Caldera (CFC), located near Naples, Italy, is one of Europe’s most dynamic and potentially hazardous volcanic systems. The structural architecture of the CFC still remains a topic of debate (e.g., [1] and references therein). However, many researchers propose the existence of a nested caldera structure, primarily shaped by two major caldera-forming eruptions (Figure 1a): the Campanian Ignimbrite eruption around 40 ka (e.g., [2]) and the Neapolitan Yellow Tuff eruption around 15 ka (e.g., [3]). These two eruptions, part of the caldera’s eruptive history, were marked by intense and recurring volcanic activity. After the Neapolitan Yellow Tuff eruption, there were periods of relative calm, interspersed with at least 70 eruptions of moderate size, mostly explosive in nature. There were also a few larger events causing minor caldera collapses, including the Agnano-Monte Spina eruption around 4,500 years ago. The most recent eruption occurred in 1538 AD, leading to the formation of Monte Nuovo.
Since the Roman era, the CFC has experienced a gradual subsidence of about 1–2 cm per year, occasionally interrupted by periods of rapid ground uplift [4]. Since 1950, the caldera has undergone several periods of instability, characterized by alternating phases of uplift and subsidence. The first three events that disturbed the gradual subsidence of the caldera were characterized by similar uplift events in terms of duration and intensity: 1950–1952 (about 74 cm), 1970–1972 (approximately 159 cm), and 1982–1984 (about 178 cm) [5]. The 1970–1972 unrest recorded a minimal seismic activity, whereas the 1982-1984 crisis was accompanied by nearly 16,000 low-magnitude earthquakes, the largest of which had a magnitude of 4.0. Following this, a period of subsidence allowed a partial restoration of ground uplift.
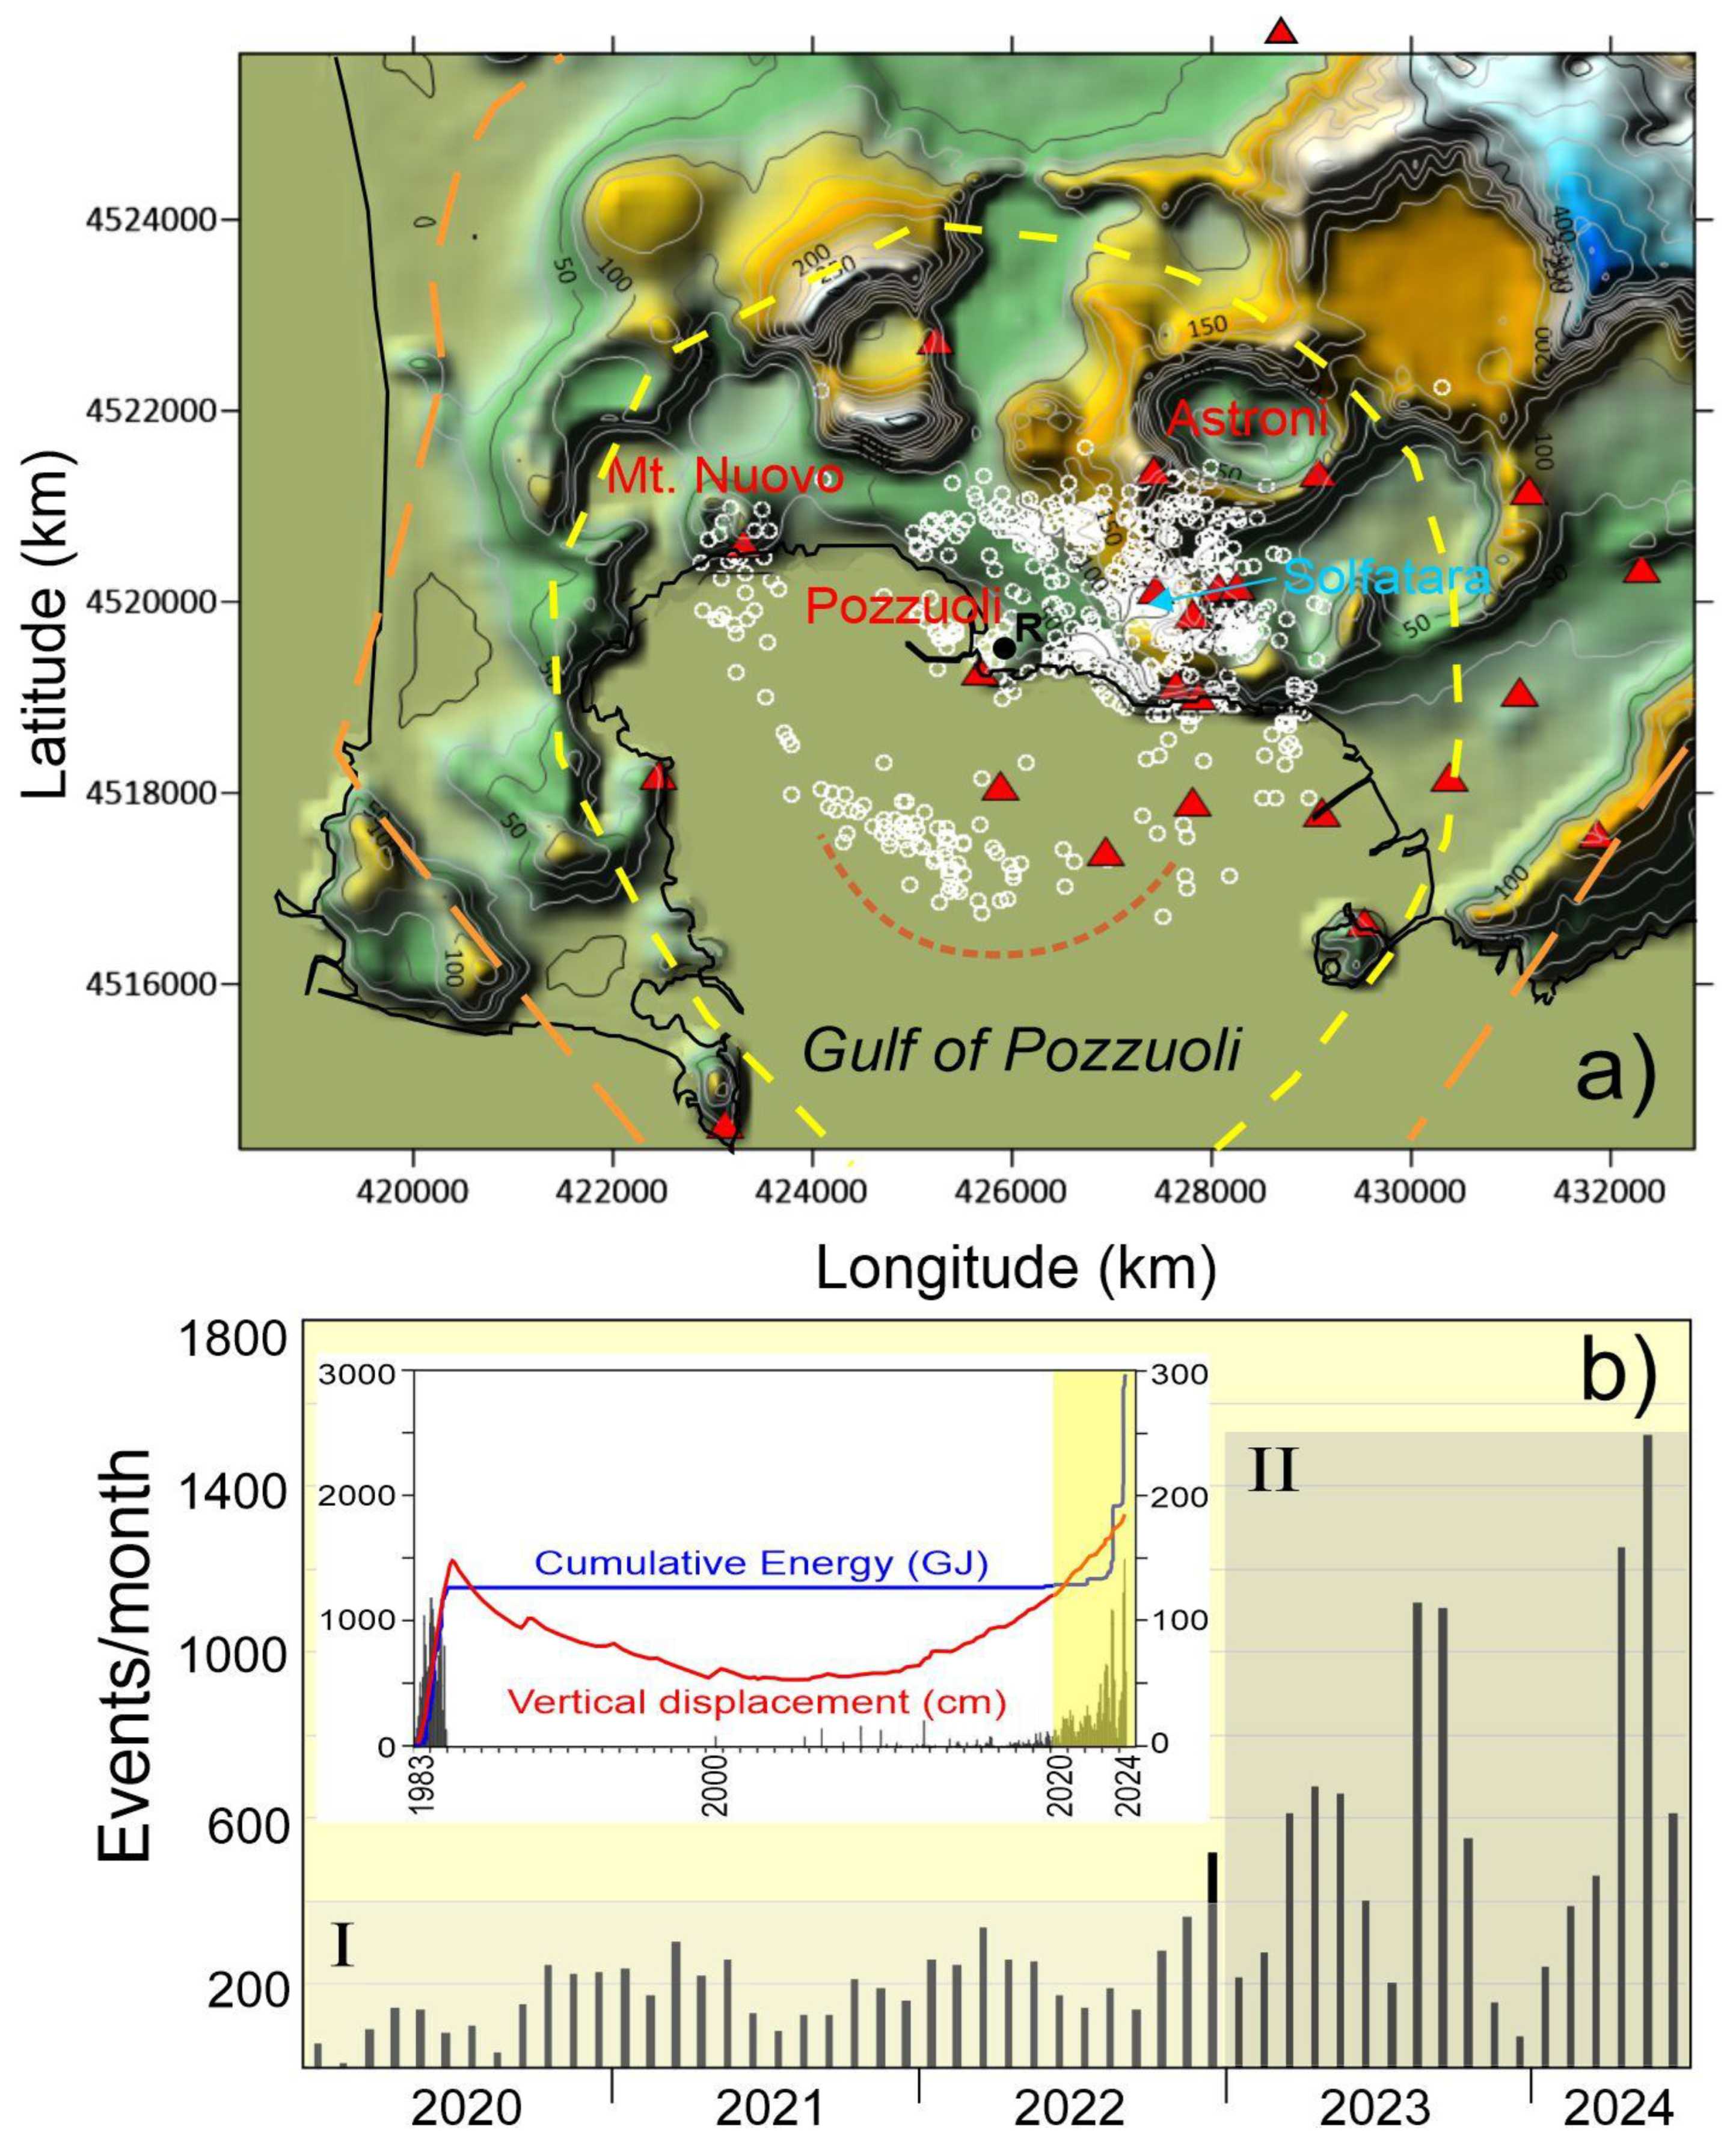
In 2005, ground uplift resumed and in the area of maximum uplift, the Rione Terra (R in Figure 1a), is now 25 cm higher than its peak in 1984 and 129 cm higher than in 2005 (inset in Figure 1b). Seismic activity during this uplift phase has progressively intensified, especially since 2018. Between 2023 and 2024, over 30 earthquakes with magnitudes greater than 3.0 were recorded, including a magnitude 4.4 event on May 20, 2024—the strongest earthquake since 1985. This phase of uplift is also associated with increased degassing in the Solfatara-Pisciarelli fumarole area, which is the site of most seismic activity (Figure 1a).
Numerous geological and geophysical studies, including various tomographic investigations, have been conducted to improve the understanding of the CFC subsurface structure. Aster and Meyer [6] analyzed 228 seismic events recorded by a temporary network from the University of Wisconsin-Madison during the 1982–1984 bradyseismic crisis, deriving both P-wave (Vp) and S-wave (Vs) velocity models of the caldera.
Subsequent analysis mainly utilized datasets from the 1982–1984 seismic activity and the 2001 SERAPIS active seismic experiment [7,8,9,10,11,12,13] important to consider that the results derived from datasets of earthquakes that occurred during the 1982–1984 crisis should be extrapolated to more recent years with caution, as subsurface conditions may have changed since then.
Figure 1.
a) A digital elevation model (DEM) of the Campi Flegrei Caldera, illustrating the caldera rims. The outer caldera margin is represented by an orange dotted line, while the inner caldera margin is marked with a yellow dotted line. The morphological boundary of the resurgent dome is delineated by a red dotted line (refer to Figure 2 in [16] for more details). The map also shows seismic stations (red triangles) and earthquake epicenters (white circles), which have been re-located using a 1D velocity model. b) Histogram displaying the number of daily earthquakes (black) from 2020 to June 30, 2024, with grey-shaded areas highlighting two distinct periods during which separate tomographic inversions were conducted for comparison. The inset includes: 1) a histogram of daily earthquakes since 1983 (black), with the count displayed on the left axis, 2) a cumulative plot of released energy (blue line), and 3) the vertical daily displacement at RITE (red line, Rione Terra, Pozzuoli). The values for 2) and 3) are provided on the right axis.
The most recent tomographic studies have focused on analyzing velocity changes [14,15], emphasizing time-dependent variations in the velocity structure. The repeated application of three-dimensional (3D) seismic tomography, or 4D tomography (in space and time), can be considered a powerful tool to detect and track changes in the velocity structure under an active volcanic system. In time-lapse tomography, 4D velocity changes are calculated by comparing differences between 3D images generated from data collected over different time intervals. 4D seismic tomography is routinely used in mature fields to monitor the effectiveness of enhanced oil recovery (EOR) techniques and in different tectonic contexts, enhancing our understanding of subsurface dynamics. For example, it can track the movement of injected fluids, such as CO2 or water, and their impact on oil displacement.
In volcanic environments, changes in both Vp and Vs and especially temporal variations in the P-to-S wave velocity ratio (Vp/Vs) have been documented, such as at Etna during its activity between 2002 and 2003 [17]. The authors interpreted the observed lower Vp/Vs ratios as evidence of the intrusion of volatile-rich basaltic magma feeding the eruption. Similarly, significant changes in seismic velocities were detected beneath Mammoth Mountain [18], where the variations were consistent with CO2 migration into the upper 2 km, with corresponding depletion in surrounding areas, correlating with surface venting zones. Furthermore, in the Geysers geothermal field, between 2008 and 2014, the strengthening of a low-Vp/Vs anomaly after 2010 was attributed to alterations in the water injection regime [19]. Also at the Nevado Del Ruiz, the temporal velocity changes from 2000 to 2016 indicated that the volcanic system underwent changes related to the ascent of new magma, which interacted with preexisting magma bodies, leading to the recent emplacement of a small dome at the bottom of the active crater [20].
Variations in seismic properties are typically linked to changes in stress and deformation, fluids and gases migration, and magma accumulation beneath volcanoes. However, the application of time-repeated tomography can be limited by differences in ray coverage between time periods (Figures S1 and S2), which may result from not always optimal distribution of seismic sources (local earthquakes) and receivers. To address this, careful data selection and inversion procedures are necessary to ensure that the time-resolution of the images is consistent across periods, thereby preventing spatial anomalies from being misinterpreted as temporal changes.
In this work, we present new three-dimensional (3D) Vp, Vs, and Vp/Vs models for Campi Flegrei during the 2020–June 2024 period, which saw a progressive and significant increase in seismicity during the ongoing uplift phase that began in 2005. First, we performed a tomographic inversion for the entire period from 2020 to 2024 and then compared the resulting seismic images with those from Battaglia et al. [11], which used data from the 1982–1984 seismic crisis and the 2001 SERAPIS active experiment. Additionally, in light of the significant increase in both the number and intensity of seismic events starting in 2023, we compared the tomographic images obtained for the 2023–2024 and 2020–2022 periods by analyzing velocity variations. This comparison aimed to identify any changes in velocity that could be linked to the ascent of fluids and/or magma in recent years.
2. Materials and Methods
2.1. Tomographic Inversion for the Vp, Vs and Vp/Vs Structures
It is well known how the accuracy and reliability of results obtained from tomographic inversion depends on several factors, including the inversion code used and the initial velocity model. The choice of starting velocity model is a critical aspect of the inversion process, as it significantly influences the accuracy and reliability of the final results. Selecting an appropriate initial model helps minimize potential biases and artifacts that could arise during the inversion [21], allowing for a more precise depiction of the subsurface structure.
In this study, we utilized various 3D starting models to thoroughly assess their impact on the inversion results. These included the 3D velocity models derived from the 1D velocity model from Vanorio et al. [9], with different Vp/Vs ratios ranging between 1.7 and 1.78, as well as the 3D velocity models obtained in Battaglia et al. [11]. This approach enabled exploring how different initial conditions could influence the final imaging of the subsurface structure, ensuring that the detected features are robust.
Moreover, the choice of the tomographic inversion code plays a pivotal role in accurately imaging the subsurface structure, as different algorithms have distinct approaches to solving the inversion problem and handling data uncertainties [22]. To enhance the reliability of our results, we used and compared two well-established inversion codes of the SimulPS [23] and tomoDD [24] families. The SimulPS14 code [25,26] is particularly effective for generating initial velocity models, thanks to its robust handling of local earthquake datasets and ability to make preliminary adjustments to the velocity structure. Conversely, the tomoDD code excels at refining these models through its double-difference approach, which reduces residual errors and enhances the resolution of subsurface features. Double-difference (DD) algorithms minimize the travel time differences between pairs of earthquakes observed at common stations. This method focuses on relative locations of earthquakes, which improves resolution in clustered seismicity. Moreover, the double-difference approach reduces the sensitivity to errors in the initial velocity model, making it computationally efficient for resolving small-scale features. The tomoDD version used in this study, named tomoDDPS [27], has advanced features for adjusting S-P times to account for different propagation velocities of P and S waves through various materials. Then, tomoDDPS is able to provide a more robust Vp/Vs model than that from the original DD tomography code (tomoDD), obtained simply by dividing Vp by Vs [28].
By employing both codes, we were able to cross-validate the results, assess the influence of the chosen starting models, and achieve a detailed and reliable representation of the Campi Flegrei Caldera’s complex subsurface. This combined approach ensured that our inversion outcomes were not overly dependent on a single method, thereby enhancing the robustness of our findings.
2.2. Dataset and Parameterization of Inversions
The majority of earthquakes in the Campi Flegrei Caldera take place at depths less than 3 km and exhibit a nearly elliptical distribution at the large caldera scale (Figure 1), as shown in the reference catalog of the Istituto Nazionale di Geofisica e Vulcanologia - Osservatorio Vesuviano [29](INGV-OV, https://doi.org/10.13127/gossip). The seismic activity mostly occurs inland, particularly under the Solfatara-Pisciarelli area and to the north of Pozzuoli, while it deepens offshore.
Typically, earthquakes have a duration magnitude of Md ≤ 1. However, since 2020, and particularly from early 2023 onward, there has been a significant rise in the average monthly magnitude. This increase includes over 30 earthquakes with magnitudes exceeding 3.0, the largest being a magnitude 4.4 earthquake recorded on May 20, 2024.
In this study, we considered only located events and the associated P- and S-wave arrival times from the INGV-OV earthquake database [29].
Typical lower magnitude events (Md < 2) present 6–10 P and 2–4 S arrival times. We extracted arrival times from 28 stations of the INGV-OV network (triangles in Figure 1), located within 15 km from the catalog epicentres. Since the data were collected by different operators at various times, the uncertainties in phase picking are not always reported and therefore not well known. Generally, the precision to which arrival times could be measured is ~0.01 s for P phases and ~0.2 s for S phases. Therefore, we decided to perform two different inversions, where we consider a uniform picking uncertainty across the entire dataset: one with a weight of 0 for P-phases and 1 for S-phases, and the other with a weight of 1 for P-phases and 2 for S-phases. From the initial dataset, we selected earthquakes that had at least 6 P and 3 S phase reads, azimuthal gaps smaller than 200, and RMS time residuals smaller than 0.2 s. This selection provided a refined dataset consisting of 4,161 earthquakes from the original 4,710 events of the INGV-OV database, with a final number of 41,272 P-wave readings and 14,683 S-wave readings.
As previously mentioned, we began by applying the SimulPS14 code, using the 1D Vp model from Vanorio et al. [9] as the starting model (hereafter referred as SimulPS-Vanorio). After carefully evaluating the 3D results with Vp/Vs ratios ranging from 1.7 to 1.78, we chose to use a constant Vp/Vs ratio of 1.7, which minimizes the residual. In the second step, the resulting Vp, Vs, and Vp/Vs models were used as starting points for further refinement with the tomoDDPS code (hereafter referred as tomoDDPS-SimulPS-Vanorio scheme). Furthermore, we also performed an inversion with tomoDDPS using the 3D velocity models from Battaglia et al. [11] (hereafter referred as tomoDDPS-Battaglia scheme) and compared the results obtained from these two final velocity models.
In the tomographic inversions using both SimulPS-Vanorio and tomoDDPS-SimulPS-Vanorio to resolve subsurface velocity structures, the inversion parameterized the study area with a grid of nodes spaced 1 km horizontally and 0.5 km vertically, extending to a depth of 8 km. Conversely, the tomoDDPS-Battaglia inversion used a finer grid spacing of 0.5 km in the longitude, latitude, and depth directions, providing a more detailed resolution.
To avoid overfitting and ensure stable inversion results with SimulPS14, we applied appropriate regularization techniques and smoothing constraints, controlling the trade-off between data fit and model smoothness. We chose the more suitable parameterization after some trial inversions, looking at the resulting model, the final data misfit and the resolution matrix. To find the best damping parameter, we ran some single-iteration inversions by varying the damping until the correct balance of misfit reduction and model complexity was found. Then a damping value of 30 for Vp and 25 for Vp/Vs ratio was chosen.
In the tomoDDPS inversion process, there are several important parameters that need to be determined: the weights for each phase, the weighting scheme for the absolute and differential catalog data, and damping. The phase weights used in this study were 1 for the P phase (0 in phase picking) structures and 0.5 (1 in phase picking) for the S phase structures. The weight of the P phase was set higher than that of the S phase because determining the S arrival time is generally more challenging and involves greater uncertainty compared to the P arrival time. For the weightings of the catalog and differential data, we gave a greater weight to the absolute data at the beginning of the inversion to obtain the velocity structure globally and at the end of the inversion a greater weight for differential data was employed to obtain the velocity structure in more detail [24]. In this study, the inversion process initially applied a weighting factor of 100 to the absolute catalog data in comparison to the differential data. Assessment of the optimal damping parameter was made based on the condition number (CND). The CND value was the ratio of the largest to the smallest eigenvalues which is between 80 to 100.
By inverting the 2020–2024 dataset using the tomoDDPS-Battaglia scheme, we processed 41,272 P-phases and 14,683 S-phases, along with a total of 388,166 P and 107,281 S differential times. After 11 iterations, we obtained the P and S velocity structures and determined the earthquake locations. For the unweighted catalog phases, the starting RMS value of 0.094 s decreased to 0.064 s, representing an approximate reduction of 32%. Conversely, for the weighted catalog, the starting RMS was 0.232 s, which was reduced to 0.043 s, resulting in an 82% decrease. Comparable results were achieved with the tomoDD-SimulPS-Vanorio scheme. For the unweighted catalog phases, the starting RMS of 0.082 s decreased to 0.064 s, yielding an approximate reduction of 22%. For the weighted catalog, the starting RMS value of 0.142 s was reduced to 0.043 s, representing a decrease of 70%.
3. Results
3.1. The 2020–2024 Inversion
For the entire dataset spanning 2020–2024, we initially compared the results from tomoDDPS-SimulPS-Vanorio and tomoDDPS-Battaglia. Although some details differ from each other, the main features of the tomographic images obtained are similar. Given the strong similarities between the two velocity models, we focused specifically on the tomoDDPS-Battaglia results. This choice was further justified by the following two reasons: 1) the better accuracy of Battaglia’s models as starting models, particularly in terms of the Vp structure, which benefited from denser sampling due to the SERAPIS active experiment, and 2) the greater flexibility of tomoDDPS in selecting initial velocity models, including the option to start from complex 3D models derived from other studies, which can lead to more accurate final models [27]. Additionally, using Battaglia’s models allowed us to integrate our tomography with external regions where the resolution was lower, enabling to show a more accurate representation of the subsurface structure of the Campi Flegrei Caldera, including offshore areas. However, the checkerboard and resolution tests show that owing to the distribution of the seismic sources and receivers, the model can be estimated correctly in a limited volume (Figures S3 and S4, see Supplementary material for further details). Therefore, our interest will be focused in the central part of CFC.
Figure 2.
Maps showing the final solutions for Vp (a), Vs (b) and Vp/Vs (c) models. Relocated 3D earthquakes (black circles) occurring within ±0.25 km from each layer are depicted. S indicates the Solfatara area. The blue continuous lines delineate the well-resolved areas. Outside of these regions, the velocity models from Battaglia et al. [11] are included.
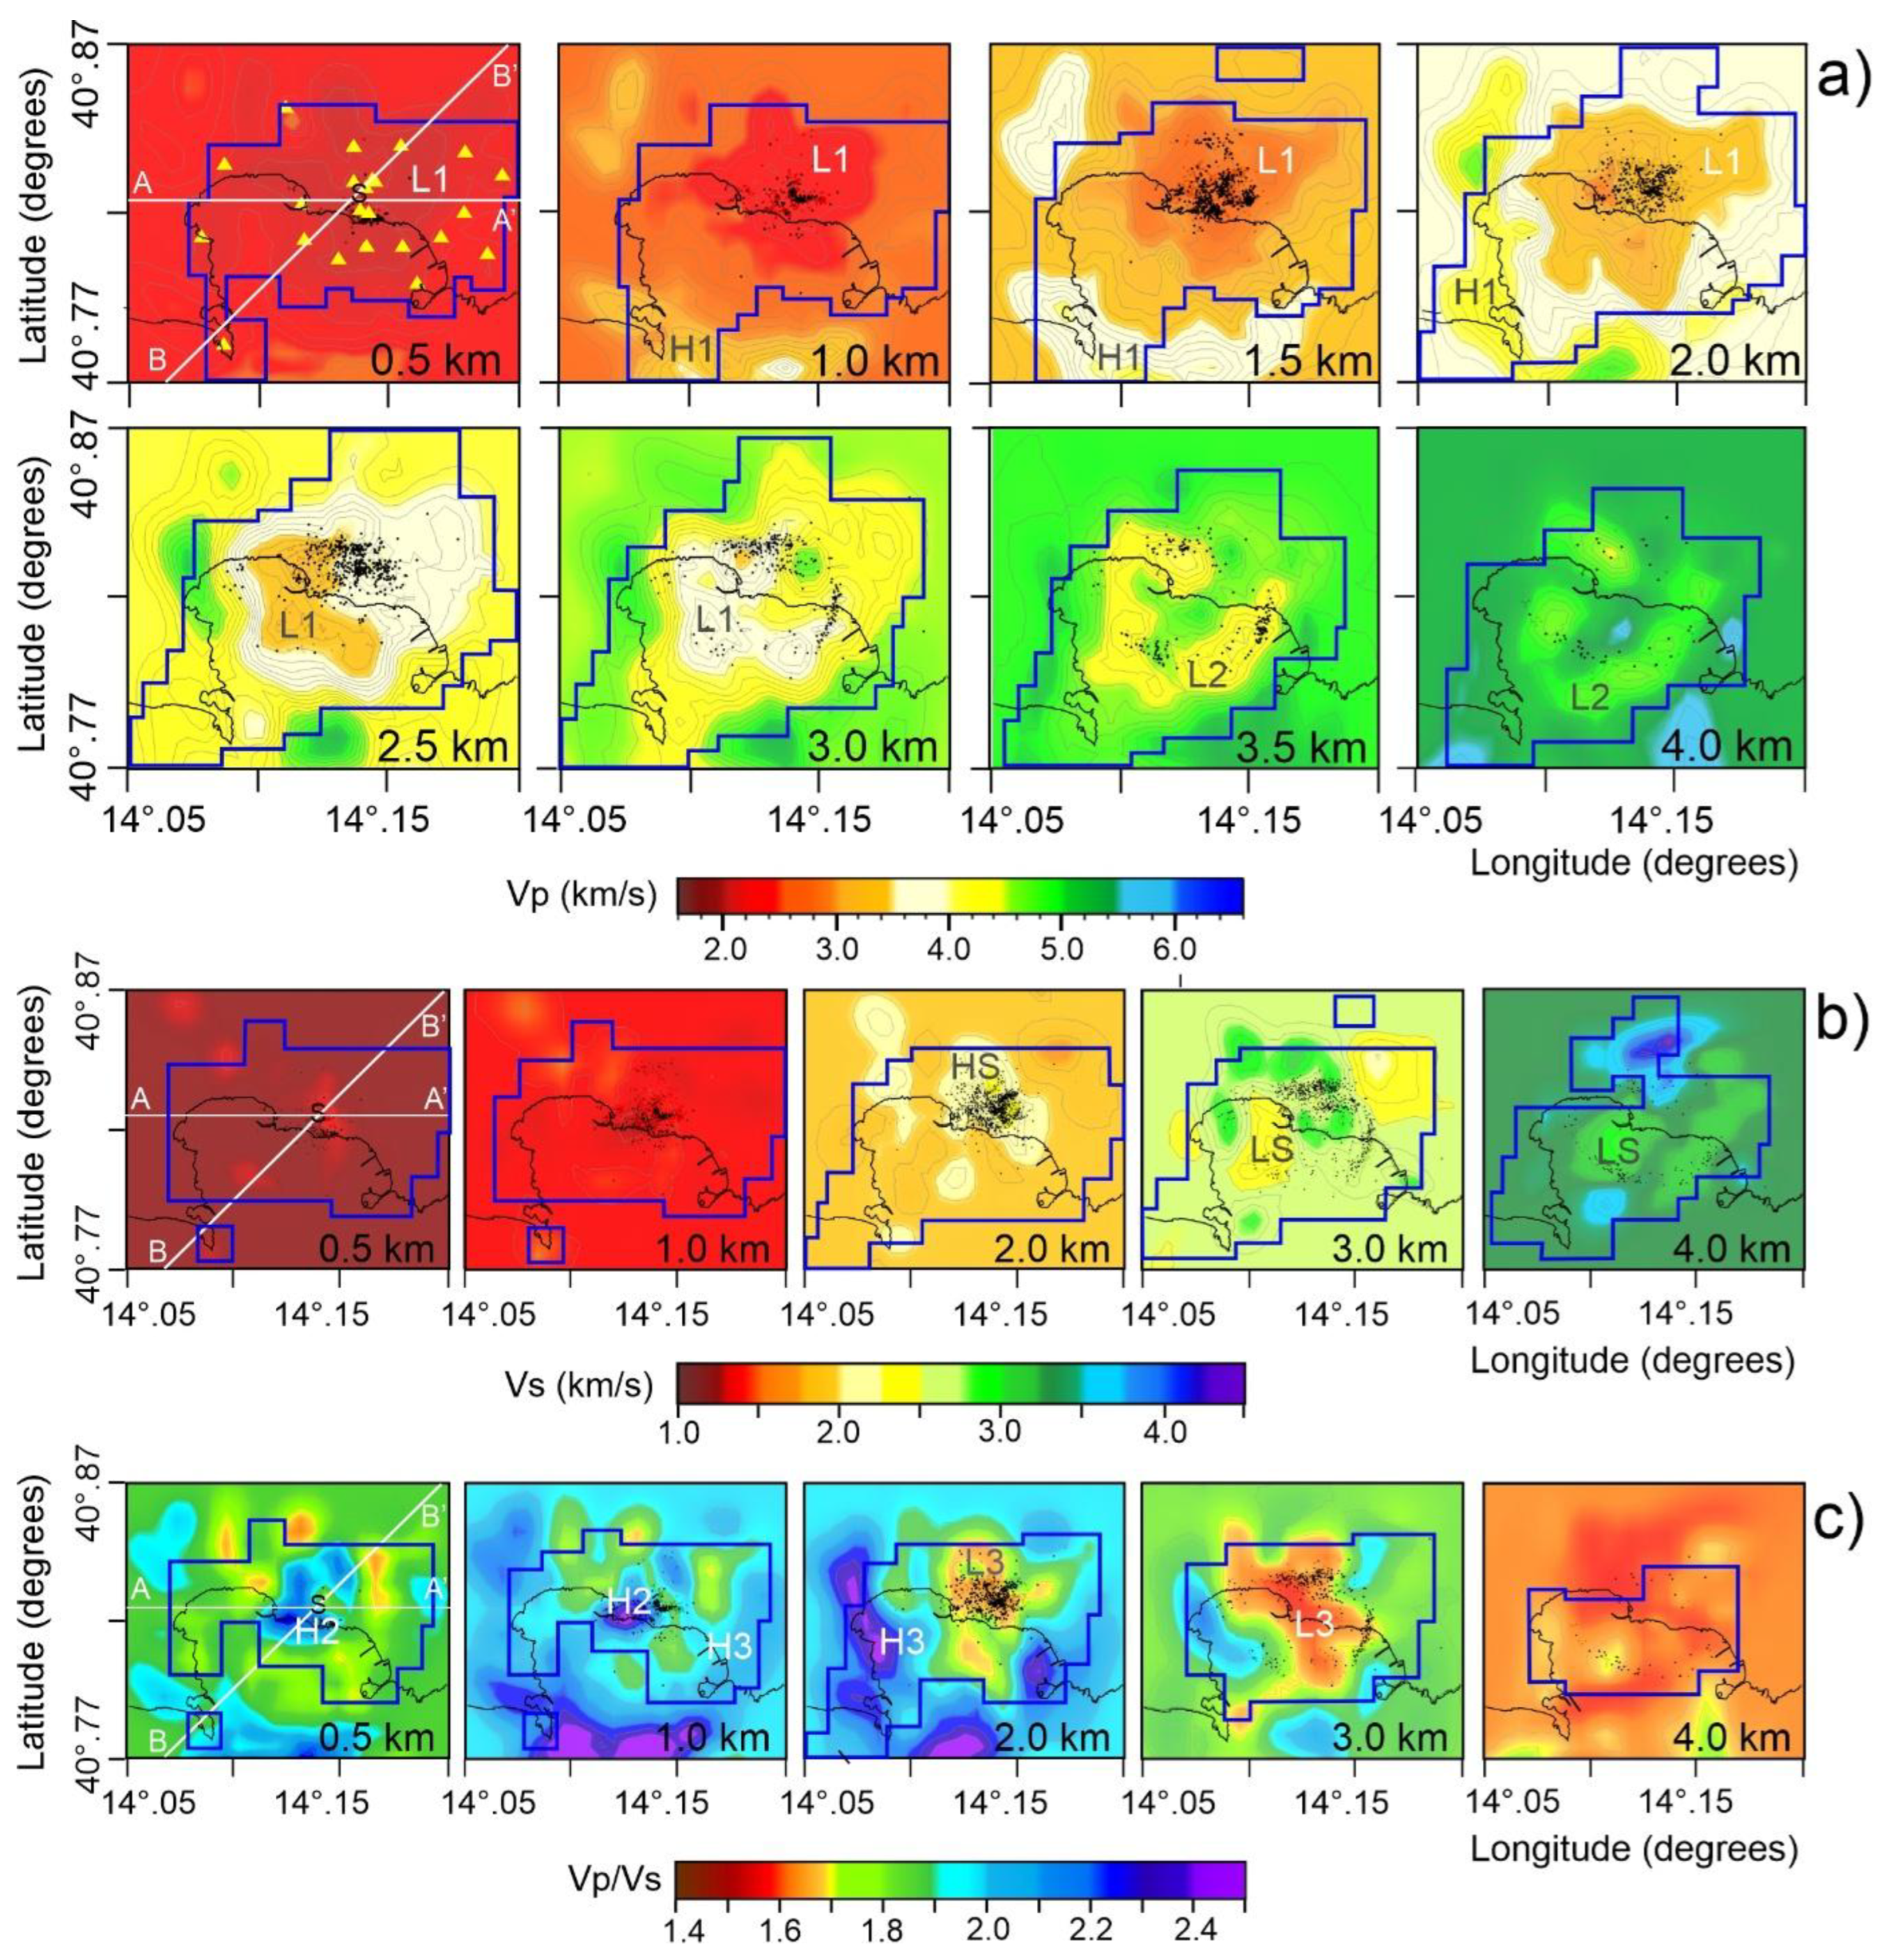
Figure 2a-c show the Vp, Vs and Vp/Vs tomographic images and 3D earthquake locations obtained for the period 2020–2024 at various horizontal depths.
According to synthetic tests and resolution criteria (Figures S3 and S4, see Supplementary material for further details), the 3D Vp, Vs and Vp/Vs structures are well-resolved in the central part of the study area down to a depth of about 4.0 km. The outline of the inferred region with reliable results is marked by a thick solid blue line (Figure 2a-c). In regions outside the area marked by the blue line, where our model resolution is poor, the displayed velocity models are those from Battaglia et al. (2005). To allow a direct comparison with the tomographic images of Vp models presented in Vanorio et al. [9] and Battaglia et al. [11], we maintained the color scales used in their figures, with only slight modifications.
The tomographic images shown in Figure 2a–c and Figure 3a–c, and the 3D representation of the Vp/Vs ratio in Figure 4 were obtained through 3D interpolation using Voxler software (Golden Software) with the Inverse Distance to a Power method.
The 3D approach, compared to 2D layer interpolation, typically presented in some tomographic studies, generally provides a more accurate and detailed representation of subsurface structures. Indeed, by accounting for variations in all three spatial dimensions, 3D interpolation can better capture the complexity of the subsurface, including vertical changes and subtle structural features that may be missed or not visible by 2D interpolation methods.
Key features of our Vp model include:
- •
- a wide relative low P-velocity anomaly (2.0 < Vp ≤ 4.0 km/s) in the central part of the caldera, mainly extending inland and down from approximately 0.5 km to 3.0 depth (L1 in Figure 2a). Between 2.5 and 3 km depth, this anomaly takes on an almost L-shaped aspect.
- •
- a relative low Vp (4.0 < Vp ≤ 5.0 km/s) region located at a depth of 3.0 and 4.0 km (L2 in Figure 2a), showing an almost elliptical shape and encircling a small high Vp anomaly (5.5 < Vp ≤ 6.0 km/s) at 4.0 km depth. This elliptical anomaly appears to delimit the morphological boundary of the internal resurgent dome [16], within which deeper earthquakes are mainly concentrated.
- •
- some portions of the arc-like high P-velocity anomaly (3.0 < Vp ≤ 5.0 km/s), previously identified in earlier tomographic studies [7,8,9,11] (H1 in Figure 2a). This anomaly, attributed to the buried rim of the Campi Flegrei outer caldera, is primarily located along the southern and western borders of the Gulf of Pozzuoli; it extends from about 0.5 km to approximately 2 km in depth, with seismic velocities increasing with depth. It has been interpreted as consolidated lavas and/or tuffs and interbedded lava sequences that signify the buried rim of the caldera [7].
Regarding the Vs structure, the most notable features of the model include:
- •
- a wide relative high-Vs anomaly (2.5 < Vs ≤ 3.0) located inland at about 2 km depth, between Pozzuoli and Campi Flegrei, coinciding with the region where a great part of earthquakes occurred (HS in Figure 2b).
- •
- ▪
- Analyzing the Vp/Vs structure, we obtain slightly more conservative absolute values of Vp/Vs with respect to the previous studies. They range from 1.6 to 2.5, suggesting that direct inversion of Vp/Vs from S-P data is probably more stable than deriving Vp/Vs from separate Vp and Vs models.
- ▪
- •
- two high Vp/Vs (≥ 1.9) volumes (H2 in Figure 2c and Figure 3c) are located in the shallower central part of the caldera, at depths ranging from approximately 0 to 1.5 km, surrounded by regions with normal to low Vp/Vs. The larger of these volumes lies beneath the inland area of Pozzuoli and partially extends offshore.
- •
- •
- a volume with a low Vp/Vs ratio with values ranging from 1.6 to 1.66 that rises from depth in the central part of the caldera and reaches approximately 1.5 km b.s.l. (L3 in Figure 2c and Figure 3c). This structure widens as it extends downward merging into an almost continuous layer at 3.5 km, that likely extends beyond 4.0 km depth.
The 3D representation of these low- and high-Vp/Vs volumes (Figure 4) in the central part of the caldera provides a clearer view of their shape and distribution at depth . Figure 4 displays the isovalues for both low Vp/Vs (≤ 1.66) and the shallower high Vp/Vs (≥ 2.1) structures. The low Vp/Vs structure appears as a complex, branching volume extending from approximately 1.5 km to 4 km depth. The two high Vp/Vs volumes in the central part of the caldera, situated between 0.2 km and 1.5 km depth, are positioned just above the branched low Vp/Vs region.
Figure 4.
3D representation in the central part of CFC of high and low Vp/Vs volumes based on their isovalues. The isovalues ≥ 2.1 are related to the higher Vp/Vs volumes, whereas isovalues ≤ 1.66 are associated the lower Vp/Vs volumes. 3D hypocentral earthquake locations (red circles) are also shown.

It is important to note that Figure 4 does not display the very shallow low Vp/Vs anomalies at depths ≤ 0.5 km, nor does it include the thick layer with high Vp/Vs values (between 1.0 km and 2.5 km depth) lacking in the central part of the calder and surrounding the two central high Vp/Vs volumes.
We believe that the branching low Vp/Vs volumes should represent regions where fluid and gas phases ascend toward the surface, a portion of which contributing to the Solfatara-Pisciarelli shallow hydrothermal system (Figure 3c). These findings are consistent with the interpretations of Vanorio et al. [9] and Battaglia et al. [11], who associate the low Vp/Vs anomaly observed beneath the caldera center, between 2 km and 4 km depth, and below 3.5 km in the surrounding areas, with overpressured water and/or gas-bearing rocks (thermo-metamorphic, Mesozoic carbonate and crystalline rocks; see Figure 3 in [30]) at supercritical conditions.
In contrast, the high Vp/Vs thick layer between ca. 1.0 and 2.5 km, and the two shallower high Vp/Vs anomalies at around 0-1.5 km depth in the central part of the caldera, likely indicates the presence of brine-saturated rocks pre- and post-caldera volcano and marine deposits (Figure 3 in [30]), possibly resulting from steam condensation due to lower temperatures measured at shallow depths [31].
A more detailed discussion on these observations is provided in the paragraph 4.0.
Temporal Variation of Vp, Vs and Vp/Vs (2023–2024 vs. 2020–2022)
4D tomographic inversion aims to detect changes in subsurface properties over time by comparing seismic data from different periods. By consistently using the same starting velocity model across multiple inversions, the differences observed in the final velocity models are more likely to reflect true temporal variations in the subsurface rather than artifacts introduced by variations in the initial conditions. This approach reduces a lot but does not zero the bias that might arise if different starting models are used, as variations due to the choice of different initial models could overshadow or distort the actual changes occurring in the subsurface [21]. Thus, maintaining a consistent starting velocity model improves the stability and comparability of the inversion results, ensuring that the detected changes likely can be primarily due to physical changes in the subsurface.
Given the significant increase in seismicity observed since 2023 (Figure 1b), we divide the 2020–2024 dataset into two sub-periods and compared the resulting tomoDDPS-Battaglia models obtained separately for the 2020–2022 and 2023–2024 to identify potential velocity changes. To verify the resolutions of the two seismic tomographic models, we also conducted resolution tests for each period as for 2020–2024 (Figures S5–S9, see Supplementary material).
First, we compared the images obtained from the two separate inversions and even though some details differ the main features of the resulting tomographic images remain consistent. In Figure 5 a,b, the temporal variations in velocity, obtained by subtracting the velocity values of the 2023–2024 model from those of the 2020–2022 model, are shown.
The observed differences highlight the evolution of velocity structures during 2023-2024, revealing areas where seismic velocities have increased or decreased. Specifically, both Vp and Vs show a broad, ring-shaped decrease, generally ranging from -2.5% to -10%. This decrease is particularly prominent at depths between approximately 2 km and 4 km, becoming more evident below 3 km, with some zones inside the ring exhibiting reductions also exceeding -10%.
For Vp, the region of decreased velocity surrounds, at depths of 3–4 km, a well-defined volume oriented roughly NW-SE, where seismic velocities increased by +2.5% to +10% (U1 in Figure 5). This increase is located between Pozzuoli and the adjacent offshore region, with the maximum increment (+10%) occurring between 3.5 and 4.0 km depth.
In contrast, the zone with increased Vs (+2.5% to +10%) (U2 in Figure 5) lies mainly at a depth of 2–3 km, with the maximum increment (+10%) occurring at ca. 2 km, primarily concentrated near and beneath the Solfatara area.
Considering the Vp/Vs ratio, the most significant variation (ranging from -2.5% to -10%) is observed between ca. 1.0 km and 3.0 km depth, with a maximum reduction of -10% occurring at approximately 2.0 km depth, almost in correspondence with the Vs increase (D1 in Figure 5). This observation might align well with seismic changes expected during the depletion of liquid pore fluids and their replacement by steam, a process observed to be progressive and extreme in other geothermal systems such as The Geysers (e.g., [32]). Instead, the observed deeper patterns of Vp and Vs increase at 3–4 km may suggest the presence of an inflating source at depth, due to a small intrusion of magma enriched in supercritical fluids. This intrusion likely influences the surrounding crustal structure through stress changes and fluid migration that reduce seismic velocities..
A more detailed discussion on these observations is provided in the paragraph 4.0.
4. Discussion
In this study, seismic imaging of the shallow volcanic structure beneath the central part of the Campi Flegrei Caldera (CFC) for the period 2020–2024 yields more refined Vp, Vs, and Vp/Vs models compared to previous tomographic investigations, reaching depths of approximately 4 km. The following discussion integrates these findings with recent geochemical and geodetic studies and compares the observed velocity variations in 2023–2024 to assess whether the ongoing unrest—accelerating since 2023—is primarily driven by magma intrusion or hydrothermal processes, a key challenge in understanding the current dynamics of Campi Flegrei. The volcanological literature on CFC presents contrasting interpretations, with several studies attributing the unrest to shallow magma intrusions and many others to hydrothermal perturbations associated with the injection of deep magmatic gases (e.g., [33]).
The Vp and Vs velocity models presented here enhance our understanding of the subsurface structures (Figure 2a,b and Figure 3a,b), though they do not provide clear evidence of low-velocity perturbations indicative of a distinct magma intrusion. The only exception is a relatively not well-confined low-Vs anomaly, located at a depth of 3–4 km (marked as LS in Figure 2b and Figure 3c), offshore and south of Pozzuoli. Differently, the Vp/Vs ratio has provided additional constraints for the identification of the causes of some observed seismic velocity variations (Figure 2c, Figure 3c and Figure 4).
It is well known that seismic velocities generally increase with depth due to the progressive compaction and densification of rocks under increasing overburden pressures. They are also influenced by multiple factors—including rock composition, porosity, fracturing, minerals, fluid saturation, temperature, and pressure—that can alter elastic properties and complicate the interpretation of seismic anomalies. Additionally, it is important to consider that ray-based seismic imaging methods may underestimate low-velocity anomalies and melt fractions, because seismic waves preferentially travel through high-velocity regions, potentially bypassing low-velocity zones [34]. This limitation is particularly significant when dealing with small magma intrusions (<1 km³) or when melt is distributed in thin, interconnected pockets rather than forming a large, coherent body [35].
The analysis of the compressional-to-shear wave velocity ratio (Vp/Vs) has proven particularly useful for constraining the distribution of fluids in volcanic and geothermal environments. In saturated or partially saturated rocks, fluid content and phase significantly influence P-wave velocities while having little effect on S-wave velocities [9]. Fluid phase transitions alter fluid compressibility and, consequently, the bulk modulus [36,37], while shear moduli remain largely unchanged. As a result, low Vp/Vs ratios are generally associated with gas-bearing rocks, which exhibit high fluid compressibility, whereas high Vp/Vs ratios indicate liquid-bearing rocks [9].
One of the most significant features of our tomographic results is the 3D reconstruction of the low Vp/Vs volumes (<1.66) beneath the central caldera (Figure 4). This 3D body appears as a broad, interconnected network of gas-bearing rocks extending from depths of 3.5–4.0 km up to approximately 1.5 km below the fumarolic areas of Campi Flegrei (Solfatara-Pisciarelli). We infer that this complex structure may represent the degassing pathway linking a deeper source to the surface fumarolic areas [38].
Another notable feature is the thick, extensive high Vp/Vs layer (values ranging from 1.9 to 2.5) located between 1.0 and 2.5 km depth beneath much of the caldera (Figure 2c and Figure 3c). This layer is attributed to liquid-bearing rocks and brine-saturated zones resulting from steam condensation. In the central caldera, this high Vp/Vs layer becomes discontinuous, and at shallower depths (0–1.5 km) two distinct high Vp/Vs zones emerge. The larger of these is situated beneath the inland area of Pozzuoli and extends partially offshore [11].
Geothermal drilling at Mofete and San Vito (Figure 1; [31,39]) confirms that volcanic sediments infiltrated by meteoric water form a porous, fluid-saturated matrix. These wells reveal a multi-reservoir geothermal system extending from 550 to 2700 m depth, characterized by high-salinity fluids, temperatures of 250–390 °C, and distinct fluid origins—seawater-derived at depths <2000 m and meteoric-magmatic below.
These high temperatures of approximately 400°C favor the decarbonation of deep limestone rocks, releasing additional CO₂ and contributing to the intense fumarolic activity observed at the surface in areas such as Solfatara and Pisciarelli.
Deep hot brines ascend through faults and fractures, mixing with shallow groundwater [40], while volcano-tectonic discontinuities facilitate the upward migration of fluids, including deep CO₂-rich mineralized fluids. Exceptionally high geothermal gradients measured in these wells [39,41] suggest a direct link between geothermal anomalies and hydrothermal activity. The interaction between cooler water and a deeper, hotter gas/steam reservoir may trigger rapid phase transitions (flashing), generating steam.
In the sketch model of Figure 6, we overlay the temperature distribution from the 3D Petrillo et al.’s model (Figure 10 in [38]) onto the W-E image of Vp/Vs structure. It is possible to observe a strong correlation with the boundaries of both high and low Vp/Vs regions, particularly in the western and central caldera. Additionally, the sketch model reports the most significant features obtained from comparing P- and S-wave velocity and Vp/Vs ratio (Figure 6) between the 2023–2024 and 2020–2022 periods.
The observed velocity variations at 3–4 km depth beneath the Pozzuoli area and its offshore (a ca. NW-SE elongated volume) indicate a significant increase in Vp (+2.5% to +10%) along with a minor increase in Vs, and a slight decrease in the Vp/Vs ratio. Extensive interdisciplinary research supports that tectonic structures oriented NW–SE and WNW–ESE may significantly influence recent unrest at Campi Flegrei (e.g., [33] and reference therein).
Two possible scenarios may explain these velocity variations:
1) A small magma intrusion enriched in supercritical fluids. In this case, the intrusion would stiffen the surrounding rock, leading to a significant increase in Vp, a modest increase in Vs, and a slight decrease in Vp/Vs. This behavior aligns with observations that high-pressure, high-density supercritical fluids reduce pore space and enhance rock stiffness [9,35].
2) The accumulation of pressurized fluids or high-density, mineral-saturated brines. These fluids similarly stiffen the rock matrix, increasing Vp, though their geochemical signatures differ from those associated with magma intrusions [42].
In both scenarios, the pressurized source influences the surrounding crust through stress changes and fluid migration, creating favorable conditions for rock fracturing and faulting. This is evidenced by the surrounding zones of Vp decrease (-2.5% to -10%), which can be linked to fluid-induced weakening and microfracturing in the adjacent rocks
At shallower depths (2–3 km), a significant increase (+10%) in Vs is observed, encircled also in this case by broader zones of Vs reduction (-2.5% to -10%). A decrease in Vs is typically associated with microfracturing, as the formation of microcracks lowers the shear modulus and, consequently, S-wave velocity. Additionally, fluid saturation reduces effective stress and acts as a lubricant within the rock matrix, further decreasing the shear modulus and Vs [42,43,44].
These observations support the interpretation that regions of reduced Vp and Vs during the 2023–2024 period are more damaged and less rigid, likely due to increased fracturing and fluid infiltration. Additionally, at shallower depths (2–3 km) beneath the Solfatara-Piscirelli area, the region of Vs increase coincides with a decrease in the Vp/Vs ratio. This may indicate the presence of relatively intact, stiff rock in which steam has gradually replaced liquid water under high-pressure and high-temperature conditions, thereby enhancing surface emissions. The resulting steam condensates can form brines and migrate upward along fracture networks, potentially explaining the intensification of fumarolic activity observed at the surface. Such seismic changes are similar to those documented in other geothermal systems, such as The Geysers [32], where the progressive replacement of liquid pore fluids by steam is associated with marked seismic anomalies.
Overall, these findings underscore the complex interplay between fluid migration, phase transitions, and rock mechanics in geothermal and volcanic settings, offering critical insights into the subsurface processes driving unrest at Campi Flegrei. Recent studies, focused on the ongoing unrest, offer varied insights.
Recently, Caliro et al. [45] refined some previous geochemical models [46,47,48] by integrating hydrothermal and magmatic contributions. They propose that the increased H₂S emissions observed from 2018 to 2022 may result from decompression-driven degassing of mafic magma at ~6 km depth, coupled with sulfur remobilization within the hydrothermal system. However, they caution that geochemical data alone cannot precisely constrain the pressure or depth of the magma source.
Anyway, nearly all recent geochemical studies consistently indicate that the hydrothermal system is responding to a deep pressurization source, with magmatic fluids migrating upward and reaching the hydrothermal system. This process induces substantial geochemical and geophysical modifications, including alterations in the gas compositions of fumarolic emissions and progressive changes in the mechanical properties of the crust as detected by seismic and geodetic measurements.
Ground deformation studies [49,50,51] consistently identify a primary magmatic pressure source between 3 and 4 km depth. Tizzani et al. [49] use multi-platform, multi-frequency InSAR data (Cosmo-SkyMed and Sentinel-1) from 2011–2022 to identify an inflating source at 3–4 km depth, interpreted as a pressurized magmatic intrusion. Giudicepietro et al. [50] analyze GNSS and Multi-Temporal DInSAR data from 2015 to 2023, highlighting a broad, bell-shaped deformation affecting the entire caldera (evident since 2021) interpreted as either a sill intrusion or a magmatic fluid accumulation zone inflating at ~3.8 km depth. Both Tizzani et al. [49] and Giudicepietro et al. [50] also identified a very shallow secondary source at 400-500 m of depth located beneath the Campi Flegrei that may be feeding fumaroles in the area. Astort et al. [51] analyze surface deformation at CF from 2007 to 2023, suggest the action of both a shallow and a deep source. They identify a deformation source that progressively widens and migrates upward from 5.9 km to 3.9 km depth, with inflation linked to the ascent of 0.06–0.22 km³ of magma from the deeper source (≥ 8 km), which undergoes minor deflation.
Therefore, the tomographic results presented here well agree with ground deformation studies and modeled source depths. However, even though the 2023–2024 temporal variations in Vp, Vs, and Vp/Vs allowed us to identify a deeper primary pressurized source at 3–4 km depth beneath Pozzuoli (and in its offshore area) and a secondary pressurized source at approximately 2 km depth—likely feeding the Solfatara-Piscirelli fumarolic field—we do not have clear evidence of a magma intrusion. Indeed, if a deeper magma intrusion enriched in supercritical fluids were present, the expected low Vp/Vs anomaly is indistinguishable from that of the surrounding rock, which already exhibits values below 1.66.
5. Conclusions
Distinguishing between magma intrusions and hydrothermal effects remains a critical challenge for understanding unrest at Campi Flegrei. Past interpretations have alternately attributed unrest to shallow magma intrusions or to thermal-fluid disturbances in the shallow geothermal system. Our analysis of seismic data from 2020–June 2024 produced updated 3D models of Vp, Vs, and Vp/Vs down to approximately 4 km depth, consistent with previous tomographic studies. Although these models did not reveal clear low-velocity anomalies typical of magma intrusions—except for a localized, poorly confined low-Vs anomaly at 3–4 km depth offshore and south of Pozzuoli—the comparison of tomographic images from 2023–2024 and 2020–2022 shows significant velocity variations. In particular, we observed a notable increase in Vp at 3–4 km depth beneath Pozzuoli and its offshore area, accompanied by a substantial increase in Vs at shallower depths (2–3 km) and a decrease in the Vp/Vs ratio at around 2 km beneath the Solfatara-Piscirelli area. Both the zones of increased Vp and Vs are surrounded by broad regions of velocity decrease.
One plausible interpretation is that the Vp increase at around 3–4 km depth reflects the effect of a deeper, roughly NW–SE-elongated pressurized source that stiffens the rock— either a magma intrusion enriched in supercritical fluids or an accumulation of pressurized, high-density fluids. This stiffening results in higher P-wave velocities relative to the surrounding, more porous, fluid-saturated rock.
These findings corroborate recent ground deformation analyses, which suggest the presence of a pressurized source between 3 and 4 km depth. In particular, Astort et al. [51] indicate that the inflation source at 3.9 km depth is linked to the ascent of 0.06–0.22 km³ of magma. This represents a very small volume (< 1 km³) that seismic tomography might fail to detect due to its resolution limitations at present, being influenced by factors such as the spacing between seismic sources and receivers, as well as the adequacy of ray coverage. Moreover, if the magma intrusion is enriched in supercritical fluids, the expected low Vp/Vs anomaly may be indistinguishable from that of the volume located at approximately 1.5 km b.s.l. in the central part of CFC, which merges into an almost continuous layer at 3.5–4.0 km depth (Figure 4) and exhibits a low Vp/Vs ratio (1.6–1.66).
Instead, the upward migration of fluids from this deeper source may cause the observed increase in Vs at around 2 km depth, indicating a separate and pressurized process within the shallow hydrothermal system. For instance, the shallower zone—characterized by increased Vs and a decreased Vp/Vs ratio—may indicate an area where, under high-pressure and high-temperature conditions, steam has gradually replaced liquid water, thereby contributing to the active feeding system of the Solfatara-Piscirelli fumarolic field. Meanwhile, the surrounding rock appears weakened by microfracturing, likely promoting increased seismicity.
These depth-related differences likely reflect the interplay between deep pressurization effects and shallow fluid phase transitions, which together produce distinct seismic signatures in Vp and Vs. Overall, our findings confirm recent ground deformation studies and modeled source depths associated with the ongoing unrest and underscore the complex interaction between deep magmatic processes and shallow hydrothermal dynamics. Fully resolving the origin of this pressurized source—and understanding its impact on the geothermal system—requires a robust, integrated approach that combines geophysical, geodetic, geochemical, and petrological data into a unified model for a more precise interpretation of these subsurface processes. Furthermore, we believe that additional multidisciplinary monitoring efforts and targeted investigations—such as a new active seismic experiment—are necessary. Considering that the unrest is still ongoing, the scientific community, local authorities and residents, are increasingly concerned, as a new eruptive episode could necessitate the evacuation of several hundred thousand people. Moreover, even without an eruption, the observed increase in seismicity could have significant consequences for such a densely populated area.
Supplementary Materials
The following supporting information can be downloaded at website of this paper posted on Preprints.org, Figure S1: Map and cross-sections (W–E and N–S) showing the P-wave ray tracing used for the inversion of 7,022 P-readings from 2020–2022 (yellow lines) and 34,250 P-readings from 2023–2024 (blue lines); Figure S2: Map and cross-sections (W–E and N–S) showing the S-wave ray tracing used for the inversion of 2,573 S-readings from 2020–2022 (yellow lines) and 12,110 S-readings from 2023–2024 (blue lines); Figure S3: Distribution of Vp (a), Vs (b) and Vp/Vs (c) obtained from the restoring resolution test for the most representative layers of the entire 2020–2024 dataset; Figure S4: Checkerboard test results for the 2020–2024 period; Figure S5: Checkerboard test results for the 2020–2022 period; Figure S6: Checkerboard test results for the 2023–2024 period; Figure S7: Checkerboard test results for vertical sections; Figure S8: Results of the spike test for Vp over the entire 2020–2024 dataset; Figure S9: Results of the spike test for Vp/Vs over the entire 2020–2024 dataset. References [52,53] are cited in the Supplementary Materials.
Author Contributions
Conceptualization, D.P., G.B., C.M.; methodology, D.P. and G.B.; software, G.B.; validation, D.P., G.B. and C.M..; formal analysis, G.B. and C.M.; data curation, C.M.; writing—original draft preparation, D.P.; writing—review and editing, D.P.; supervision, D.P., G.B., C.M.; funding acquisition, C.M. All authors have read and agreed to the published version of the manuscript.
Funding
This research was funded by Project INGV Rete Multiparametriche OR EEW and Vulcani - OR Stromboli.i
Data Availability Statement
The data that support the findings of this study are available from the corresponding author, D.P., upon request.
Acknowledgments
We thank the Osservatorio Vesuviano-Istituto Nazionale di Geofisica e Vulcanologia for the seismic records used in this study [29] (https://doi.org/10.13127/gossip). We especially thank Haijiang Zhang and Clifford Thurber for realizing and sharing the tomoDDPS code and Aldo Zollo for his helpful comments on the paper.
We are extremely grateful to our collaborators for sharing their results with us. We thank INGV-CT for allowing us to use their Mt. Etna 2001 eruption data. We especially thank Felix Waldhauser and Steve Roecker for their assistance and helpful comments in the early stage of tomoDD algorithm development. Megan Flanagan helped us to realize the tomoFDD algorithm using part of her code.
Conflicts of Interest
The authors declare no conflicts of interest.
References
- Natale, J.; Camanni, G.; Ferranti, L.; Isaia, R.; Sacchi, M.; Spiess, V.; Steinmann, L.; Vitale, S. Fault systems in the offshore sector of the Campi Flegrei caldera (Southern Italy): Implications for nested caldera structure, resurgent dome, and volcano-tectonic evolution. Journal of Structural Geology 2022, 163, 104723. [Google Scholar] [CrossRef]
- Giaccio, B.; Haydas, I.; Isaia, R.; Deino, A.; Nomade, S. High-precision 14C and 40Ar/39Ar dating of Campanian Ignimbrite (Y-5) reconciles the time-scales of climatic cultural processes at 40 ka. Sci. Rep. 2017, 7, 45940. [Google Scholar] [CrossRef]
- Deino, A.L.; Orsi, G.; De Vita, S.; Piochi, M. The age of the Neapolitan Yellow Tuff caldera-forming eruption (Campi Flegrei caldera, Italy) assessed by 40Ar/39Ar dating method. J. Volcanol. Geotherm. Res. 2004, 133, 157–170. [Google Scholar] [CrossRef]
- De Vivo, B.; Rolandi, G. Volcanological risk associated with Vesuvius and Campi Flegrei. In Vesuvius, Campi Flegrei, and Campanian Volcanism, De Vivo, B., Belkin, H.E., Rolandi, G., Eds.; Elsevier, 2020, pp. 471–493, ISBN 9780128164549. [CrossRef]
- Del Gaudio, C.; Aquino, I.; Ricciardi, G.P.; Ricco, C.; Scandone, R. Unrest episodes at Campi Flegrei: A reconstruction of vertical ground movements during 1905–2009. J. Volcanol. Geotherm. Res. 2010, 195, 48–56. [Google Scholar] [CrossRef]
- Aster, R.C.; Meyer, R.P. Three-dimensional velocity structure and hypocentral distribution in the Campi Flegrei caldera, Italy. Tectonophysics 1988, 149, 195–218. [Google Scholar] [CrossRef]
- Zollo, A.; Judenherc, S.; Auger, E.; D’Auria, L.; Virieux, J.; Capuano, P.; Chiarabba, C.; de Franco, R.; Makris, J.; Michelini, A.; et al. Evidence for the buried rim of Campi Flegrei caldera from 3-d active seismic imaging. Geophys. Res. Lett. 2003, 30, 2002. [Google Scholar] [CrossRef]
- Judenherc, S.; Zollo, A. The Bay of Naples (southern Italy): Constraints on the volcanic structures inferred from a dense seismic survey. J. Geophys. Res. Solid Earth 2004, 109, B10312. [Google Scholar] [CrossRef]
- Vanorio, T.; Virieux, J.; Capuano, P.; Russo, G. Three-dimensional seismic tomography from P wave and S wave microearthquake travel times and rock physics characterization of the Campi Flegrei caldera. J. Geophys. Res. Solid Earth 2005, 110, B03201. [Google Scholar] [CrossRef]
- Chiarabba, C.; Moretti, M. An insight into the unrest phenomena at the Campi Flegrei caldera from Vp and Vp/Vs tomography. Terra Nova 2006, 18, 373–379. [Google Scholar] [CrossRef]
- Battaglia, J.; Zollo, A.; Virieux, J.; Dello Iacono, D. Merging active and passive data sets in traveltime tomography: The case study of Campi Flegrei Caldera (Southern Italy). Geophyiscal Prospecting 2008, 56, 555–573. [Google Scholar] [CrossRef]
- Dello Iacono, D.; Zollo, A.; Vassallo, M.; Vanorio, T.; Judenherc, S. Seismic images and rock properties of the very shallow structure of Campi Flegrei caldera (southern Italy). Bull. Volcanol. 2009, 71, 275–284. [Google Scholar] [CrossRef]
- Calò, M.; Tramelli, A. Anatomy of the Campi Flegrei caldera using enhanced seismic tomography models. Sci. Rep. 2018, 8, 16254. [Google Scholar] [CrossRef] [PubMed]
- De Landro, G.; Amoroso, O.; Russo, G.; Zollo, A. 4D travel-time tomography as a tool for tracking fluid-driven medium changes in off-shore oil-gas exploitation areas. Energies 2020, 13, 5878. [Google Scholar] [CrossRef]
- Giacomuzzi, G.; Chiarabba, C.; Bianco, F.; De Gori, P.; Piana Agostinetti, N. Tracking transient changes in the plumbing system at Campi Flegrei Caldera. Earth Planet. Sci. Lett. 2024, 637, 118744. [Google Scholar] [CrossRef]
- Sbrana, A.; Marianelli, P.; Pasquini, G. The Phlegrean Fields volcanological evolution. J. Maps 2021, 17, 557–570. [Google Scholar] [CrossRef]
- Patanè, D.; Barberi, G.; Cocina, O.; De Gori, P.; Chiarabba, C. Time-Resolved Seismic Tomography Detects Magma Intrusions at Mount Etna. Science 2006, 313, 821–823. [Google Scholar] [CrossRef] [PubMed]
- Foulger, G.R.; Julian, B.R.; Pitt, A.M.; Hill, D.P.; Malin, P.E.; Shalev, E. Three-dimensional crustal structure of Long Valley caldera, California, and evidence for the migration of CO2 under Mammoth Mountain. J. Geophys. Res. Solid Earth 2003, 108, 2147. [Google Scholar] [CrossRef]
- Tezel, T.; Julian, B.R.; Foulger, G.R.; Nunn, C.; Mhana, N. Preliminary 4D Seismic Tomography Images for The Geysers, 2008- 2014. In Proceedings, 41st Workshop on Geothermal Reservoir Engineering, Stanford University, Stanford, California, USA, 22–24 February 2016.
- Londoño, J.M.; Kumagai, H. 4D seismic tomography of Nevado del Ruiz Volcano, Colombia, 2000–2016. J. Volcanol. Geotherm. Res. 2018, 358, 105–123. [Google Scholar] [CrossRef]
- Kissling, E.; Ellsworth, W.L.; Eberhart-Phillips, D.; Kradolfer, U. Initial reference models in local earthquake tomography. J. Geophys. Res. Solid Earth 1994, 99, 19635–19646. [Google Scholar] [CrossRef]
- Priolo, E.; Lovisa, L.; Zollo, A.; Böhm, G.; D’Auria, L.; Gautier, S.; Gentile, F.; Klin, P.; Latorre, D.; Michelini, A.; et al. The Campi Flegrei Blind Test: Evaluating the Imaging Capability of Local Earthquake Tomography in a Volcanic Area. Int. J. Geophy. 2012, 37, 1–37. [Google Scholar] [CrossRef]
- Thurber, C.H. Local earthquake tomography: velocities and Vp/Vs-theory. In Seismic Tomography: Theory and Practice, Iyer, H.M., Hirahara, K., Eds.; Springer, Chapman and Hall, London, 1993, pp. 563–583.
- Zhang, H.; Thurber, C.H. Double-Difference Tomography: The Method and Its Application to the Hayward fault, California. Bull. Seismol. Soc. Am. 2003, 93, 1875–1889. [Google Scholar] [CrossRef]
- Haslinger, F.; Kissling, E.; Ansorge, J.; Hatzfeld, D.; Papadimitriou, E.; Karakostas, V.; Makropoulos, K.; Kahle, H.-G.; Peter, Y. 3D crustal structure form local earthquake tomography around the Gulf of Arta (Ionian region, NW Greece). Tectonophysics 1999, 304, 201–218. [Google Scholar] [CrossRef]
- Haslinger, F.; Kissling, E. Investigating effects of 3-D ray tracing methods in local earthquake tomography. Phys. Earth Planet. Inter. 2001, 123, 103–114. [Google Scholar] [CrossRef]
- Zhang, H.; Thurber, C.; Bedrosian, P. Joint inversion for Vp, Vs, and Vp/Vs at SAFOD, Parkfield, California. Geochem. Geophys. Geosyst. 2009, 10, Q11002. [Google Scholar] [CrossRef]
- Guo, H.; Zhang, H.; Froment, B. Structural control on earthquake behaviors revealed by high-resolution Vp/Vs imaging along the Gofar transform fault, East Pacific Rise. Earth Planet. Sci. Lett. 2018, 499, 243–255. [Google Scholar] [CrossRef]
- Ricciolino, P.; Lo Bascio, D.; Esposito, R. GOSSIP - Database sismologico Pubblico INGV-Osservatorio Vesuviano. Istituto Nazionale di Geofisica e Vulcanologia (INGV) 2024. Available online: https://doi.org/10.13127/gossip.
- Zollo, A.; Maercklin, N.; Vassallo, M.; Dello Iacono, D.; Virieux, J.; Gasparini, P. Seismic reflections reveal a massive melt layer feeding Campi Flegrei caldera. Geophys. Res. Lett. 2008, 35, L12306. [Google Scholar] [CrossRef]
- AGIP, 1987. Geologia e geofisica del sistema geotermico dei Campi Flegrei. Technical Report SERG-ESG 1987, San Donato Italy, p. 17.
- Guo, H.; Thurber, C. Temporal changes in seismic velocity and attenuation at The Geysers geothermal field, California, from double-difference tomography. J. Geophys. Res. Solid Earth 2022, 127, e2021JB022938. [Google Scholar] [CrossRef]
- Troise, C.; De Natale, G.; Schiavone, R.; Somma, R.; Moretti, R. The Campi Flegrei caldera unrest: Discriminating magma intrusions from hydrothermal effects and implications for possible evolution. Earth-Science Rev. 2019, 188, 108–122. [Google Scholar] [CrossRef]
- Lees, J.M. Seismic tomography of magmatic systems. J. Volcanol. Geotherm. Res. 2007, 167, 37–56. [Google Scholar] [CrossRef]
- Takei, Y. Effect of pore geometry on Vp /Vs: from equilibrium geometry to crack. J. Geophys. Res. Solid Earth 2002, 107, ECV 6-1–ECV 6-12. [Google Scholar] [CrossRef]
- Ito, H.; DeVilbiss, J.; Nur, A. Compressional and shear waves in saturated rock during water-steam transition. J. Geophys. Res. Solid Earth 1979, 84, 4731–4735. [Google Scholar] [CrossRef]
- Wang, Z.; Nur, A.M. Effects of CO2 flooding on wave velocities in rocks with hydrocarbons. SPE Res. Eng. 1989, 4, 429–436. [Google Scholar] [CrossRef]
- Petrillo, Z.; Chiodini, G.; Mangiacapra, A.; Caliro, S.; Capuano, P.; Russo, G.; Cardellini, C.; Avino, R. Defining a 3D physical model for the hydrothermal circulation at Campi Flegrei caldera (Italy). J. Volcanol. Geotherm. Res. 2013, 264, 172–182. [Google Scholar] [CrossRef]
- Piochi, M.; Kilburn, C.R.J.; Di Vito, M.A.; Mormone, A.; Tramelli, A.; Troise, C.; De Natale, G. The volcanic and geothermally active Campi Flegrei caldera: an integrated multidisciplinary image of its buried structure. Int. J. Earth Sci. (Geol. Rundsch) 2014, 103, 401–421. [Google Scholar] [CrossRef]
- Aiuppa, A.; Avino, R.; Brusca, L.; Caliro, S.; Chiodini, G.; D’Alessandro, W.; Favara, R.; Federico, C.; Ginevra, W.; Inguaggiato, S.; et al. Mineral control of arsenic content in thermal waters from volcano-hosted hydrothermal systems: Insights from island of Ischia and Phlegrean Fields (Campanian Volcanic Province, Italy). Chem. Geol. 2006, 229, 313–330. [Google Scholar] [CrossRef]
- Chiodini, G.; Todesco, M.; Caliro, S.; Del Gaudio, C.; Macedonio, G.; Russo, M. Magma degassing as a trigger of bradyseismic events: The case of Phlegrean Fields (Italy). Geophys. Res. Lett. 2003, 30, 1434. [Google Scholar] [CrossRef]
- Mavko, G.; Mukerji, T.; Dvorkin, J. The Rock Physics Hanbook: Tools for Seismic Analysis of Porous Media, 2nd ed.; Cambridge University Press: Cambridge, UK, 2009; ISBN 978-05-1162-675-3. [Google Scholar] [CrossRef]
- Nur, A. Dilatancy, pore fluids, and premonitory variations of ts/tp travel times. Bull. Seismol. Soc. Am. 1972, 62, 1217–1222. [Google Scholar] [CrossRef]
- O’Connell, R.J.; Budiansky, B. Seismic velocities in dry and saturated cracked solids. J. Geophys. Res. 1974, 79, 5412–5426. [Google Scholar] [CrossRef]
- Caliro, S.; Avino, R.; Capecchiacci, F.; Carandente, A.; Chiodini, G.; Cuoco, E.; Minopoli, C.; Rufino, F.; Santi, A.; Rizzo, A.L.; et al. Chemical and isotopic characterization of groundwater and thermal waters from the Campi Flegrei caldera (southern Italy). J. Volcanol. Geotherm. Res. 2025, 460, 108280. [Google Scholar] [CrossRef]
- Moretti, R.; Troise, C.; Sarno, F.; De Natale, G. Caldera unrest driven by CO2-induced drying of the deep hydrothermal system. Sci. Rep. 2018, 8, 8309. [Google Scholar] [CrossRef]
- Chiodini, G.; Caliro, S.; Avino, R.; Bini, G.; Giudicepietro, F.; De Cesare, W.; Ricciolino, P.; Aiuppa, A.; Cardellini, C.; Petrillo, Z.; et al. Hydrothermal pressure-temperature control on CO2 emissions and seismicity at Campi Flegrei (Italy). J. Volcanol. Geotherm. Res. 2021, 414, 107245. [Google Scholar] [CrossRef]
- Buono, G.; Caliro, S.; Paonita, A.; Pappalardo, L.; Chiodini, G. Discriminating carbon dioxide sources during volcanic unrest: The case of Campi Flegrei caldera (Italy). Geology 2023, 51, 397–401. [Google Scholar] [CrossRef]
- Tizzani, P.; Fernández, J.; Vitale, A.; Escayo, J.; Barone, A.; Castaldo, R.; Pepe, S.; De Novellis, V.; Solaro, G.; Pepe, A.; et al. 4D imaging of the volcano feeding system beneath the urban area of the Campi Flegrei caldera. Remote Sensing of Environment 2024, 315, 114480. [Google Scholar] [CrossRef]
- Giudicepietro, F.; Casu, F.; Bonano, M.; De Luca, C.; De Martino, P.; Di Traglia, F.; Di Vito, M.A.; Macedonio, G.; Manunta, M.; Monterroso, F.; et al. First evidence of a geodetic anomaly in the Campi Flegrei caldera (Italy) ground deformation pattern revealed by DInSAR and GNSS measurements during the 2021–2023 escalating unrest phase. International Journal of Applied Earth Observation and Geoinformation 2024, 132, 104060. [Google Scholar] [CrossRef]
- Astort, A.; Trasatti, E.; Caricchi, L.; Polcari, M.; De Martino, P.; Acocella, V.; Di Vito, M.A. Tracking the 2007–2023 magma-driven unrest at Campi Flegrei caldera (Italy). Commun. Earth Environ. 2024, 5, 506. [Google Scholar] [CrossRef]
- Zhao, D.; Hasegawa, A.; Horiuchi, S. Tomographic imaging of P and S wave velocity structure beneath northeastern Japan. J. Geophys. Res. Solid Earth 1992, 97, 19909–19928. [Google Scholar] [CrossRef]
- Rawlinson, N.; Spakman, W. On the use of sensitivity tests in seismic tomography. Geophys. J. Int. 2016, 205, 1221–1243. [Google Scholar] [CrossRef]
Figure 3.
Cross-sections W-E and SW-NE oriented (see white lines in Figure 3) Vp (a), Vs (b) and Vp/Vs (c) models. Relocated 3D earthquakes (black circles) occurring within ±0.25 km from each cross-section are depicted. The dotted gray lines in the sections are the hypothesized limits of the outer and inner margins of the caldera reported in Figure 1a. The blue continuous lines delineate the well-resolved areas. Outside of these regions, the velocity models from Battaglia et al. [11] are shown.
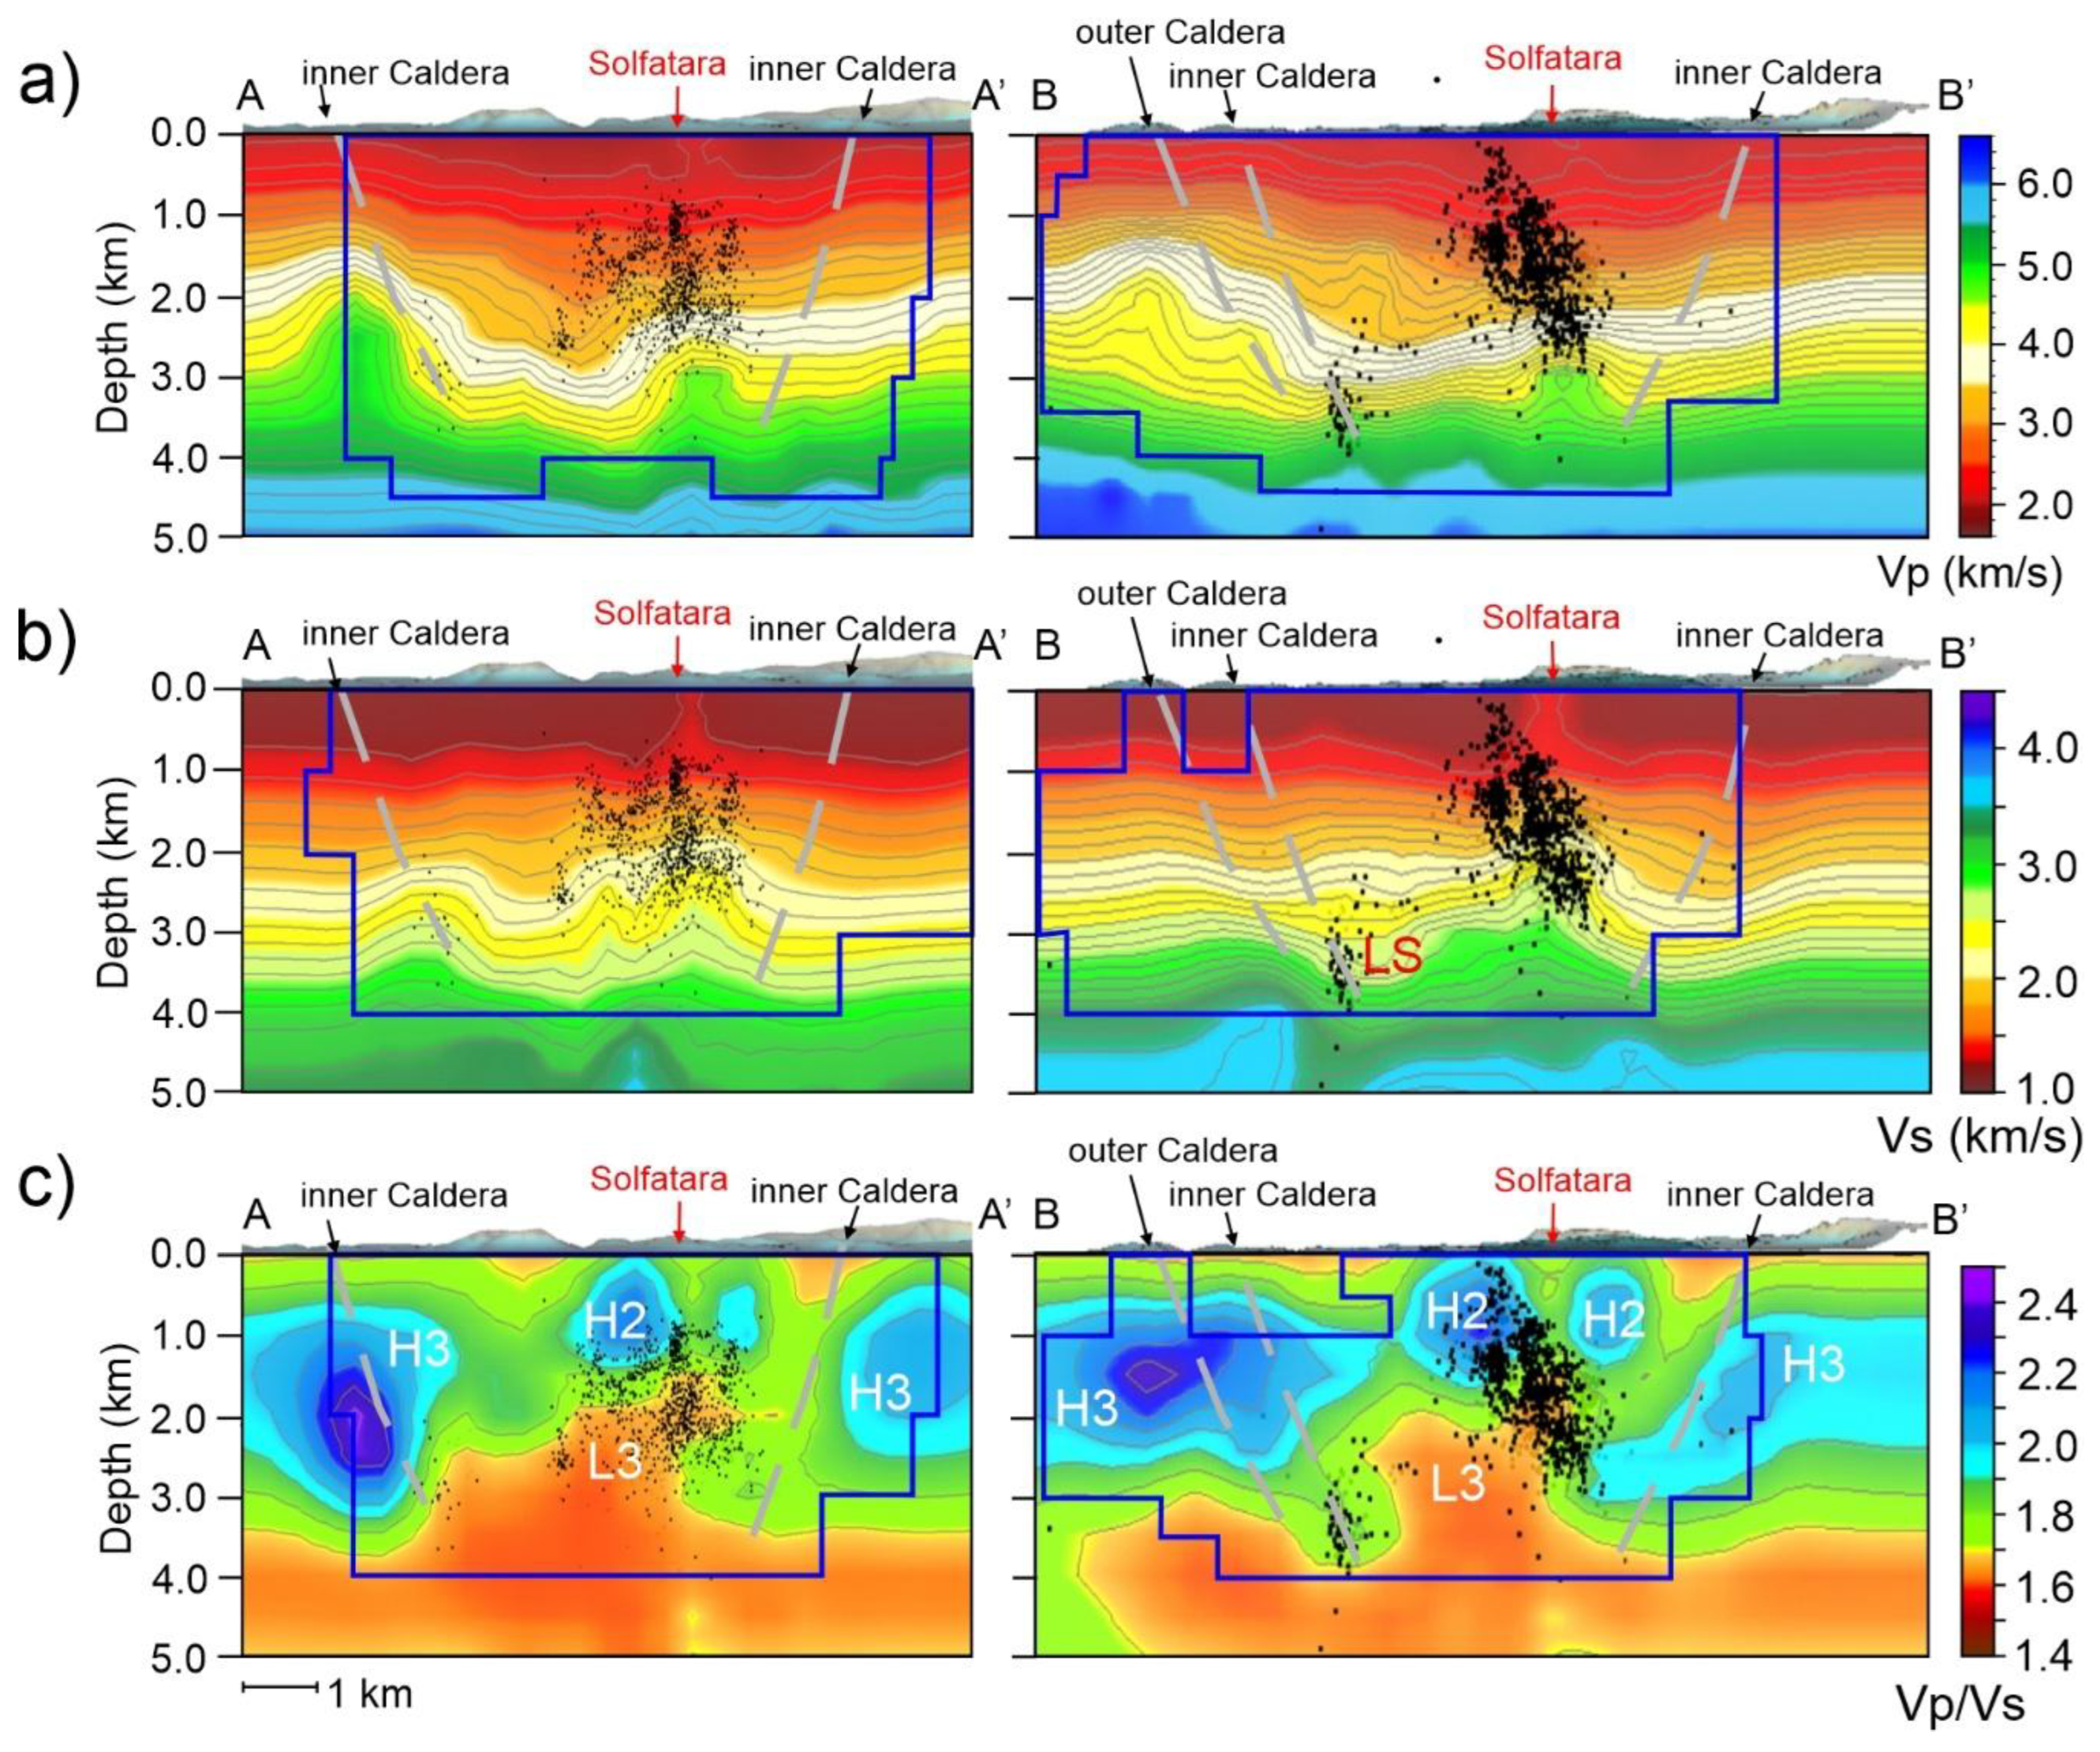
Figure 5.
Differences in Vp, Vs, and Vp/Vs between the 2023–2024 and 2020–2022 models. Increases in P- and S-wave velocities are indicated by U1 and U2, respectively, while D1 denotes a decrease in the Vp/Vs ratio. Relocated 3D earthquakes (black circles) occurring within ±0.25 km from each section are depicted. The dotted gray lines in the sections are the hypothesized limits of the outer and inner margins of the caldera reported in Figure 1a.
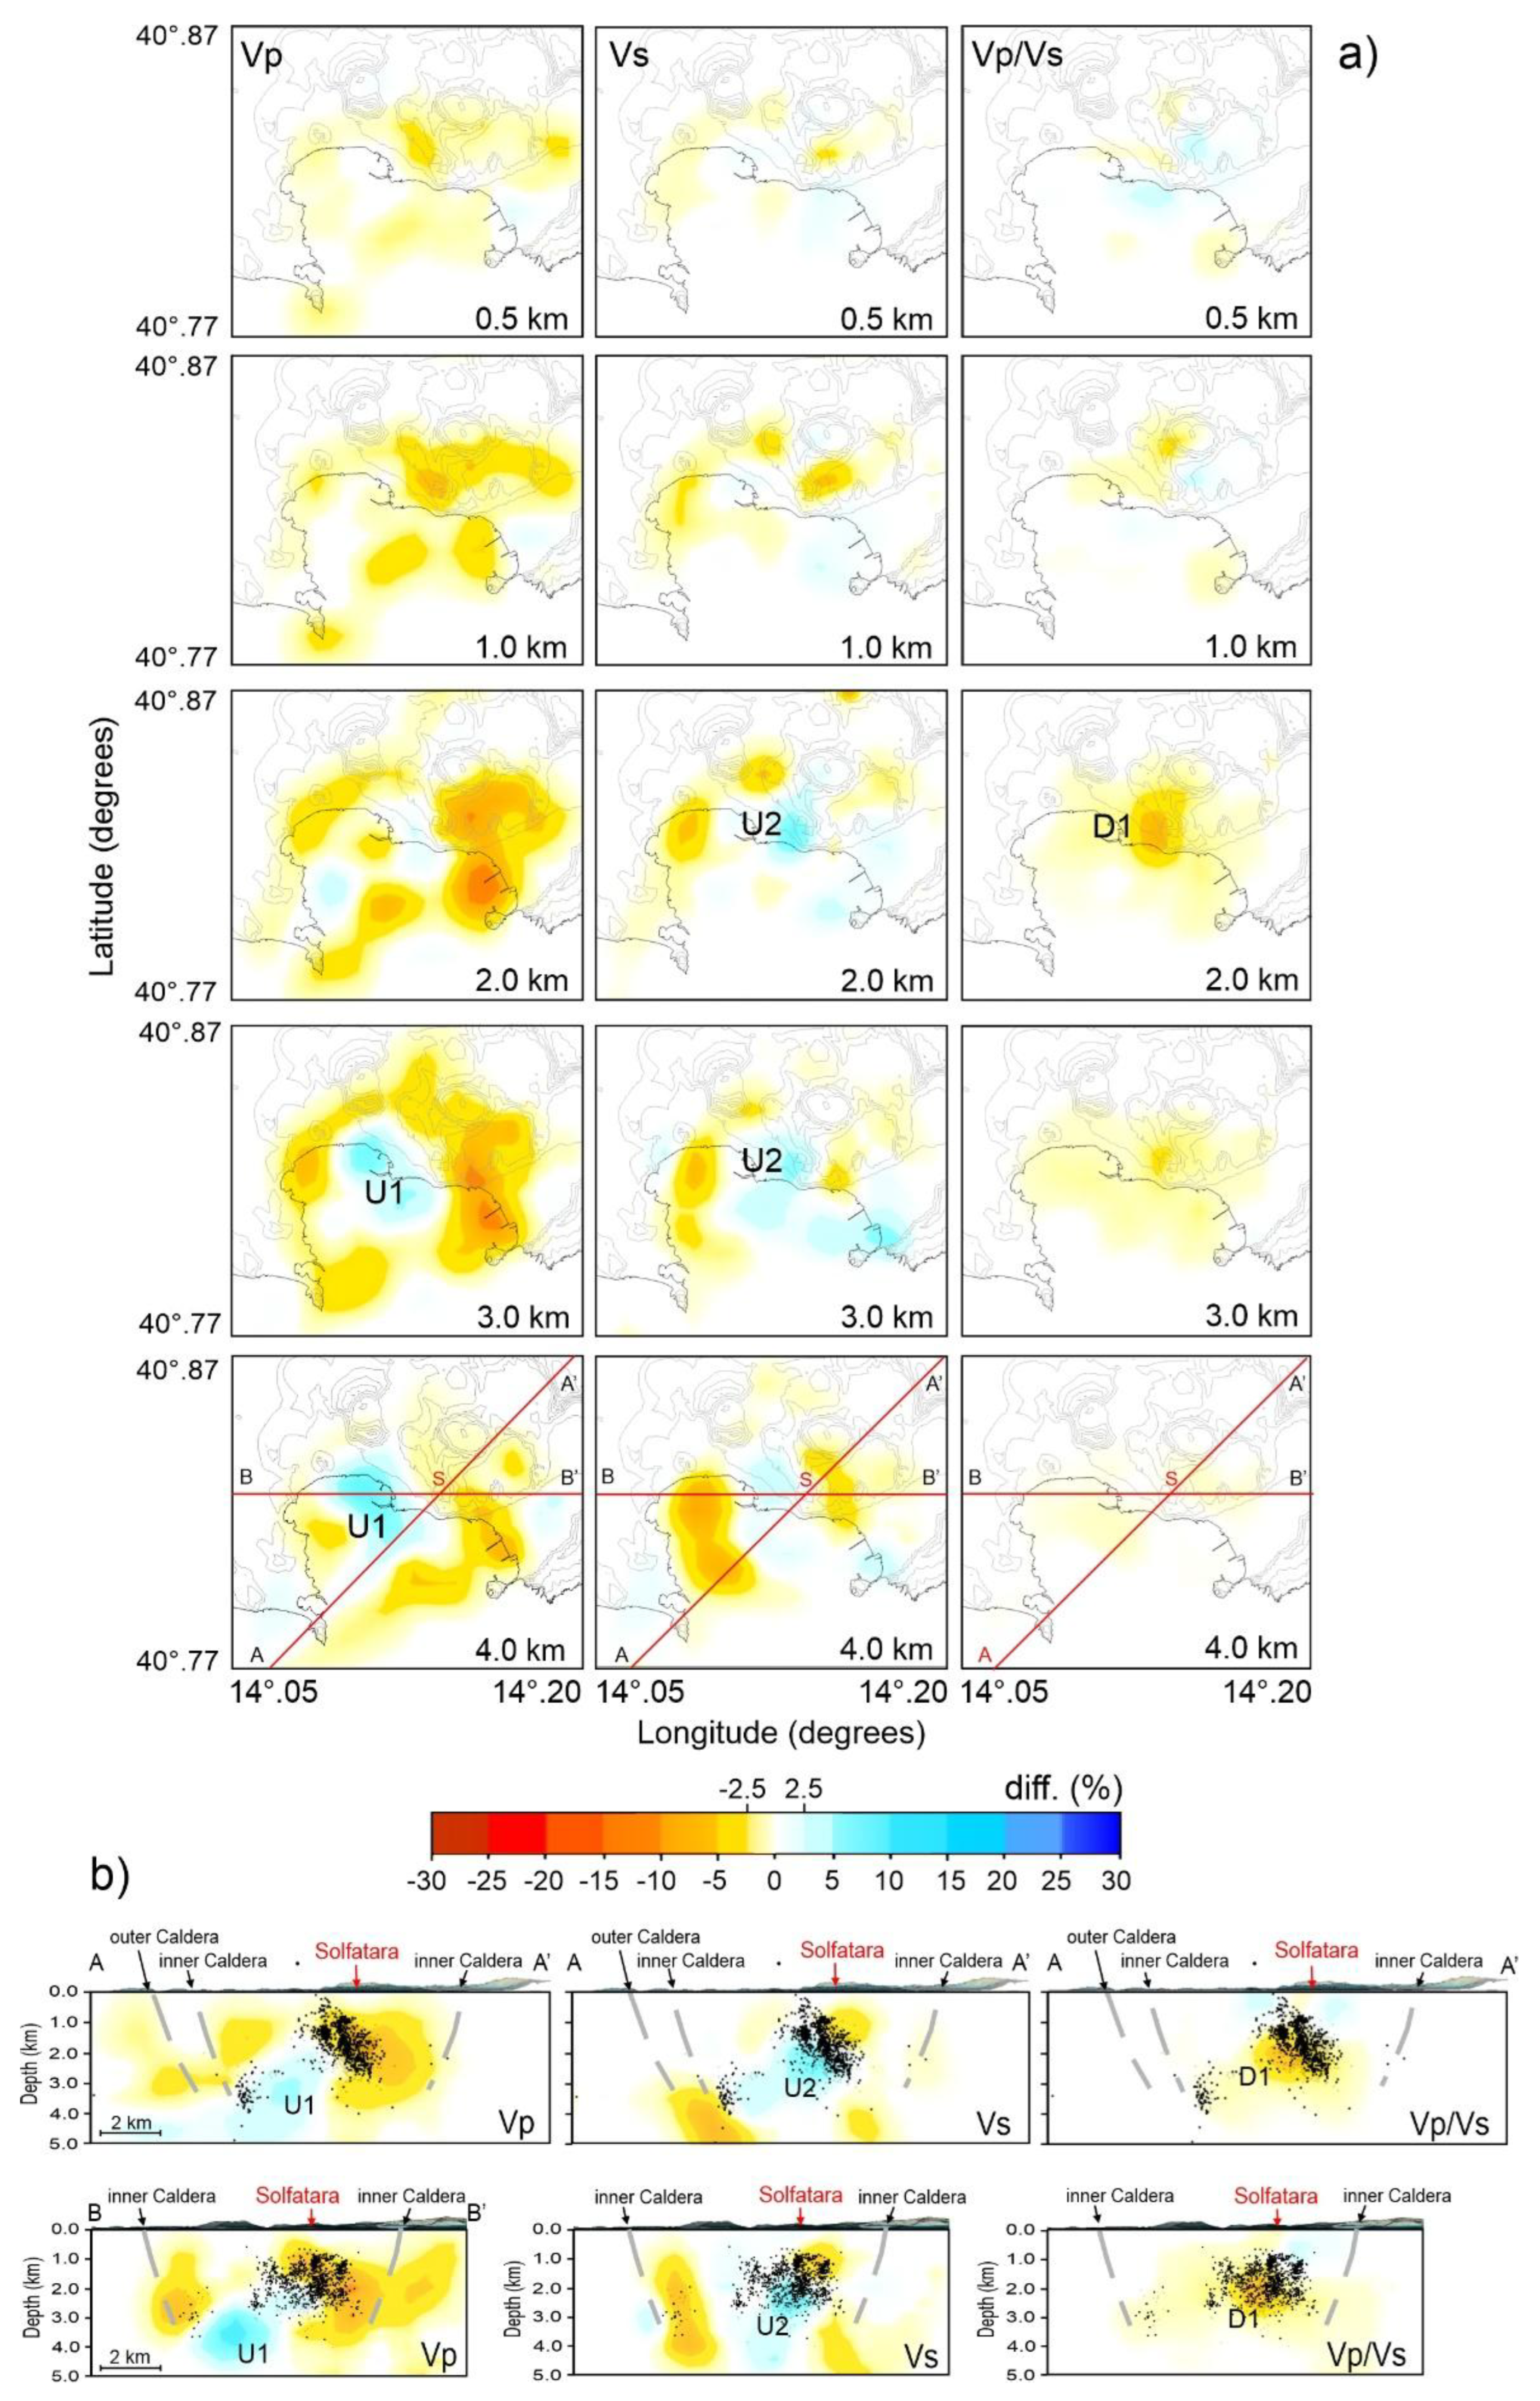
Figure 6.
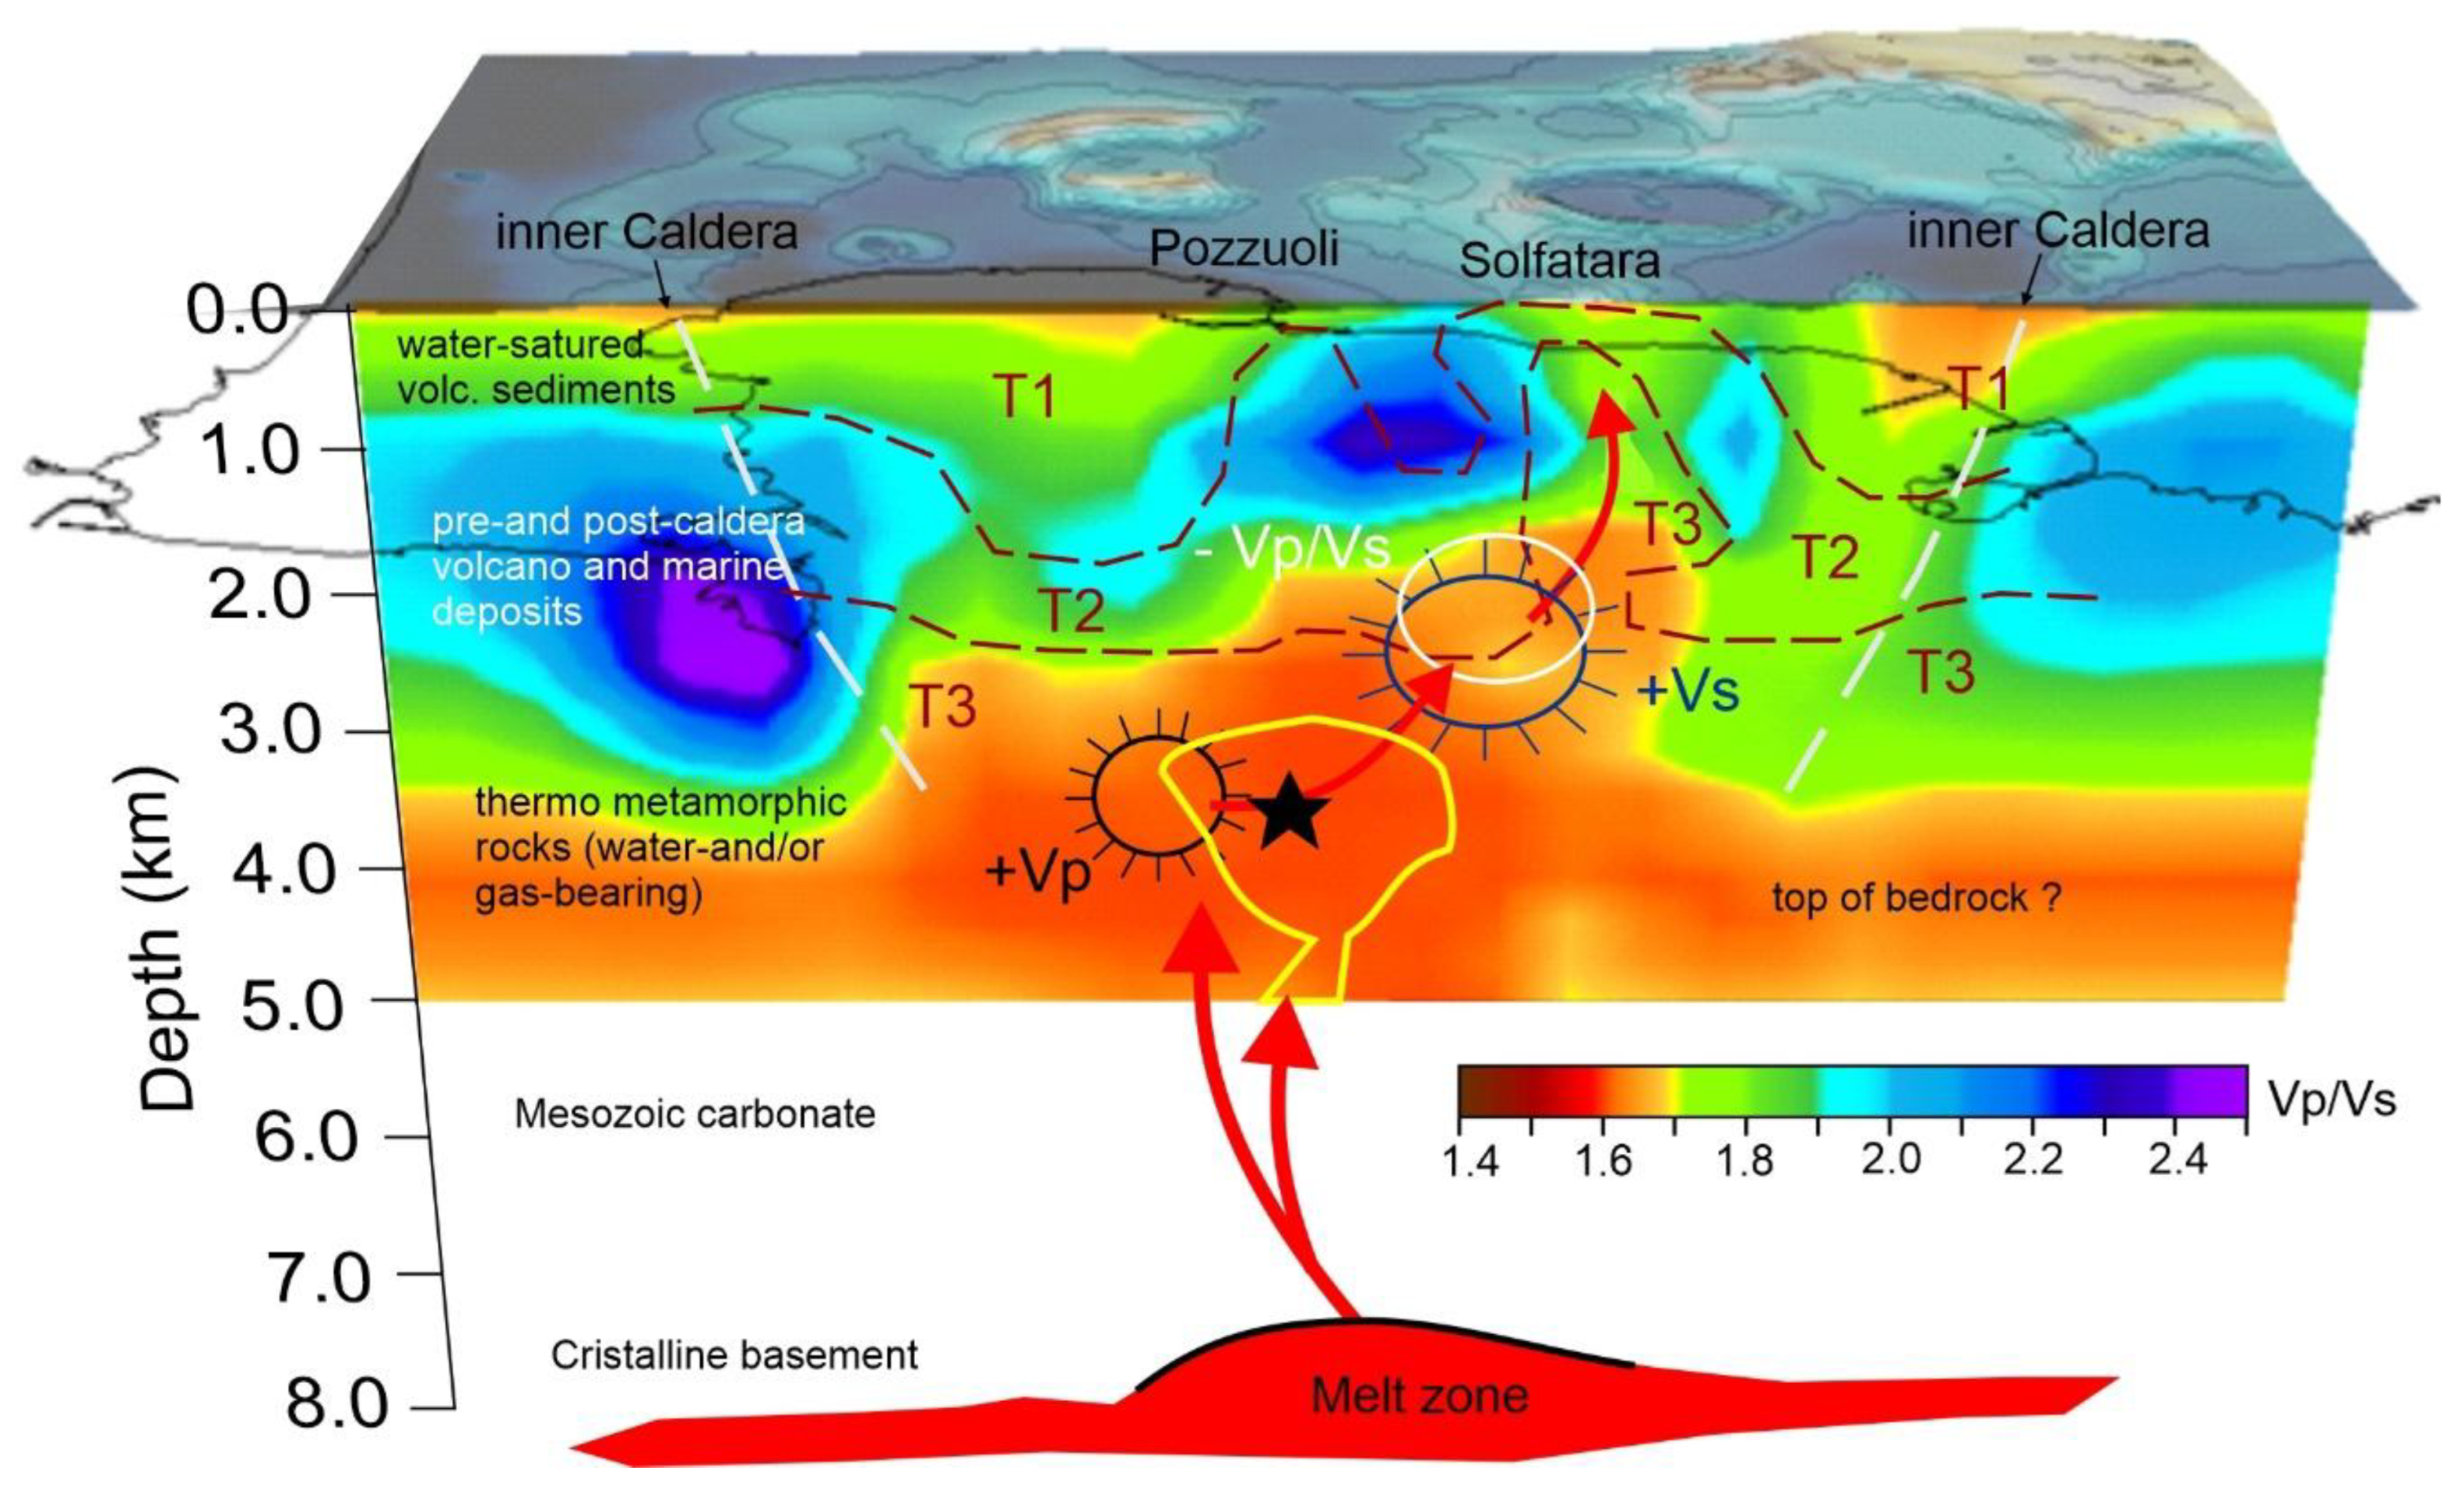
Sketch model illustrating the W–E cross-section of the Vp/Vs ratio structure, which shows the locations of two pressurized sources—one at 3–4 km depth (Vp) and the other at 2–3 km depth (Vs)—derived from seismic velocity variations observed between the 2023–2024 and 2020–2022 periods. The increase in P-wave velocity (ca. +10%) is indicated by a black circle, while a blue circle denotes a similar increase in S-wave velocity; the white circle marks the decrease in the Vp/Vs ratio (ca. –10%).Dark red dotted lines delineate the temperature boundaries (T1 < 140 °C, T2 between 140 and 220 °C, and T3 > 260 °C) derived from the 3D model of Petrillo et al. (Figure 10 in [38]). The black star represents the deeper pressurized source location reported by Giudicepietro et al. [50]. The irregular yellow line encircles the region where Tizzani et al. [49] identified a partially melted magma reservoir. Finally, the deeper region below 7.5 km corresponds to a low-velocity layer associated with a mid-crustal partial melting zone beneath the caldera [30].
Figure 6.
Sketch model illustrating the W–E cross-section of the Vp/Vs ratio structure, which shows the locations of two pressurized sources—one at 3–4 km depth (Vp) and the other at 2–3 km depth (Vs)—derived from seismic velocity variations observed between the 2023–2024 and 2020–2022 periods. The increase in P-wave velocity (ca. +10%) is indicated by a black circle, while a blue circle denotes a similar increase in S-wave velocity; the white circle marks the decrease in the Vp/Vs ratio (ca. –10%).Dark red dotted lines delineate the temperature boundaries (T1 < 140 °C, T2 between 140 and 220 °C, and T3 > 260 °C) derived from the 3D model of Petrillo et al. (Figure 10 in [38]). The black star represents the deeper pressurized source location reported by Giudicepietro et al. [50]. The irregular yellow line encircles the region where Tizzani et al. [49] identified a partially melted magma reservoir. Finally, the deeper region below 7.5 km corresponds to a low-velocity layer associated with a mid-crustal partial melting zone beneath the caldera [30].
Disclaimer/Publisher’s Note: The statements, opinions and data contained in all publications are solely those of the individual author(s) and contributor(s) and not of MDPI and/or the editor(s). MDPI and/or the editor(s) disclaim responsibility for any injury to people or property resulting from any ideas, methods, instructions or products referred to in the content. |
© 2025 by the authors. Licensee MDPI, Basel, Switzerland. This article is an open access article distributed under the terms and conditions of the Creative Commons Attribution (CC BY) license (https://creativecommons.org/licenses/by/4.0/).
Copyright: This open access article is published under a Creative Commons CC BY 4.0 license, which permit the free download, distribution, and reuse, provided that the author and preprint are cited in any reuse.


