
Submitted:
19 February 2025
Posted:
20 February 2025
You are already at the latest version
Abstract
A method integrating seed germination, seedling emergence, and seedling growth was established to evaluate salt tolerance in tall wheatgrass. The results showed that 250 mM NaCl, 150 mM Na2SO4, 150 mM NaHCO3, or 100 mM Na2CO3 resulted in 31.5%, 65.4%, 68.2%, and 32.6% of non-stress seed germination rate, respectively. The 250 mM NaCl and 100 mM Na2CO3 can be used for germination tests in tall wheatgrass for tolerance to neutral and sodic salt stress, respectively. In addition, 250 mM NaCl or saline water with ECw= 6.6 dS m‒1 resulted in 52% and 59.8% of non-stress seedling emergence rate. Seedling hydroponic culture demonstrated that 300 mM NaCl resulted in 38.2%, 35.7% and 50% of the non-stress total dry weight, shoot dry weight, and root dry weight, respectively. The salt response genes expressed differentially in tall wheatgrass subjected to long-term and short-term salt stress. Interestingly, the expression levels of NHX7.1 and NCL1 were higher in the salt-tolerant lines than in the salt-sensitive lines. Based on the integrated evaluation of seed germination, seedling emergence, and seedling growth, six of the 28 tall wheatgrass lines were salt tolerant. Additionally, two Tritipyrum lines were found to inherit salt tolerance from tall wheatgrass. Collectively, this work provided an integrated method for salt tolerance test in tall wheatgrass breeding program.
Keywords:
tall wheatgrass
; salt tolerance
; saline-alkaline soils
; gene expression
1. Introduction
Tall wheatgrass (Thinopyrum ponticum (Podp.) Z. W. Liu & R. C. Wang, 2n=10x=70) is a perennial cool-season bunchgrass which has been widely cultivated in America, Australia, and some European countries since 1950s [1,2]. For instance, in Argentina there are currently 1 × 10⁶ ha of tall wheatgrass pasture in the Salado River basin [3]. Tall wheatgrass confers a high level of tolerance to salt and alkali [2,4,5,6], which making it as an ideal grass for saline pasture. To keep up with the ever-increasing demand of food for human population, the competition for arable land between food crops and forage crops should be balanced and avoided. It can alleviate such completion to plant salt‒alkali tolerant forage crops including tall wheatgrass in saline-alkaline land [7,8,9,10,11]. Recently, a proposal of “Coastal Grass Belt” was raised, in which tall wheatgrass was suggested to be planted in the coastal saline-alkaline soils around the Bohai Sea [12,13,14]. Linking with this goal, it is essential to breed tall wheatgrass varieties with enhanced salt tolerance. Salt tolerance in plants is a complex trait which is determined by multiple genes and environmental factors [15]. Reliable phenotyping of salt tolerance is pivotal for selection of salt-tolerant varieties, which determines the breeding efficiency to a large extent.
The salt tolerance in tall wheatgrass was usually assessed by seed germination test in laboratory [4,16,17,18,19,20,21,22], seedling emergence [17,18], seedling growth through hydroponic culture supplemented with NaCl [16,23,24,25], sand- or soil-filled pots irrigated with NaCl solution or saline water [4,17,18,26,27,28,29,30,31,32,33,34,35,36] in green house, field evaluation via irrigation with saline water or NaCl solution, and on-side field test in saline and/or alkaline soils [6,37,38,39,40,41].
An early study showed that the most salt-tolerant tall wheatgrass accessions of the 32 investigated accessions showed 95–100% recovery rate in a stepwise increase to a final salinity of 765 mM equal equivalent of NaCl and CaCl2 [26]. Furthermore, another study showed that two of the nine tall wheatgrass accessions had 87–93% survival rates in a stepwise increase to a final concentration of 750 mM NaCl [23]. In addition, Roundy found that tall wheatgrass can survive when the osmotic potentials declined to −35 bar but grows slowly below −10 bar under salt stress [28]. Tall wheatgrass produced 5.9–8.3 t ha−1 dry matter yield when grown on saline soil with electric conductivity of “saturation paste extract” (ECe)=19 dS m−1 [42]. An early report showed that the EC of irrigation water (ECw)=7.5 dS m‒1 was the threshold salinity for tall wheatgrass without growth reduction [43]. Further, Riedell showed that the salinity threshold of tall wheatgrass cv. Akar was ECw=10 dS m−1 without shoot dry weight (SDW) loss and ECw=30.2 dS m−1 for 50% SDW reduction [32]. Furthermore, a recent study demonstrated that the tall wheatgrass plants irrigated with 300 mM NaCl in a 90-d growth period reduced approximately one-third forage yield [35]. Recently, it was suggested that in the “Coastal Grass Belt” targeted area, for instance in Yellow River Dleta Region, tall wheatgrass can be planted in saline soils with salinity of less than 1% (w/w) [41]. In addition, to achieve high forage productivity, irrigation with saline drainage water having salinity of less than 5 g L‒1 was recommended for tall wheatgrass in Spring as needed [44]. The surface soil salinity in the “Coastal Grass Belt” targeted region ranges between 0.3% and 1.0% (w/w), with the maximum salinity over 3.0% [45], which is unprofitable for other food crops. Hence, screening and selection for highly salt-tolerant tall wheatgrass varieties instead of food crops has real prospects to utilize such coastal saline soils efficiently.
Due to the discrepancy of experimental conditions and plant materials, the above mentioned evaluation results of salt tolerance in tall wheatgrass were not always consistent. In addition, the testing methods, developed for purpose of physiological and biochemical analysis, cannot always meet the real field conditions and may be unsuitable for tall wheatgrass breeding program. Although seed germination in 220 mM NaCl solution had been suggested as selection index for salt tolerance in an Argentina tall wheatgrass breeding program [21], the seed germination results for salt tolerance were usually inconsistent with seedling tolerance under field conditions [4]. Considering that seed germination, seedling emergence, and seedling growth all determine the ultimate forage yield and persistence of tall wheatgrass on saline-alkaline soils, the evaluation of salt tolerance in tall wheatgrass breeding program should fully consider the performances at all these three aspects.
The salt tolerance in plants is regulated by genes, which respond differentially to salt stress. Several studies were conducted on gene expression of diploid Th. elongata, a possible ancestor subgenome donor of tall wheatgrass, and wheat×Th. elongata amphiploids responding to salt stress. Gulick and Dvorák firstly found that 18 mRNA species were differentially accumulated in a wheat-Th. elongata amphiploid [46]. Then, eleven of these mRNA species were cloned as cDNA, which are induced in Th. elongata within 2 h and peaked at 6 h of 250 mM NaCl treatment [47]. These genes are early salt stress induced, which accumulated greater in roots than in shoots in Th. elongata [48]. In addition, dehydrin and non-specific lipid transfer protein genes were also induced by salt in Th. elongata [49]. Further, Shen et al. reported a salt- and ABA-induced protein kinase gene Esi47 in Th. elongata [50]. In addition, transcriptomic analysis was also carried out on wheat×Th. elongata amphiploid [51,52], accounting for more salt-induced differentially expressed genes. In addition, overexpression of AeNHX1 from Th. elongata enhanced salt tolerance in Arabidopsis and Festuca plants [53].
Recently, Sheikh-Mohamadi et al. compared six ecotypes of tall wheatgrass, native to Iran, for salt tolerance and expression of salt response genes [54]. This study demonstrated that the salinity-resistant ecotypes exhibited high expression levels of NHX1, NHX2, HKT1;4, SnRK2.4 and NAC9 in leaves and roots. Especially, the salt-tolerant tall wheatgrass lines showed higher expression of HKT1;4 and NAC9 in leaves and roots than the salt-sensitive lines. Additionally, the transgenic Arabidopsis overexpressing HKT1;4 from tall wheatgrass showed significant tolerance to salt stress [55]. Collectively, the reports on gene expression of tall wheatgrass responding to salt stress are very limited, which hinders the molecular breeding of tall wheatgrass with enhanced salt tolerance.
The objectives in this study were to: (1) establish an integrated method for evaluation of salt tolerance in tall wheatgrass for purpose of breeding program; (2) study the expression levels of salt response genes in tall wheatgrass responding to salt stress; (3) assess salt tolerance of 28 tall wheatgrass lines and five Tritipyrum lines derived from the cross of wheat × tall wheatgrass. Tritipyrum (or partial amphiploids), coined from the offspring of the cross between Triticum aestivum (wheat) and Thinopyrum species, was considered as a new type of forage crop [56], which was also included in this work.
2. Results
2.1. Seed Germination Rate of Tall Wheatgrass Responding to NaCl, Na2SO4, NaHCO3, and Na2CO3
Dynamic responses of seed germination rate in tall wheatgrass line Zhongyan 1 to different concentrations of NaCl, Na2SO4, NaHCO3, and Na2CO3 were shown in Figure 1. All the four salts inhibited germination rate substantially. In addition, the germination potential, germination index, vigor index, and shoot height declined drastically while the relative salt damage rate and inhibition of shoot height elevated with the increase of salt concentration (Table S1). The highest concentration of salts including 300 mM NaCl, 250 mM Na2SO4, 250 mM NaHCO3, and 125 mM Na2CO3 resulted in the lowest germination rate, i.e. 26.9%, 0%, 3.0%, and 2.3% of the non-stress control at 15 days after treatment (DAT), which was too low to be used for evaluation of salt tolerance in tall wheatgrass. Comparatively, 250 mM NaCl, 150 mM Na2SO4, 150 mM NaHCO3, and 100 mM Na2CO3 resulted in 31.5%, 65.4%, 68.2%, and 32.6% of non-stress seed germination rate and 73.5%, 57.6%, 58.1%, and 73.4% inhibition of seedling height at 15 DAT. It appeared that such salt stress may be suitable for germination test of tall wheatgrass for salt tolerance when relatively high selection pressure was considered. Especially, 250 mM NaCl and 100 mM Na2CO3 can be used for germination test of tall wheatgrass for tolerance to neutral and sodic salt stress, respectively.
2.2. Seedling Emergence Rate of Tall Wheatgrass Responding to NaCl and Saline Water
Furthermore, both NaCl solution and saline water were used to study the response of seedling emergence rate (SER) in Zhongyan 1 to salt stress. As shown in Figure 2, the SER, shoot height, shoot fresh weight (SFW), and SDW declined drastically with the increase of NaCl concentration. The SER reached the highest value at 11 DAT in 100 and 150 mM NaCl, which was two days later than the same NaCl treatments as seed germination test. Meanwhile, it reached the highest value in 200 and 250 mM NaCl at 13 DAT, which was similar to the same NaCl treatments as seed germination test. The SER of Zhongyan 1 subjected to 250 mM NaCl for 9 d was 52% of the non-stress control. At 15 DAT, Zhongyan 1 treated in 250 mM NaCl exhibited 24%, 77.2%, 86.1% and 86.8% inhibition of SER, shoot height, SFW, and SDW in the non-stress control, respectively.
The response of SER in Zhongyan 1 to saline water was illustrated in Figure 3. Consistently, the SER, shoot height, SFW, and SDW decreased with the increase of the salinity in the saline waters. The SER reached the highest values at 11 DAT in saline waters having salinity of ECw=4.9 and 5.4 dS m‒1, which was similar to the effects of 100 and 150 mM NaCl. Meanwhile, it reached the highest values at 13 DAT when the saline water salinity was increased to 6.0, 6.6, and 7.5 dS m‒1, which was similar to the effects of 200 and 250 mM NaCl. The SER under the treatment with salinity of ECw=6.6 dS m‒1 at 9 DAT was 59.8% of the non-stress control. At 15 DAT, this treatment resulted in similar SER as 250 mM NaCl, which accounted for 33.7%, 56.1%, 68.1%, and 67.6% of inhibition of SER, shoot height, SFW, and SDW in the non-stress control, respectively. Both NaCl and saline water treatment increased the salinity in the culture medium (Figure 2d,3d). It seemed that the treatment with 250 mM NaCl or saline water with ECw=6.6 dS m‒1 for 9 d may be suitable for evaluation of SER in tall wheatgrass responding to salt stress.
2.3. Seedling Growth of Tall Wheatgrass Responding to NaCl Stress.
The survival rate of Zhongyan 1 declined drastically when the NaCl concentration in hydroponic nutrient medium was increased from 400 to 800 mM (Figure S1). Therefore, the seedling growth traits were analyzed in seedlings subjected to 150‒400 mM NaCl stress and the result was shown in Figure 4. After cultured in the nutrient solution supplemented with more than 200 mM NaCl for 15 d, the total dry matter weight (TDW), SDW, and root dry weight (RDW) declined significantly compared with the non-stress control (Figure 4a-c). For instance, the treatments with 200, 250, 300, and 400 mM NaCl resulted in 38.7%, 48.7%, 61.8%, and 84.1% inhibition of TDW under non-stress, respectively. In addition, the shoot height and the number of green leaves declined while the dry matter content and the number of senescent leaves elevated with the increase of NaCl concentration. The root length increased significantly in the 150 and 200 mM NaCl treatments and then decreased significantly in the 400 mM NaCl solution compared with the non-stress control. The ratio of root to shoot dry weight (root/shoot) increased significantly under 150‒300 mM NaCl stress and then decreased to the non-stress level at 400 mM NaCl.
To explore the recovery of the seedling growth, NaCl was removed and the Zhongyan 1 seedlings were cultured in nutrient solution for another 15 d. As shown in Figure 4, the TDW, SDW, RDW, shoot height, and the number of green leaves increased while the root/shoot ratio declined. The increment of dry matter and the number of green leaves declined with the pervious increment of NaCl concentration. For instance, after removal of salt stress and recovery for 15 d, the growth inhibition rates for the 150, 200, 250, 300, and 400 mM NaCl treatments were 13.5%, 42.3%, 51.6%, 66.2%, and 85.9% of TDW under non-stress, respectively. Taken together, 15 d of 300 mM NaCl treatment resulted in 50%, 64.3%, and 61.8% inhibition of RDW, SDW, and TDW, which may be suitable for evaluation of seedling tolerance to salt stress in tall wheatgrass.
2.4. Differential Expression of Salt Response Genes in Seedlings of Tall Wheatgrass Under Salt Stress
To investigate the response of tall wheatgrass to long-term salt stress at mRNA level, the expression levels of salt response genes were assayed in leaves and roots of Zhongyan 1 subjected to 150, 200, 250, and 300 mM NaCl stress for 15 d. The gene annotations and specific qPCR primer sequences were shown in Table 1. As illustrated in Figure 5a, ten of the 22 genes were highly induced in leaves by 150 mM NaCl, which included NHX6, NHD1, BASS2, APX4, GPX6, BASS4, LOX23, NCED1, DHAR1, POD, and ESI3. Similarly, three genes PSA1, NCL1, and NCL2 were highly induced in roots by 150 mM NaCl. However, three genes BSSS5, NHX7.1 and NHX7.2 were all highly induced in roots by 300 mM NaCl. The transcripts of four genes including GR, NHX1, GPX1, and BASS3 were higher in leaves than in roots, three of which (NHX1, GPX1, and BASS3) were induced in leaves by 150 and 300 mM NaCl, respectively. The expression of NHX8 was induced in leaves by 300 mM NaCl and in roots by 200 mM NaCl, respectively.
Additionally, these genes were also detected in leaves of Zhongyan 1 subjected to 300, 500, and 800 mM NaCl within 24 h, respectively, to investigate the response of Zhongyan 1 to short-term salt stress at mRNA level. As shown in Figure 5b, all the investigated genes expressed differentially within 24 h of salt stress. Three genes NHX1, LOX23, and NCL1 were highly induced by 24 h treatment of 300 mM NaCl for. Five NHX genes NHX7.1, NHX7.2, NHX2, NHX6, and NHX8 were induced by 6 h of 500 mM NaCl while eleven genes including NHD1, BASS5, BASS2, APX4, GPX6, DHAR1, BASS4, POD, NCED1, NCL2, and ESI3 were induced by 24 h of 500 mM NaCl . The GR gene appeared to be inhibited while PSA1 were induced by 300, 500, and 800 mM NaCl treatments for 24 h. The BASS3 gene was induced by 500 and 800 mM NaCl for 6 and 24 h, respectively. Taken together, whether long- or short-term salt stress resulting from different concentrations of NaCl led to differential expression of salt response genes. It appeared that the expression of salt response genes in leaves was rather induced by long term (15 d) treatment of 150 mM NaCl and by short-term salt stress of 500 mM NaCl.
2.5. Differential Expression of Salt Response Genes Between Salt-Tolerant and Salt-Sensitive Tall Wheatgrass Lines
Furthermore, the expression levels of the above salt response genes were detected in six tall wheatgrass lines with contrasting seedling growth in responses to 300 mM NaCl stress. The mean values of gene expression data as well as the phenotypic traits including TDW, SDW, RDW, shoot height, root length, the number of senescent leaves, and the number of green leaves relative to non-stress control were clustered and illustrated in Figure 6. The tall wheatgrass lines TWG121, TWG8, and TWG119 exhibited higher TGW, SDW, and RDW, more green leaves, and less senescent leaves compared with TWG59, TWG157, and TWG204 subjected to 300 mM NaCl stress for 15 d. Interestingly, the expression levels of two genes NHX7.1/SOS1 and NCL1 in roots were grouped with TDW, SDW, RDW, shoot height, and root length, indicating that the expression levels of these two genes appeared to be associated with salt tolerance of the salt-tolerant lines. Additionally, the expression levels of three genes BASS4, POD, and NHX6 were grouped with the number of senescent leaves while the expression levels of BASS3, PSA, BASS5, DHAR, and NCL1 were classified with the number of green leaves.
2.6. Evaluation of Salt Tolerance in 28 Tall Wheatgrass Lines
A total of 28 tall wheatgrass lines were evaluated for salt tolerance in combination with seed germination, seedling emergence, and seedling growth under salt stress. The mean values of relative seed germination and seedling emergence traits in comparison with non-stress control as well as seedling growth traits were shown in Table 2. According to the cluster analysis, the 28 TWG lines were classified as six groups. Each of the first three groups consisted of more than three lines, which was further analyzed. ANOVA analysis demonstrated that group 1 had significantly higher relative germination rate, germination index, shoot height, and vigor index but lower relative salt damage rate than group 3 under both 250 mM NaCl and 100 mM NaCO3 stress. In addition, group 1 had significantly higher relative SER under 250 mM NaCl and higher SFW, TFW, SDW, and TDW under 300 mM NaCl than group 3. The group 2 had intermedium values for these investigated traits. Therefore, it appeared that group 1, consisting of five lines TWG8, TWG22, TWG86, TWG216, and TWG223, was the most salt-tolerant group, which may have superior to be used in the “Coastal Grass Belt” targeted region.
2.7. Evaluation of Salt Tolerance in Five Tritipyrum Lines Derived from Wheat×Tall Wheatgrass
To study the transference of salt tolerance from tall wheatgrass to wheat, the seedlings of five Tritipyrum lines, derived from the cross of wheat cv. Xinong 6028×Zhongyan 1, were evaluated in nutrient solution with 250 mM NaCl for 15 d. As shown in Figure 7a, the male parent Zhongyan 1 had the highest while the female wheat parent Xinong 6028 had the lowest relative TFW. The Line 11 had comparable relative TFW to Zhongyan 1 which was significantly higher than the other Tritipyrum lines and Xinong 6028, followed by Line 122. Interestingly, Line 11 had the highest relative SFW while Line 122 and Line 94 had comparable relative SFW to Zhongyan 1 (Figure 7b). In addition, the relative RFW in Line 11 and Line 122 were significantly lower than Zhongyan 1 but were higher than the other lines (Figure 7c). The relative shoot height in Lines 11, Line 122, and Line 94 were significantly higher than that in parents (Figure 7d). The relative root/shoot ratio and relative root length in the offspring and Xinong 6028 was significantly lower than Zhongyan 1 (Figure 7e,f). Collectively, Lines 11 and Line 122 seemed to inherit salt tolerance from Zhongyan 1, which may be used as salt-tolerant forage crop in the “Coastal Grass Belt” targeted area.
3. Discussion
Although tall wheatgrass confers a high level of salt tolerance [2], highly salt-tolerant varieties are expected in the “Coastal Grass Belt” targeted area where the surface soil salinity is too high to grow food crops profitably. Several documents demonstrated that there exists large genetic variance among tall wheatgrass accessions or ecotypes from different geographical locations [4,21,23,26,31,34,40], which theoretically supports the genetic improvement of tall wheatgrass with enhanced salt tolerance.
Under field conditions, any aspect of seed germination, seedling emergence, and seedling growth that is influenced by soil salinity, moisture, and nutrients and other environmental hints determines stand establishment, final forage yield, and persistence of tall wheatgrass pasture. First of all, the survival rate during seed germination and seedling emergence under salt stress determines stand establishment of tall wheatgrass. Then, the growth and regrowth performance under extreme salt stress all year round influences final herbage yield and persistence. Therefore, the evaluation of salt tolerance in tall wheatgrass should fully consider all aspects of seed germination, seedling emergence, and seedling growth. An ideal salt-tolerant variety should confer high level of tolerance to salt stress at seed germination, seedling emergence, and seedling growth stages and finally produce high herbage yield on saline-alkaline soils.
3.1. Seed Germination Rate Under Salt Stress as Salt Tolerance Index in Tall Wheatgrass
Seed germination test in laboratory is the easiest way to evaluate salt tolerance in tall wheatgrass. However, the evaluation results were not always consistent due to experimental conditions or plant materials. For instance, an early report showed that the relative germination rates in three tall wheatgrass accessions ranged between 65.6% and 80.3% in mixed salts consisting of 55 mM NaCl and 133.5 mM CaCl2 for 15 d [4]. Peng et al. reported that the relative germination rate of tall wheatgrass exposed to 205 mM NaCl for 9 d was around 22% [17]. Zhang et al. found that 50% of the non-stress control germination rate of two tall wheatgrass varieties Tyrrell and Dundas was achieved in approximately 300 mM NaCl. The germination rate of Tyrrel in 461.5 mM NaCl for 18 d was 8% [18]. A recent study showed that 400 mM NaCl for 11 d caused no germination [22]. However, Shen et al. showed that the relative germination rate of tall wheatgrass subjected to 445 mM NaCl for 15 d was 80% [16]. In this work, 300 mM NaCl for 9 d resulted in no germination and led to decreases of germination rate, germination index, shoot height, and vigor index to 26.9%, 7.3%, 9.0%, and 0.6% of the non-stress control at 15 DAT, respectively, which seemed to be too severe to be used for test salt tolerance in tall wheatgrass. Comparatively, 250 mM NaCl for 9 d may be suitable for salt tolerance assessment of tall wheatgrass when considering shorter evaluation period and relatively high selection pressure, which was consistent with the previous study [21].
Besides NaCl, other salts had also been used to test sat tolerance of tall wheatgrass. For instance, Liu et al. showed that the relative germination rates of tall wheatgrass in 274 mM NaCl, 113 mM Na2SO4, 143 mM NaHCO3, and 75 mM Na2CO3 for 21 d were 3.6%, 54.5%, 13.9%, and 6.7% [20], respectively. Huang & Liang found that the relative germination rates of tall wheatgrass in 250 mM NaCl, 100 mM NaHCO3, and 100 mM Na2CO3 for 7 d were 80%, 69%, and 14% [19], respectively. Recently, Xu et al. observed that the relative germination rates of tall wheatgrass in 200 mM NaCl, 200 mM Na2SO4, 150 mM NaHCO3, and 100 mM Na2CO3 for 11 d were 76.6%, 62.2%, 42.3%, and 11.9% [22], respectively. They further found that 400 mM NaCl, 600 mM Na2SO4, and 150 mM Na2CO3 resulted in no germination. In our work, the treatments with 250 mM NaCl, 150 mM Na2SO4, 150 mM NaHCO3, or 100 mM Na2CO3 for 9 d resulted in 31.5%, 65.4%, 68.2%, and 32.6% of non-stress seed germination rate and 73.5%, 57.6%, 58.1%, and 73.4% inhibition of seedling height at 15 DAT. Such conditions may be used as selection index to breed salt-alkali tolerant tall wheatgrass varieties. Especially, 250 mM NaCl and 100 mM Na2CO3 can be used for germination test of tall wheatgrass for tolerance to neutral and sodic salt stress, respectively.
3.2. Seedling Emergence Rate Under Salt Stress as Salt Tolerance Index in Tall Wheatgrass
The SER of tall wheatgrass declined with the increase of soil salinity [17,18]. The salinity threshold for 50% of the non-stress control SER of tall wheatgrass was approximately 100 mM NaCl [17,18]. In this work, the treatment with 250 mM NaCl resulted in 52% of the non-stress control ESR. The salinity threshold in this work was higher than the previous studies [17,18]. In addition, the SER was higher than the germination rate (31.5% of the non-stress) in the 250 mM NaCl treatment for 9 d, which may be ascribed to good permeability and sufficient nutrient in the culture medium of vermiculite. In addition, saline water with ECw=6.6 dS m‒1 led to 59.8% of non-stress SER, indicating that local saline drainage water instead of NaCl may be conveniently superior for salt tolerance test in tall wheatgrass breeding program.
3.3. Seedling Growth Under Salt Stress as Salt Tolerance Index in Tall Wheatgrass
Followed by seed germination test, seedling growth was usually evaluated for salt tolerance in tall wheatgrass. Both stepwise increase [4,17,23,26,28] and sudden salt stress [18,25,31] were carried out to evaluate seedling growth as salt tolerance index in tall wheatgrass. Although a stepwise increase of salinity can avoid osmotic shock stress, low concentration of NaCl increases salt tolerance of tall wheatgrass. For instance, 100 mM and 150 mM NaCl slightly increased seed germination rate compared with non-stress. In addition, 150 mM NaCl for 15 d enhanced root weight and root length by 13% and 87%, respectively. In order to explore the effects of stepwise increase salt stress on salt tolerance evaluation of tall wheatgrass, the seedling growth of Zhongyan 1 exposed to both stepwise increase and sudden salt stress (300 mM NaCl) was compared in this study. The result showed that the stepwise increase induced salt stress resulted in significantly higher SDW, RDW, TDW, root/shoot ratio, shoot height, root length, tiller number, and the number of green leaves than the sudden salt stress (Figure S2). Therefore, it appeared that stepwise increase induced salt stress led to higher salt tolerance performance, which may account for the inconsistency of salt tolerance in tall wheatgrass to some extent. The saline field conditions was more complex than laboratory testing conditions as the soil salinity varied with precipitation, soil moisture, and seasons. When tall wheatgrass is planted, the local soil salinity is relatively certain where sudden salt stress usually occurs. Therefore, the sudden salt stress may better match the field conditions than the stepwise increase induced salt stress for purpose of breeding.
In addition, seedling age influences seedling tolerance in tall wheatgrass to salt. For instance, the 7-d seedling of Zhongyan 1 was more sensitive to 400 mM NaCl than the 14-d, 21-d, and 28-d seedlings for its lowest TDW and the highest inhibition of dry matter yield (Figure 8). Also, the growth light intensity affects seedling tolerance in tall wheatgrass to salt. Two growth light intensities 100 and 300 µmol m‒2 s‒1 were performed on the 250 and 500 mM NaCl treated Zhongyan 1. The result showed that the 300 µmol m‒2 s‒1 of growth light intensity reduced relative SDW, tiller number, and the number of green leaves but enhanced relative shoot height of Zhongyan 1 treated with 250 mM NaCl in comparison with those grown in the 100 µmol m‒2 s‒1 of light intensity (Figure S3). However, no significant differences were observed between these two light intensities for the investigated traits under 500 mM NaCl stress, which generated more severe salt damage than 250 mM NaCl. High light aggravates salt stress induced photoinhibition and photosystem II repair [57], which ultimately slows down seedling growth of tall wheatgrass.
Considering energy input and evaluation efficiency, 160 µmol m‒2 s‒1 growth light intensity, 7-d seedlings of tall wheatgrass, and sudden salt stress of different concentrations of NaCl were used for salt tolerance evaluation in tall wheatgrass breeding program. The results demonstrated that over 500 mM NaCl concentrations drastically reduced survival rate. Further analysis showed that 300 mM NaCl may be suitable to evaluate seedling growth of tall wheatgrass under salt stress, which resulted in 38.2%, 35.7%, and 50% of the non-stress TDW, SDW, and RDW, respectively. Even followed by removal of salt stress, the TDW, SDW, and RDW of Zhongyan 1 suffered from 300 mM NaCl were still 33.8%, 32.8%, and 40.1% of non-stress control for slow recovery from salt stress.
3.4. Differential Expression of Salt Response Genes in Tall Wheatgrass Responding to Salt Stress
There is very few reports on gene expression of tall wheatgrass responding to salt stress possibly for lack of gene sequences information. Only one study recently reported the expression of NHX1, NHX2, HKT1;4, SnRK2.4, and NAC9 in six tall wheatgrass ecotypes from Iran [54]. The NHX genes encoding Na+/H+ antiporters, which play a major role in Na+ exclusion by transporting it from cytoplasm into vacuoles or extracellular spaces [58]. The HKT genes encode Na+/K+ transporters which protect leaves from Na+ over-accumulation [59]. Recently, a tall wheatgrass HKT1;4 gene was found to enhance salt tolerance in Arabidopsis [55]. The SnRK2 genes encoding non-fermenting related protein kinases which involve in stress-signaling responses [60]. Overexpression of NAC transcription factor genes enhanced salt tolerance in plants [61,62,63]. Furthermore, Sheikh-Mohamadi et al. found that the induction of SnRK2.4 and NAC9 was more pronounced in the salt-tolerant tall wheatgrass ecotypes [54].
In this study, the expression of six NHX genes, four BASS genes encoding sodium/metabolite cotransporters, two NCL genes encoding sodium/calcium exchangers, antioxidant enzyme genes, and other salt response genes were assayed in Zhongyan 1 responding to NaCl stress. Both long-term (15 d) and short-term (within 24 h) salt stress induced differential expression of the investigated genes. Of the ten long-term salt stress induced genes by 150 mM NaCl in leaves, nine were also induced in short-term salt stress in leaves. For instance, five genes including NCED1, BASS2, APX4, GPX6, and POD were drastically induced by 500 mM NaCl for 24 h, two genes DHAR and BASS4 were highly induced by both 300 and 500 mM NaCl for 24 h, and NHX6 and LOX23 were highly induced by 500 mM NaCl for 6 h and by 300 mM NaCl for 24 h. For the short-term stress, more genes were induced at 24 h than 6 h, which was inconsistent with the expression of early salt induced (ESI) genes (peaked at 6 h) [47]. The expression of two salt response genes NHX7.1 and NCL1 positively correlated with seedling height, root length, TDW, SDW, and RDW in the salt-tolerant lines TWG8, TWG121, and TWG119. The NHX7 gene, also known as SOS1, encodes a sodium/hydrogen antiporter, the expression level of which was significantly related with salt-tolerant wild rice species [64]. In addition, overexpression of SOS1 enhanced salt tolerance in tobacco [65]. A very recent study showed that SOS1 tonoplast neo-localization play a role in the extreme salinity tolerance of Salicornia bigelovii [66]. The NCL1 gene, encoding a sodium/calcium exchanger-like protein, participates in the maintenance of Ca2+ homeostasis in Arabidopsis. The NCL mutants of Arabidopsis enhanced salt sensitivity [67]. The correlation of the expression levels of NHX7 and NCL1 and biomass in salt-tolerant tall wheatgrass lines needs further study on a large population.
3.5. Screening of Salt-Tolerant Lines of Tall Wheatgrass for Breeding Purpose
Several initiatives have been undertaken to identify salt-tolerant lines of tall wheatgrass. For instance, in combination with germination test and field evaluation, Dewey found that three tall wheatgrass accessions (Mandan 1422, NDG-1, and P.I. 109452) exhibited better tolerance than the other 22 Agropyron species to salt stress [4]. Further, Shannon reported that among the 32 tall wheatgrass lines, seven most salt-tolerant lines had 95–100% of recovery rate, which consisted of P.I. 142012, 205279, 276399, 276709, 283164, 297871, and 315352 [26]. Additionally, Mcguire & Dvôrák demonstrated that P.I. 276399 and 315352 had 100% and 87% survival rate to 500 mM and 750 mM NaCl [23], respectively. According to the seedling performance of nine tall wheatgrass accessions exposed to 0.9% NaCl (154 mM) for 15 d, six accessions were deemed as salt tolerant, which included Alkar, Platte, P.I. 276399, 308592, 535580, and 595139 [31]. In addition, one of the ten adapted tall wheatgrass populations from Argentina showed the best seed germination rate in 220 mM NaCl [21]. A recent study showed that one salt-tolerant and productive line (C2, renamed as Zhongyan 1) was screened from seven clonal tall wheatgrass lines in coastal saline–alkaline soils with salinity of 0.3% and 0.5% [39]. As the results of the field and germination was somewhat inconsistent, evaluation based on both germination and field results may enhance the selection efficiency [4]. In this study, a total of 28 tall wheatgrass lines were evaluated through integration of seed germination under both 250 mM NaCl and 100 mM Na2CO3 stress, seedling emergence under 250 mM NaCl, and seedling growth under 300 mM NaCl. Six salt-tolerant lines having higher biomass and better seed germination and seedling emergence rate under salt stress were selected, which may be used in the saline–alkaline land. In addition, two Tritipyrum lines (Lines 11 and 122) having high relative biomass under salt stress, which also have potential to be used as forage crops in the “Coastal Grass Belt” targeted region.
4. Materials and Methods
4.1. Plant Materials
The seeds from tall wheatgrass line Zhongyan 1 and 28 TWG lines with diverse agronomical traits were used in this work. In addition, five BC3F3 Tritipyrum lines 11, 21, 94, 105, and 122 derived from the distant hybridization between wheat cv. Xinong 6028 and tall wheatgrass line Zhongyan 1 were also included to study the transference of salt tolerance of tall wheatgrass to wheat.
4.2. Evaluation of Seed Germination of Tall Wheatgrass Responding to Salt Stress
Different concentrations of NaCl (100, 150, 200, 250, and 300 mM), Na2SO4 (50, 100, 150, 200, and 250 mM), NaHCO3 (50, 100, 150, 200, and 250 mM), and Na2CO3 (25, 50, 75, 100, and 125 mM) were used for seed germination test of tall wheatgrass responding to salt stress. Instead of salt, deionized water was used as the non-stress control. Seed germination test was conducted in plastic and sterile cultural dishes (diameter= 90 mm). Two layer sterile and filter paper (diameter=90 mm) were immersed with distilled water or salt solution before the seeds were sown. Totally, 50 seeds were tested in each culture dish and three independent repeats were carried out for each treatment. The seeded culture dishes were kept at 23℃(day)/20℃(night) in a growth chamber where the photoperiod was 12 h, the relative humidity was kept 65‒70%, and photosynthetic photon flux density (PPFD) was 160 µmol m‒2 s‒1. The germinated seeds were counted every day from 3 to 15 DAT. During the seed germination test period, deionized water was supplemented as needed to maintain the water volume for evaporation.
The seed germination traits were computed as follows:
Germination rate = the number of germinated seeds/50 × 100%;
Germination potential= the number of germinated seeds at 4 DAT/50 ×100%;
Germination index=the sum of germinated seeds at 15 DAT/15;
Vigor index=germination index × mean shoot height;
Relative salt damage rate= (germination rate of control ‒ germination rate of treatment)/ germination rate of control × 100%.
4.3. Evaluation of Seedling Emergence of Tall Wheatgrass Responding to Salt Stress
A total of 30 seeds were sown in a plastic pot (80×80×80 mm) filled with sterile vermiculite, then were fully irrigated with totally 1 L of 0, 100, 150, 200, or 250 mM NaCl solution or saline water for 15 d. According to Li et al. [44], the saline water with ECw=8.2 dS m‒1 and pH=9.6 was collected from the nearby drainage ditch at the Agricultural Experiment Station for Saline–Alkaline Land in the Yellow River Delta Region (118°84′03″ E, 37°68′74″ N), Institute of Genetics and Developmental Biology, Chinese Academy of Sciences. It was diluted with deionized water to ECw=0.6, 4.9, 5.4, 6.0, 6.6, and 7.5 dS m‒1 before being used further. The SER was recorded every day from 4 to 7 DAT and every two days from 7 to 15 DAT. Additionally, shoot height, SFW, and SDW were determined at 15 DAT. Finally, at the end of the experiment the salinity in the vermiculite was measured by using an activity meter (PNT3000, STEP systems, Nürnberg, Germany).
4.4. Evaluation of Seedling Growth of Tall Wheatgrass Responding to Salt Stress
Seeds were germinated on nylon net in deionized water at room temperature. Until the shoot was 8‒10 cm, 7 days after sowing, the uniform seedlings were selected and transferred into a nutrition medium which was refreshed every three days according to Li et al. [68]. The solution medium consisted of 0.2 mM KH2PO3, 0.5 mM MgSO4, 1.5 mM KCl, 1.5 mM CaCl2, 0.1 mM FeEDTA, 2 mM Ca(NO3)2, 1×10⁻³ mM H3BO3, 1×10⁻⁴ mM (NH4)6Mo7O24, 5×10⁻⁴ mM CuSO4, 1×10⁻³ mM ZnSO4, and 1×10⁻³ mM MnSO4. Three days later, NaCl was added in the nutrition medium, resulting in final concentrations of 150, 200, 250, 300, and 400 mM NaCl. The zero NaCl addition was taken as the non-stress control. After culturing in a growth chamber for 15 d, the NaCl stress was removed and then cultured in nutrition medium for another 15 d to explore the seedling growth recovery. During plant culture in growth chamber, PPFD was set as 160 µmol m‒2 s‒1, the photoperiod was 12 h, the temperature was kept at 24‒26℃ (day) and 20‒21℃ (night). The relative humidity was between 60% and 65%.
In addition, an everyday stepwise increase of 50 mM to a final concentration of 300 mM NaCl as well as sudden stress of 300 mM NaCl for 15 and 20 d were performed to compare the effects of sudden- and stepwise-increased salt stress on seedling growth of tall wheatgrass. Furthermore, to investigate the effects of seedling age on salt tolerance, the 7-d, 14-d, 21-d, and 27-d seedlings were subjected to 0 and 400 mM NaCl for 15 d. Finally, to study the effects of growth light intensity on salt tolerance of tall wheatgrass, 100 and 300 µmol m‒2 s‒1 growth light intensities were conducted on the 7-d seedlings subjected to 250 and 500 mM NaCl stress for 15 d. The other growth conditions remained unchanged as mentioned above. After the treatments, TFW, SFW, RFW, TDW, SDW, RDW, shoot height, root length, tiller number, the number of senescent leaves, and the number of green leaves were collected and analyzed.
4.5. Total RNA Extraction and First-Strand cDNA Synthesis
The leaf and root samples from hydroponic culture experiment were used to extract total RNA and synthesize the first-strand cDNA for assay of gene expression. According to the manufacturer's instructions, total RNA was extracted with the TRIzol Reagent (Thermo Fisher Scientific, USA). Then, all RNA samples were quantified by using a spectrophotometer Nanodrop 2000 (Thermo Fisher Scientific, USA). After genomic DNA was removed with a TransScript One-Step gDNA Removal, then 2 μg of total RNA was used to synthesize the first-strand cDNA with a cDNA Synthesis SuperMix kit (TransGen Biotech Co., Ltd., China). The 20 μL of cDNA solution was diluted to 60 μL with H2O before used for assay of gene expression.
4.6. qPCR Assay for Relative Gene Expression
The gene specific primers for 23 salt response genes and an internal reference gene ACT4 were designed according to the full-length cDNA sequences of Zhongyan 1 consisting of more than 50,000 unique isoforms (data not shown) by using Primer3web (version 4.1.0). The primer sequences and gene annotations were shown in Table 1. The quantitative real-time polymerase chain reaction (qPCR) was conducted by using a StepOnePlusTM Real-Time PCR System (Thermo Fisher Scientific, USA) to study the relative gene expression. The qPCR reaction solution included 1.5 μL of cDNA template, 5 μL of 2× PowerUp SYBR Green Master Mix (Thermo Fisher Scientific, USA), and 0.3 μL of 10 μM gene specific primers, resulting in a final volume of 10 μL. For each sample, four replicates were performed. Following the CT relative quantification method [69], relative expression levels were analyzed. The mean relative expression values were used for gene cluster analysis by using pheatmap package (version 1.0.12) in R script (version 4.2.2).
4.7. Tall Wheatgrass Lines and Tritipyrum Lines Evaluation
Seeds of a total of 28 tall wheatgrass lines were germinated as mentioned above in 250 mM NaCl and 100 mM Na2CO3 for 9 d, respectively. In addition, the seeds were sown in vermiculite fully irrigated with nutrient solution supplemented with 250 mM NaCl for 10 d. Three independent experiments were carried out. Deionized water or zero NaCl addition was taken as control, the relative seed germination and SER were computed. Finally, the 28 tall wheatgrass lines were hydroponically cultured and supplemented in 300 mM NaCl for 15 d. A half of sixteen plants for each line were cultured in two plastic boxes as repeats. Finally, TFW, SFW, RFW, TDW, SDW, and RDW were determined. Also, five Tritipyrum lines as well as the female tall wheatgrass parent Zhongyan 1 and the male wheat parent Xinong 6028 were hydroponically cultured in 250 mM NaCl for 15 d, which was evaluated as mentioned above.
4.8. Statistical Analysis
One-way analysis of variance (ANOVA), multiple comparisons, and the least significant difference (LSD) calculations were conducted by using the SPSS (version 19.0, IBM, Armonk, NY, USA) software package. Data were shown as mean ± standard deviation (SD). The figures were depicted by using Graphpad Prism (version 9.0).
5. Conclusions
In this work, seed germination, seedling emergence, and seedling growth were tested for salt tolerance in tall wheatgrass line Zhongyan 1, which was screened from coastal saline-alkaline soils around the Bohai Sea. The seed germination test showed that 250 mM NaCl, 150 mM Na2SO4, 150 mM NaHCO3, or 100 mM Na2CO3 for 9 d resulted in 31.5%, 65.4%, 68.2%, and 32.6% of non-stress seed germination rate. According to the germination rate, it seemed that 250 mM NaCl and 100 mM Na2CO3 for 9 d can be used for germination test of tall wheatgrass for tolerance to neutral and sodic salt stress, respectively. In addition, seedling emergence test showed that 250 mM NaCl or saline water with ECw= 6.6 dS m‒1 for 9 d resulted in 52% and 59.8% of non-stress SGR. Hydroponic culture demonstrated that 300 mM NaCl for 15 d resulted in 38.2%, 35.7% and 50% of the non-stress TDW, SDW, and RDW. Both long-term and short-term salt stress induced differential expression of salt response genes in both leaf and root of Zhongyan 1. Interestingly, the transcripts of NHX7.1/SOS1 and NCL1 were higher in root of the salt-tolerant tall wheatgrass lines than the salt-sensitive lines. Integrated evaluation of seed germination, seedling emergence, and seedling growth in 28 tall wheatgrass under 300 mM NaCl stress demonstrated that six lines behaved salt tolerant. Additionally, according to the seedling growth under 250 mM NaCl stress, two Tritipyrum lines 11 and 121 seems to inherit salt tolerance from Zhongyan 1. The six tall wheatgrass lines and two Tritipyrum lines have potential to be used in the coastal saline–alkaline land around the Bohai Sea. Taken together, in combination with 250 mM NaCl and 100 mM Na2CO3 for germination test, 250 mM NaCl or ECw=6.6 dS m–1 for seedling emergence test, and 300 mM NaCl for seedling growth test may generate reliable results. Collectively, this work provided an integrated salt tolerance test method for tall wheatgrass breeding program, which may promote breeding for new tall wheatgrass varieties with enhanced salt tolerance.
Acknowledgement: We thank for the support from Saline–alkaline Land Technological Breakthroughs of Chinese Academy of Sciences.
Supplementary Materials
The following supporting information can be downloaded at the website of this paper posted on Preprints.org, Figure S1: Dynamic response of survival rate of Zhongyan 1 to different concentration of NaCl; Figure S2: Comparison of the effects of stepwise and sudden increase to 300 mM NaCl on seedling growth of Zhongyan 1; Figure S3: Comparison of the effects of two growth light intensities on seedling growth of Zhongyan 1 subjected to NaCl stress; Table S1. The germination traits of tall wheatgrass line Zhongyan 1 subjected to different concentrations of salts.
Author Contributions
Conceptualization, H.L. and Z.L.; methodology, Q.X.; software, Q.X.; validation, W.L., P.H., and Q.X.; formal analysis, Q.X.; investigation, Q.X.; W.L.; and P.H.; resources, Q.Z.; data curation, Q.X.; writing—original draft preparation, H.L.; writing—review and editing, J.C.; visualization, Q.X.; supervision, Z.L.; project administration, H.L.; funding acquisition, H.L. All authors have read and agreed to the published version of the manuscript.
Funding
This research was funded by Chinese Academy of Sciences.
Data Availability Statement
Data are contained within the article or Supplementary Material. Raw data are available by contacting the corresponding author.
Conflicts of Interest
The authors declare no conflict of interest.
Abbreviations
The following abbreviations are used in this manuscript:
| DAT | Days after treatment |
| SDW | Shoot dry weight |
| SER | Seedling emergence rate |
| SFW | Shoot fresh weight |
| TDW | Total dry matter weight |
| TFW | Total fresh matter weight |
References
- Asay, K.H.; Jensen, K.B. Wheatgrasses. In Cool-Season Forage Grasses, Moser, L.E.; Buxton, D.R.; Casler, M.D., Eds., ASA, CSSA, and SSSA: Madison, WI, USA, 1996, 691–724.
- Andrioli, R.J. Adaptive mechanisms of tall wheatgrass to salinity and alkalinity stress. Grass Forage Sci. 2023, 78(1), 23–36. [CrossRef]
- Falasca, S.L.; Miranda, C.; Alvarez, S.P. Agro-ecological zoning for tall wheatgrass (Thinopyrum ponticum) as a potential energy and forage crop in salt-affected and dry lands of Argentina. Arch. Crop Sci. 2017, 1(1), 10–19.
- Dewey, D.R. Salt tolerance of twenty-five strains of Agropyron. Agron. J. 1960, 52, 631–635.
- Carter, D.L.; Peterson, H.B. Sodic tolerance of tall wheatgrass1. Agron. J. 1962, 54, 382–384.
- Temel, S.; Keskın, B.; Sımsek, U.; Yılmaz, I.H. Performance of some forage grass species in halomorphic soil. Turk. J. Field Crops. 2015, 20, 131–141. [CrossRef]
- Shahid, S.A.; Al-Shankiti, A. Sustainable food production in marginal lands—Case of GDLA member countries. Int. Soil Water Conserv. Res. 2013, 1(1), 24–38. [CrossRef]
- Ciria, C.S.; Sastre, C.M.; Carrasco, J.; Ciria, P. Tall wheatgrass (Thinopyrum ponticum (Podp)) in a real farm context, a sustainable perennial alternative to rye (Secale cereale L.) cultivation in marginal lands. Ind. Crops Prod. 2020, 146, 112184. [CrossRef]
- Nazli, R.I.; Kusvuran, A.; Tansi, V.; Ozturk, H.H.; Budak, D.B. Comparison of cool and warm season perennial grasses for biomass yield, quality, and energy balance in two contrasting semiarid environments. Biomass Bioenergy 2020, 139, 105627. [CrossRef]
- Cao, X.; Sun, B.; Chen, H.; Zhou, J.; Song, X.; Liu, X.; Deng, X.; Li, X.; Zhao, Y.; Zhang, J.; Li, J. Approaches and research progresses of marginal land productivity expansion and ecological benefit improvement in China. Bull. Chin. Acad. Sci. 2021, 36(3), 336–348.
- Scordia, D.; Papazoglou, E.G.; Kotoula, D.; Sanz, M.; Ciria, C.S.; Pérez, J.; Maliarenko, O.; Prysiazhniuk, O.; Von Cossel, M.; Greiner, B.E. Towards identifying industrial crop types and associated agronomies to improve biomass production from marginal lands in Europe. GCB Bioenergy 2022, 14(7), 710–734. [CrossRef]
- Xu, W.; Wang, J.; Liu, X.; Xie, Q.; Yang, W.; Cao, X.; Li, Z. Scientific and technological reasons, contents and corresponding policies of constructing “Coastal Grass Belt”. Bull. Chin. Acad. Sci. 2022, 37(2), 238–245.
- Wang, T.; Cao, L.; Liu, Z.; Yang, Q.; Chen, L.; Chen, M.; Jing, H. Forage grass basic biology of constructing Coastal Grass Belt. Chin. Bull. Bot. 2022, 57, 837–847.
- Li, H.; Zheng, Q.; Wang, J.; Sun, H.; Zhang, K.; Fang, H.; Xing, X.; Yang, W.; Cao, X.; Liu, X. Industrialization of tall wheatgrass for construction of “Coastal Grass Belt”. Bull. Chin. Acad. Sci. 2023, 38(4), 622–631.
- Munns, R.; Tester, M. Mechanisms of salinity tolerance. Annu. Rev. Plant Biol. 2008, 59, 651–681. [CrossRef]
- Shen, Y.; Li, Y.; Yan, S.; Wang, S. Salt tolerance of early growth of five grass species in Hexi corridor. Acta Agrest. Sin. 1999, 7(4), 293–299.
- Peng, Y.X.; Zhang, L.J.; Yu, Y.J.; Liu, G. The salt tolerance of seeds and seedlings from Thinopyrum species. Inner Mong. Pratacult. 2002, 14(3), 42–43.
- Zhang, B.; Jacobs, B.C.; O'Donnell, M.; Guo, J. Comparative studies on salt tolerance of seedlings for one cultivar of puccinellia (Puccinellia ciliata) and two cultivars of tall wheatgrass (Thinopyrum ponticum). Anim. Prod. Sci. 2005, 45(4), 391–399. [CrossRef]
- Huang, L.H.; Liang, Z.W. Effect of different sodium salt stress on the seed germination of tall wheatgrass (Agropyron elongatum). J. Arid Land Resour. Environ. 2007, 21(6), 173–176.
- Liu, Y.Q.; Dong, K.H.; Wang, Q.L.; Zhang, R.Z. Effect of salt stress on seed germination of tall wheatgrass. Grassl. Turf 2007, 2, 18–21.
- Bazzigalupi, O.; Pistorale, S.M.; Andrés, A.N. Salinity tolerance during seed germination from naturalized populations of tall wheatgrass (Thinopyrum ponticum). Cien. Investig. Agrar. 2008, 35(2), 231–238.
- Xu, M.; Wang, Q.; Wang, Y.; Liu, D.; Wang, S.; Li, Z.; Zhou, B. Effects of different salt stress on seed germination and seedling growth of Elytrigia elongata. Chin. J. Grassl. 2020, 42, 15–20.
- Mcguire, P.E.; Dvôrák, J. High salt tolerance potential in wheatgrasses. Crop Sci. 1981, 21(5), 702–705.
- Steppuhn, H.; Asay, K. Emergence, height, and yield of tall, NewHy, and green wheatgrass forage crops grown in saline root zones. Can. J. Plant Sci. 2005, 85(4), 863–875. [CrossRef]
- Guo, Q.; Meng, L.; Mao, P.; Tian, X. Salt tolerance in two tall wheatgrass species is associated with selective capacity for K+ over Na+. Acta Physiol. Plant. 2015, 37, 1708. [CrossRef]
- Shannon, M.C. Testing salt tolerance variability among tall wheatgrass lines. Agron. J. 1978, 70(5), 719–722. [CrossRef]
- Johnson, R. Salinity resistance, water relations, and salt content of crested and tall wheatgrass accessions. Crop Sci. 1991, 31(3), 730–734. [CrossRef]
- Roundy, B.A. Response of basin wildrye and tall wheatgrass seedlings to salination. Agron. J. 1983, 75(1), 67–71. [CrossRef]
- Grattan, S.R.; Grieve, C.M.; Poss, J.A.; Robinson, P.H.; Suarez, D.L.; Benes, S.E. Evaluation of salt-tolerant forages for sequential water reuse systems: I. Biomass production. Agric. Water Manage. 2004, 70(2), 109–120. [CrossRef]
- Zhang, G.; Wang, Z.; Gao, H.; Na, T.; Guo, D. Comprehensive evaluation of salt tolerance at seedling stage in Elytrigia accessions. Pratacult. Sci. 2008, 25, 51–54.
- Meng, L.; Shang, C.; Mao, P.; Zhang, G.; An, S. A comprehensive evaluation of salt tolerance for germplasm and materials of Elytrigia at the seedling stage. Acta Pratacult. Sin. 2009, 18(4), 67–74.
- Riedell, W.E. Growth and ion accumulation responses of four grass species to salinity. J. Plant Nutr. Soil Sci. 2016, 39(14), 2115–2125. [CrossRef]
- Bhuiyan, M.S.I.; Raman, A.; Hodgkins, D.; Mitchell, D.; Nicol, H.I. Influence of high levels of Na+ and Cl− on ion concentration, growth, and photosynthetic performance of three salt-tolerant plants. Flora 2017, 228, 1‒9.
- Borrajo, C.I.; Sánchez-Moreiras, A.M.; Reigosa, M.J. Morpho-physiological, biochemical and isotopic response of tall wheatgrass populations to salt stress. J. Agro. Crop Sci. 2021, 207, 236–248. [CrossRef]
- Borrajo, C.I.; Sánchez-Moreiras, A.M.; Reigosa, M.J. Ecophysiological responses of tall wheatgrass germplasm to drought and salinity. Plants 2022, 11(12), 1548. [CrossRef]
- Zhang, R.; Feng, X.H.; Wu, Y.J.; Sun, Q.; Li, J.; Li, J.S.; Liu, X.J. Interactive effects of drought and salt stresses on the growth and physiological characteristics of Thinopyrum ponticum. Chin. J. Eco-Agric. 2022, 30(11), 1795−1806.
- Rogers, A.L.; Bailey, E.T. Salt tolerance trials with forage plants in south Western Australia. Aust. J. Exp. Agric. 1963, 3, 125–130. [CrossRef]
- Gu, A. Cultivation of salt-tolerant forage grass—Thinopyrum ponticum. Grassl. China 2004, 26(2), 9.
- Bhuiyan, M.N.; Raman, A.; Hodgkins, D.S.; Mitchell, D.C.; Nicol, H.I. Salt accumulation and physiology of naturally occurring grasses in saline soils in Australia. Pedosphere 2015, 25, 501–511. [CrossRef]
- Tong, C.Y.; Yang, G.T.; Li, H.W.; Li, B.; Li, Z.S.; Zheng, Q. Screening of salt-tolerant Thinopyrum ponticum under two coastal region salinity stress levels. Front. Genet. 2022, 13, 832013. [CrossRef]
- Li, H.; Li, W.; Zheng, Q.; Zhao, M.; Wang, J.; Li, B.; Li, Z. Salinity threshold of tall wheatgrass for cultivation in coastal saline and alkaline land. Agriculture 2023, 13(2), 337. [CrossRef]
- Suyama, H.; Benes, S.E.; Robinson, P.H.; Getachew, G.; Grattan, S.R.; Grieve, C.M. Biomass yield and nutritional quality of forage species under long-term irrigation with saline-sodic drainage water: Field evaluation. Anim. Feed Sci. Technol. 2007, 135, 329–345. [CrossRef]
- Bernstein, L.; Ford, R. Salt tolerance of forage crops. In: U.S. Salinity Lab Report to Collaborators, Riverside: CA, USDA, 1958, 32–36.
- Li, W.; Yin, J.; Ma, D.; Zheng, Q.; Li, H.; Wang, J.; Zhao, M.; Liu, X.; Li, Z. Acceptable salinity level for saline water irrigation of tall wheatgrass in edaphoclimatic scenarios of the coastal saline–alkaline land around Bohai Sea. Agriculture 2023, 13(11), 2117. [CrossRef]
- Ouyang, Z.; Wang, H.; Lai, J.; Wang, C.; Liu, Z.; Sun, Z.; Hou, R. New approach of high-quality agricultural development in the yellow river delta. Bull. Chin. Acad. Sci. 2020, 35(2): 145–153.
- Gulick, P.; Dvorák, J. Gene induction and repression by salt treatment in roots of the salinity-sensitive Chinese Spring wheat and the salinity-tolerant Chinese Spring x Elytrigia elongata amphiploid. Proc. Natl. Acad. Sci. U. S. A. 1987, 84(1), 99–103.
- Gulick, P.J.; Dvorák, J. Coordinate gene response to salt stress in Lophopyrum elongatum. Plant Physiol. 1992, 100(3), 1384–1388. [CrossRef]
- Galvez, A.F.; Gulick, P.J.; Dvorak, J. Characterization of the early stages of genetic salt-stress responses in salt-tolerant Lophopyrum elongatum, salt-sensitive wheat, and their amphiploid. Plant Physiol. 1993, 103(1), 257–265. [CrossRef]
- Tabaei-Aghdaei, S.R.; Harrison, P.; Pearce, R.S. (2000), Expression of dehydration-stress-related genes in the crowns of wheatgrass species [Lophopyrum elongatum (Host) A. Love and Agropyron desertorum (Fisch. ex Link.) Schult.] having contrasting acclimation to salt, cold and drought. Plant Cell Environ. 2000, 23, 561–571.
- Shen, W.; Gómez-Cadenas, A.; Routly, E.L.; Ho, T.H.; Simmonds, J.A.; Gulick, P.J. The salt stress-inducible protein kinase gene, Esi47, from the salt-tolerant wheatgrass Lophopyrum elongatum is involved in plant hormone signaling. Plant Physiol. 2001, 125(3), 1429–41.
- Hussein, Z.; Dryanova, A.; Maret, D.; Gulick, P.J. Gene expression analysis in the roots of salt-stressed wheat and the cytogenetic derivatives of wheat combined with the salt-tolerant wheatgrass, Lophopyrum elongatum. Plant Cell Rep. 2014, 33, 189–201. [CrossRef]
- Peng, Z.; Wang, Y.; Geng, G.; Yang, R.; Yang, Z.; Yang, C.; Xu, R.; Zhang, Q.; Kakar, K.U.; Li, Z.; Zhang, S. Comparative analysis of physiological, enzymatic, and transcriptomic responses revealed mechanisms of salt tolerance and recovery in Tritipyrum. Front. Plant Sci. 2022, 12, 800081. [CrossRef]
- Qiao, W.H.; Zhao, X.Y.; Li, W.; Luo, Y.; Zhang, X.S. Overexpression of AeNHX1, a root-specific vacuolar Na+/H+ antiporter from Agropyron elongatum, confers salt tolerance to Arabidopsis and Festuca plants. Plant Cell Rep. 2007, 26(9), 1663–1672.
- Sheikh-Mohamadi, M.H.; Etemadi, N.; Aalifar, M.; Pessarakli, M. Salt stress triggers augmented levels of Na+, K+ and ROS alters salt-related gene expression in leaves and roots of tall wheatgrass (Agropyron elongatum). Plant Physiol. Biochem. 2022, 183, 9–22. [CrossRef]
- Zhang, Y.; Tian, X.X,; Zheng, M.L.; Mao, P.C.; Meng, L. Analysis of drought and salt resistance of EeHKT1;4 gene from Elytrigia elongata in Arabidopsis. Acta Prat. Sin. 2022, 31, 188–198.
- King, I.P.; Law, C.N.; Cant, K.A.; Orford, S.E.; Reader, S.M. Miller, T.E. Tritipyrum, a potential new salt-tolerant cereal. Plant Breed. 1997, 116, 127–132.
- Didaran, F.; Kordrostami, M.; Ghasemi-Soloklui, A.A.; Pashkovskiy, P.; Kreslavski, V.; Kuznetsov, V.; Allakhverdiev, S.I. The mechanisms of photoinhibition and repair in plants under high light conditions and interplay with abiotic stressors. J. Photochem. Photobiol. B. 2024, 259, 113004. [CrossRef]
- Wu, G.Q.; Wang, J.L.; Li, S.J. Genome-wide identification of Na+/H+ antiporter (NHX) genes in sugar beet (Beta vulgaris L.) and their regulated expression under salt stress. Genes 2019, 10 (5), 401.
- Hamamoto, S.; Horie, T.; Hauser, F.; Deinlein, U.; Schroeder, J.I.; Uozumi, N. HKT transporters mediate salt stress resistance in plants: from structure and function to the field. Curr. Opin. Biotechnol. 2015, 32, 113–120. [CrossRef]
- Zhao, Y.; Zhang, Z.; Gao, J.; Wang, P.; Hu, T.; Wang, Z.; Hou, Y.J.; Wan, Y.; Liu, W.; Xie, S.; Lu, T. Arabidopsis duodecuple mutant of PYL ABA receptors reveals PYL repression of ABA-independent SnRK2 activity. Cell Rep. 2018, 23 (11), 3340–3351. [CrossRef]
- Li, M.; Chen, R.; Jiang, Q.; Sun, X.; Zhang, H.; Hu, Z. GmNAC06, a NAC domain transcription factor enhances salt stress tolerance in soybean. Plant Mol. Biol. 2021, 105(3), 333–345. [CrossRef]
- Zhang, X.; Long, Y.; Chen, X.; Zhang, B.; Xin, Y.; Li, L.; Cao, S.Q.; Liu, F.; Wang, Z.; Huang, H.; Zhou, D.; Xia, J. A NAC transcription factor OsNAC3 positively regulates ABA response and salt tolerance in rice. BMC Plant Biol. 2021, 21, 546. [CrossRef]
- Hu, Y.; Li, C.; Zhou, R.; Song, Y.; Lv, Z.; Wang, Q.; Dong, X.; Liu, S.; Feng, C.; Zhou, Y.; Zeng, X.; Zhang, L.; Wang, Z.; Di, H. The transcription factor ZmNAC89 gene is involved in salt tolerance in maize (Zea mays L.). Int. J. Mol. Sci. 2023, 24(20), 15099. [CrossRef]
- Solis, C.A.; Yong, M.T.; Zhou, M.; Venkataraman, G.; Shabala, L.; Holford, P.; Shabala, S.; Chen, Z.H. Evolutionary significance of NHX Family and NHX1 in salinity stress adaptation in the genus Oryza. Int. J. Mol. Sci. 2022, 23(4), 2092. [CrossRef]
- Yue, Y.; Zhang, M.; Zhang, J.; Duan, L.; Li, Z. SOS1 gene overexpression increased salt tolerance in transgenic tobacco by maintaining a higher K(+)/Na(+) ratio. J. Plant Physiol. 2012, 169(3), 255–261.
- Salazar, O.R.; Chen, K.; Melino, V.J.; Reddy, M.P.; Hřibová, E.; Čížková, J.; Beránková, D.; Arciniegas Vega, J.P.; Cáceres Leal, L.M.; Aranda, M.; Jaremko, L.; Jaremko, M.; Fedoroff, N.V.; Tester, M.; Schmöckel, S.M. SOS1 tonoplast neo-localization and the RGG protein SALTY are important in the extreme salinity tolerance of Salicornia bigelovii. Nat. Commun. 2024, 15(1), 4279. [CrossRef]
- Wang, P.; Li, Z.; Wei, J.; Zhao, Z.; Sun, D.; Cui, S. A Na+/Ca2+ exchanger-like protein (AtNCL) involved in salt stress in Arabidopsis. J. Biol. Chem. 2012, 287(53), 44062–44070.
- Li, H.; Zheng, Q.; Zhang, J.; Li, B.; Li, Z. The analysis of determining factors and evaluation of tolerance to photoinhibition in wheat (Triticum aestivum L.). Photosynthetica 2017, 55, 69–76. [CrossRef]
- Schmittgen, T.D.; Livak, K.J. Analyzing real-time PCR data by the comparative CT method. Nat. Protoc. 2008, 3, 1101–1108. [CrossRef]
Figure 1.
Dynamic responses of germination rate in tall wheatgrass line Zhongyan 1 to different concentrations of NaCl (a), Na2SO4 (b), NaHCO3 (c), and Na2CO3 (d). Data are represented as mean ± SD. Different letters indicate that the difference was significant at p < 0.05.
Figure 1.
Dynamic responses of germination rate in tall wheatgrass line Zhongyan 1 to different concentrations of NaCl (a), Na2SO4 (b), NaHCO3 (c), and Na2CO3 (d). Data are represented as mean ± SD. Different letters indicate that the difference was significant at p < 0.05.
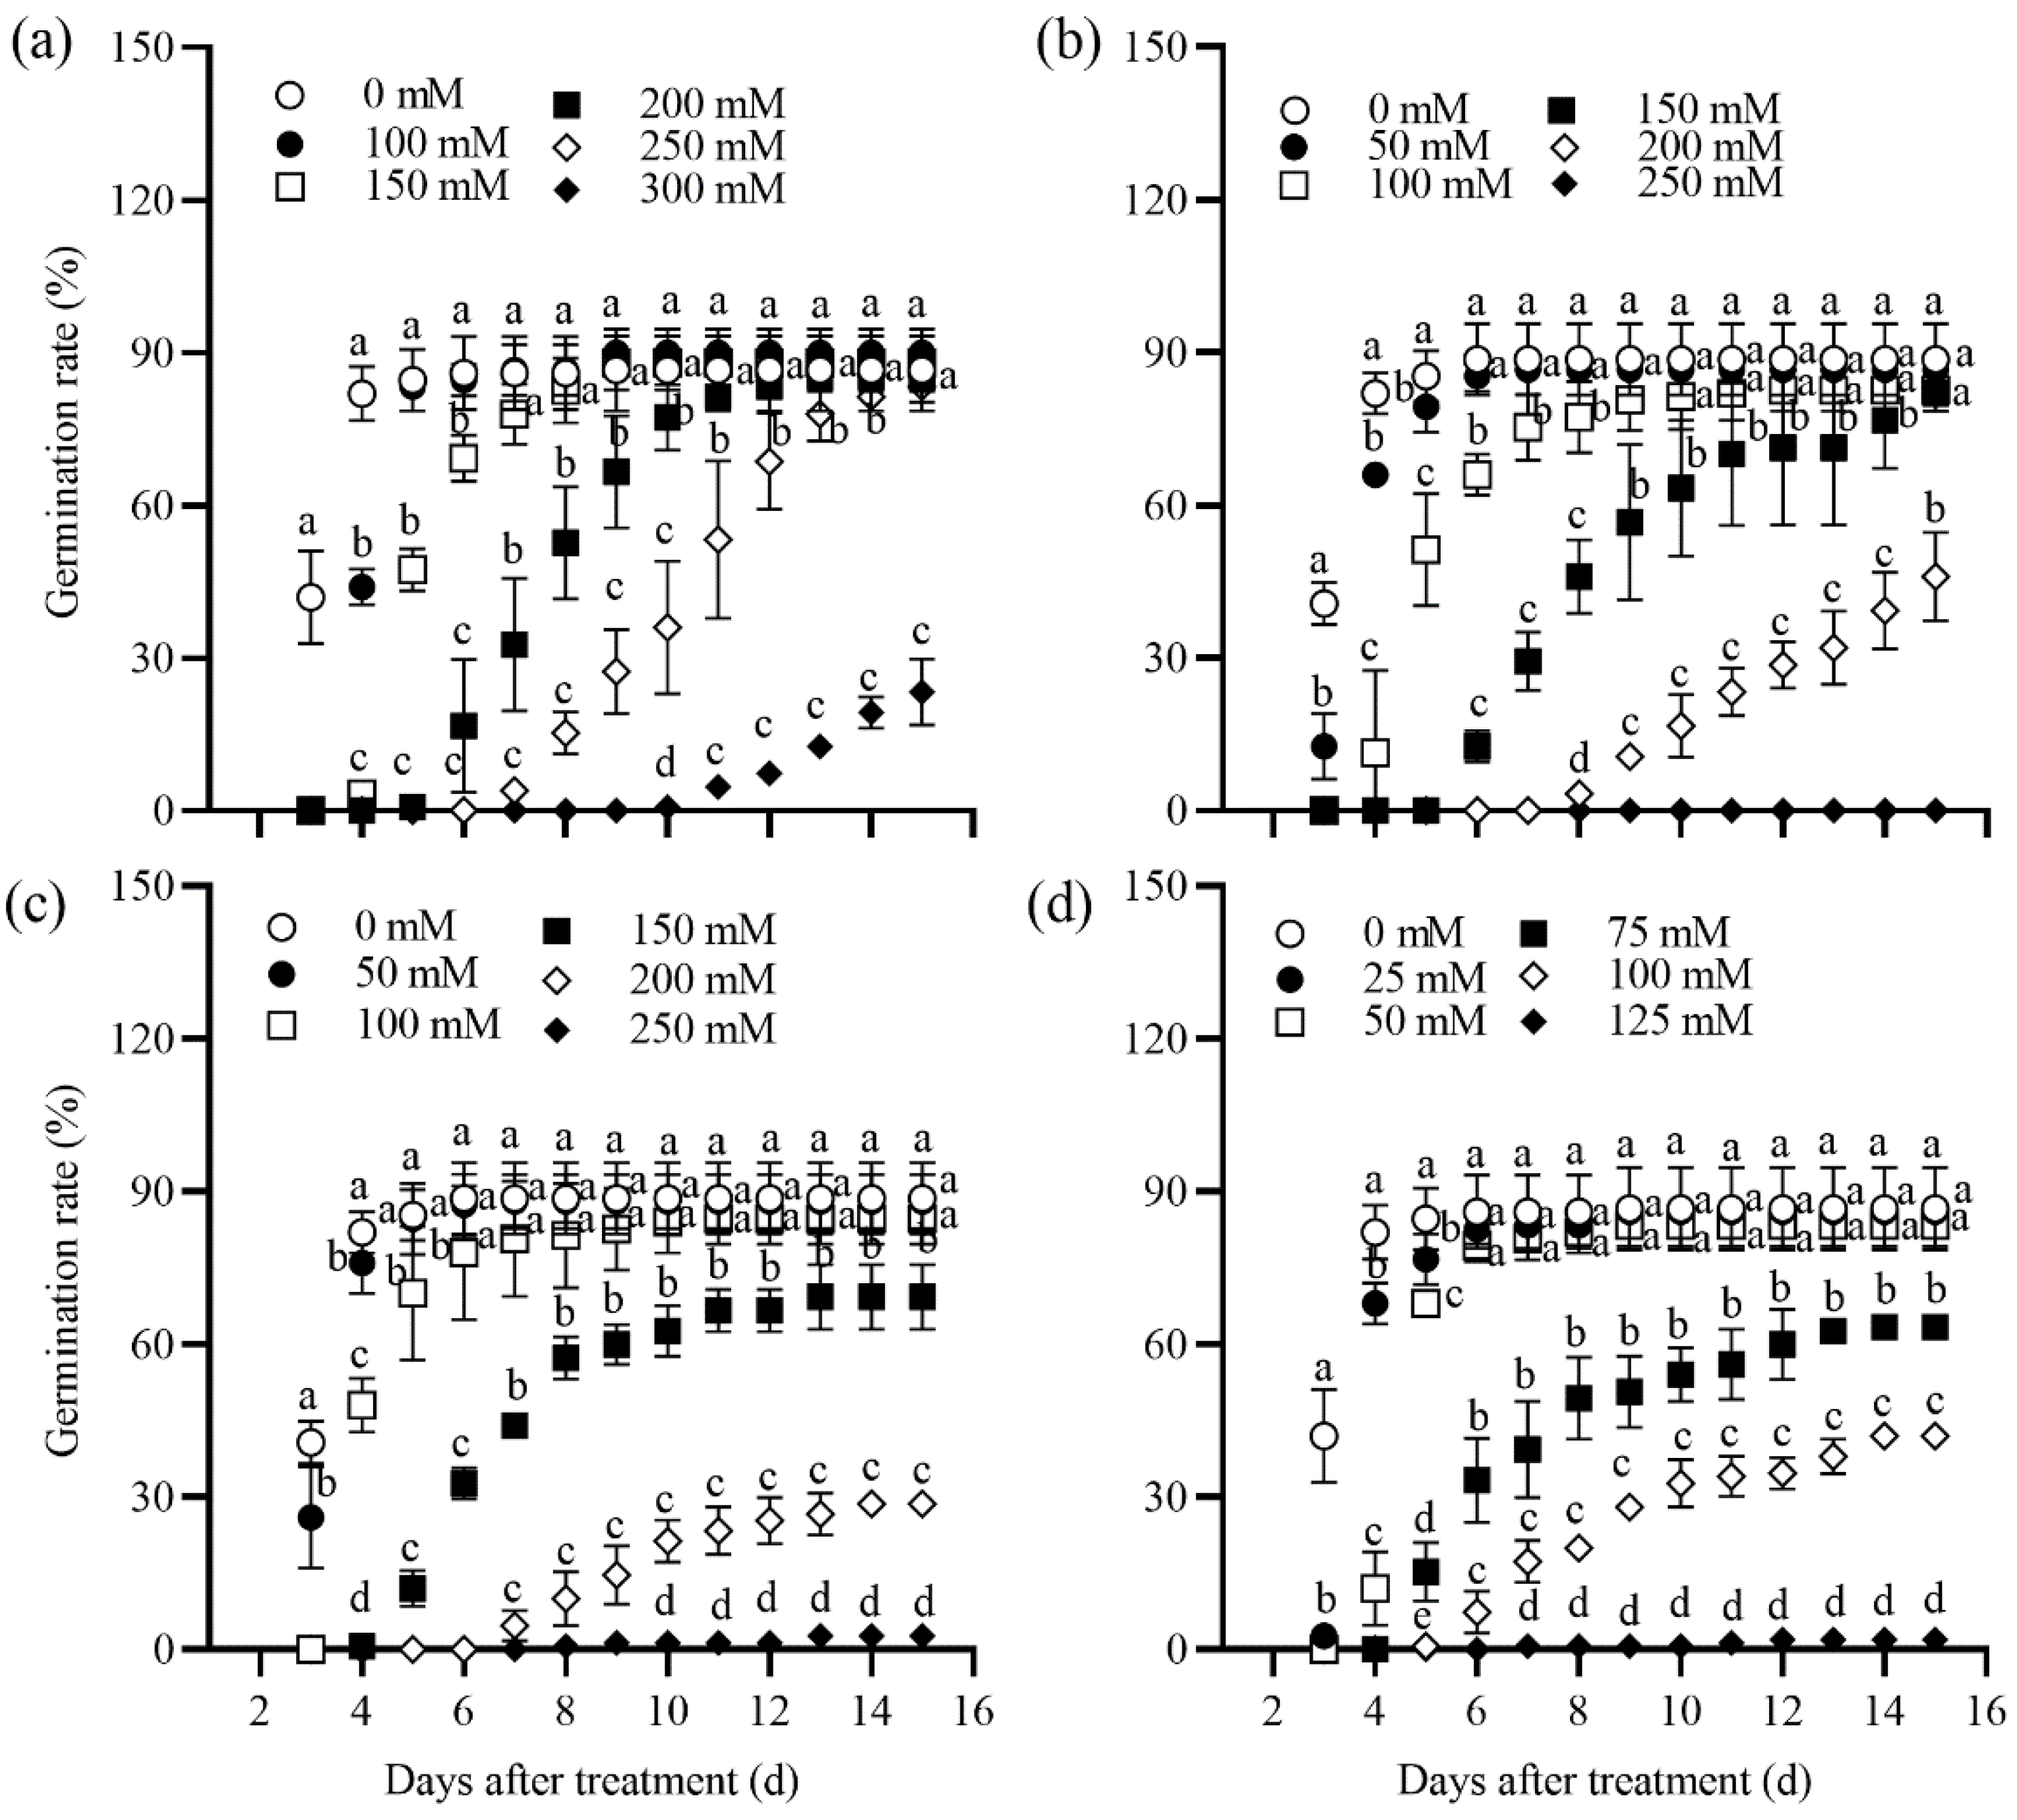
Figure 2.
The seedling emergence rate (SER, a), shoot height (b), and biomass (c) of tall wheatgrass line Zhongyan 1 subjected to different concentration of NaCl solution. (d) The salinity of vermiculite medium after NaCl treatment, which was measured with a PNT3000 activity meter. Data are represented as mean ± SD. Different letters indicate that the difference was significant at p < 0.05.
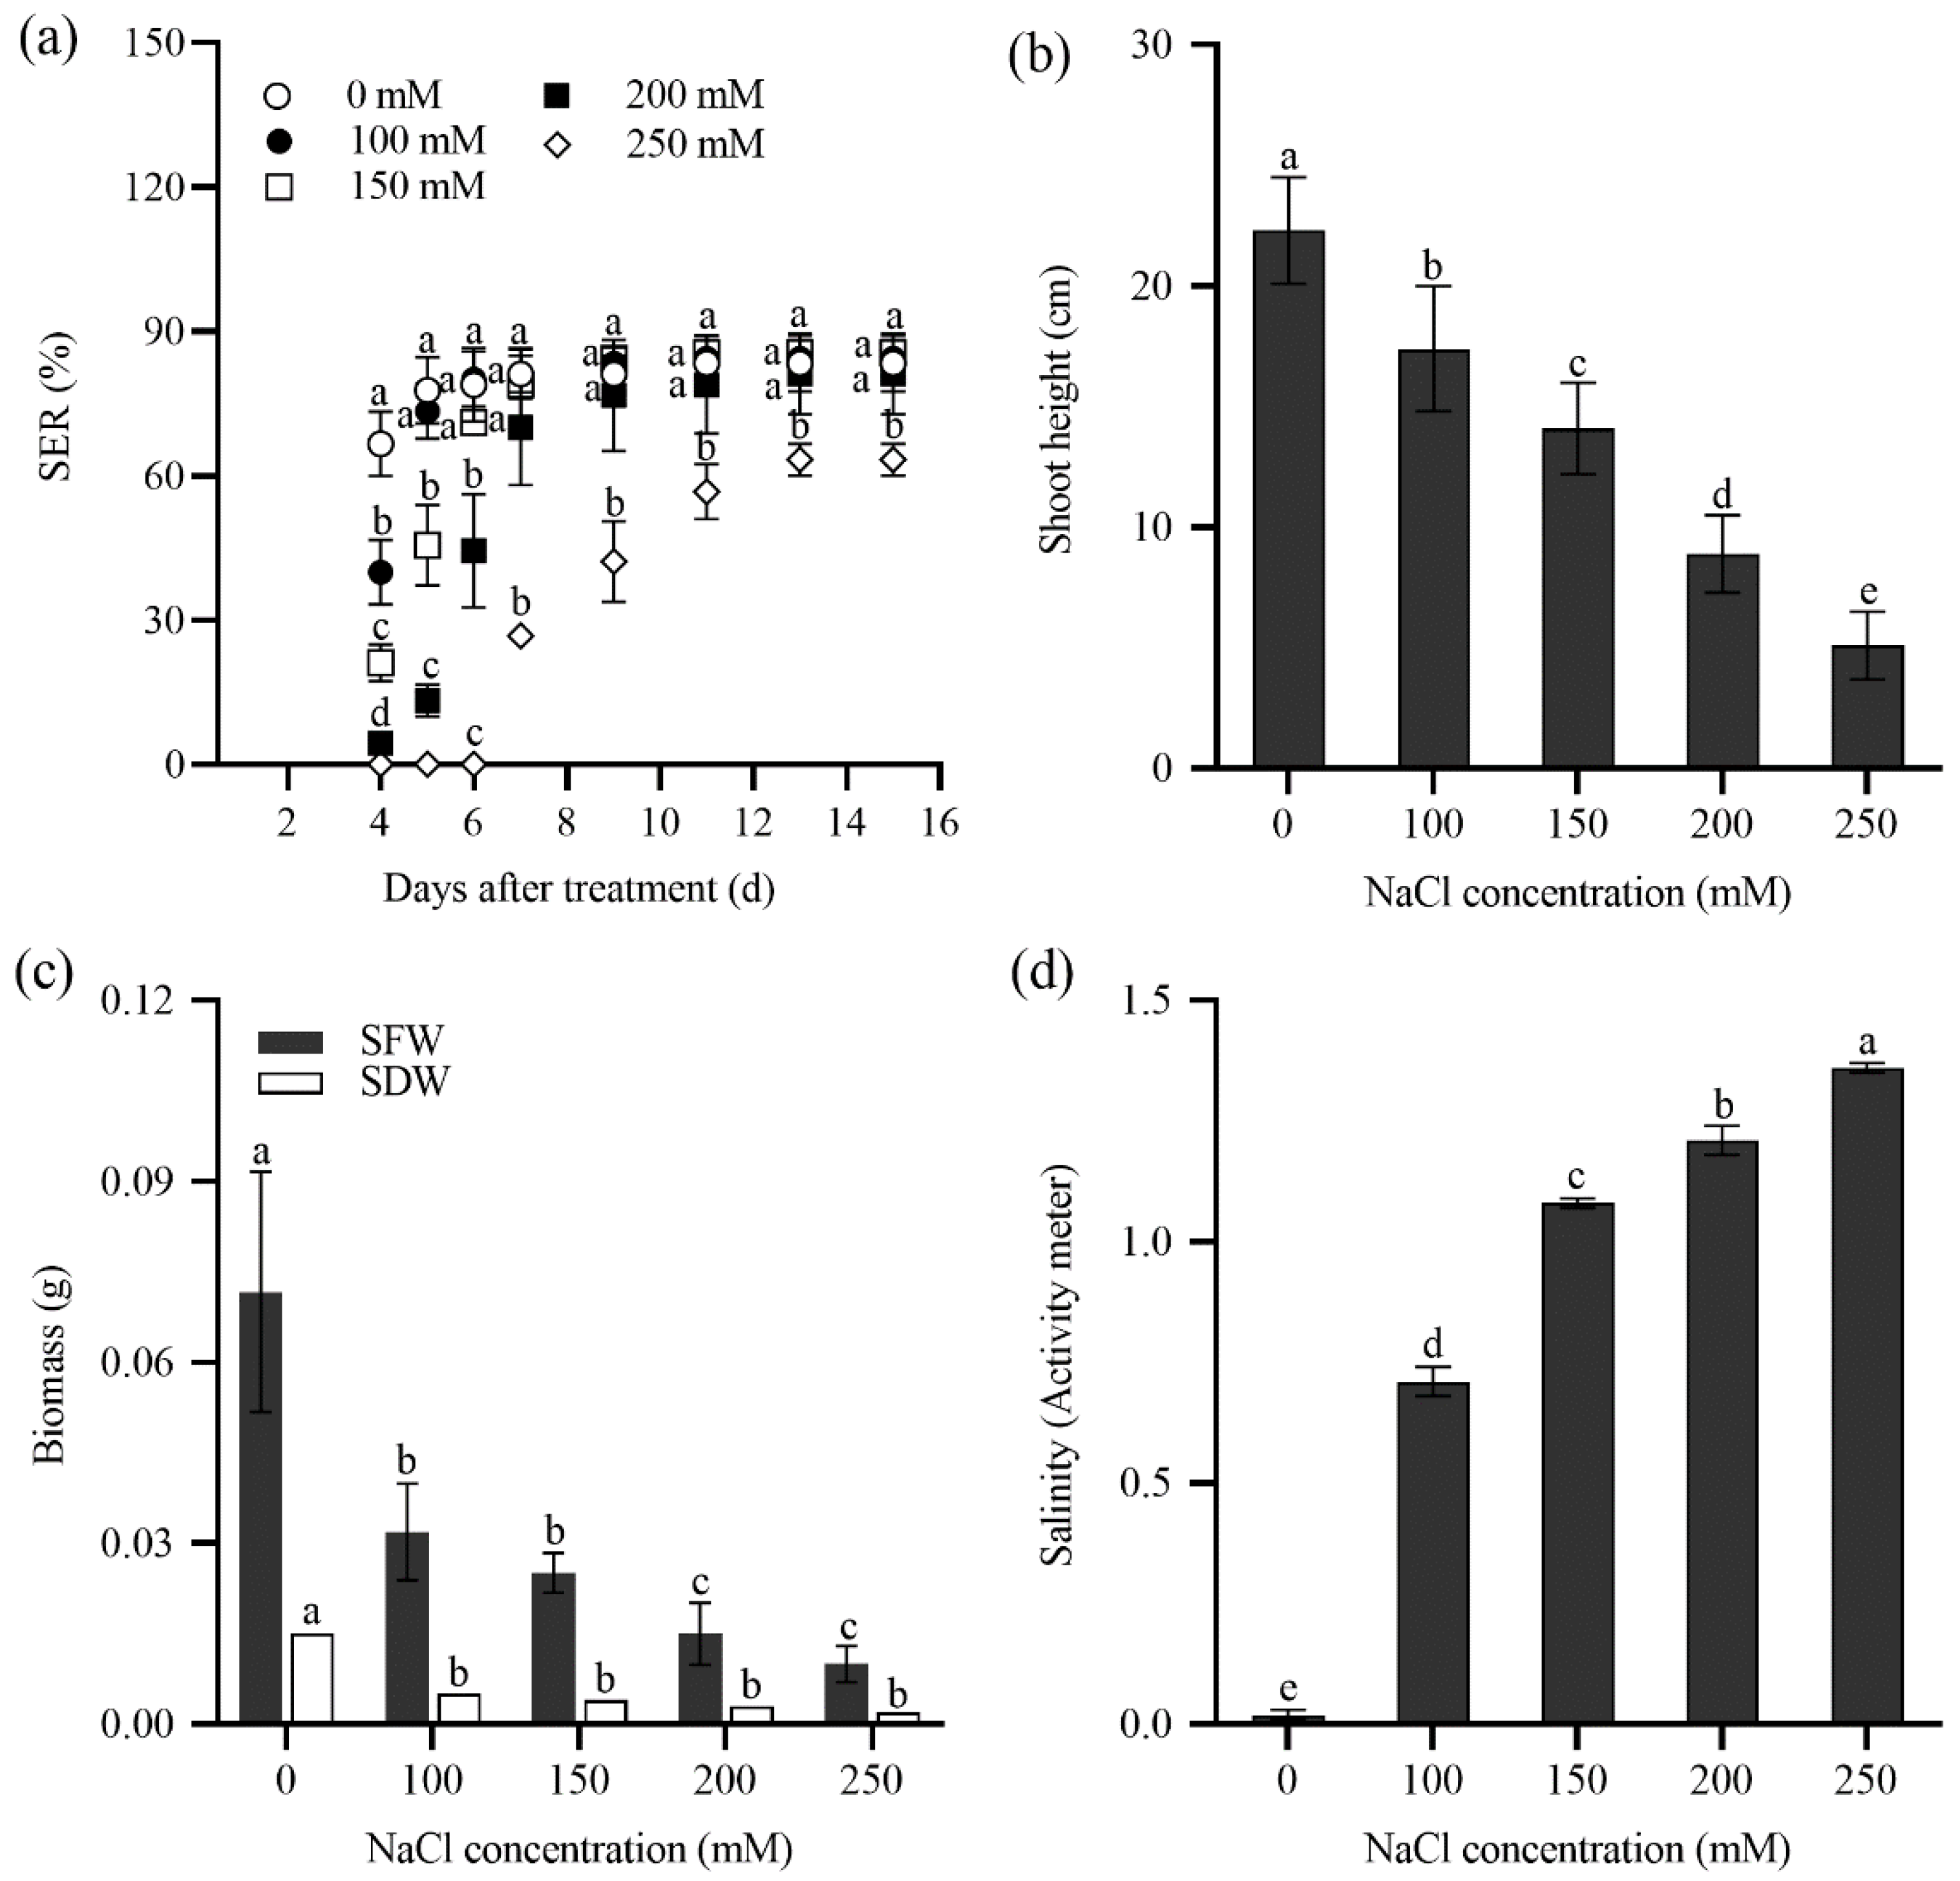
Figure 3.
The seedling emergence rate (SER, a), shoot height (b), and biomass (c) of tall wheatgrass line Zhongyan 1 subjected to saline water. (d) The salinity of cultured vermiculite medium after saline water treatment, which was measured with a PNT3000 activity meter. Data are represented as mean ± SD. Different letters indicate that the difference was significant at p < 0.05.
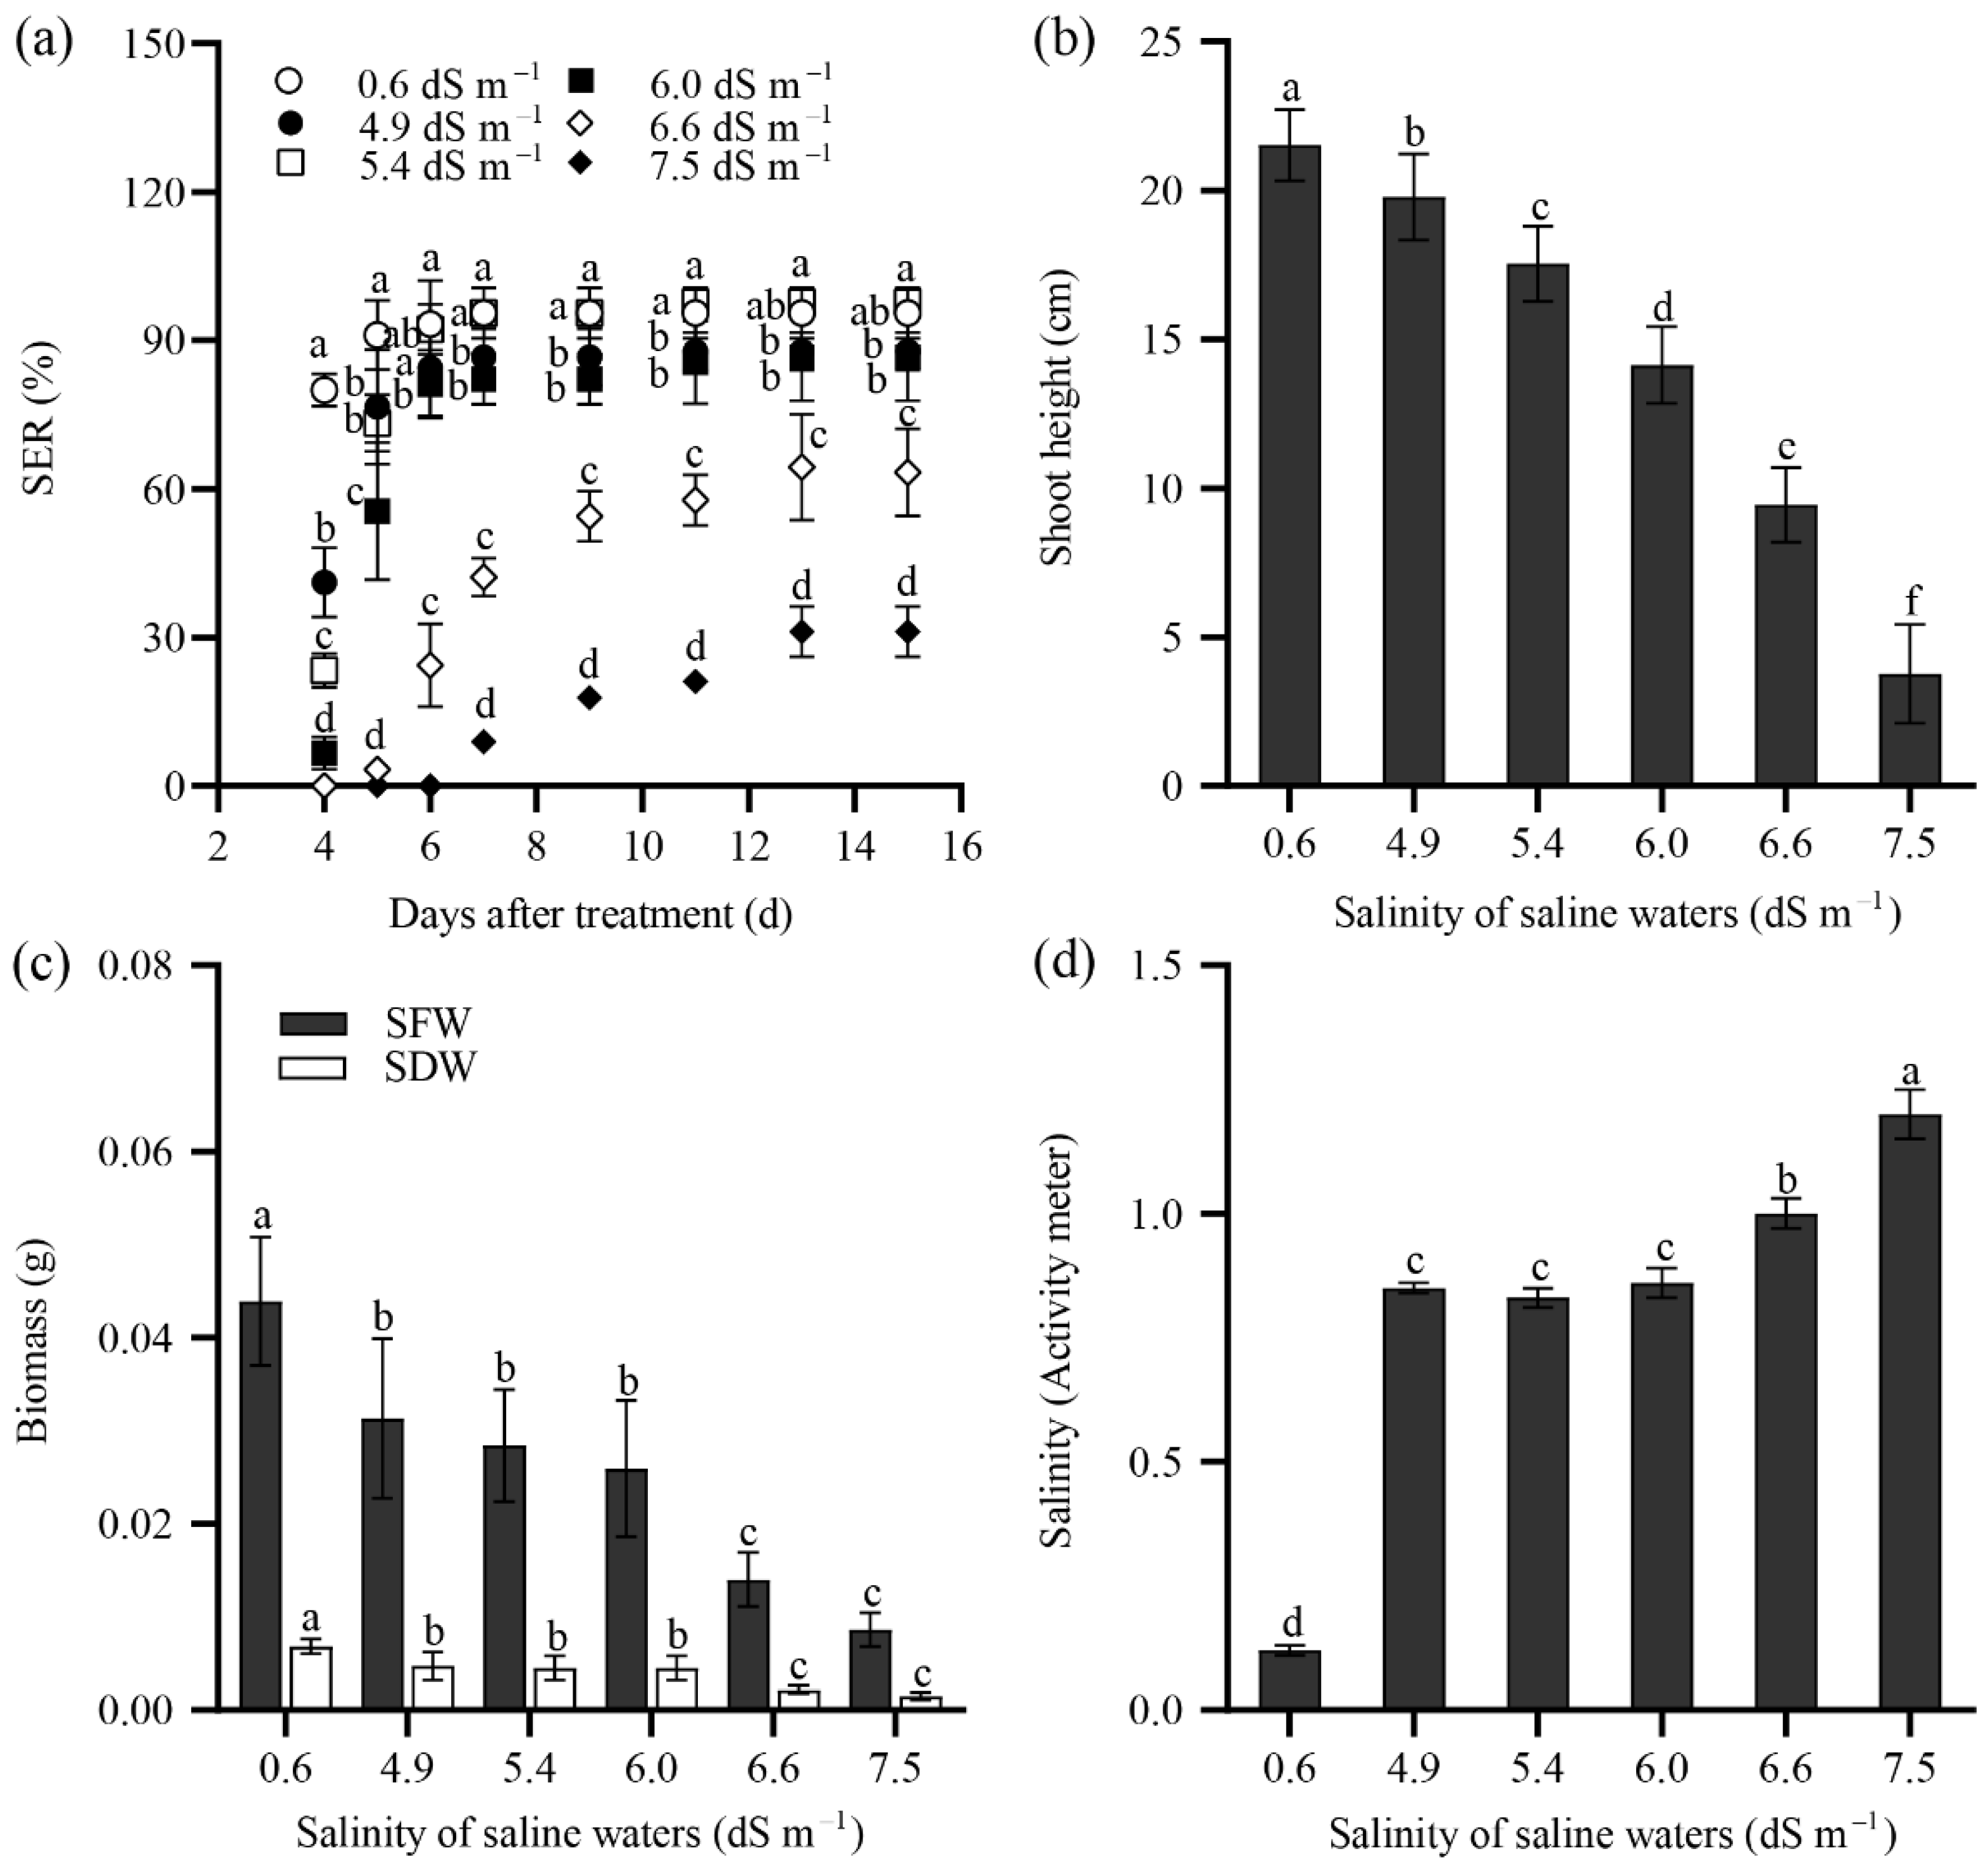
Figure 4.
The total dry weight (TDW, a), shoot dry weight (SDW, b), root dry weight (RDW, c), shoot height (d), root length (e), the number of green leaves (f), dry matter content (g), and the ratio of root to shoot dry weight (root/Shoot ratio, h) in tall wheatgrass line Zhongyan 1 subjected to NaCl stress for 15 d (dark) and recovery for another 15 d after removal of NaCl (white). Data are represented as mean ± SD. Different letters indicate that the difference was significant at p < 0.05.
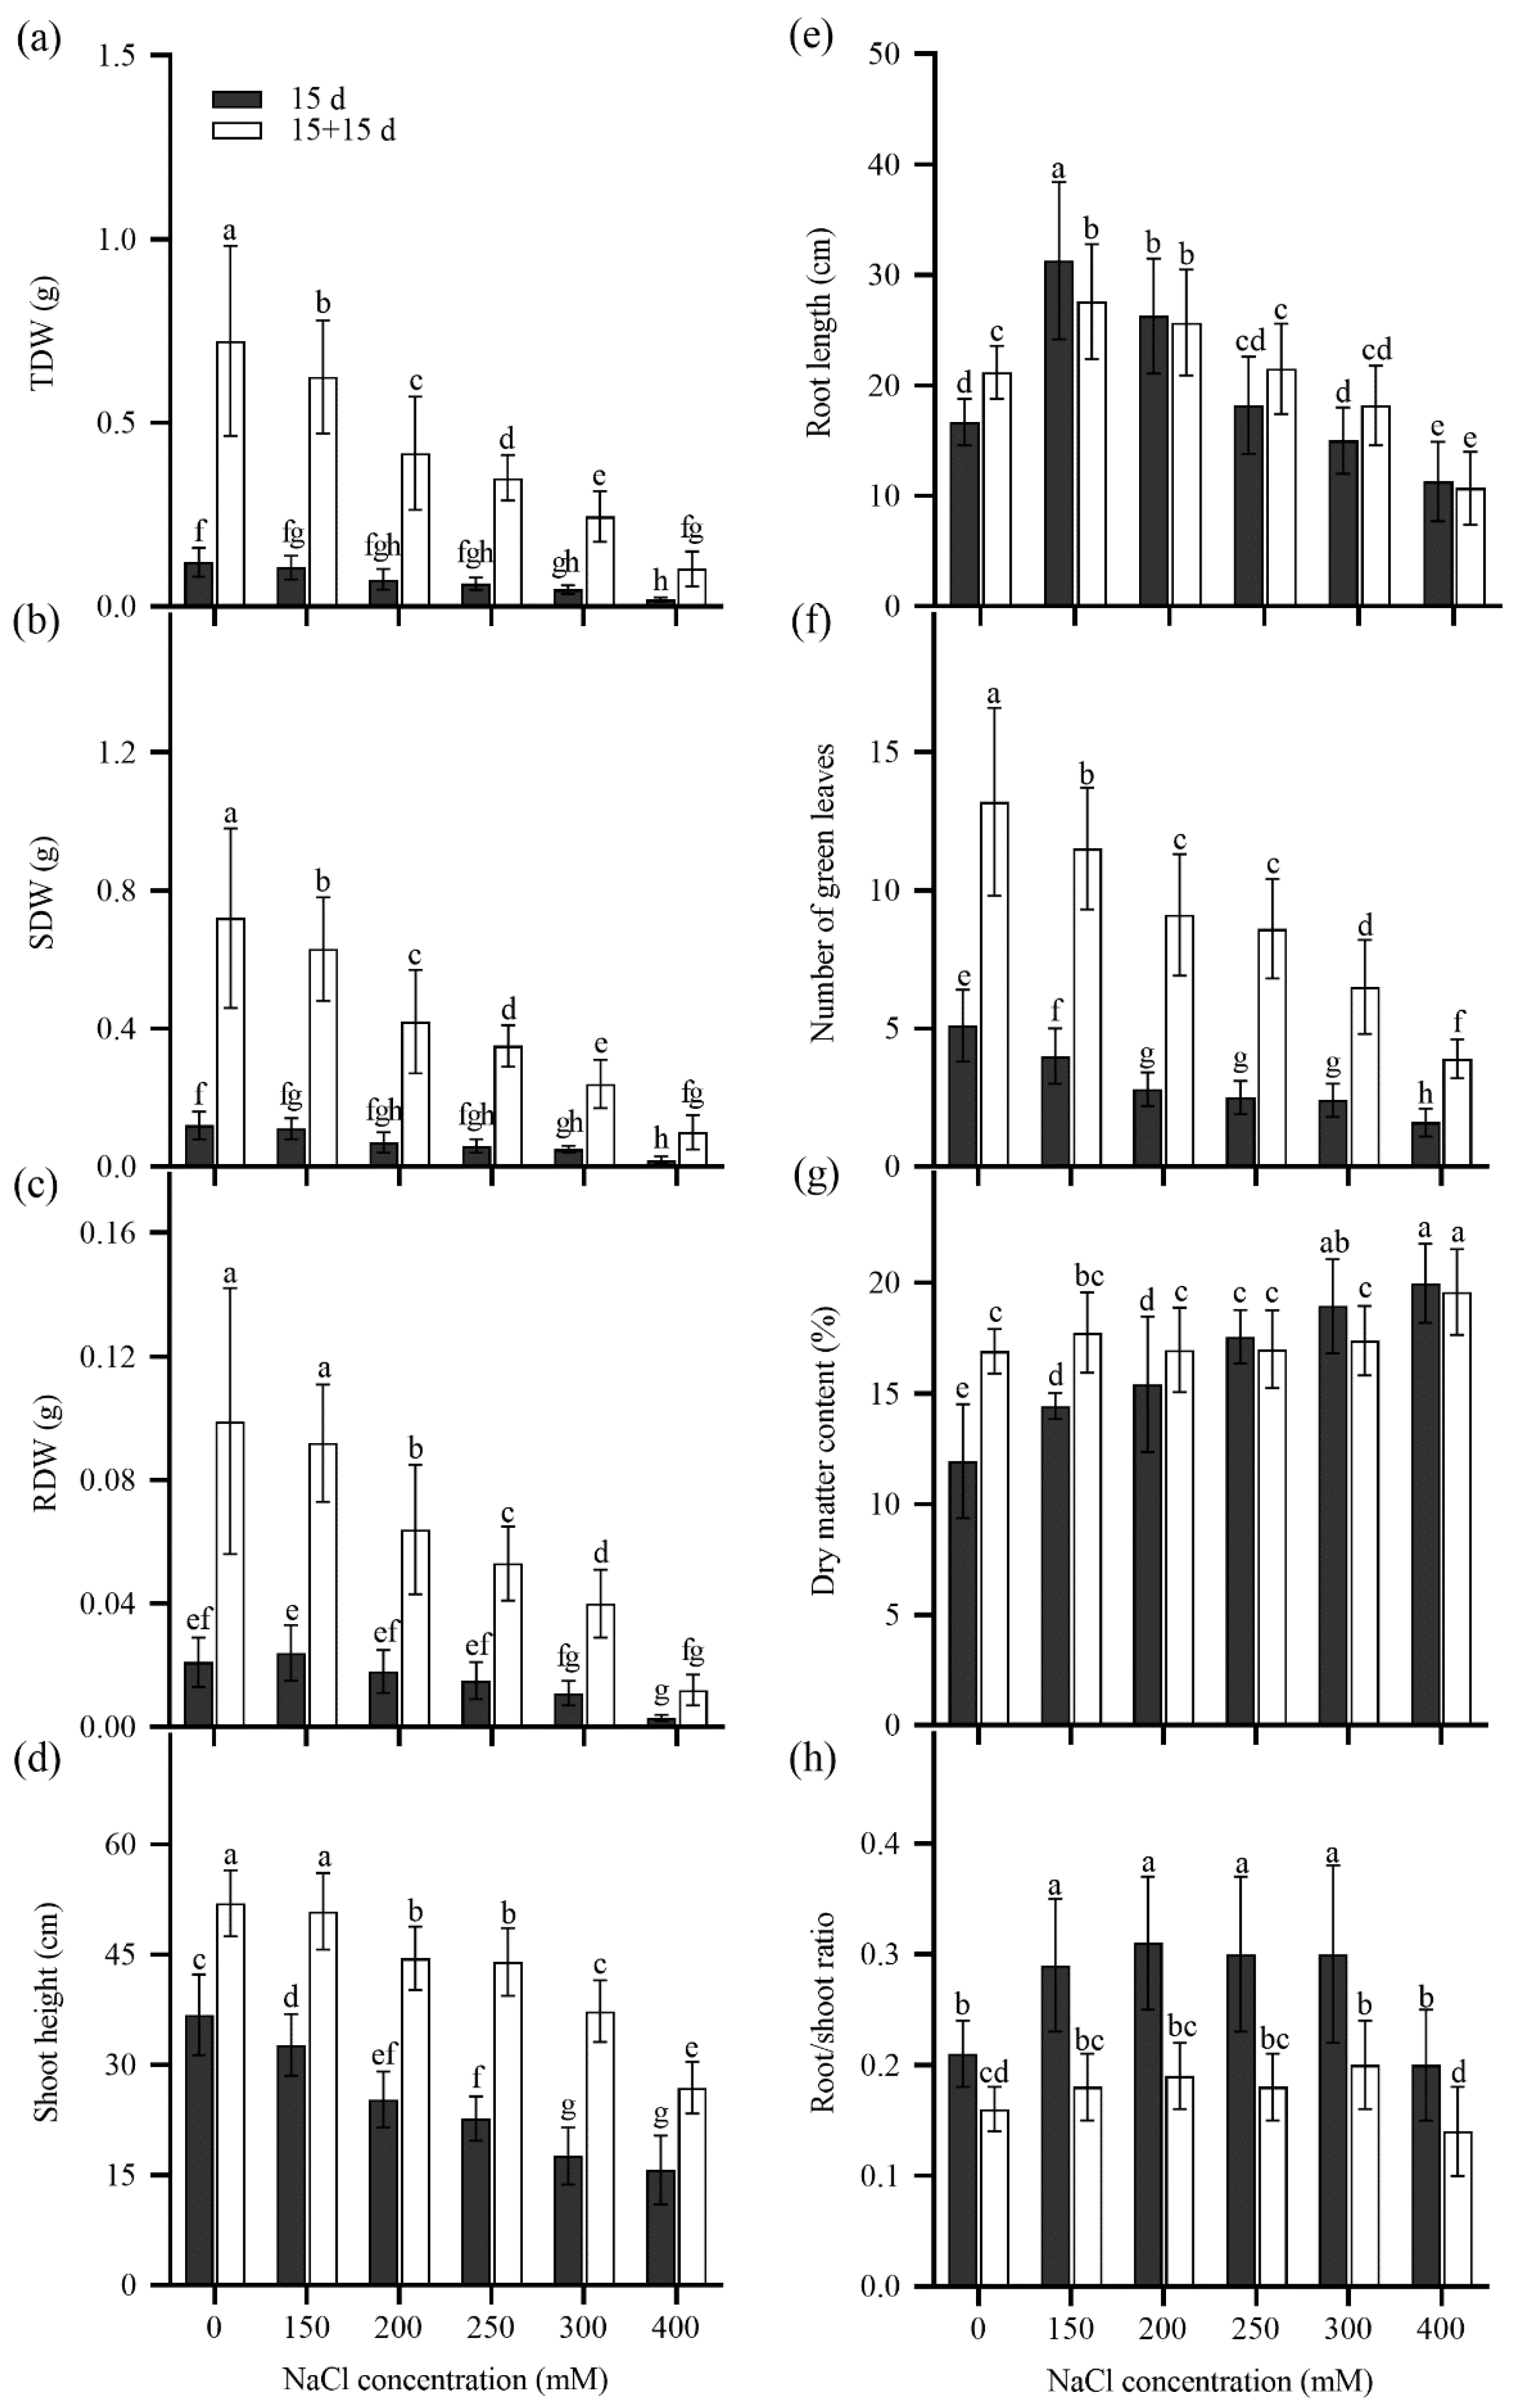
Figure 5.
The mean relative expression levels of 22 genes in fully expanded leaf and root of tall wheatgrass line Zhongyan 1 subjected to 150, 200, 250, and 300 mM NaCl for 15 d (a) and in leaf of tall wheatgrass line Zhongyan 1 subjected to 300, 500, and 800 mM NaCl for 1 h, 6 h, and 24 h (b). _L, indicates leaves; _R, indicates roots.
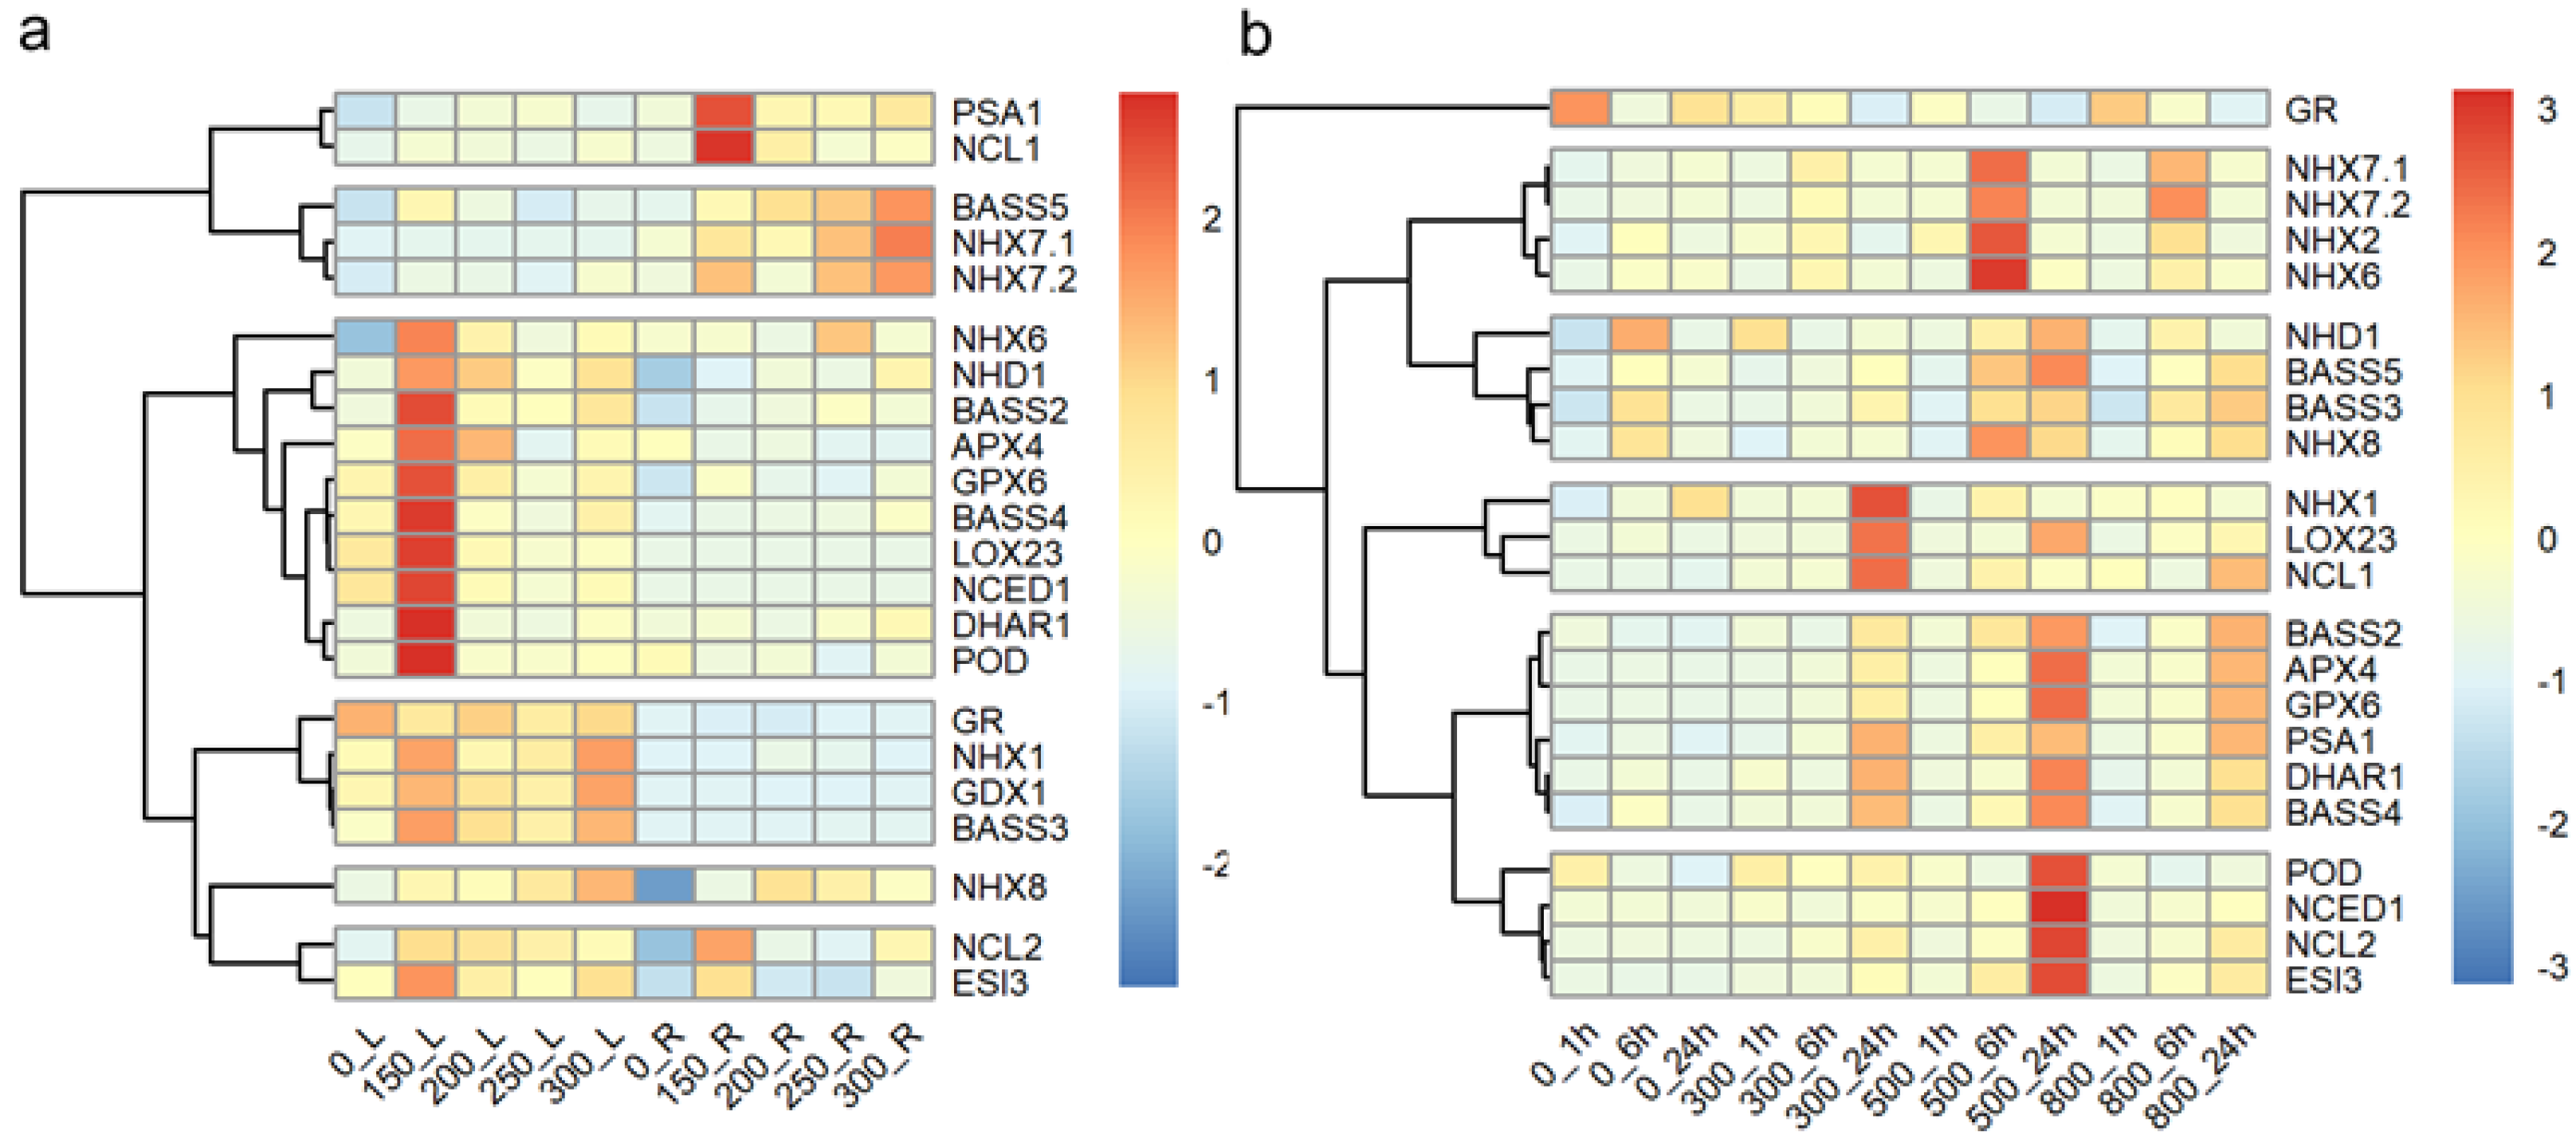
Figure 6.
The mean relative expression levels of salt-response genes in six tall wheatgrass lines with contrasting seedling growth traits under salt stress. _L, indicates leaves; _R, indicates roots; *denotes the seedling growth traits under salt stress relative to non-stress control. TDW, total dry weight; SDW, shoot dry weight; RDW, root dry weight; SH, shoot height; RL, root length; GL, the number of green leaves; SL, the number of senescent leaves.
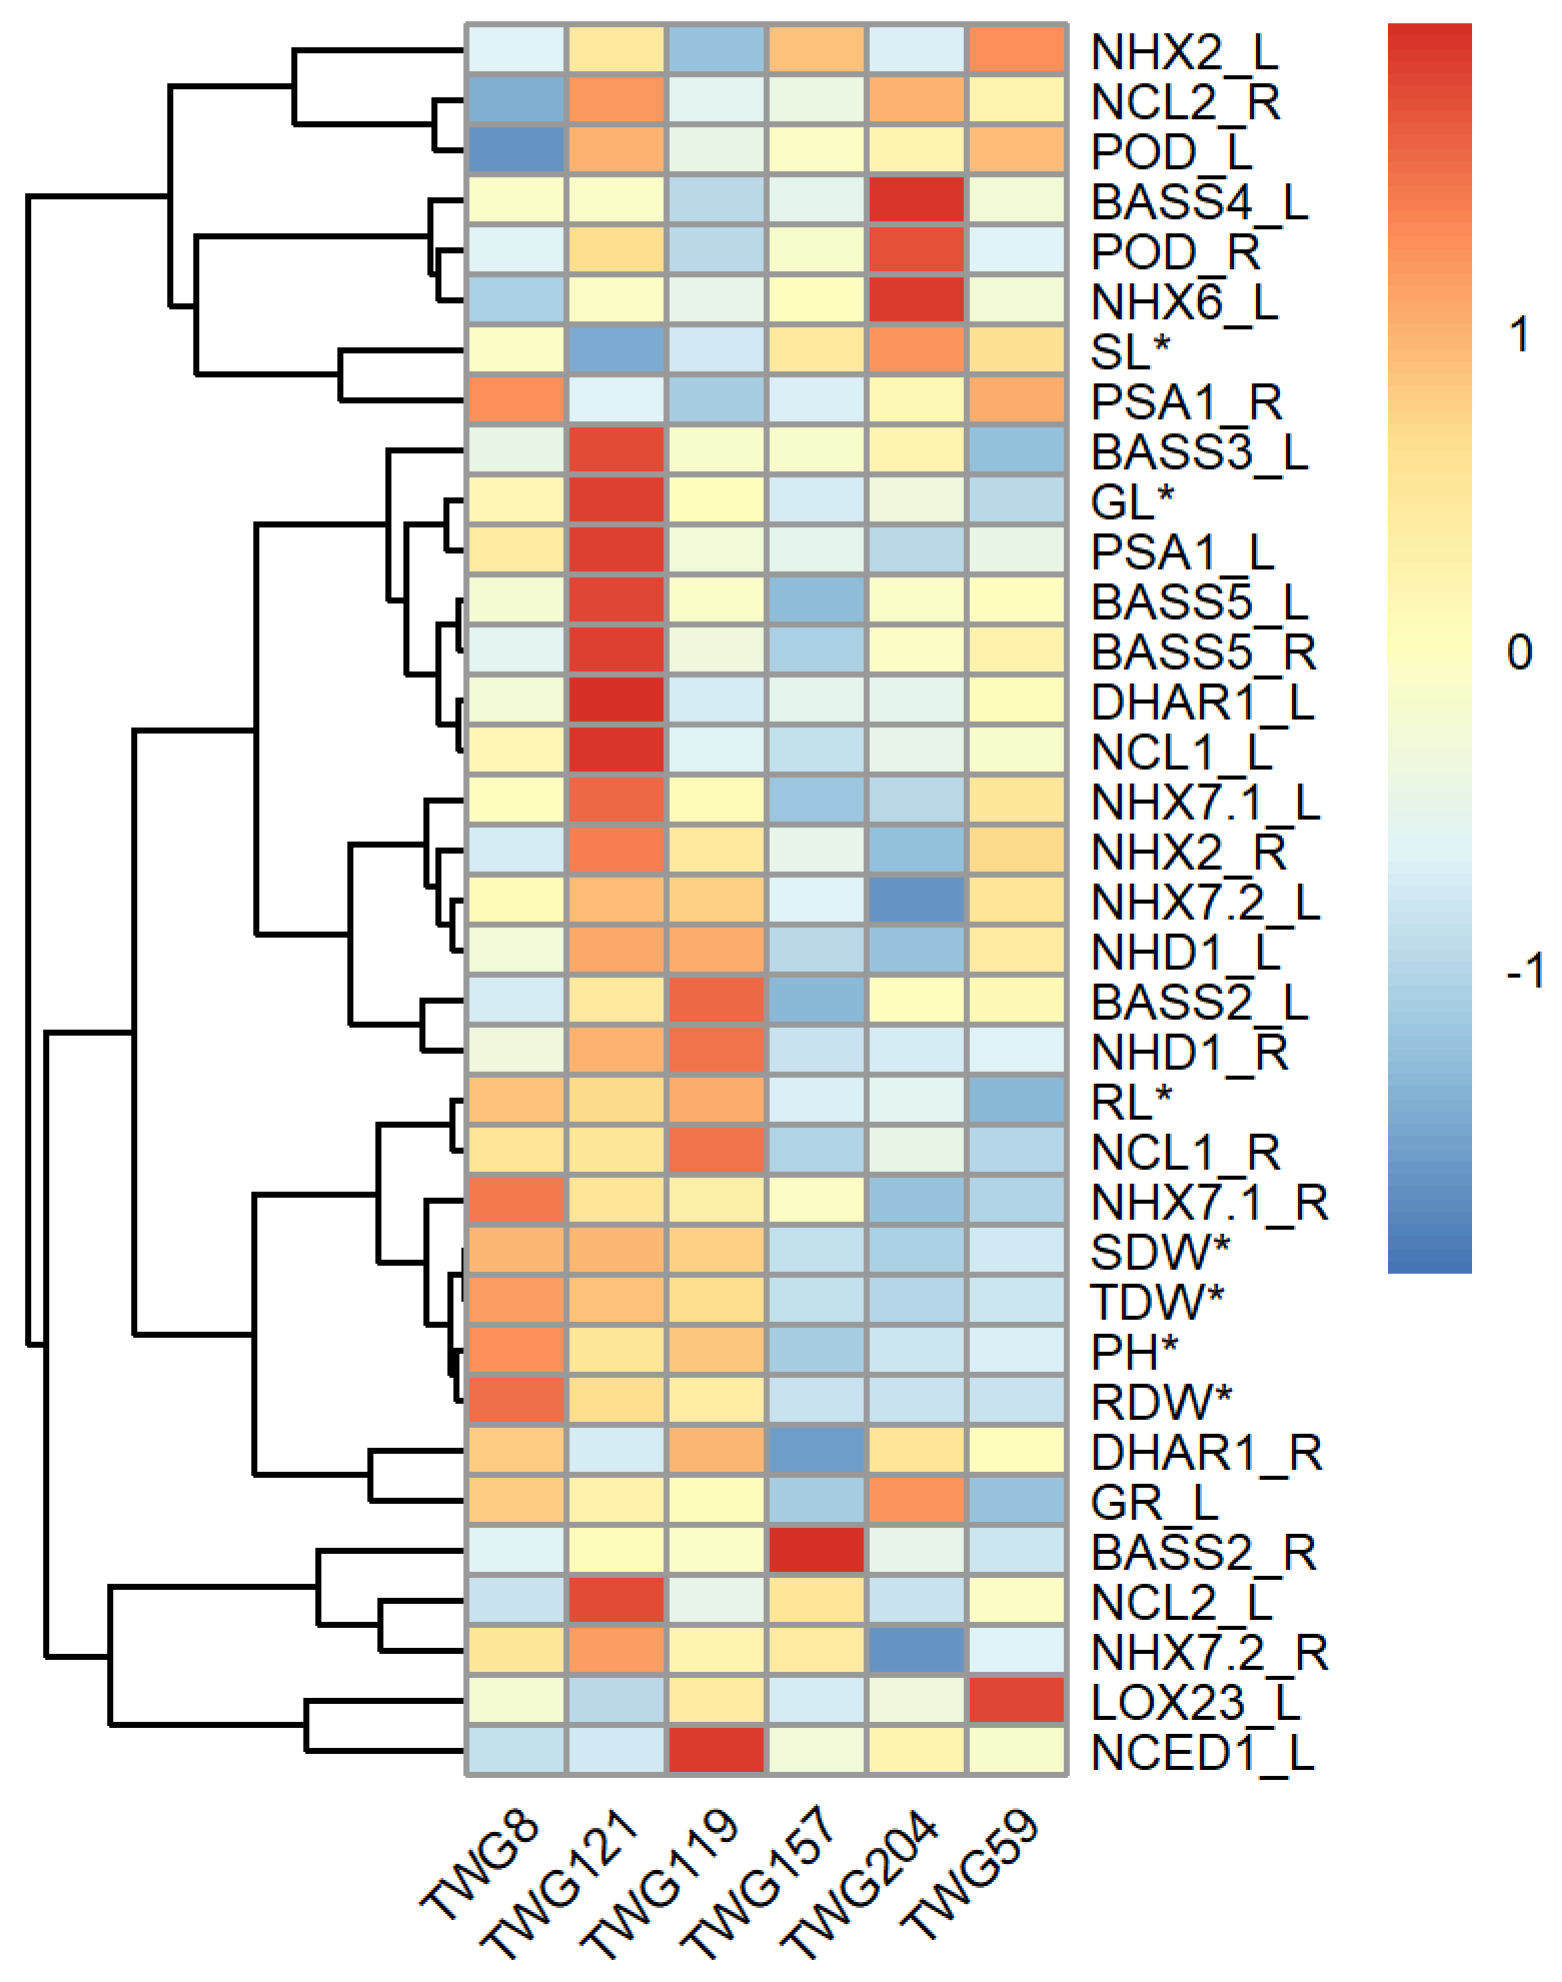
Figure 7.
The relative seedling growth traits in the Tritipyrum lines and their parents Zhongyan 1 and Xinong 6028 under salt stress relative to non-stress control. (a) Relative TFW, relative total fresh weight; (b) relative SFW, relative shoot fresh weight; (c) relative RFW, relative root fresh weight; (d) relative shoot height; (e) relative ratio of root to shoot fresh weight; (f) relative root length. Data are represented as mean ± SD. Different letters indicate that the difference was significant at p < 0.05.
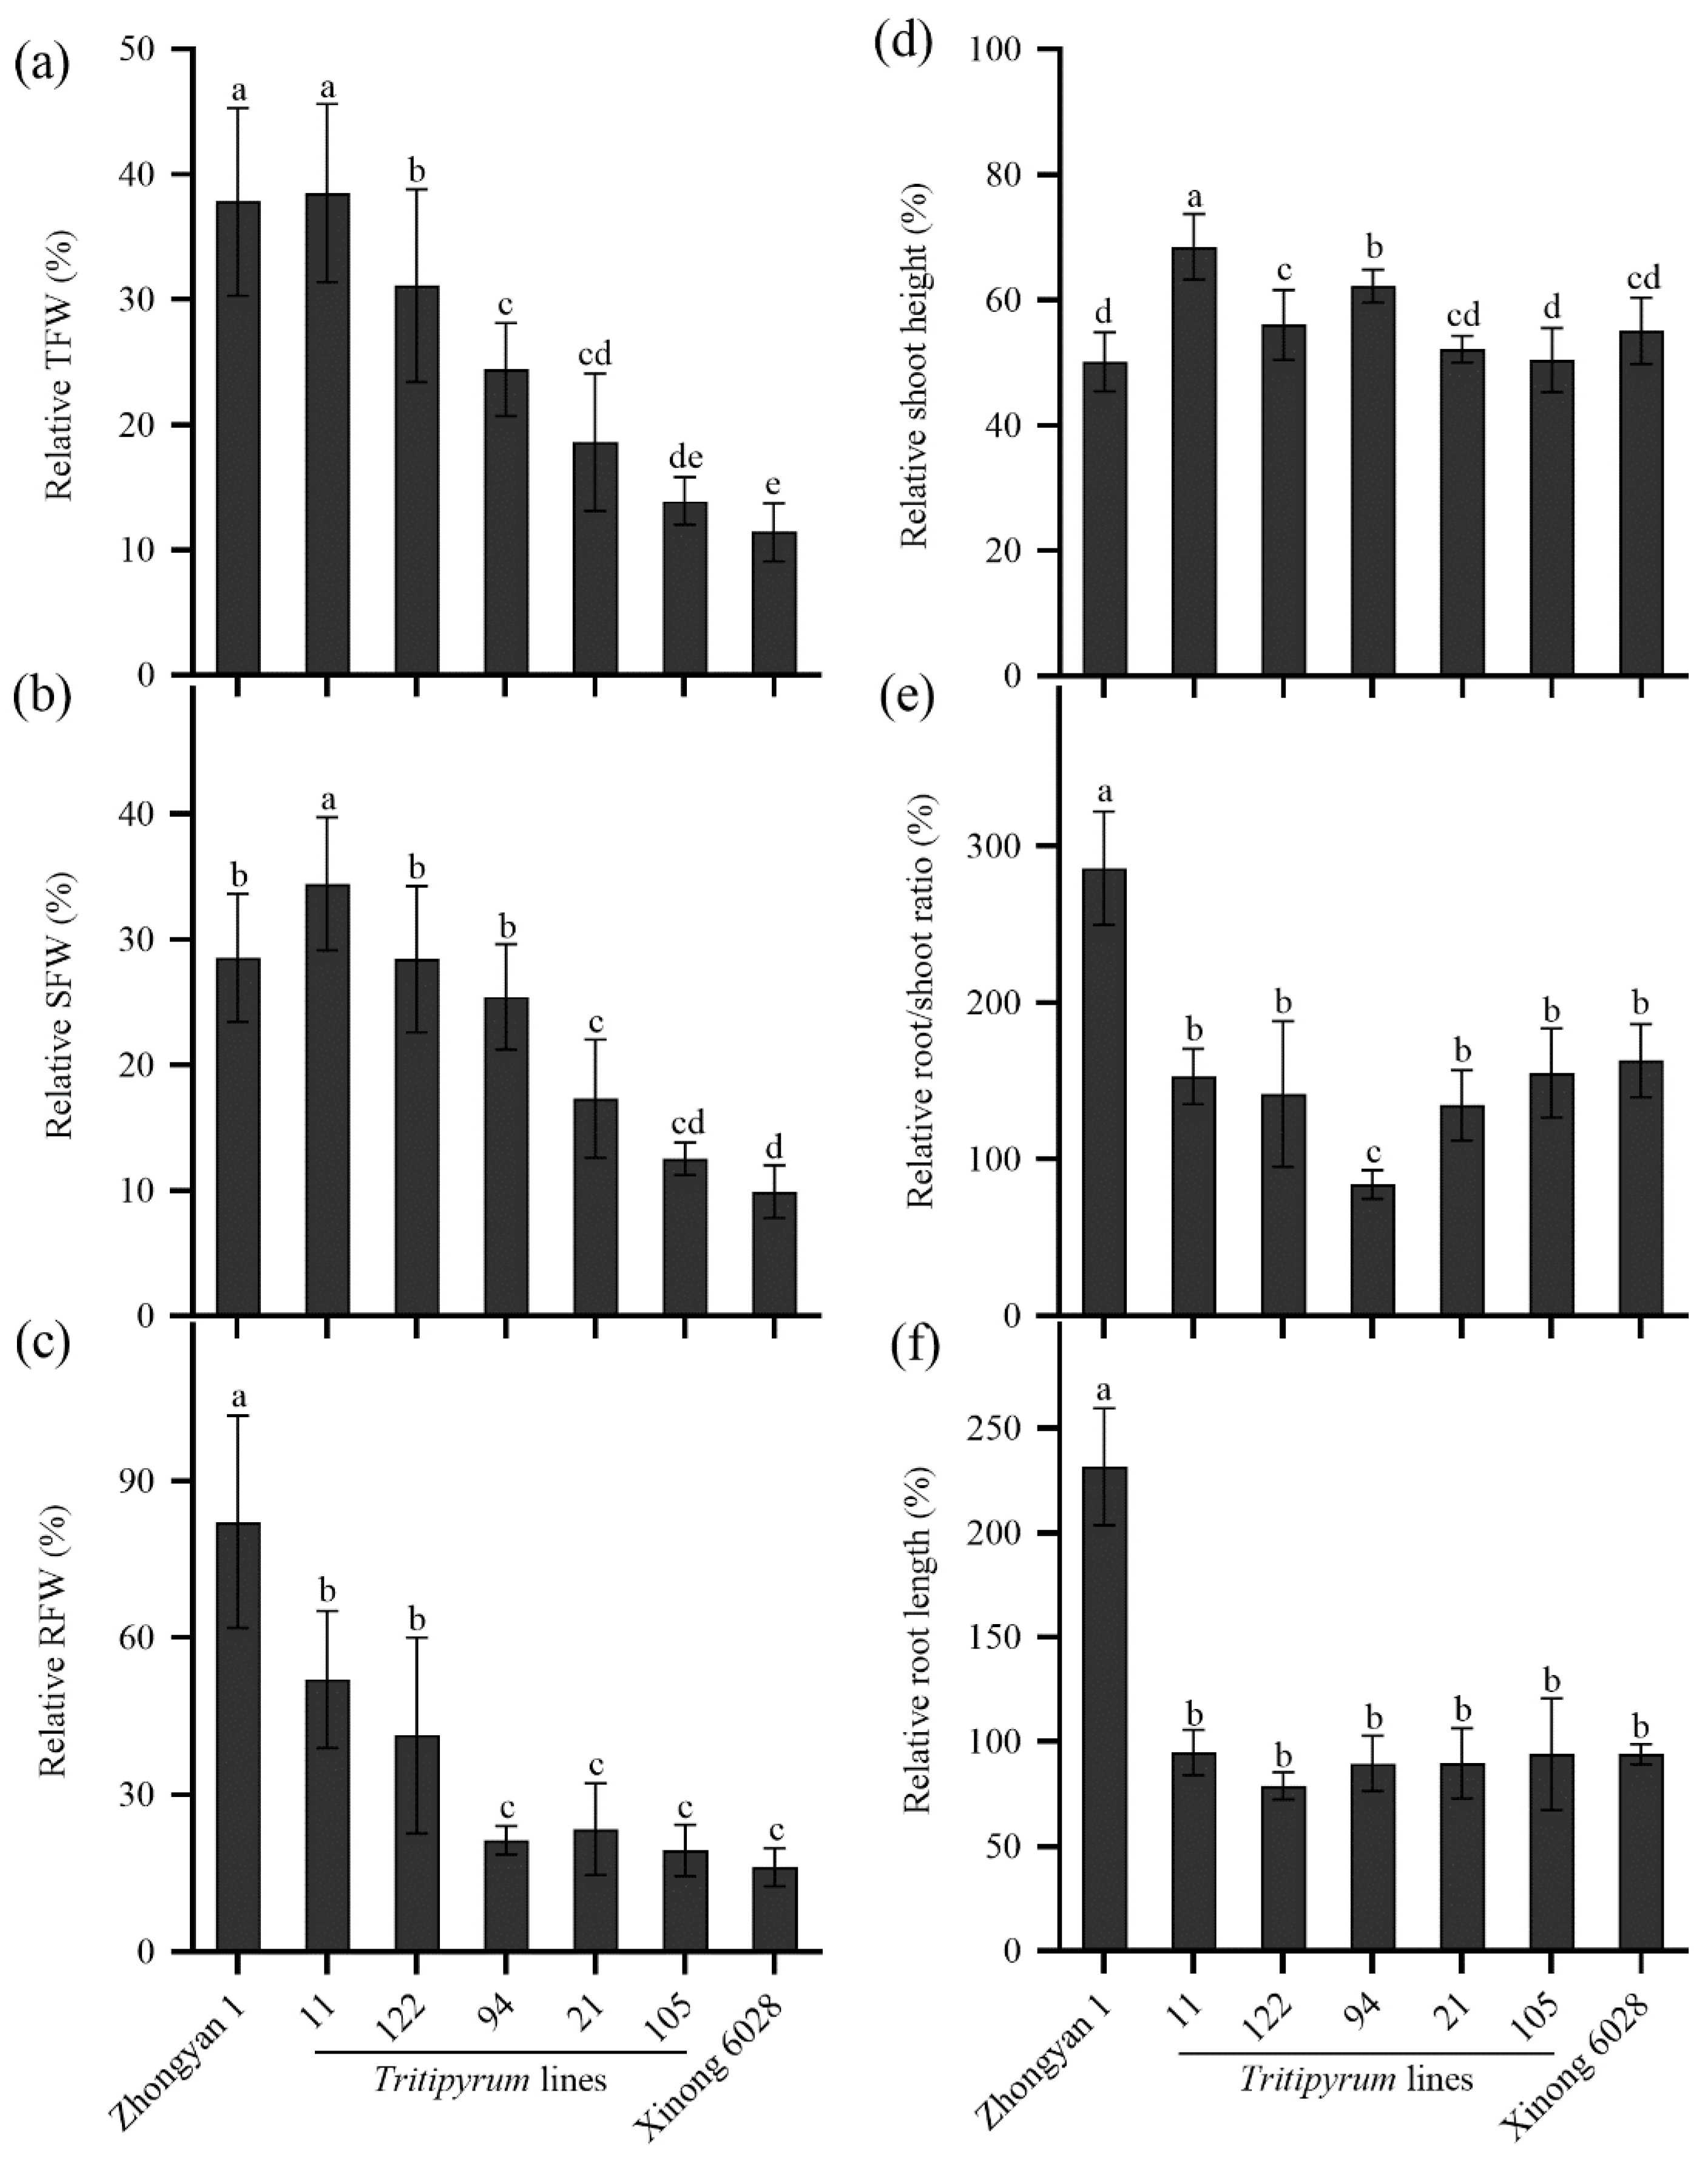
Figure 8.
Comparison of salt tolerance in tall wheatgrass line Zhongyan 1 seedlings at different age. (a) Relative total dry weight per plant (TDW) to the non-stress control; (b) percent inhibition of dry weight per plant. Data are represented as mean ± SD. Different letters indicate that the difference was significant at p < 0.05.
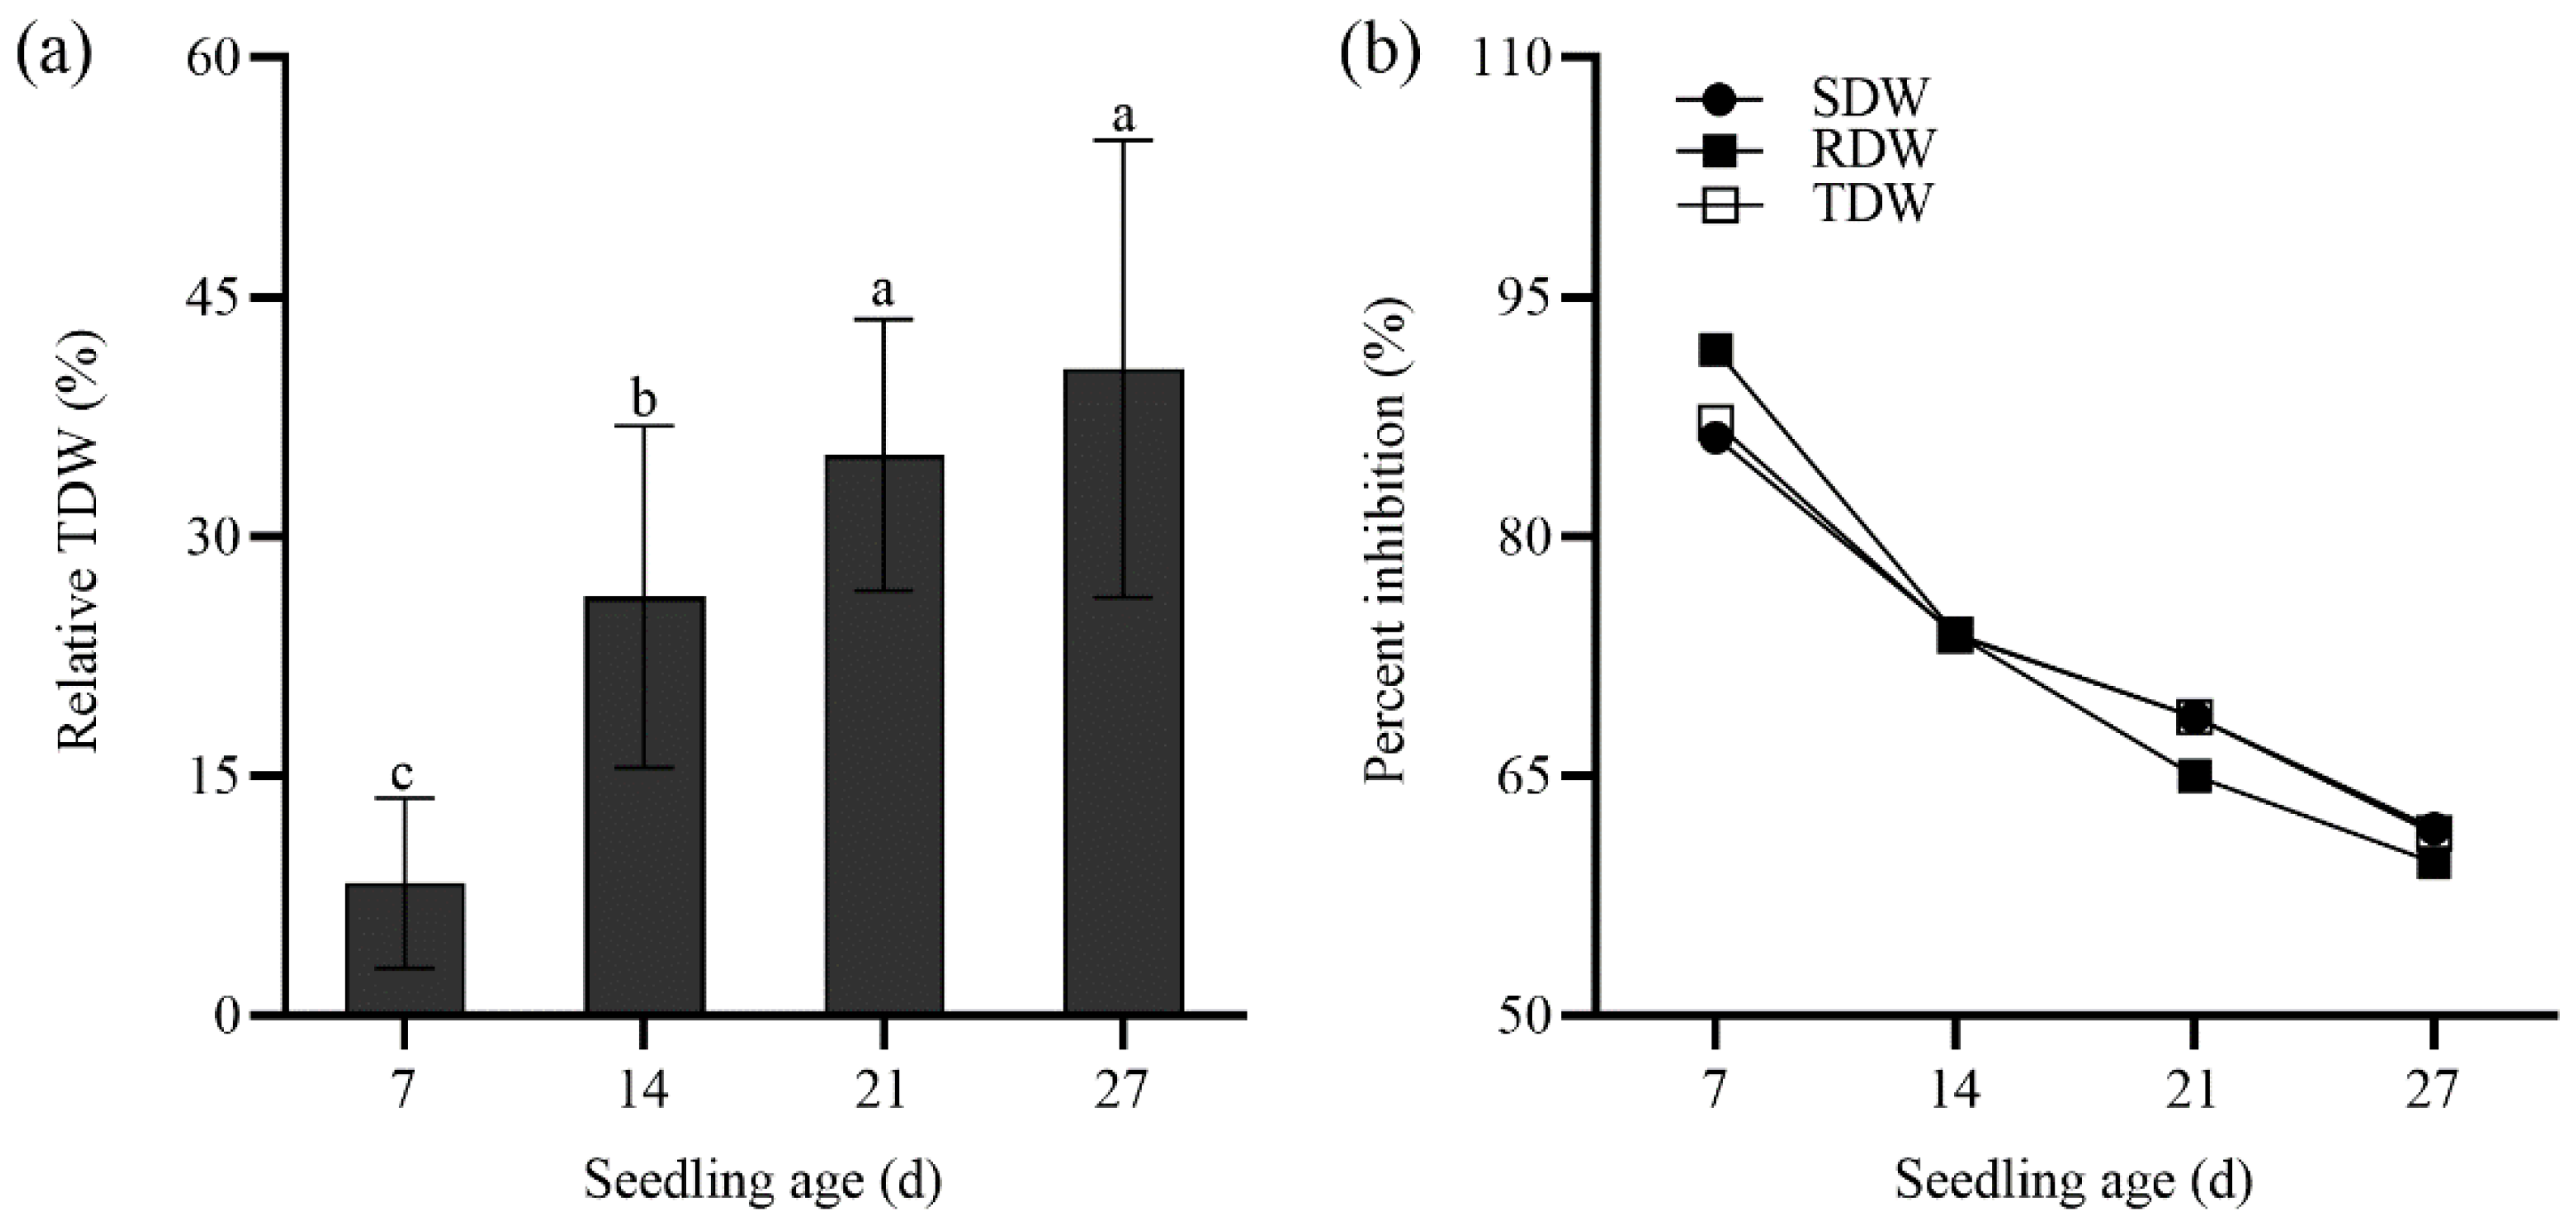

Table 1.
The sequences of gene specific primers used for qPCR in this work.
| Genes | Forward sequence | Reverse sequence | Product (bp) | Gene annotation |
| ACT4 | CTAGTGGACGCACAACAGGT | AAGGATGGCATGTGGAAGGG | 98 | Actin |
| APX4 | AGCCCAAACACACCTCAGAC | CAACGCGGATGACCCTAGAA | 80 | Probable L-ascorbate peroxidase 4 |
| BASS2 | TGAGTGTGGGATGCAGAGTT | CCATGCACACAACACTGACA | 104 | Probable sodium/metabolite cotransporter BASS2 |
| BASS3 | CGTATTGGGGAAGTGGCATG | CCCAAATGGCAGCAGAGTTT | 149 | Probable sodium/metabolite cotransporter BASS3 |
| BASS4 | GGTCATCCCATGTGTTGCTG | GTCAAGCCTCACTCGGATAGA | 157 | Probable sodium/metabolite cotransporter BASS4 |
| BASS5 | ACAGGGATGCAAAGTAGCCT | TCAGGGACATCAGCACAACT | 106 | Probable sodium/metabolite cotransporter BASS5 |
| DHAR1 | GCCTTGATGTGCTGTGGTTG | CCGCTAGCACCAAAACACAC | 116 | Probable glutathione S-transferase DHAR1 |
| ESI3 | AGCCTCGAGTGAAGTAAGCA | GAATTCCACGCCGAGTTTGT | 114 | Salt stress-induced hydrophobic peptide ESI3 |
| GPX1 | GAGTCGAGTGCTGGAGGATT | CCGCAACGAGTTTCTGGATG | 148 | Phospholipid hydroperoxide glutathione peroxidase 1 |
| GPX6 | TCGCTTCAAGGCCGAGTATC | CCACTTGATGTTGTCCCCGA | 121 | Phospholipid hydroperoxide glutathione peroxidase 6 |
| GR | AATACAGAGCTGCAACGCCT | ACCTTTCCACGGCCTTCAAT | 86 | Glutathione reductase |
| LOX23 | GACCAGCGAAACAACAACCC | CTTATCCTGGGGCCACGATC | 147 | Lipoxygenase 2.3 |
| NCED1 | TCAGACACACCAACACGTCC | CCTACCCATGCACCACTGTT | 88 | 9-cis-epoxycarotenoid dioxygenase 1 |
| NCL1 | GACCATGAACAACACGCTGT | ATGACACAGACGAGCAGGAT | 111 | Sodium/calcium exchanger-like protein NCL1 |
| NCL2 | ATCTGGTACGTGTTTCCGGT | CAGCAACACACGCGATATCA | 116 | Sodium/calcium exchanger-like protein NCL2 |
| NHD1 | TGTTCCACTTGTTGCTGCAA | TGCAGACCCGATGATAAGCA | 127 | Sodium/proton antiporter NHD1 |
| NHX1 | TTATTGTGCTGCTGTGACCA | CGACCTCCCTTTTCCATGTG | 97 | Sodium/hydrogen exchanger NHX1 |
| NHX2 | TGGTGCGATGGGGCTAATAT | GCCGAGAATATTGCCCCAAG | 84 | Sodium/hydrogen exchanger NHX2 |
| NHX6 | CCGGCAAATATCCAGGCAAT | AAATTGTCTGTCCATGGCCG | 122 | Sodium/hydrogen exchanger NHX6 |
| NHX7.1 | GGCTTGGGAAAATTGTCAGC | TCACCAAAAGCCTCCAATGC | 89 | SOS1 |
| NHX7.2 | GTTTTGGCCGTCATGACCTT | GCAAACTTTCCTGGCTGTCA | 82 | SOS1 |
| NHX8 | AGGGACGGATAAATGCAGCT | GGACACTGGACTGCAAACTG | 96 | Sodium/hydrogen exchanger NHX8 |
| POD | TTGCTCTGCCATTGTCCACA | GTCGATTGCCAACTGAACGG | 121 | Peroxidase 51 |
| PSA1 | ATCGCCTCAGGTTGACAAGA | CCTCAGGCTGTTGAACGATG | 129 | Protein short root in salt medium PSA1 |
Table 2.
The mean values of seed germination, seedling emergence and seedling growth traits in 28 tall wheatgrass lines responding to salt stress.
Table 2.
The mean values of seed germination, seedling emergence and seedling growth traits in 28 tall wheatgrass lines responding to salt stress.
| Lines | Seed germination test | RER (%) | Seedling growth test | ||||||||||||||
| RGR (%) | RDR (%) | RGI (%) | RSH (%) | RVI (%) | SFW (g) | RFW (g) | TFW (g) | SDW (g) | RDW (g) | TDW (g) | |||||||
| NaCl | Na2CO3 | NaCl | Na2CO3 | NaCl | Na2CO3 | NaCl | Na2CO3 | NaCl | Na2CO3 | ||||||||
| TWG8 | 43.5 | 28.2 | 56.5 | 71.8 | 15.0 | 11.9 | 23.5 | 18.9 | 2.2 | 0.9 | 118.5 | 0.168 | 0.100 | 0.268 | 0.036 | 0.011 | 0.046 |
| TWG216 | 50.4 | 30.7 | 49.6 | 69.3 | 18.6 | 12.7 | 29.0 | 20.0 | 4.4 | 2.7 | 96.6 | 0.104 | 0.056 | 0.160 | 0.024 | 0.008 | 0.031 |
| TWG223 | 45.6 | 44.1 | 54.4 | 55.9 | 19.7 | 18.4 | 24.7 | 25.3 | 4.2 | 3.5 | 85.7 | 0.123 | 0.085 | 0.208 | 0.026 | 0.010 | 0.036 |
| TWG86 | 45.2 | 15.9 | 54.8 | 84.1 | 17.4 | 6.8 | 31.8 | 15.6 | 5.9 | 0.9 | 96.7 | 0.152 | 0.082 | 0.234 | 0.032 | 0.009 | 0.041 |
| TWG22 | 38.5 | 13.9 | 61.5 | 86.1 | 15.2 | 5.6 | 21.9 | 13.1 | 3.2 | 0.8 | 104.9 | 0.164 | 0.092 | 0.255 | 0.035 | 0.010 | 0.045 |
| Group 1 | 44.7a | 26.6a | 55.3b | 73.4b | 17.2a | 11.1a | 26.2a | 18.6a | 4.0a | 1.8a | 100.5a | 0.142a | 0.083a | 0.225a | 0.030a | 0.009a | 0.039a |
| TWG31 | 49.6 | 10.9 | 50.4 | 89.1 | 19.6 | 4.5 | 30.2 | 9.3 | 5.9 | 0.5 | 57.0 | 0.116 | 0.055 | 0.171 | 0.023 | 0.008 | 0.031 |
| TWG90 | 48.0 | 11.2 | 52.0 | 88.8 | 17.9 | 4.3 | 26.2 | 10.2 | 5.1 | 0.3 | 54.2 | 0.140 | 0.086 | 0.226 | 0.028 | 0.009 | 0.037 |
| TWG182 | 48.6 | 11.4 | 51.4 | 88.6 | 20.1 | 4.8 | 28.3 | 8.6 | 5.3 | 0.8 | 52.9 | 0.101 | 0.063 | 0.163 | 0.023 | 0.008 | 0.030 |
| TWG48 | 39.5 | 17.1 | 60.5 | 82.9 | 19.4 | 9.3 | 21.5 | 8.0 | 4.9 | 1.0 | 60.4 | 0.085 | 0.042 | 0.126 | 0.018 | 0.005 | 0.023 |
| TWG88 | 38.6 | 8.7 | 61.4 | 91.3 | 16.1 | 4.0 | 27.4 | 6.4 | 3.8 | 0.2 | 54.0 | 0.160 | 0.093 | 0.252 | 0.035 | 0.011 | 0.046 |
| TWG30 | 48.1 | 26.7 | 51.9 | 73.3 | 21.3 | 10.4 | 37.0 | 17.5 | 6.0 | 1.5 | 64.1 | 0.139 | 0.066 | 0.204 | 0.032 | 0.009 | 0.040 |
| TWG209 | 42.1 | 36.4 | 57.9 | 63.6 | 16.6 | 14.7 | 31.9 | 30.1 | 4.8 | 4.1 | 43.0 | 0.126 | 0.076 | 0.202 | 0.028 | 0.011 | 0.039 |
| TWG214 | 42.7 | 32.1 | 57.3 | 67.9 | 16.8 | 15.6 | 27.9 | 24.7 | 4.9 | 2.5 | 39.7 | 0.116 | 0.064 | 0.179 | 0.024 | 0.007 | 0.031 |
| Group 2 | 44.7a | 19.3ab | 55.3bb | 80.7ab | 18.5a | 8.4a | 28.8a | 14.3ab | 5.1a | 1.4ab | 53.2b | 0.123ab | 0.068a | 0.190ab | 0.026ab | 0.009a | 0.035ab |
| TWG9 | 34.3 | 5.7 | 65.7 | 94.3 | 14.3 | 2.7 | 15.3 | 2.1 | 4.2 | 0.1 | 20.3 | 0.142 | 0.083 | 0.224 | 0.029 | 0.009 | 0.038 |
| TWG15 | 29.9 | 16.8 | 70.1 | 83.2 | 10.4 | 6.3 | 18.0 | 15.6 | 2.1 | 0.9 | 44.6 | 0.089 | 0.055 | 0.144 | 0.021 | 0.007 | 0.028 |
| TWG65 | 9.9 | 3.3 | 90.1 | 96.7 | 4.2 | 1.2 | 9.6 | 2.2 | 0.4 | 0.0 | 50.3 | 0.122 | 0.071 | 0.192 | 0.025 | 0.007 | 0.032 |
| TWG105 | 15.2 | 11.6 | 84.8 | 88.4 | 5.4 | 4.9 | 11.0 | 13.3 | 0.3 | 0.7 | 16.5 | 0.138 | 0.079 | 0.218 | 0.030 | 0.011 | 0.040 |
| TWG106 | 13.8 | 2.3 | 86.2 | 97.7 | 5.8 | 1.0 | 10.0 | 1.1 | 0.6 | 0.0 | 22.8 | 0.110 | 0.067 | 0.177 | 0.023 | 0.007 | 0.029 |
| TWG164 | 18.4 | 5.7 | 81.6 | 94.3 | 7.4 | 2.3 | 18.6 | 5.4 | 1.4 | 0.2 | 22.2 | 0.108 | 0.063 | 0.171 | 0.023 | 0.008 | 0.030 |
| TWG180 | 15.8 | 18.7 | 84.2 | 81.3 | 6.3 | 8.0 | 10.6 | 14.1 | 0.8 | 1.0 | 28.1 | 0.127 | 0.086 | 0.212 | 0.027 | 0.009 | 0.035 |
| TWG185 | 13.9 | 10.2 | 86.1 | 89.8 | 5.1 | 4.2 | 11.0 | 10.5 | 0.6 | 0.4 | 30.5 | 0.115 | 0.048 | 0.163 | 0.023 | 0.006 | 0.028 |
| TWG186 | 26.3 | 1.7 | 73.7 | 98.3 | 9.5 | 0.6 | 17.3 | 2.0 | 1.5 | 0.0 | 12.6 | 0.116 | 0.062 | 0.177 | 0.025 | 0.008 | 0.032 |
| TWG213 | 27.3 | 16.4 | 72.7 | 83.6 | 10.2 | 6.2 | 19.8 | 12.1 | 2.1 | 0.7 | 9.3 | 0.097 | 0.054 | 0.151 | 0.021 | 0.008 | 0.029 |
| Group 3 | 20.5b | 9.2b | 79.5a | 90.8a | 7.9b | 3.7b | 14.1b | 7.8b | 1.4b | 0.4b | 25.7c | 0.116b | 0.067a | 0.183b | 0.025b | 0.008a | 0.032b |
| TWG52 | 68.5 | 58.7 | 31.5 | 41.3 | 28.1 | 28.0 | 42.4 | 31.5 | 11.8 | 7.6 | 92.6 | 0.137 | 0.083 | 0.219 | 0.028 | 0.010 | 0.038 |
| TWG70 | 67.7 | 40.0 | 32.3 | 60.0 | 30.9 | 18.5 | 32.0 | 22.1 | 10.9 | 3.9 | 103.7 | 0.093 | 0.055 | 0.148 | 0.022 | 0.009 | 0.031 |
| TWG40 | 50.6 | 8.0 | 49.4 | 92.0 | 20.7 | 3.1 | 22.2 | 1.5 | 5.7 | 0.0 | 82.8 | 0.113 | 0.067 | 0.180 | 0.028 | 0.010 | 0.037 |
| TWG157 | 64.9 | 2.1 | 35.1 | 97.9 | 29.2 | 1.0 | 26.2 | 1.1 | 8.4 | 0.0 | 108.7 | 0.122 | 0.079 | 0.201 | 0.027 | 0.014 | 0.041 |
| TWG206 | 27.7 | 48.2 | 72.3 | 51.8 | 9.5 | 20.3 | 15.4 | 24.3 | 1.2 | 4.6 | 24.1 | 0.123 | 0.052 | 0.174 | 0.026 | 0.006 | 0.032 |
Notes: The seed germination test was carried out in 250 mM NaCl and 100 mM Na2CO3 for 9 d while the seedling emergence test was carried out in 250 mM NaCl for 10 d. In addition, the seedling growth test was conducted with 300 mM NaCl for 15 d. RGR, relative seed germination rate; RDR, relative salt damage rate; RGI, relative seed germination index; RSH, relative shoot height; RVI, relative vigor index; RER, relative seedling emergence rate; SL, the number of senescent leaves; GL, the number of green leaves; SFW, shoot fresh weight; RFW, root fresh weight; TFW, total fresh weight; SDW, shoot dry weight; RDW, root dry weight; TDW, total dry weight; R/S, the ratio of root to shoot dry weight.
Disclaimer/Publisher’s Note: The statements, opinions and data contained in all publications are solely those of the individual author(s) and contributor(s) and not of MDPI and/or the editor(s). MDPI and/or the editor(s) disclaim responsibility for any injury to people or property resulting from any ideas, methods, instructions or products referred to in the content. |
© 2025 by the authors. Licensee MDPI, Basel, Switzerland. This article is an open access article distributed under the terms and conditions of the Creative Commons Attribution (CC BY) license (http://creativecommons.org/licenses/by/4.0/).
Copyright: This open access article is published under a Creative Commons CC BY 4.0 license, which permit the free download, distribution, and reuse, provided that the author and preprint are cited in any reuse.


