
Submitted:
24 February 2025
Posted:
25 February 2025
You are already at the latest version
Abstract
This study presents an application of Boruta-SHapley Additive ExPlanations (Boruta-SHAP) for geotechnical characterization using Measure-While-Drilling (MWD) data, enabling a more interpretable and statistically rigorous assessment of feature importance. Pit-scale Measure-While-Drilling (MWD) data was used to characterize geotechnical properties via regression-based algorithms. In contrast to previous studies using MWD data to recognize rock type using Principal Component Analysis (PCA), which only identifies the directions of maximum variance, Boruta-SHAP quantifies the individual contribution of each MWD parameter. This method ensures interpretable and reliable geotechnical characterization as well as robust feature selection by comparing predictors against randomized ‘shadow’ features. The Boruta-SHAP analysis revealed that bit air pressure and torque-to-penetration ratio were the most significant predictors of rock strength, contradicting previous assumptions that rate of penetration was the dominant factor. Moreover, feature importance was conducted for fracture frequency and Geological Strength Index (GSI), a rock mass classification system. Boruta-SHAP A comparative analysis of prediction performance was also performed using a range of different machine learning algorithms that resulted in strong coefficient of determinations of actual field or laboratory results versus predicted values. The results are plausible, confirming that MWD data could provide a high-resolution description of geotechnical conditions prior to mining leading to a more confident prediction of subsurface geotechnical properties. Therefore, the fragmentation from blasting as well as downstream operational phases, such as digging, hauling, and crushing, could be improved effectively.
Keywords:
Measure-While-Drilling (MWD)
; Artificial Intelligence (AI)
; Machine Learning (ML)
; Geotechnical Engineering
; Rock Mass Characterization
; Boruta-SHAP
; Feature Importance
; Orebody Knowledge
; Slope Stability
1. Introduction
Geotechnical characterization provides information about the conditions of the rock mass, such as the type of rock, geomechanical properties, average ore grade, ore boundary, etc. This data is essential for mine planning, fragmentation optimization, and equipment selection to achieve efficient mineral extraction. The most used systems include Geological Strength Index (GSI), Q-System (Q), Rock Mass Rating (RMR) and Rock Quality Designation (RQD) [1,2,3,4]. These rock mass characterization systems describe the mechanical and structural characteristics of the rock through logging diamond drill core and laboratory testing, respectively [5]. However, determining geotechnical conditions via diamond core drilling is costly and destructive to the rock core [6]. In addition, the limited core samples obtained via diamond drilling do not provide a representative description of a complex rock mass on the scale of a pit in a surface mine [7,8]. Consequently, an economic technique with widespread data capture is necessary to characterize geotechnical conditions in high resolution.
Measure-While-Drilling (MWD) is a well-known drill monitoring technology that originated in the petroleum industry and was adopted in the 1970s for open pit mining blast hole drilling systems [9]. This technique involves equipping a blast hole drill rig with MWD sensors that collect drilling data that can be used to assess subsurface penetration performance [10]. Because of the continuous nature of drill and blast cycles for excavation in open-pit and underground mining, construction and tunnelling environments, enormous quantities of MWD datapoints are collected from blast rigs [11,12,13]. More specifically, in the open pits examined in this paper, a single, productive blast rig at an open-pit iron ore mine may generate around 10,000 MWD observations per day. Many major iron-ore mines employ around over a dozen simultaneously operating blast drills, resulting in hundreds of thousands of drilling response datapoints every day [14].
Due to this sheer volume of data to be analyzed and the complicated, multivariate, as well as nonlinear responses between the drill responses and subsurface composition, advanced analytical techniques, such as Machine Learning (ML), have been applied on MWD datasets across multiple excavation industries, including open pit mining, underground mining, and tunnelling [15]. Research on open pit mining applications of MWD data has generally focused on rock type recognition to improve fragmentation from blasting [9,14,16,17,18,19,20,21,22,23,24,25]. In contrast, few reports have applied analytical methods on MWD responses to determine changing subsurface geophysical [26] and geochemical conditions [24,27]. In underground excavations, rock type recognition from MWD data can assist decision making for placement of ground support equipment to reduce strata failure in underground metalliferous mining [12,28,29,30,31,32,33], underground coal mining [34,35,36] and tunnelling [22,37,38,39,40,41,42,43]. In summary, each industry uses rock type recognition from MWD data for various purposes.
Nevertheless, the dominant output across all excavation industries using MWD data is the classification of rock types often using univariate methods, which is useful to delineate lithological boundaries. These broad classifications of contrasting rock types, such as BIF and shale, may improve blasting around rock type contacts [25,44,45]. However, general rock type recognition does not characterize geotechnical conditions in enough detail to optimize open pit blasting within a particular geological unit. Despite an exhaustive search, no studies were identified that aimed to investigate the relationship between MWD data and geotechnical properties, such as rock strength and fracturing, rather than rock type recognition [15]. Additionally, no studies were found that utilized an appropriate method to evaluate the feature importance of multivariate MWD features in predictive modelling of the geotechnical conditions.
A common approach in prior studies has been the use of Principal Component Analysis (PCA) to assess feature importance in MWD datasets [25,28,31]. PCA is a well-established dimensionality reduction technique that identifies orthogonal principal components explaining the greatest variance in data [46]. However, PCA is not inherently designed for feature importance ranking; instead, it highlights directions of maximum variance amongst all features, some of which may not correspond to the most predictive features for geotechnical conditions. This fundamental limitation can lead to misleading interpretations, as PCA-derived components often mix multiple variables and fail to preserve the individual explanatory power of each MWD parameter [7].
Existing methods for geotechnical characterization using MWD data lack a rigorous feature selection framework. To address this gap, our study employs Boruta-SHapley Additive ExPlanations (Boruta-SHAP), a game-theoretic approach that quantifies the contribution of each feature to a model’s predictions that has been used in other mining areas, such as metallurgy [47,48]. Boruta-SHAP was applied to determine the most influential MWD parameters for geotechnical property prediction. Previous studies have relied on PCA or simple correlation metrics, which fail to account for feature interactions and non-linear dependencies. Boruta-SHAP, on the other hand, provides a mathematically robust measure of feature importance, ensuring transparency and reliability in model interpretation. By using this method, we ensure that only statistically significant variables are retained, providing a principled approach to feature selection that has not been previously applied to MWD data.
While prior research has identified relationships between MWD parameters and geotechnical categorical properties [49], this study goes further by using Boruta-SHAP to quantify feature contributions and to eliminate spurious correlations. By integrating Boruta-SHAP-based feature importance analysis with advanced ML models—including Decision Trees (DT), Support Vector Machines (SVM), Random Forests (RF), Gaussian Process Regression (GP), and Neural Networks (NN)—this study establishes a high-resolution framework for predicting subsurface geotechnical properties to provide a data-driven, interpretable, and scalable framework for integrating MWD technology into mine geotechnical workflows, ultimately enhancing decision-making for excavation and resource management.
2. Methods
The data used in this paper are the same as in Goldstein et al. [27,49,50] which aimed to predict wireline geophysical measurements, geochemical assay values and geotechnical categories from the same MWD dataset. For the sake of self-completeness, the site and data are briefed as below:
2.1. Mine Site Geotechnical Data
The Pilbara region in Western Australia is Australia’s primary supplier of iron-ore, producing 874 million tons in 2021 [51]. The Marra Mamba Formation and Brockman Formation of the Hammersley Group were the deposits analyzed in this study, as they are the greatest sources of economic Pilbara iron ore [52]. Both Formations consist of extensive sequences of mineralized Banded Iron Formation (BIF) interlayered with shale bands that were deposited about 2.5 billion years ago [53]. The Marra Mamba Formation is contained within the Mount Newman Member and is overlain by the shale dominated West Angelas Member. The Brockman Formation consists of mineralized Dales Gorge BIF and shales.
Two pits were selected for this study, with each pit’s geology representing the Marra Mamba and Brockman Formations, respectively. Each pit’s geotechnical were characterized by exploration drilling data. The Brockman Pit (BR) contained 12 diamond cored holes totaling 1,089 meters at an average depth of 90m per hole. The Marra Mamba Pit (MM) consisted of 14 diamond cored holes totaling 1,431 meters at an average depth of 102m per hole. The exploration data from the BR and MM diamond cored holes consisted of laboratory results for Unconfined Compressive Strength (UCS; measured in MPa) to approximate rock strength, field observed fracture frequency logs (FPM; measured in fractures per meter) and several rock mass classification systems scored by the logging geotechnical engineer, including GSI, Q, RMR and RQD. The exploration dataset has been scrutinized in the mining company’s Quality Assurance and Quality Control (QA/QC) process and does not require further data engineering.
For the present analysis, rock strengths, fracture frequencies and rock mass classification system scores were considered. Rock strength (UCS) is measured from laboratory testing of diamond drilled core samples. Fracture frequency (FPM) is recorded from counting naturally occurring discontinuities of diamond drilled core. Scores from a rock mass classification system (GSI), operate as an index of the rock’s mechanical and structural properties. GSI scores were determined from field observations and laboratory test findings and were the only reported rock mass classification system.
2.2. Mine Site MWD Systems and Data
22 rotary blast hole rigs equipped with tricone Tungsten Carbide Insert bits acquired MWD data for this study. Ten Atlas Copco (Epiroc) PV271 rigs, two Terex SKS 12 rigs, one Bucyrus SKS 13 rig, and two Sandvik 460 rigs were employed to drill production blast holes with a 0.229m hole diameter (Figure 1a). For 0.165m wall control blast holes, one Cubex QXR 920, one Sandvik 560, and five Atlas Copco (Epiroc) D65 drill rigs were used (Figure 1b). The bench height in the investigated iron-ore pits averaged 10 meters, while the sub drilling was approximately 2 meters below the bench floor. The burden and spacing of the production blast holes averaged 7 meters and 8 meters, respectively.
The MWD system on the drills at the iron-ore mines monitored the rate of penetration (rop; m/s), the torque or rotary pressure (tor; Nm), the force on bit (fob; kgf), also known as weight on bit, thrust or pulldown pressure, the bit air pressure, or flushing air medium (bap; kgf/cm), and the rotary speed (rpm). Due to the instability of the onboard sensor, less than 25 percent of sample points included rpm. This uneven data collection led to the elimination of rpm as a drilling parameter in this study. Metrics for MWD were collected by a combination of rigs operated by onboard workers and semi-autonomous equipment remotely managed by an off-site Operations Centre. The drilling system recorded the MWD time-series data at approximately 0.1 m intervals along the depth of the blast hole.
The MWD data used in this study originated from two pits in different geological environments: the BR pit’s dataset contained 75,470 blast holes totaling 844,855 meters, while the MM pit’s dataset had 18,887 holes totaling 208,707 meters. For this investigation, the MWD data from 2 m below the hole collars to the bottom of the blast holes were analyzed. The reason for choosing this depth is that the first two meters of the borehole may not be typical of the rock mass characteristics since this region was likely impacted by the toe charge during blasting of the prior bench and is likely to not be representative of in situ geotechnical properties. This hole collar filtering resulted in 4,486 and 3,239 datapoints for BR and MM, respectively.
2.3. MWD Data Pre-Processing
Due to the heterogenous nature of rock, the drill rig control system, and external factors affecting MWD responses, production MWD data contains unrealistically high and poor performance values [54]. As a result, these variables can result in an inaccurate measurement and an incorrect interpretation of geotechnical properties [55]. Consequently, the mining MWD dataset examined in this paper contains a high ratio of noise to signal that is typical of MWD data. Such noise could be the result of sensor anomalies, operational inconsistency or geomechanical irregularities. To ensure robust analysis, a structured data preprocessing workflow was applied, addressing noise filtration, feature engineering, and data validation.
Since these noisy MWD datapoints in this paper have not been thoroughly examined in any QA/QC process, they require feature engineering in preparation for use in later experiments. The MWD data was first cleaned by removing the initial 2 meters of each blast drillhole which may not represent the in situ rock mass for two reasons: 1) the effects of collaring at the beginning of a hole so that the hole remains open, and 2) inclusion of data points with blast damage from the bottom of the last bench’s holes. Then, all blasthole data points in which the rop, tor, fob, or bap were negative were eliminated. Next, missing MWD data points were filled using linear interpolation with the quartile detection method and a threshold factor of 1.5. To limit the localized influence of noise, the blast hole data was subsequently smoothed using a Gaussian filter with a smoothing factor of 0.3. While alternative methods are available, a Gaussian filter was selected as the optimal approach, balancing noise reduction, computational efficiency, and geological signal retention.
Both the MWD and exploration drill datasets were converted from drillhole interval formats to point data, consisting of the geospatial coordinates of each data point and the corresponding values from the relevant dataset. The exploration geotechnical hole point data was calculated utilizing downhole wireline logged desurvey data that recorded the azimuth and dip of each hole at every 10 meters until the end depth. The blast hole MWD data were not desurveyed due to the production nature of the holes and the calculation of point locations assumed of straight holes from the hole collar. The two datasets were then combined using a K-Nearest Neighbor distance-based search algorithm that determines the distance between each point. To facilitate supervised ML, each geotechnical drilling data point was queried and matched with the closest MWD data point. The results were then filtered to only include points that were within three-dimensional proximity.
2.4. Feature Engineering - MWD Variables
Accurate prediction of geotechnical properties from MWD data requires careful selection of input variables. While prior studies have primarily relied on raw MWD parameters (rop, tor, fob, bap) for rock type classification, this study investigates the role of engineered features, particularly ratio-based and moving standard deviation (MSD) features, in improving predictive performance for UCS, FPM, and GSI. Geotechnical properties such as rock strength and fracture density are influenced by multi-variable interactions rather than single metrics. For example, interactions between fob and capture drill resistance variations across different lithologies.
The MWD values that were derived from the cleaned MWD data are shown in Table 1. Derived variables included ratios of the four original variables (such as the rate of penetration divided by the torque, labelled as roptor) and a moving standard deviation across 0.5m for the four original variables (e.g., the moving standard deviation for the rate of penetration is ropS). Due to the fragility of the onboard sensor, rotary speed (rpm) was unavailable for the majority of blastholes and hence was not included in the analysis. The Specific Energy of Drilling (SED) could not be estimated and was also omitted from the analysis due to the absence of rotary speed [56].
It is also important to evaluate whether additional engineered MWD features would strengthen the prediction performance of regression-based ML models. To do this, the NN method was used to compare the performance of only Measured data with additional Engineered data (Measured plus ratios and MSD). A preliminary investigation was conducted using the NN method to determine if additional engineered MWD features would strengthen the prediction performance of regression-based ML models. Two feature sets were evaluated, including the Measured (rop, tor, fob and bap) and Engineered (Measured plus ratios and MSD).
The results of this comparison (Table 2) demonstrate all models performed better with the Engineered features, increasing R² by 10–40% and reducing RMSE by up to 40%. The improvement was particularly notable in MM, where geological heterogeneity made raw features less effective. The decision was made to incorporate all Measured and Engineered MWD features in all the investigated predictive ML models.
2.5. Feature Importance –Boruta-SHAP
In contrast to the commonplace practice of using PCA on MWD data, this study utilized a deliberate feature importance methodology to establish the relative importance of each MWD variable on the various geotechnical values. Boruta-SHAP is derived from cooperative game theory, where the contribution of each feature is computed as the marginal contribution across all possible feature subsets.[47]. It assigns each feature an importance score based on Shapley values, which quantify the average contribution of a feature across all possible combinations of features.
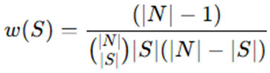
The Boruta-SHAP framework ensures consistency and local accuracy, making it a robust method for feature importance analysis. The Kernel-SHAP method was used, as it is computationally efficient for low-dimensional data, and defined by the objective function as:
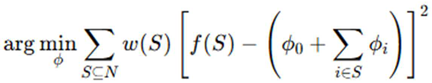 where ϕ0 is the baseline SHAP prediction (expected model output with no features), ϕi is the SHAP value for feature i, f(S) is the model prediction using only subset S, N is the total number of features and w(S) is the Shapley kernel weight, computed as:
This weight ensures that smaller feature subsets receive appropriate consideration. The SHAP value for a feature xi was computed as:
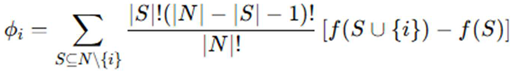 where f(S∪{i}) is the model prediction after adding feature i [57].
Boruta-SHAP was used to evaluate feature significance and creates shadow features by randomly permuting each feature:
 where Xi is the original feature, Xshadow,I is the corresponding shadow feature (randomized version). Shuffling ensures that shadow features have no relationship to the target variable. The dataset is then augmented to include both original and shadow features [58]:

SHAP values were computed using the shapley function from the MATLAB Statistics and Machine Learning Toolbox using default hyperparameters and no optimization [59].
Unlike PCA, which assumes linear relationships, Boruta-SHAP can handle complex, nonlinear interactions between drilling parameters and rock properties. PCA has been utilized to estimate the feature importance of MWD measures for geotechnical qualities in a variety of excavation contexts [25,28,31]. However, such use is incorrect since PCA is not specifically designed for the purpose of feature importance. Instead, the method identifies the underlying structure in a high-dimensional dataset and projects it onto a lower-dimensional space. This dimensionality-reduction technique is accomplished by determining the principal components, which are linear combinations of the original attributes that capture the most data variance [7]. However, the most varied features are not necessarily the most important. PCA is not a statistically adequate strategy for selecting features, and the PCA-based feature importance conclusions from MWD data do not corroborate one another [15,27,49,50].
2.6. Regression-based ML Methods
Regression-based ML algorithms, such as DT, SVM, RF, GP NN, have been used in many applications to solve geotechnical engineering problems [60]. Using the most informative characteristics, DT divide the data into smaller subsets via recursion [61]. They can capture nonlinear interactions although may be susceptible to overfitting if not pruned properly. SVM attempt to identify the hyperplane that maximally separates data into classes [62]. Using a kernel method, they are effective for high-dimensional data and can handle nonlinear relationships. RF are a collection of DT that mix various models to enhance performance and minimize overfitting [63]. They can represent nonlinear relationships and are less susceptible to overfitting than individual DT. GP models the output variable as a Gaussian distribution and searches for the function that best matches the data [64]. This method captures nonlinear interactions and delivers a probabilistic output estimate. Finally, NN are a flexible, nonlinear model composed of layers of interconnected neurons based upon the human brain [65]. They may capture complex correlations and are excellent for high-dimensional data. However, if not adequately regularized, they are susceptible to overfitting.
This study compared the predictive performance of the DT, SVM, RF GP and NN algorithms on MWD data for predicting geotechnical conditions. A Pawsey Supercomputer Nimbus cloud Ubuntu instance with 8 vCPUs and 32GB RAM performed the computations. The Regression Learner Toolbox in MATLAB, was used with default hyperparameters and no optimization for each respective regression-based ML method to generate models and assess prediction performance [66].
A 10-fold cross-validation technique revealed the training dataset’s prediction strength. Datasets were split into 80% Training and 20% Testing. Testing results reported in Root Mean Square Error (RMSE) and R2 being the average of the 10 folds during cross validation were calculated as follows to compare findings:
where:
R2 = coefficient of determination
RSS = sum of squares of residuals
TSS = total sum of squares
N = the number of samples
= the measured value,
= the predicted value
= the mean value.
3. Results
This section presents the SHAP-based feature importance analysis, including the Boruta-SHAP variable selection process, and the predictive performance of regression-based machine learning models.
3.1. MWD Exploratory Data Analysis
Initially, a statistical analysis was conducted for the rop, tor, fob and bap MWD variables collected by sensors on the drill rigs in both BR and MM pits. The rop followed a right-skewed distribution in both BR and MM (Figure 2a and Figure 3a). The similar skewness in both Formations suggests variable penetration resistance, likely due to bit wear, operator variability, and changing rock properties along the borehole. tor follows a normal distribution in both the normal distributions, indicating consistent torque requirements, likely because torque is automatically regulated based on drilling conditions, resulting in a more stable response (Figure 2b and Figure 3b)
Key differences in MWD variables emerged between the BR and MM Formations in the fob and bap distributions. In the BR Formation, fob (Figure 2c) and bap (Figure 2d) followed right-skewed distributions, suggests the presence of harder, banded lithologies interbedded with softer sediments, requiring variable forces for penetration. In contrast, the fob and bap (Figure 3c and 3d, respectively), in the MM Formation followed normal distributions indicating a more homogeneous rock type with less variability in hardness. The MM Formation, deposited in a more stable sedimentary environment, lacks the extensive structural banding and alternating hardness levels of the BR Formation, leading to a more consistent force requirement during drilling.
These findings underscore the importance of considering geological context when analyzing MWD data, as linear statistical assumptions may not capture the complex interactions between rock mass properties and drilling responses. Moreover, univariate examination of these variables may not describe non-linear relationships between the MWD responses and the geotechnical outputs.
Partial dependence plots provide a powerful tool for analyzing the relationship between MWD variables and target geotechnical properties across different deposit types. By isolating the effect of individual MWD parameters while averaging out other influences, the plots reveal how variables such as rop, fob, tor and bap contribute to predicting UCS, FPM, and GSI. This study applies partial dependence to compare these relationships between BR and MM formations, highlighting formation-specific differences in mechanical resistance, fracturing behavior, and rock mass quality. Understanding these dependencies improves the interpretability of MWD-based geotechnical models, supporting formation-specific feature selection and predictive accuracy.
Partial dependence analysis reveals key UCS differences between BR (Figure 4) and MM (Figure 5). In BR, UCS is driven by mechanical resistance, with fob and tor as strong predictors, reflecting higher rock competency. In MM, these relationships are weaker, suggesting fracturing and mineralogy play a greater role. rop inversely correlates with UCS in BR, indicating harder rock slows drilling, whereas in MM, rop is a weaker predictor, implying structural factors govern penetration speed. bap increases UCS in BR but declines at high values, suggesting flushing inefficiencies, while in MM, bap stabilizes earlier, indicating faster drilling optimization. These findings highlight formation-specific UCS controls, with BR dominated by mechanical resistance and MM influenced by additional geological factors.
Distinct FPM controls in BR and MM in the partial dependence analysis were observed (Figure 6 and Figure 7, respectively). In BR, FPM demonstrates a strong inverse correlation with rop, indicating fractured rock masses enhance penetration, whereas in MM, this relationship is weaker, suggesting fracturing plays a lesser role. fob and tor are stronger predictors in BR, implying fractures are more mechanically induced, while in MM, structural factors likely dominate. bap increases FPM in BR but stabilizes in MM, indicating flushing efficiency has less influence on fracture frequency in MM. These findings highlight formation-specific differences, with BR fracturing driven by drilling resistance, whereas in MM, geological discontinuities are more influential.
Figure 8 and Figure 9 demonstrate the partial dependence analysis on GSI in BR and MM, respectively. In BR, rop is strongly inversely related to GSI, suggesting higher-quality rock resists penetration, whereas in MM, this relationship is weaker, indicating structural factors may play a greater role. fob and tor exhibit stronger positive correlations with GSI in BR, implying mechanical resistance is a key indicator of rock mass quality, while in MM, these effects are less pronounced, suggesting GSI is less constrained by drilling force. bap influences GSI in both formations, but in BR, higher bap is more predictive, likely due to differences in air flushing dynamics in competent rock. These results suggest MWD-based GSI predictions require formation-specific adjustments, with BR dominated by mechanical controls and MM potentially influenced by additional geological factors.
The Measured MWD variables influence UCS, FPM, and GSI differently in BR and MM. In BR, UCS and FPM are strongly controlled by mechanical resistance, with fob and tor as key predictors, while in MM, weaker correlations suggest fracturing and mineralogy play a greater role. rop inversely correlates with UCS and GSI in BR, indicating higher-quality rock resists penetration, whereas in MM, this relationship is weaker, implying structural controls dominate. bap affects UCS and FPM more in BR, while in MM, it stabilizes earlier, suggesting flushing efficiency is less critical. These results highlight formation-specific controls, with BR driven by mechanical resistance and MM influenced by broader geological factors.
3.1. Feature Importance
To determine the statistical significance of MWD predictors, a Boruta-SHAP approach was applied. This involved augmenting the predictor set with shadow variables (randomly permuted versions of each feature) and then applying SHAP analysis to the expanded feature set. This section compares the significance of the numerous features employed for the prediction of rock mass conditions to determine the importance of each MWD parameter to describe geotechnical properties. The results of the Boruta-SHAP analysis reveal distinct trends in the influence of MWD variables on UCS, FPM and GSI for the BR and MM Formations, including:
- Ratio-based features (baprop, fobrop, torrop) ranked higher than raw features in UCS and GSI prediction.
- MSD features (ropS, torS) were critical for FPM, indicating their effectiveness in detecting fracture-related variability.
- bap emerged as the most significant raw feature, reinforcing the role of flushing pressure in geotechnical characterization.
These results challenge the conventional assumption that rop and tor are the primary indicators of geotechnical conditions, highlighting the need for multi-variable analysis.
3.1.1. Feature Importance Boruta-SHAP – UCS
The Boruta-SHAP values for UCS prediction in BR (Figure 10) indicate that bap, bapfob, torbap, and torS are the most influential features, suggesting that UCS in BR is primarily controlled by pressure-related variables rather than purely force-based parameters. This challenges the initial assumption that fob and tor would dominate, instead highlighting that higher bap correlates with increased UCS, implying a pressure-dominated response where greater air pressure is required to penetrate stronger rock. While rop and fob still contribute, their role appears secondary to bap-related variables, suggesting that mechanical resistance remains a factor but is overshadowed by pressure effects.
Boruta-SHAP values for BR range from -20 to +50, reflecting high UCS variability across different sections of the pit, which aligns with the geological complexity of BR, characterized by interbedded high-strength chert and quartz layers. This high variability emphasizes the importance of drilling efficiency and airflow management in UCS interpretation from MWD data. The pressure-driven nature of UCS estimation implies that rock breakage and drill performance are more affected by air pressure regulation than direct force application, reinforcing the critical role of pressure-based drilling adjustments in BR formations.
The Boruta-SHAP analysis for MM UCS (Figure 11) reveals that fobtor, bapfob, fobS, and rop are the most important variables, indicating a stronger influence of force-based interactions in MM compared to BR. While bap remains a key factor, MM shows greater importance of fobtor and fobS, suggesting that UCS in MM is controlled by both applied forces and pressure effects. Additionally, rop and ropS hold greater significance in MM than in BR, indicating a higher sensitivity of penetration rate variations to rock strength. This suggests that UCS in MM is not purely pressure-driven but also strongly influenced by drilling force and mechanical loading, which reflects the more homogeneous nature of MM lithologies.
The Boruta shadow variables (_sv) confirm these trends, reinforcing the reliability of the primary predictors. In BR, ropfob_sv, torfob_sv, and bapfob_sv exhibit low SHAP values, confirming that bap and its interactions are genuine UCS predictors. The lower significance of force-related shadow variables further supports the dominance of pressure-based controls in BR UCS estimation. bap_sv, ropfob_sv, and fobtor_sv also exhibit low influence for MM, reinforcing that while pressure effects remain important, force-based variables play a more significant role in MM UCS predictions. The weaker impact of bap_sv in MM compared to BR suggests that UCS in MM is less affected by pressure-driven variability, instead relying more on mechanical resistance and penetration efficiency.
3.1.2. Feature Importance Boruta-SHAP – FPM
The Boruta-SHAP analysis of FPM highlights distinct fracture detection mechanisms between BR and MM, reflecting their fundamentally different geomechanical behaviors. Figure 12 displays the most influential features in BR are baptor, ropS, torS, and torbap, indicating that fracture detection is primarily controlled by rotational force and penetration rate fluctuations. The dominance of torque-based variables (torS, torbap) suggests that fractures in BR are influenced by rotational resistance, likely due to the deposit’s high rock competency and existing fracture networks. In MM (Figure 13), ropfob, rop, torfob, and torbap emerge as the most significant predictors, suggesting that fracturing is driven more by penetration efficiency and applied force rather than rotational resistance, highlighting a greater dependence on mechanical loading rather than pre-existing structural controls.
The role of interaction-based variables further underscores these contrasting fracture behaviors. In BR, baptor and torbap exhibited strong feature importance, emphasizing the role of pressure-assisted torque in controlling fracture initiation. This suggests that fracturing in BR is more dependent on dynamic drilling interactions, in which changes in penetration rate and torque signal structural weaknesses. In contrast, MM is more influenced by ropfob and torfob, indicating that fracture formation is primarily governed by the interplay of penetration rate and force-based responses rather than pressure alone. This implies that fracturing in BR is more dynamic and controlled by drilling efficiency, while MM is more sensitive to mechanical load variations and stress-induced fracturing.
The distribution of Boruta-SHAP values across both deposits further reinforces these differences in fracturing mechanisms. ropS and torS exhibited a wide range of SHAP values for BR, suggesting that fluctuations in penetration rate and torque can either enhance or suppress fracture formation depending on localized geological conditions. The presence of extreme SHAP values supports the idea that brittle failure mechanisms dominate BR, where abrupt energy release leads to rapid fracture propagation. On the other hand, MM exhibits a more uniform and progressive fracture development process, as seen in the tighter distribution of SHAP values for ropfob and fob. The lower variance in SHAP values in MM suggests that fractures are governed by stress-driven mechanisms, leading to gradual failure rather than abrupt mechanical breakdown.
The Boruta shadow variables (_sv) confirm the robustness of the key predictors. In BR, shadow variables such as ropfob_sv, fobS_sv, and torfob_sv exhibit minimal impact, reinforcing that the real counterparts (ropfob, fobS, torfob) are meaningful indicators of fracture formation. The low influence of force-based and penetration rate shadow variables suggests that fracturing in BR is governed by true drilling responses rather than random fluctuations.
Similarly, in MM, bap_sv, torrop_sv, and fobtor_sv show negligible influence, confirming that the primary features—ropfob, rop, torfob—are legitimate predictors of FPM in MM. The lower impact of shadow variables for MM compared to BR aligns with its more stable geomechanical behavior, suggesting that fracture development in MM is more predictable and less influenced by drilling variability. The limited significance of air pressure-related shadow variables in both deposits further support fracturing is primarily driven by penetration rate and force-based interactions rather than pressure alone.
3.1.3. Feature Importance Boruta-SHAP – GSI
The Boruta-SHAP results for GSI in BR and MM illustrate distinct patterns in how MWD variables correlate with rock mass quality. In BR, Boruta-SHAP values are more widely distributed, ranging from approximately -8 to +10, reflecting high variability in rock strength due to localized geological heterogeneity, such as alternating iron-rich and siliceous bands. In contrast, MM exhibits a narrower SHAP value range (-15 to +10), with values focused around zero, indicating more uniform rock strength and less short-range variability. The reduced spread of SHAP values in MM suggests that GSI can be more reliably estimated using steady-state MWD variables, as opposed to the more dynamic drilling responses seen in BR.
Key feature importance rankings further highlight deposit-specific differences in GSI prediction. torrop, bap, and fobS emerge as the most influential variables in BR, with torrop exhibiting the highest importance (Figure 14). This suggests that rotational torque and its interaction with penetration rate strongly influence GSI in BR, likely due to banding, alteration, and fracturing effects. Other key features include fobrop, ropbap, and bapfob, highlighting the role of multiple variable interactions in determining BR geotechnical properties. The strong influence of force-based variables (fob, tor) suggests that rock mass quality in BR is more sensitive to mechanical resistance and drilling force fluctuations.
On the other hand, MM (Figure 15) shows a different feature importance hierarchy, with rop, bapfob, and bap as the dominant predictors. Unlike BR, bap has a stronger direct relationship with GSI, suggesting that air pressure-based variables are more predictive of rock strength in MM formations. Additionally, torque-related variables (torrop, torbap) have greater importance in MM than in BR, reinforcing the role of rotational drilling forces in characterizing the MM rock mass. The lower importance of force-based variables in MM, along with the reduced variance of Boruta-SHAP values, suggests that MM exhibits a more homogeneous geomechanical structure, resulting in more stable and predictable drilling responses compared to BR.
The Boruta shadow variables (_sv) further validate the robustness of the GSI predictions by distinguishing genuine predictive features from statistical noise. For BR, torbap_sv, fobS_sv, and torrop_sv exhibited minimal importance, confirming that the real counterparts of these variables—such as torrop, fobS, and bap—are genuine indicators of rock mass quality. The presence of multiple interaction-based shadow variables with low significance reinforces the idea that GSI variations in BR are primarily controlled by actual drilling responses rather than random fluctuations.
In MM, bap_sv, rop_sv, and torbap_sv showed similarly low importance, supporting the conclusion that bap and rop remain the dominant drivers of GSI in MM formations. The weaker influence of shadow variables in MM compared to BR aligns with the observation that GSI prediction in MM is more stable and less influenced by short-range variability. This distinction highlights how MWD-based GSI estimation is more complex in BR due to geological heterogeneity, whereas MM allows for more reliable and consistent predictions using less variable drilling parameters.
3.2. Regression-based ML Overview
The predictive performance of five regression-based ML models—DT, SVM, RF, GP, and NN—was evaluated for estimating UCS, FPM, and GSI from MWD data. The results revealed consistent trends across all models, with NN and RF outperforming other approaches in both datasets, particularly in BR where larger data volume and more homogeneous geotechnical conditions contributed to higher predictive accuracy.
Across all geotechnical parameters, NN consistently achieved the highest R² and lowest RMSE, followed closely by RF. The superior performance of NN can be attributed to its ability to model complex, nonlinear interactions between MWD variables and geotechnical properties. RF also demonstrated strong predictive capability, benefiting from its ensemble approach that reduces overfitting by averaging multiple DTs.
Conversely, DT, SVM, and GP exhibited lower predictive accuracy, particularly in MM, which is characterized by higher geological variability. DT was the least effective model, likely due to its sensitivity to noise in the MWD dataset and its tendency to overfit training data while failing to generalize well to test data.
The superior performance of NN and RF can be attributed to their ability to handle high-dimensional, multivariate datasets where complex interactions exist between input features. In contrast, simpler models like DT and SVM struggled because:
- DT is prone to overfitting and lacks the ability to capture intricate geomechanical relationships.
- SVM relies on a fixed decision boundary, which is not well-suited to continuous, nonlinear geotechnical responses.
- GP, while effective in some cases, is computationally expensive and does not generalize well with the large, noisy datasets typical of MWD applications.
The comparison between NN and RF suggests a trade-off where NN provides the highest predictive accuracy but requires significantly longer training times and RF offers a strong balance between accuracy and computational efficiency, making it a practical choice for real-time mining applications. GP may be useful for smaller datasets but is not well-suited for large-scale MWD data due to its high computational cost.
Given these findings, future work should explore hybrid modeling approaches that combine the interpretability of RF with the high-dimensional learning capabilities of NN. Additionally, model uncertainty quantification should be incorporated to better assess prediction reliability in heterogeneous formations such as MM.
3.2.1. UCS Prediction
For the BR dataset, the NN model outperformed all other approaches, achieving an R² of 0.96 and the lowest RMSE of 7.7 MPa for both training and test datasets (Table 3). The RF model also exhibited strong predictive capabilities, with R² = 0.94 and RMSE = 9.3 MPa on the test set. SVM and GP demonstrated similar predictive accuracy, with R² values above 0.91 and RMSE values in the range of 10.4 to 11.9 MPa. DT, while computationally efficient, had the lowest predictive accuracy in BR, with R² = 0.90 and RMSE = 12.4 MPa.
In contrast, model performance was notably lower for the MM dataset, with a wider range of R² values (0.46 to 0.84) and higher RMSE values across all models. NN remained the best-performing model for MM, with R² = 0.84 and RMSE = 11.95 MPa. RF followed closely, achieving an R² of 0.78 and RMSE of 13.95 MPa. SVM and GP displayed moderate predictive ability, with R² values ranging from 0.62 to 0.68. DT performed the poorest, with an R² of 0.46 and the highest RMSE of 21.88 MPa, indicating important prediction errors for MM rock strength values. The higher RMSE values in MM suggest that UCS estimation in this formation is more challenging due to greater lithological variability. The lower performance of GP and SVM (R² = 0.62–0.68 for MM) suggests that these models struggle with the nonlinearity inherent in MWD-UCS relationships.
The training times for each model varied, with NN requiring the longest computation time (517 s for BR and 184 s for MM). Conversely, GP were the fastest models, taking only 4 s for BR and 2.4 s for MM. DT and SVM also demonstrated relatively fast training times, with SVM completing training in under 10 s for both deposits. RF had moderate computational demand, requiring 60 s for BR and 66.1 s for MM.
These results indicate that NN and RF offer the best compromise between predictive accuracy and robustness, particularly for the BR dataset. The MM dataset exhibits greater prediction uncertainty, likely due to increased geological heterogeneity or reduced data volume. Future work will focus on exploring the underlying causes of performance degradation in MM predictions, refining feature selection techniques, and integrating additional geotechnical parameters to improve model generalization.
3.2.2. FPM Prediction
The BR results presented in Table 4 demonstrate the NN model outperformed all other approaches, achieving an R² of 0.98 and the lowest RMSE of 1.0 for both training and test datasets, likely due to its ability to capture highly nonlinear fracture formation mechanisms. The RF model also exhibited strong predictive capabilities, with R² = 0.96 and RMSE = 1.3 on the test set. SVM and GP demonstrated similar predictive accuracy, with R² values above 0.93 and RMSE values ranging from 1.6 to 1.8. DT, while computationally efficient, had the lowest predictive accuracy in the BR dataset, with R² = 0.94 and RMSE = 1.7.
Model performance was lower across all methods in MM models, with R² values ranging from 0.53 to 0.93. The NN model remained the best-performing approach, achieving R² = 0.93 and RMSE = 2.2, followed by RF (R² = 0.87, RMSE = 2.9). SVM and GP displayed moderate predictive ability, with R² values between 0.76 and 0.84, while DT exhibited the weakest performance, with R² = 0.53 and RMSE = 5.5, due to its tendency to oversimplify fracture-related interactions, leading to poor generalization.
The training times for each model varied, with NN requiring the longest computation time (Table 3). Conversely, GP were the fastest models, taking only 4 s for BR and MM. DT and SVM also demonstrated relatively fast training times, with SVM completing training in under 10 s for both datasets. RF had a moderate computational demand, requiring 77 s for BR and 59 s for MM.
Overall, these results indicate that NN and RF provide the most robust predictive performance for both BR and MM datasets, with NN yielding the highest accuracy but at a higher computational cost. The MM dataset exhibits greater prediction uncertainty, likely due to increased geological heterogeneity or reduced data volume. Future investigations will focus on identifying the sources of variability in MM predictions, optimizing feature selection, and integrating additional geotechnical parameters to enhance model generalization.
3.2.3. GSI Prediction
For the BR dataset, the NN model achieved the highest accuracy, with an R² of 0.99 and the lowest RMSE of 2.0 for both training and test datasets (Table 5). The RF model also performed well, with R² = 0.98 and RMSE = 2.6, followed by SVM (R² = 0.97, RMSE = 3.2) and GP (R² = 0.97, RMSE = 2.9). DT had the lowest accuracy among the models tested, with R² = 0.94 and RMSE = 4.3, but remained computationally efficient.
In contrast, MM model performance was comparatively lower across all methods, with R² values ranging from 0.68 to 0.93. NN remained the best-performing model, achieving R² = 0.93 and RMSE = 2.4, followed by RF (R² = 0.87, RMSE = 3.2). SVM and GP displayed moderate predictive ability, with R² values between 0.78 and 0.86, while DT exhibited the weakest performance (R² = 0.68, RMSE = 5.1). The performance gap in MM suggests that GSI estimation is more sensitive to variations in MWD-derived parameters, particularly bap and torrop.
The training times varied among models, with NN requiring the longest computation time (255 s for BR and 297 s for MM). In contrast, DT were the fastest models, requiring only 2 s for both datasets. RF had moderate computational demands (80 s for BR, 60 s for MM), while GP and SVM were relatively fast (5–8 s across both datasets). The high R² values of GP and NN (above 0.97 for BR and 0.91 for MM) suggest potential overfitting, particularly for BR, where geological variability may be lower.
Overall, NN and RF offer the best balance between predictive accuracy and robustness, particularly in GSI prediction for BR deposits. The MM dataset exhibits greater prediction uncertainty, which may necessitate further investigation into geological variability and dataset quality. Future work will focus on examining model generalization, refining feature selection techniques, and optimizing hyperparameters to mitigate overfitting while maintaining prediction accuracy.
4. Discussion
The results presented in this study suggest that leveraging MWD data through ML provides high predictive accuracy for UCS, FPM, and GSI. While this was demonstrated for these three parameters, the methodology can be applied to a broader range of geotechnical properties (excluded for brevity). However, since the findings are based on two iron ore pits in the Pilbara region of Western Australia, questions remain about their generalizability to other geological settings, mining operations, and commodity types.
In terms of feature importance, the Boruta-SHAP analysis with shadow variables provided new insights into the reliability of key predictors. Unlike previous studies where rop and tor were consistently identified as dominant MWD variables [18,19,22,25,31,67], this study found that derived ratio variables—such as ropbap, torrop, and baprop—exhibited stronger feature importance across UCS, FPM, and GSI estimations. The lower significance of force-related shadow variables confirmed that pressure-based interactions (bap, bapfob) were genuinely important features of UCS in BR, contradicting prior assumptions that mechanical resistance (fob, tor) would be the primary controls. Additionally, the MM deposit showed a greater reliance on force-based metrics (fobtor, torfob) rather than pressure-driven responses, reinforcing the deposit-specific nature of MWD-based geotechnical predictions.
The ML model performance differed significantly between BR and MM, largely due to geological variability. Prediction accuracy was higher in BR, consistently achieving R² values >0.94, likely due to its more homogeneous BIF geology with relatively uniform mechanical properties. In contrast, MM exhibited greater lithological and structural heterogeneity, resulting in higher RMSE and lower R² values (0.78–0.87). The impact of shadow variables was also greater in MM, suggesting that higher geological complexity introduces greater uncertainty in ML-based predictions. This highlights that ML models trained in relatively uniform deposits may not generalize well to structurally complex formations without additional tuning or feature adjustments.
These findings emphasize the need for deposit-specific model training and validation before applying MWD-based geotechnical predictions to new sites. Further analysis of dataset distribution between the deposits revealed that differences in dataset volume contributed to disparities in model performance. The MM dataset contained fewer observations and exhibited greater geological heterogeneity, leading to higher prediction uncertainty. This reinforces the importance of training ML models with site-specific geomechanical data rather than assuming universal feature importance across deposits.
The methodology proposed in this study can be adapted for other orebody types (including copper, gold, nickel, and coal) and both open-pit and underground mining operations. Additionally, this study utilized data from multiple drill rig manufacturers (Epiroc, Terex, Bucyrus, and Sandvik), revealing that model performance remained consistent across rigs, though minor variations in sensor calibration and data resolution were observed. The impact of sensor calibration on ML predictions was further highlighted by shadow variable analysis, which showed that some rig-specific data variations may influence feature importance rankings. Ensuring standardization of MWD data processing across different drill rigs will be essential for improving model transferability.
Future studies should include:
- Standardizing MWD data processing across different equipment types to improve the transferability of ML models to new operations.
- Evaluating the robustness of MWD-based geotechnical predictions across different drill bit designs, rig configurations, and automation levels.
- Training models on multi-site, multi-commodity datasets to differentiate universal vs. deposit-specific feature importance.
- Developing transfer learning techniques to allow pre-trained ML models to adapt to new sites with minimal re-training.
- Integrating additional geological context variables (e.g., geophysical wireline logs, lithological logs) to enhance prediction accuracy across different orebody types.
- Validating model predictions against real-time operational outcomes, such as blast fragmentation and equipment performance, to ensure practical applicability.
By refining MWD-based ML models for broader geological settings, this approach could become a universal tool for real-time geotechnical assessment, enabling more efficient mine planning, optimized drill-and-blast operations, and improved slope stability management across diverse mining environments.
5. Conclusions
This study demonstrated the feasibility of estimating geotechnical properties using MWD data and ML techniques, showing that rock strength, fracture frequency, and rock mass classification scores can be predicted with high accuracy. A feature importance framework was developed using Boruta-SHAP algorithms, incorporating shadow variable analysis to validate key predictors. The results highlighted the dominance of bap and ratio-based metrics such as torrop in geotechnical characterization, while also confirming that pressure-driven responses are more significant in UCS estimation for BR, whereas force-based interactions play a larger role in MM. Comparative analyses across DT, SVM, RF, GP, and NN models showed strong correlations (up to R² = 0.98) between MWD features and geotechnical properties, reinforcing the robustness of ML-based geotechnical estimation, even in variable geological conditions.
The findings are highly relevant to the mining industry, as MWD-driven geotechnical characterization offers a pathway to more precise drill-and-blast design. The ability to optimize powder factor based on rock strength predictions and adjust stemming and detonation delays according to FPM results can lead to more efficient and controlled fragmentation. Furthermore, reducing oversized or inconsistent rock fragments can minimize over- and under-blasting effects, ultimately enhancing equipment longevity and reducing operational costs. Shadow variable analysis further confirmed the reliability of MWD-based feature selection, strengthening the case for integrating ML models into routine geotechnical assessments.
While this study demonstrates the feasibility of predicting geotechnical conditions from MWD data, further work is required to quantify the operational benefits, including:
- Comparing MWD-based geotechnical predictions to actual fragmentation results, validating the impact on blast efficiency.
- Developing integrated ML models that link MWD data to downstream productivity metrics such as loader efficiency, cycle times, and crusher performance.
- Investigating real-time integration of MWD analytics into mine control systems, enabling dynamic adjustments to blast and excavation strategies.
By extending the application of MWD-based geotechnical characterization beyond prediction to real-time operational optimization, mining operations can achieve higher efficiency, lower costs, and improved safety in excavation and material processing. This study also underscores the need for deposit-specific model training, as demonstrated by the differing influence of shadow variables in BR and MM, further reinforcing the importance of site-specific calibration for MWD-based geotechnical estimation.
Acknowledgments
One of the authors (DG) received support through the MRIWA Postgraduate Research Scholarship and the AusIMM Education Endowment Fund Postgraduate Scholarship during his doctoral studies at Curtin University. Furthermore, the research was enabled by the advanced computing resources provided by the Pawsey Supercomputing Research Centre in Perth, Australia.
Conflicts of Interest
The authors declare no conflict of interest.
References
- Barton, N.; Lien, R.; Lunde, J. Engineering Classification of Rock Masses for the Design of Tunnel Support. Rock Mech. 1974, 6, 189–236. [Google Scholar] [CrossRef]
- Bieniawski, Z.T. Geomechanics Classification (Rock Mass Rating System). In Engineering rock mass classifications : a complete manual for engineers and geologists in mining, civil, and petroleum engineering; Wiley-Interscience, 1989.
- Deere, D.U. Technical Description of Rock Cores.Pdf. Rock Mech. Eng. Geol. 1963, I, 18–22. [Google Scholar]
- Hoek, E. Strength of Jointed Rock Masses. Géotechnique 1983, 33, 187–223. [Google Scholar] [CrossRef]
- Howarth, D.F.; Rowlands, J.C. Quantitative Assessment of Rock Texture and Correlation with Drillability and Strength Properties. Rock Mech. Rock Eng. 1987, 20, 57–85. [Google Scholar] [CrossRef]
- Elbaz, S.; Crawford, D.; Tuck, M. A Method to Assess Rock Strength and Excavability of Diamondiferous Kimberlite Ore through In-Situ Rock Testing. In Proceedings of the Geotechnical and Geophysical Site Characterisation 5; Springer International Publishing: Sydney, Australia, 2016.
- Schunnesson, H. Drill Process Monitoring in Percussive Drilling for Location of Structural Features, Lithological Boundaries and Rock Properties, and for Drill Productivity Evaluation. PhD, Lulea University of Technology: Lulea, Sweden, 1997.
- Palleske, C.; Kalenchuk, K.; Hume, C.; Bawden, W. Strategic Use of Geotechnical Data for Maximised Value Added.; 2017; pp. 511–520.
- Segui, J.B.; Higgins, M. Blast Design Using Measurement While Drilling Parameters.; Hunter Valley, NSW, 2001; pp. 28–31.
- Hatherly, P.; Leung, R.; Scheding, S.; Robinson, D. Drill Monitoring Results Reveal Geological Conditions in Blasthole Drilling. Int. J. Rock Mech. Min. Sci. 2015, 78, 144–154. [Google Scholar] [CrossRef]
- Khorzoughi, M.B.; Hall, R.; Apel, D. Rock Fracture Density Characterization Using Measurement While Drilling (MWD) Techniques. Int. J. Min. Sci. Technol. 2018, 28, 859–864. [Google Scholar] [CrossRef]
- Navarro, J.; Sanchidrian, J.A.; Segarra, P.; Castedo, R.; Paredes, C.; Lopez, L.M. On the Mutual Relations of Drill Monitoring Variables and the Drill Control System in Tunneling Operations. Tunn. Undergr. Space Technol. 2018, 72, 294–304. [Google Scholar] [CrossRef]
- van Eldert, J.; Schunnesson, H.; Johansson, D.; Saiang, D. Application of Measurement While Drilling Technology to Predict Rock Mass Quality and Rock Support for Tunnelling. Rock Mech. Rock Eng. 2020, 53, 1349–1358. [Google Scholar] [CrossRef]
- Kadkhodaie-Ilkhchi, A.; Monteiro, S.T.; Ramos, F.; Hatherly, P. Rock Recognition from MWD Data: A Comparative Study of Boosting, Neural Networks, and Fuzzy Logic. IEEE Geosci. Remote Sens. Lett. 2010, 7, 680–684. [Google Scholar] [CrossRef]
- Goldstein, D.M.; Aldrich, C.; O’Connor, L. A Review of Orebody Knowledge Enhancement Using Machine Learning on Open-Pit Mine Measure-While-Drilling Data. Mach. Learn. Knowl. Extr. 2024, 6, 1343–1360. [Google Scholar] [CrossRef]
- Peck, J.P. Performance Monitoring of Rotary Blasthole Drills. 1989, 395.
- Scoble, M.J.; Peck, J.; Hendricks, C. Correlation between Rotary Drill Performance Parameters and Borehole Geophysical Logging. 1989, 8, 301–312.
- Martin, J. Application of Pattern Recognition Techniques to Monitoring-While- Drilling on a Rotary Electric Blasthole Drill at an Open-Pit Coal Mine. MSc, Queen’s University: Kingston, Ontario, Canada, 2007.
- Beattie, N. Monitoring-While-Drilling for Open-Pit Mining in a Hard Rock Environment. Master of Science, Queen’s University: Kingston, Ontario, Canada, 2009.
- Khorzoughi, M.B. Use of Measurement While Drilling Techniques for Improved Rock Mass Characterization in Open-Pit Mines. MSc, University of British Columbia: Vancouver, 2011.
- Basarir, H.; Wesseloo, J.; Karrech, A.; Pasternak, E.; Dyskin, A. The Use of Soft Computing Methods for the Prediction of Rock Properties Based on Measurement While Drilling Data. Proc. Eighth Int. Conf. Deep High Stress Min. 2017, 537–551. [Google Scholar] [CrossRef]
- Galende-Hernández, M.; Menéndez, M.; Fuente, M.J.; Sainz-Palmero, G.I. Monitor-While-Drilling-Based Estimation of Rock Mass Rating with Computational Intelligence: The Case of Tunnel Excavation Front. Autom. Constr. 2018, 93, 325–338. [Google Scholar] [CrossRef]
- Klyuchnikov, N.; Zaytsev, A.; Gruzdev, A.; Ovchinnikov, G.; Antipova, K.; Ismailova, L.; Muravleva, E.; Burnaev, E.; Semenikhin, A.; Cherepanov, A.; et al. Data-Driven Model for the Identification of the Rock Type at a Drilling Bit. J. Pet. Sci. Eng. 2019, 178, 506–516. [Google Scholar] [CrossRef]
- Khushaba, R.N.; Melkumyan, A.; Hill, A.J. A Machine Learning Approach for Material Type Logging and Chemical Assaying from Autonomous Measure-While-Drilling (MWD) Data. Math Geosci 2021. [Google Scholar] [CrossRef]
- Navarro, J.; Seidl, T.; Hartlieb, P.; Sanchidrián, J.A.; Segarra, P.; Couceiro, P.; Schimek, P.; Godoy, C. Blastability and Ore Grade Assessment from Drill Monitoring for Open Pit Applications. Rock Mech Rock Eng 2021, 54, 3209–3228. [Google Scholar] [CrossRef]
- Silversides, K.L.; Melkumyan, A. Machine Learning for Classification of Stratified Geology from MWD Data. Ore Geol. Rev. 2022, 142, 104737. [Google Scholar] [CrossRef]
- Goldstein, D.; Aldrich, C.; O’Connor, L. Enhancing Orebody Knowledge Using Measure-While-Drilling Data: A Machine Learning Approach. IFAC Pap. 2024, 58, 72–76. [Google Scholar] [CrossRef]
- Schunnesson, H. Drill Process Monitoring in Percussive Drilling: A Multivariate Approach for Data Analysis. Licentiate, Lulea University of Technology: Lulea, Sweden, 1990.
- Schunnesson, H. RQD Predictions Based on Drill Performance Parameters. Tunn. Undergr. Space Technol. 1996, 11, 345–351. [Google Scholar] [CrossRef]
- Schunnesson, H. Rock Characterisation Using Percussive Drilling. Int. J. Rock Mech. Min. Sci. 1998, 35, 711–725. [Google Scholar] [CrossRef]
- Ghosh, R.; Gustafson, A.; Schunnesson, H. Development of a Geological Model for Chargeability Assessment of Borehole Using Drill Monitoring Technique. Int. J. Rock Mech. Min. Sci. 2018, 109, 9–18. [Google Scholar] [CrossRef]
- Ghosh, R. Assessment of Rock Mass Quality and Its Effects on Chargeability Using Drill Monitoring Technique. PhD, Lulea University of Technology, 2017.
- Navarro, J.; Schunnesson, H.; Ghosh, R.; Segarra, P.; Johansson, D.; Sanchidrián, J.Á. Application of Drill-Monitoring for Chargeability Assessment in Sublevel Caving. Int. J. Rock Mech. Min. Sci. 2019, 119, 180–192. [Google Scholar] [CrossRef]
- King, R.L.; Hicks, M.A.; Signer, S.P. Using Unsupervised Learning for Feature Detection in a Coal Mine Roof. Eng. Appl. Artif. Intell. 1993, 6, 565–573. [Google Scholar] [CrossRef]
- Finfinger, G.; Peng, S.; Gu, Q.; Wilson, G.; Thomas, B. An Approach to Identifying Geological Properties from Roof Bolter Drilling Parameters. Proc. 19th Conf. Ground Control Min. 2000, 1–12. [Google Scholar]
- Peng, S. Evaluation of Roof Bolting Requirements Based on In-Mine Roof Bolter Drilling; West Virgina University, 2004.
- Van Eldert, J. Analysis of Excavation Damage, Rock Mass Characterisation and Rock Support Design Using Drilling Monitoring. PhD, Lulea University of Technology: Lulea, Sweden, 2018.
- Van Eldert; Jeroen Analysis of Excavation Damage, Rock Mass Characterisation and Rock Support Design Using Drilling Monitoring. 2018.
- Liu; Jiankang Study on Intelligent Prediction Models of Geological Conditions Ahead of Tunnel Face Using Measurement-While-Drilling Data. 2021.
- Liu, J.; Jiang, Y.; Han, W.; Sakaguchi, O. Optimized ANN Model for Predicting Rock Mass Quality Ahead of Tunnel Face Using Measure-While-Drilling Data. Bull Eng Geol Env. 2021, 80, 2283–2305. [Google Scholar] [CrossRef]
- Liu, J.; Jiang, Y.; Ishizu, S.; Sakaguchi, O. Estimation of Tunnel Support Pattern Selection Using Artificial Neural Network. Arab J Geosci 2020, 13, 321. [Google Scholar] [CrossRef]
- van Eldert, J.; Funehag, J.; Schunnesson, H.; Saiang, D. Drill Monitoring for Rock Mass Grouting: Case Study at the Stockholm Bypass. Rock Mech. Rock Eng. 2021, 54, 501–511. [Google Scholar] [CrossRef]
- Navarro, J.; Sanchidrián, J.A.; Segarra, P.; Castedo, R.; Costamagna, E.; López, L.M. Detection of Potential Overbreak Zones in Tunnel Blasting from MWD Data. Tunn. Undergr. Space Technol. 2018, 82, 504–516. [Google Scholar] [CrossRef]
- Silversides, K.L.; Melkumyan, A. Multivariate Gaussian Process for Distinguishing Geological Units Using Measure While Drilling Data. In Proceedings of the Minig Goes Digitial; Taylor & Francis Group: London, 2019; pp. 94–100.
- Silversides, K.L.; Melkumyan, A. Boundary Identification and Surface Updates Using MWD. Math. Geosci. 2020. [Google Scholar] [CrossRef]
- Wold, S.; Esbensen, K.; Geladi, P. Principal Component Analysis. Chemom. Intell. Lab. Syst. 1987, 2, 37–52. [Google Scholar] [CrossRef]
- Lundberg, S.; Lee, S.-I. A Unified Approach to Interpreting Model Predictions.; Long Beach, CA, USA, 217AD; pp. 1–10.
- Liu, X.; Aldrich, C. Assessing the Influence of Operational Variables on Process Performance in Metallurgical Plants by Use of Shapley Value Regression. 2022.
- Goldstein, D.; Aldrich, C.; Shao, Q.; O’Connor, L. A Machine Learning Classification Approach to Geotechnical Characterisation Using Measure-While-Drilling Data. Preprints 2025. [Google Scholar] [CrossRef]
- Goldstein, D.; Aldrich, C.; Shao, Q.; O’Connor, L. Unlocking Subsurface Geology: A Case Study with Measure-While-Drilling Data and Machine Learning. Preprints 2025. [Google Scholar] [CrossRef]
- Ker, P. Iron Ore Supply Slump as Rio Runs Late on New Mines. Australian Financial Review 2021.
- De-Vitry, C.; Vann, J.; Arvidson, H. Multivariate Iron Ore Deposit Resource Estimation – a Practitioner’s Guide to Selecting Methods. Trans Inst Min. Metall. Sect B. 2010, 119, 154–165. [Google Scholar] [CrossRef]
- Jones, H.; Walraven, F.; Knott, G. Natural Gamma Logging as an Aid to Iron Ore Exploration in the Pilbara Region of Western Australia.; Perth, Australia, 1973.
- Khorzoughi, B.M.; Hall, R. Processing of Measurement While Drilling Data for Rock Mass Characterization. Int. J. Min. Sci. Technol. 2016, 26, 989–994. [Google Scholar] [CrossRef]
- van Eldert, J.; Schunnesson, H.; Saiang, D.; Funehag, J. Improved Filtering and Normalizing of Measurement-While-Drilling (MWD) Data in Tunnel Excavation. Tunn. Undergr. Space Technol. 2020, 103, 103467–103467. [Google Scholar] [CrossRef]
- Teale, R. The Concept of Specific Energy in Rock Drilling. Int. J. Rock Mech. Min. Sci. 1965, 2, 57–73. [Google Scholar] [CrossRef]
- MATLAB; The MathWorks Inc.: Natick, Massachursetts, 2024.
- Kursa, M.B.; Rudnicki, W.R. Feature Selection with the Boruta Package. J. Stat. Softw. 2010, 36. [Google Scholar] [CrossRef]
- Statistics and Machine Learning Toolbox; The MathWorks Inc.: Natick, Massachursetts, 2024.
- Zhang, W.; Li, H.; Li, Y.; Liu, H.; Chen, Y.; Ding, X. Application of Deep Learning Algorithms in Geotechnical Engineering: A Short Critical Review. Artif Intell Rev 2021. [Google Scholar] [CrossRef]
- Kotsiantis, S.B. Decision Trees: A Recent Overview. Artif. Intell. Rev. 2013, 39, 261–283. [Google Scholar] [CrossRef]
- Hearst, M.A.; Dumais, S.T.; Osuna, E.; Platt, J.; Scholkopf, B. Support Vector Machines. IEEE Intell. Syst. Their Appl. 1998, 13, 18–28. [Google Scholar] [CrossRef]
- Breiman, L. Random Forests. Mach. Learn. 2001, 45, 5–32. [Google Scholar] [CrossRef]
- Schulz, E.; Speekenbrink, M.; Krause, A. A Tutorial on Gaussian Process Regression: Modelling, Exploring, and Exploiting Functions. J. Math. Psychol. 2018, 85, 1–16. [Google Scholar] [CrossRef]
- Bishop, C.M. Neural Networks and Their Applications. Rev. Sci. Instrum. 1993, 65. [Google Scholar] [CrossRef]
- Regression Learner Toolbox; The MathWorks Inc.: Natick, Massachursetts, 2024.
- Scoble, M.J.; Peck, J. A Technique for Ground Characterization Using Automated Production Drill Monitoring. 1987, 5265. [CrossRef]
Figure 1.
Examples of blasthole drill rigs used for collecting MWD data [49]: a) Terex SKS 12, utilized for the drilling of 0.229m production blast holes and b) Epiroc D65, used in the creation of 0.165m wall control blast holes.
Figure 1.
Examples of blasthole drill rigs used for collecting MWD data [49]: a) Terex SKS 12, utilized for the drilling of 0.229m production blast holes and b) Epiroc D65, used in the creation of 0.165m wall control blast holes.
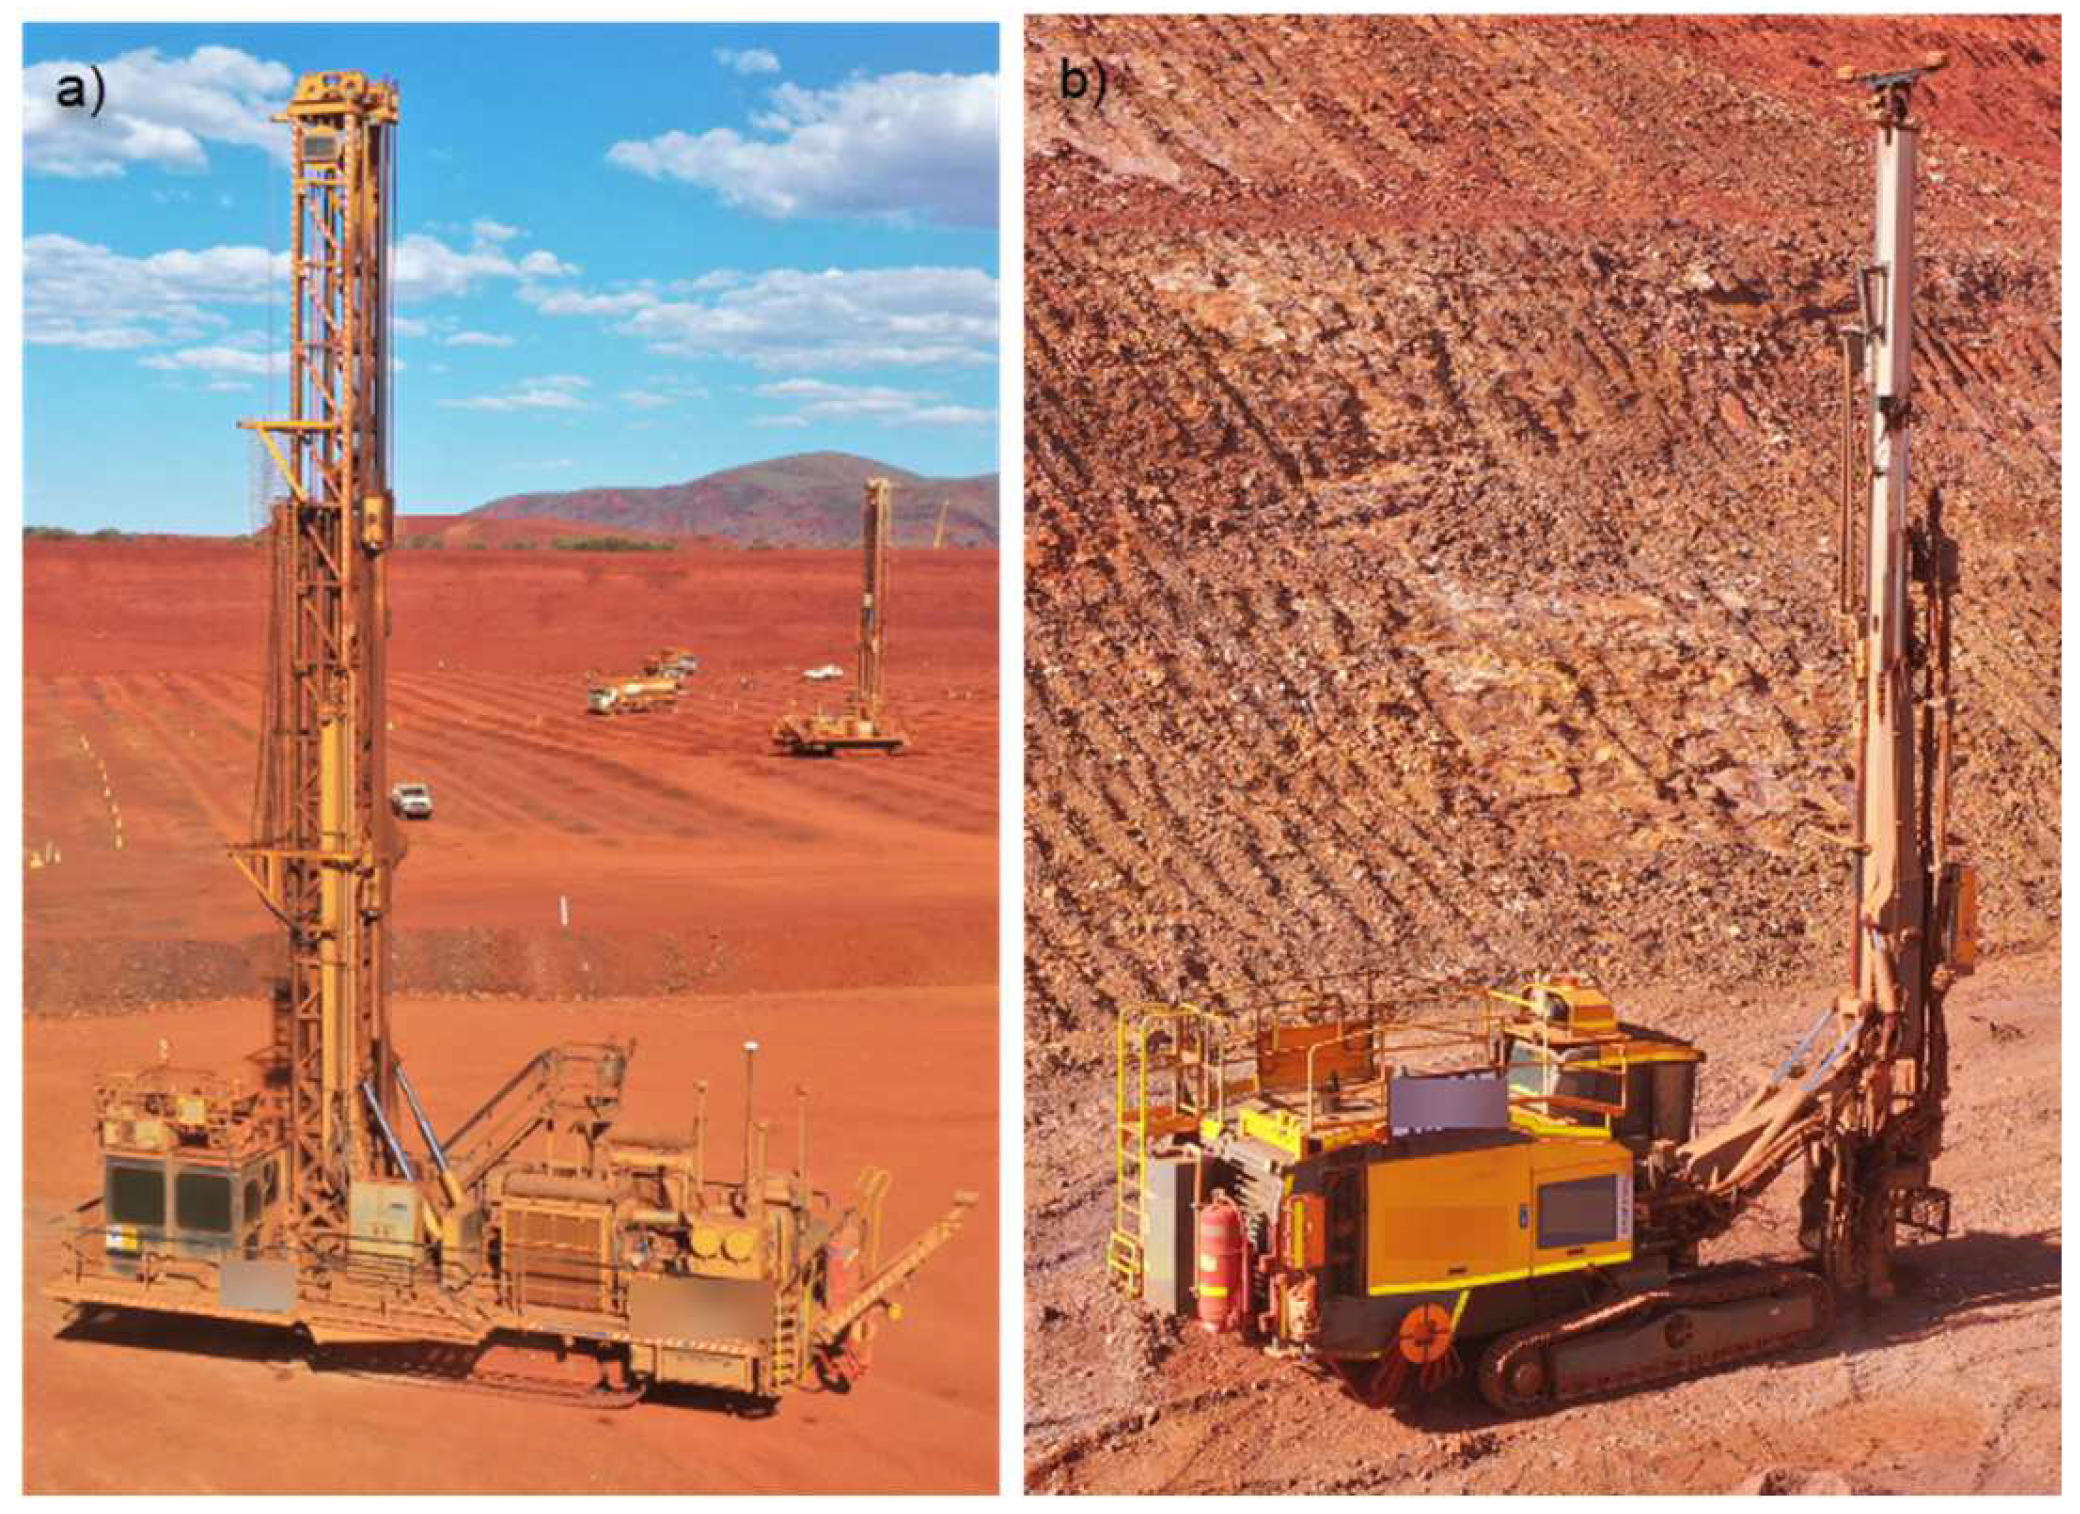
Figure 2.
Distribution of BR data for a) rop, b) tor, c) fob and d) bap.
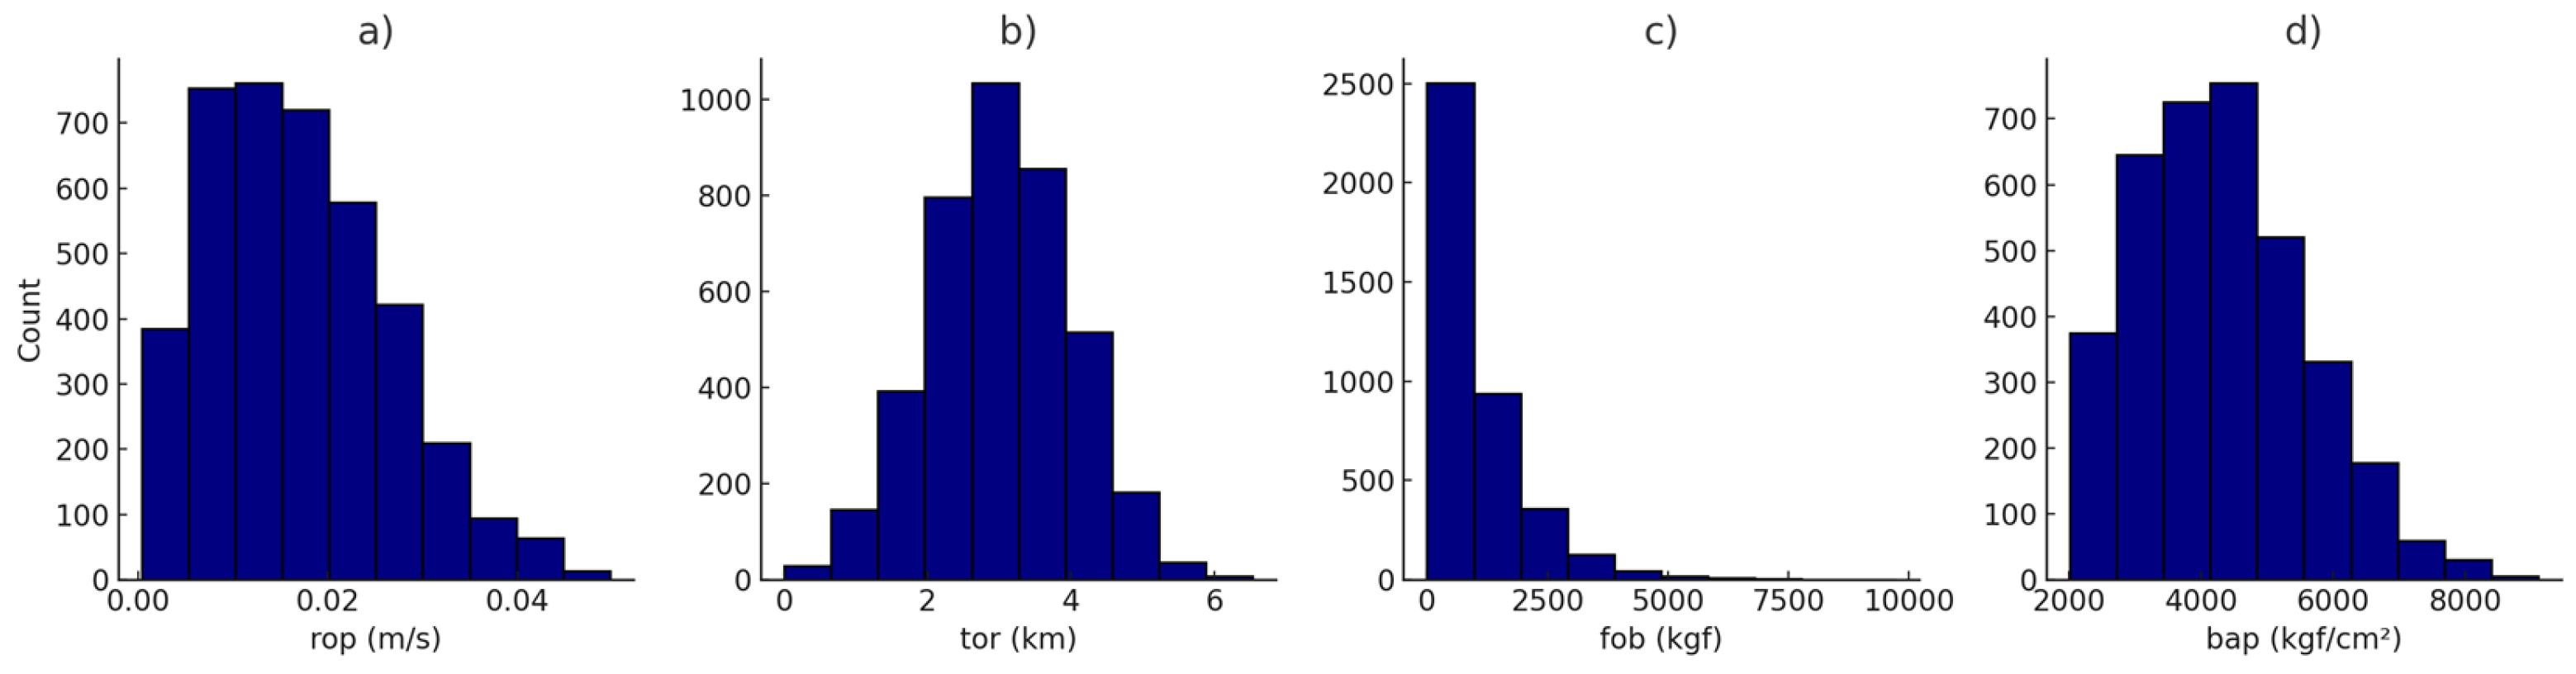
Figure 3.
Distribution of MM data for a) rop, b) tor, c) fob and d) bap.
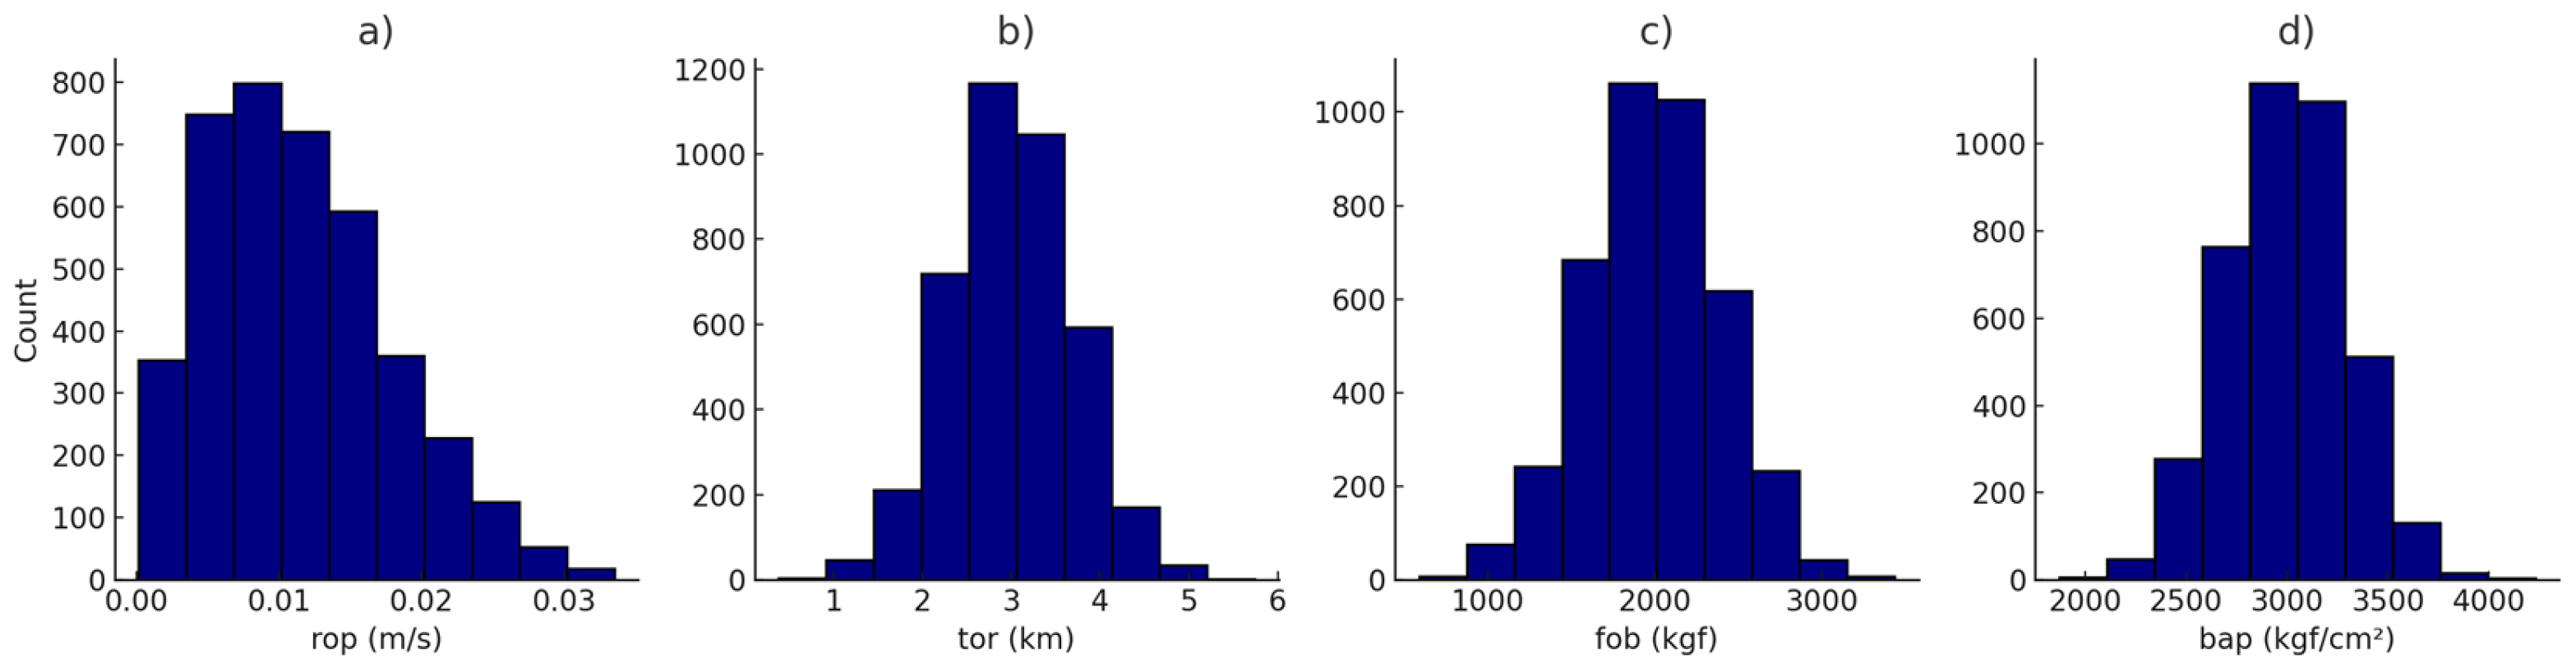
Figure 4.
Partial Dependence Plot of Measured MWD variables of UCS in BR.
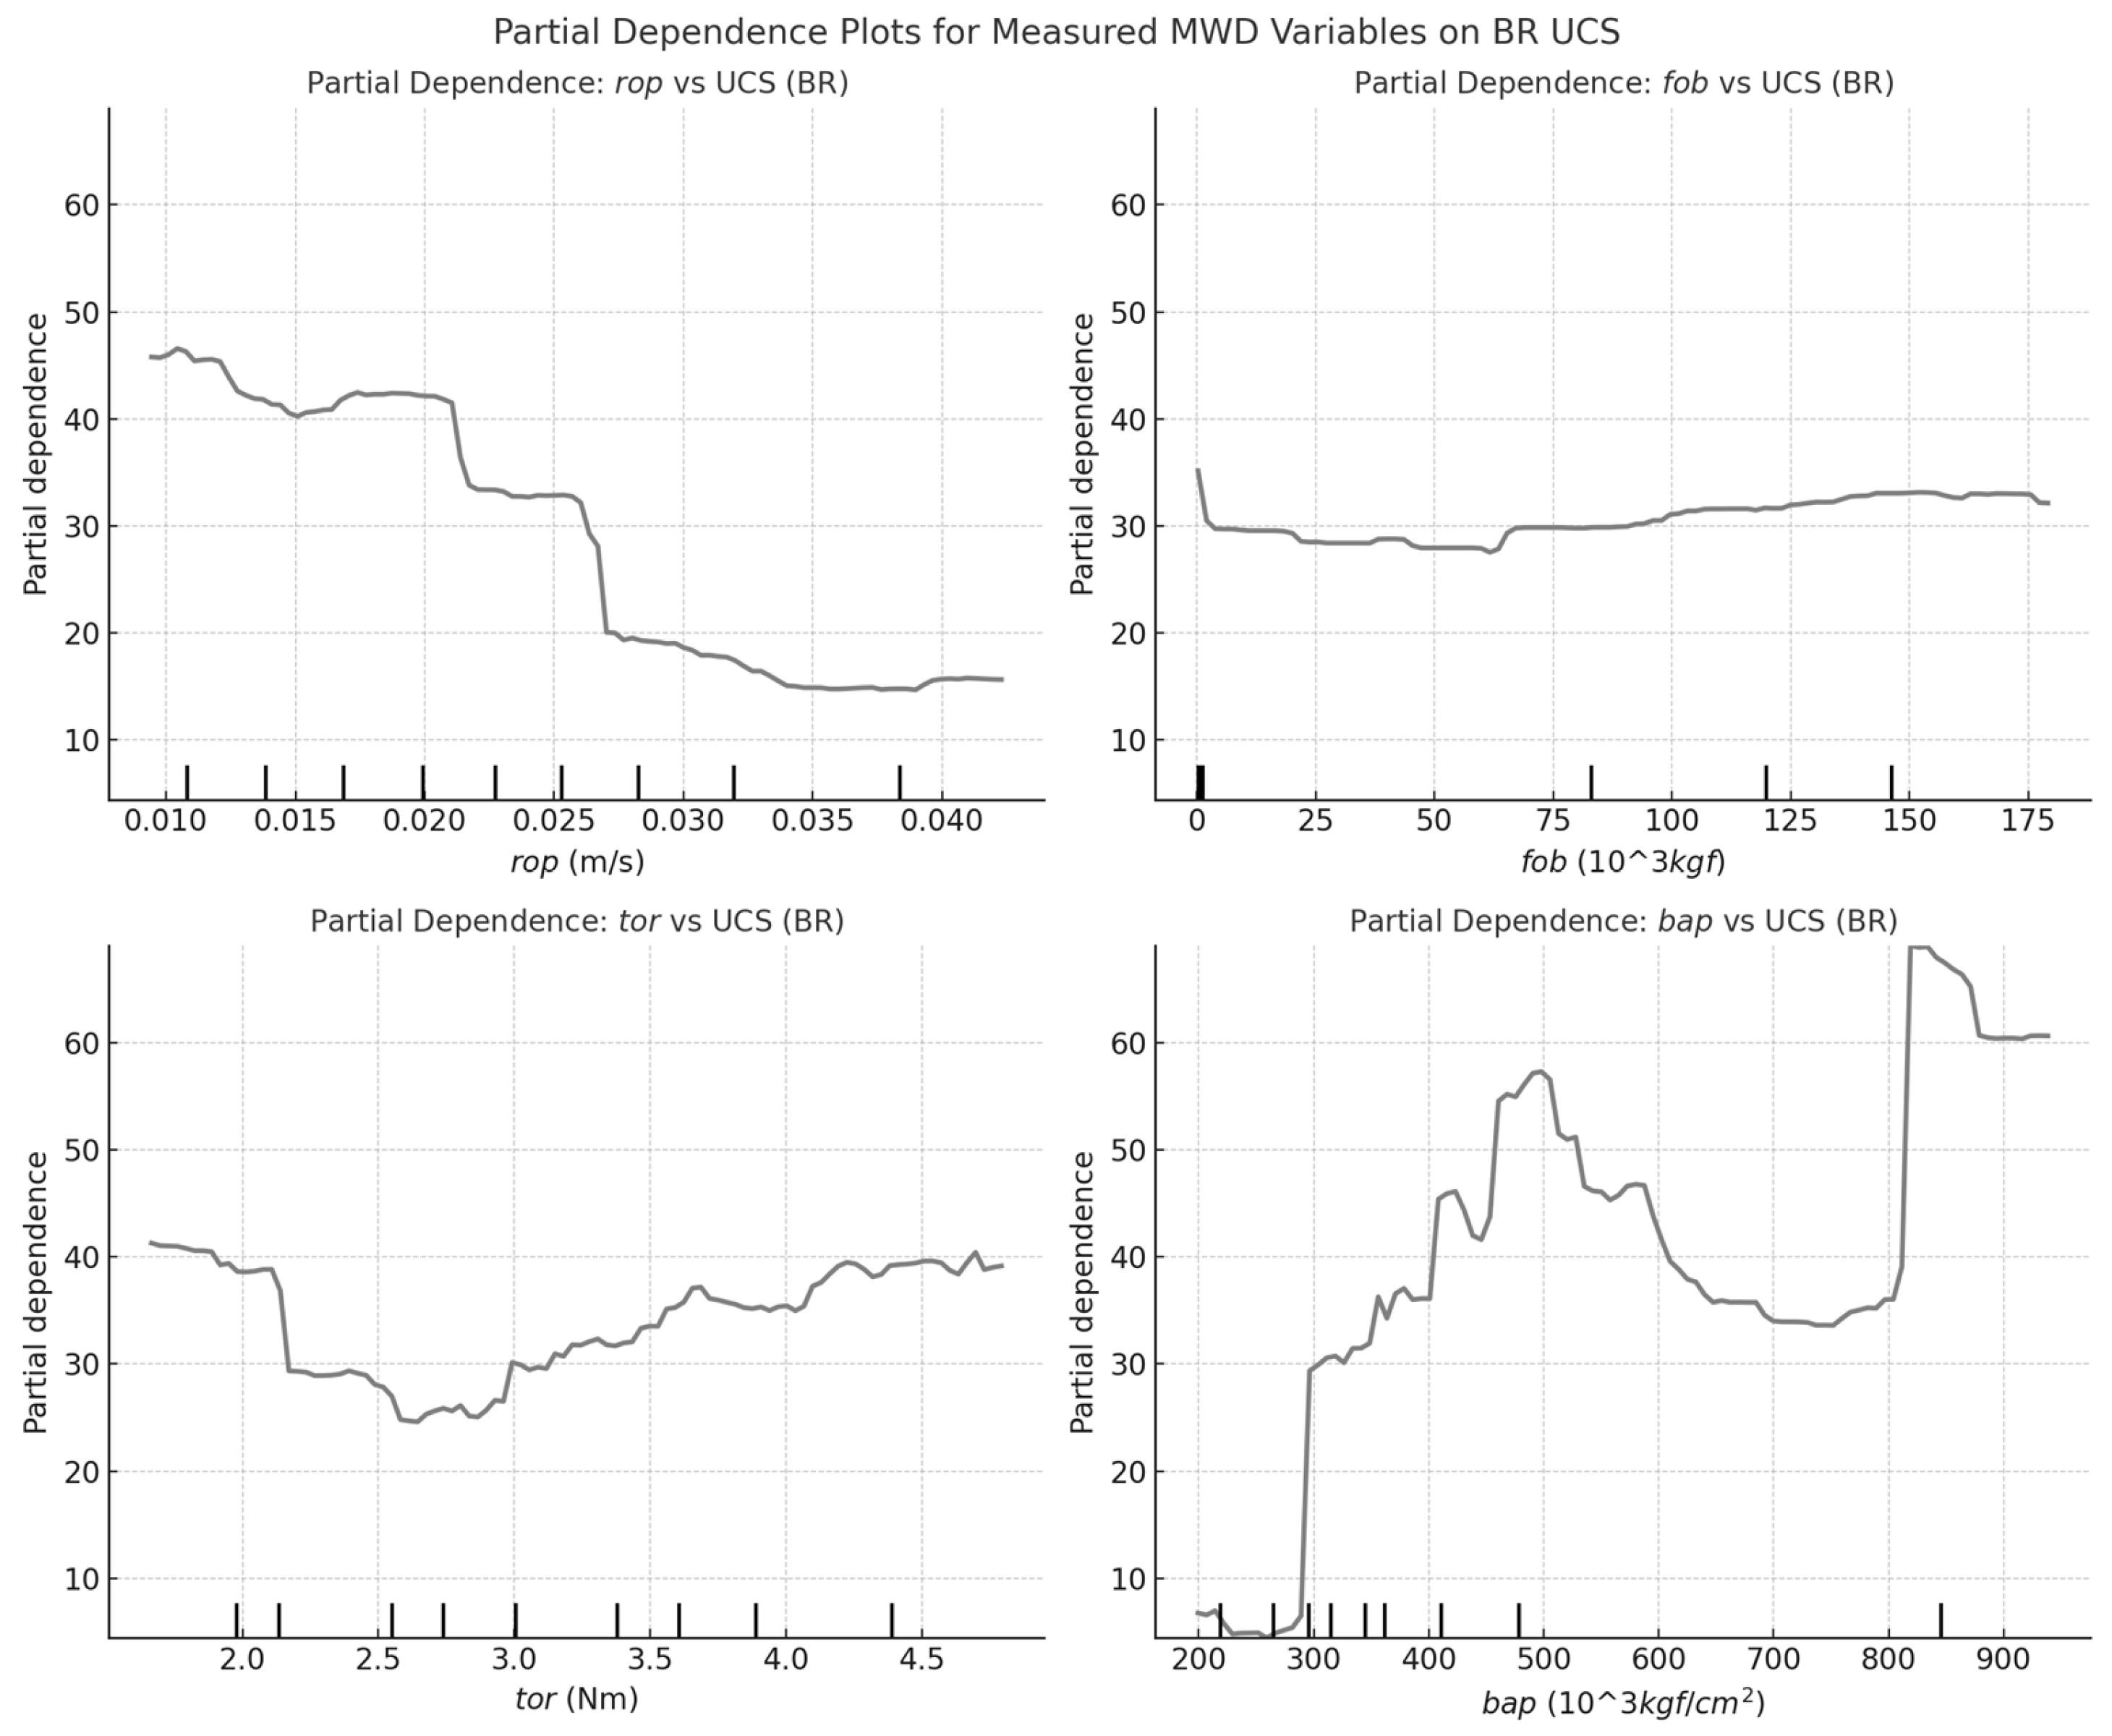
Figure 5.
Partial Dependence Plot of Measured MWD variables of UCS in MM.
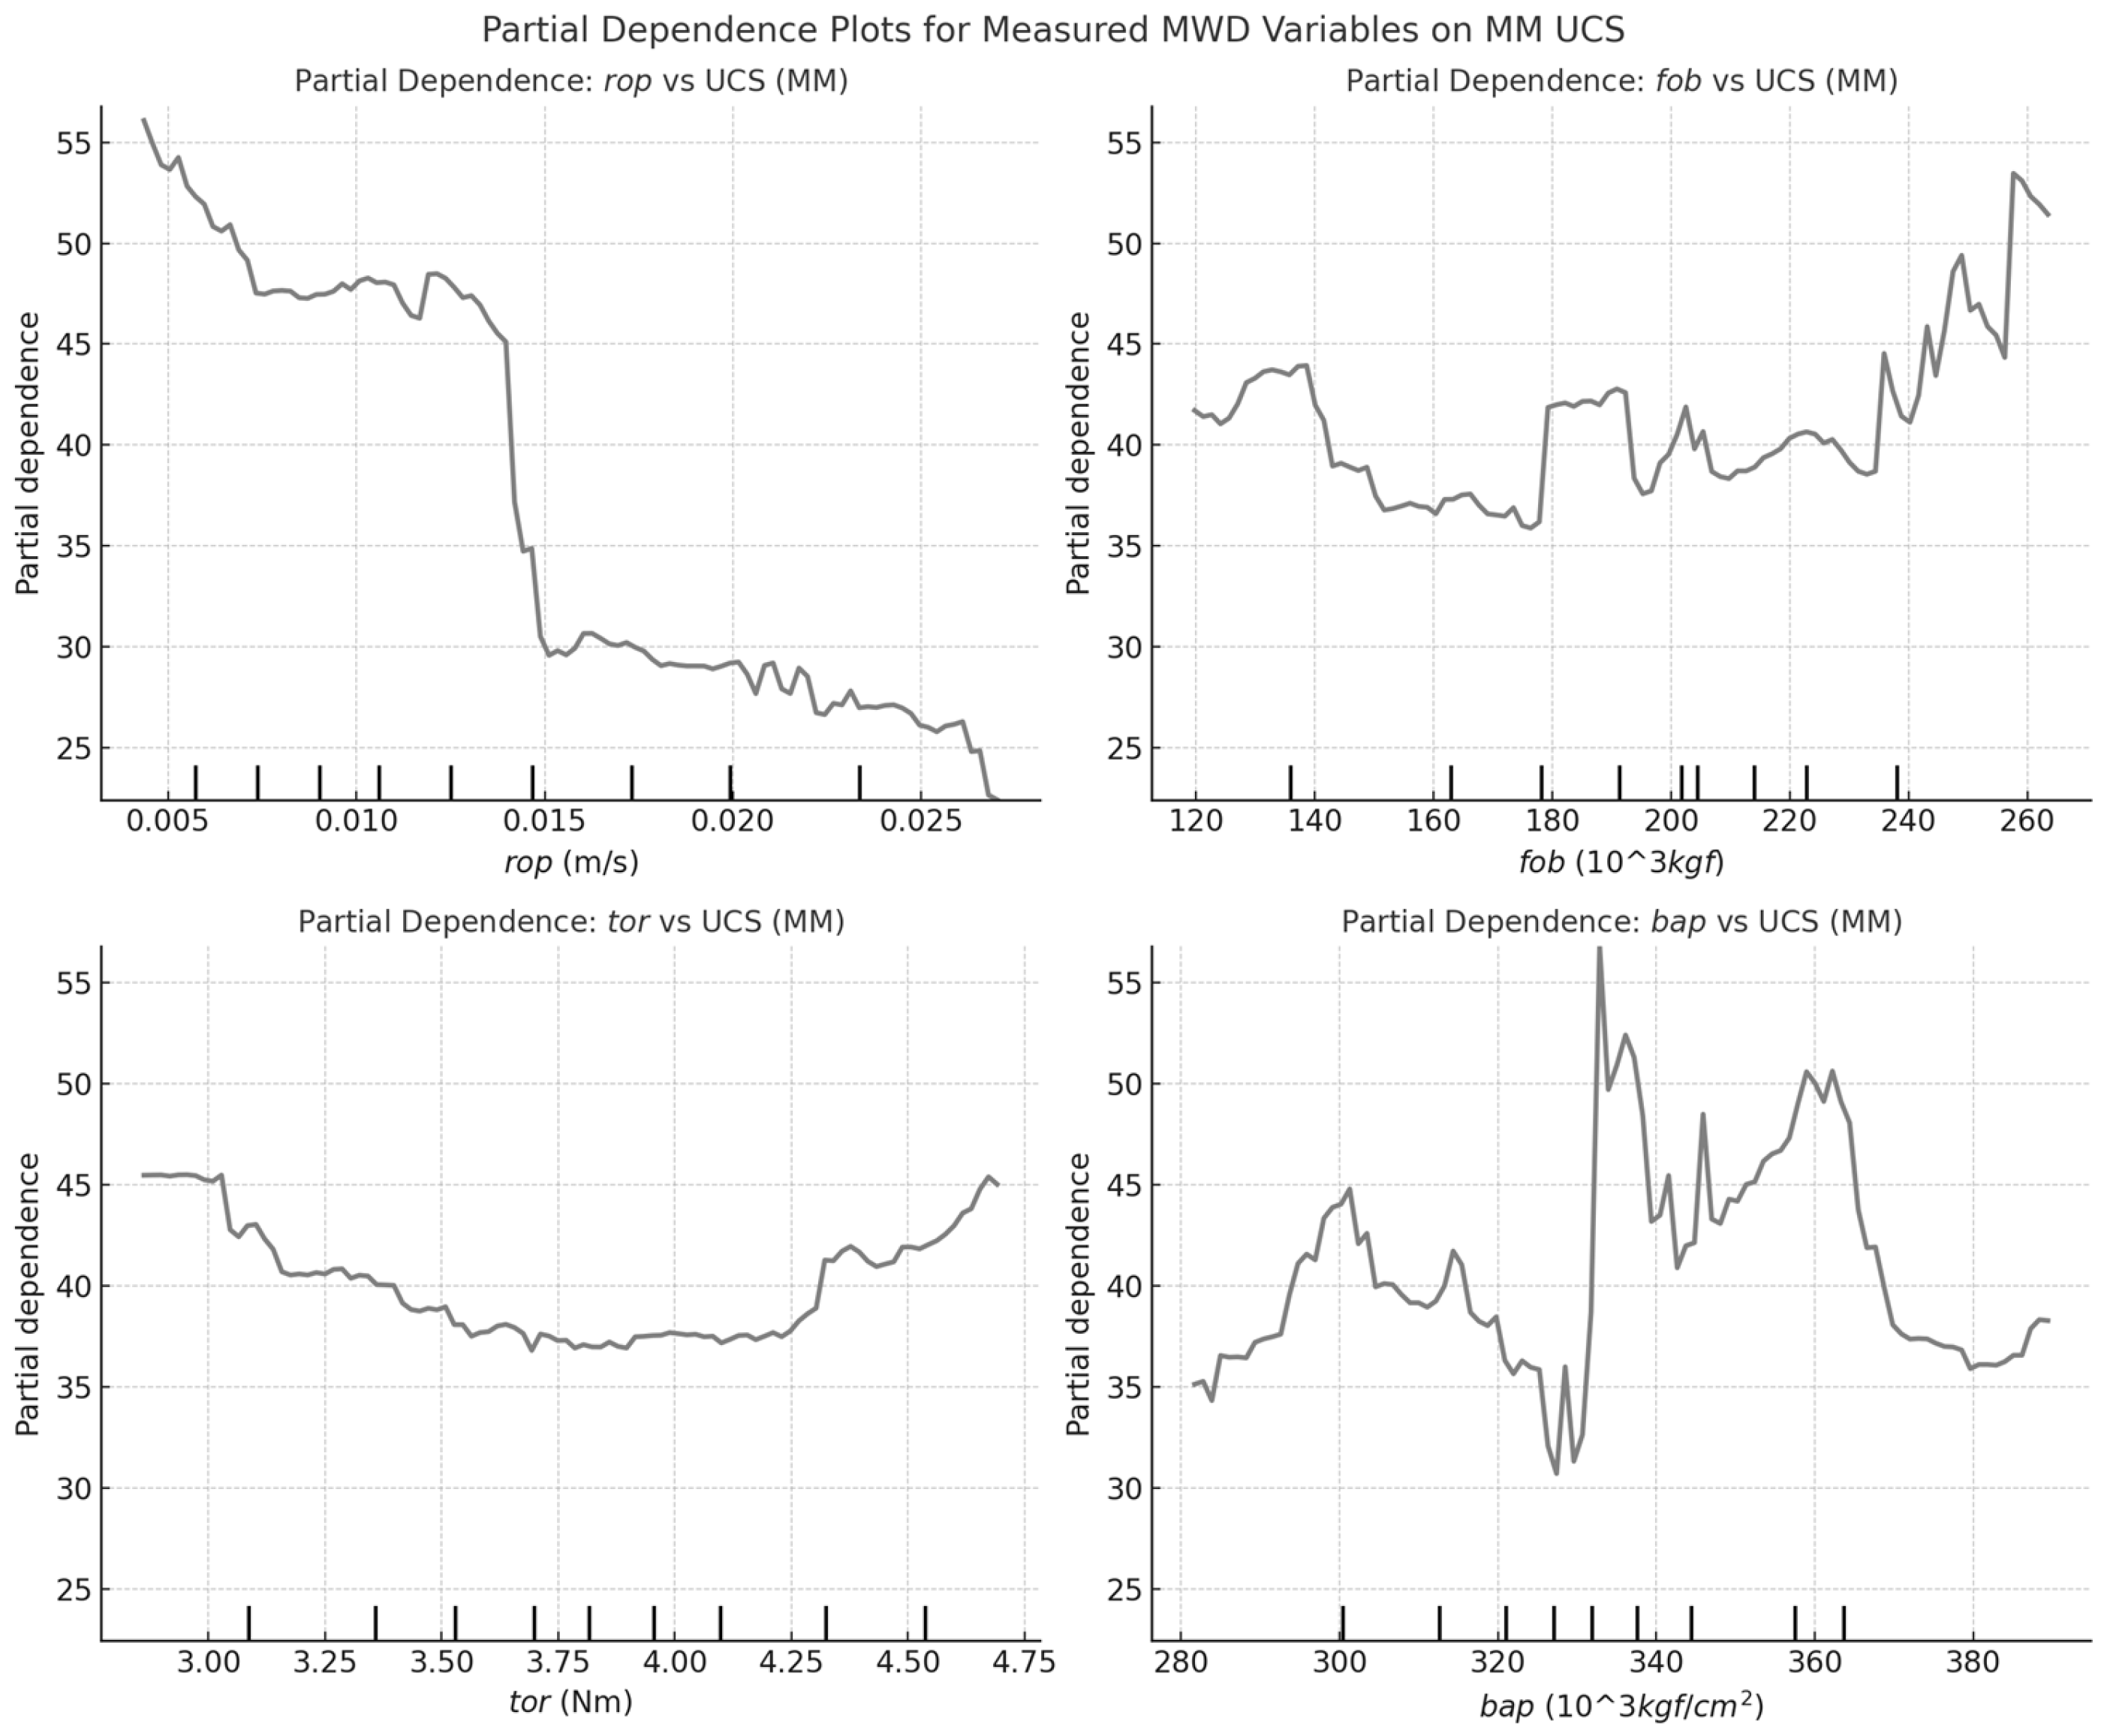
Figure 6.
Partial Dependence Plot of Measured MWD variables of FPM in BR.
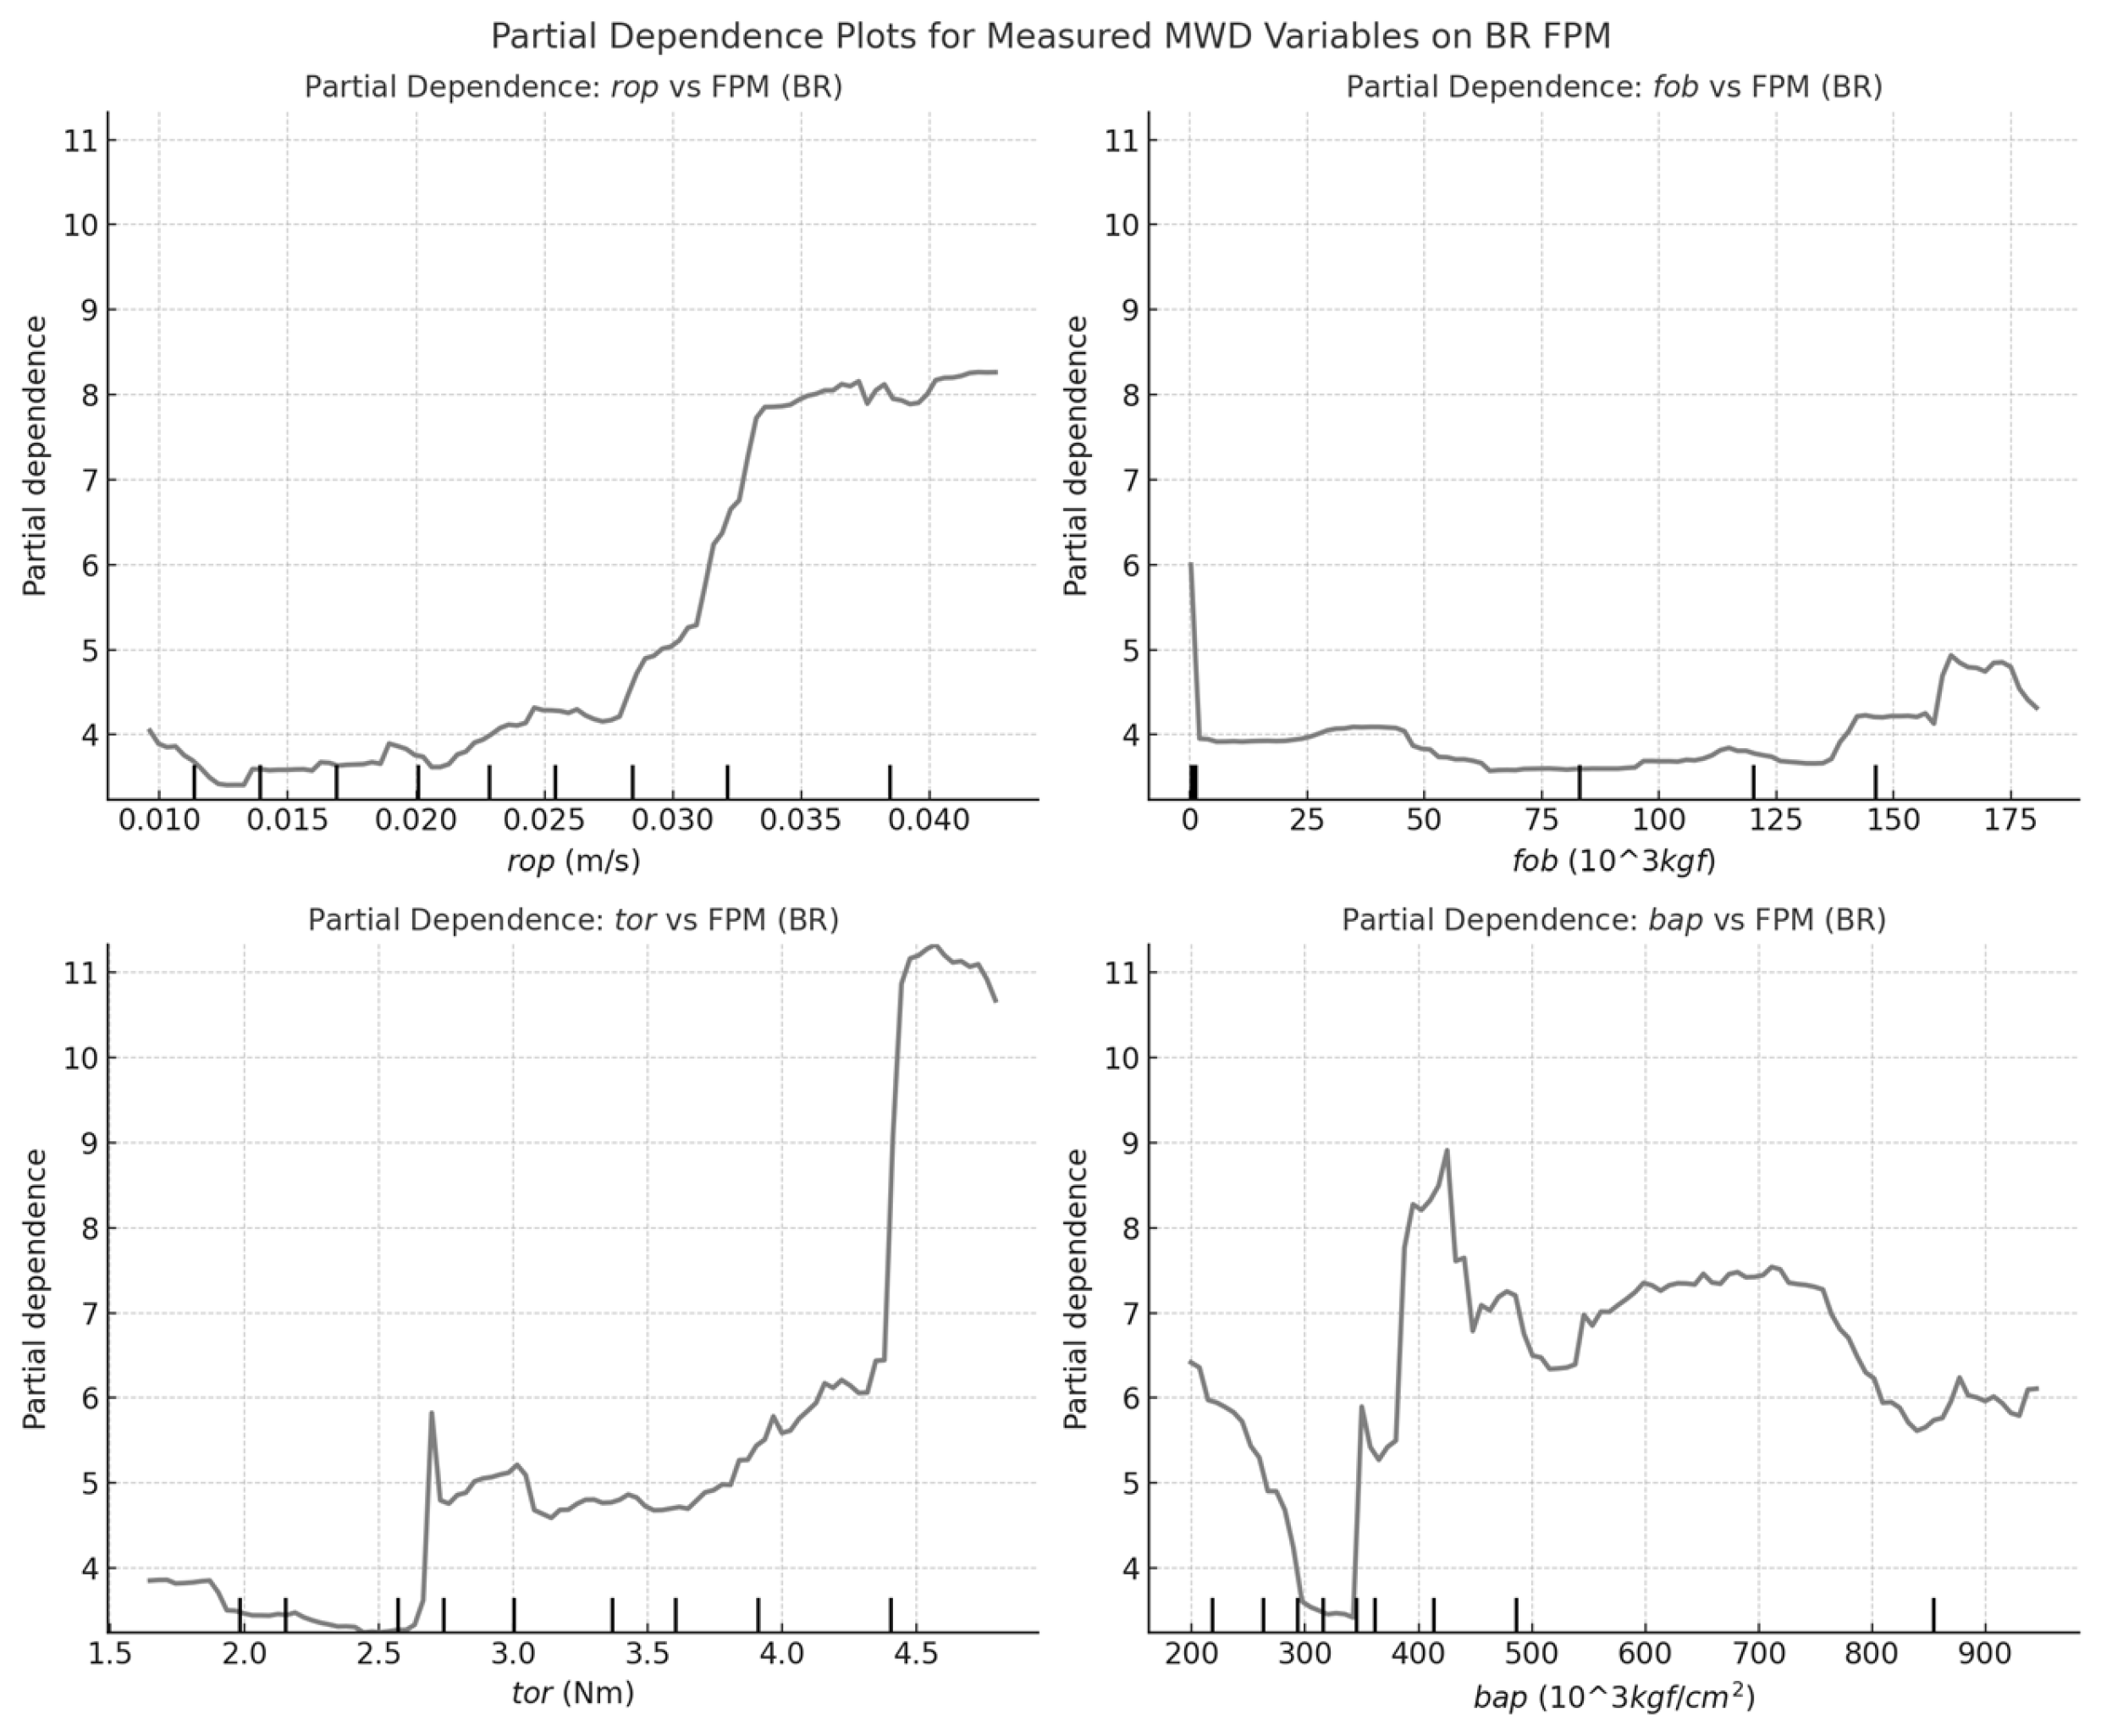
Figure 7.
Partial Dependence Plot of Measured MWD variables of FPM in MM.
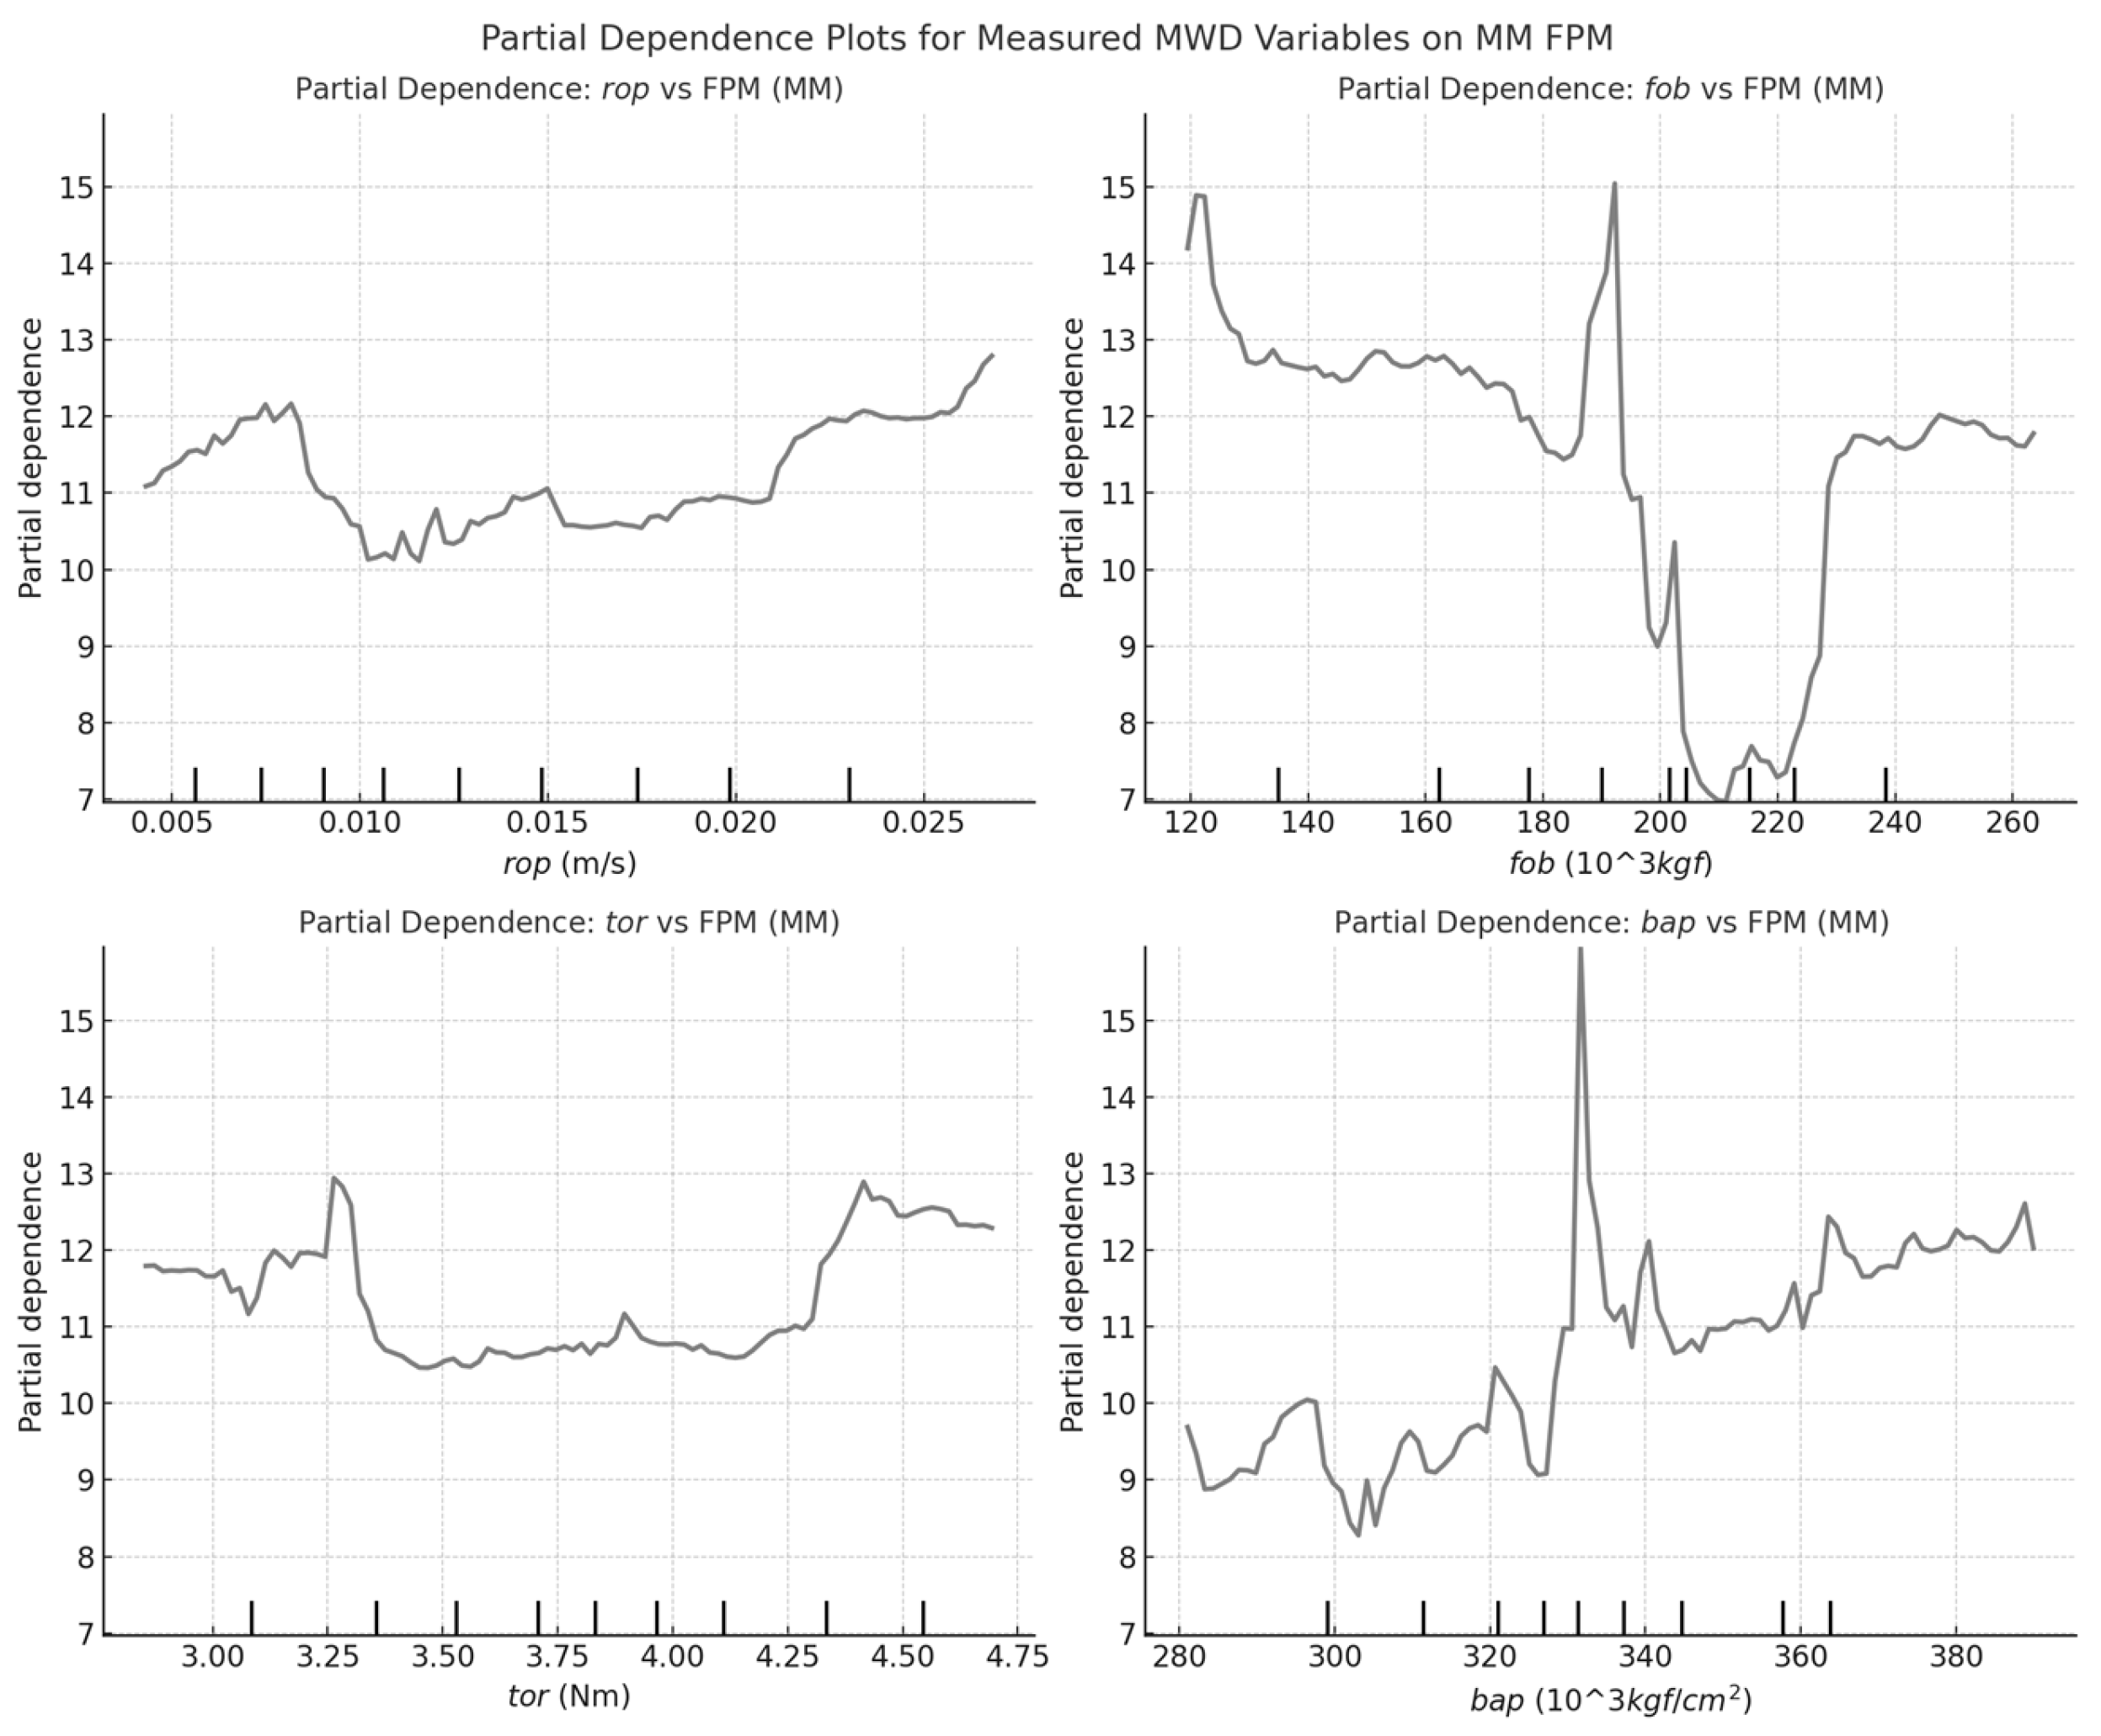
Figure 8.
Partial Dependence Plot of Measured MWD variables of GSI in BR.
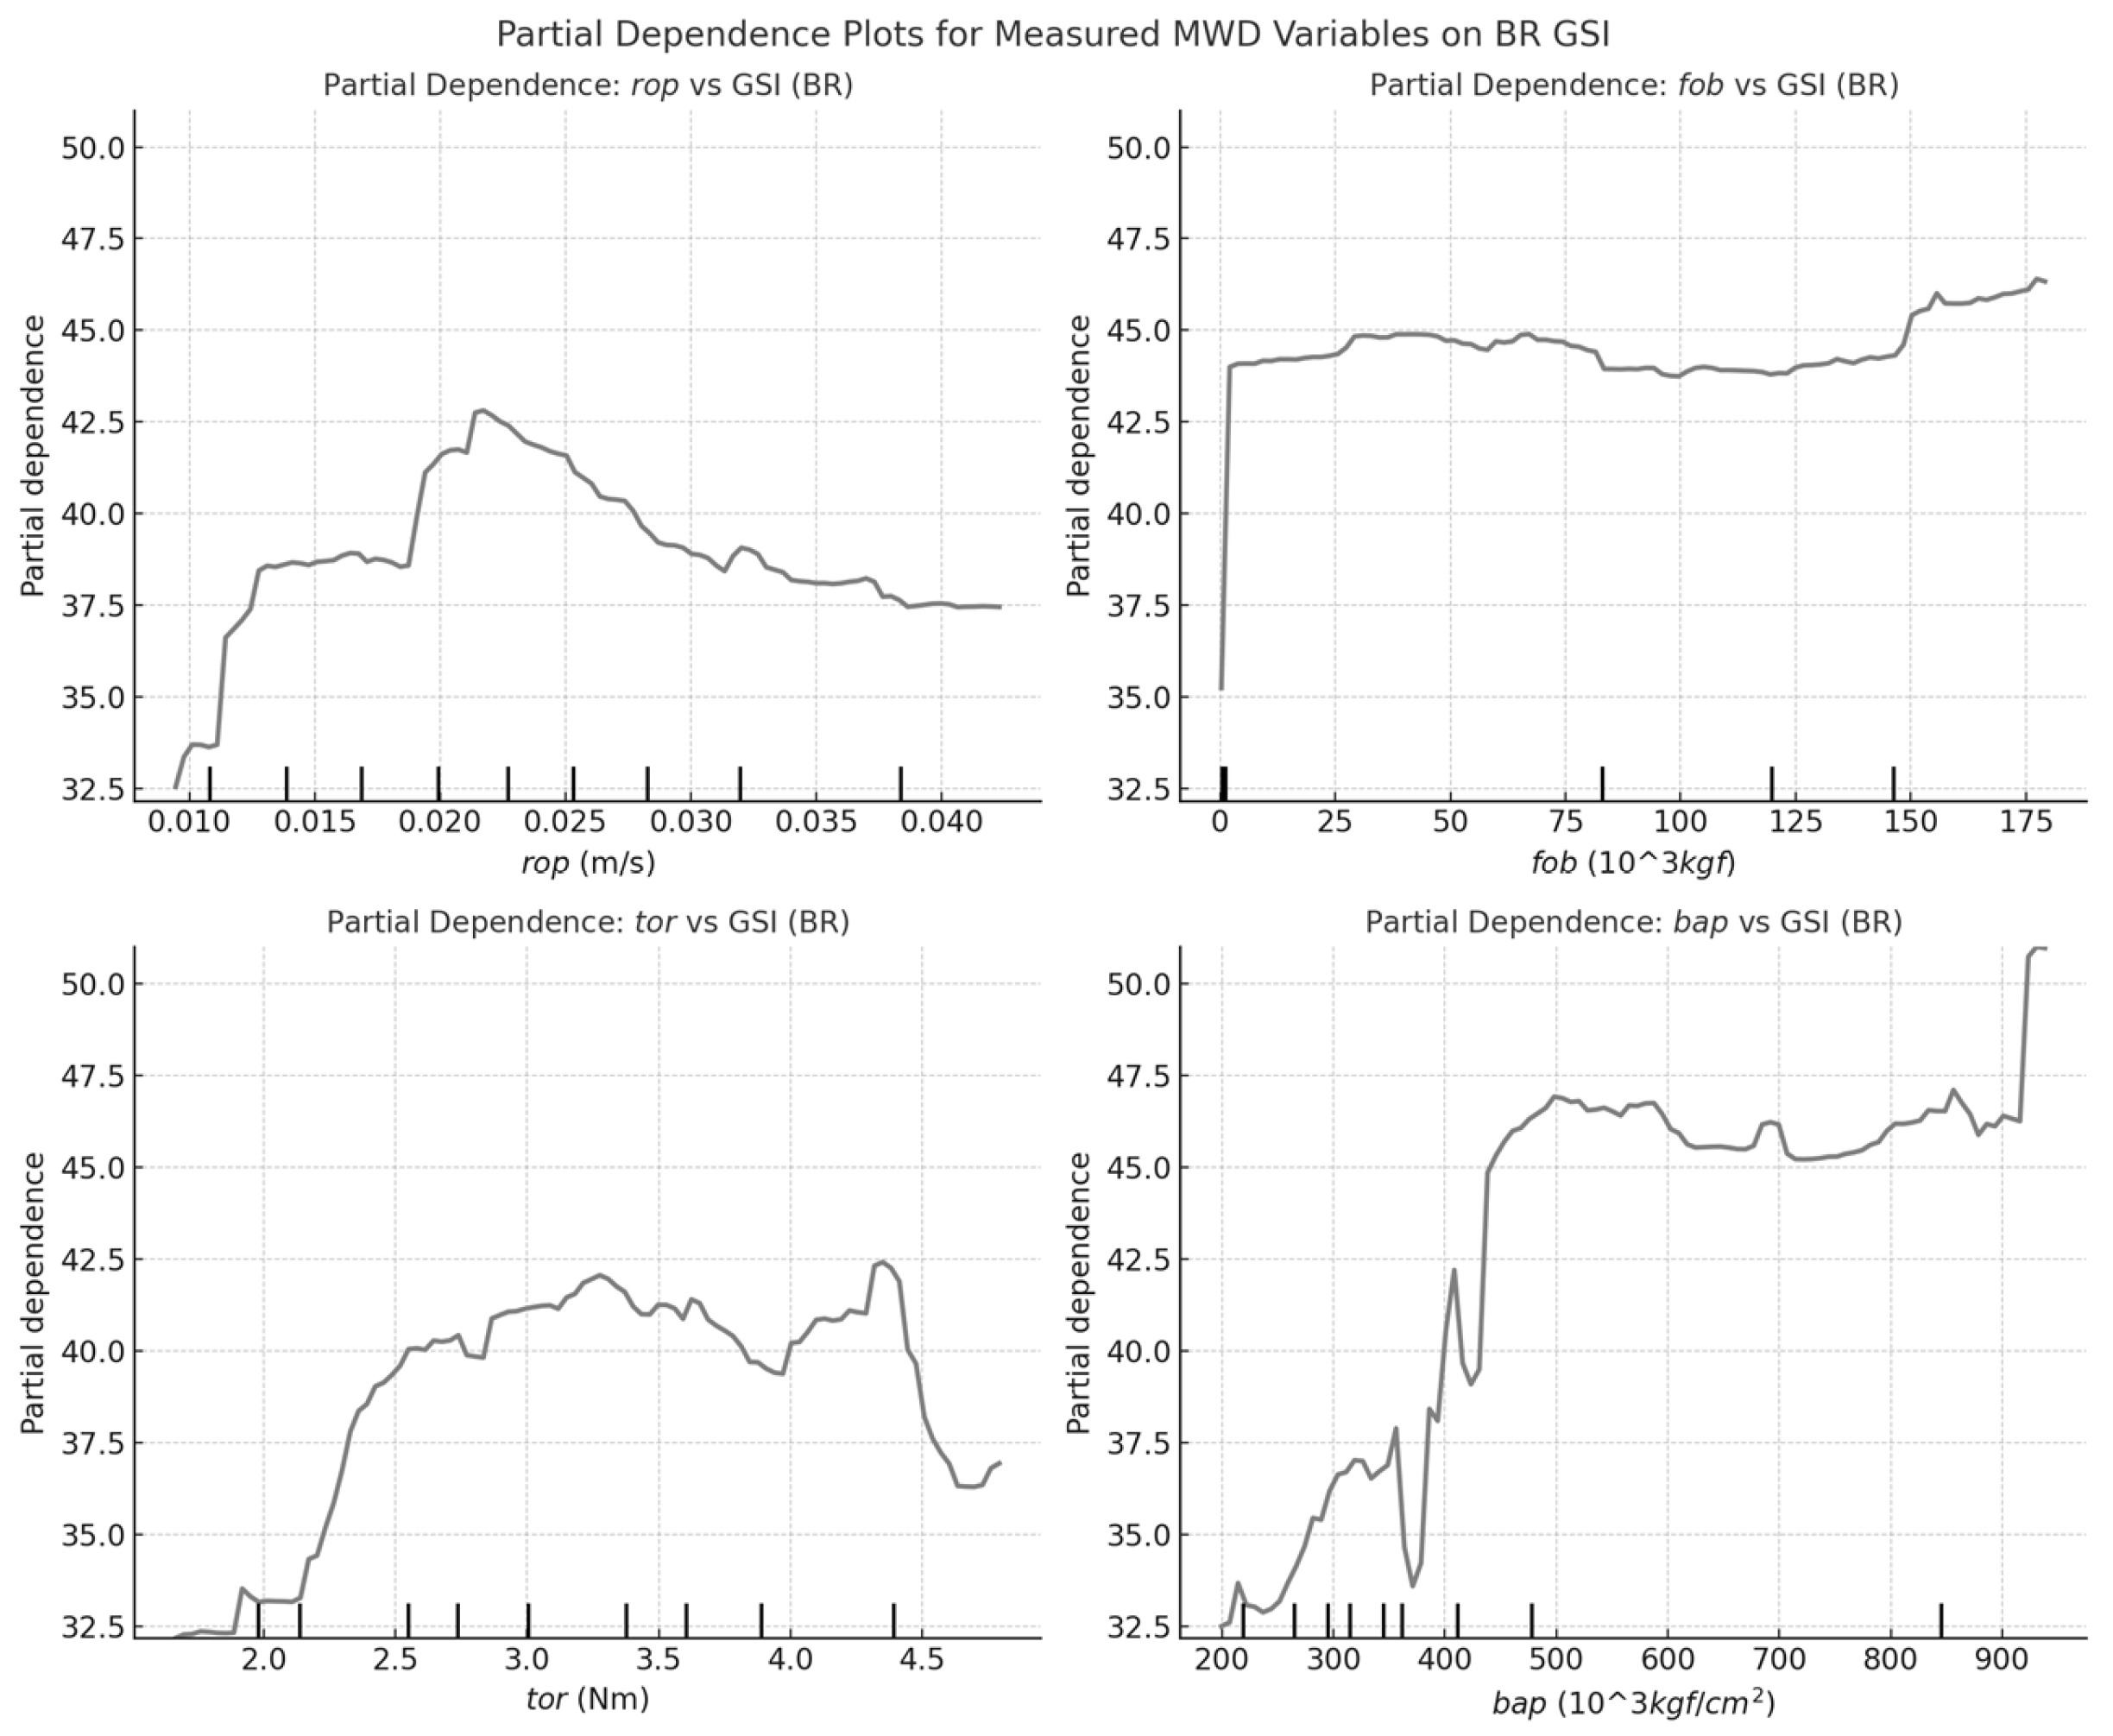
Figure 9.
Partial Dependence Plot of Measured MWD variables of GSI in MM.
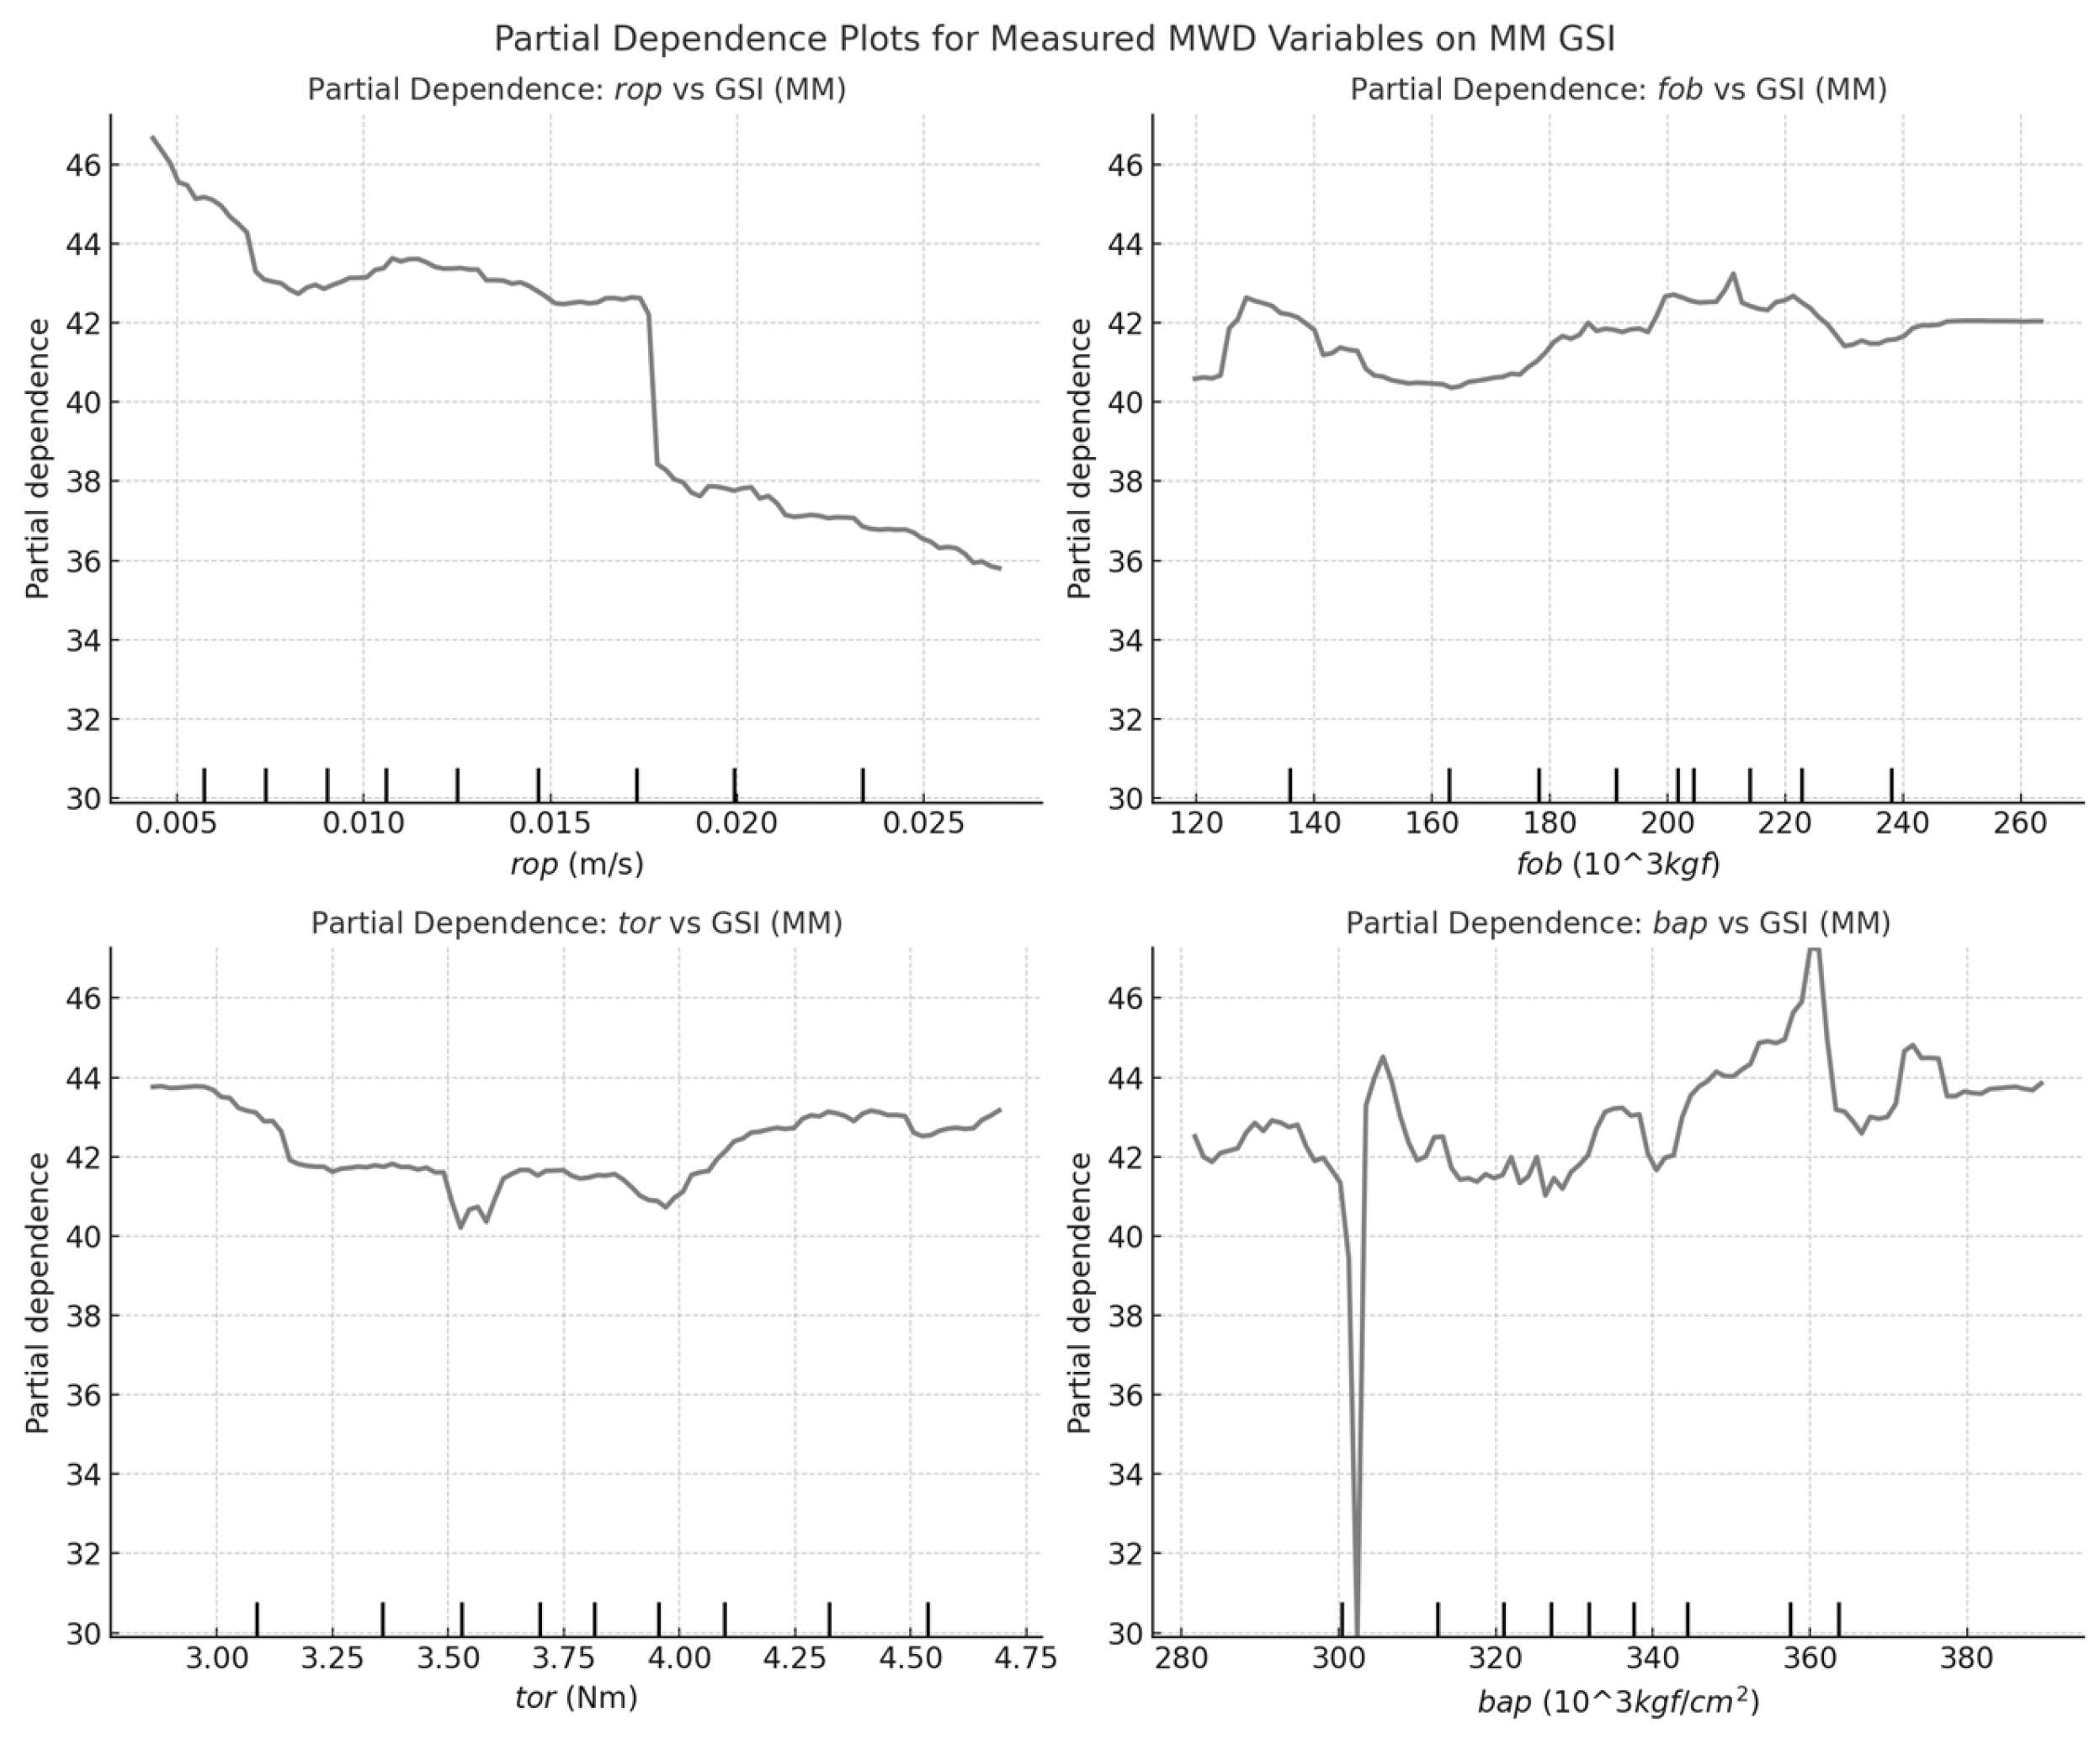
Figure 10.
Boruta-SHAP RF analysis for feature importance of UCS in BR showing a) bar plot of mean absolute SHAP values and b) swarm chart showing impact on model output.
Figure 10.
Boruta-SHAP RF analysis for feature importance of UCS in BR showing a) bar plot of mean absolute SHAP values and b) swarm chart showing impact on model output.
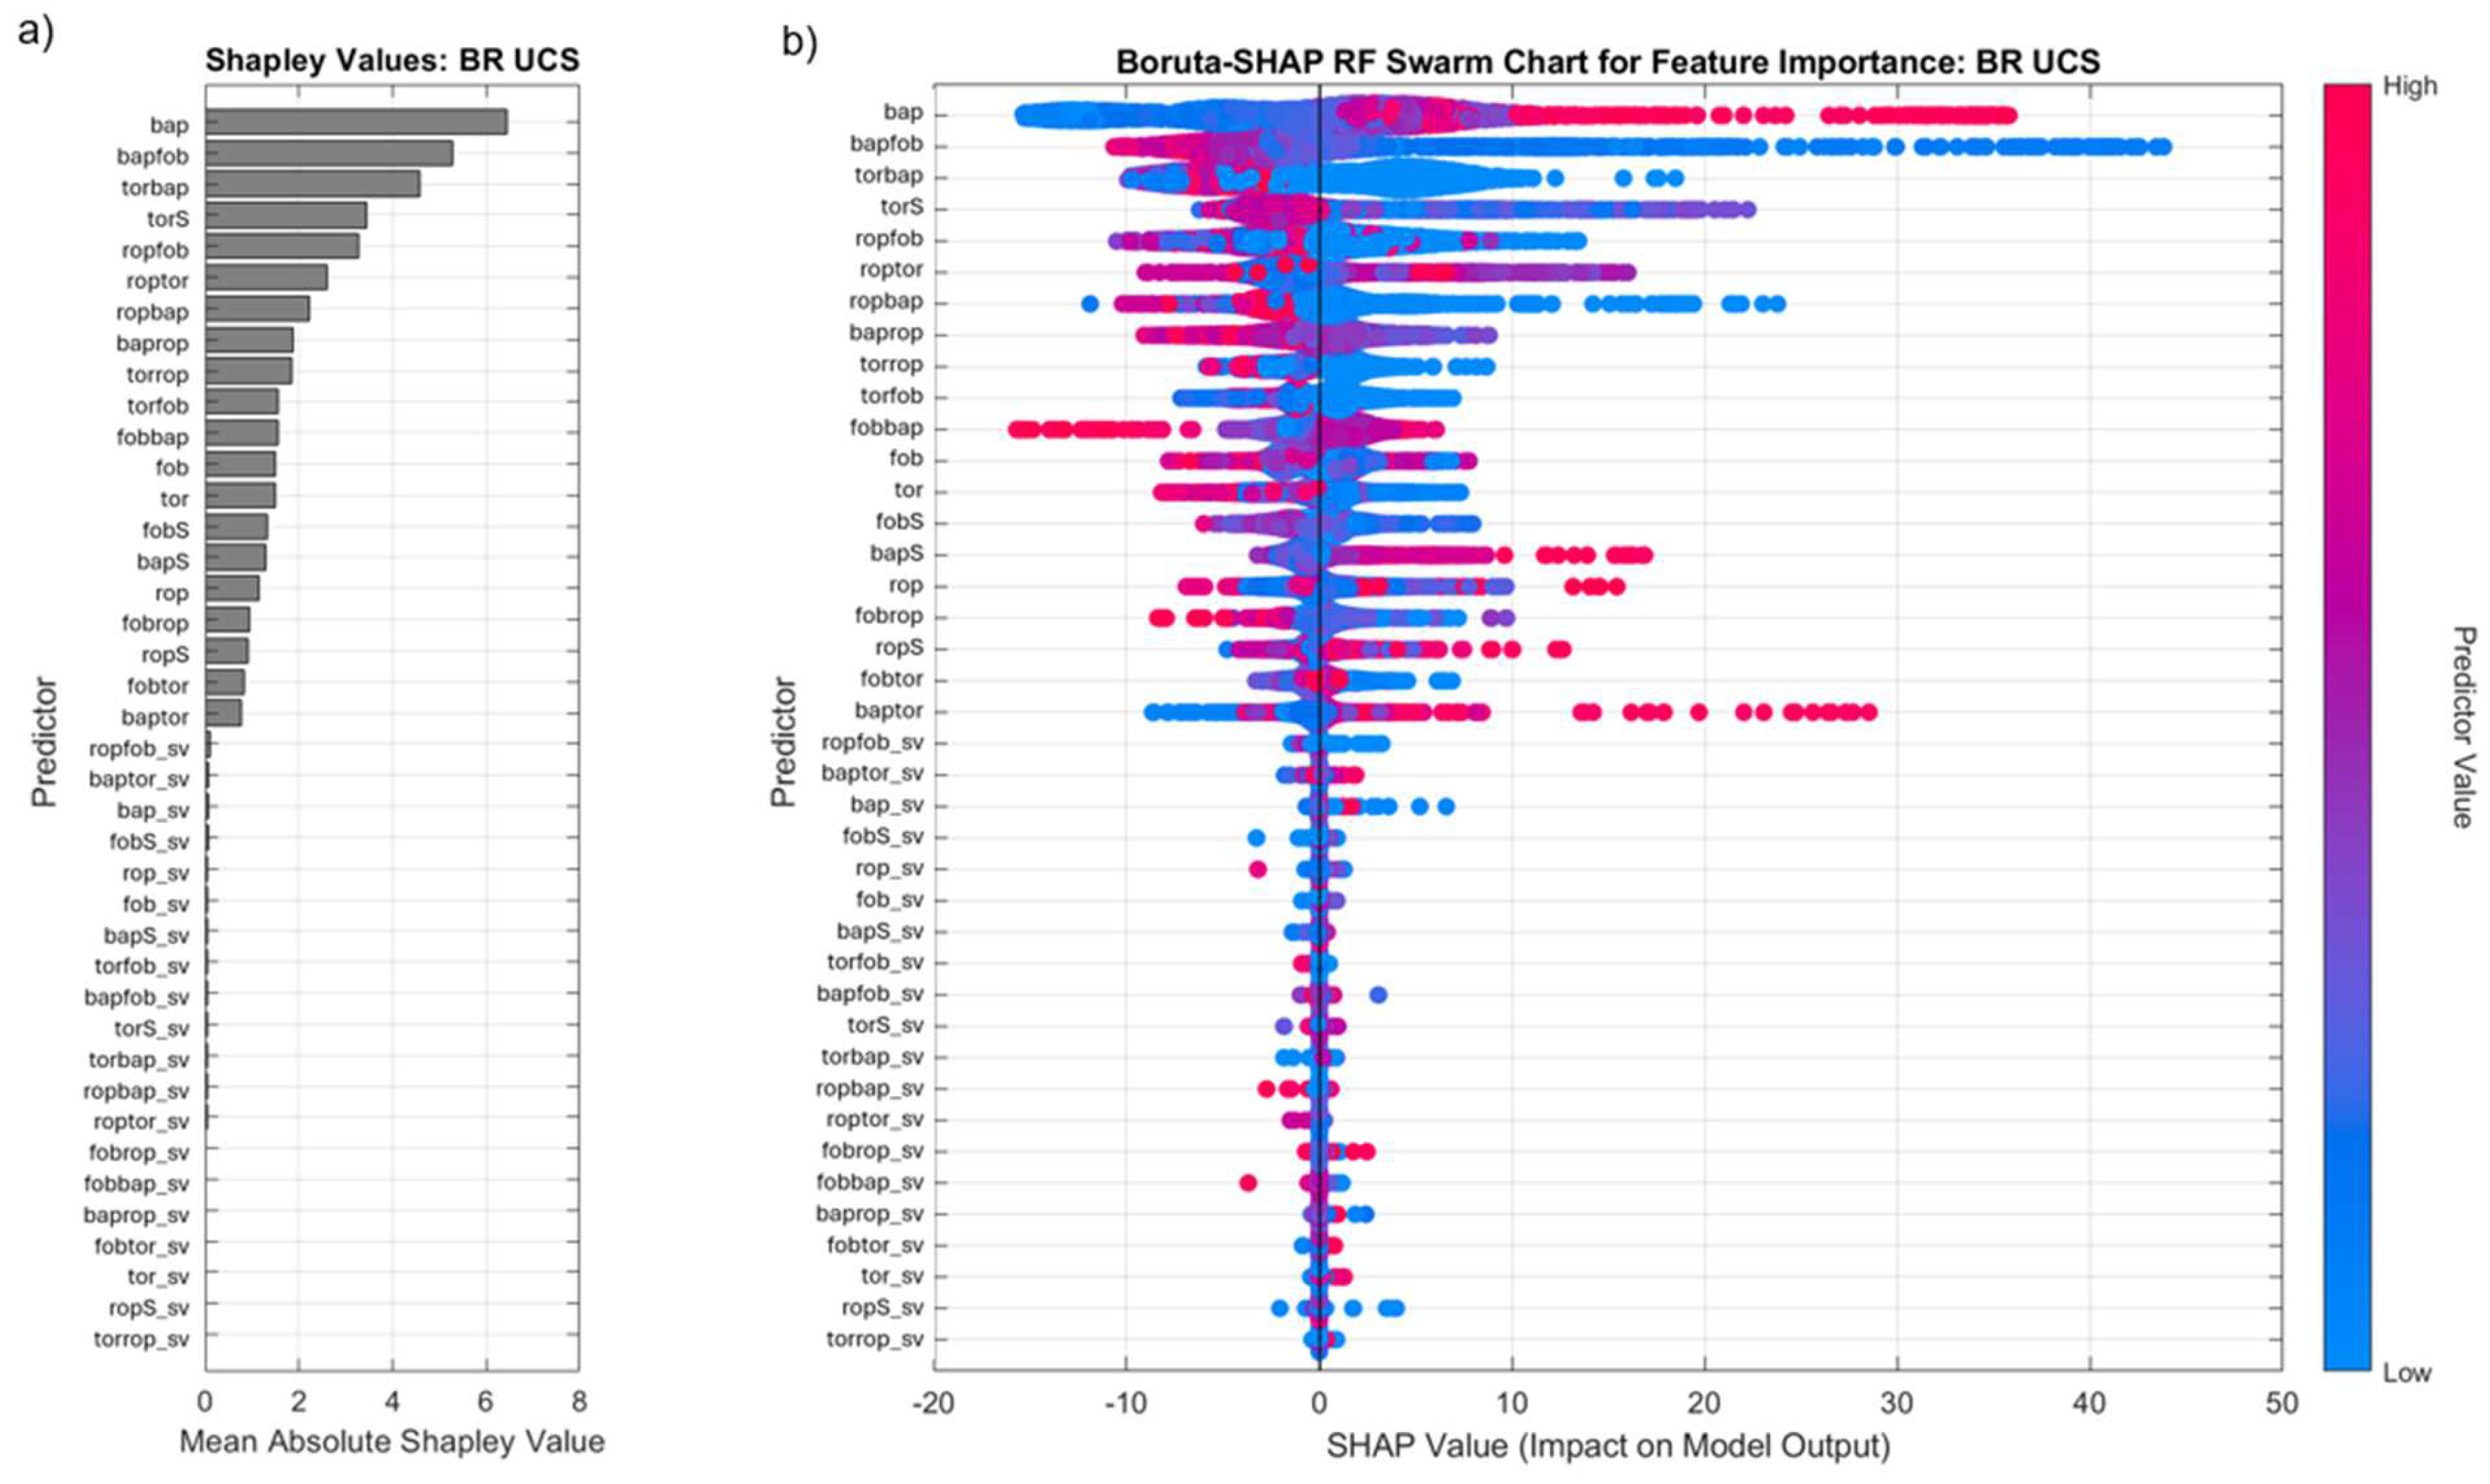
Figure 11.
Boruta-SHAP RF analysis for feature importance of UCS in MM showing a) bar plot of mean absolute SHAP values and b) swarm chart showing impact on model output.
Figure 11.
Boruta-SHAP RF analysis for feature importance of UCS in MM showing a) bar plot of mean absolute SHAP values and b) swarm chart showing impact on model output.
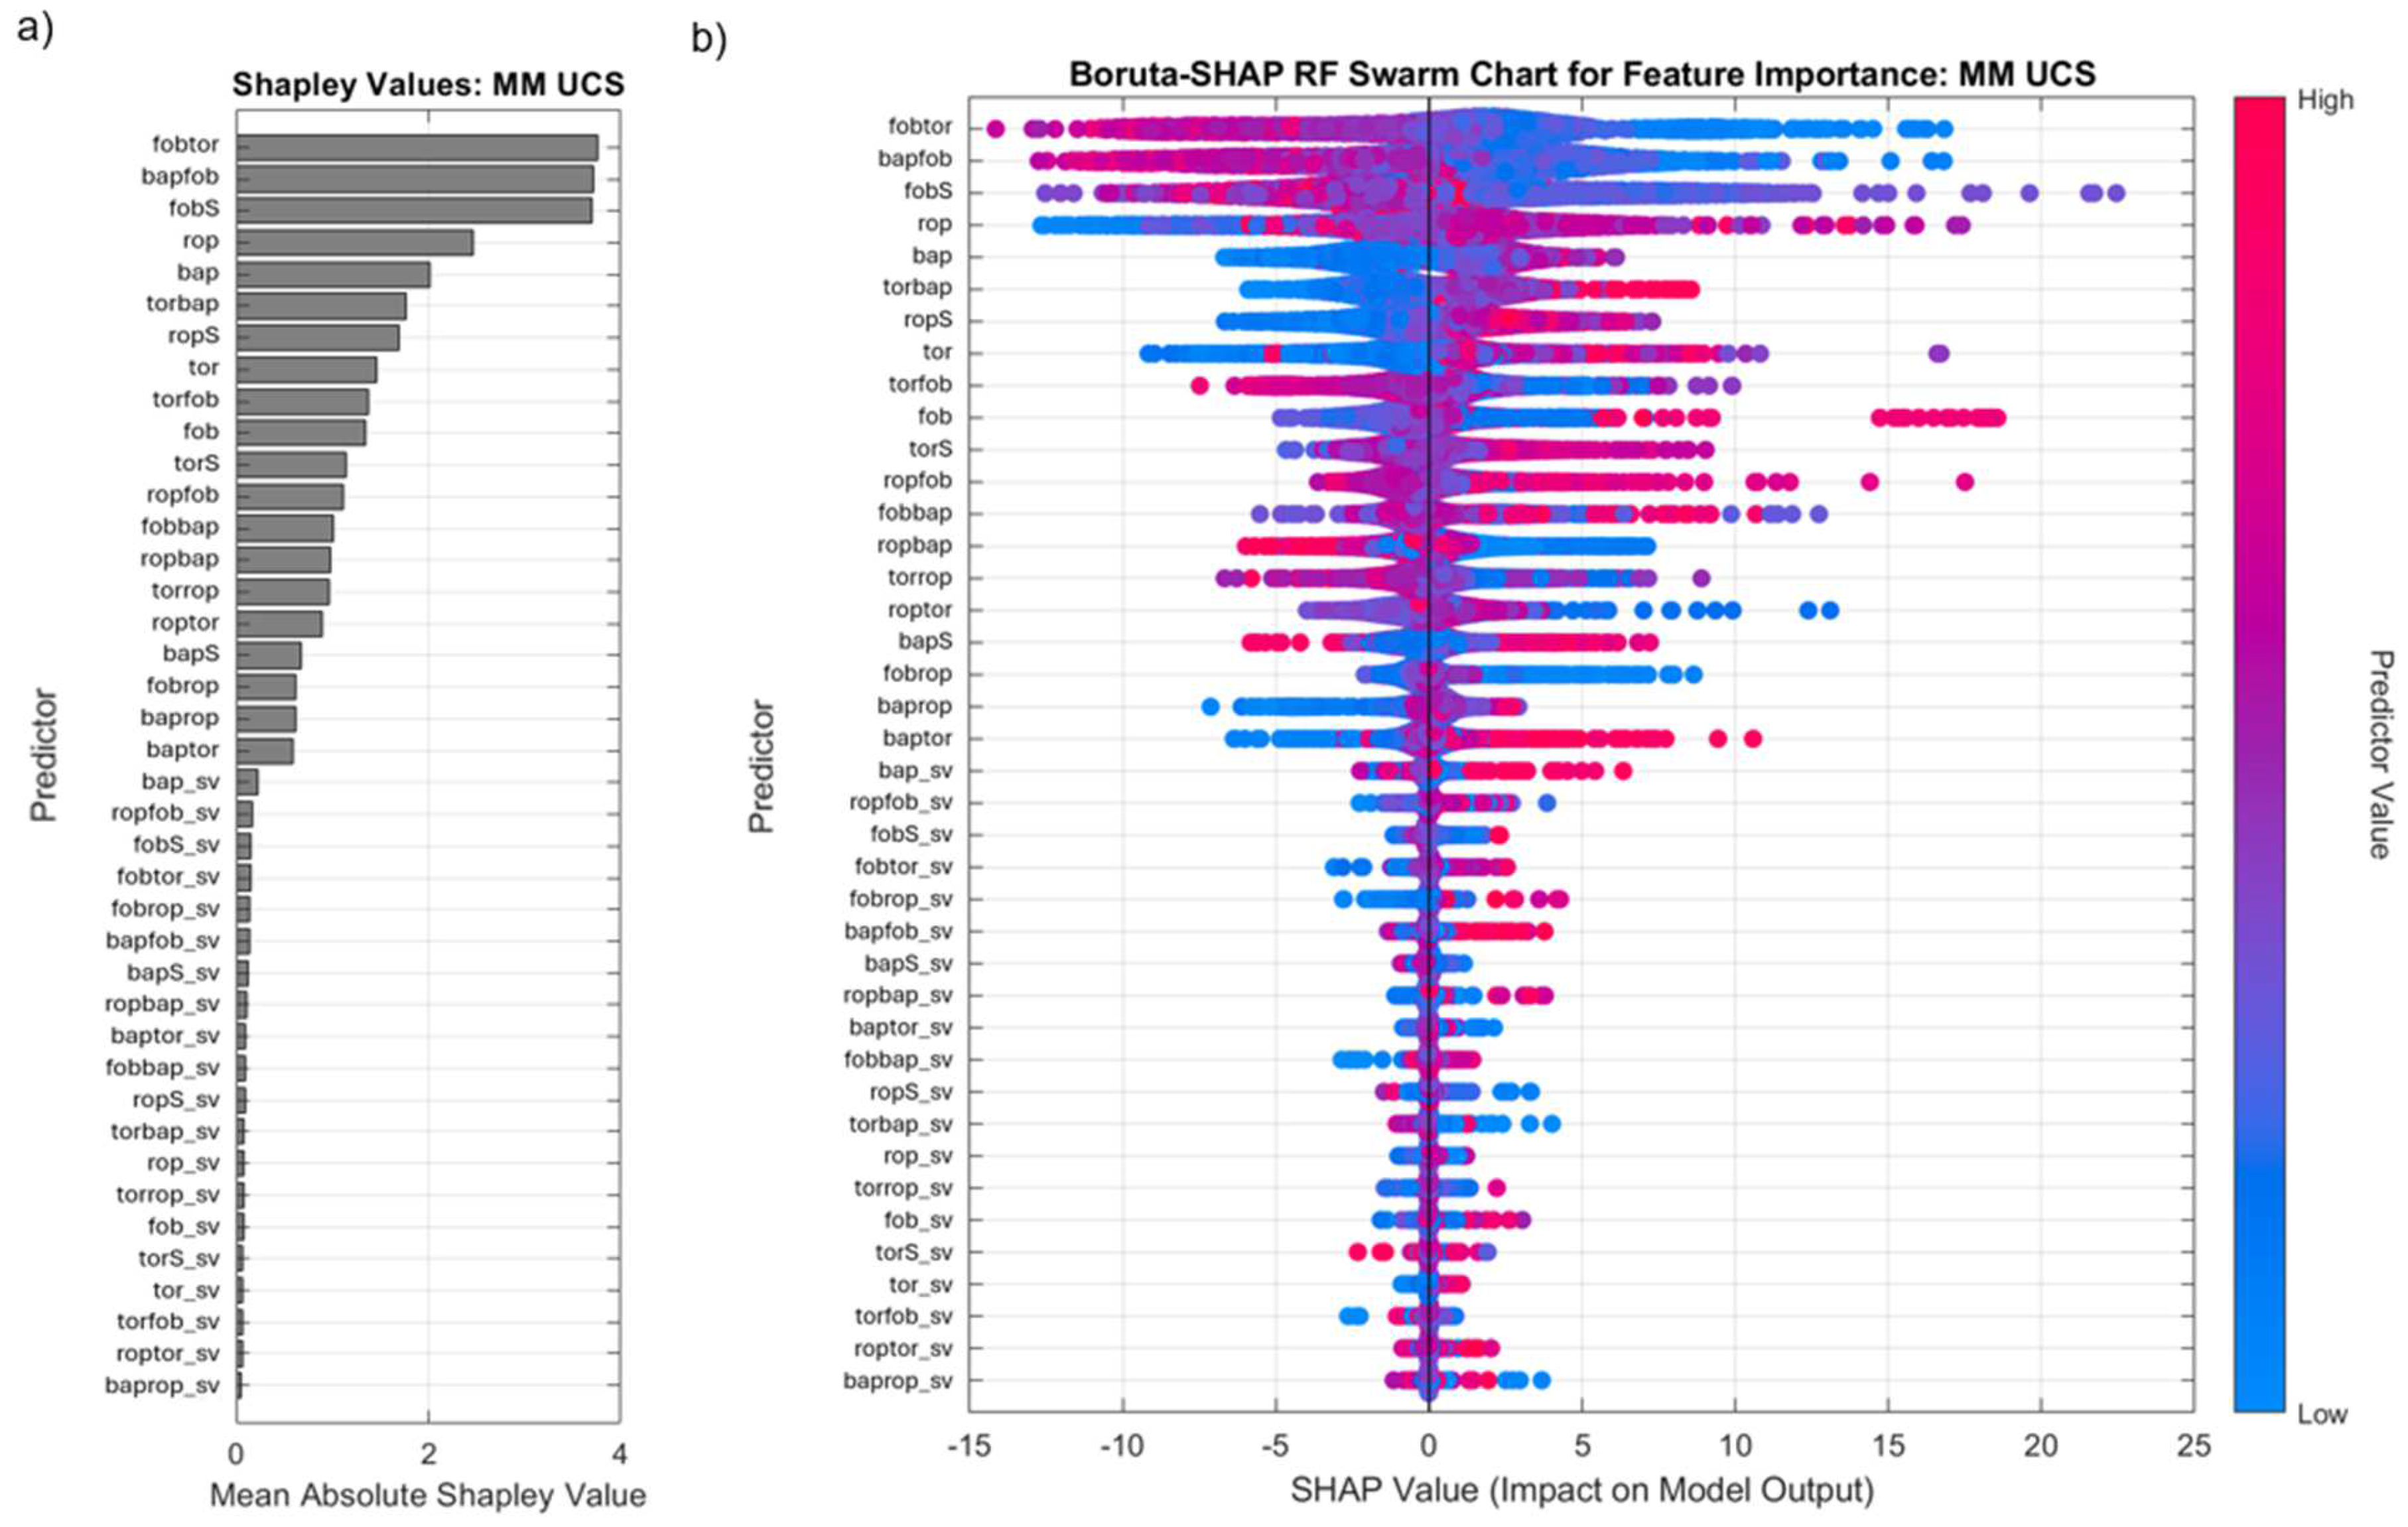
Figure 12.
Boruta-SHAP RF analysis for feature importance of FPM in BR showing a) bar plot of mean absolute SHAP values and b) swarm chart showing impact on model output.
Figure 12.
Boruta-SHAP RF analysis for feature importance of FPM in BR showing a) bar plot of mean absolute SHAP values and b) swarm chart showing impact on model output.
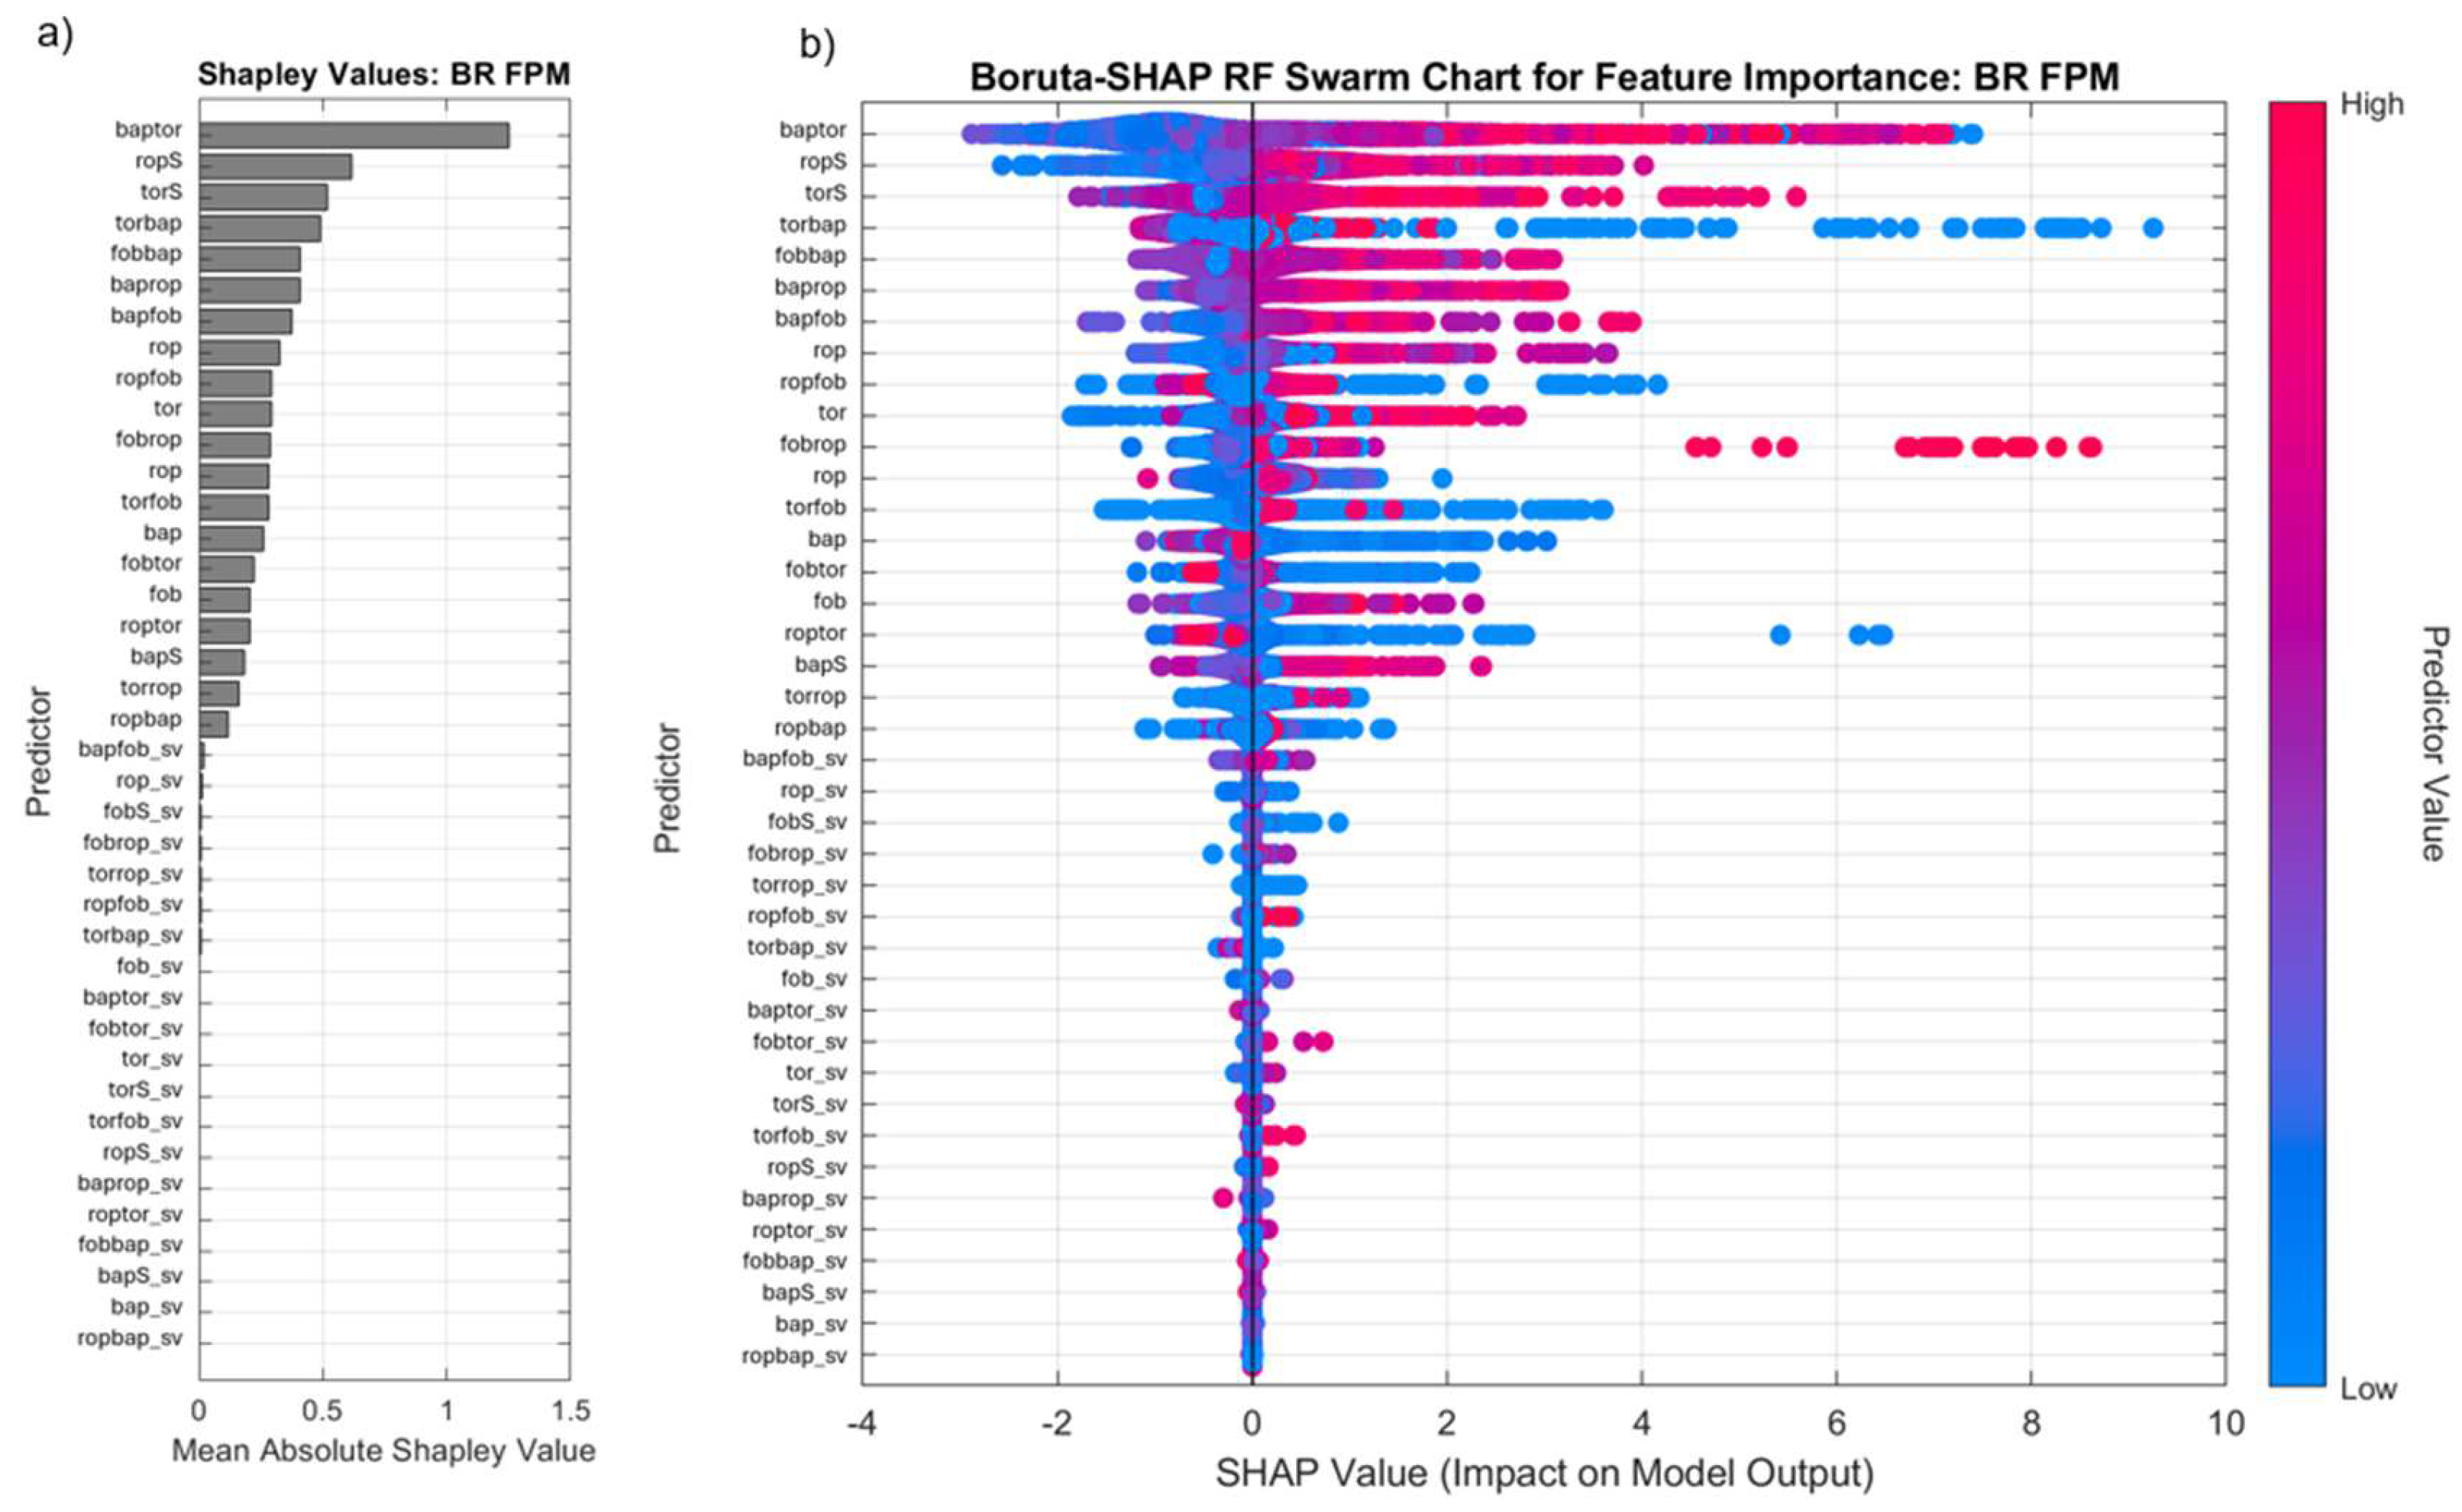
Figure 13.
Boruta-SHAP RF analysis for feature importance of FPM in MM showing a) bar plot of mean absolute SHAP values and b) swarm chart showing impact on model output.
Figure 13.
Boruta-SHAP RF analysis for feature importance of FPM in MM showing a) bar plot of mean absolute SHAP values and b) swarm chart showing impact on model output.
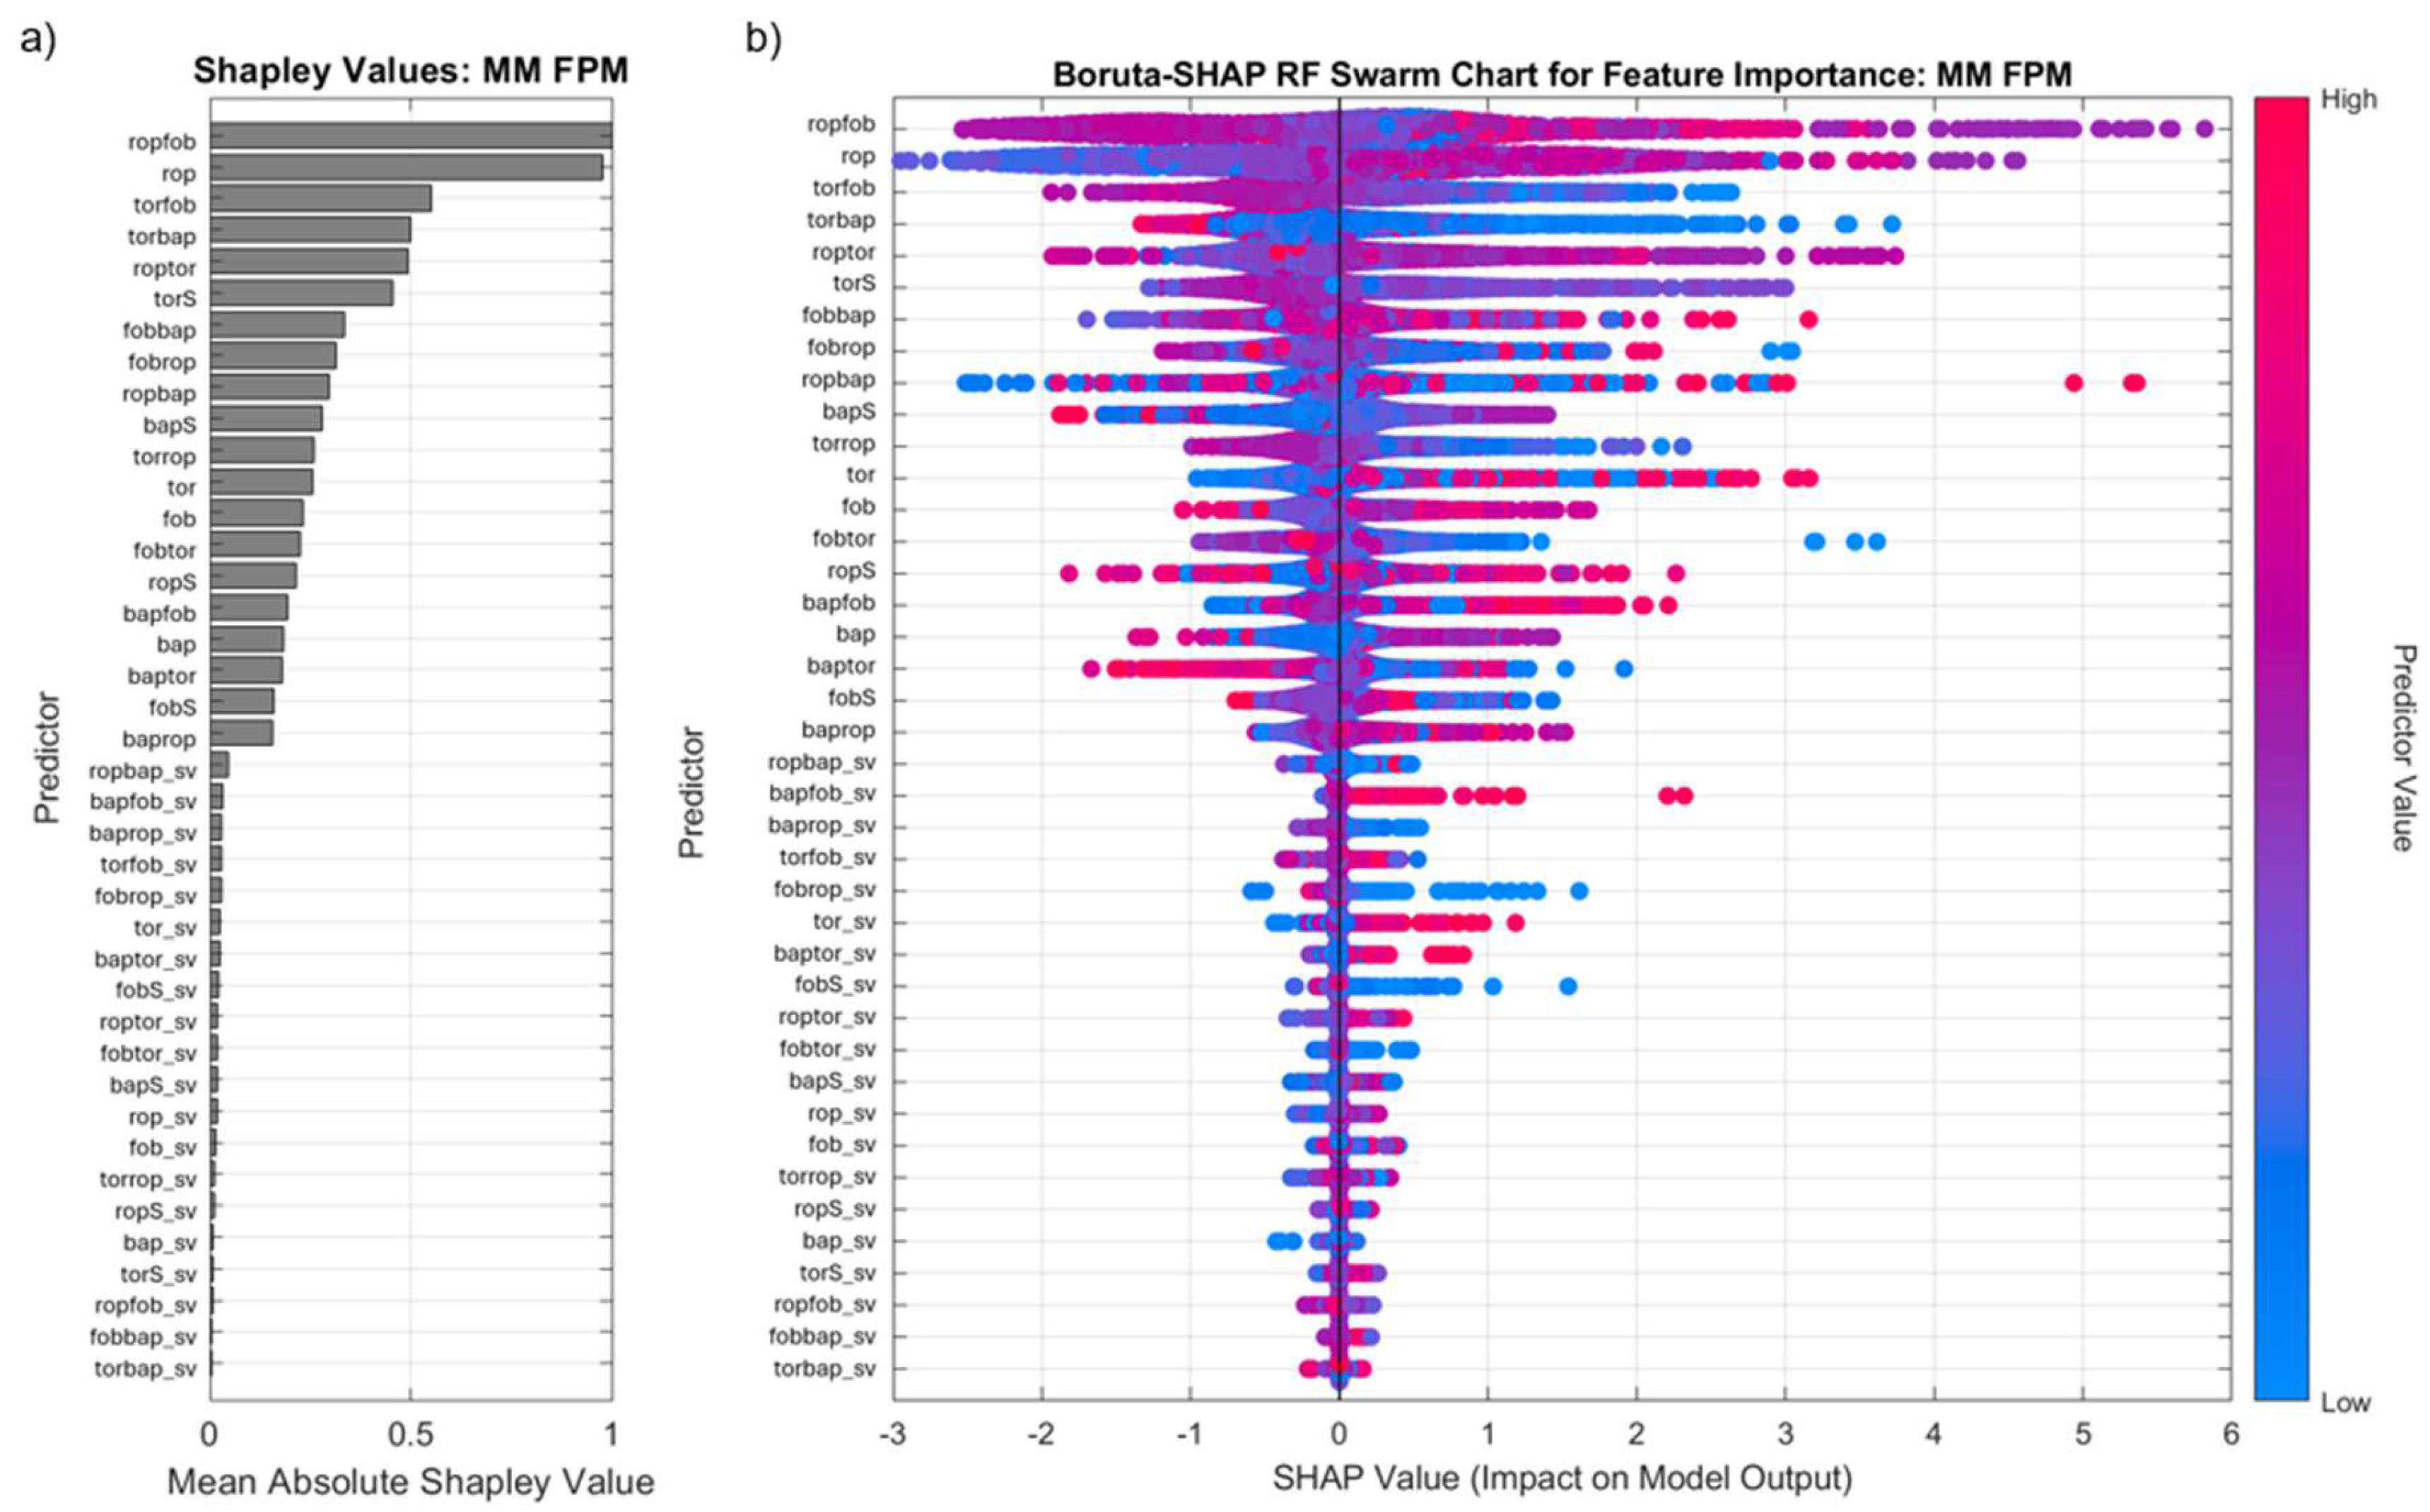
Figure 14.
Boruta-SHAP RF analysis for feature importance of GSI in BR showing a) bar plot of mean absolute SHAP values and b) swarm chart showing impact on model output.
Figure 14.
Boruta-SHAP RF analysis for feature importance of GSI in BR showing a) bar plot of mean absolute SHAP values and b) swarm chart showing impact on model output.
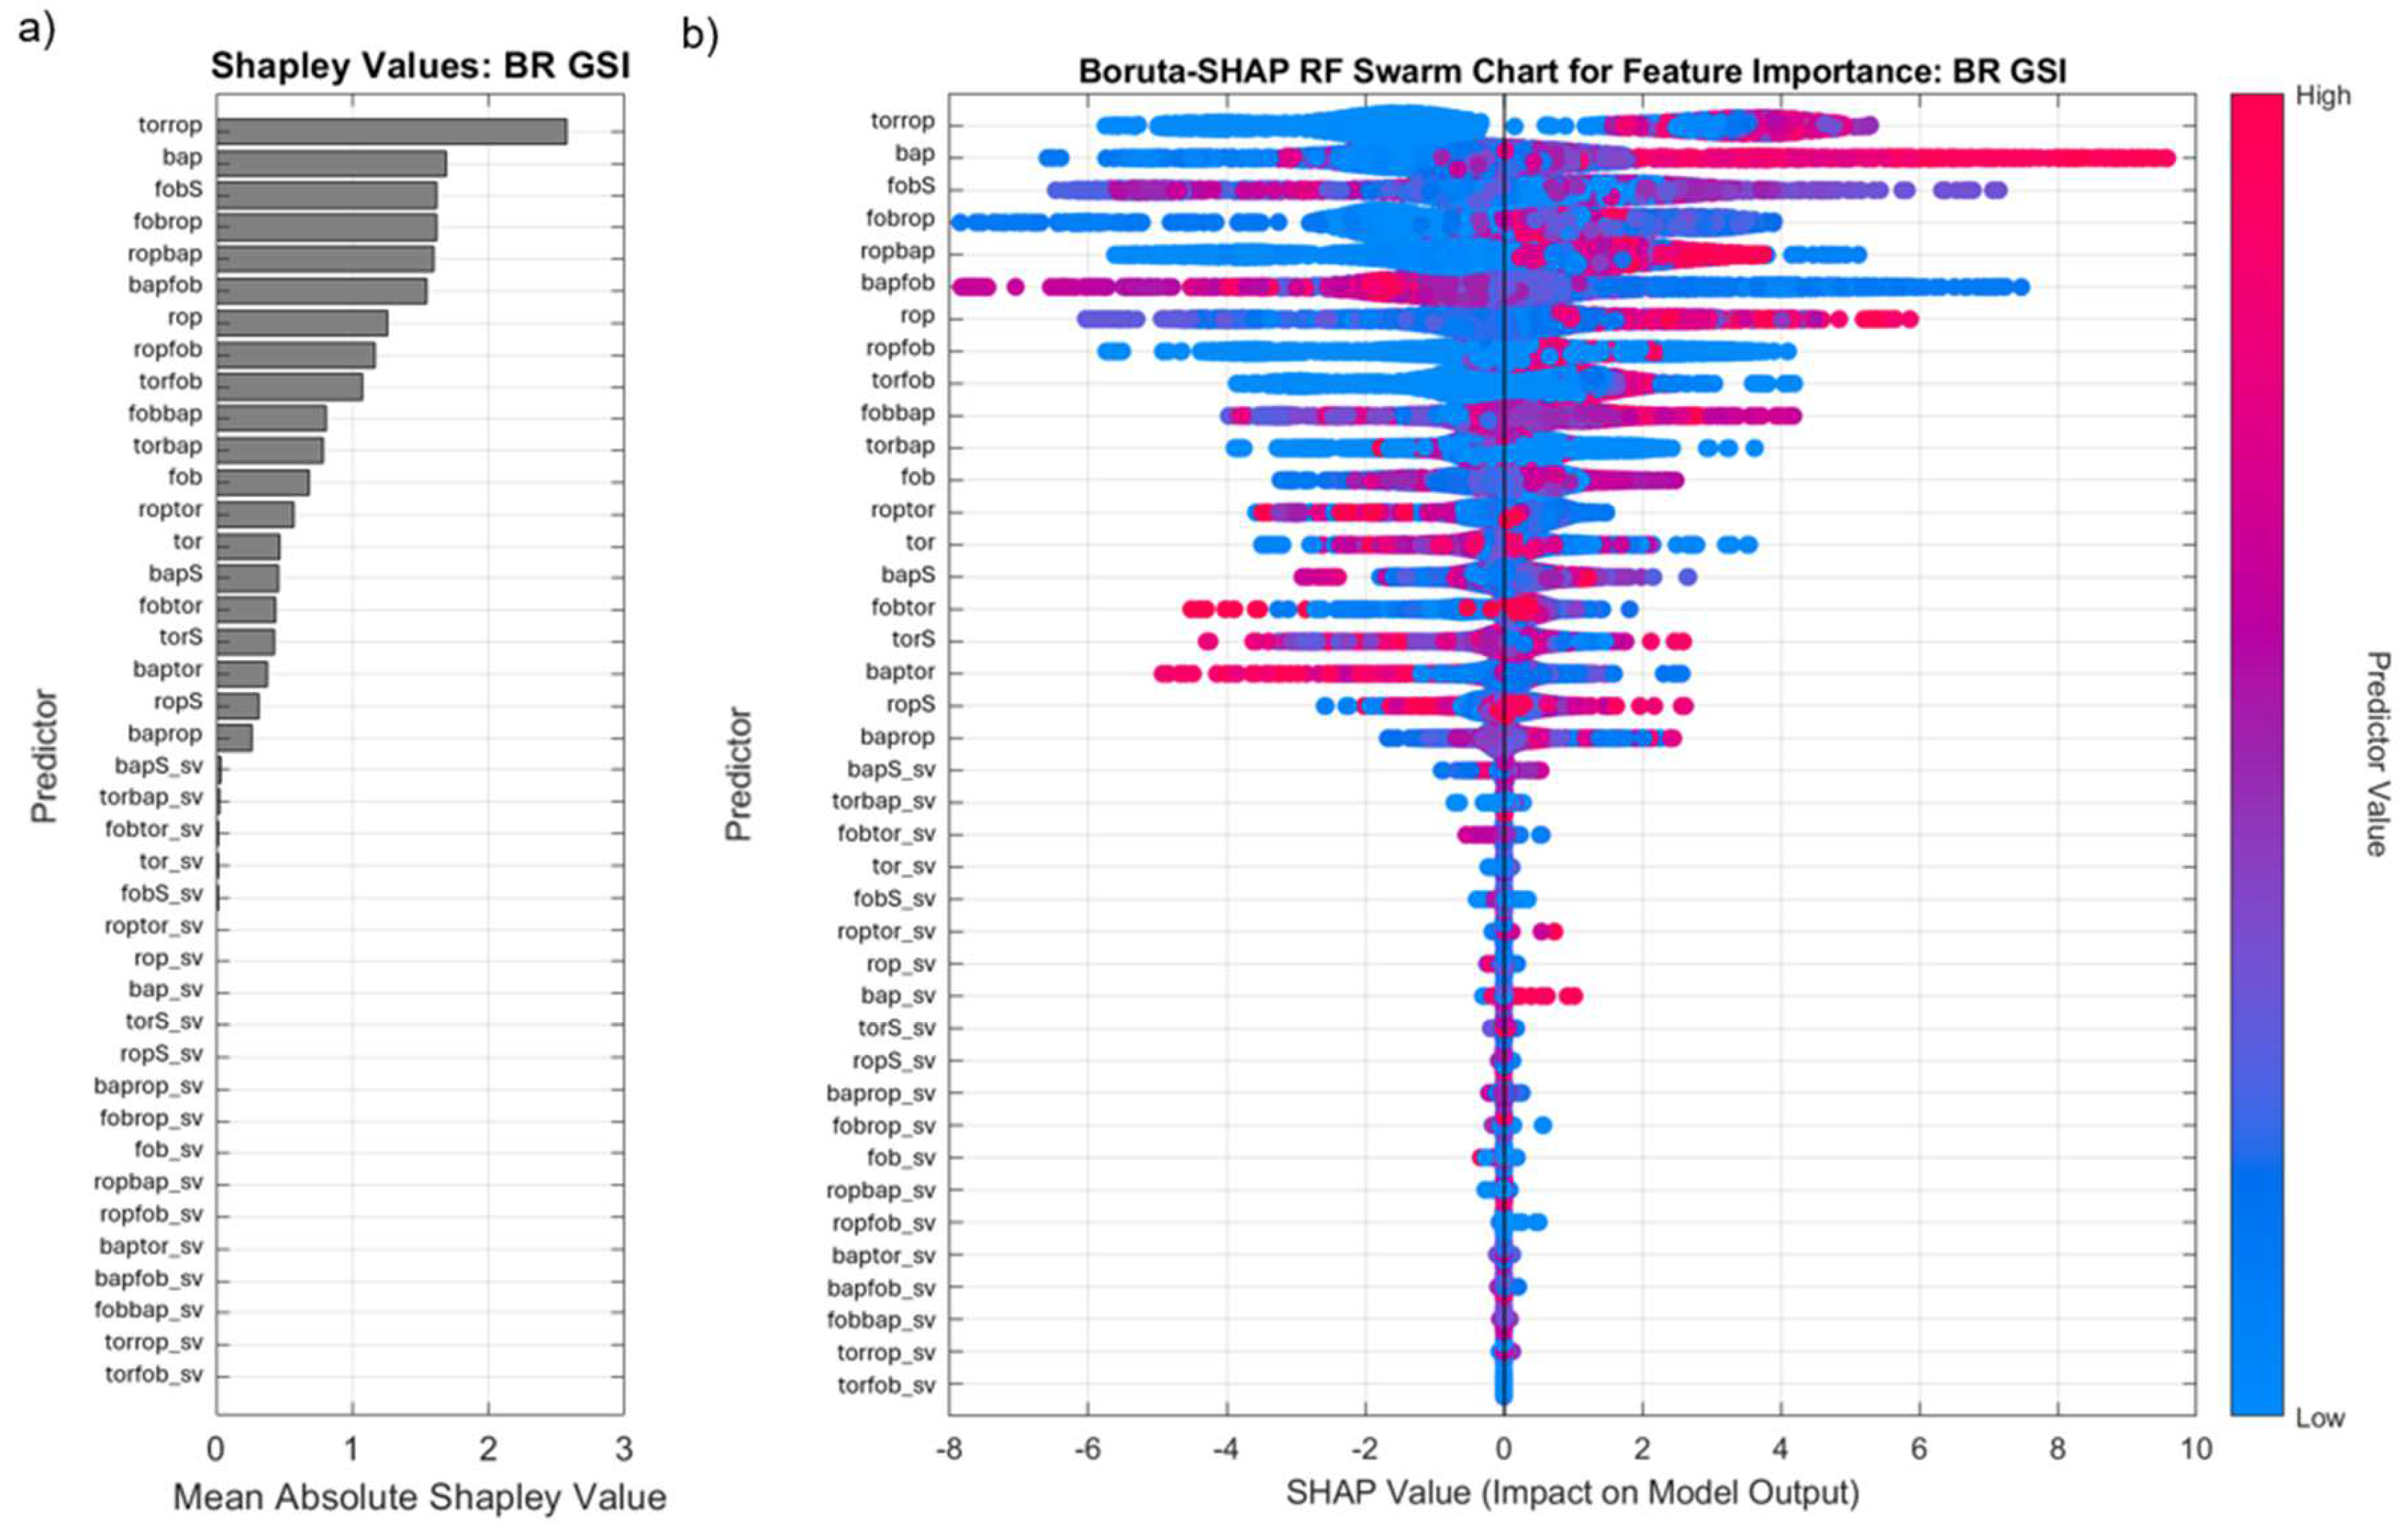
Figure 15.
Boruta-SHAP RF analysis for feature importance of GSI in MM showing a) bar plot of mean absolute SHAP values and b) swarm chart showing impact on model output.
Figure 15.
Boruta-SHAP RF analysis for feature importance of GSI in MM showing a) bar plot of mean absolute SHAP values and b) swarm chart showing impact on model output.
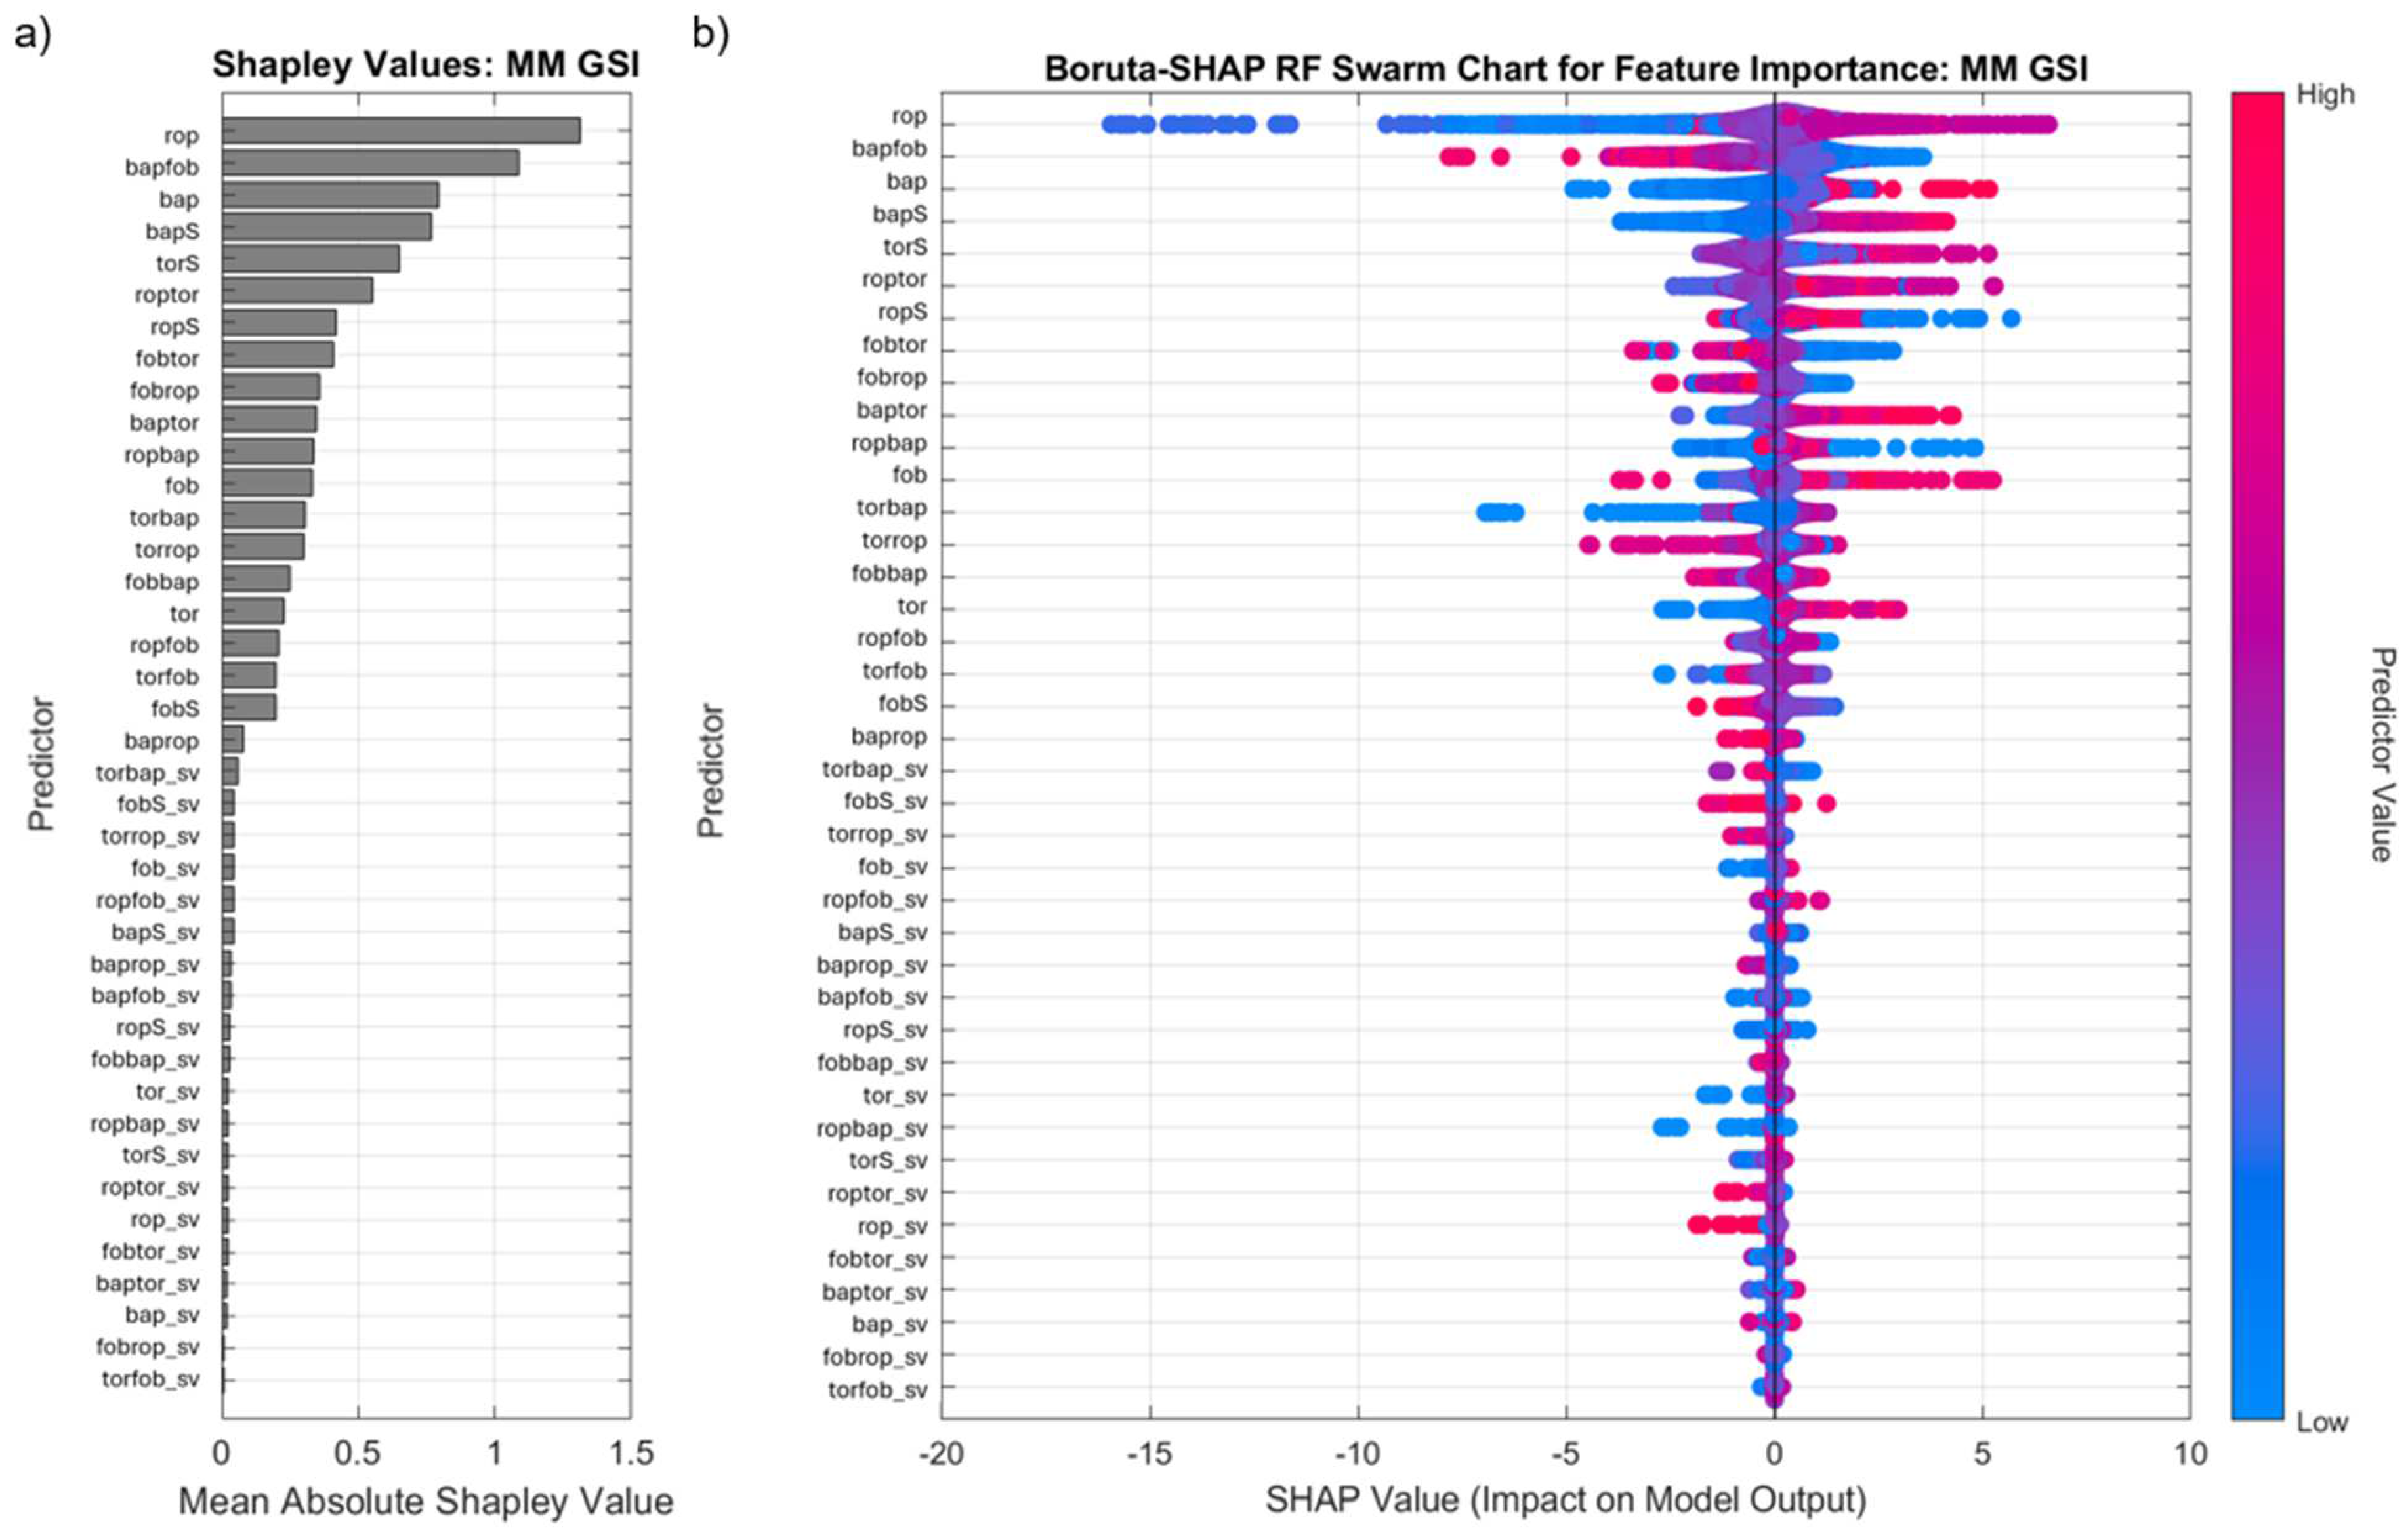

Table 1.
Measure-While-Drilling variables investigated in this study.
| Type | MWD Features | |||
|---|---|---|---|---|
| Recorded | rop | tor | fob | bap |
| Ratio |
roptor ropfob ropbap |
torrop torfob torbap |
fobrop fobtor fobbap |
baprop baptor bapfob |
| Moving Standard Deviation | ropS | torS | fobS | bapS |
Table 2.
Prediction performance testing results of NN using the 4 measured MWD features and all 20 investigated MWD features. Higher performing models are bold.
Table 2.
Prediction performance testing results of NN using the 4 measured MWD features and all 20 investigated MWD features. Higher performing models are bold.
| Geotechnical Measurements | BR | MM | ||||||
|---|---|---|---|---|---|---|---|---|
| Measured | Engineered | Measured | Engineered | |||||
| RMSE | R2 | RMSE | R2 | RMSE | R2 | RMSE | R2 | |
| Unconfined Compressive Strength (MPa) | 14.38 | 0.86 | 9.31 | 0.94 | 23.56 | 0.38 | 13.95 | 0.78 |
| Fracture Per Meter | 2.88 | 0.82 | 1.32 | 0.96 | 4.98 | 0.61 | 2.87 | 0.87 |
| Geological Strength Index | 7.96 | 0.79 | 2.56 | 0.98 | 6.78 | 0.43 | 3.23 | 0.87 |
Table 3.
Regression-based ML 10-fold cross validation training and testing analytical coefficient of determination, RMSE (MPa) and training speed prediction results for UCS values from MWD data using all MWD features in BR and MM Formations.
Table 3.
Regression-based ML 10-fold cross validation training and testing analytical coefficient of determination, RMSE (MPa) and training speed prediction results for UCS values from MWD data using all MWD features in BR and MM Formations.
| Regression-Based ML Method | BR | MM | ||||||||
|---|---|---|---|---|---|---|---|---|---|---|
| Train | Test | Train | Test | |||||||
| RMSE | R2 | Time (s) | RMSE | R2 | RMSE | R2 | Time | RMSE | R2 | |
| DT | 13.2 | 0.89 | 8 | 12.4 | 0.90 | 18.5 | 0.61 | 2.3 | 21.88 | 0.46 |
| SVM | 11.9 | 0.91 | 7 | 11.9 | 0.91 | 16.8 | 0.68 | 7.5 | 17.84 | 0.64 |
| RF | 9.7 | 0.94 | 60 | 9.3 | 0.94 | 13.3 | 0.8 | 66.1 | 13.95 | 0.78 |
| GP | 12.2 | 0.91 | 4 | 10.4 | 0.93 | 1.2 | 0.66 | 2.4 | 18.28 | 0.62 |
| NN | 7.7 | 0.96 | 517 | 7.7 | 0.96 | 10.3 | 0.88 | 184 | 11.95 | 0.84 |
Table 4.
Regression-based ML 10-fold cross validation training and testing analytical coefficient of determination, RMSE and training speed prediction results for FPM values from MWD data using all MWD features in BR and MM Formations.
Table 4.
Regression-based ML 10-fold cross validation training and testing analytical coefficient of determination, RMSE and training speed prediction results for FPM values from MWD data using all MWD features in BR and MM Formations.
| Regression-Based ML Method | BR | MM | ||||||||
|---|---|---|---|---|---|---|---|---|---|---|
| Train | Test | Train | Test | |||||||
| RMSE | R2 | Time (s) | RMSE | R2 | RMSE | R2 | Time | RMSE | R2 | |
| DT | 2.0 | 0.93 | 2 | 1.7 | 0.94 | 4.8 | 0.59 | 2 | 5.5 | 0.53 |
| SVM | 1.8 | 0.94 | 9 | 1.6 | 0.94 | 3.9 | 0.73 | 7 | 3.9 | 0.76 |
| RF | 1.3 | 0.97 | 77 | 1.3 | 0.96 | 3.1 | 0.84 | 59 | 2.9 | 0.87 |
| GP | 1.7 | 0.94 | 4 | 1.8 | 0.93 | 3.1 | 0.84 | 4 | 3.2 | 0.84 |
| NN | 1.0 | 0.98 | 279 | 1.0 | 0.98 | 2.4 | 0.9 | 206 | 2.2 | 0.93 |
Table 5.
Regression-based ML 10-fold cross validation training and testing analytical coefficient of determination, RMSE and training speed prediction results for GSI values from MWD data using all MWD features in BR and MM Formations.
Table 5.
Regression-based ML 10-fold cross validation training and testing analytical coefficient of determination, RMSE and training speed prediction results for GSI values from MWD data using all MWD features in BR and MM Formations.
| Regression-Based ML Method | BR | MM | ||||||||
|---|---|---|---|---|---|---|---|---|---|---|
| Train | Test | Train | Test | |||||||
| RMSE | R2 | Time (s) | RMSE | R2 | RMSE | R2 | Time (s) | RMSE | R2 | |
| DT | 4.3 | 0.94 | 2 | 4.3 | 0.94 | 5.9 | 0.64 | 2 | 5.1 | 0.68 |
| SVM | 3.7 | 0.95 | 8 | 3.2 | 0.97 | 4.6 | 0.78 | 8 | 3.8 | 0.82 |
| RF | 2.6 | 0.98 | 80 | 2.6 | 0.98 | 3.6 | 0.86 | 60 | 3.2 | 0.87 |
| GP | 3.2 | 0.96 | 5 | 2.9 | 0.97 | 3.6 | 0.86 | 3 | 3.0 | 0.89 |
| NN | 2.0 | 0.99 | 255 | 2.0 | 0.99 | 2.9 | 0.91 | 297 | 2.4 | 0.93 |
Disclaimer/Publisher’s Note: The statements, opinions and data contained in all publications are solely those of the individual author(s) and contributor(s) and not of MDPI and/or the editor(s). MDPI and/or the editor(s) disclaim responsibility for any injury to people or property resulting from any ideas, methods, instructions or products referred to in the content. |
© 2025 by the authors. Licensee MDPI, Basel, Switzerland. This article is an open access article distributed under the terms and conditions of the Creative Commons Attribution (CC BY) license (http://creativecommons.org/licenses/by/4.0/).
Copyright: This open access article is published under a Creative Commons CC BY 4.0 license, which permit the free download, distribution, and reuse, provided that the author and preprint are cited in any reuse.


