1. Introduction
Maize (
Zea mays L.) is one of the most important crops in the world. In 2023, the area of maize cultivated for grain amounted to 208.2 million ha, yielding 5.96 t ha
–1, with 1,211.6 million t being harvested [
1].
Maize carries out a C4 photosynthetic cycle in which it assimilates carbon dioxide (CO
2) in two successive, spatially separated stages. In this way, it eliminates photorespiration, which has a beneficial effect on the photosynthetic efficiency of the plant [
2].
Maize yield is limited by the impact of several stresses caused by abiotic and biotic factors, the former primarily being drought. Therefore, innovative ways to limit yield reduction are being sought. In terms of nutrients, nitrogen (N) has the greatest impact on maize yield [
3], but the European Union (EU) has restrictive regulations on N fertilization. In Poland, the maximum amount of N from all sources (soil, and natural, organic, mineral soil and foliar fertilizers) allowed in maize cultivation for grain has been set at 240 kg N ha
–1 [
4]. The European Green Deal assumes that, by 2030, the EU will have reduced nutrient losses by 50%, which means reducing the dose of mineral fertilizers by 20% [
5]. Therefore, innovative methods are being sought to achieve this goal.
One of these methods may be the use of plant-growth-promoting rhizobacteria. The results of studies using growth activators and bacterial preparations containing plant-growth-promoting rhizobacteria have indicated that it is possible to reduce N fertilization by 30–40% while maintaining the same maize grain yields or even more [
6]. The yield and quality of maize grain can be improved by the combined foliar application of N, boron (B), and zinc (Zn) [
7].
In recent years, there has been increasing interest in beneficial elements––primarily silicon (Si), as evidenced by the rapidly growing number of publications on Si since 2000 [
8]. The role of Si has been emphasized as a beneficial factor in increasing the resistance and productivity of crops [
9]. Restoring natural cycles of reactive Si allows for improving sustainable development by reducing the use of phosphorus (P) fertilizers and increasing the resistance of crops to pest feeding [
10]. Silicon supplementation can mitigate the negative effects of potassium (K) deficiency and improve maize yields on soils with low K content [
11]. The addition of Si contributes to greater nutrient uptake by maize plants. On clayey soil, the use of potassium silicate (K
2SO
4) can increase the the availability of P, K, Ca, Mg, S, Cu, and Si, and on sandy soil, it can increase the availability of N, P, K, Mg, Si, and Cu [
12]. Silicon alleviates drought-induced yield reduction in maize [
10], especially in the late vegetative and early reproductive stages [
13]. The soil application of Si improves maize plant growth by improving its physiological and biochemical attributes under drought stress and the presence of cadmium (Cd) [
14]. The foliar application of SiNP can also mitigate Cd toxicity [
15]. Silicon application has been associated with increases in the content of anthocyanins, ascorbic acid, total phenols, and flavonoids, thus mitigating the effects of salinization in maize cultivation [
16]. Silicon also has a place in mitigating climate change through the long-term sequestration of carbon (C) in phytoliths [
17].
Due to the diverse responses of different crops to Si, it is necessary to conduct specific studies and develop application methodologies adapted to each plant species. By precisely determining the dosage, application method, and timing of Si application, its potential benefits can be significantly increased [
18].
There is relatively little information on soil fertilization with Si in maize cultivation under European conditions, one of the reasons being the applicable legislation. There are significantly more publications on the effects of the foliar application of products containing different forms of Si.
Under controlled conditions, the foliar application of sodium silicate (Na
2O
3Si) with iron (Fe) was found to have a positive effect on the relative chlorophyll content, selected chlorophyll fluorescence parameters, and gas exchange in maize plants grown under different soil salinity conditions. However, these results have not yet been verified under field conditions, in which various environmental factors can modify the responses of plants to stress conditions and foliar Si application [
19]. For this reason, field experiments performed under maize production conditions are particularly important, having great practical value.
The aim of this study was to assess the effects of various soil fertilization and foliar feeding treatments using Si on the yield, quality, and chemical composition of maize grain in Central Poland.
The following research hypotheses were put forward:
1. soil and foliar fertilisation with Si fertilisers has a beneficial effect on grain and dry matter yields of maize,
2. grain and dry matter yields of maize increase with the dose of Si soil fertilizer;
3. the best production results can be obtained with the application of soil fertiliser + Si foliar fertilization;
4. the soil and foliar application of Si fertilisers results in a greater increase in grain and dry matter yields of maize with a 50% reduction in NPK doses than with 100% NPK doses.
2. Materials and Methods
In 2023–2024, a field experiment was conducted, using maize as the grain, under commercial crop conditions in Kraski (52°2’42” N, 18°54’6” E), in Central Poland (
Figure 1).
The experiment was conducted on Cambisols [
20]. The soil had a loamy sand or sandy loam texture in the 0–30-cm layer and contained 74.4–82.7% sand (0.05–2.0 mm), 13.0–17.8% silt (0.002–0.05 mm), and 3.8–11.2 clay (<0.002 mm). In the 30–60-cm layer, the soils contained 51.6–82.3%, 10.0–20.5%, and 6.5–32.9% of these fractions, representing the sandy loam or silt–clay loam textural groups. Based on the results of a particle-size analysis, the soils were classified as light or medium in the 0–30-cm layer, and medium, rarely light or heavy in the 30–60-cm layer.
Soil samples were collected from two soil depths (0–30 and 30–60 cm) in spring before fertilization. The soil samples were analyzed in the Department of Soil Science WULS–SGGW in Warsaw. The contents of the mineral forms of N (nitrate [NO3-N] and ammonium [NH4-N]) were determined in fresh samples, just after sampling, and during homogenization. Approximately 5 g of sample were placed into polytetrafluoroethylene extraction tubes at two replicates, and 50 ml of 1% potassium sulphate (K2SO4) solution was added. The samples were left for 24 h and then filtered through quantitative paper filters. The content of NO3-N in extracts was determined colorimetrically using sodium salicylate, and the NH4-N was determined using Nessler reagent. Additionally, the content of water was determined in the fresh soil samples. The water content was taken into account when calculating the NO3-N and NH4-N contents.
The remaining soil samples were dried at room temperature and then sieved through a 2.0-mm sieve to remove the gravel fraction. All analyses were performed on the earth fraction (<2.0 mm). Part of each sample was additionally ground into powder for chemical analysis.
The soil pH was determined potentiometrically (SevenDirect SD23) in a suspension with 1 mol dm–3 potassium chloride (KCl) solution in a soil-to-KCl ratio of 1:2.5.
The total carbon (TC) and N contents were determined by dry combustion (Vario MacroCube, Elementar). The inorganic carbon (IC) was determined by Scheibler’s volumetric procedure. The total organic carbon was calculated as TC – IC. The analysis included two replicates.
The contents of the bioavailable forms of macronutrients (P, K, and Mg) and micronutrients (B, Cu, Fe, Mn, and Zn) were determined by inductively coupled plasma atomic emission spectrometry (Avio 200, Perkin Elmer) prior to samples extraction using the Mehlich III procedure [
21].
The bioavailable forms of Si were determined by inductively coupled plasma atomic emission spectrometry prior to soil sample extraction in a 0.01 mol dm–3 calcium chloride (CaCl2) solution. Approximately 1.5 g of air dried soil was placed into a 50 ml Falcon tube to which 25 ml of CaCl2 solution was added. The samples were shaken for 16 h, centrifuged at 3,000 rpm for 5 min, and filtered through hard paper filters. The Si content was determined in the extracts.
The characteristics of the soil conditions in the spring before applying the fertilizers are presented in
Table 1. The 0–30-cm soil layer mostly had a higher pH value, a higher organic carbon and mineral N content, and more available nutrients than the 30–60-cm layer.
The vegetation period (May–September) in 2024 was more favorable for maize vegetation than in 2023 due to the greater total rainfall and its distribution (
Table 2). July and August were characterized by particularly high average monthly temperatures.
The grain maize was grown in monoculture in the third and fourth year after grain maize. After harvesting the forecrop, disc harrowing was performed to a depth of approximately 12 cm. Pre-sowing fertilization was carried out using urea with a urease inhibitor (N = 460 g kg–1) at a dose of 400 and 200 kg ha–1, respectively, ESTA Kieserit Gran® (S = 200 g kg–1, Mg = 151 g kg–1) at 200 and 100 kg ha–1, and with SiGS® fertilizer. The fertilizers were mixed to a depth of approximately 30 cm using a no-tillage unit. On May 1, 2023, and April 30, 2024, the maize was sown using a Gaspardo precision seeder with simultaneous intercrop fertilization. For the fertilization, Polifoska 8® fertilizer (N = 80 g kg–1, P = 105 g kg–1, K = 197 g kg–1, S = 36 g kg–1) was used at doses of 350 and 175 kg ha–1. The total mineral fertilization amounted (per hectare) to (for 100% NPK) N = 212 kg, P = 36.6 kg, K = 68.9 kg, Mg = 30.2 kg, and S = 52.8 kg; for 50% NPK, N = 106 kg, P = 18.3 kg, K = 34.5 kg, Mg = 15.1 kg, and S = 26.4 kg.
For both years of the study, seeds of the DKC 3888® maize variety were used [
23]. This is a medium-late (FAO number: 270) hybrid variety with a very high and stable level of grain yield. It is characterized by very good initial vigor, and produces medium-high plants with strong stems, well-developed root systems, very good health, and a high tolerance to lodging. It produces flex-type cobs and dent-type grain. It tolerates periodic water shortages in the soil and high temperatures well. The sowing rate in the study was 82,000 seeds ha
–1, the inter-row spacing was 75 cm, and the sowing depth was 5 cm. The seed material was dressed with Redigo M 120 FS® dressing (metalaxyl = 20 g dm
–3 + prothioconazole = 100 g dm
–3). To control weeds, the herbicide Lumax 537.5 SE® (active substance: mesotrione = 37.5 g dm
–3 + s-metolachlor = 312.5 g dm
–3 + terbuthylazine = 187.5 g dm
–3) at a dose of 3.5 dm
3 in 240 dm
3 of water ha
–1. The treatment was applied on May 4, 2023, and May 2, 2024. No chemical treatments were applied against diseases or pests. This was a two-factor experiment, established in a randomised complete block design, with four replicates for each treatment. Individual plot area was 625 m
2. The total number of plots was 64. The total area of the experiment was 4.0 ha.
The first factor (A) was the NPK doses––100% using farm technology (without the intervention of the research team) and 50%––and the second (B) was the method of fertilizing using Si, both on the soil and as a foliar application. The experiment used SiGS® soil fertilizer (Eramet, Norway) and Barrier Si-Ca® foliar fertilizer (Cosmocel, Mexico). Currently, SiGS® fertilizer is not available on the EU market (
Table 3 and
Table 4). SiGS is a pure slag from the electric smelting process for the production of SiMn metal. It has been approved in Norway for agricultural use, making the SiGS® fertilizer 98–99% amorphous. Foliar application of the Barrier Si-Ca® fertilizer was carried out based on the experiment schedule on June 10, 2023, and June 7, 2024. The dose of the working liquid was 300 dm
3 ha
–1.
Several plant physiological parameters were measured three times during the growing season: in the 6th leaf stage – BBCH 16 (June 2, 2023, June 3, 2024), in the 9th leaf stage – BBCH 19 (June 16–17, 2023, June 17, 2024), and in the full flowering stage – BBCH 65 (July 10–11, 2023, July 10, 2024) [
24]. They included the leaf area index (LAI), photosynthetically active radiation (PAR) absorption, Normalized Difference Vegetation Index (NDVI), and SPAD-measured chlorophyll content.
The LAI and PAR were measured above the canopy (II) and below the canopy (Iu) using an AccuPar® probe (Decagon, USA). The NDVI was measured using a GreenSeeker® device (Trimble, USA). The chlorophyll content in the maize leaves was measured using a Minolta SPAD 502Plus® chlorophyll meter on the highest leaf, in its middle part. The physiological traits were measured in 10 plants in four representative locations on each treatment, the measurements taken from the same plants each time.
The fresh weight yield was assessed in the second half of September 2023 and 2024. For this purpose, 4 samples were taken from each combination with an area of 1 m
2 each. Representative plant samples of 100 g were then taken from each sample, which were sliced and dried at a temperature not exceeding 60°C with forced air circulation according to Polish Standard PN-R-04013 [1988] [
25] in the laboratory of the Department of Agronomy of the Warsaw University of Life Sciences. The dry matter yield was determined on the basis of the dry matter content.
Cob samples were collected in the first half of October 2023 and 2024. Four samples of 1 m2 (133 cm of a randomly selected representative row) were selected for harvesting from each treatment. The plants were counted. The cobs were picked by hand, counted, and the cover leaves were removed. The number of cobs per plant was calculated as the quotient of the number of cobs and the number of plants. The kernels were counted in five randomly selected cobs from each sample.
The cobs were transported to the laboratory in the Department of Agronomy at the Institute of Agriculture at the Warsaw University of Life Sciences, where the kernels (grain) were removed and weighed. The grain quality was then assessed (moisture, fat, protein, and starch contents) using an Infratec 1241 Grain Analyzer®. The mass of 1,000 grains at their current moisture content was determined in accordance with the Polish Standard PN-EN ISO 520 [2010] [
26]. A densimeter with a capacity of 0.25 dm
3 was used to determine the grain density.
The results obtained were converted into the grain yield per hectare at a standard moisture content of 14%. A similar procedure was followed to determine the mass of 1,000 grains. The following formula was used for the calculations: P = Po * (100-Zw)/86, where P = grain yield at 14% moisture content (in kilograms), Po = grain yield at the moisture content during harvest (in percent), and Zw = grain moisture content during harvest (in percent).
The grain yield per cob was calculated as the quotient of the grain yield and the number of cobs. In accordance with the requirements of the project this study was a part of, the grain yield and its moisture content in 2023 were published so they could be distributed to agricultural advisors and farmers [
27].
2.1. Statistical analysis
The results obtained from the experiment were subjected to statistical analysis including an analysis of variance (ANOVA) and multiple comparisons using the Tukey procedure. The ANOVA was performed for each year separately and as a combined analysis for two years together, where factors were: years of the study (Y), dose NPK (A), fertilization treatment Si (B). In the ANOVA model all interaction between the factors were included. A significance level of P = 0.05 was set for the comparison of means. Based on this, homogeneous groups of means were distinguished, which were marked with subsequent letters. Standard errors calculated for each treatment/factor level were presented as a parameters of variability. An assessment of the relationships between the studied features was made based on the values of simple Pearson correlation coefficients. The significance of the correlations was assessed at P ≤ 0.05 and P ≤ 0.01. Principal component analysis (PCA) was performed to evaluate multivariate relationships between grain yield with physiological parameters. The analyses were carried out using Statistica 13® software (TIBCO Software Inc., CA, USA).
3. Results
The interaction of the study years with the NPK dose had a significant effect on most of the assessed physiological parameters, except for the NDVI value and SPAD chlorophyll content on the first and second measurement dates, and the PAR absorption value on the second measurement date (
Table 5). The interaction of the study year with the Si fertilization treatment significantly affected all physiological parameters, except for the LAI value and the SPAD chlorophyll content on the first measurement date. The interaction of the NPK dose with the Si fertilization treatment significantly affected all the assessed parameters on the first measurement date, the LAI value and PAR absorption on the second date, and the NDVI value and SPAD chlorophyll content on the third date.
The interaction between the study year, NPK dose, and Si fertilization treatment had a significant effect on all the assessed physiological parameters, except for the NDVI value on the first measurement date and the LAI value on the third date.
The study year had a significant effect on all assessed physiological parameters on each measurement date. The NPK dose significantly affected the LAI value for all measurement dates, the PAR absorption value on the first measurement date, and the NDVI value and chlorophyll content on the third measurement date. The Si fertilization treatment significantly affected all assessed parameters on each measurement date, except for the SPAD chlorophyll content on the first measurement date and the NDVI value on the second measurement date.
The NDVI value in 2023 on the first measurement date was the highest for treatment A2B2, on the second date for treatments A1B6 and A2B5, and on the third date for treatment A1B1 (
Figure S1). On average, for both NPK doses, the values of the NDVI on the first date for treatments B2 and B3 were significantly higher, and for treatment B4 significantly lower, than for treatment B1. On the second date, the values were similar for all treatments in relation to treatment B1, and on the third date, all treatments, except for treatment B4, were characterized by a significantly lower NDVI value than for treatment B1. The NDVI value in 2023 was significantly different depending on NPK fertilization on the second and third measurement dates, and was higher when higher doses of fertilizer were used. The NDVI values in 2024 on the first measurement date were the highest for treatments A1B2 and A2B3, on the second date for treatments A1B8 and A2B3, and on the third date for treatment A1B6 (
Figure S2). On average, for both NPK doses, the value of the NDVI on the first date for treatment B3 was significantly higher, and for treatments B4 and B7 significantly lower, than for treatment B1. On the second date, the values were similar for all treatments in relation to treatment B1, except for treatment B4, in which it was significantly lower, and on the third date, all treatments had a similar NDVI values to treatment B1. The NDVI value in 2024 was significantly different depending on NPK fertilization only on the first measurement date, and was higher when higher doses of fertilizer were used. In 2023–2024, the value of the NDVI in the first measurement term was the highest for treatments A1B2, A1B3, A2B2, and A2B3, in the second term for treatment A1B3, and in the third term for treatments A1B1, A1B4, and A1B6 (
Figure S3). On average, for both NPK doses, the values of the NDVI in the first term for treatments B2 and B3 were significantly higher, and in treatments B4 and B7 significantly lower, than in treatment B1. In the second term, the values were similar for all treatments in relation to treatment B1, with the exception of treatment B7, in which it was significantly lower, and in the third term, treatments B2, B3, B5, B7, and B8 were characterized by significantly lower NDVI values than treatment B1. On average, for both years of the study, the NDVI values were significantly different depending on NPK fertilization on the first and third measurement dates, and were higher when using higher doses of fertilizer (
Figure S3).
The LAI value in 2023 on the first measurement date was the highest for treatment A2B3, on the second date for treatment A2B2, and on the third date for treatment A1B2 (
Figure S4). On average, for both NPK doses, the values of the LAI on the first date for treatment B3 were significantly higher than for treatment B1, on the second date they were similar for all treatments in relation to treatment B1, with the exception of treatments B4, B7, and B8, which gave significantly lower values. On the third date, treatments B2 and B3 were characterized by significantly higher LAI values than for treatment B1, while treatments B5, B6, and B8 had significantly lower LAI values than treatment B1. The LAI values in 2023 were significantly different depending on NPK fertilization on the third measurement date, and were higher when using higher doses of fertilizer. The LAI values in 2024 on the first measurement date were the highest for treatments A1B1 and A1B8, on the second measurement date for treatments A1B4 and A1B7, and on the third measurement date for treatment A2B3 (
Figure S5). On average, for both NPK doses, the values of the LAI on the first measurement date for treatments B2, B5, and B6 were significantly lower than for treatment B1, and were similar for the remaining treatments. On the second measurement date, for all treatments except for treatments B2 and B8, the values were significantly higher, being similar on the third measurement date, except for treatment B5, which was similar to treatment B1. The LAI values in 2024 were significantly different depending on NPK fertilization on the first and second measurement dates, and were higher when using higher doses of fertilizer.
In 2023–2024, the LAI on the first measurement date were the highest for treatment A1B8, on the second date for treatment A1B, and on the third date for treatment A2B3 (
Figure S6). On average, for both NPK doses, the index values on the first date for treatments B2 and B5 were significantly lower than for treatment B1, while the remaining treatments were similar to treatment B1. On the second date, the values were similar for all treatments in relation to treatment B1, except for treatments B3, B4, B5, and B7, which had significantly higher values, and on the third date, all treatments, except for treatments B5 and B7, had significantly higher LAI values than treatment B1. On average, for both years of the study, the LAI values were significantly different depending on NPK fertilization on the first measurement date, and were higher when higher doses of fertilizer were used.
The PAR absorption values in 2023, on the first measurement date, were the highest for treatment A2B3, on the second date for treatments A1B3 and A2B2, and on the third date for treatments A1B2 (
Figure S7). On average, for both NPK doses, the values of the PAR absorption on the first term for treatment B3 were significantly higher than for treatment B1, in the second term they were similar for all treatments in relation to treatment B1, except for treatments B4, B6, and B7, which had significantly lower values. In the third term, treatments B2 and B3 had significantly higher values than treatment B1, while treatments B5–B8 had significantly lower PAR absorption values than treatment B1. The PAR absorption values in 2023 were significantly different depending on NPK fertilization in the third measurement term, and were higher when higher doses of fertilizer were used. The PAR absorption values in 2024 in the first measurement term were the highest for treatments A1B8 and A2B7, in the second term for treatment A2B6, and in the third term for treatment A2B4 (
Figure S8). On average, for both NPK doses, the values of the PAR absorption in the first term for treatment B2 were significantly lower than for treatment B1, with the remaining treatments having similar values to treatment B1. In the second term, treatments B2 and B8 had similar values to treatment B1, while in the remaining term the values were significantly higher in relation to treatment B1. In the third term, treatments B3, B4, B6, and B8 had significantly higher PAR absorption values than treatment B1, the remaining treatments having similar values. The PAR absorption values in 2024 did not depend significantly on NPK fertilization.
In 2023–2024, the PAR absorption values in the first measurement term were the highest for treatment A1B3, in the second term for treatments A1B3, A2B3, and A2B6, and in the third term for treatment A1B3 (
Figure S9). On average, for both NPK doses, the values of the PAR absorption in the first and second terms for treatment B3 were significantly higher than for treatment B1, with the remaining values being similar. In the third term, treatments B2–B4 were characterized by significantly higher PAR absorption values than treatment B1, with treatment B5 having significantly lower values and treatments B6–B8 having similar values to treatment B1. On average, for both study years, the PAR absorption values were significantly different depending on NPK fertilization in the third measurement term, and were higher when higher doses of fertilizer were used.
The SPAD chlorophyll content in 2023 in the first measurement term was the highest for treatment A1B1, in the second term for treatment A2B5, and in the third term for treatments A2B1 and A2B5 (
Figure S10). On average, for both NPK doses, the values of the SPAD chlorophyll content in the first term for treatments B2, B4, B5, and B6 were significantly lower than for treatment B1, with the remaining treatments having similar values to treatment B1. In the second term, the values were similar for all treatments in relation to treatment B1, except for treatment B2, which had significantly lower values. In the third term, treatments B2, B4, B7, and B8 had significantly lower SPAD chlorophyll contents than treatment B1, while the remaining treatments had similar values to treatment B1. The SPAD chlorophyll contents in 2023 did not differ significantly depending on NPK fertilization.
The SPAD chlorophyll contents in 2024 in the first measurement term were the highest for treatment A1B6, in the second term for treatment A2B2, and in the third term for treatment A2B6 (
Figure S11). On average, for both NPK doses, the values of the SPAD chlorophyll content in the first term for treatment B6 were significantly higher than for treatment B1, with the remaining treatments having similar values to treatment B1. In the second term the values were significantly higher for all treatments in relation to treatment B1, with the exception of treatments B5 and B7, which had similar values. In the third term, treatment B7 had a similar SPAD chlorophyll content to treatment B1, with the remaining treatments having similar values to treatment B1. The SPAD chlorophyll contents in 2024 were significantly different depending on NPK fertilization in the third term, and were higher when a lower dose of fertilizer was used.
In 2023–2024, the SPAD chlorophyll content in the first term of measurement was the highest for treatment A1B6, in the second term for treatment A1B3, and in the third term for treatment A1B6 (
Figure S12). On average, for both NPK doses, the values of the the SPAD chlorophyll content in the first term for treatment B4 were significantly lower than for treatment B1, whereas the remaining treatments had similar values to treatment B1. In the second term, the values for treatments B3 and B8 were significantly higher than for treatment B1, with the remaining treatments having similar values to treatment B1, and in the third term, all treatments had SPAD chlorophyll contents similar to treatment B1. On average, for both years, the SPAD chlorophyll content was significantly different depending on NPK fertilization in the third measurement term, and was higher when lower doses of fertilizer were used.
The study year significantly affected the value of the assessed physiological parameters (
Figure S13). In each of the measurement terms, the NDVI, LAI, and PAR absorption values were higher in 2024. The SPAD values in the first measurement term were significantly higher in 2024, but also significantly higher in the second and third measurement terms in 2023.
The variability in the examined physiological parameters decreased in the subsequent measurement terms (
Table 6). The lowest SPAD chlorophyll contents were measured in the first and second terms, and the lowest LAI values in the third term.
All physiological parameters assessed in Term I had a significant positive relationship with the grain yield and dry-matter yield of the maize (
Table 7). In Term II, a significant positive relationship was found for all physiological parameters, except for the SPAD chlorophyll content, which was negative. In Term III, there was a significant positive relationship between the PAR absorption and the grain and dry-matter yields, and between the NDVI and grain and dry-matter yields. A significant but negative relationship was found for the SPAD chlorophyll content with grain and dry-matter yield.
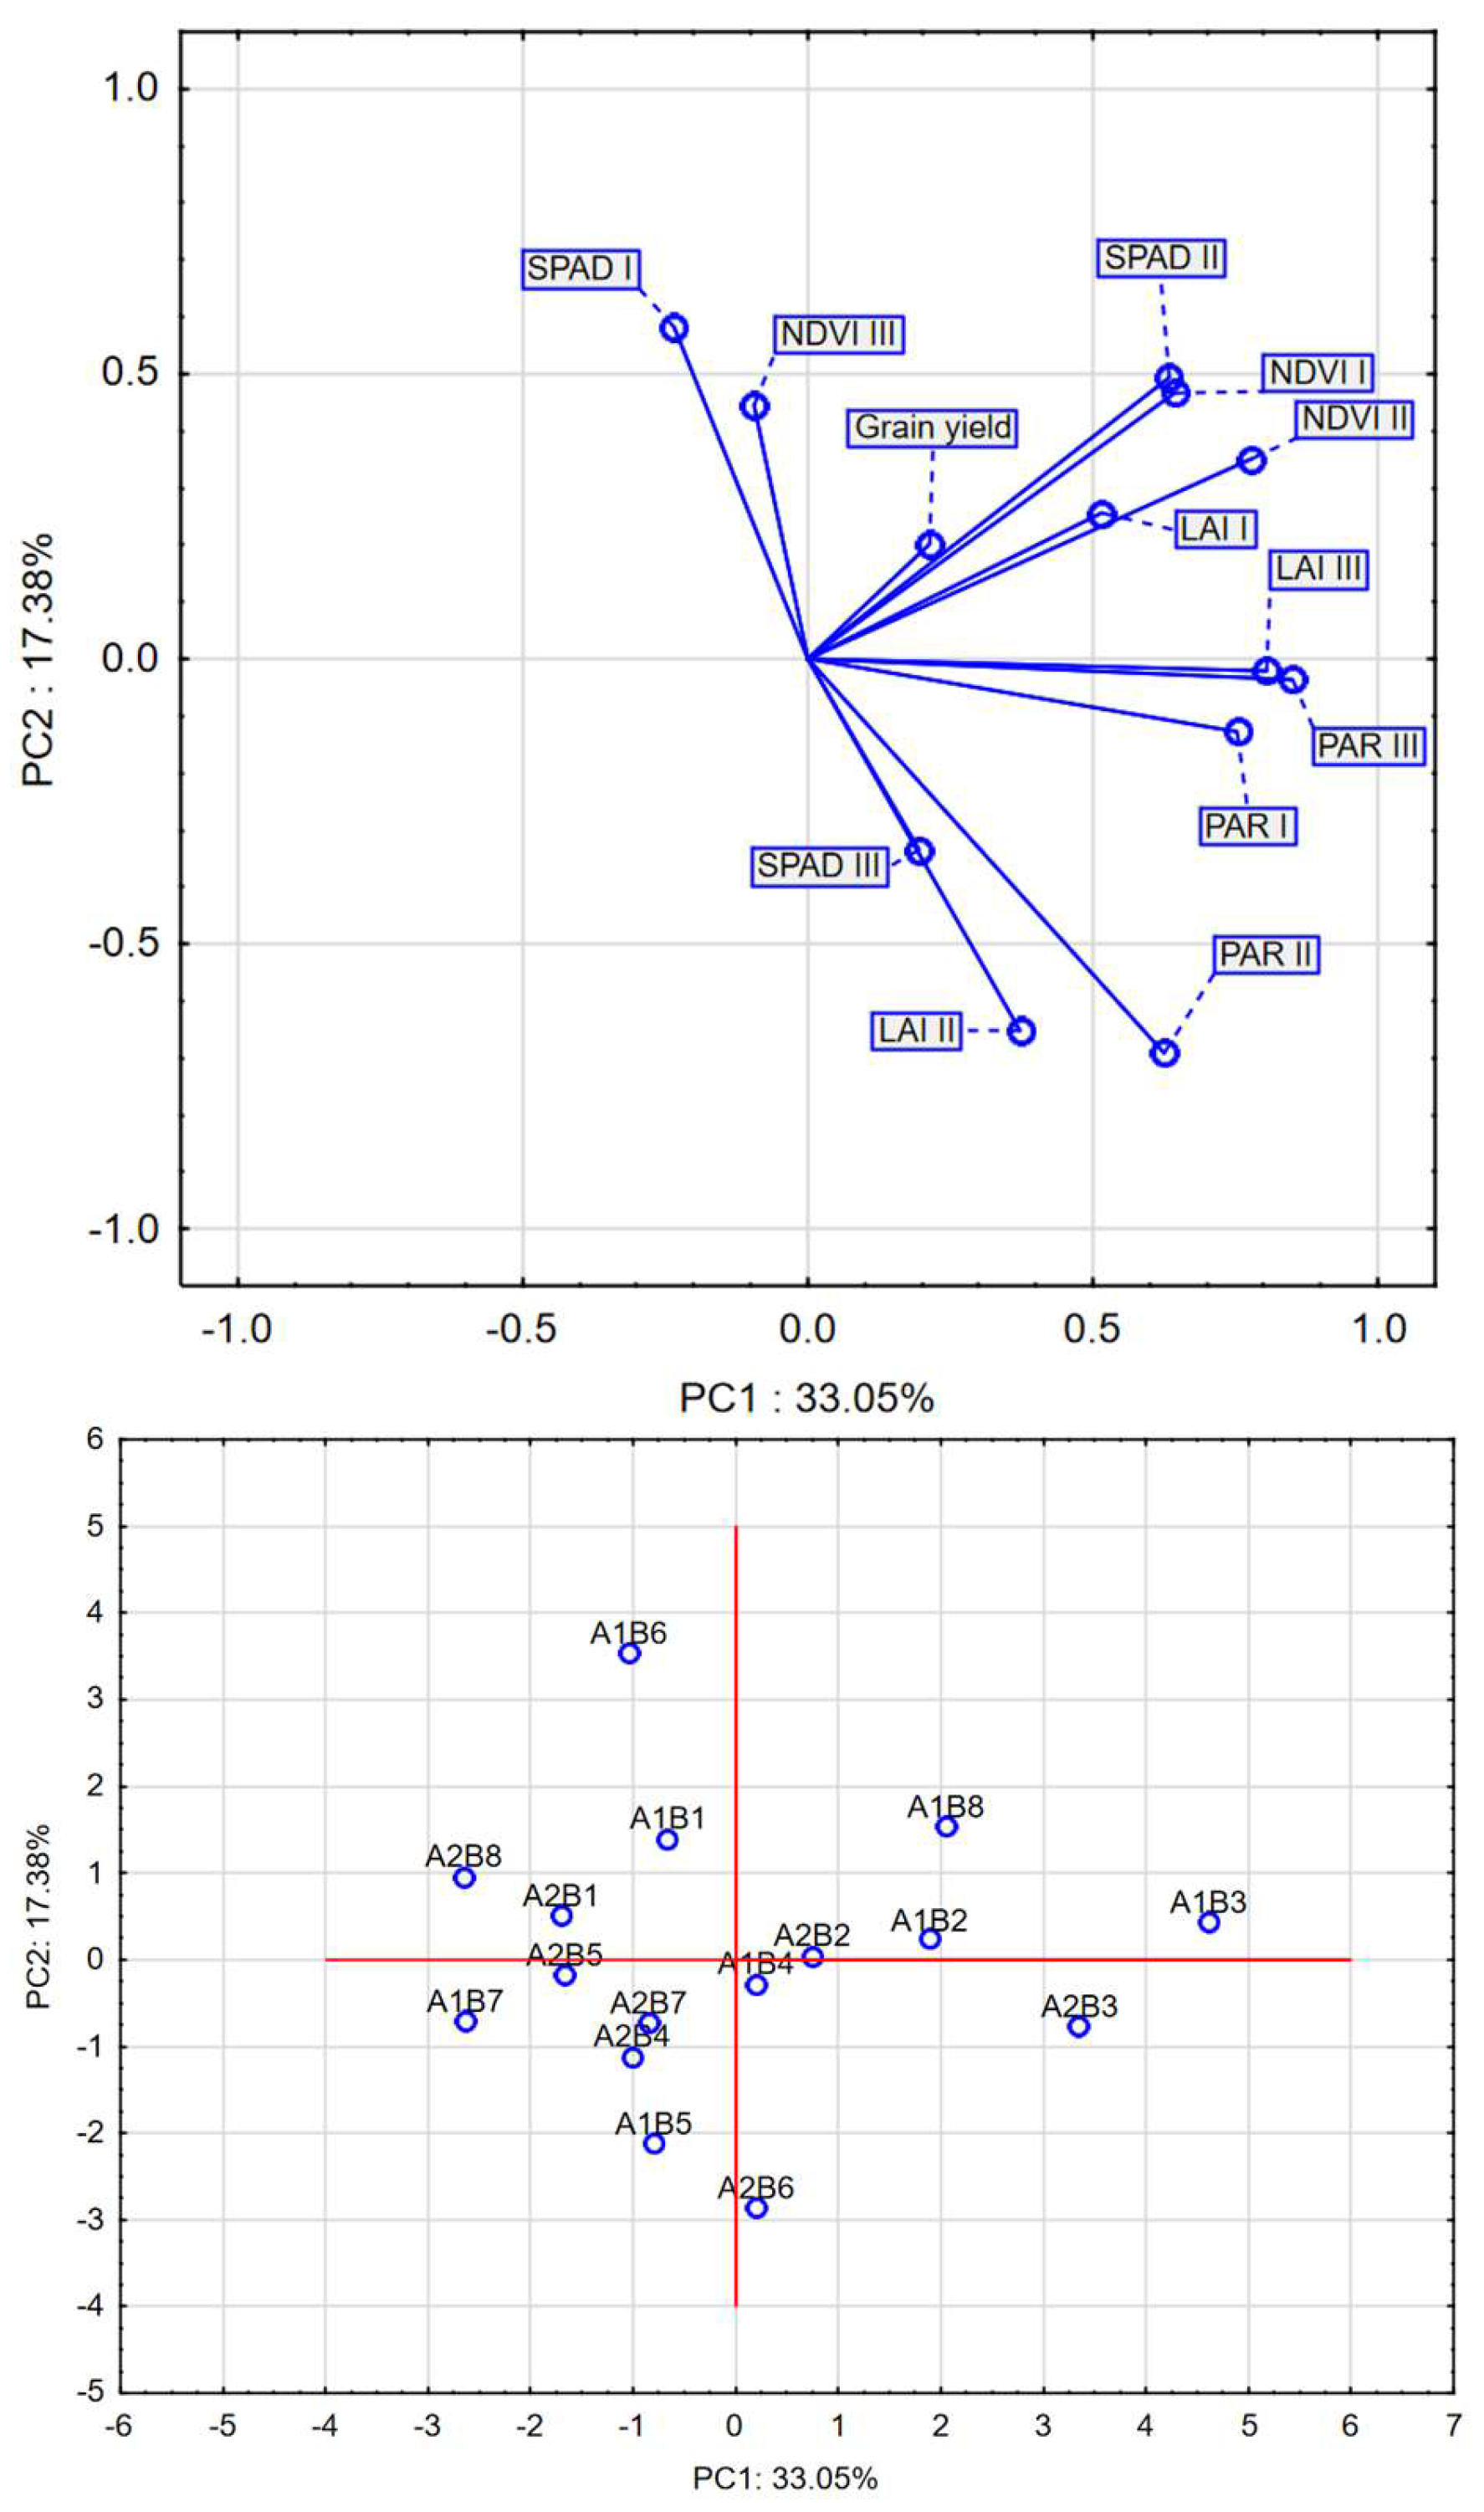
For evaluation of multivariate relationships principal component analysis was performed (
Figure 2). The PCA biplot shows that PC1 (33.05%) and PC2 (17.38%) together explain 50.43% of the variance. Variables like NDVI, LAI, and PAR cluster together, indicating strong correlations, while SPAD indices show more spread. Grain yield is moderately correlated with NDVI III. Longer vectors mean stronger contributions, and opposite directions indicate negative correlations. Closer points indicate similar treatments, while distant ones show variation. For example treatments like A1B6, A1B8 differ significantly, while A2B1, A2B5 are more similar.
The number of maize plants at harvest was significantly influenced by the study year, interaction of NPK dose, and Si fertilization treatment, and interaction of the study year, NPK dose, and Si fertilization treatment (
Table 8). The highest number of plants at harvest with the full NPK dose were produced by treatments B4 and B6, while the highest number of plants was produced by treatment B4 with the 50% dose.
The grain yield was significantly modified by the study year, NPK dose, Si fertilization treatment, the interaction of the study year and the Si fertilization treatment, and interaction of the study year, the NPK dose and the Si fertilization treatment (
Table 9). Application of the full NPK dose resulted in a significantly higher grain yield compared to the 50% dose. With the full NPK dose, the highest grain yields were obtained by treatments B3, B4, B7, and B8. With the 50% dose, the highest grain yields were obtained by treatments B4 and B8.
Sometimes, maize originally grown for grain is used as green fodder. In that case, the most important feature is the dry-matter yield. The dry-matter yield of the maize depended significantly on the study year, the NPK dose, the Si fertilization treatment, the interaction of the study years and the Si fertilization treatment, the interaction of the NPK dose and the Si fertilization treatment (
Table 10). The full NPK dose resulted in a significantly higher dry-matter yield than the 50% dose. For both doses, the highest dry-matter yield was obtained by treatments B4 and B8, and also by treatment B7 for the 50% dose.
The moisture content of the maize grain at harvest was significantly influenced by the study year, Si fertilization treatment, interaction of study year and Si fertilization treatment, NPK dose and Si fertilization treatment, study year, NPK dose and Si fertilization treatment (
Table 11). With the full NPK fertilization, the lowest moisture content was achieved by treatments B4, B6, and B7. With the 50% NPK dose, this was achieved by treatment B7.
The protein content in the grain was significantly influenced by the study year; Si fertilization treatment and the interaction of study year and Si fertilization treatment (
Table 12). With the full NPK fertilization, the highest protein content was produced by treatment B8, and with the 50% NPK dose, by treatments B3 and B8.
The fat content in the maize grain was significantly modified by the Si fertilization treatment (
Table 13), with the highest fat content being achieved by treatments B8 and B3 with both full and 50% NPK fertilization.
The starch content in the maize grain was significantly modified by the study year, Si fertilization treatment, interaction of study year and Si fertilization treatment, and the NPK dose and Si fertilization treatment (
Table 14). With the full NPK dose, the highest starch content was achieved by treatments B4 and B7, and with the 50% dose, by treatment B7.
The mass of 1,000 maize grains was significantly modified by the study year, Si fertilization treatment, interaction of study years and Si fertilization treatment, and NPK dose and Si fertilization treatment (
Table 15). With both NPK treatments, the highest mass was observed in grains from treatment B8.
The bulk density of the maize grain significantly depended on the study year, the Si fertilization treatment, and the interaction of the study year and the NPK dose (
Table 16). In both treatments of NPK fertilization, the highest bulk density was noted for treatment B8.
The study year, NPK dose, and Si fertilization treatment significantly modified the number of kernels per cob (
Table 17). With both NPK doses, the highest number of kernels per cob was achieved by treatment B7, with the full NPK dose producing a significantly higher number of kernels per cob compared with the 50% dose.
Study year, NPK dose, Si fertilization treatment and interaction of study year and Si fertilization treatment significantly influenced the grain yield from a single cob (
Table 18). With a full NPK dose, the highest grain yield from a single cob was produced by B7, and with a 50% dose, treatment B8. Application of the full NPK dose resulted in a significantly higher grain yield from a single cob compared with the half dose.
Study year, interaction of study year and Si fertilization treatment, interaction of NPK dose and Si fertilization treatment, and study year, NPK dose and Si fertilization treatment significantly influenced the number of cobs produced per plant (
Table 19). With the full NPK dose, treatments B4 and B7 produced a significantly lower number of cobs than the control treatment, while with 50% NPK, all treatments produced similar results.
Among the assessed maize yield and quality traits, the highest variability was observed in the number of kernels per cob (coefficient of variation, CV = 20.48%), and the lowest in the starch content in the grain (CV = 1.09%) (
Table 20.)
4. Discussion
Silicon has a multifaceted and beneficial effect on plant photosynthesis [
28]. The results of our own studies have shown that Si fertilization treatment significantly affects almost all the assessed physiological parameters in each measurement term. Previous studies on sugar beet have shown a significant effect of the foliar application of Si on the LAI, PAR absorption, and NDVI [
29,
30]. The foliar feeding of sugar beet with macro- and microelements has had a beneficial effect on the LAI, PAR absorption, and effective quantum efficiency value of Photosystem II (ΦPSII) and no significant effect on the remaining parameters of chlorophyll fluorescence and, after leaf adaptation to light, the stationary fluorescence and maximum fluorescence [
31].
In previous studies, the most common increase in maize grain yield was achieved by Si fertilization in a range of 5–10% [
32]. Our own research has shown that both soil fertilization with fertilizer containing Si and Ca, and the separate foliar application of these elements, as well as a combined treatment of soil fertilization and foliar application, have a beneficial effect on maize grain yield. The best results were obtained using a treatment including both methods of Si fertilization. A soil application of fertilizer containing Si, Ca, and Mg contributed to an increase in grain yield of 34% compared to the control [
33]. A beneficial effect on maize grain yield of soil fertilization with Zn and the foliar application of Si has been reported [
34]. The three-time foliar application of a biostimulant containing Na
2SiO
3 and Fe alone, or in a treatment containing a fungicide, has been found to contribute to a significant increase in maize grain yield compared to a control with no biostimulant or fungicide protection [
35]. Depending on the dose, the foliar application of K
2SiO
3 produced an increase in grain yield from 18% to 28% [
36], and the foliar application of orthosilicic acid with choline and Ca has contributed to an increase in grain yield of 29.2% compared to the control [
37]. The foliar application of K
2SiO
3 at a concentration of 1,000 ppm has produced the highest sweet maize grain and biomass yields, this treatment being most effective under water-deficit conditions [
38].
The use of stabilized orthosilicic acid has resulted in an increase in maize grain yield, the scale depending on the application method. Fertiliser containing stabilised orthosilicic acid (30% H
4SiO
4) was applied at different times and by different methods: control (no silicon application), seed dressing before sowing, soil spraying before sowing and crop spraying in the 5th-6th leaf stage (BBCH 15–16). With less rainfall in 2021, an increase in grain yield of: 5.1 and 1.5%, and a reduction of 5.9% in the last variant. In the following year, the yield increases were considerably higher and amounted to, respectively: 11.6; 12.0 and 32.8%, which the authors explain by the higher amount of rainfall [
39].
An effect similar to that on grain yield has been obtained for biomass yield. The soil application of liquid K glass and solid K
2SiO
3 has produced an increase in the biomass of young maize plants of 20–30% [
40]. The use of orthosilicic acid with the addition of microelements has increased the dry-matter yield of maize, depending on the dose, by 12.0% and 24.7% compared to the control [
41]. The application to the soil of K
2SiO
3 during sowing has contributed to an increase in the aboveground mass and grain yield of spring barley, and the yields of maize biomass for silage and soybean seeds. The greatest effect of 1 kg of silica (SiO
2) on these crops was determined at doses of 105, 92, and 76 kg SiO
2 ha
–1. A positive effect of the foliar application of Si fertilizers has also been obtained for soybean. The greatest increase in yield, compared to the control, was obtained in soybeans, a smaller increase in maize for silage and the smallest increase in spring barley [
42].
In our study, Si fertilisation and foliar fertilisation had an inconclusive effect on grain moisture. The timing and method of silicon application in the form of stabilised orthosilicic acid had no significant effect on grain moisture [
39].
The applied Si fertilization treatment mostly contributed to increasing the protein and fat contents and reducing the starch content in the grain. The use of stabilized orthosilicic acid resulted in an improvement in grain quality by increasing the protein and fat contents. Depending on the application method, the protein content in the grain increased from 10.8% to 11.5% (foliar application), 11.5% (dressing of seed grain), and 11.1% (soil application before sowing). Contrastingly, the fat content increased from 3.41% to 3.75%, 3.57%, and 3.91%, respectively [
43]. The foliar application of marine calcite (CaCO
3) fertilizer (Herbagreen) in maize cultivation, along with a 30% reduction in the amount of NPK fertilization, resulted in the same protein and fat contents in the grain as with the full NPK dose [
44].
In our own studies, Si fertilization treatment in most cases has significantly affected the weight of 1,000 grains, the grain density, and number of grains per cob. The timing and method of application of silicon in the form of stabilised orthosilicic acid had no significant effect on the weight of 1,000 grains and on the number of grains per cob [
39]. The soil application of Si, Ca, and Mg fertilizers has contributed to an increase in the number of kernels per cob and in the starch content in the grain [
33]. The foliar application of orthosilicic acid with choline and Ca has contributed to an increase in the grain yield per cob compared to a control [
37]. Foliar feeding has had a positive effect on the quality of maize grain (moisture, protein, lipid, carbohydrate, fiber, and mineral contents) [
7]. The foliar application of Si has also had a beneficial effect on the mycotoxins content in the grain. The foliar application of Na
2SiO
3 with Fe, depending on the dose, has reduced the content of the mycotoxin DON in maize grain by 82.8–90.8% and the mycotoxin ZEA by 96.7–98.4% [
45].