
Submitted:
25 February 2025
Posted:
26 February 2025
You are already at the latest version
Abstract
This study investigates the impact of different reverse logistics (RL) strategies on the economic and environmental performance of a system within the rubber flooring sector. A simulation tool was developed to replicate the behavior of a real production system, focusing on the transition from linear to circular processes. By considering multiple factors influencing system performance, this research offers an overview of the sustainability of various RL strategies and provides realistic es-timates for different scenarios. Three key factors were identified to evaluate each strategy’s re-sponse: transportation distance, flooring thickness, and returned flooring quality. The findings suggest that the environmental advantage generally favors on-site inspections at the customer’s location to assess the returned product's condition, regardless of distance. However, centralizing inspections at the manufacturer’s facility is more economically advantageous when distances are short, particularly when the company prioritizes recycling over other CE practices. Based on these results, practical implications and guidelines are proposed to help companies balance cost-effectiveness with sustainability, optimizing their operations within a circular economy framework.
Keywords:
circular economy
; remanufacturing
; recycling
; reverse logistics
; sustainability
; simulation
; case study
; practical application
1. Introduction
The current industrial landscape is undergoing a transformative shift driven by an urgent need to address sustainability challenges. In recent years, the global environmental crisis, manifested through escalating greenhouse gas emissions, resource depletion, and ecological degradation, has underscored the necessity for industries to adopt environmentally conscious practices. The industrial sector, accounting for a significant proportion of global emissions and waste generation, holds a crucial role in achieving sustainability targets.
In this context, international agreements and legislative frameworks such as the Paris Agreement [1] in 2015 and the European Climate Law [2] have provided a compelling impetus for action. The European Climate Law, for instance, mandates a net reduction of greenhouse gas emissions by at least 55% by 2030, while establishing legally binding goals to achieve carbon neutrality by 2050. These regulatory milestones reflect the increasing alignment of governmental policy with the principles of sustainable development, emphasizing the integration of environmental stewardship within economic and industrial strategies, while also paying attention to social aspects [3]
Among the most promising approaches to addressing these challenges is the adoption of a Circular Economy (CE) paradigm. Unlike traditional linear economic models, which are based on extraction, production, consumption, and disposal [4], CE advocates for a regenerative system designed to minimize waste and maximize resource efficiency. This shift towards circularity represents a significant evolution in industrial production, offering both environmental and economic benefits. CE principles find their main applicative strategies in reusing or recycling materials. Recycle usually operates on products in the disposal phase and aims to recover the raw materials without preserving the original functionality of the product. Reuse, instead, aims to maintain the original functionalities of the product and, depending on the final quality level of the product achieved, can be characterized in 5 different strategies [5]: direct reuse, repairing, reconditioning, refurbishing and remanufacturing, listed here in ascending order according to the final quality level achieved by the product.
The implementation of circular strategies has gained momentum within the industrial sector, especially for the environmental benefits they demonstrated to bring. For example, remanufacturing a product has the potential to reduce use of raw materials and waste disposal up to 80% if compared to new products [6], while saving up to 87% of CO2 emissions [7].
However, adopting CE strategies is often complicated because of the high investments needed to transform a factory based on a linear economy approach into a circular one. In fact, their implementation in real-world industrial settings often requires significant restructuring of supply chains, manufacturing processes, and business models. Additionally, industries must contend with uncertainties surrounding the costs and feasibility of these transitions, particularly in sectors reliant on complex production systems [8].
To address these challenges effectively, industries must rely on robust decision-making frameworks informed by quantitative evaluations of sustainability. In this sense, simulation emerges as a powerful tool for evaluating the feasibility and effectiveness of implementing CE strategies, since it allows for the creation of virtual models of production systems, enabling the exploration of different scenarios and their potential outcomes without making costly changes to real-world operations. By integrating sustainability-focused key performance indicators (KPIs), such as energy consumption, carbon emissions, and resource utilization, simulation provides a dynamic platform for assessing how CE practices can influence both environmental and economic performance [9,10]. Through this approach, decision-makers can gain insights into critical trade-offs [11], identify bottlenecks [12], predict failures [13] and explore the most effective strategies for aligning production systems with sustainability goals.
The aim of this research is to leverage on simulation tools to evaluate the economic and environmental impact of adopting CE strategies in the field of industrial rubbers used as floors in several environments. First, the “as-is” scenario, in which a production system based on the linear economy principles is adopted, was reproduced to validate the logics and rules of the production process, using data and information from a real application. Hence, two “to-be” scenarios will be simulated, differing for the strategy on the reverse logistics phase, and will be compared to identify the most sustainable one. Both the reusing and recycling practices were included in the “to-be” scenarios. Specifically, remanufacturing was considered among all the reuse practices to achieve the highest possible quality level for the final product. Among the various challenges faced by companies pursuing CE practices, this work focuses on the uncertainty surrounding the quality of recovered materials. The simulation model will perform quality control for choosing the most suitable practice among remanufacturing, recycling, or disposal.
2. Literature Review
The concept of the CE has emerged as a transformative model aimed at addressing the inefficiencies of the traditional linear economy. As described by Kirchherr et al. [14], CE represents an economic system that eliminates the “end-of-life” (EOL) concept for products, basically through the 3R paradigm: reduce, recover, recycle. It aims to minimize the use of resources and energy in production and consumption processes to reduce environmental impacts by extending products’ lifecycle (recover) or transforming end-of-life (EoL) products into raw materials for new production cycles (recycle).
The CE principles find their operative application in strategies like direct reuse, reconditioning, remanufacturing and recycling. However, the implementation of these strategies in industrial environments is, often, very complicated. Firstly, the implementation of the processes associated to these strategies has an increasing degree of difficulty according to the desired quality and performance of the product. For example, reconditioning aims to return a product to a satisfactory working condition, with overall performance and expected lifespan lower than the original [5], while remanufacturing returns a used product into a state in which it has at least the same performance and warranty of a new product [15,16]. This makes remanufacturing the top among the reuse strategies, but also the more complex, since it requires several operations, ranging from the complete disassembly of the product to reprocessing, reassembling and testing. Additionally, these operations can be further complicated by the inherent uncertainties that EoL products have. In fact, each product entering in the CE loop has its own story of usage and its inherent quality. Consequently, during the execution of the CE process, some unpredictable difficulties may arise, included unexpected hazards for workers during reprocessing [17] depending on the specific conditions of products. This creates uncertainty on the process flow and costs, and on the product’s recovery effectiveness [18].
Furthermore, products submitted to CE processes still suffer of a low acceptance rate by the customers, who perceive a lower quality of the reused product compared to the new, not adequately corresponded by a decrease in the purchase price [19].
These problems may limit stakeholders in investing in CE strategies, as they see the payback period of the investment far in time.
Despite these difficulties, entire industrial segments are starting investing to transition towards a CE paradigm. Companies like Philips have adopted “circular lighting,” offering light as a service where products are leased and components reused or refurbished, significantly reducing waste. Similarly, IKEA has committed to becoming a circular business by 2030, focusing on designing products that can be repaired, reused, and recycled, while also introducing furniture rental services to extend product lifecycles. However, to make circularity profitable, companies must adopt opportune strategies for each operation of the process. For example, reverse logistics (RL) represents a cornerstone to realize a profitable and environmental-friendly CE strategy, facilitating the return and recovery of products, components, and materials from end users back into the CE supply chain [20]. Without RL, circularity would not be possible. But, RL also represents a cost, because it requires transportation means, infrastructures for collection points, labor for sorting materials and incentives to end-users to encourage product’s returns [21]. Hence, opportunely managing RL is pivotal for the effectiveness of the entire CE strategy. The same can be said for other operations of a CE strategy. Inspection addresses evaluating the quality of EOL products to assess the convenience of applying a CE strategy and doing it appropriately can make the difference between profits and losses for a company [22]. Referring to remanufacturing, an efficient disassembly has been demonstrated to reduce the overall costs [23], but it is product-dependent and implies product-related decisions such as the level of disassembly [24].
It is clear that the variability of the CE strategies in each operation makes the difference in determining the profitability of circular operations. Products of high quality at the point of return typically require minimal processing, reducing the costs of disassembly, cleaning, and repair. These high-quality returns are more likely to be reintegrated into production cycles quickly and efficiently, leading to faster recovery of value and lower operational expenses. Conversely, products of low quality introduce significant variability into the process, often necessitating extensive operations, higher energy consumption, or complete material breakdown, which can escalate costs and increase lead times.
To reduce this variability, simulation emerged as a useful tool. Guevara-Rivera et al. [25] combined agent-based modeling and system dynamics (SD) to develop a simulation model to aid stakeholders understanding the implications of transitioning from a linear to a circular economy before the real-world implementation. The model was applied to a Mexican food bank [25] and to a confectionary factory [26]. Their results showed the utility of a simulation model in visualizing the mid and long term impacts of CE strategies and how these can lead to both economic and environmental benefits if implemented strategically. Charnley et al. [27] used discrete event simulation (DES) and SD to reproduce a remanufacturing process. DES was used to improve decision-making for remanufacturing electric motors in shop-floors, while SD allowed for exploring the remanufacturing system behavior over time. The paper demonstrated that using simulations based on real sensor data reduced processing times and associated costs and improved the accuracy in predicting the product quality. Goodall et al. [28] introduced a data-driven simulation framework to model remanufacturing operations with high levels of uncertainty, such as varying product returns, conditions, and processes. The framework was applied to a waste electrical and electronic equipment (WEEE) facility that remanufactures items like mobile phones, laptops, and hard drives, demonstrating its capability to help facing sudden changes in the industrial environment, such as fluctuating staffing levels, process updates, and inventory. Okorie et al. [29] discussed on combining different simulation models to move towards the concept of “smart remanufacturing”, a paradigm based on the use of digital technologies (such as Internet of Things or data-driven analysis). The authors focused on evaluating SD, DES and agent-based simulation, concluding that a hybrid simulation model is the best solution to analyze complex CE environments. Many papers focused on simulating CE production factories to optimize the scheduling of operations considering the quality uncertainty of the EoL products [30,31,32]. [30] focused on the quality evaluation for recycled automobile engines, [31] on the profit optimization for a company that remanufactures laptops and desktops, while [32] demonstrated that the Monte Carlo simulation based approach was useful to improve the overall CE system efficiency, not considering a specific application. The lifecycle extension of electric vehicles (EV) batteries also represents a hot theme. In this field , simulation has been used for different purposes. In [33], the authors proposed a DES approach to simulate the lifecycle of batteries and vehicles separately, enabling an analysis of supply and demand for remanufactured batteries. Results highlighted that integrating remanufactured batteries into the system extends vehicle lifetimes and reduces the environmental footprint of battery production, demonstrating the effectiveness of the simulation approach. In [34], the authors used SD to explore the interplay between manufacturers, retailers, and government policies in a closed-loop supply chains of EV batteries. Interestingly, the simulation showed that enhanced recycling technologies led to higher profits in recycling operations, increasing both collection prices and collection volumes. In the research by Lieder et al. [35], the authors changed the perspective, passing from a facility focused to a customer focused approach. They used an agent-based simulation model to reproduce the customers’ behavior and assess the acceptance of new CE business models, thereby accelerating CE implementation. Socio-demographic factors, product utility functions, social network structures, and inter-agent communication were the variables considered to simulate two CE approaches, one based on the possibility for customers to return products after use in exchange for a percentage of the original purchase price or other incentives, and another where the manufacturer maintains the property of the products and customers pay only for the usage of a product, rather than owning it. The results of the simulation demonstrated how the first approach favored customers who prioritized cost savings over environmental benefits, while the main challenge of the second approach was the cost retention, with customers frequently switching back to competitive or traditional sales offers due to the higher perceived cost.
The review of the literature highlighted that simulation is widely used in the field of CE strategies to evaluate the advantages and the possible drawbacks of different policies in several industrial sectors. To the best of the authors’ knowledge, there is a gap in the use of simulation to evaluate the implementation of CE strategies on industrial rubber floors. Some industrial initiatives such as the CISUFLO project [36] for sustainable floor coverings, IOBAC’s adhesive-free flooring solutions [37], and the Circular Flooring Partnership by Tarkett and IKEA [38], highlight the industry’s commitment to promoting reuse, recycling, and sustainable manufacturing. However, while these practical applications showcase the potential of CE principles, the scientific research addressing this specific sector remains limited. Recently, Parvaresh and Amini [39] introduced a 9R framework based on interviews to industrial stakeholders to promote a more sustainable and circular economy in the flooring sector, while Wiesinger et al. [40] analyzed the chemical compositions of industrial floors, discussing the implications of the findings on the transition to a safe and circular economy, highlighting the challenges of identifying and removing hazardous chemicals from recycled floors.
It is clear that those papers do not represent a sufficient sample to fill the gap evidenced before. Hence, the present paper is a first attempt to propose a simulation approach to evaluate the economic and environmental impact of implementing CE strategies in the rubber industrial flooring sector.
3. Materials and Methods
The research methodology employed in this study combines simulation modeling and case study-based research. A simulation-based approach was chosen due to the well-established potential of this technique for examining the behavior and performance of supply chain and industrial systems, particularly when assessing changes over time. The production process analyzed in this study is grounded in a real-life context, with data provided by a company located in Italy. The information supplied by the company was utilized to investigate the implementation of various CE practices and reverse logistics (RL) strategies within the rubber flooring sector, aiming to assess their suitability and sustainability for practical adoption. This approach aligns with the case study methodology, which is commonly used to explore new phenomena in contexts where understanding is heavily influenced by specific contextual conditions.
The research followed several key steps. The first step involved a review of recent studies (Section 2), aimed at analyzing existing evidence and identifying gaps regarding CE practices and reverse logistics strategies to evaluate their practical implementation. The second step involved analyzing a real-life process to better understand the operational flow and to identify key parameters of the process (Section 3.1.1). This analysis also led to identify potential industrial practices for remanufacturing and recycling specifically within the rubber flooring sector, and to design and characterize the CE processes (Section 3.1.2). Based on the insights gained from these steps, the “to-be “scenarios were identified, tailored to the characteristics of the specific sector under consideration. The proposed reverse logistics strategies are described in Section 3.2, including the logic behind the simulation model and the design of the experiments.
The final step of the research involved analyzing and organizing the results of the simulations to assess the impact of the proposed RL strategies (Section 4). The main findings and implications derived from these results are presented in Section 5, along with recommendations for potential practical implementation.
3.1. “As-Is” Scenario
This sub-section analyzes the “As-is” process, to understand the characteristics of the production phases. Then, the information will be used to identify the CE practices which could be potentially applied to the sector under investigation.
3.1.1. Linear Process
The production process of rubber flooring consists of two stages: compound preparation and molding. The compound is obtained through two key stages. In the first stage, the elastomer (rubber) is softened and mixed with other liquid and solid components. In the second stage, the compound is refined to improve homogeneity, and additional additives, such as accelerators, are introduced to prepare for the next processing steps. Once prepared, the compound is transferred to the warehouse.
The molding line consists of a series of sequential processes and operations that lead to the production of the final product. These operations are as follows.
The extrusion operation marks the starting point of the production process. During this phase, pressure and heat are applied to the raw material, forming a continuous shape and imparting the necessary physical and mechanical properties. Key parameters in this stage include speed and temperature, which must be continuously monitored to ensure the desired performance of the flooring product. Next, the product passes through one or more rotating rollers in the calendaring process, which serves to achieve sheets of varying thickness. The main variables to monitor in this phase to meet the required quality standards include the speed of the calendaring machine, the temperature of the calendar, sheet thickness, and sheet width. Following calendaring, the grinding operation is performed to refine the product and its surface to the desired shape. The key of this stage include the material removal rate, grinder speed, and electronic absorption. After grinding, the vulcanization process is carried out. Critical parameters for monitoring during vulcanization include speed, temperature, imprint paper type, and paper consumption. Once vulcanization is complete, the rubber product is gradually cooled to stabilize its structure. Subsequently, the product is coated with an opacifying substance to enhance its opacity and improve its physical properties. Then, the product undergoes corona treatment, an effective method for increasing the surface tension of the material. Key variables for this process include speed and power settings. Finally, the coating and curing operation are performed before the cutting process.
A discrete event simulation (DES) model was developed using AnyLogic software, which is recognized for its effectiveness in simulating complex system behaviors. Figure 1 illustrates a scheme of the model, where each block represents a process through which the raw material is transformed until it meets the final product specifications.
The first block (source) is used to generate the raw material entering the system. In this regard, the compound preparation is treated as a black box within the simulation process; therefore, it is not simulated, but it outputs the raw material that proceeds to the subsequent stages of processing. The arrival rate simulates the raw material entry into the system, and it was modelled according to the data provided by the company. The next block (dummy operation) is a dummy work center, included in the model to assign two different labels to the products, to distinguish between different thickness and weight, reflecting the difference in products realized by the company. Thickness represents a critical parameter for the company that affects production costs and CO2 emissions; weight, which is directly linked to thickness, is essential for calculating transportation costs and the associated environmental impact. These labels are assigned according to the probability that a given product is requested by the customers. Labels allows setting different processing time and energy consumption in all the machines belonging to the following block (“AS-IS process”). The “AS-IS process” block is used to reproduce the manufacturing process, and it includes all the operations described above, each one characterized by its key parameters. The final block (End) represents a decision point that determines whether the flooring should undergo the cutting operation. If the decision is to proceed with cutting, the material will undergo the die-cutting process and then be sent to the tile warehouse. Alternatively, if the cutting operation is not required, the material will be sent directly to the flooring warehouse. The data inserted reflects the probability that a given product will be cut before being stocked.
The simulation model was run with a one-minute time step, for 25 replications of a typical working day. The “As-Is” system was replicated using the real data provided by the company, and the results were used to validate the model. This step allowed for a comparison between the simulation results and the actual process results, ensuring the accuracy of the applied logic.
3.1.2. From Linear to Circular
Transitioning from a linear to a circular model is a complex process. Converting a linear production system into a circular one requires a fundamental rethinking of how resources are utilized, optimized, and recovered within the system. To facilitate circularity, products should be designed for easy disassembly and reuse. Starting with these concepts, remanufacturing and recycling processes were characterized and tailored to the product, process and sector under investigation.
To understand the logics used to design the “to-be” scenarios, the main stages of a remanufacturing process are described with a specific focus on the sector investigated.
Pre-Disassembly: it is a preparatory phase. It involves inspecting and assessing the product’s condition when it is returned to the company. Based on this evaluation, decisions are made on whether to proceed with remanufacturing, recycling, or disposal. The goal is to assess the product’s quality to identify the most suitable process. Key operations include testing the product to determine its state, which informs the next steps: 1) continuing with remanufacturing if the quality of the rubber flooring is high, 2) recycling if the quality is good, but insufficient to ensure that the new flooring meets the ‘as good as new’ condition, 3) disposing when the quality is too bad for any CE practice.
Disassembly: If remanufacturing is selected, the flooring undergoes disassembly, which, in general, is the most complex and critical phase. Components are separated, and each one is inspected to determine if a maintenance phase is needed. In this specific case, disassembly consists in the removal of the top layer of the floor (sheet), which has a defined thickness that does not depend on the thickness of the flooring.
Repair or Maintenance: Components undergo maintenance operations to restore them to a condition close to that of new products. These operations vary, with simpler cases requiring only cleaning and painting. This step was considered in this study according to the characteristics of the product considered. In particular, the removed sheet is disposed of, and a new sheet is produced to replace the old one; the remaining part of the floor will undergo the following operation.
Reassembly: In this stage, the components are reassembled to form the product. The reassembled component may be identical to the original or upgraded, depending on customer specifications. In this case, reassembly consists in gluing the new sheet that will form the top layer of the floor.
Post-assembly: The final phase involves testing the reassembled product to ensure it meets required quality standards.
If recycling is selected during the pre-disassembly phase, the flooring will undergo a specific treatment to recycle the material, which will subsequently be used in the production of a new floor to be sold on the market. The process begins with devulcanization, which breaks the chemical bonds between the elastomer and the additives. Then, a grinding operation is performed, which is crucial for reducing the material to a controlled size and for converting the devulcanized floor into recycled raw material. The As-Is process, as outlined in the previous section, will then be applied, resulting in the production of a floor made from recycled raw materials.
Finally, if disposal is selected during the pre-disassembly phase, no treatment is applied to the flooring which is directly disposed.
3.2. “To-Be” Scenarios
The To-Be scenarios represent alternative strategies that will be evaluated to identify the most sustainable approach, considering the characteristics of the examined system. The objective is to simulate two distinct scenarios, which differ in the reverse logistics strategy employed. The primary distinction lies in the execution of several process stages at the manufacturer’s facility, rather than at the customer’s location, where the flooring is to be recovered at the end of its life cycle.
The key difference between the two scenarios concerns the logistic flow of the flooring. The first aspect involves the execution of the Pre-Disassembly phase, which can occur either at the manufacturer’s facility or at the customer’s location. This phase is crucial for assessing the quality of the flooring and determining the appropriate CE practice—recycling, remanufacturing, or disposal. Indeed, the uncertainty related to the quality of the returned product is a critical factor in evaluating the product’s suitability for remanufacturing. For both scenarios, the same assumptions regarding the quality of the flooring, as described in section 3.1.2, were applied.
In the first scenario, referred to as ‘To-Be 1’, the flooring is returned to the manufacturer’s facility before the inspection phase. This incurs shipping costs necessary to recover the returned product with the aim of assessing the condition of the flooring and determining the appropriate CE practice. In the second scenario, ‘To-Be 2’, the operator visits the customer’s location to inspect and, if necessary, collect the flooring for further processing. In this case, only the operator’s travel costs are considered.
The To-Be scenarios will be compared to assess the most sustainable reverse logistics strategy in terms of both economic and environmental sustainability.
3.2.1. To-Be 1: Inspection at the Manufacturer’s Facility
Figure 2 show the flow chart of the ‘To-Be 1’ in which the Pre-Disassembly operation (quality control) is carried out at the manufacturer’s facility.
Each blue block represents an operation to be carried out. In this scenario, the flooring is returned to the manufacturer’s facility for inspection to determine the appropriate CE practice to be implemented. The process starts with the return of the flooring, which is represented by the green ‘RL’ block. A quality control check is then performed on the returned product, and based on the results, the next steps are determined. This decision-making process is represented by the blue diamond shape, indicating a decision point.
At this stage, depending on the outcome of the quality control, a specific CE practice is selected (orange blocks), and the flooring undergoes different operations and treatments. The flooring of low quality does not undergo any treatment and is directly disposed of. Flooring of good quality is processed for recycling materials, which is then used to produce new flooring for sale on the market. The process description (orange ‘recycling’ block) is provided in section 3.1.2. As the final step, the flooring produced from recycled material is shipped to the end user (green ‘LOGISTICS’ block).
Flooring of excellent quality is processed for remanufacturing (orange ‘remanufacturing’ block), and the resulting flooring is sold on the market. Several operations, as outlined in section 3.1.2, are performed. Afterward, the remanufactured flooring is shipped to the end user.
Figure 3 shows the scheme of the simulation model, with pink block highlighting the dummy operations that assign 3 labels: ‘thickness’ and ‘weight’, already used in the ‘As-Is’ model to simulate the difference in products realized by the company, and the label ‘quality’ that allow to assign the quality of the returned flooring. The red block represents the As-Is process, the yellow block represents the process related to sheet production, and the blue one represents the flooring shipment. Finally, the green block shows the RL phase, which is performed before the inspection phase.
3.2.2. To-Be 2: Inspection at the Customer’s Location
The ‘To-Be 2’ scenario involves the operator visiting the customer’s location to perform the quality control directly on-site, in contrast to the previous approach, where the Pre-Disassembly operation is carried out at the manufacturing facility. The flow chart is shown in Figure 4.
As in the ‘To-Be 1’ scenario, the diamond shape represents a decision point that determines the appropriate CE practices based on the flooring’s quality.
If the flooring is suitable for recycling (i.e., of good quality), it must be shipped to the manufacturer’s facility (green ‘RL’ block), where the recycling process and production take place. In this case, the steps from material recycling to flooring shipment follow the same process as in the previous scenario. The key distinction is that only flooring of good quality is shipped to the manufacturing facility, while flooring of low quality is not purchased. Therefore, this strategy enables the company to cover the operator’s travel expenses, while potentially benefiting from cost savings if the flooring is of bad quality.
If the flooring is of excellent quality, the operator removes the top layer directly at the customer’s location. The remaining part of the flooring is assembled with a new sheet, which is shipped from the manufacturer’s facility where it is produced. The shipping of the new sheet is represented by a green block. Once this phase is complete, no further shipment of the finished product occurs, as reassembly and post-assembly operations are carried out at the customer’s location. Compared to the ‘To-Be 1’ scenario, for flooring undergoing remanufacturing, only the new sheet is produced at the manufacturer’s facility and then transported to the customer’s location, eliminating the need to transport the entire flooring back to the manufacturer’s facility.
Figure 5 represents the Anylogic model, where the blocks assigning labels are highlighted in pink, the As-Is process is highlighted in red, the production process related to the sheet is highlighted in yellow, and the shipments are highlighted in blue. Finally, the green block shows the RL phase, which is performed after the inspection phase.
3.2.3. Design of Experiment
As already asserted, the aim of this study is to evaluate the sustainability of two RL strategies and assess their suitability in practice. Three factors have been identified with the aim of evaluating the response of the system. The following key factors were considered to have a potential impact on the performance of the system: the distance between manufacturer and customer, the flooring thickness, and the returning flooring quality. This approach offers a realistic estimate of the various situations that could arise.
Two possible distances from the manufacturing facility to the customer location were simulated. Additionally, eight different quality scenarios were considered, each simulating a different percentage of returned flooring in low, medium and highquality conditions. These scenarios were simulated to provide a comprehensive overview of the potential end-of-life conditions of the flooring. Finally, the effect of flooring thickness was evaluated. Four different thickness scenarios were defined, each representing different proportions of low, medium and high thickness flooring. These scenarios were used to assess the probability of customer demand for a specific thickness, which has a direct impact on both the production and transportation phases.
For each experiment, the simulation model provides the results for the two ‘To-Be’ scenarios. Overall, 128 different experiments have been designed. Table 1, Table 2 and Table 3 provide an overview of the data used for each scenario.
The following key performance indicators (KPIs) are used to assess the sustainability of the ‘To-Be’ scenarios:
- Average profit [€/kg]
- Average CO2 emissions [kgCO2/kg]
The average profit represents the mean profit per kg of flooring produced and reflects the economic efficiency of the strategy. The average CO2 emissions measure the carbon dioxide emissions per kg of flooring, providing an estimate of the environmental impact. Both KPIs are critical for identifying the most sustainable strategy.
Profit is determined by accounting for all costs incurred during production and the total revenue. Revenue is calculated based on the flooring sold, including both those that have undergone the remanufacturing process and will be sold at a lower price, as well as those made from recycled material, which will be sold at a higher price respect to the manufacturing one. Costs include the cost of raw materials, labor costs, energy costs, and transportation costs (both logistics and RL phases).
The CO2 emission is calculated by considering the total amount of CO2, including emissions generated from manufacturing, remanufacturing and recycling. For production processes, the energy consumed was converted into CO2 emissions using the Carbon Emission Signature (CES), a specific coefficient that translates energy consumption into kgCO2. CO2 emissions due to transportation (both logistics and RL phases) were then added to compute the total amount of CO2emissions.
All ‘To-Be’ scenarios were simulated using the real data provided by the company, which was also used for the ‘As-Is’ simulation. The simulation model was run with a one-minute time step to replicate a typical working day.
4. Results
This section summarizes the results provided by the scenarios that have been run. A full factorial plan of experiment was conducted, and this consists of 128 different scenarios. Each scenario was generated by combining a specific scenario for each factor under consideration. The aim is to understand the impact of each factor and the effect of the RL strategy on the performance of the system.
The first analysis regards the evaluation of the impact of the three factors on the environmental and economic performance of the system; the results of the simulations were analyzed focusing on one single factor while keeping other factors constant.
Starting with the impact of thickness, Figure 6 shows the performance varying the probability that the customer requests a flooring of a certain thickness (four thickness scenarios).
A clear trend emerges as the percentage of floors with greater thickness (and consequently higher weight) increases (thickness #4), leading to a rise in average profit. This trend holds true for both the ‘To-be 1’ and ‘To-be 2’ scenarios. This can likely be attributed to the fact that the increase in weight leads to higher revenue, which outweighs the additional production and transport costs associated with the increase in thickness. However, a similar conclusion cannot be drawn when considering the average CO2 emissions. In this case, it is evident that thickness does not have a clear impact under the same RL scenario, but it’s clear that the RL strategy combined with thickness is an important element when evaluating the environmental sustainability since thickness impacts logistics and RL processes.
Moving to the impact of distance, Figure 7 shows the performance varying the distance (two distance scenarios).
As expected, the impact of distance on performance is significant. As the distance increases, both economic and environmental performance deteriorates, as evidenced by a decrease in average profit and an increase in CO2 emissions. Notably, the effect is more pronounced in the ‘To-Be 1’ scenario, indicating a higher dependency of this scenario on logistics operations.
Figure 7 shows the last analysis on the performance varying the flooring quality (eight quality scenarios).
It can be observed that the net profit decreases as the percentage of top-quality flooring increases (moving from quality #1 to quality #8). This is because the top-quality flooring is sold at a lower price compared to flooring that has undergone recycling processes. This trend is more evident in the ‘To-Be 2’ scenario, where the logistics costs have a lower impact on economic performance.
Furthermore, as the percentage of top-quality flooring increases, implying the implementation of remanufacturing processes and consequently lower energy consumption compared to recycling operations, CO2 emissions tend to have a progressively lower environmental impact, which is clear for both the RL strategies.
The last analysis still focuses on the impact of quality on performance and strategy. Specifically, the objective is to understand how increasing the weight of the remanufacturing process affects the system by comparing the two RL strategies and calculating the frequency with which a strategy proves to be successful as the percentage of high-quality products increases. The comparison was made considering 16 scenarios at a time, starting from scenarios with percentage of remanufacturing equal to 50% to scenarios characterized by the maximum percentage of high-quality products (80%). Figure 9 indicates the number of times one scenario is more advantageous than the other from an economic or environmental perspective. Results show that the type of CE practice adopted does not significantly influence profit; in fact, the two strategies are largely equivalent, with no clear trend. However, regarding environmental sustainability, the CE practice has a considerable effect, revealing a clear trend in which “to-be 2” emerges as the least impactful strategy. This can be easily explained by the reduced number of trips required.
5. Discussion
This study explored the effects of different reverse logistics (RL) strategies on the economic and environmental performance of a system within the rubber flooring sector, adopting various CE practices. By considering multiple factors, we aimed to understand how these elements influence sustainability.
The following discussion highlights the key findings of this study, examining practical implications, and potential directions for future research.
5.1. Main Findings
The results of the simulation demonstrate that when the percentage of products eligible for remanufacturing is minimal (50%), the economic and environmental implications of the RL strategy differ significantly. The centralization of inspection at the manufacturer’s facility tends to be more economically advantageous (mainly when distances are low), as it may involve fewer operational costs in terms of time and resources required for production. However, this strategy is generally less sustainable, primarily due to the environmental impact of the additional transportation required.
In contrast, the inspection that takes place at the customer’s site leads to a reduction in transportation costs, as fewer trips are necessary. However, this strategy introduces the additional costs associated with operator travel and time spent on-site performing the inspection and remanufacturing operations. Despite these extra costs, this solution is more environmentally and economically sustainable, as it significantly reduces the overall transportation impact, particularly when distances are long.
Thus, the economic advantage of the RL strategy is often driven by transportation cost efficiency, but this advantage is counterbalanced by the higher environmental impact. On the other hand, the choice to limit the RL process represents a more environmentally favorable approach, especially as transportation distances increase, although it may come at a higher economic cost due to the operational time and travel expenses required to conduct inspections at the customer’s location.
As the percentage of good-quality flooring increases and that of low-quality flooring decreases, the proportion of flooring requiring recycling operations rises, while the number of flooring units that are not purchased decreases. This leads to a situation where a greater amount of flooring needs to be returned to the manufacturer’s facility for processing. At low distances, it is difficult to definitively determine which strategy is more economically advantageous or sustainable, as the optimal choice largely depends on the thickness of the flooring being processed. This result demonstrates how thickness impacts on the overall sustainability of each strategy. However, when distances increase, the environmental impact of RL operations becomes significantly higher. Despite this, the economic advantage does not necessarily shift towards the strategy with less RL operations. This is because, in any case, the flooring still ultimately needs to be sent back to the manufacturer’s facility for recycling.
Thus, the trade-off between sustainability and cost-effectiveness is influenced by a combination of factors, including the distance involved, the quality of the flooring, and the operational requirements of each strategy.
As the proportion of top-quality flooring increases (60%), a larger share of flooring requires remanufacturing operations. Thus, the remanufacturing process that takes place at the customer’s site involves only the transportation of the new sheet, rather than the entire flooring, which can reduce the overall logistical effort. Therefore, when considering the environmental impact, the centralization of inspection at the manufacturer’s facility typically shows a higher impact, even at short distances.
However, when the proportion of good-quality flooring rises in relation to low-quality flooring (i.e., when more flooring returns to the manufacturer for recycling), it is difficult to declare one strategy as definitively more sustainable than the other. The sustainability of each strategy is influenced by factors such as the thickness of the flooring being processed, especially when distances are short. However, the inspection at the customer’s site is often more economically favorable, as it reduces transportation costs, despite more operational expenses related to remanufacturing processes at the customer’s site. Thus, the decision between these strategies depends on a combination of economic and environmental considerations, with factors like product quality, processing requirements, and transportation distances playing key roles in determining the optimal approach.
As the proportion of top-quality flooring increases once again (70%), the environmental benefits tend to favor the inspections on-site at the customer’s location, regardless of the distance. This minimizes the overall environmental impact by avoiding the repeated trips required to transport flooring back and forth. However, this environmental benefit could be diminished in cases where the percentage of low-quality flooring increases, potentially decreasing the high environmental impact of the recycling process in terms of both process and transport.
Economically, the approach with on-site inspection may also be more cost-effective, particularly when there is a higher percentage of low-quality flooring. In this scenario, the low-quality flooring is identified and rejected on-site, avoiding the costs associated with transporting it to the manufacturer’s facility for inspection and disposing. On the other hand, the alternative approach, which involves transporting all the flooring to the manufacturer, incurs additional costs related to transportation, inspection, and potential disposal of low-quality flooring. Also in this case, the optimal strategy depends on various factors such as transportation distance, the quality of the flooring, and the costs associated with inspection and remanufacturing processes. Each approach has its own trade-offs in terms of sustainability and economic efficiency, and careful consideration is needed to determine the most effective method for a given situation.
When the proportion of top-quality flooring is at its maximum (80%), the environmental advantage generally favors the scenario where inspections are conducted at the customer’s location, regardless of distance. The only exception occurs in certain scenarios with short distances and minimal low-quality flooring. This means that for short distances, even though recycling has a significant environmental impact, it is more advantageous compared to disposal.
From an economic perspective, conducting inspections on-site is typically more cost-effective, especially when the proportion of low-quality flooring is lower than that of good-quality flooring. Even when the amount of flooring that needs to be discarded is minimal (making the economic impact of disposal relatively insignificant), the scenario where inspections take place at the customer’s location remains more advantageous. This suggests that when the quantity of flooring requiring remanufacturing is high, the savings from avoiding transportation of the entire flooring to the manufacturer’s facility outweigh the additional costs of operator travel and labor.
In summary, when a large proportion of flooring requires remanufacturing, the economic benefits of on-site inspection become clear, as the transportation and labor costs associated with returning the flooring to the manufacturer’s facility are more costly than conducting the operations at the customer’s location.
5.2. Final Remarks and Practical Implications
Based on the results of this analysis, some practical implications and guidelines are presented. The aim is to help companies to choose the best strategy within a CE context.
1. Prioritize on-site inspection for reaching environmental sustainability
For companies seeking to reduce their environmental footprint within a CE framework, conducting on-site inspections (at the customer’s location) typically represents the most sustainable approach. This strategy significantly minimizes transportation needs by eliminating the need to transport flooring back and forth between the customer site and the manufacturer’s facility. This is especially true when the remanufacturing practice is prevalent and it can be also performed on-site, as the focus on reusing and extending the life cycle of materials aligns with the environmental principles of waste reduction and resource efficiency. On-site inspection further optimizes sustainability by ensuring that only flooring requiring remanufacturing is processed, while materials deemed unsuitable for reuse can be immediately discarded or repurposed, avoiding unnecessary transportation. Additionally, this practice reduces the energy consumption associated with the logistics of transporting large volumes of flooring.
When evaluating the environmental advantages of on-site inspection, companies should also consider the potential environmental impact of the remanufacturing process itself. In some cases, remanufacturing may have a significant environmental footprint, especially when high-energy processes are involved. Therefore, adopting an integrated approach that balances the environmental costs of both logistics and remanufacturing is essential for achieving optimal sustainability outcomes.
Moreover, it is important for companies to continually monitor and assess the environmental impacts of their strategies. Technological advancements in both transportation and remanufacturing processes can further enhance the sustainability of on-site inspection, making it an even more viable strategy as innovation progresses in the field of circular economy practices.
While on-site inspections provide substantial environmental benefits, these advantages are maximized when combined with other CE practices, such as effective waste management, energy-efficient remanufacturing processes, and optimized transportation logistics. Future research and practice should explore the integration of these factors to create comprehensive, sustainable systems for product life cycle management.
2. Short distances can justify recycling at the manufacturer’s facility
Short distances between the manufacturer and the customer can significantly influence the sustainability and economic viability of different CE practices. When distances between the manufacturer and the customers are short, it may be more beneficial to prioritize recycling rather than other CE practices. Despite the higher environmental impact of recycling processes, the reduced transportation costs make recycling the more economical and environmentally favorable option in such cases.
The environmental impact of recycling, particularly in terms of energy consumption and emissions, is often considerable due to the complex and energy-intensive nature of many recycling processes. However, when transportation distances are minimal, the overall environmental footprint is substantially reduced. The decreased need for extensive transportation mitigates the carbon emissions typically associated with long-haul logistics, making recycling a more environmentally favorable option in such circumstances.
Economically, short transportation distances can also make recycling more profitable due to the higher prices of recycled products. This is particularly relevant in cases where the volume of products requiring recycling is significant, and where the cost of manufacturing would otherwise impose a heavier financial burden.
It is important to recognize that the choice between recycling and other CE practices should be based on a comprehensive analysis of both environmental and economic factors, including transportation costs, energy consumption, and the specific requirements of the remanufacturing process. Companies should also take into account the evolving nature of recycling technologies, which may increasingly reduce the environmental impact of recycling and improve its economic viability in the future.
Thus, while recycling is typically associated with a higher environmental impact, short distances can make it a more favorable option, both environmentally and economically, when transportation costs are minimized. Future research should explore the integration of these factors and investigate how short-distance logistics can be optimized within circular economy strategies to achieve greater sustainability outcomes.
4. Consider the quality of the returned item as the main driver
When a significant proportion of flooring requires remanufacturing, the strategy can have considerable implications for both environmental and economic performance. In these cases, the savings generated from reducing transportation costs—by conducting on-site inspections and avoiding the need to transport entire flooring units—can often outweigh the additional costs incurred for operator travel and labor. On-site inspections reduce the need for long-distance transport of flooring, thereby minimizing the associated emissions, energy consumption, and logistical costs. Furthermore, remanufacturing a large volume of flooring on-site aligns with the principles of the CE, as it promotes material reuse while reducing the carbon footprint of transport.
From an economic perspective, while the costs of operator travel and additional labor for on-site inspections must be considered, these are often compensated by the avoidance of transportation and related handling costs. The higher the volume of flooring requiring remanufacturing, the greater the potential savings from minimizing transportation-related expenses. Consequently, this approach can contribute to the optimization of both environmental and economic performance, making it a strategically sound choice in scenarios with substantial remanufacturing needs.
In contrast, when only a small proportion of the flooring requires remanufacturing, it may be more efficient to conduct inspections at the manufacturer’s facility. This is particularly relevant when the volume of flooring to be inspected and processed does not justify the additional costs associated with transporting operators to the customer’s location and conducting the remanufacturing at the customer’s site. In such scenarios, the complexities involved in on-site inspections—such as time, logistics coordination, and labor costs—may outweigh the potential savings from reducing transportation.
Moreover, the manufacturer’s facility is typically better equipped to handle a variety of remanufacturing processes and can achieve higher efficiencies due to economies of scale, which may not be achievable in on-site operations for smaller volumes. By centralizing the inspection and remanufacturing activities at the manufacturer’s location, companies can optimize operational efficiency and minimize the overall cost per unit of remanufactured flooring.
The decision to prioritize on-site inspections or centralize operations at the manufacturer’s facility should be based on a thorough analysis of remanufacturing volumes. When large volumes of flooring require remanufacturing, on-site inspections are likely to yield better environmental and economic outcomes. Conversely, for smaller volumes, centralizing operations at the manufacturer’s facility remains a more efficient option.
In conclusion, the volume of remanufactured flooring plays a key role in determining the most appropriate strategy for optimizing the balance between sustainability and economic viability. A comprehensive approach that integrates remanufacturing volume with logistical considerations is crucial for maximizing the effectiveness CE practices in the flooring sector.
5. Digital twins and dynamic decision-making help improve sustainability
To maximize the effectiveness of CE practices, companies must adopt a dynamic and flexible decision-making approach that integrates both environmental and economic considerations. The optimal strategy is not static but depends on several factors that can vary over time, such as transportation distance, the quality of flooring materials, and the specific characteristics of the product required. As these factors can fluctuate, it is crucial for companies to regularly reassess their strategies to ensure they are selecting the most efficient approach for each situation.
A flexible decision-making framework allows companies to adapt their strategies in real time based on changing operational conditions. For example, when transportation distances are short, prioritizing recycling or centralizing inspection may be more environmentally and economically favorable. Conversely, for long-distance logistics, inspection and remanufacturing processes at the customer’s facility could minimize transportation costs and environmental impact. By continuously evaluating these variables, companies can ensure that their strategies remain aligned with both their sustainability goals and economic objectives.
To support dynamic decision-making, companies should leverage simulation approaches through the implementation of decision-support tools or software. These tools can analyze a wide range of scenarios and provide insights into how best to optimize logistics, inspection processes, and remanufacturing volumes. By integrating data on transportation distances, product quality, remanufacturing requirements, and other relevant factors, companies can model various strategies and predict their impacts on both environmental sustainability and economic performance. Simulation models can help companies assess how changes in one variable, such as an increase in remanufacturing volume or a shift in transportation distance, will influence overall performance. This approach not only improves the accuracy of decision-making but also enhances the company’s ability to respond to emerging trends, shifts in customer demand, and regulatory changes.
Furthermore, by adopting decision-support tools, companies can track key performance indicators related to environmental sustainability, operational efficiency, and cost-effectiveness. This continuous monitoring of performance allows for iterative improvements and ensures that companies can stay competitive in a rapidly evolving CE landscape.
In conclusion, companies aiming to integrate sustainable practices into their operations should adopt flexible, data-informed strategies that account for the variability of key factors. By utilizing decision-support systems to analyze and optimize these factors, companies can enhance their operational efficiency, improve their environmental performance, and ensure that their practices align with long-term sustainability goals.
6. Conclusions
The study highlights the importance of evaluating reverse logistics strategies in a CE landscape and considering both economic and environmental performance. On-site inspections at customers’ locations offer significant environmental benefits by reducing transportation. However, short transportation distances may make recycling at the manufacturer’s facility more cost-effective, despite the higher environmental impact. Large remanufacturing volumes benefit from on-site inspections, while small volumes may be more efficient at the manufacturer’s facility. The study highlights the importance of dynamic, data-driven decision-making, using simulation tools to optimize logistics and Ce practices, balancing sustainability with cost-effectiveness.
Author Contributions
Conceptualization, M.R., M.C., M.F.; methodology, M.R., M.C., R.A.; software, M.R.; validation, M.R, R.A.; formal analysis, M.F.; investigation, M.C., M.F.; resources, U.D., R.M.; data curation, M.C.; writing—original draft preparation, M.R.; writing—review and editing, R.M; supervision, U.D., R.M.; project administration, U.D. All authors have read and agreed to the published version of the manuscript.
Funding
This research was conducted within the framework of the SIIP “Sustainable Intelligent Industrial Planning” project funded by Ministero delle Imprese e del Made in Italy (MIMIT) under Grant Agreeement No. F/310195/01-04/X56. The authors acknowledge that this output reflects only their views, and the funding authority cannot be held responsible for any use that may be made of the information contained herein.
Data Availability Statement
Data available on request due to restrictions eg privacy or ethical.
Conflicts of Interest
The authors declare no conflicts of interest.
References
- Agreement, P. (2015, December). Paris agreement. In report of the conference of the parties to the United Nations framework convention on climate change (21st session, 2015: Paris). Retrived December (Vol. 4, No. 2017, p. 2). Getzville, NY, USA: HeinOnline.
- Regulation (EU) 2021/1119 of the European Parliament and of the Council of 30 June 2021 establishing the framework for achieving climate neutrality and amending Regulations (EC) No 401/2009 and (EU) 2018/1999 (‘European Climate Law’).
- Fantozzi, I.C.; Di Luozzo, S.; Schiraldi, M.M. The Impact of University Challenges on Students’ Attitudes and Career Paths in Industrial Engineering: A Comparative Study. Sustainability 2024, 16, 1600. [Google Scholar] [CrossRef]
- Neves, S.A.; Marques, A.C. Drivers and barriers in the transition from a linear economy to a circular economy. J. Clean. Prod. 2022, 341, 130865. [Google Scholar] [CrossRef]
- Gharfalkar, M.; Ali, Z.; Hillier, G. Clarifying the disagreements on various reuse options: Repair, recondition, refurbish and remanufacture. Waste Manag. Res. J. a Sustain. Circ. Econ. 2016, 34, 995–1005. [Google Scholar] [CrossRef] [PubMed]
- Manco, P.; Caterino, M.; Rinaldi, M.; Macchiaroli, R. A sustainability-oriented methodology to compare production strategies: The case of AM-based remanufacturing. J. Clean. Prod. 2023, 423, 138594. [Google Scholar] [CrossRef]
- Arnold, M.; Palomäki, K.; Le Blévennec, K.; Koop, C.; Geerken, T.; Jensen, P.; Colgan, S. Contribution of remanufacturing to circular economy. Eionet Report-ETC/WMGE, 10, 2021. Eionet Report-ETC/WMGE 2021, 10, 2021. [Google Scholar]
- Ghisellini, P.; Ulgiati, S. Circular economy transition in Italy. Achievements, perspectives and constraints. J. Clean. Prod. 2020, 243, 118360. [Google Scholar] [CrossRef]
- Han, F.; Sun, M.; Jia, X.; Klemeš, J.J.; Shi, F.; Yang, D. Agent-based model for simulation of the sustainability revolution in eco-industrial parks. Environ. Sci. Pollut. Res. 2021, 29, 23117–23128. [Google Scholar] [CrossRef]
- de Paula Ferreira, W.; Armellini, F.; De Santa-Eulalia, L. A. Simulation in industry 4.0: A state-of-the-art review. Computers & Industrial Engineering 2020, 149, 106868. [Google Scholar]
- Caterino, M.; Greco, A.; D’ambra, S.; Manco, P.; Fera, M.; Macchiaroli, R.; Caputo, F. Simulation Techniques for Production Lines Performance Control. Procedia Manuf. 2020, 42, 91–96. [Google Scholar] [CrossRef]
- Leoni, L.; Cantini, A.; BahooToroody, F.; Khalaj, S.; De Carlo, F.; Abaei, M.M.; BahooToroody, A. Reliability Estimation under Scarcity of Data: A Comparison of Three Approaches. Math. Probl. Eng. 2021, 2021, 1–15. [Google Scholar] [CrossRef]
- Leoni, L.; De Carlo, F.; Abaei, M.M.; BahooToroody, A.; Tucci, M. Failure diagnosis of a compressor subjected to surge events: A data-driven framework. Reliab. Eng. Syst. Saf. 2023, 233. [Google Scholar] [CrossRef]
- Kirchherr, J.; Reike, D.; Hekkert, M. Conceptualizing the circular economy: An analysis of 114 definitions. Resour. Conserv. Recycl. 2017, 127, 221–232. [Google Scholar] [CrossRef]
- Caterino, M.; Fera, M.; Macchiaroli, R.; Pham, D.T. Cloud remanufacturing: Remanufacturing enhanced through cloud technologies. J. Manuf. Syst. 2022, 64, 133–148. [Google Scholar] [CrossRef]
- Panagou, S., La Cava, G., Fruggiero, F., & Mancusi, F. (2023, September). Selective complexity determination at cost based alternatives to re-manufacture. In IFIP International Conference on Advances in Production Management Systems (pp. 215-228). Cham: Springer Nature Switzerland.
- Leoni, L. , De Carlo, F., Sgarbossa, F., & Paltrinieri, N. (2020). Comparison of risk-based maintenance approaches applied to a natural gas regulating and metering station.
- Guide, V.D.R., Jr. Production planning and control for remanufacturing: industry practice and research needs. Journal of Operations Management 2000, 18, 467–483. [Google Scholar] [CrossRef]
- Jakowczyk, M.; Neto, J.Q.F.; Gibson, A.; Van Wassenhove, L.N. Understanding the market for remanufactured products: what can we learn from online trading and Web search sites? Int. J. Prod. Res. 2016, 55, 3465–3479. [Google Scholar] [CrossRef]
- Mallick, P.K.; Salling, K.B.; Pigosso, D.C.; McAloone, T.C. Closing the loop: Establishing reverse logistics for a circular economy, a systematic review. J. Environ. Manag. 2022, 328, 117017. [Google Scholar] [CrossRef] [PubMed]
- Dat, L.Q.; Linh, D.T.T.; Chou, S.-Y.; Yu, V.F. Optimizing reverse logistic costs for recycling end-of-life electrical and electronic products. Expert Syst. Appl. 2012, 39, 6380–6387. [Google Scholar] [CrossRef]
- Errington, M.; Childe, S.J. A business process model of inspection in remanufacturing. J. Remanufacturing 2013, 3, 7. [Google Scholar] [CrossRef]
- Lander, L.; Tagnon, C.; Nguyen-Tien, V.; Kendrick, E.; Elliott, R.J.; Abbott, A.P.; Edge, J.S.; Offer, G.J. Breaking it down: A techno-economic assessment of the impact of battery pack design on disassembly costs. Appl. Energy 2022, 331, 120437. [Google Scholar] [CrossRef]
- Smith, S.; Hsu, L.-Y.; Smith, G.C. Partial disassembly sequence planning based on cost-benefit analysis. J. Clean. Prod. 2016, 139, 729–739. [Google Scholar] [CrossRef]
- Guevara-Rivera, E., Osorno-Hinojosa, R., & Zaldívar-Carrillo, V. H. (2020, September). A simulation methodology for circular economy implementation. In 2020 10th International Conference on Advanced Computer Information Technologies (ACIT) (pp. 43-48). IEEE.
- Guevara-Rivera, E.; Osorno-Hinojosa, R.; Zaldivar-Carrillo, V.; Perez-Ortiz, H. Dynamic simulation methodology for implementing circular economy: A new case study. J. Ind. Eng. Manag. 2021, 14, 850–862. [Google Scholar] [CrossRef]
- Charnley, F.; Tiwari, D.; Hutabarat, W.; Moreno, M.; Okorie, O.; Tiwari, A. Simulation to Enable a Data-Driven Circular Economy. Sustainability 2019, 11, 3379. [Google Scholar] [CrossRef]
- Goodall, P.; Sharpe, R.; West, A. A data-driven simulation to support remanufacturing operations. Comput. Ind. 2018, 105, 48–60. [Google Scholar] [CrossRef]
- Okorie, O.; Charnley, F.; Ehiagwina, A.; Tiwari, D.; Salonitis, K. Towards a simulation-based understanding of smart remanufacturing operations: a comparative analysis. J. Remanufacturing 2020, 14, 45–68. [Google Scholar] [CrossRef]
- He, P. Optimization and Simulation of Remanufacturing Production Scheduling under Uncertainties. Int. J. Simul. Model. 2018, 17, 734–743. [Google Scholar] [CrossRef]
- Li, J.; González, M.; Zhu, Y. A hybrid simulation optimization method for production planning of dedicated remanufacturing. Int. J. Prod. Econ. 2009, 117, 286–301. [Google Scholar] [CrossRef]
- Zhang, R.; Ong, S.; Nee, A. A simulation-based genetic algorithm approach for remanufacturing process planning and scheduling. Appl. Soft Comput. 2015, 37, 521–532. [Google Scholar] [CrossRef]
- Huster, S.; Glöser-Chahoud, S.; Rosenberg, S.; Schultmann, F. A simulation model for assessing the potential of remanufacturing electric vehicle batteries as spare parts. J. Clean. Prod. 2022, 363, 132225. [Google Scholar] [CrossRef]
- Li, X.; Mu, D.; Du, J.; Cao, J.; Zhao, F. Game-based system dynamics simulation of deposit-refund scheme for electric vehicle battery recycling in China. Resour. Conserv. Recycl. 2020, 157, 104788. [Google Scholar] [CrossRef]
- Lieder, M.; Asif, F.M.A.; Rashid, A. Towards Circular Economy implementation: an agent-based simulation approach for business model changes. Auton. Agents Multi-Agent Syst. 2017, 31, 1377–1402. [Google Scholar] [CrossRef]
- https://cordis.europa.eu/project/id/101003893.
- https://circulareconomy.europa.eu/platform/en/good-practices/iobac-adhesive-free-flooring-tiles-which-can-be-readily-reused-and-recycled.
- https://circulareconomy.europa.eu/platform/en/good-practices/circular-flooring-partnership-tarkett-ikea.
- Parvaresh, F.; Amini, M.H. Application of circular economy for sustainable waste management in the carpet industry. International Journal of Research in Industrial Engineering 2024, 13, 188–206. [Google Scholar]
- Wiesinger, H., Bleuler, C., Christen, V., Favreau, P., Hellweg, S., Langer, M., ... & Wang, Z. (2023). Legacy and Emerging Plasticizers and Stabilizers in PVC Floorings: Impacts of an Industrial Transition and Recycling.
Figure 1.
AS-IS simulation model.
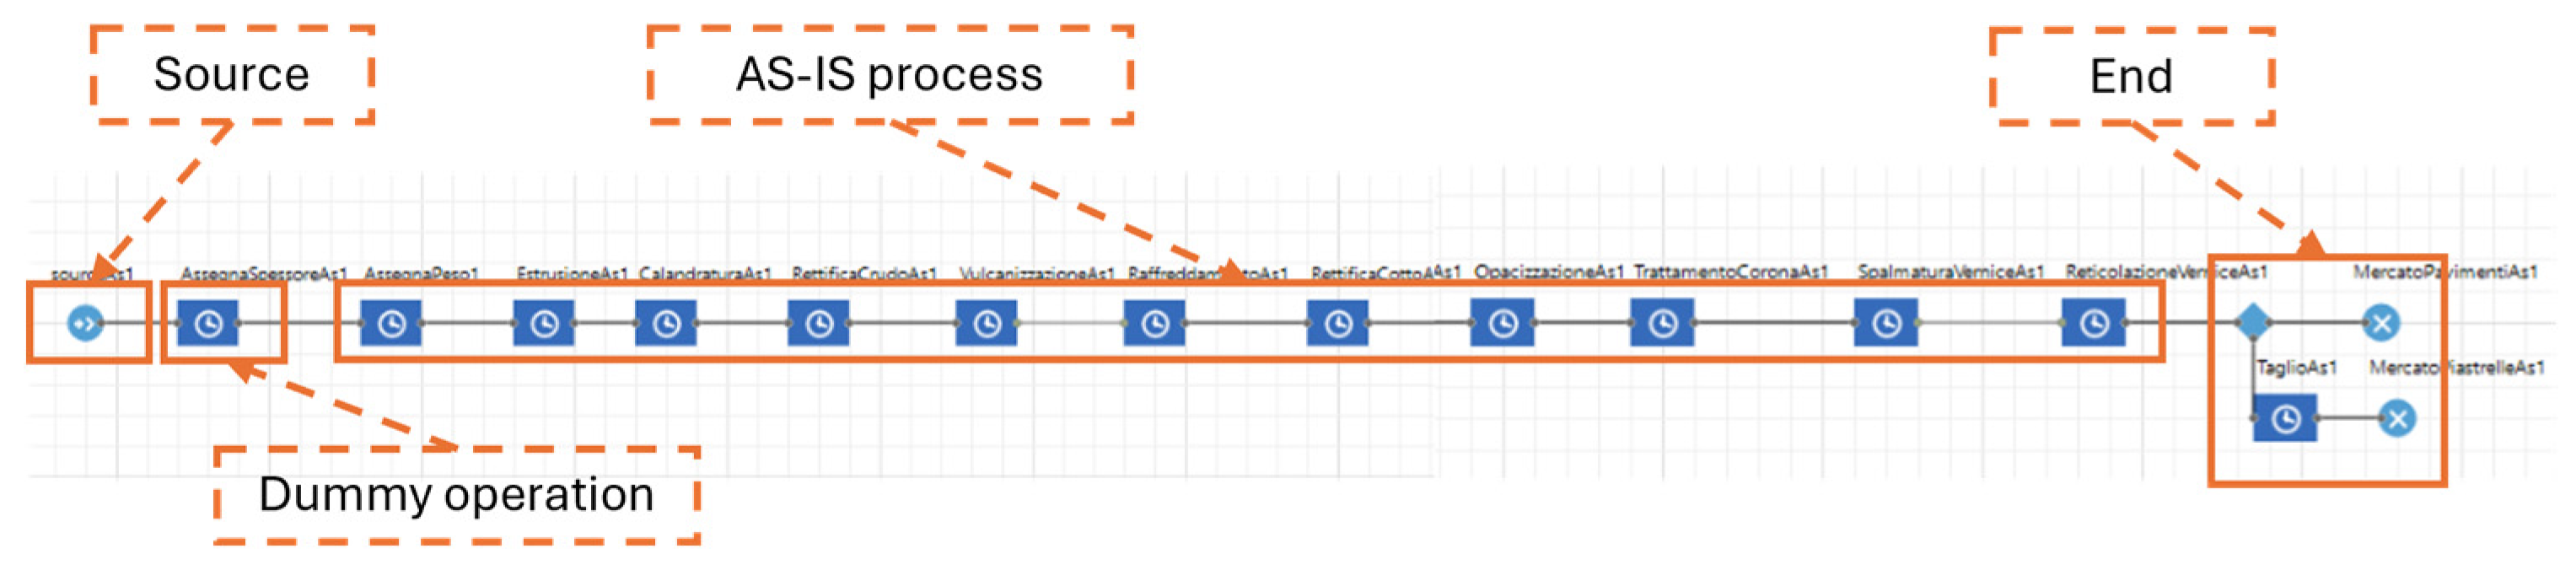
Figure 2.
To-Be 1 – operational flows (blue blocks) and logistic flows (green blocks).
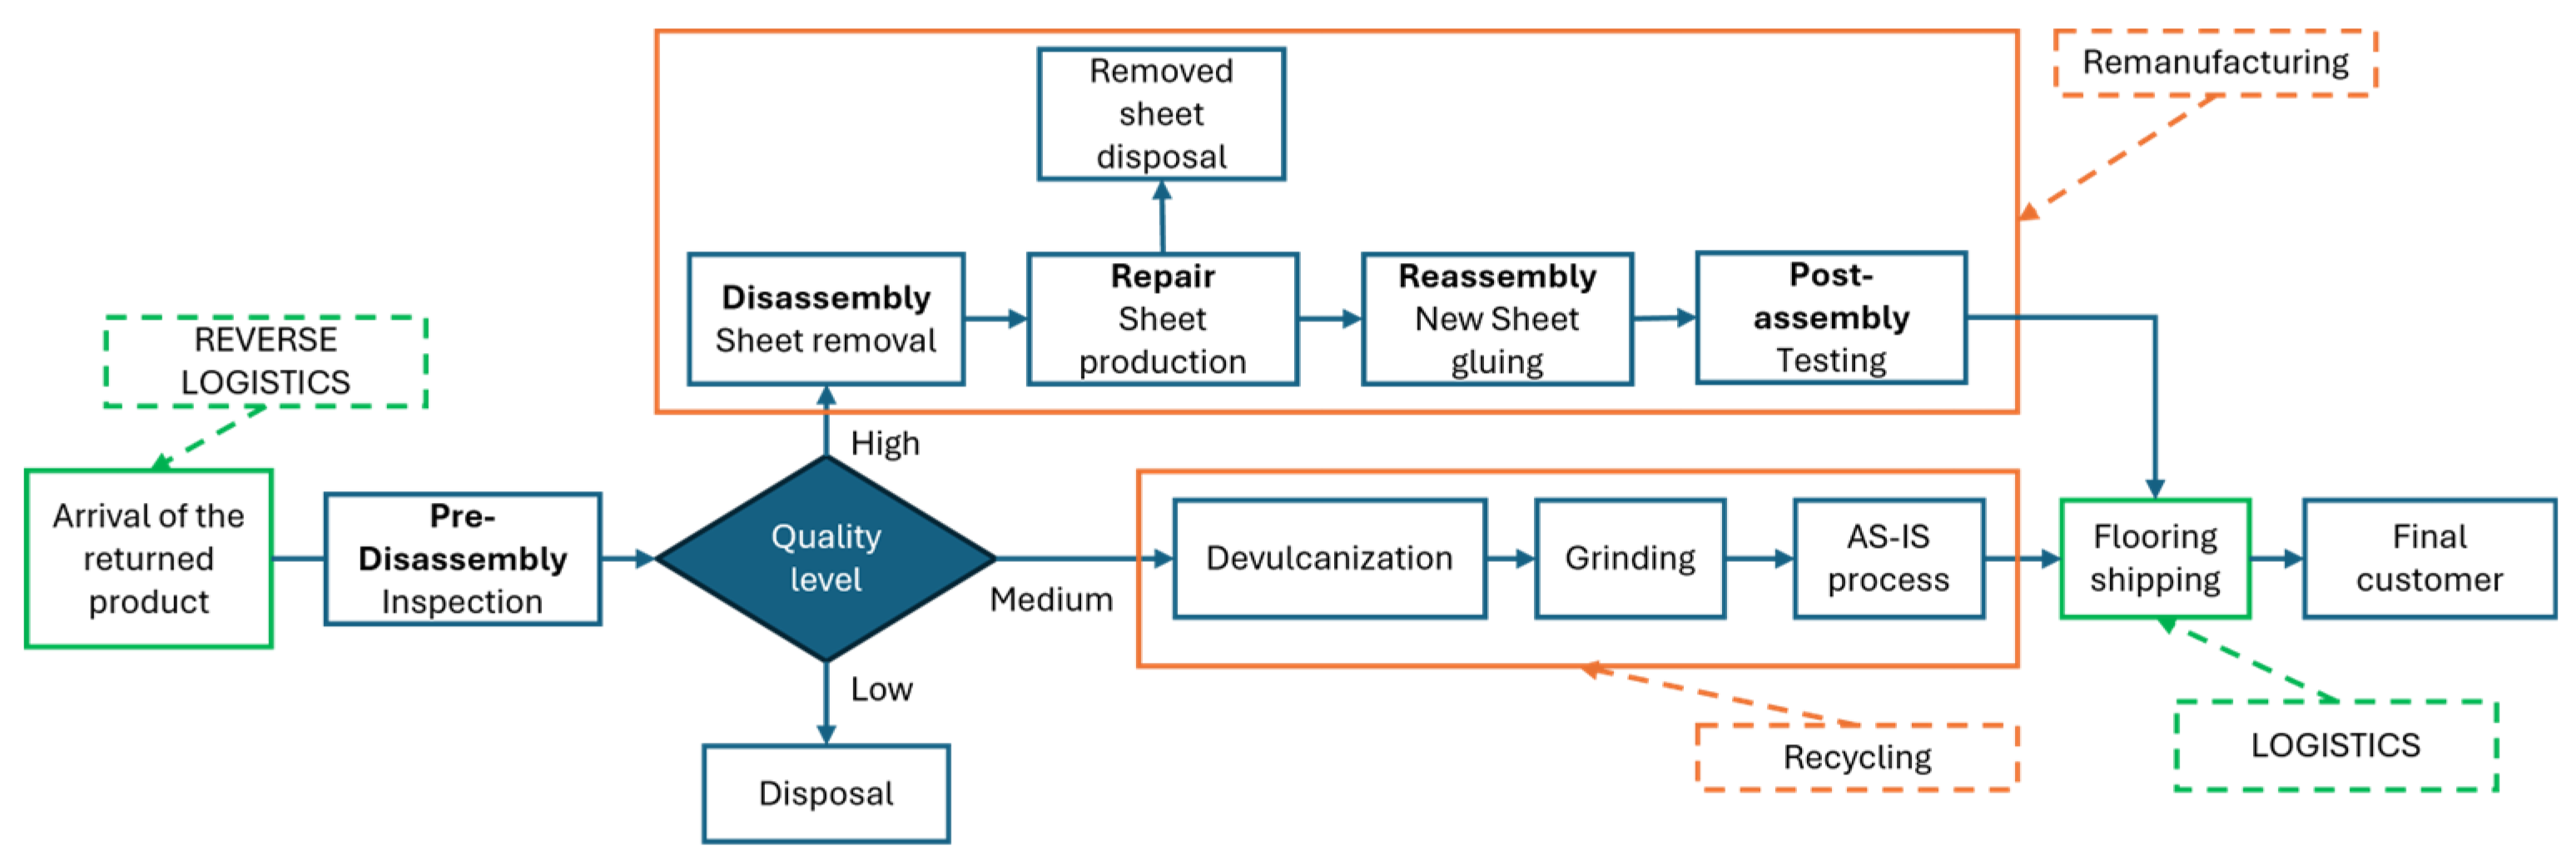
Figure 3.
‘To-Be’ 1 simulation model.
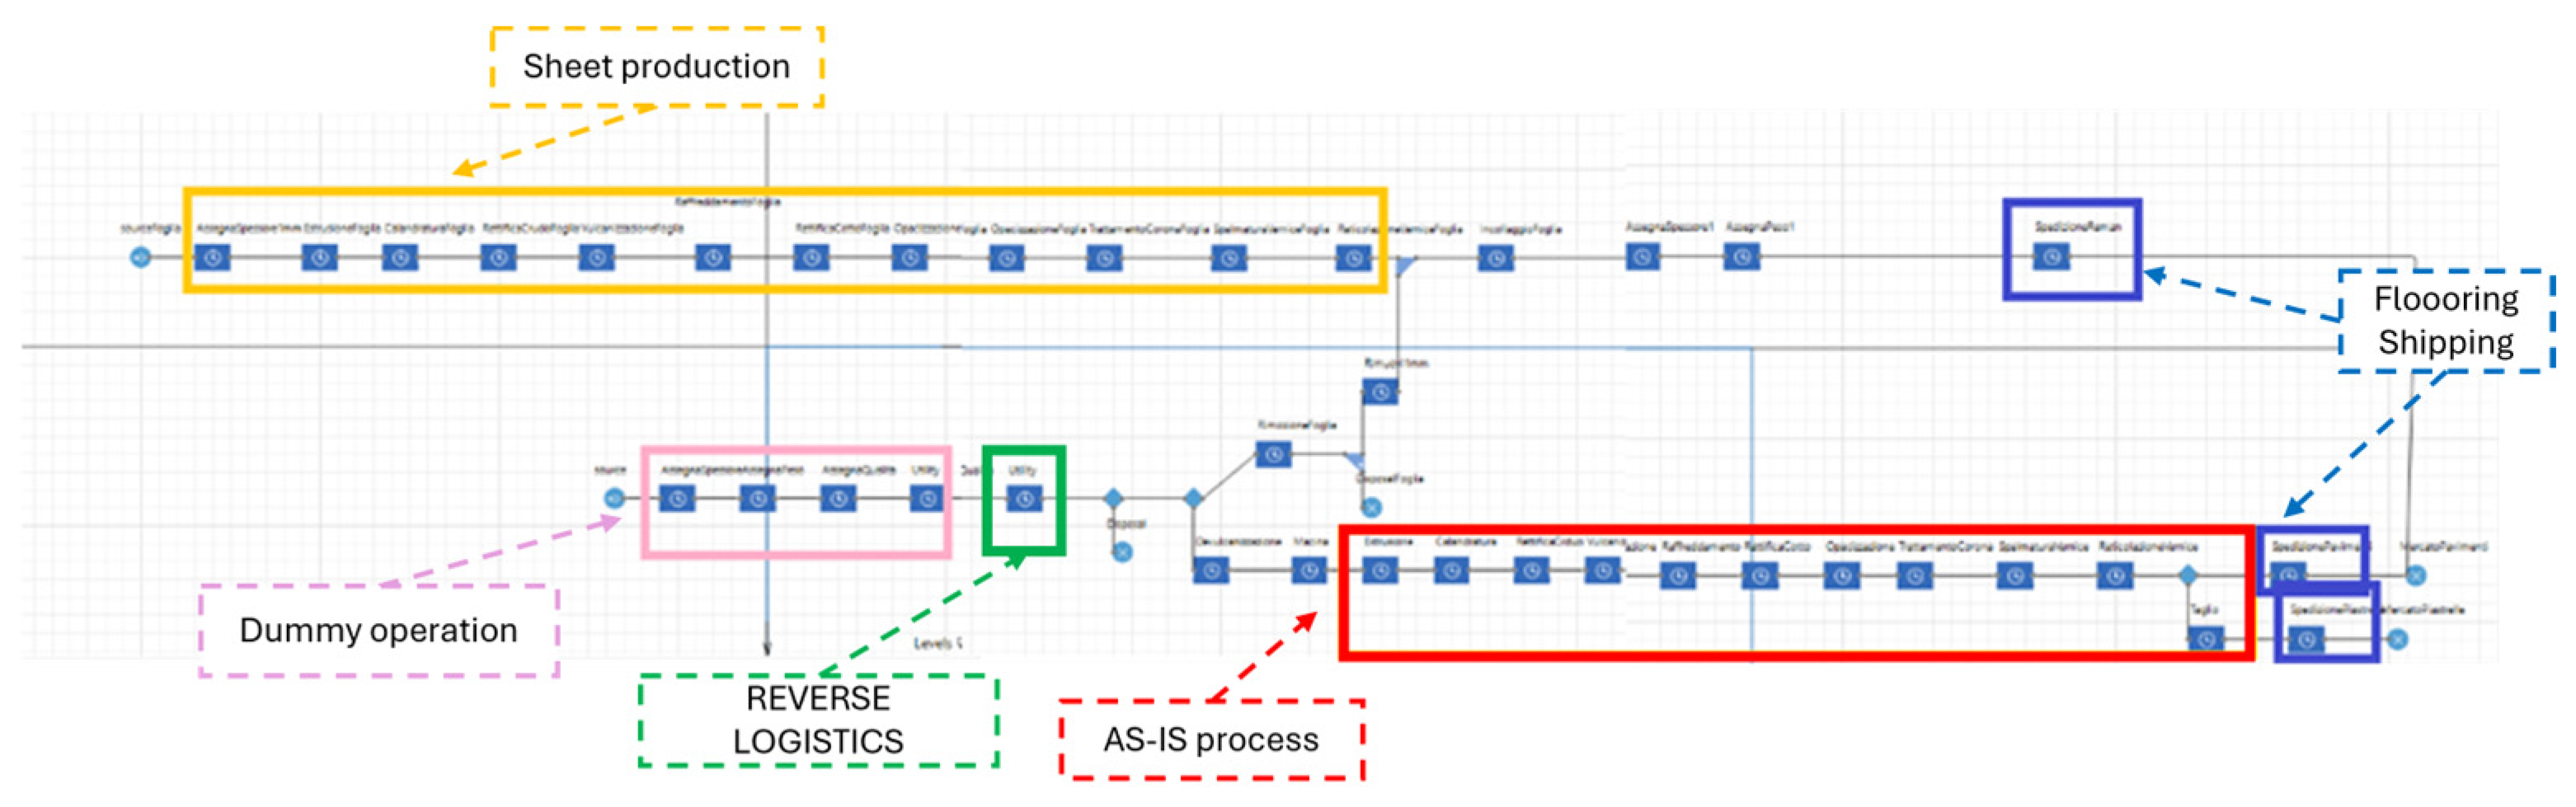
Figure 4.
To-Be 1 – operational flows (blue blocks) and logistic flows (green blocks).
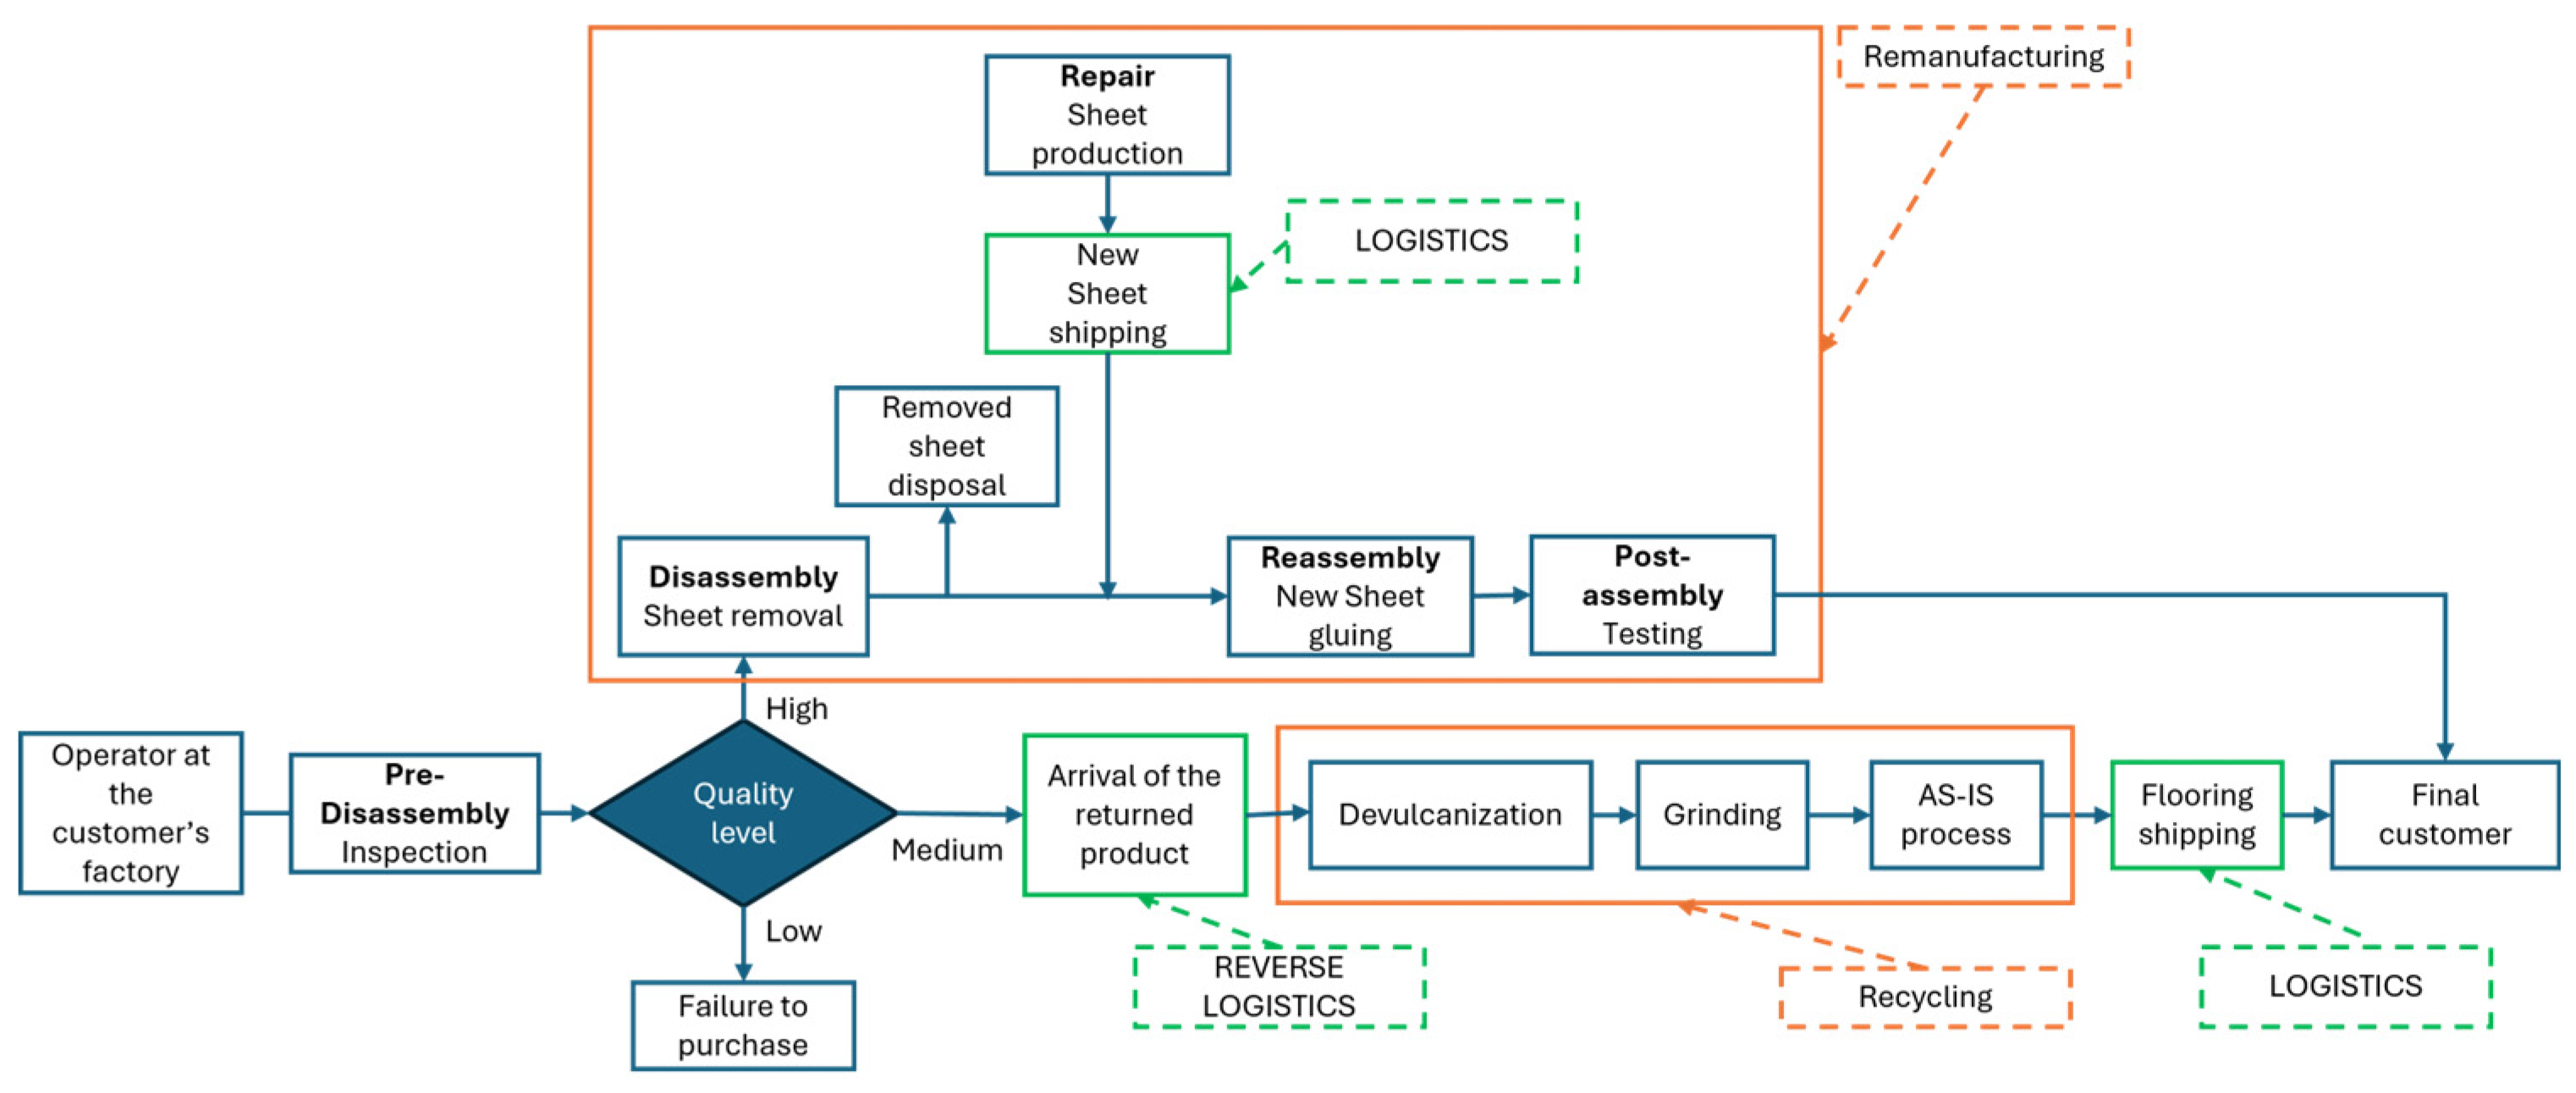
Figure 5.
To-Be 1 – operational flows (blue blocks) and logistic flows (green blocks).
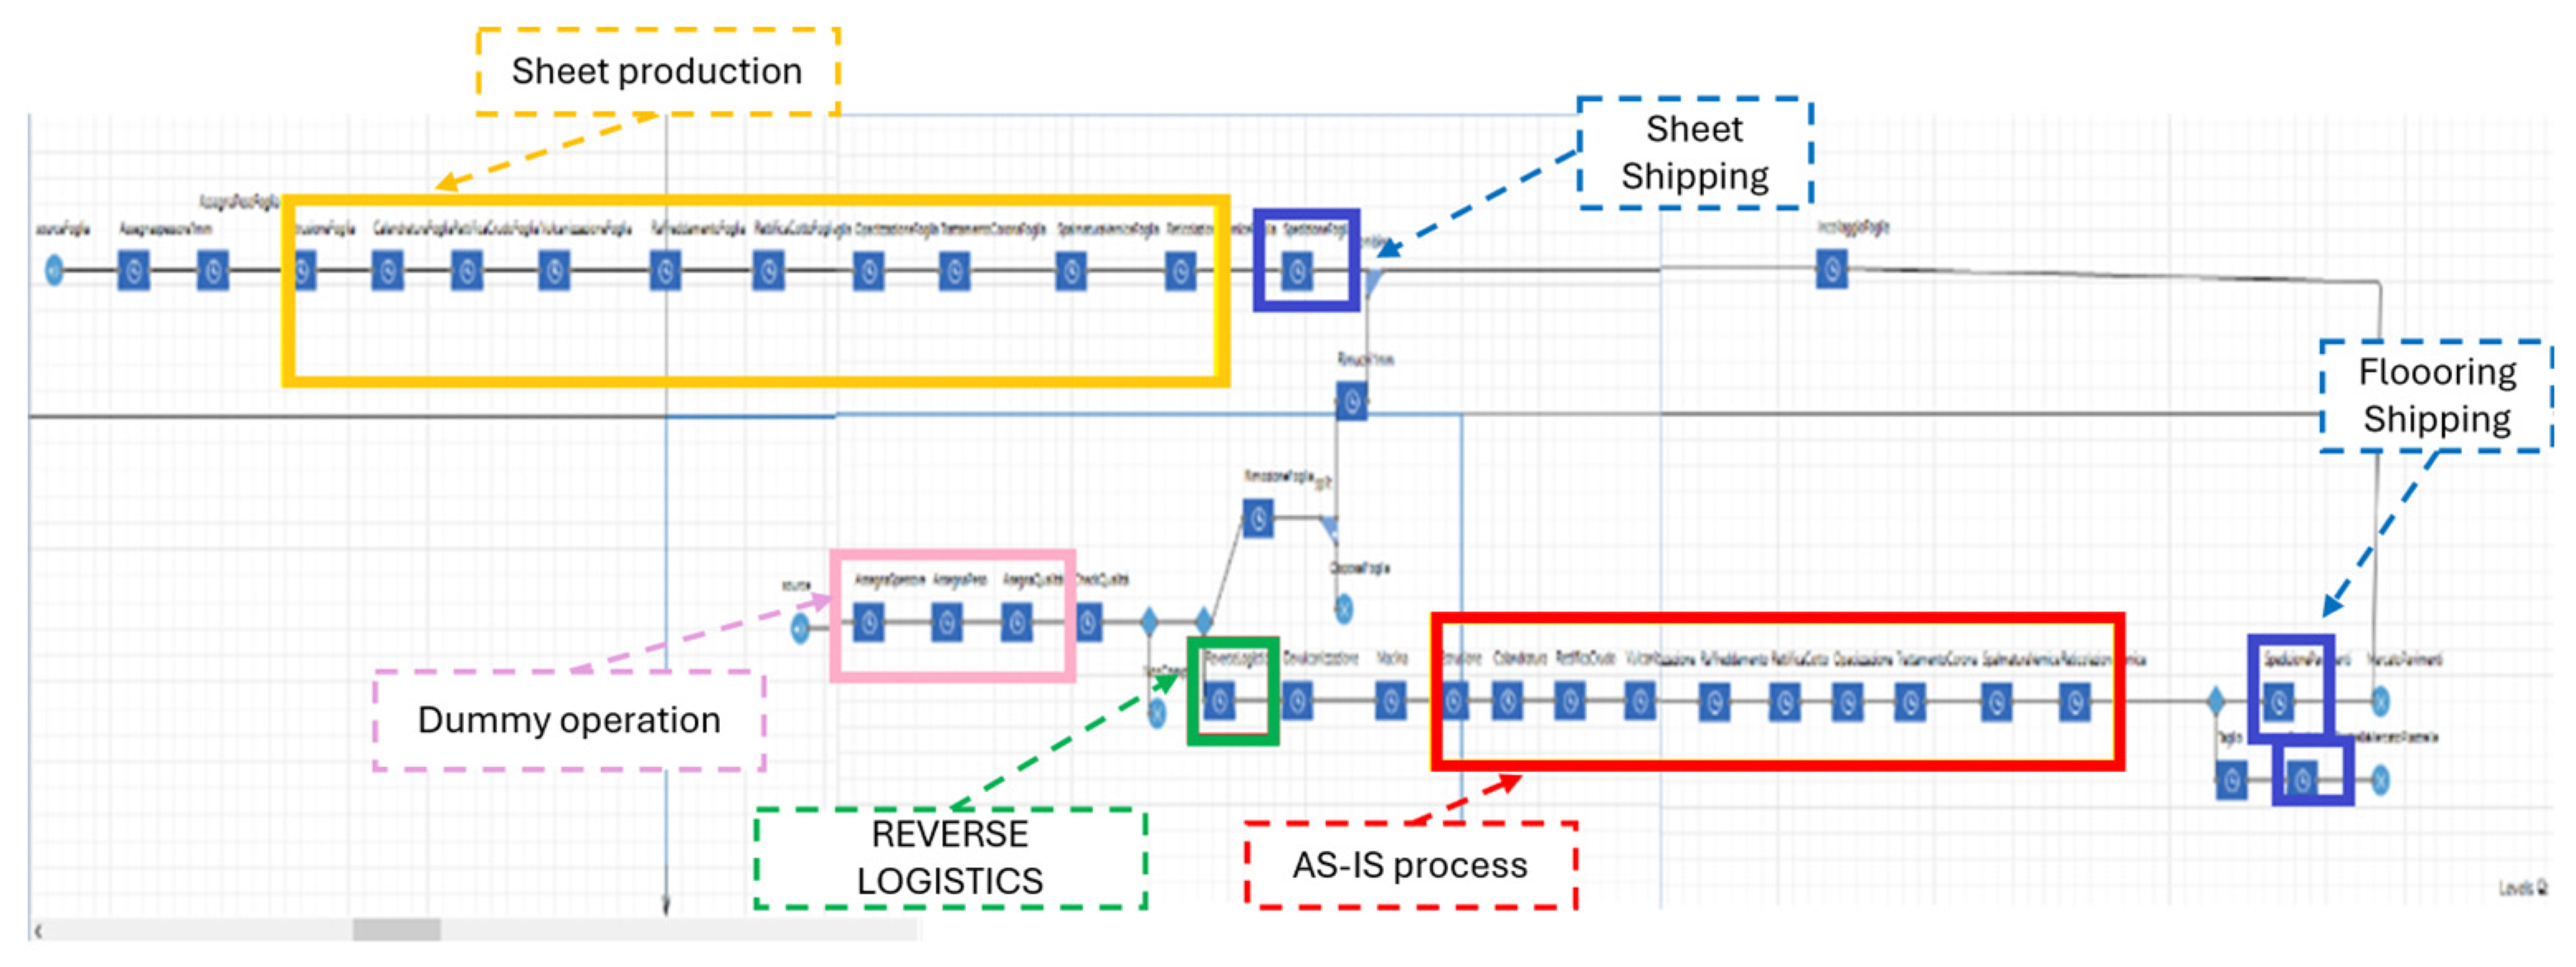
Figure 6.
Impact of thickness on performance and strategy.
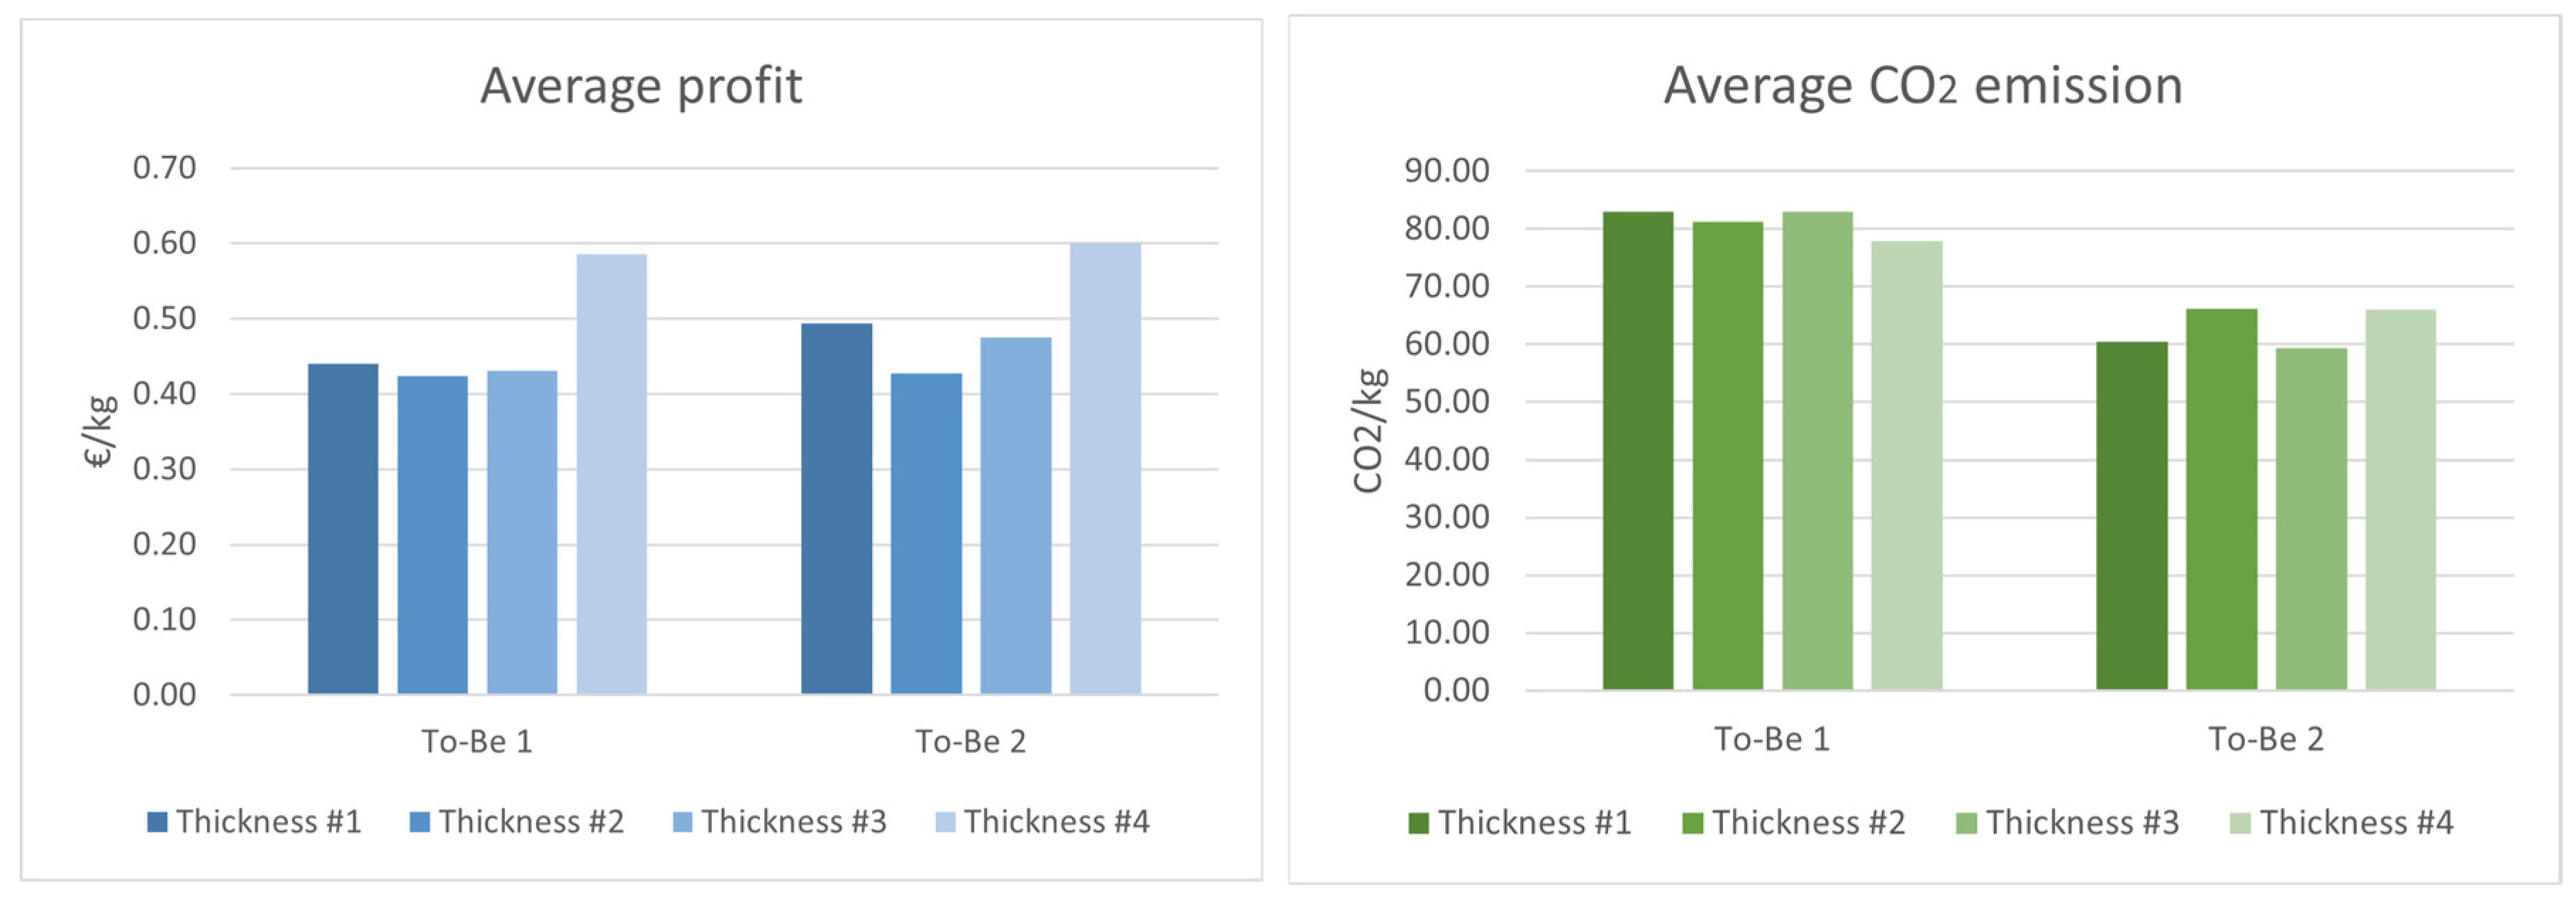
Figure 7.
Impact of distance on performance and strategy.
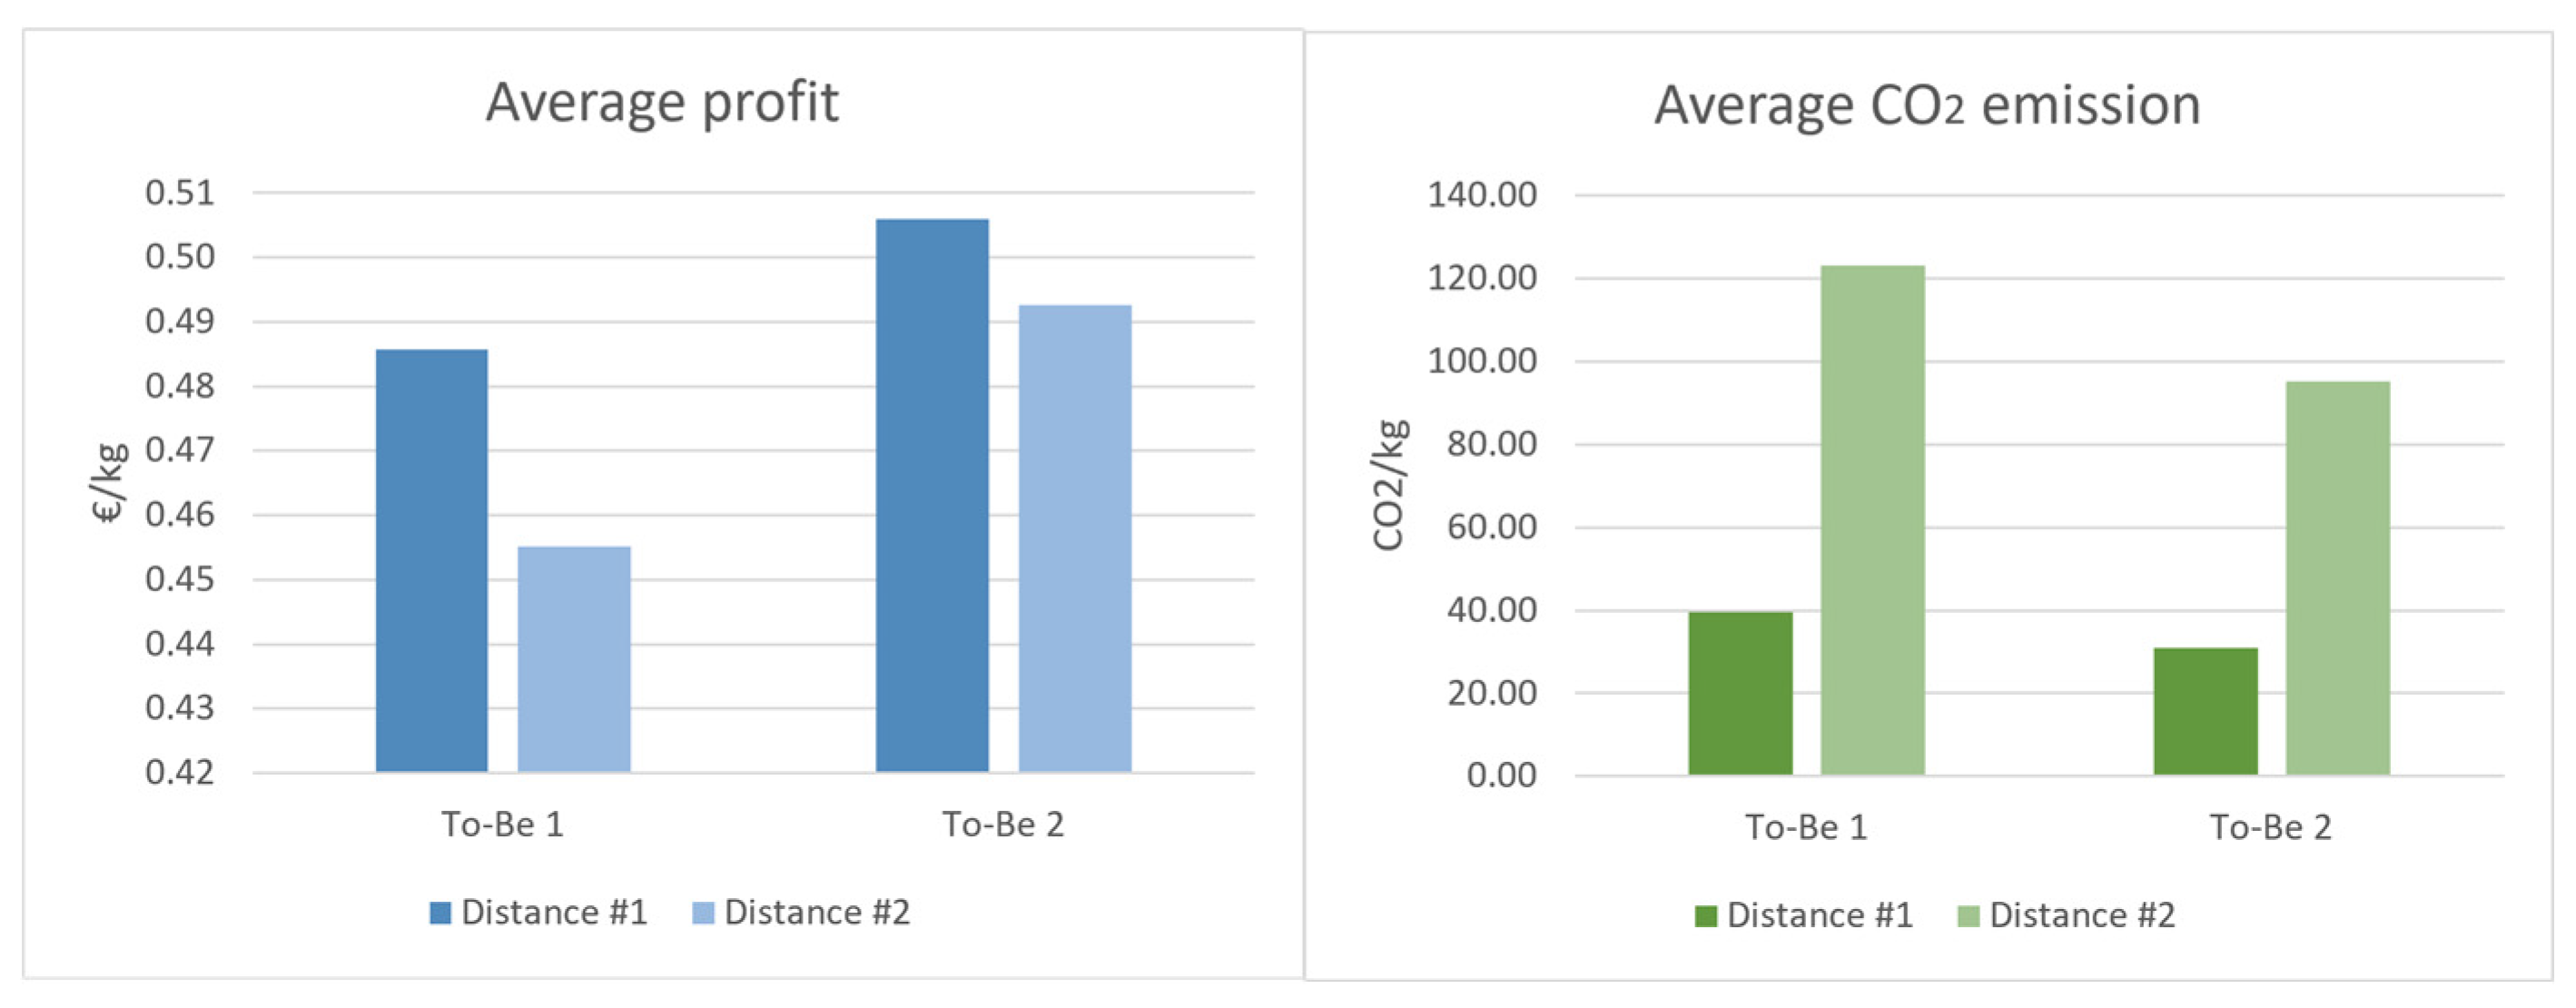
Figure 8.
Impact of quality on performance and strategy.
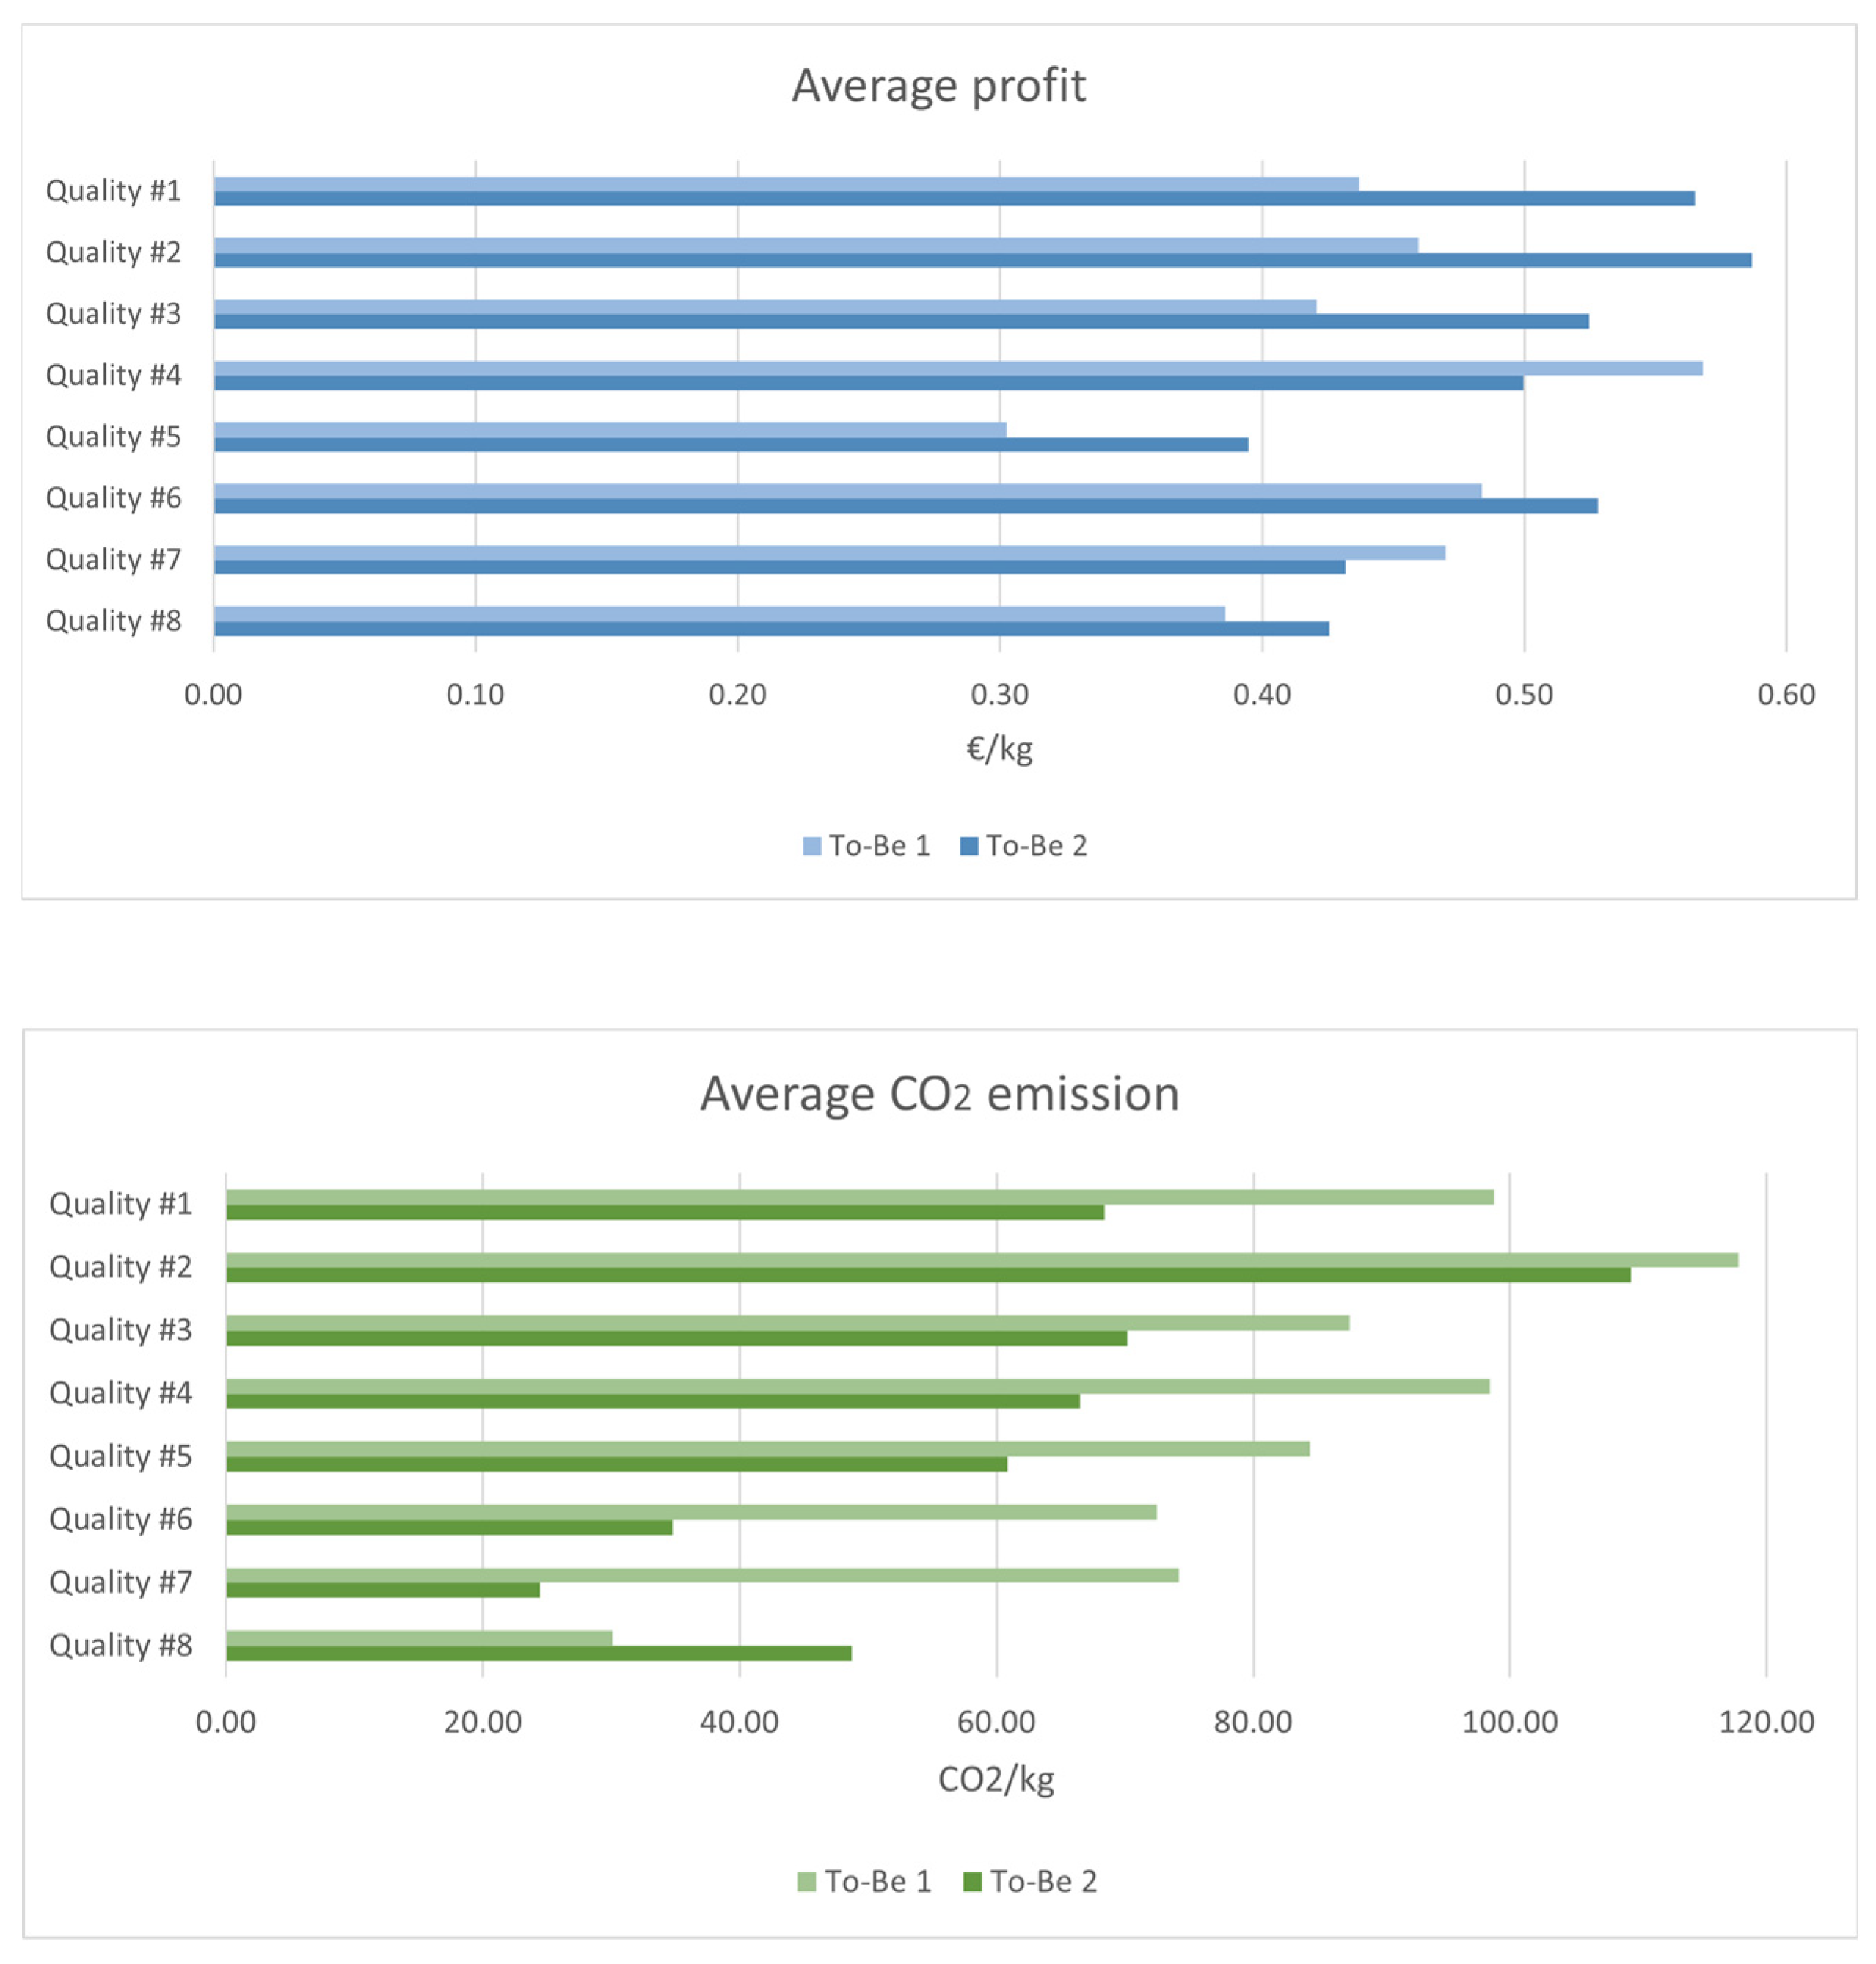
Figure 9.
Impact of remanufacturing process on performance and strategy.
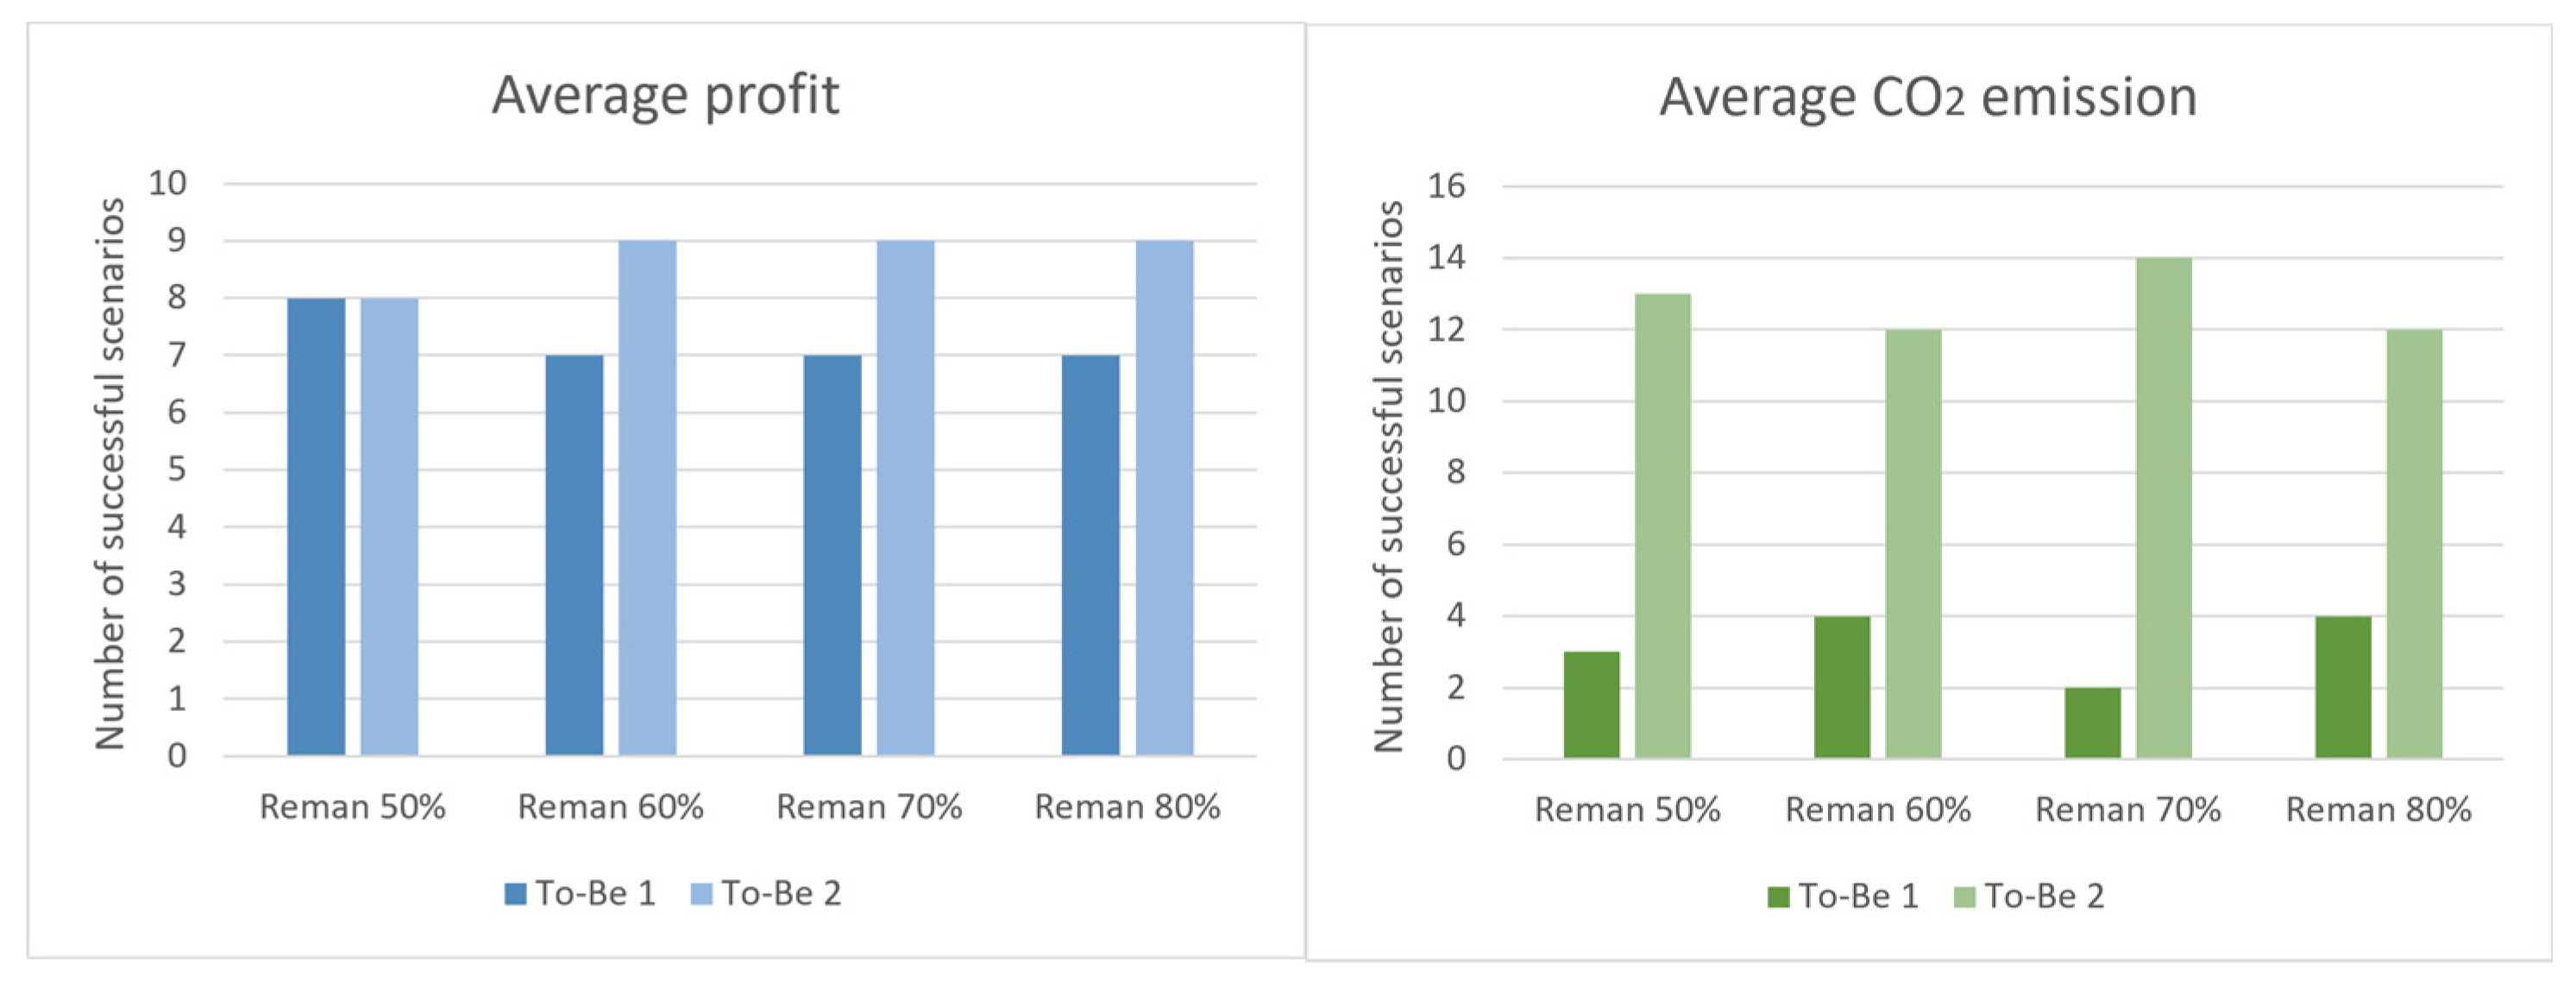

Table 1.
Distance scenarios.
| Scenario | Distance [km] |
|---|---|
| Scenario 1 | 300 |
| Scenario 2 | 1000 |
Table 2.
Quality scenarios.
| Scenario | High quality [%] | Medium quality [%] | Low quality [%] |
|---|---|---|---|
| Scenario 1 | 50% | 30% | 20% |
| Scenario 2 | 50% | 40% | 10% |
| Scenario 3 | 60% | 20% | 20% |
| Scenario 4 | 60% | 30% | 10% |
| Scenario 5 | 70% | 20% | 10% |
| Scenario 6 | 70% | 10% | 20% |
| Scenario 7 | 80% | 10% | 10% |
| Scenario 8 | 80% | 15% | 5% |
Table 3.
Thickness scenarios.
| Scenario | Low Thickness [%] | Medium Thickness [%] | High Thickness [%] |
|---|---|---|---|
| Scenario 1 | 33,3% | 33,3% | 33,3% |
| Scenario 2 | 60% | 20% | 20% |
| Scenario 3 | 20% | 60% | 20% |
| Scenario 4 | 20% | 20% | 60% |
Disclaimer/Publisher’s Note: The statements, opinions and data contained in all publications are solely those of the individual author(s) and contributor(s) and not of MDPI and/or the editor(s). MDPI and/or the editor(s) disclaim responsibility for any injury to people or property resulting from any ideas, methods, instructions or products referred to in the content. |
© 2025 by the authors. Licensee MDPI, Basel, Switzerland. This article is an open access article distributed under the terms and conditions of the Creative Commons Attribution (CC BY) license (http://creativecommons.org/licenses/by/4.0/).
Copyright: This open access article is published under a Creative Commons CC BY 4.0 license, which permit the free download, distribution, and reuse, provided that the author and preprint are cited in any reuse.


