
Submitted:
05 March 2025
Posted:
06 March 2025
You are already at the latest version
Abstract
This study examines the cultural dimensions of Romania and Tunisia using Hofstede’s 6D model, analyzing their impact on organizational behavior and decision-making in multinational corporations (MNCs). Through qualitative research, surveys were conducted among 10 employees from a Tunisian health insurance company and a Romanian recruitment company. The findings reveal high power distance in both countries, with Romania being more hierarchical. Both societies demonstrate collectivist tendencies, though Romania exhibits moderate individualism. Uncertainty avoidance is strong in both contexts, affecting flexibility in business operations. Masculinity and indulgence scores indicate a balance between competition and quality of life. These insights contribute to cross-cultural management practices and international business strategies.
Keywords:
Cultural Dimensions
; Hofstede’s 6D Model
; Empirical Research
; Cross-Cultural Management
; Workplace Culture
; Organizational Behavior
1. Introduction
Background and Context
Cultural dimensions significantly influence business environments, shaping decision-making, leadership styles, and employee interactions. Hofstede’s 6D model provides a structured framework for analyzing cultural differences in national and organizational contexts. Romania and Tunisia, although from different regions, share historical ties and economic collaborations. However, their cultural dimensions remain underexplored in relation to multinational corporations (MNCs).
Research Problem and Questions
This research seeks to address:
- How do cultural dimensions in Romania and Tunisia impact workplace behavior?
- What are the key similarities and differences in organizational structures between the two nations?
- How can MNCs adapt their management practices to these cultural differences?
Objectives and Hypothesis:
- Objective 1: To compare Hofstede’s 6D scores between Romania and Tunisia.
- Objective 2: To analyze the impact of these dimensions on employee behavior in MNCs.
- Hypothesis: Romania and Tunisia exhibit similar hierarchical structures but differ in individualism and long-term orientation.
2. Methodology
- a)
- Research Design
This study employs a qualitative research approach, using surveys to collect employee perspectives on Hofstede’s 6D model.
- b)
- Sample/Participants
-
10 employees from two MNCs:
- ➢
- Tunisian health insurance company
- ➢
- Romanian recruitment company
- Participants were selected based on organizational role and industry representation
- c)
- Data Collection Methods
- Google Forms surveys with structured Likert-scale questions (Strongly Disagree to Strongly Agree).
- Questions aligned with each of Hofstede’s six dimensions.
- d)
- Instruments
- Survey responses were analyzed using STATA software for statistical interpretation.
- e)
- Data Analysis
- Responses were converted into numeric scores for direct comparison.
- Averages were calculated per dimension, ensuring data validity.
- f)
- Ethical Considerations
- Participants were informed about anonymity and the research purpose.
- No sensitive or personal data were collected.
3. Results
This section presents the empirical findings of the study, comparing Romania and Tunisia based on Hofstede’s 6D model. The results are structured as follows:
3.1. Descriptive Statistics of Participants
To provide background on the survey respondents, the following figures illustrate gender distribution, age groups, and length of service in the participating MNCs in Romania and Tunisia.
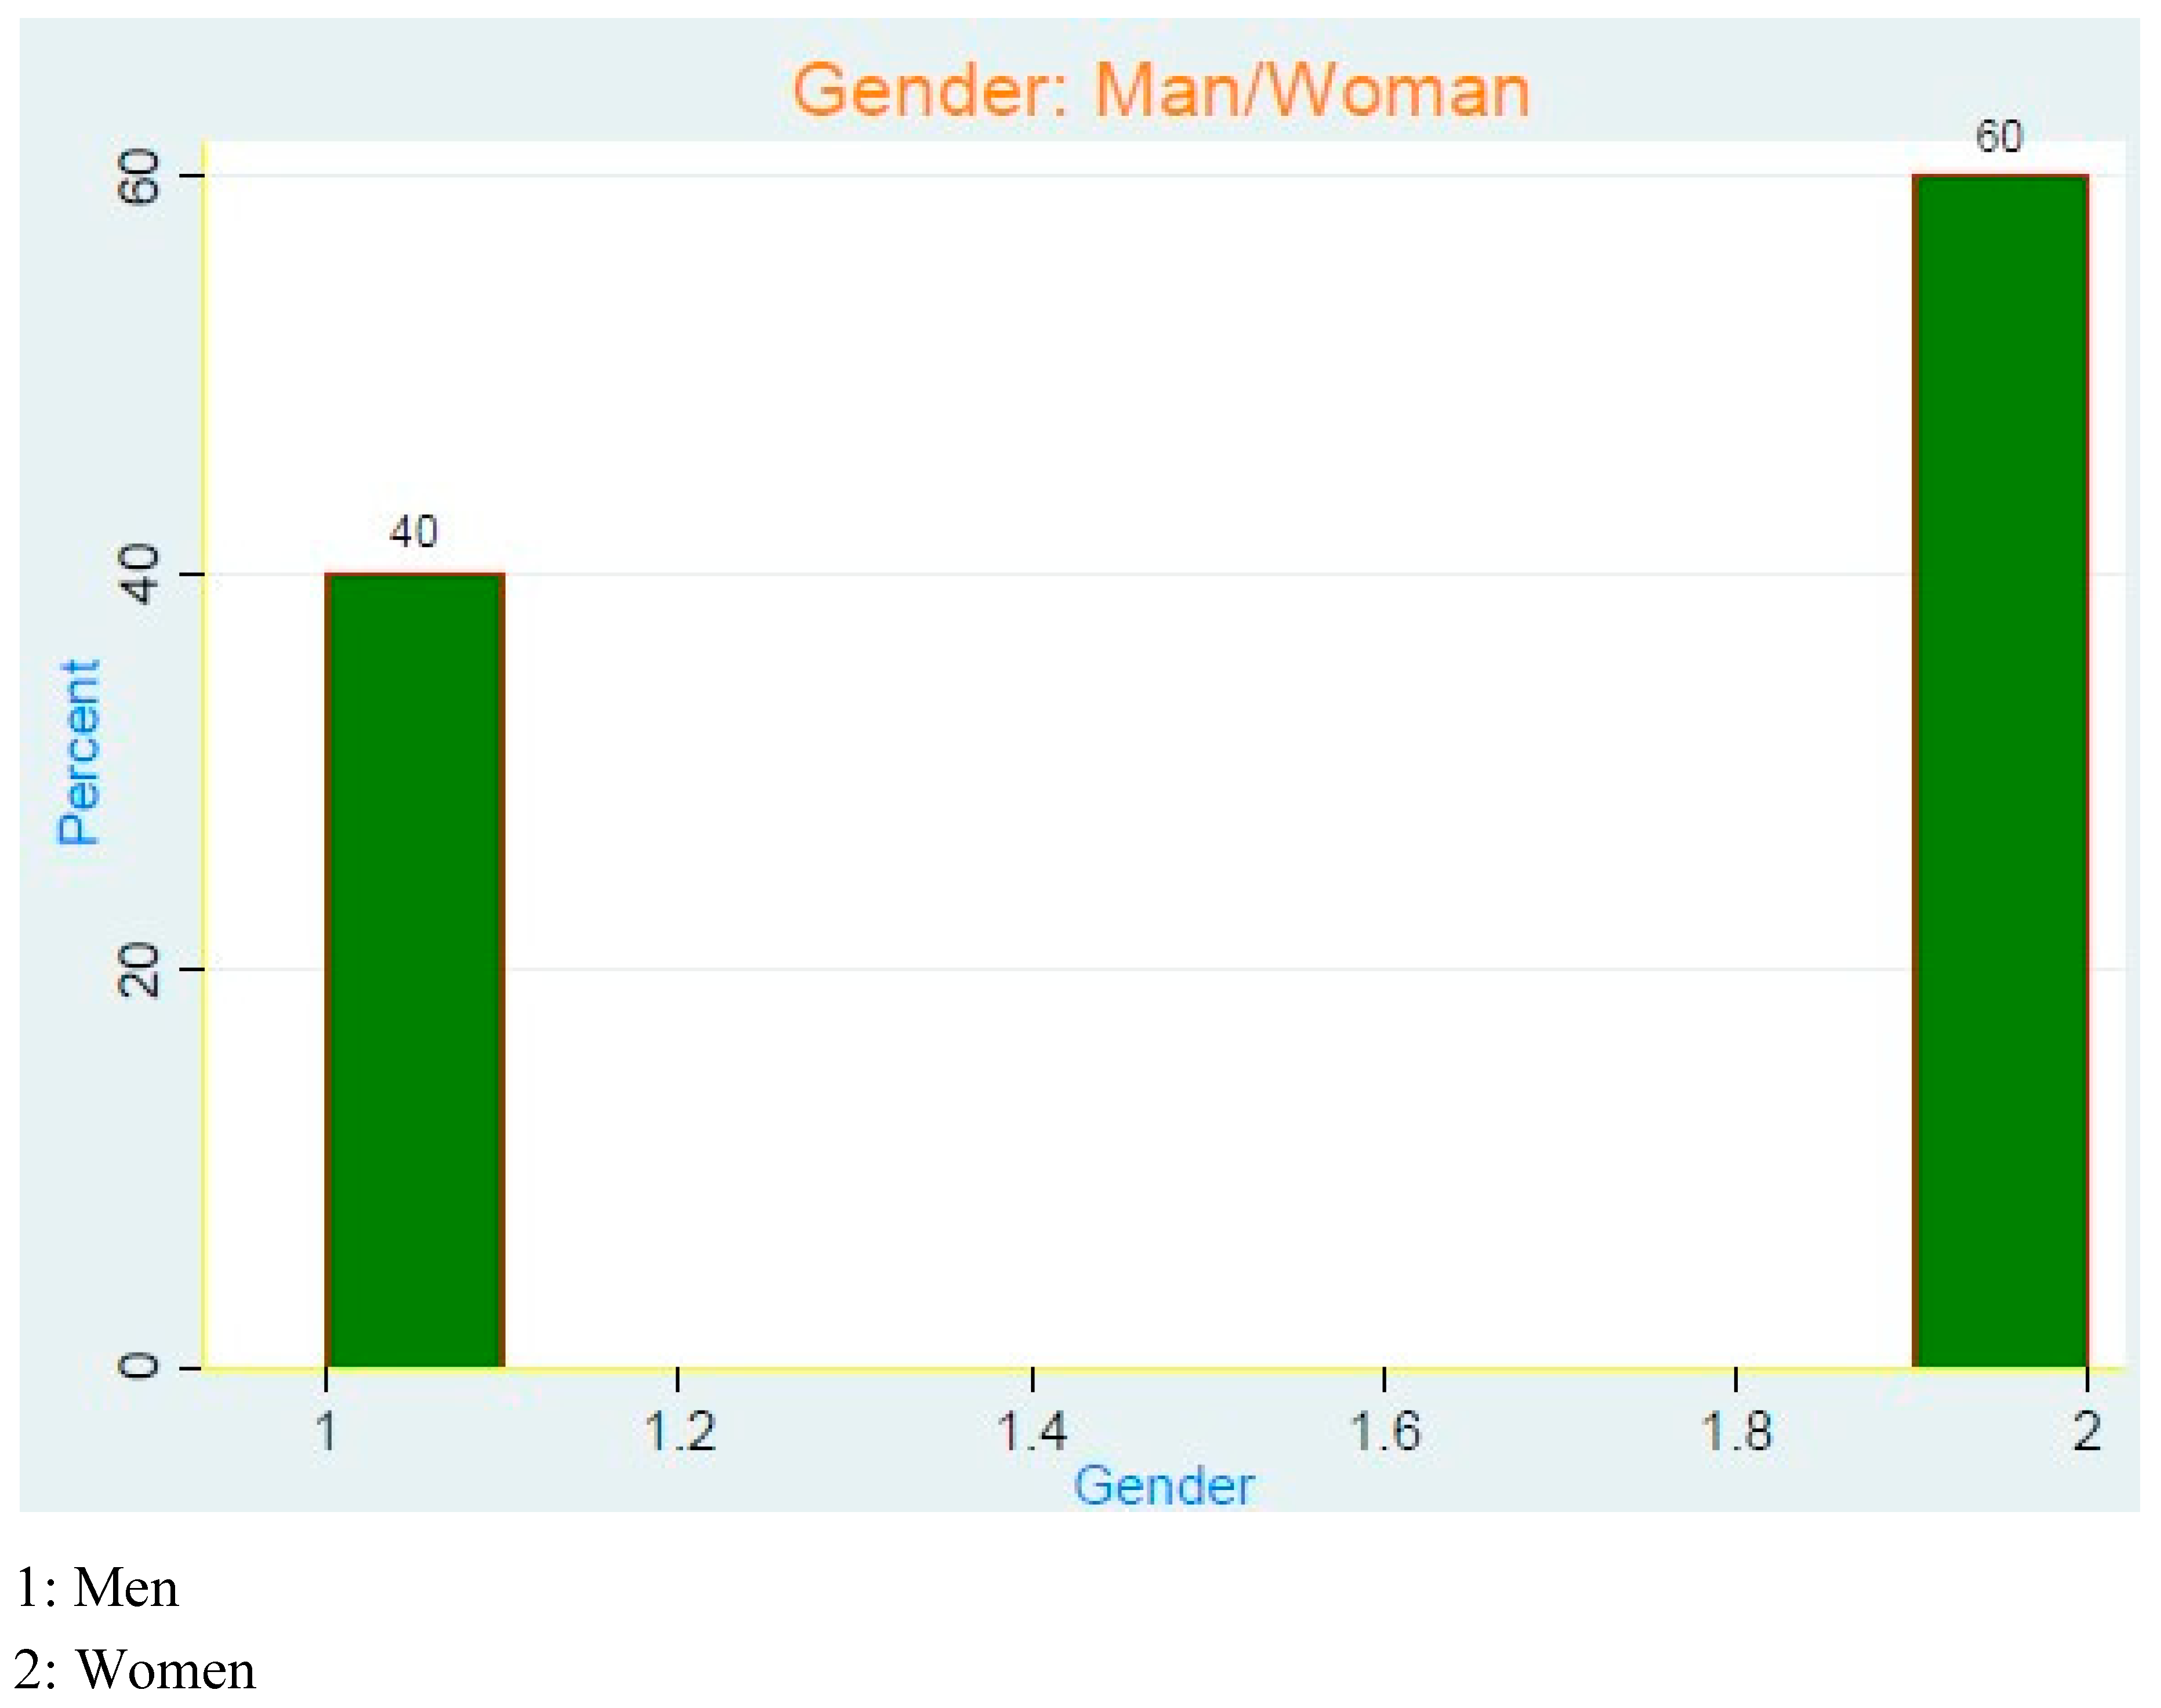
Gender Distribution of Participants:
Figure 1.
Gender Breakdown of Participants in Romanian and Tunisian MNCs. This bar chart represents the gender distribution in both MNCs. The data shows a slightly higher number of female employees in both countries (60% women, 40% men).
Figure 1.
Gender Breakdown of Participants in Romanian and Tunisian MNCs. This bar chart represents the gender distribution in both MNCs. The data shows a slightly higher number of female employees in both countries (60% women, 40% men).
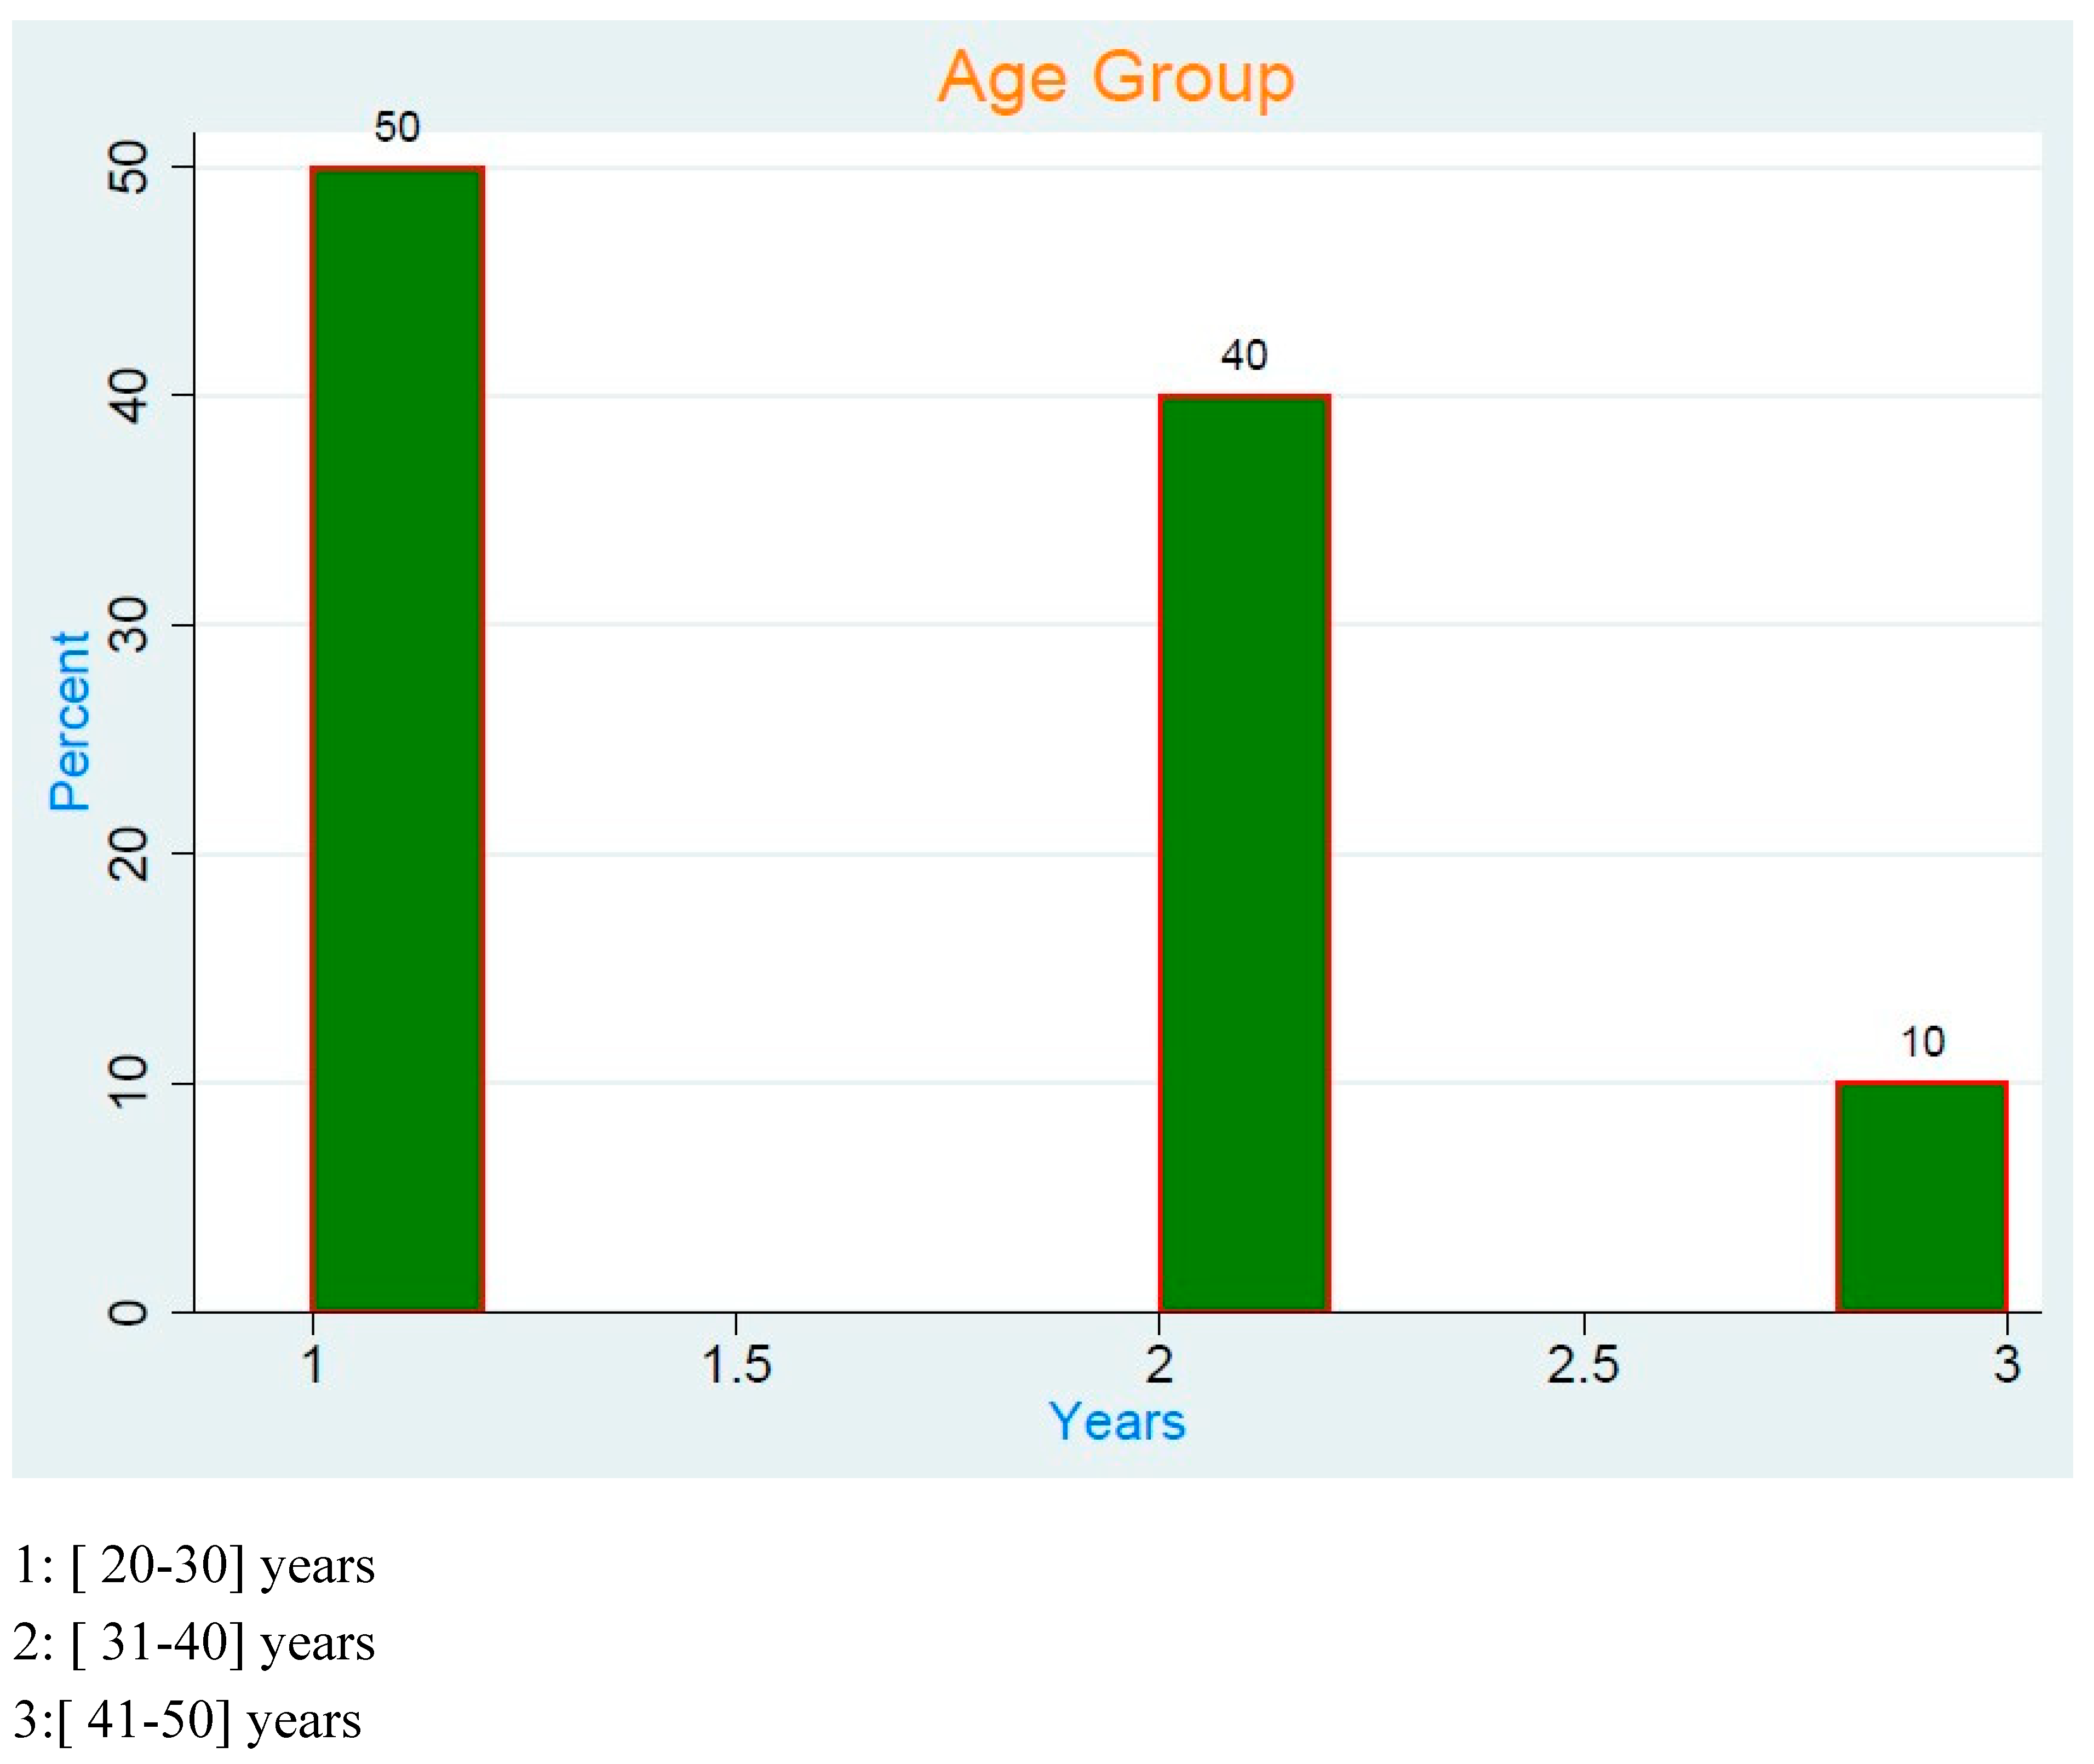
Age Distribution of Participants:
Figure 2.
Age Groups of Survey Participants. The majority of employees in both MNCs are young, with 60% of Romanian participants below 30 years old and 90% of Tunisian participants aged between 20 and 40 years based on the below bar chart.
Figure 2.
Age Groups of Survey Participants. The majority of employees in both MNCs are young, with 60% of Romanian participants below 30 years old and 90% of Tunisian participants aged between 20 and 40 years based on the below bar chart.
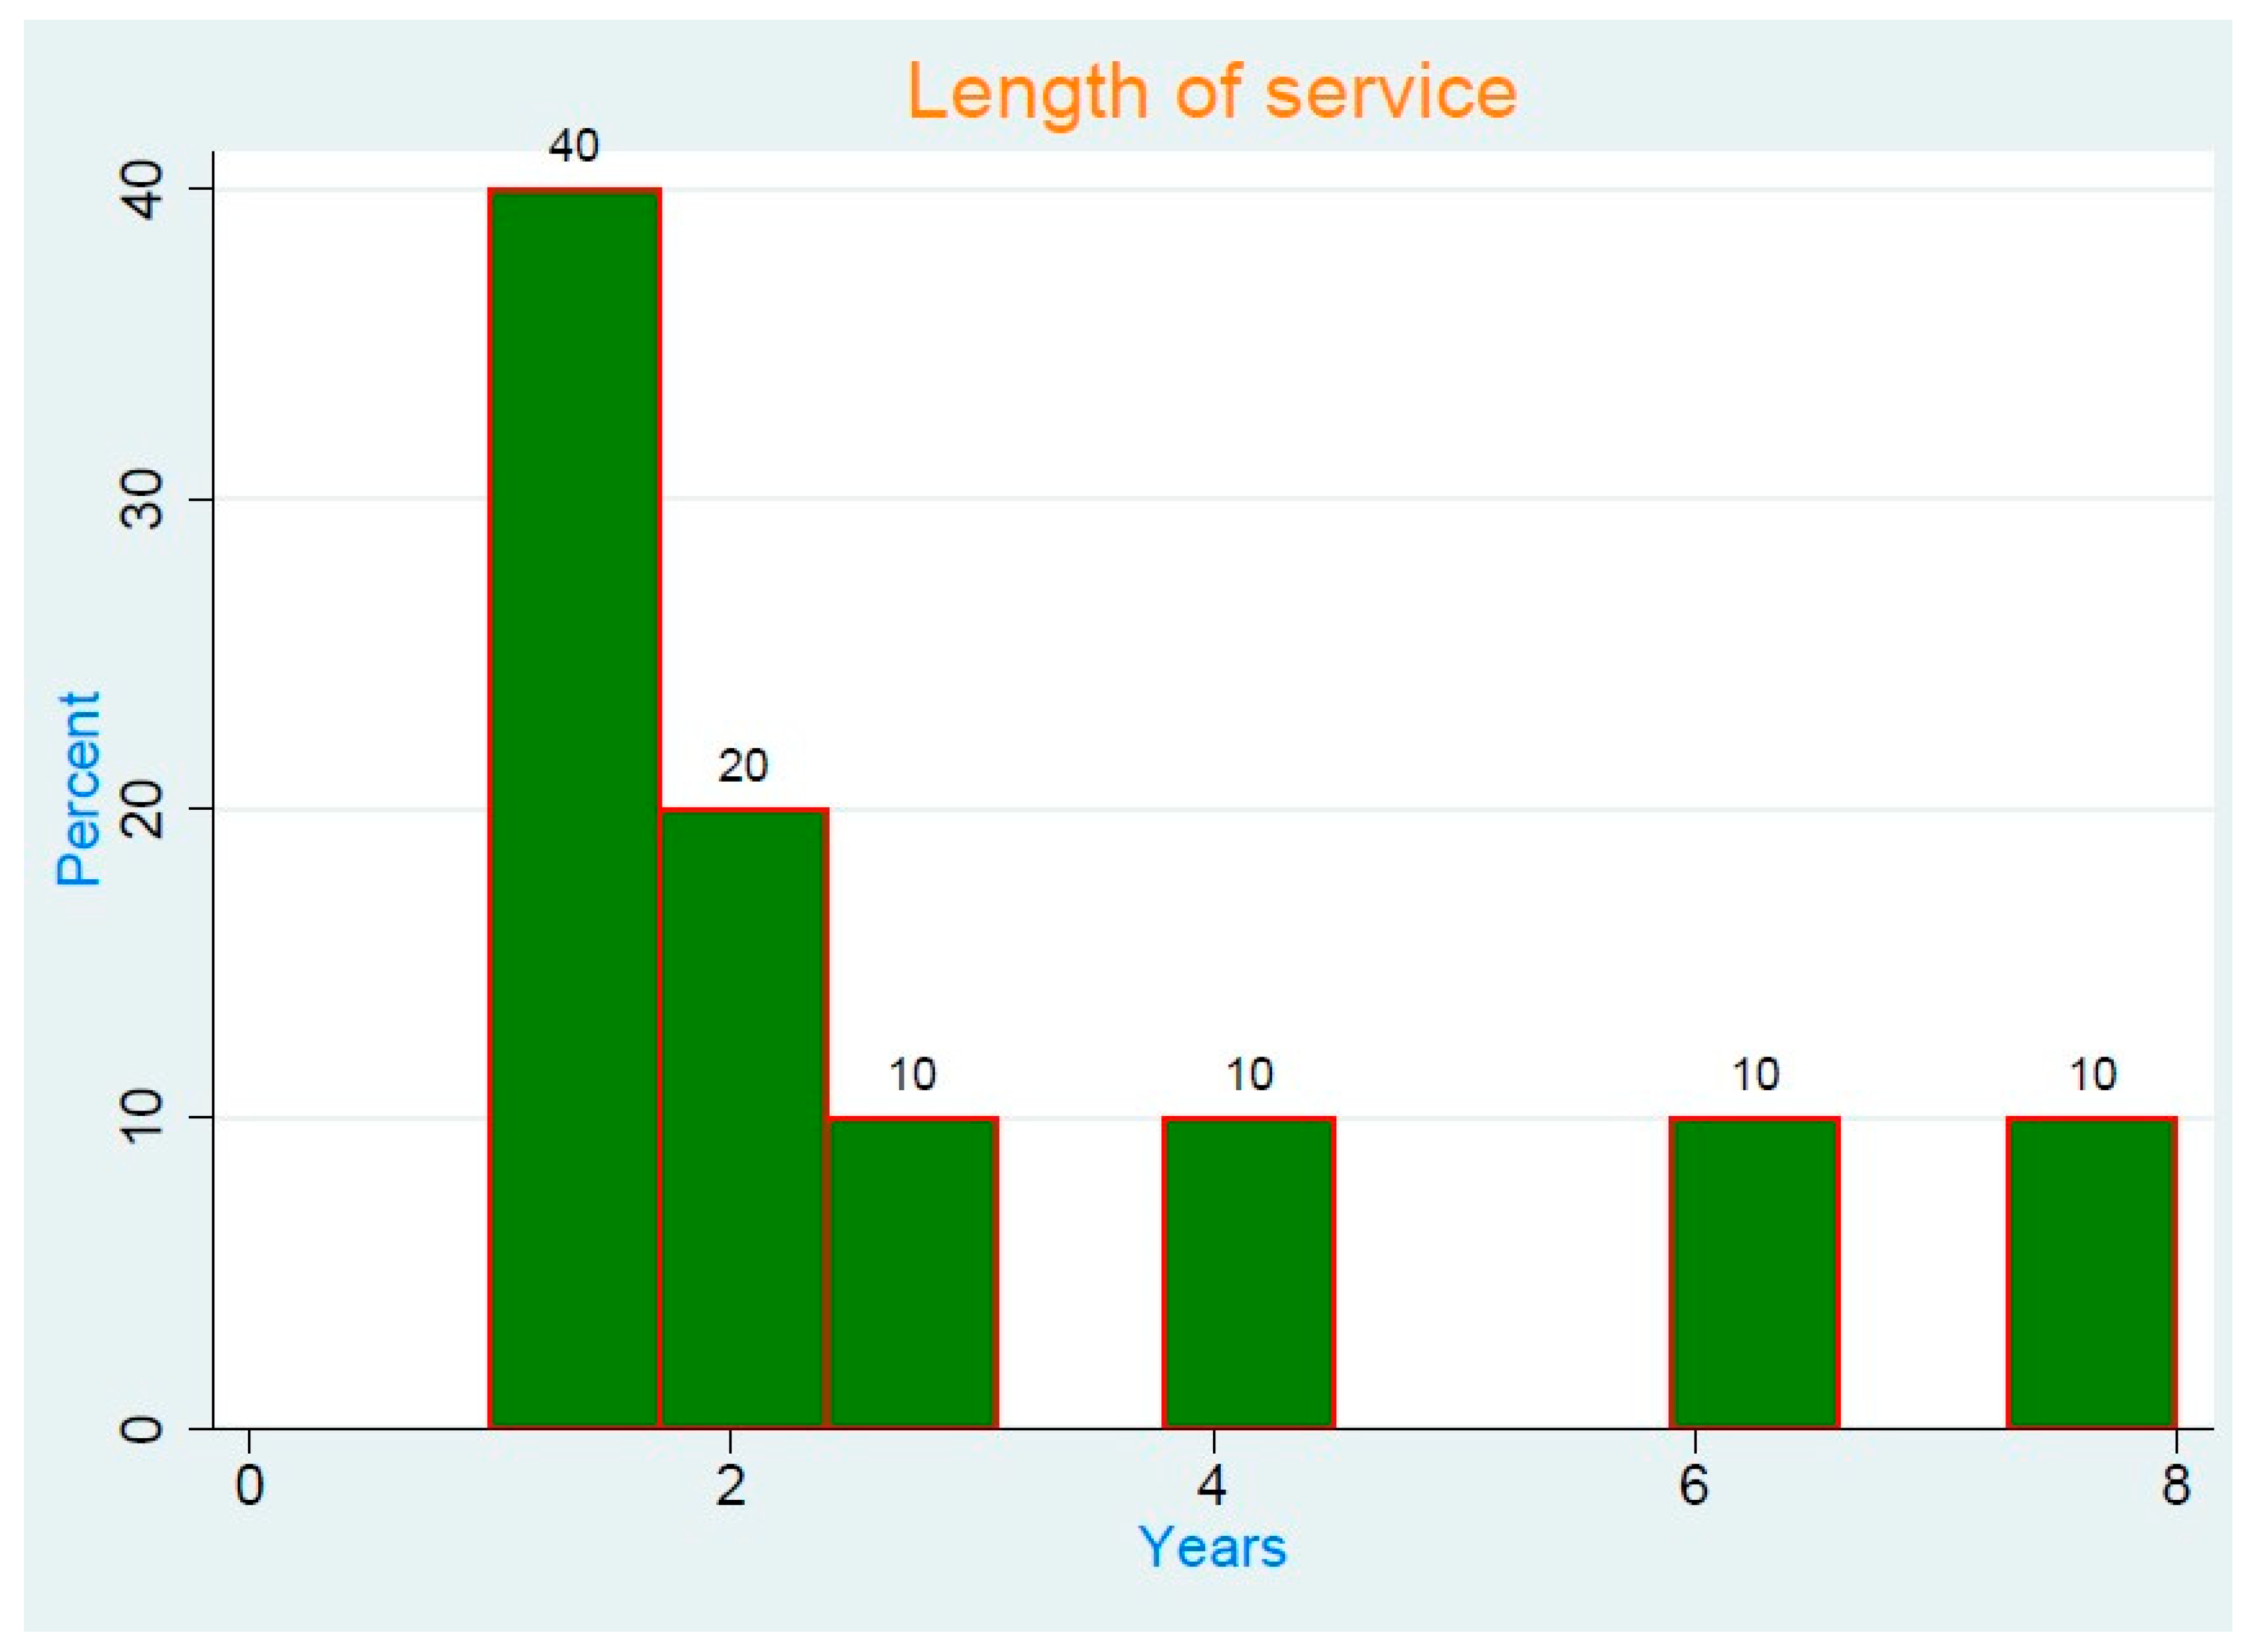
Length of Service in MNCs:
Figure 3.
Employee Tenure in Romanian and Tunisian MNCs. This bar chart shows that most employees have been recently hired, with 70% of Romanian participants having worked for just over a year, while 70% of Tunisian employees have between one and three years of tenure.
Figure 3.
Employee Tenure in Romanian and Tunisian MNCs. This bar chart shows that most employees have been recently hired, with 70% of Romanian participants having worked for just over a year, while 70% of Tunisian employees have between one and three years of tenure.
Summary Statistics Table
To measure employees tendency towards a particular cultural dimension, we combined the percentages of the "Agree" and "Strongly Agree" responses. Each 10% corresponds to 1 point, allowing for quantitative interpretation in STATA.
For example, if 40% of employees answered "Agree" and 20% answered "Strongly Agree", the total score would be 60%, which corresponds to 6 points.
The following summary statistics provide an overview of the collected data from Romanian and Tunisian MNCs, allowing for comparison across Hofstede’s six cultural dimensions.
Table 1 presents the summary statistics for Hofstede’s six cultural dimensions. The results indicate that Power Distance (PDI) is higher in Romania (M = 8.0) than in Tunisia (M = 7.2), confirming a more hierarchical structure in Romanian workplaces. Additionally, the Individualism (IDV) score is significantly lower in Romania (M = 1.3) compared to Tunisia (M = 4.8), supporting the collectivist nature of Romanian organizations.
3.2. Cultural Dimensions Analysis:
To compare the cultural differences between Romania and Tunisia, the following figures illustrate Hofstede’s 6D model scores for both countries.
Figure 4.
Power Distance Index (PDI) Comparison – Romania vs. Tunisia.
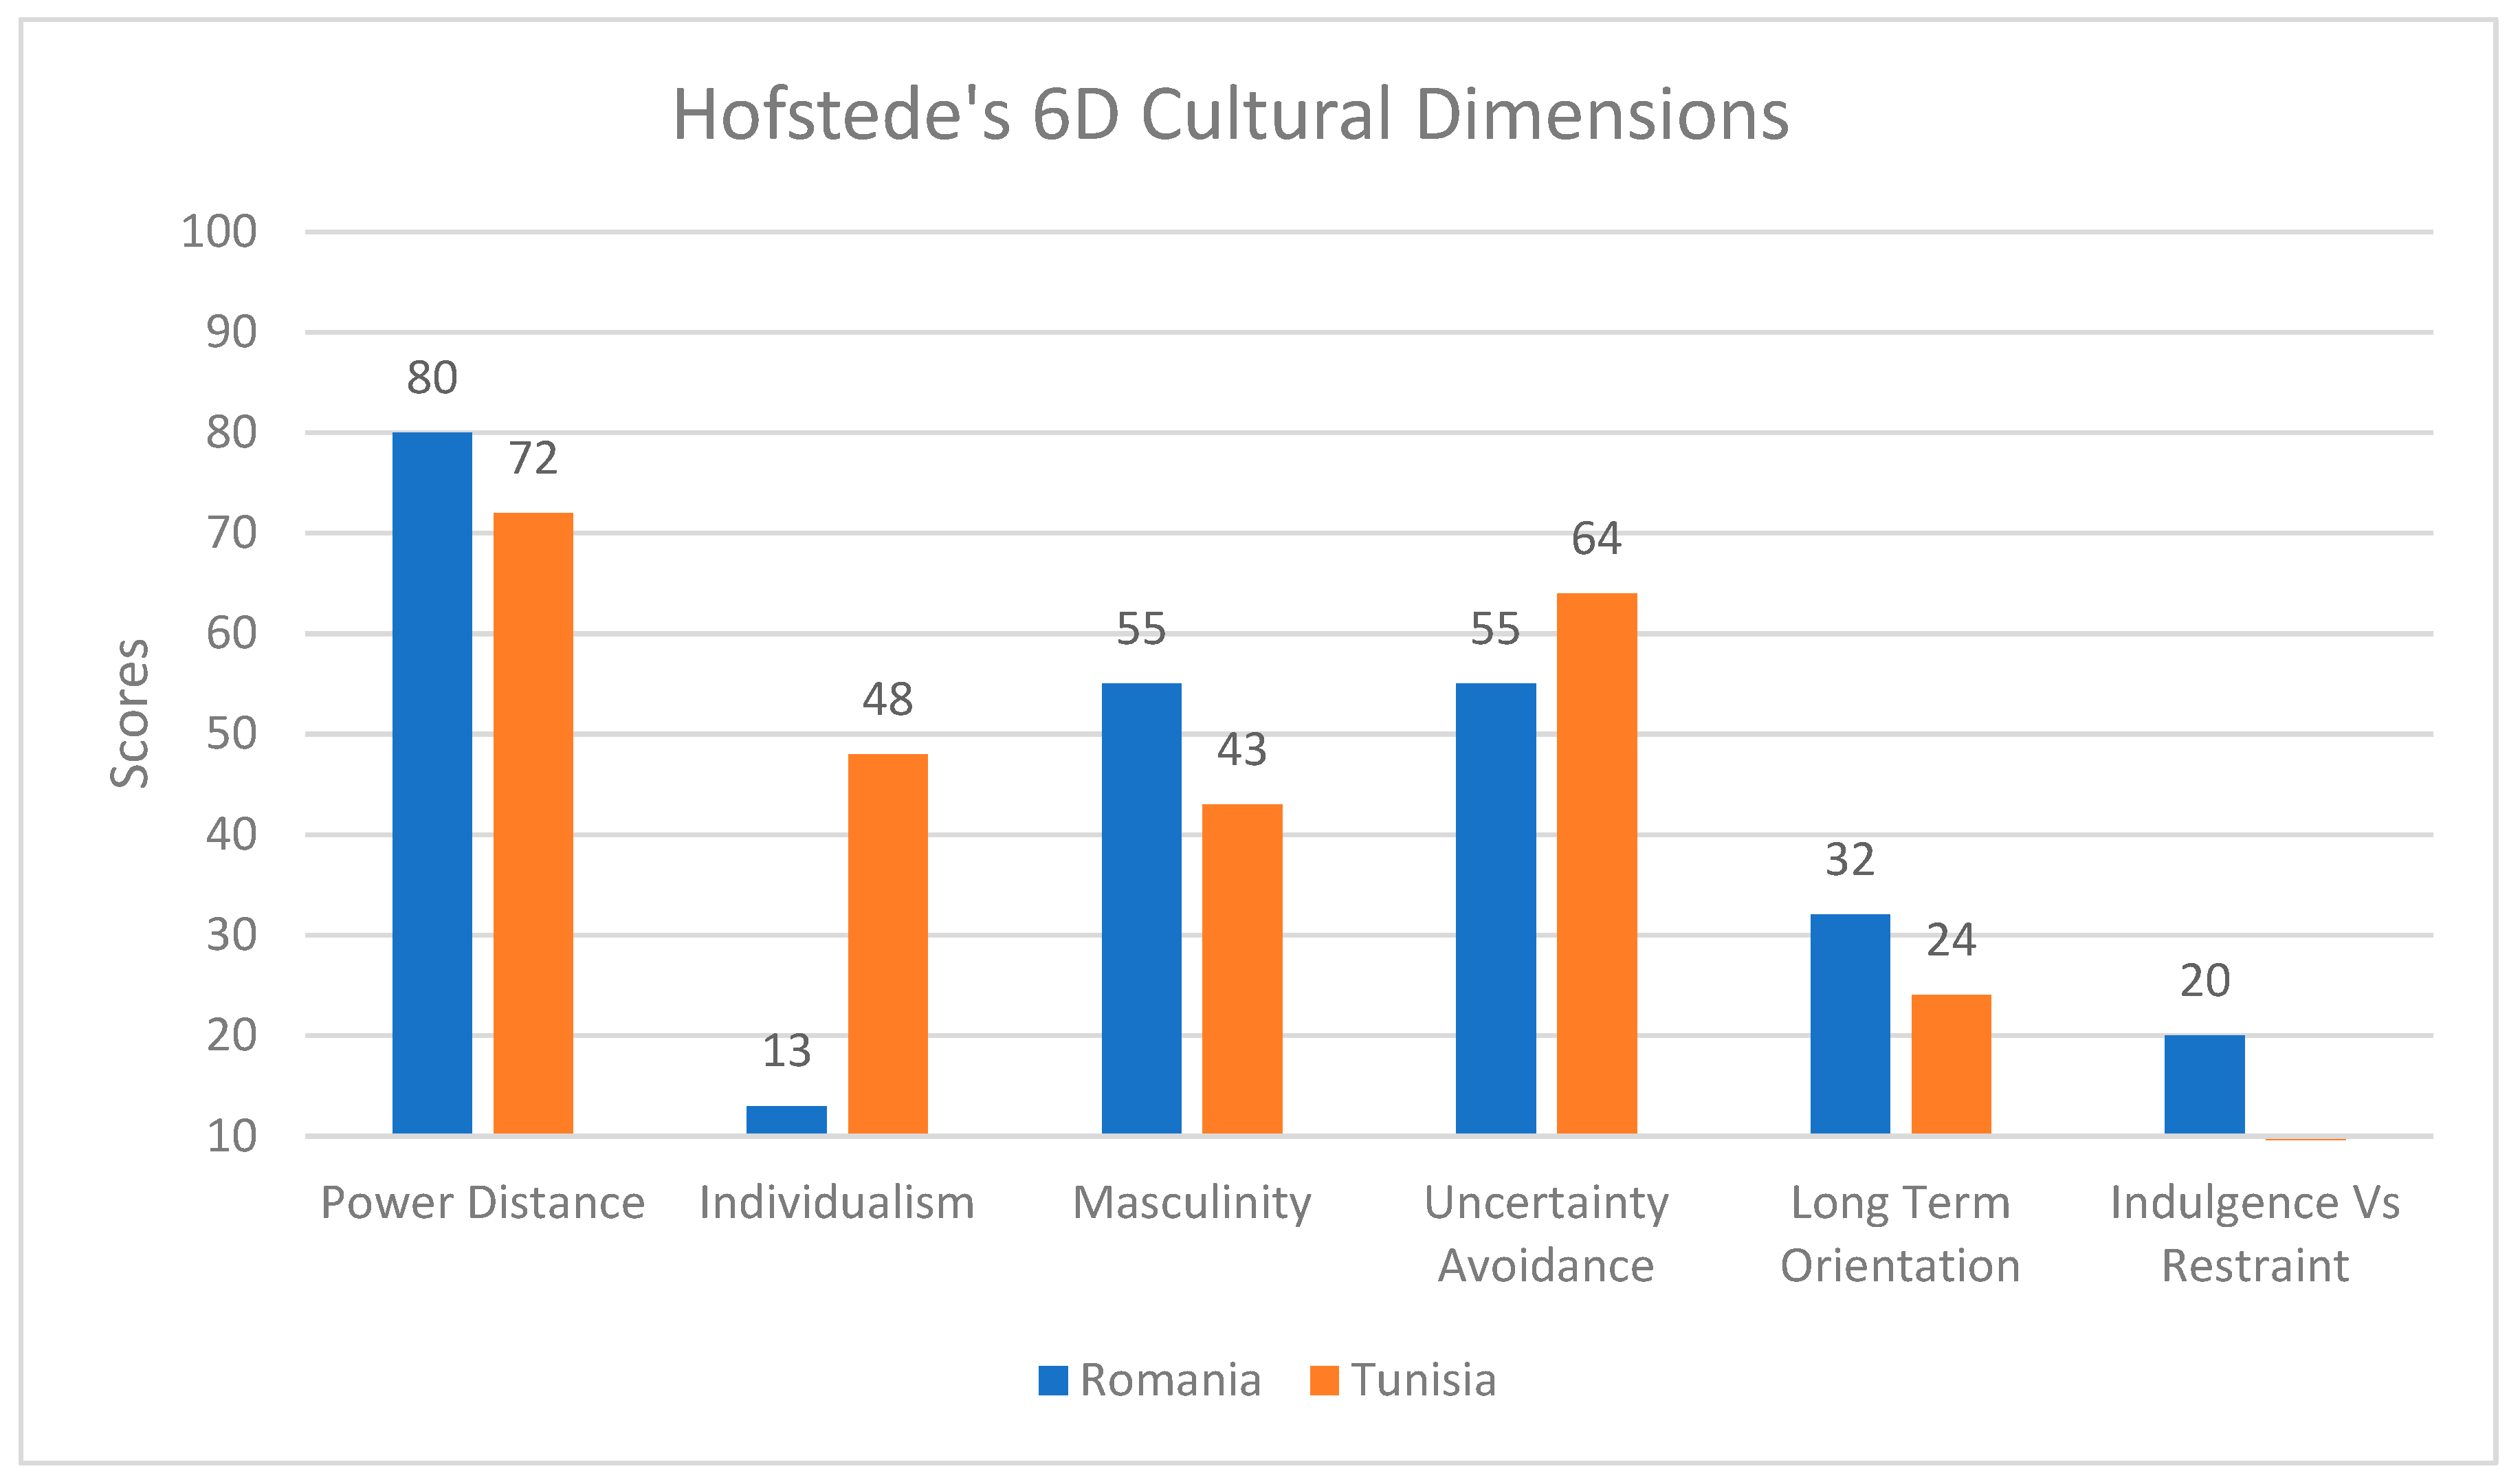
Power Distance (PDI)
The results indicate that Romania (80) has a slightly higher Power Distance score than Tunisia (72), meaning Romanian workplaces are more hierarchical, with employees following authority strictly, while Tunisians have slightly more flexibility in hierarchical structures.
Individualism vs. Collectivism (IDV)
Both cultures lean towards collectivism, but Romania (13) scores significantly lower than Tunisia (48), indicating that while group cohesion is important in both societies, Romanian employees exhibit slightly higher independence.
Masculinity vs. Femininity (MAS)
Romania (43) leans towards femininity, emphasizing collaboration over competition, while Tunisia (55) is slightly more masculine, balancing success-driven and compassionate values.
Uncertainty Avoidance (UAI)
Both countries prefer structured environments, but Romania (64) shows a higher tendency to avoid uncertainty compared to Tunisia (55), suggesting stricter adherence to rules and risk-averse business environments.
Long-Term vs. Short-Term Orientation (LTO)
Both societies prioritize short-term gains, with Romania scoring 32 and Tunisia 28, reflecting a preference for quick results over long-term planning in business and economic decision-making.
Indulgence vs. Restraint (IVR)
Both cultures exhibit restraint, but Tunisia (10) is even more conservative than Romania (20), indicating stronger social norms that limit personal gratification and indulgence.
4. Discussion
Interpretation of Findings
- Romanian workplaces are stricter, with less negotiation in leadership.
- Both cultures value social cohesion, though Tunisian employees have more flexibility in decision-making.
- Risk avoidance is higher in Romania, which limits adaptability in business settings.
Comparison with Previous Studies
- Previous studies on Hofstede’s model confirm high PDI and UAI in both regions (Hofstede, 2010).
- This study’s findings align with global research on hierarchical business cultures in Eastern Europe and North Africa.
Limitations
- Small sample size (10 employees) restricts generalizability.
- Focus on two industries (insurance & recruitment) may not represent other sectors.
Implications
- For MNCs: Companies must adapt leadership styles, offering more flexibility in Tunisia and structured decision-making in Romania.
- For Future Research: Expanding the sample size and incorporating other industries can strengthen these findings.
5. Conclusions
This study demonstrates that cultural differences between Romania and Tunisia significantly impact organizational behavior. The high-power distance, collectivist tendencies, and risk-averse nature of both cultures shape workplace interactions and managerial decisions. Understanding these cultural dimensions allows multinational corporations to tailor their management approaches for better cross-cultural collaboration.
References
- Ben Aoun, B. (2024). Comparative study on cultural dimensions (Hofstede 6D): Europe vs Middle East- NorthWest Africa (MENWA) [Master’s thesis, Ștefan Cel Mare University of Suceava]. [CrossRef]
- Robert Boyd Peter J. Richerson (2005) pp320-321. The origin and evolution of cultures. Oxford University Press.
- Fred Luthans Jonathan P.Doh (2018) pp124-125,130-138. International Management: Culture,Strategy and Behavior. McGraw-Hill Education.

Table 1.
Summary Statistics of Hofstede’s Cultural Dimensions (Romania vs. Tunisia).
| Cultural Dimensions | Romania (Mean ±SD) | Tunisia (Mean ± SD) | Min | Max |
|---|---|---|---|---|
| Power Distance (PDI) | 8.0 ± 1.2 | 7.2 ± 1.4 | 6 | 9 |
| Individualism (IDV) | 1.3 ± 0.8 | 4.8 ± 1.0 | 1 | 6 |
| Masculinity (MAS) | 4.3 ± 1.1 | 5.5 ± 1.2 | 3 | 7 |
| Uncertainty Avoidance (UAI) | 6.4 ± 1.5 | 5.5 ± 1.3 | 4 | 8 |
| Long – Term Orientation (LTO) | 3.2 ± 0.9 | 2.8 ± 1.0 | 2 | 5 |
| Indulgence (IVR) | 2.0 ± 1.0 | 1.0 ± 0.8 | 1 | 3 |
Disclaimer/Publisher’s Note: The statements, opinions and data contained in all publications are solely those of the individual author(s) and contributor(s) and not of MDPI and/or the editor(s). MDPI and/or the editor(s) disclaim responsibility for any injury to people or property resulting from any ideas, methods, instructions or products referred to in the content. |
© 2025 by the authors. Licensee MDPI, Basel, Switzerland. This article is an open access article distributed under the terms and conditions of the Creative Commons Attribution (CC BY) license (http://creativecommons.org/licenses/by/4.0/).
Copyright: This open access article is published under a Creative Commons CC BY 4.0 license, which permit the free download, distribution, and reuse, provided that the author and preprint are cited in any reuse.


