1. Introduction
In open waters worldwide, marine ecosystems are surveyed using advanced fisheries acoustics [
1]. By applying this method, the distribution of commercially- important fish and plankton species can be mapped and their biomass estimated [
2,
3,
4]. The method, instruments, protocols and platforms for marine ecosystem surveys, using fisheries acoustics, have been much improved since the first attempts in the early sixties [
5]. The method has been proven to be linear [
6], the target strengths for important species have been measured, the instruments have produced reliable digital outputs [
7,
8], the protocols including calibration have been standardized, and the low-noise research vessels with the transducers mounted on a protruding keel have been evaluated as efficient platforms [
9].
Since the nineties, digital post processing system have been developed to help allocate recordings to specific species [
10,
11,
12]. Using such systems, noise and unwanted signals can be deleted, specific settings regulated, and layers set conveniently. Even the target strength of single organisms identified can be measured underway. Some of these systems now have elements of machine learning to help the scrutinizing process by removing noise automatically, and suggest allocation of back scatter to given species, families or other taxonomic units of marine organisms.
Here, we describe application of the LSSS post processing system [
13] using its KORONA module [
14] with elements of machine learning to survey the European sector of the Arctic Ocean. The surveys started in the productive open waters near Svalbard and were run all the way to the ice-covered waters in the Central Arctic Ocean (CAO). The first survey (2022) was conducted all the way to the North Pole. By use of LSSS, a nearly continuous acoustic mapping of the upper 500 m of the water column were obtained by removing segments cluttered with substantial noise from icebreaking. Finally, perspectives for further development of post-processing system for better and more-efficient mapping and monitoring of marine ecosystems are discussed.
2. Materials and Methods
Acoustic data from two cruises with RV “
Kronprins Haakon” (KPH) in the Arctic Ocean in 2022 and 2023 have been collected for this study. KPH is a modern Polar Class 3, 11000 GRT icebreaking research vessel [
15]. KPH is equipped with state-of-the- art instruments for broadband acoustic surveying [
16] of the water column along the ship track. Continuous recordings were made by the hull-mounted transducers of the Simrad EK80 echo sounder, operated at 18, 38, 70, 120, 200 and 333 kHz. The beam width (- 3dB points) was 11° on the 18 kHz transducer operated at 1.6 kW. For the other frequencies the beam width was 7°, and the transducers operated from 2.0 kW for 38 kHz to 0.05 kW for the 333 kHz transducer. All frequencies operated with continuous wave pulses and fast ramping. The volume back scatter (s
v) at the six frequencies was recorded and stored from surface to 500 m depth.
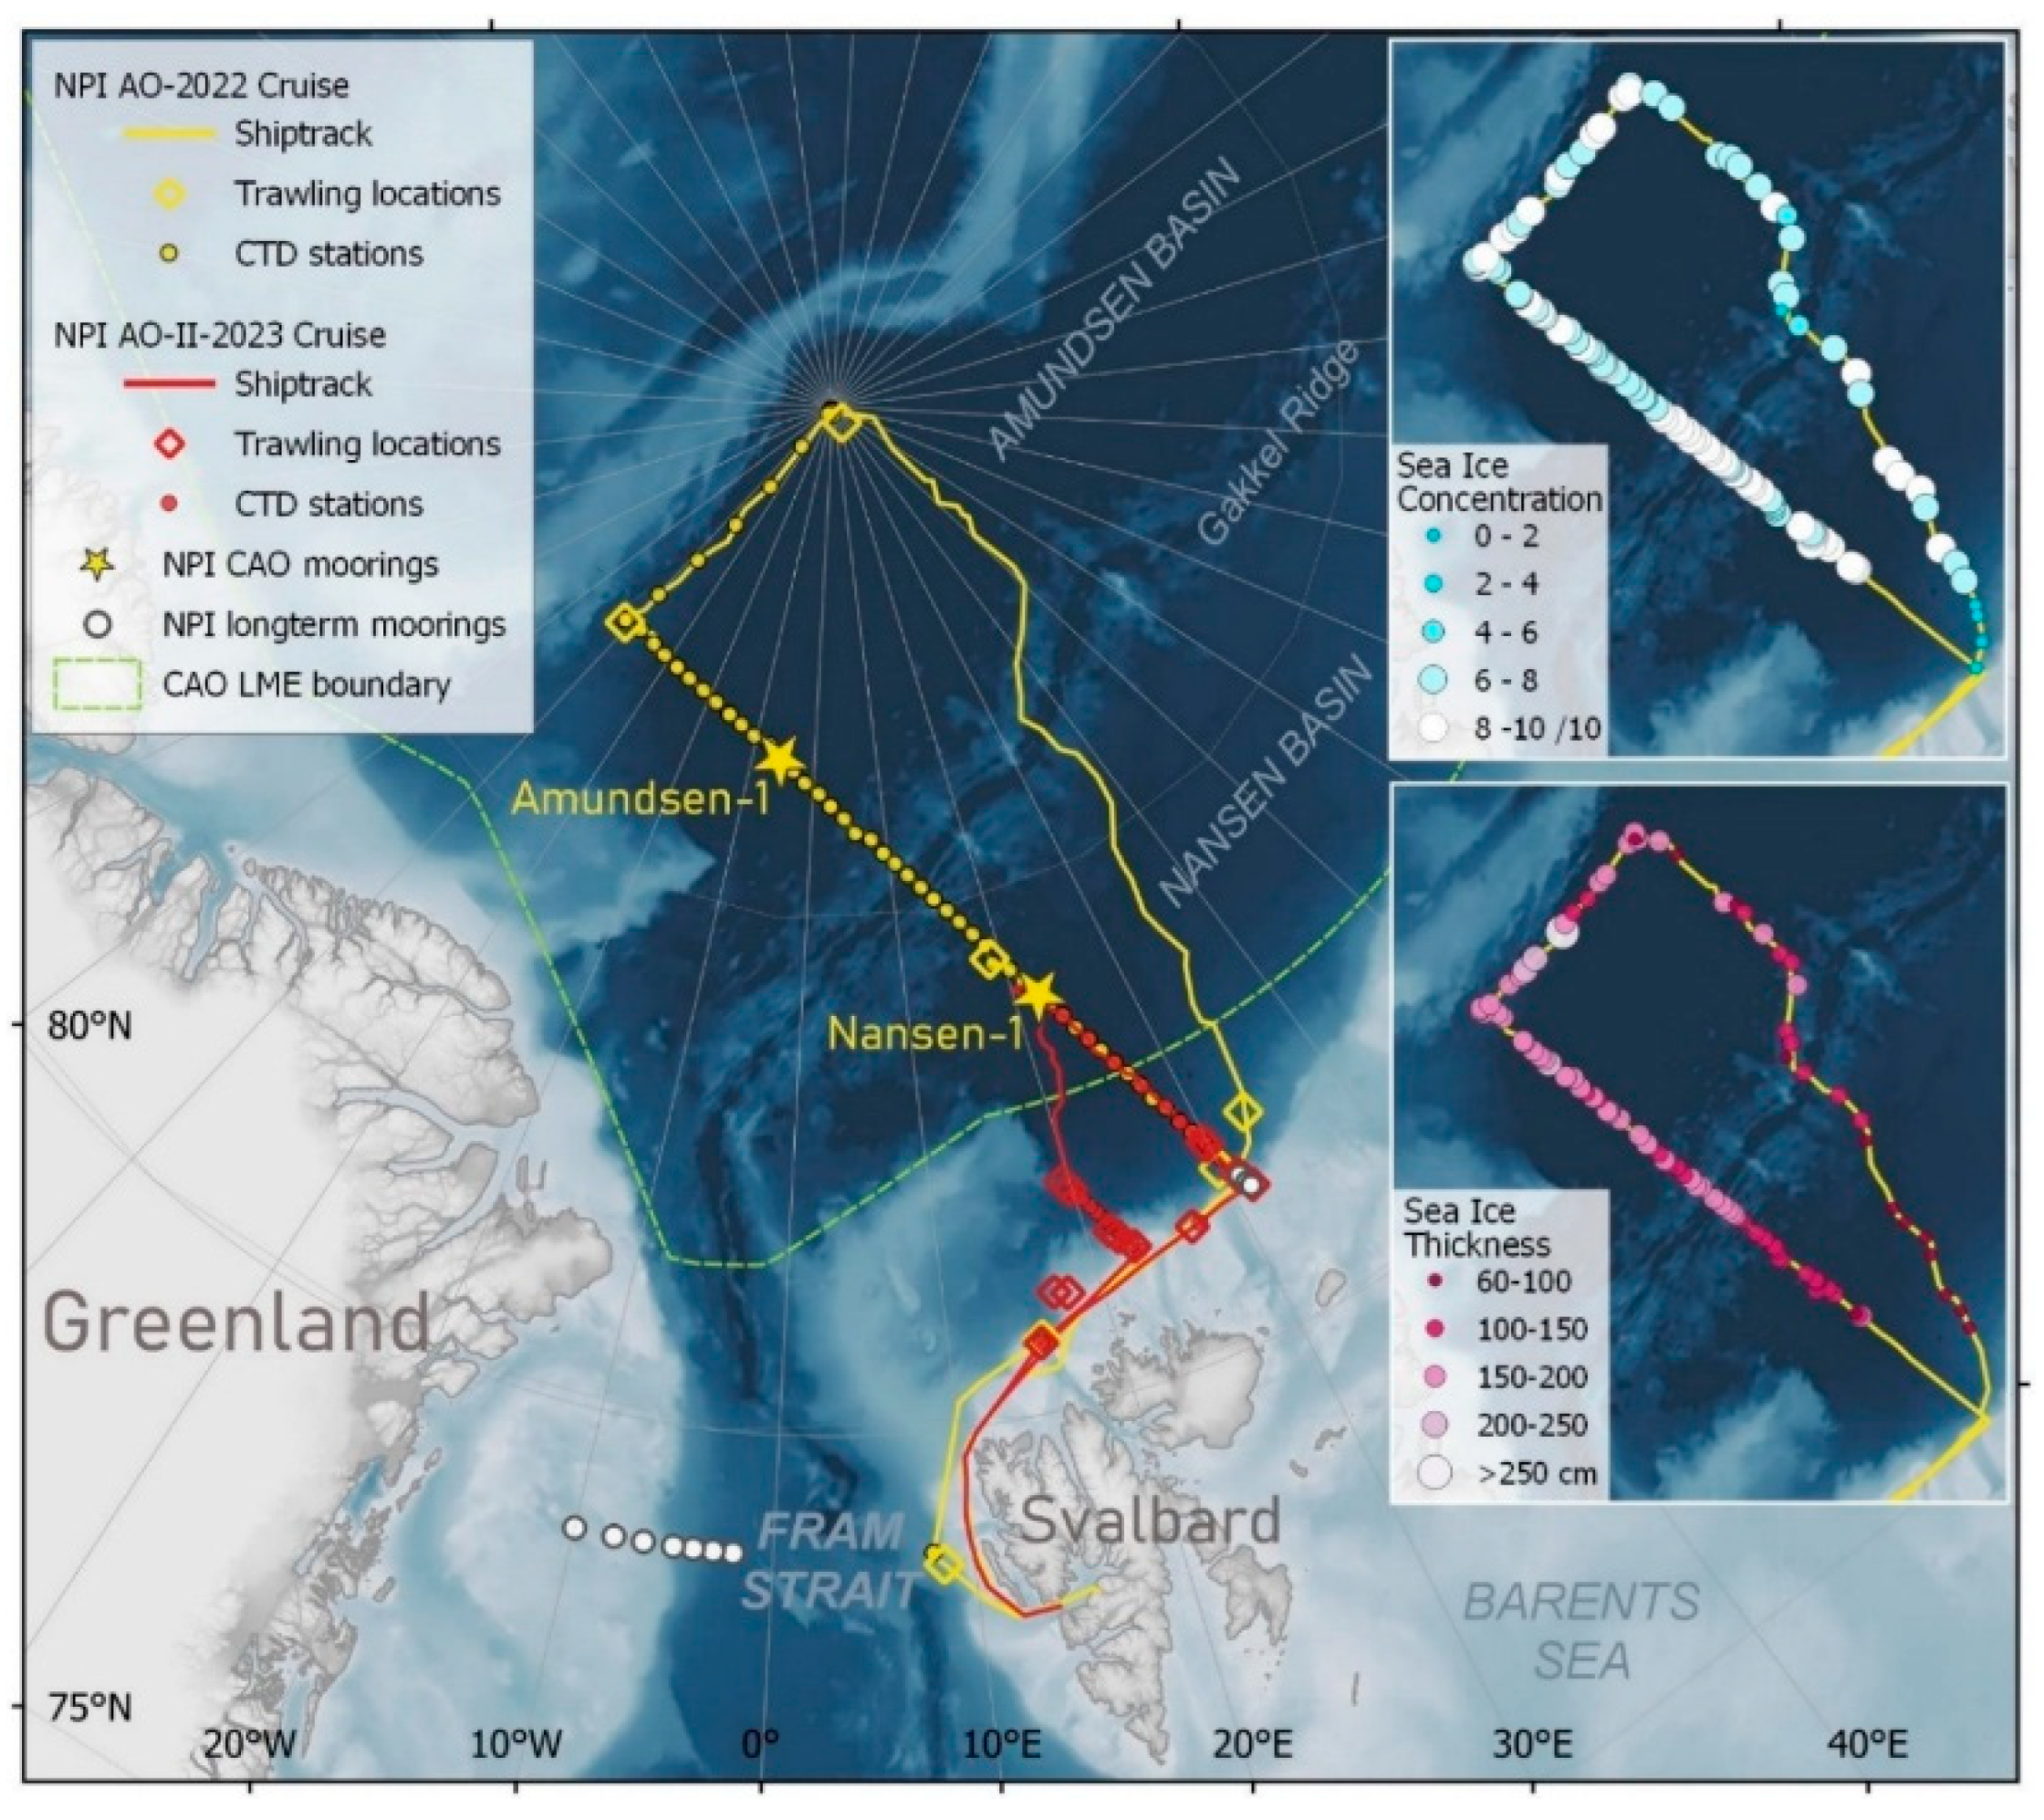
Both cruises started from Longyearbyen, Svalbard. The first cruise [
17] started on 22 July 2022, and data collection was initiated when the ship departed the harbour (
Figure 1). The ship followed a route west of Svalbard, north on the Svalbard shelf, encountering the sea ice at N82° 05’ (
Figure 1), and then sailed on a northern course all the way to the North Pole. From there the ship continued on a southwestern route along W 41° to N87° 10’ before turning southeast along an established hydrographic transect, started in 2021 [
18]. Data collection was stopped on 19 August 2022, at N81° 31’ E31° 06 at ship log 10175. The second, shorter cruise [
19] was conducted in the period 12 – 27 August 2023 and focused in more detail on the ecosystem on the shelf slope Northeast of Svalbard and into the deeper Nansen Basin (
Figure 1). This year the ice edge was encountered at N81° 32.7’ E 22° 10’. The ship manoeuvred rather easily through the about 1 m thick ice, with occasional ice breaking.
2.1. Post Processing - General Protocol and Principles
Conversion of the echo sounder recordings to meaningful marine biological information first involves a rather coarse post processing, which is usually done sequentially onboard. Since the Institute of Marine Research (IMR) developed acoustic surveys for fish abundance estimation in the Nordic Seas in the sixties [
20], a formal protocol for this process has been developed and adjusted according to available technology. At least once a day, the chief instrument operator and the cruise leader sit together in the acoustic centre of the research vessel and replay the echo sounder recordings using the LSSS software [
13,
14]. For every unit nautical distance, usually five nautical miles (nmi), the recordings of volume back scattering strength are converted to nautical area back scattering strength (NASC, s
A with the unit (m
2 / (nmi)
2). The recordings are usually separated in convenient depth layers, and there are possibilities to limit recordings of dense shoals or schools using a school function. NASC values are displayed for the different depth layers and school units and integrated for the unit nautical distance. Before allocation to biological categories like zooplankton and fish, the recordings are “cleaned” for unwanted back scattering from surface disturbance, for instance air plumes in the water column during bad weather, false bottom, interference from other acoustic instruments, noise from different sources or irregular bottom detections. The LSSS system has a convenient rubber function for erasing noise recordings, and a region removal function for deleting nautical distances with many disturbances. Surface and bottom irregularities are usually handled with redrawing the upper surface layer and the lower bottom layer manually using a pencil function. Also, the pencil function is often used to adjust the set depth layers also to delimitate recordings that vary in depth extent. The final allocation of NASC for every unit nautical distance to given taxa, families of specific species is done manually by setting the NASC value or the percentage of the total NASC value. In both cases the total NAC value for the given unit nautical distance should add up to one hundred percent. With the LSSS system it is possible to analyse echo sounder recordings not only for nautical distance sailed, but also by pings or time as the basic units in cases when the echo sounders are stationary, or geographical information is not connected to the echo sounder recordings.
The main purpose of the post processing procedure onboard is to “judge” or “scrutinize” the recordings so that NASC origination from marine biological sources like zooplankton or fish can be allocated to taxonomic units as order, families or even specific species. This can be done based on the characteristics of the recordings, or trough sampling of the back scattering organisms with trawl or plankton nets. Thus, the post processing process onboard is somewhat subjective [
21,
22], and to do it as objectively as possible, the IMR protocol is that it shall be done by the chief instrument operator in cooperation with the cruise leader or an acoustic specialist. The chief instrument operator is the one operating the computer systems and is responsible for the storing of both the raw and processed data onboard, and for transferring the acoustic recordings and other logged data from the specific cruise to the onshore database at the IMR headquarter in Bergen.
To help allocate of the recorded NASC to plankton or other scattering categories during the post processing onboard, aimed pelagic trawling and plankton net surveys were undertaken (
Figure 1). These surveys were done in leads in ice covered waters with an ice rigged Harstad pelagic trawl, and the MIK ring net and MultiNet plankton samplers hauled vertically.
2.2. Post Processing of Echo Sounder Recordings from the Arctic Ocean
The echo sounder recordings from the Arctic Ocean surveys in July – August 2022 and 2023 were processed onboard according to the general protocol and principles outlined above. The recordings from the 38 kHz channel were chosen for post processing, and with a minimum detection threshold of – 82 dB as normally used during fisheries acoustic surveys. Aimed pelagic trawling was conducted to identify recordings on the Svalbard shelf and on the slope north of Svalbard with the conventional Harstad trawl and a larger Vito pelagic trawl (
Figure 1). Based on the catches obtained, it was possible to identify single recordings, and to separate mixed recordings to taxa, species groups and single fish species. Precise monitoring of the gear performance and the catching process gives vital information to support separation of the back scattering organisms.
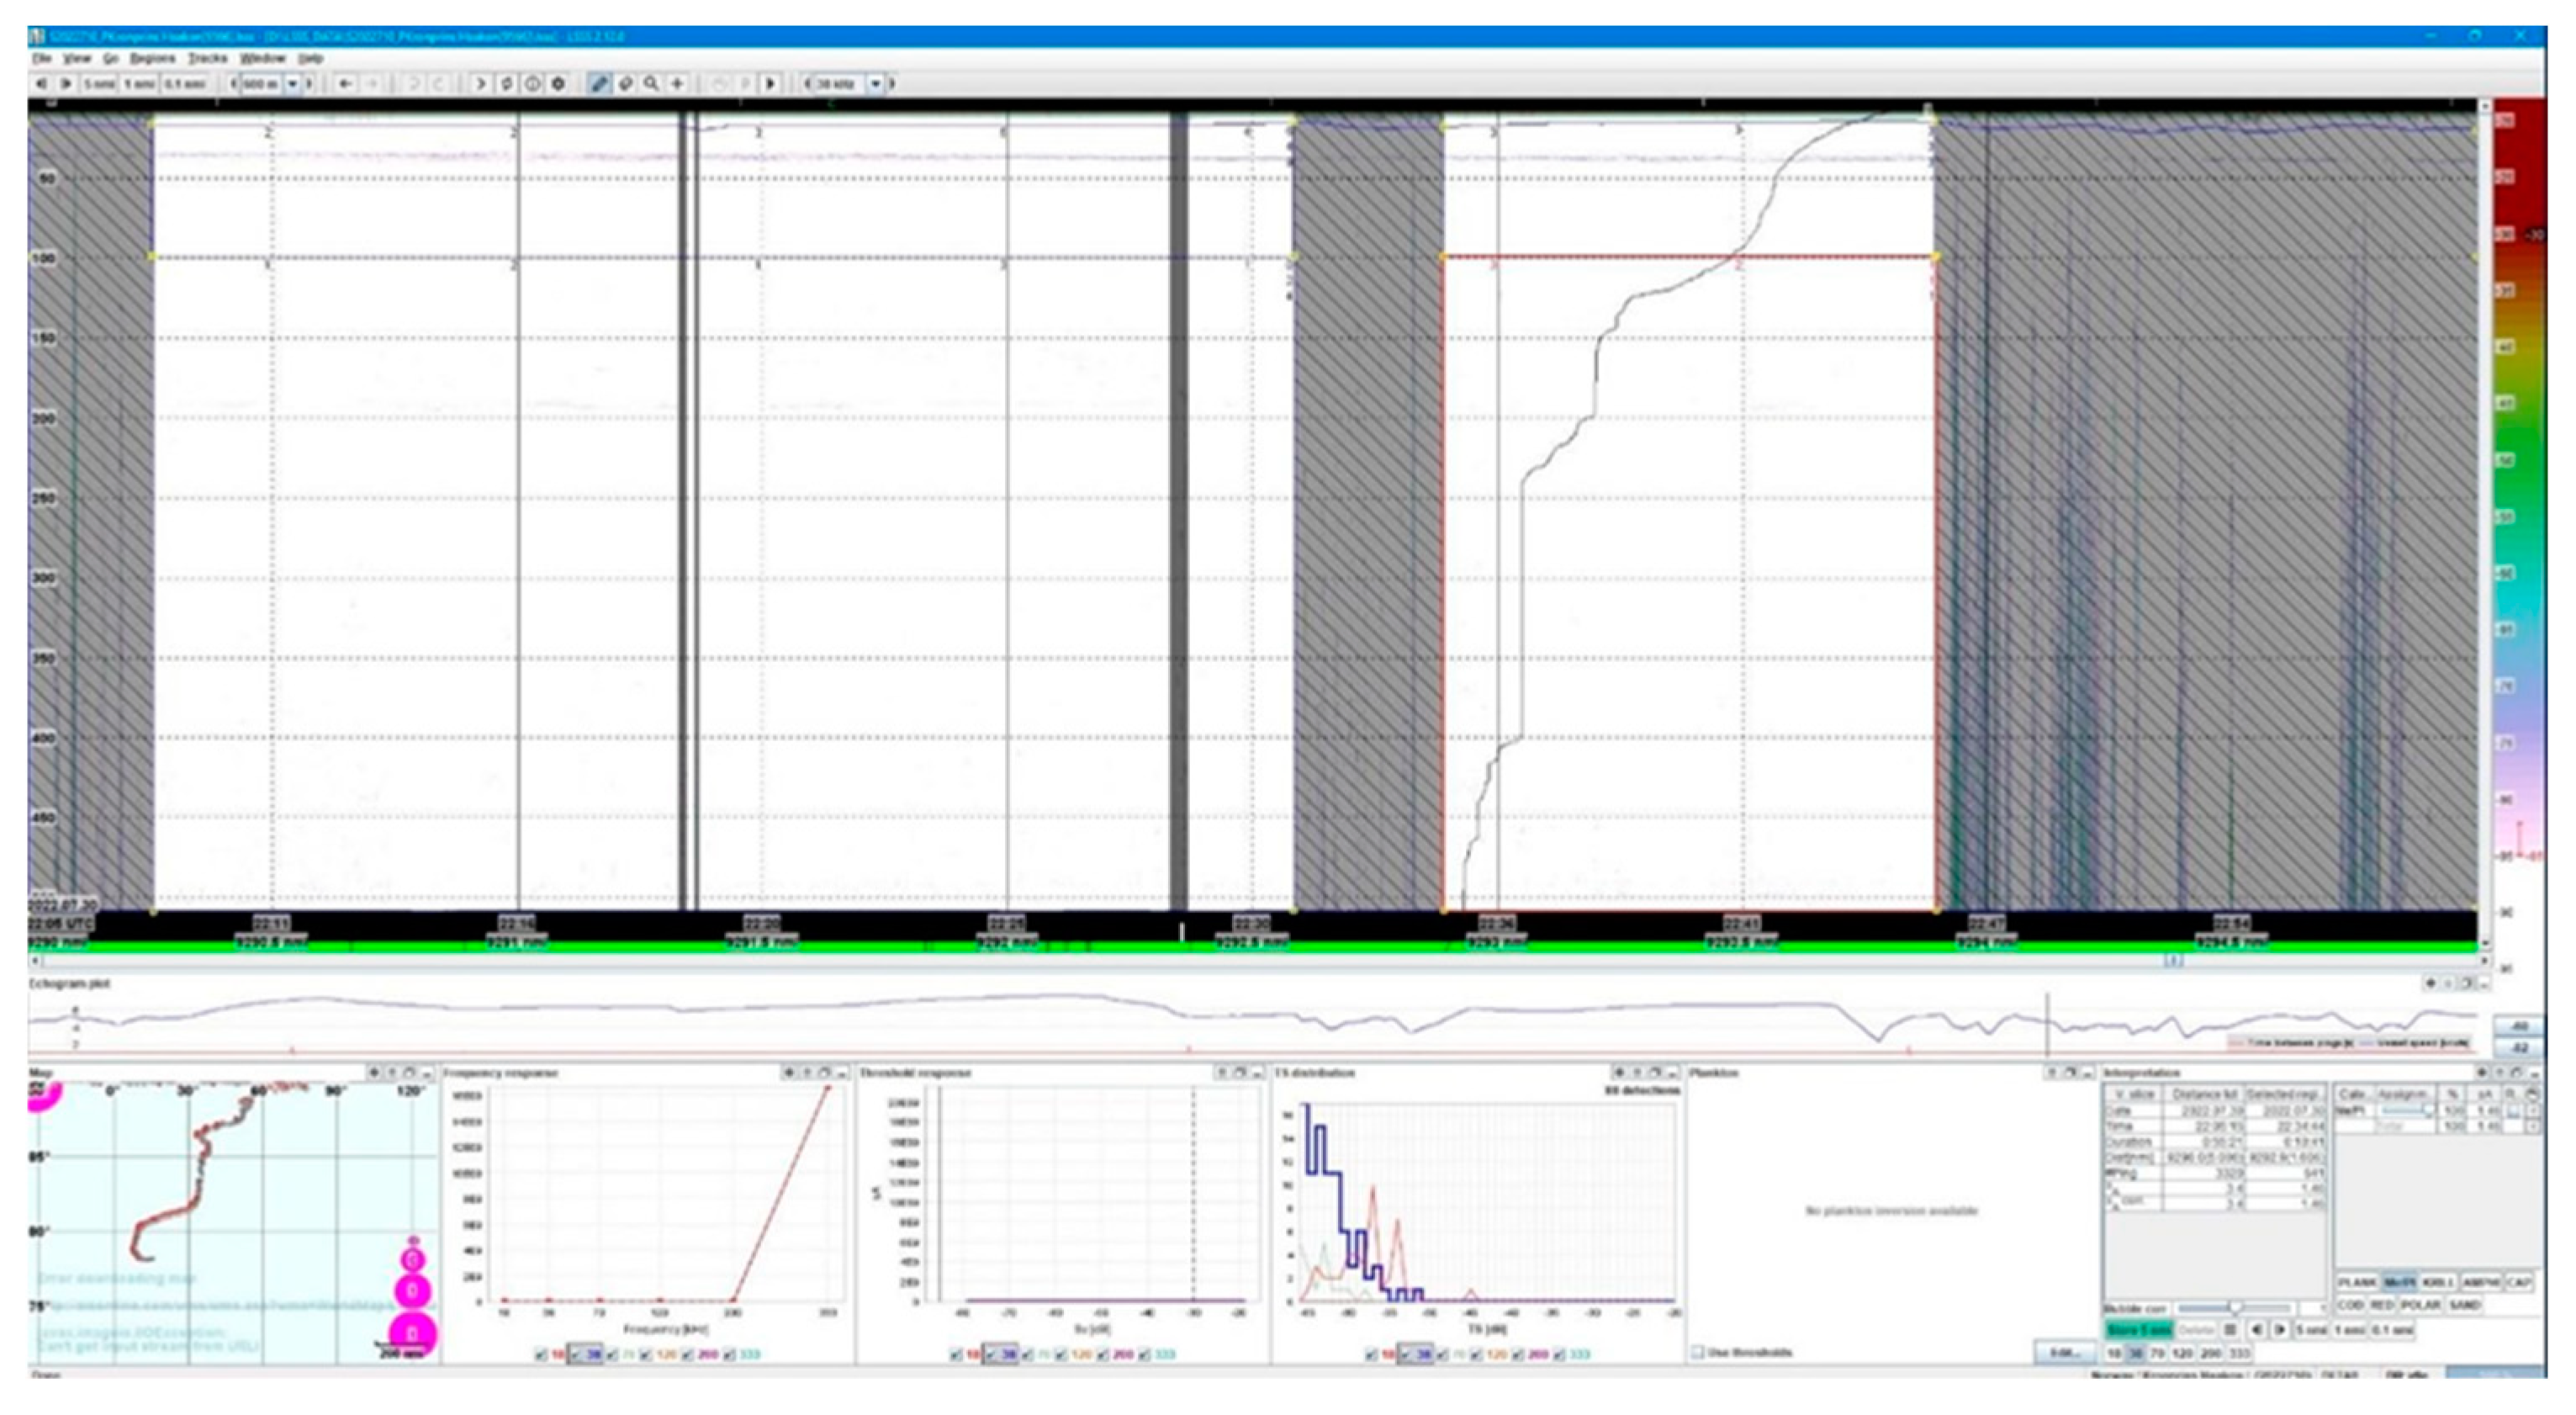
During the post processing onboard, noise in the recordings due to ice breaking, or other interactions with ice floes, were removed using the convenient region removal function of the LSSS system (
Figure 2). For distances where heavy ice conditions were encountered, there were a few five nautical mile sections where the recordings had to be removed completely because of rather continuous noise recordings. Especially towards the end of the southward hydrographic transect in August 2022, after the Nansen-1 mooring deployment, we encountered large, dense ice floes which the ship had to break through. Nevertheless, for most five nautical miles sailed, there were sections with representative recordings, generally when the ship was navigated through open leads in ice-covered waters. Then allocation of area backscattering coefficients to the recording categories was possible
The echo sounder recordings were post processed a second time at the IMR acoustic laboratory in Bergen using the
KORONA, a pre-processing facility of the LSSS, that carries out time-intensive processing of acoustic data [
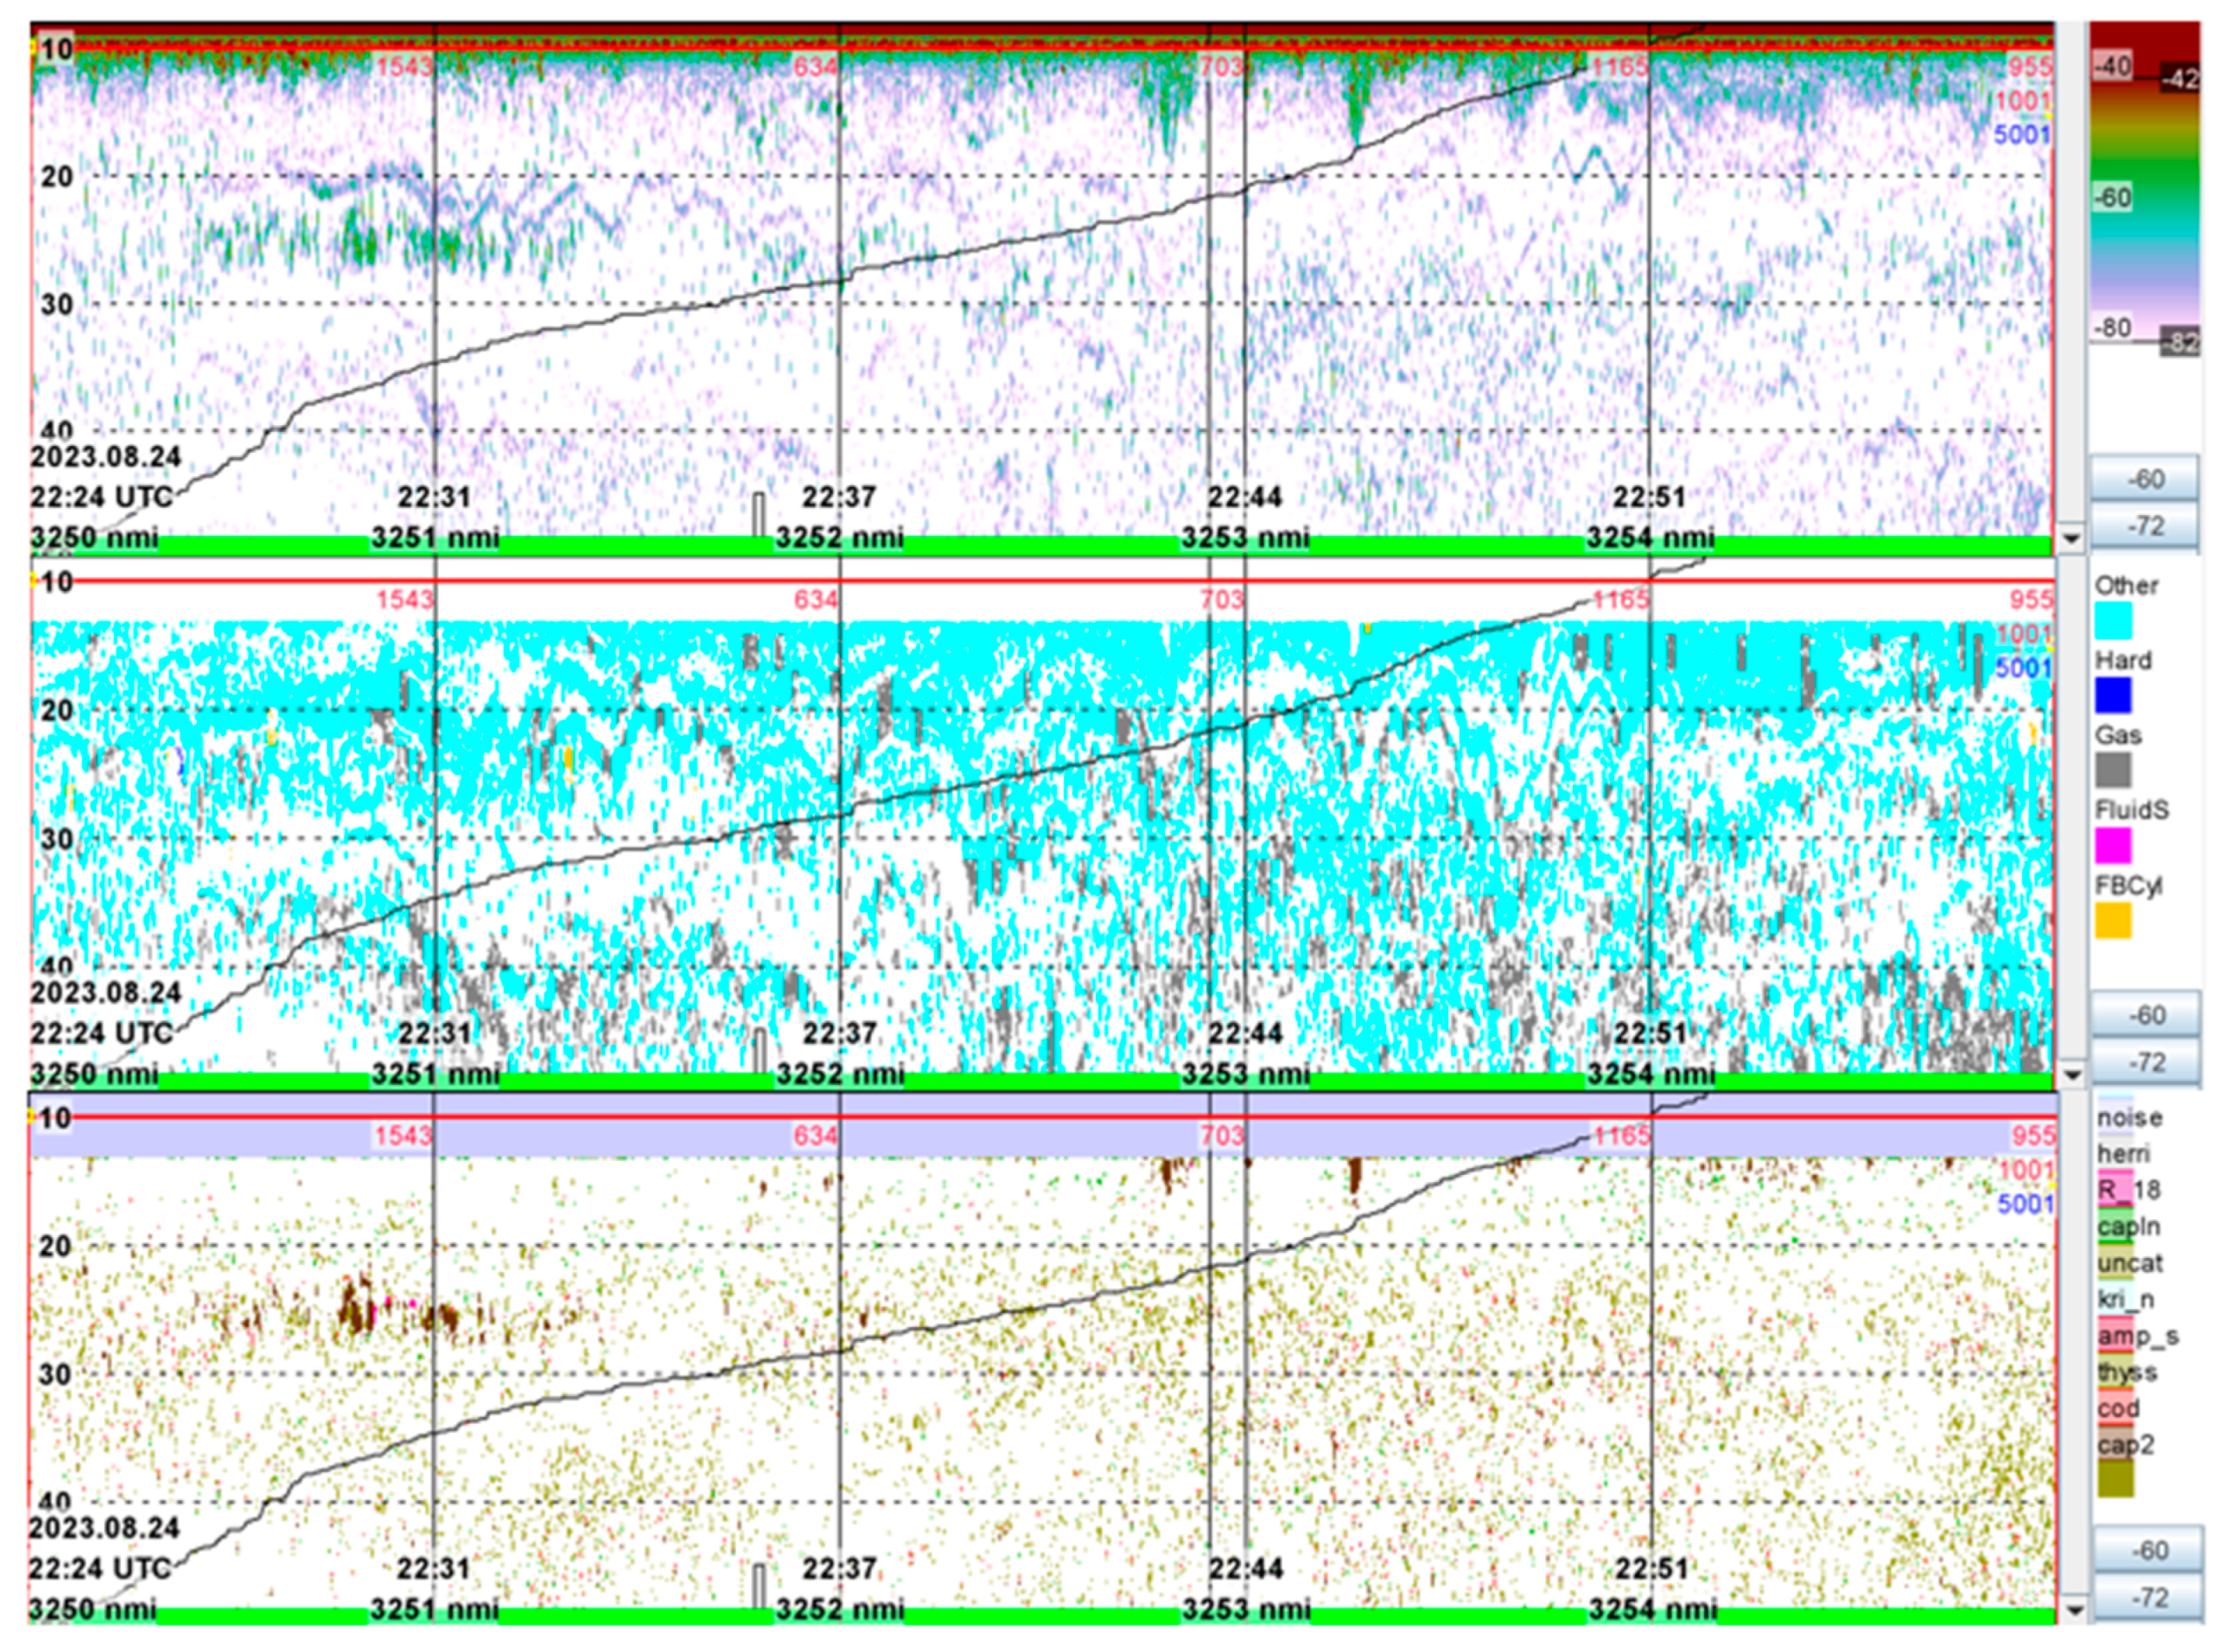
14]. The settings and results from the onboard post processing was the starting point for the second post processing. These data were then replayed using the KORONA facility to remove impulse-noise and ambient noise from the acoustic recordings, and thereafter also for categorization of the acoustic recordings based on an acoustic feature-library incorporated into LSSS. To help
distinguish fish with swim bladder from other scatterers, the
Plankton module of the KORONA suite was used regularly (
Figure 3). This module help is based on multi-frequency backscatter of theoretical models of fluid-bent cylinder, prolate spheroid, hard-shelled and gas-filled targets [
23,
24,
25] incorporated into a framework for estimating zooplankton specimen size [
2]. These models, in turn, fit well with backscatter from euphausiids or amphipods (fluid-bent cylinder), copepods (prolate spheroid), siphonophores or small mesopelagic fish with small swim bladder (gas-filled targets), or hard-shelled zooplankton such as the sea butterfly (
Limacina helicina). In addition to the model-based targets, the content of the acoustic feature-library containing known recordings of euphausiids, siphonophores or Mueller’s pearlside (
Maurolicus muelleri). For all five nautical miles sampled during the two cruises, the
Categorization mode was used. This mode enables distinguishing recordings in several Acoustic Library Categories (ALC): herring, capelin, krill, amphipods, cod, bottom, blind, noise, uncategorized, or unknown (
Figure 3). Each ALC is trained on a verified acoustic registration of that category, e.g., ALC_herring includes acoustic characteristics of herring. Based on visual results of the
Categorization mode and the trawl samples obtained during the cruises, the following categories were applied for allocation of NASC values: amphipods, capelin, cod, redfish , krill (
Thyssanoessa sp.), mesopelagics, O – group fish (for the 2023 recordings only), and plankton. Due to the weak recordings made by the Simrad EK80 echo sounder in the CAO, the LSSS software was developed further to give the NASC (s
A) with tree decimals (normally only integers are used). The final allocation of NASC to taxa, order, families of specific species was done manually.
During the second round of post processing, the recording conditions when the ship was moving or lying still for station work (CTD and vertical net hauls) were especially considered. The LSSS recordings from just 19 of the undertaken 80 CTD stations were stored as part of categorization of the integrated NASC. This was mostly due to the ship not moving during the CTD stations in densely ice-covered waters. When run in Distance mode, LSSS does not store values if there is no sailed distance. On some occasions the LSSS data from the CTD stations were excluded because there was much noise during the CTD stations due to other acoustic instrument activity (use of ADCP or multibeam echo sounding).
3. Results
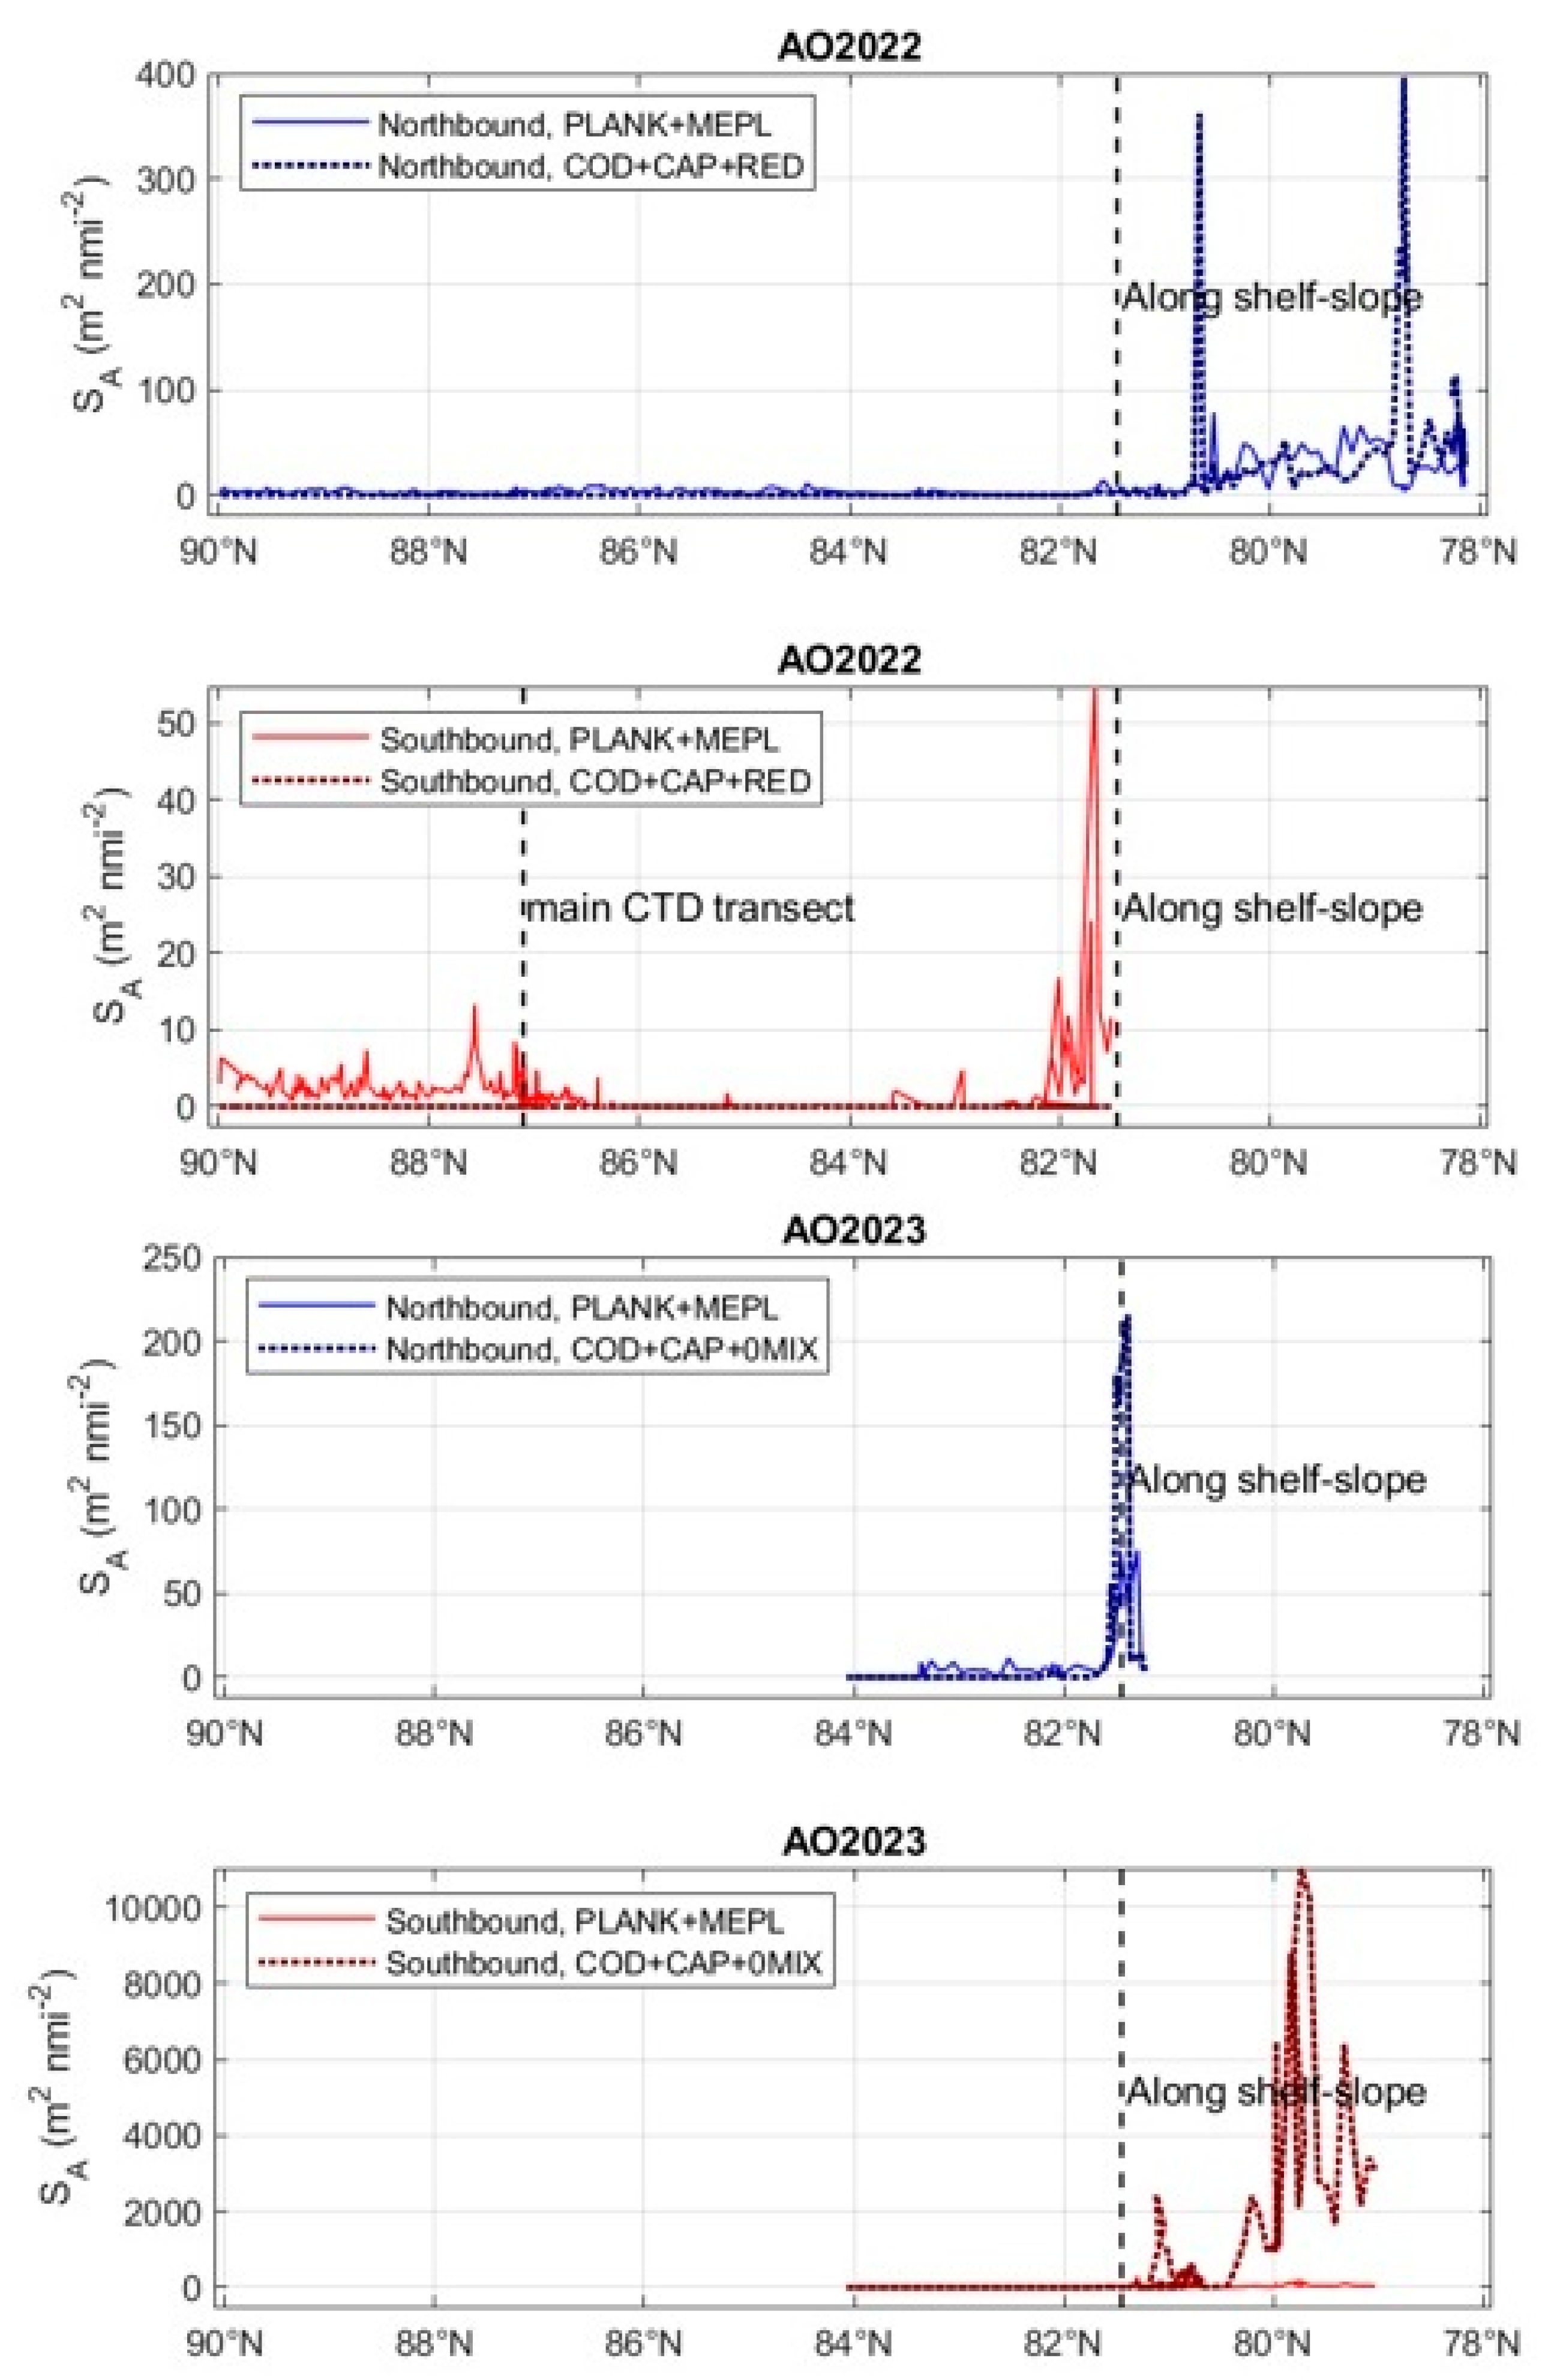
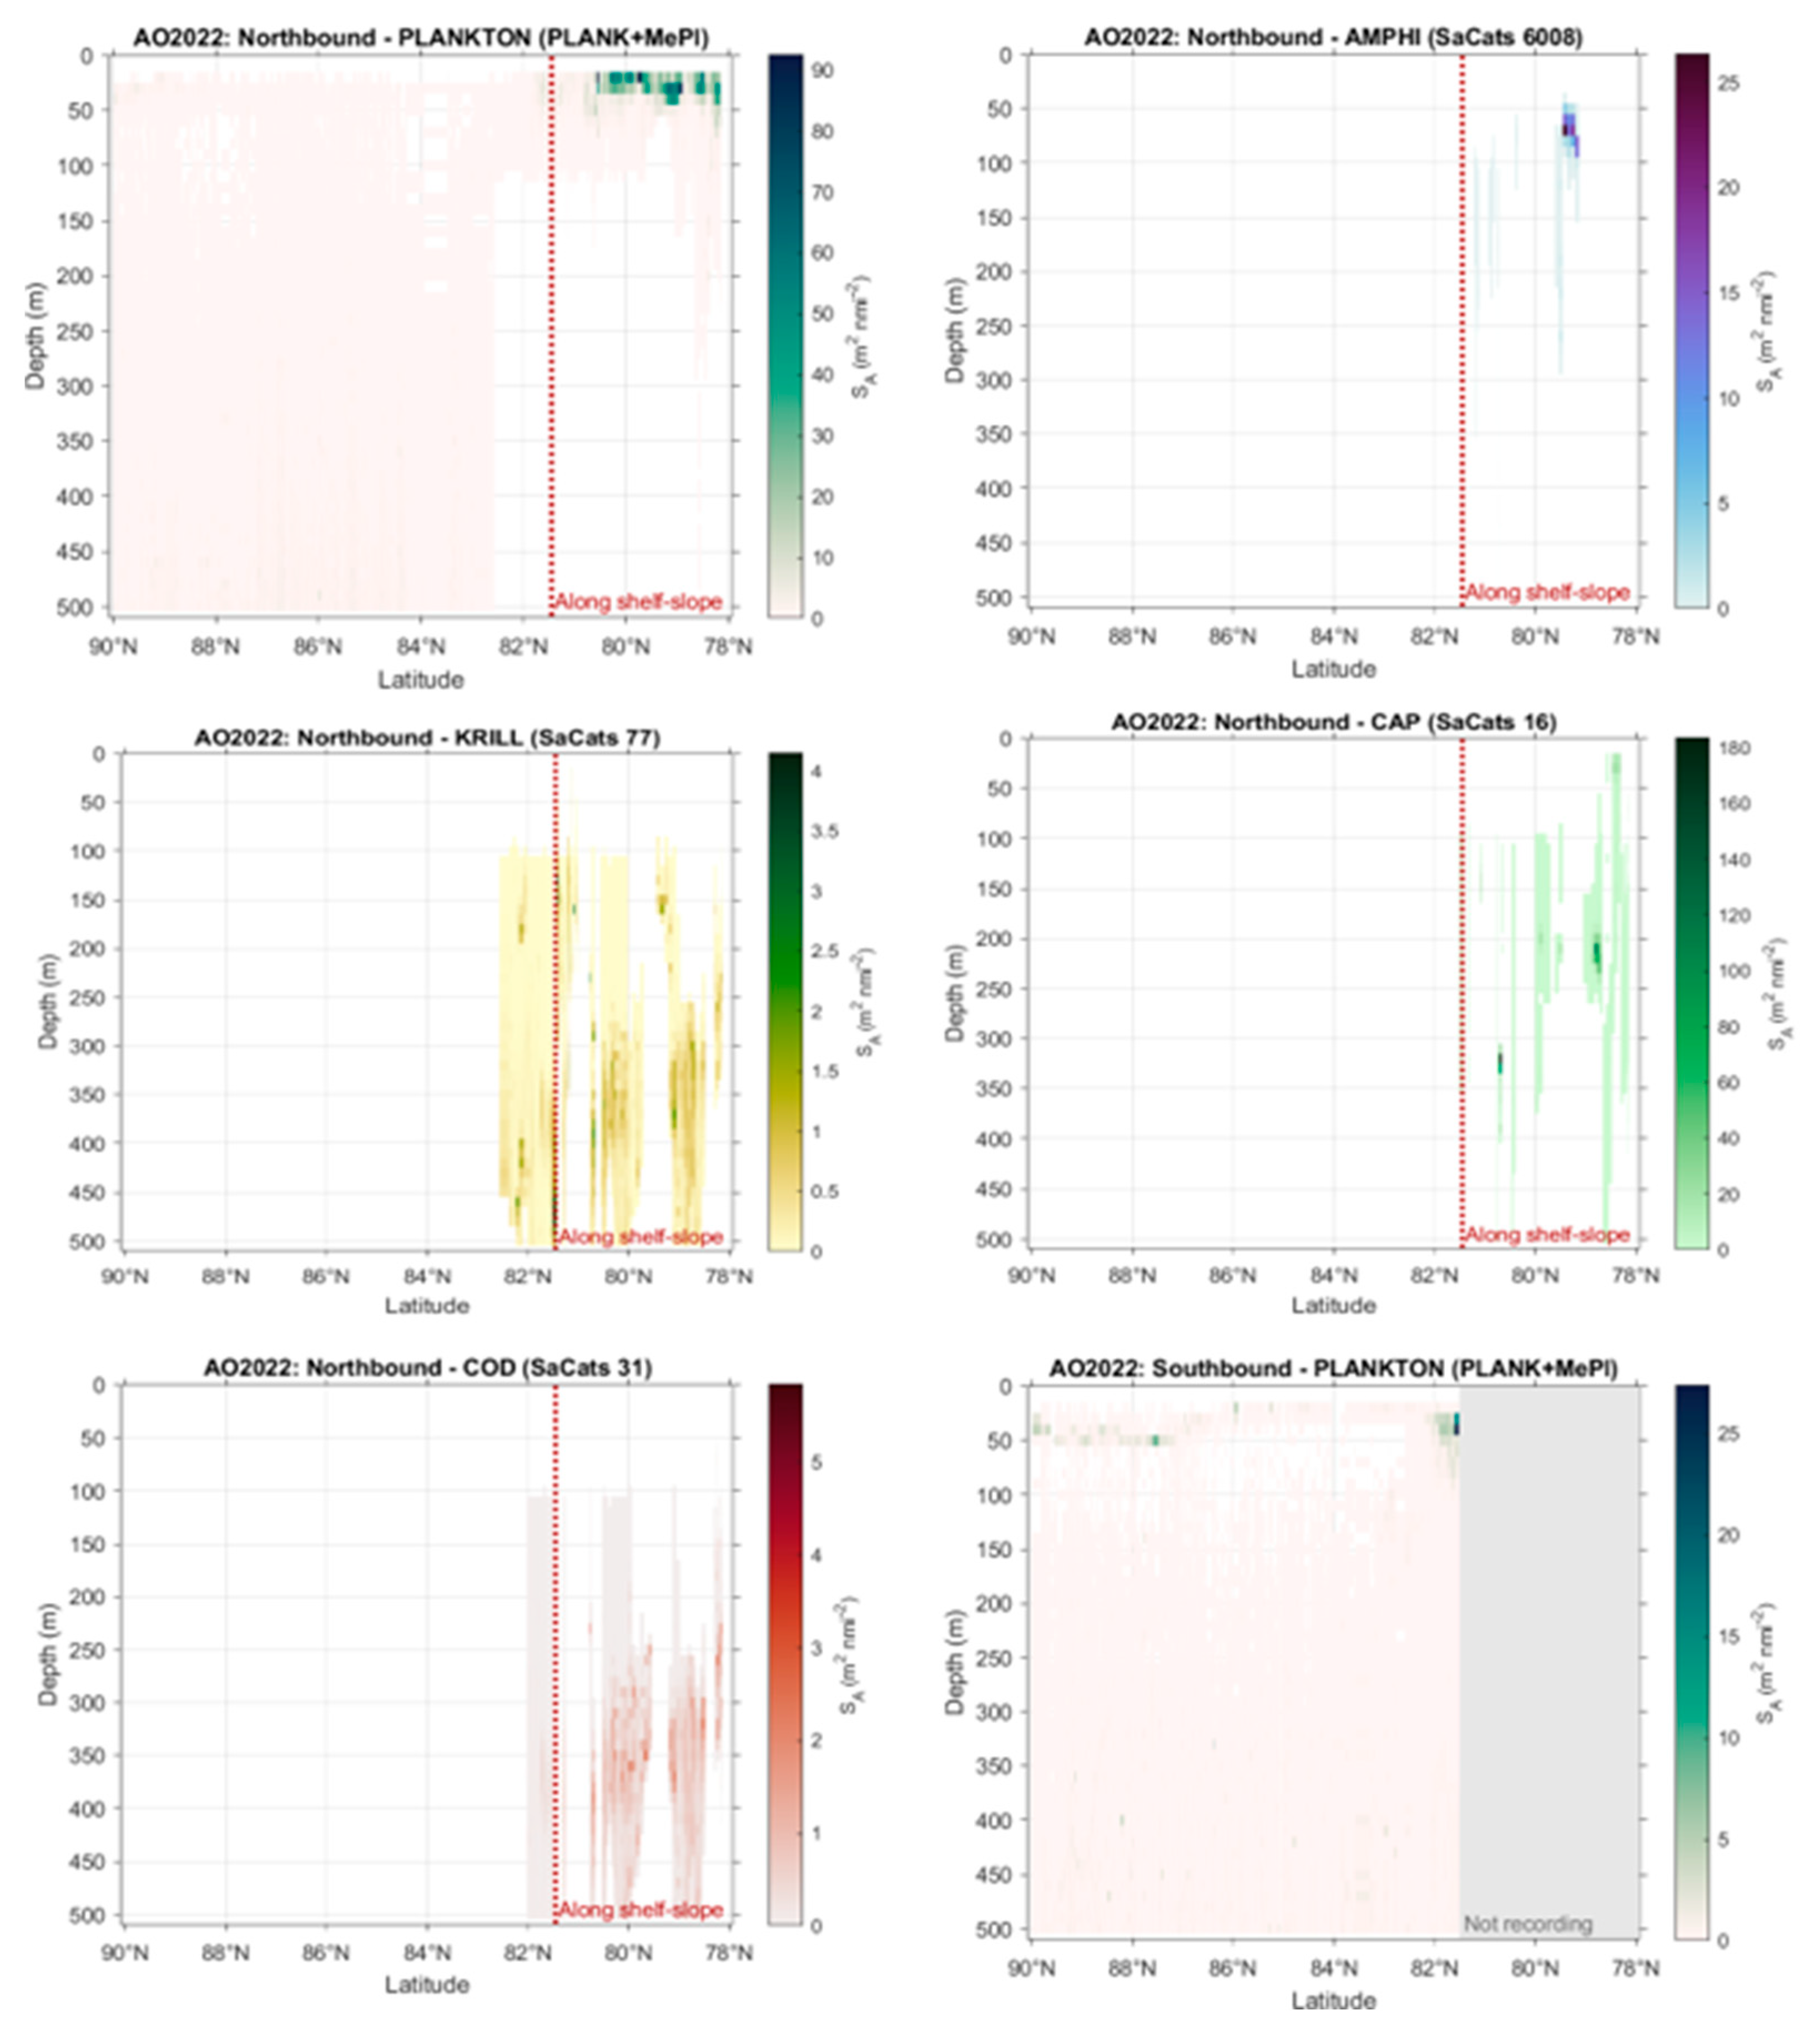
The two step post processing of the acoustic recordings using LSSS show substantial recordings of fish like capelin, cod and redfish on the shelf west and north of Svalbard in July – August 2022 (
Figure 4, 5). There were recordings of plankton near the surface on the shelf, and of a weak mesopelagic layer from the slope north of Svalbard and north to the
North Pole (
Figure 5). South from the North Pole there were some recordings of plankton and a weak mesopelagic layer. Similarly, the two step post processing of the acoustic recordings from the shorter 2023 survey gave about the same picture with good recordings of fish and plankton on the Svalbard shelf and a weak mesopelagic layer and some plankton off the shelf north of Svalbard (
Figure 4). In 2023 the area back scatter from fish on the shelf west and North of Svalbard on the way south was more than ten times the strength of the recordings in 2022. This was because there was a high abundance of young of the year fish (O – group) of capelin, cod and other species in 2023.
4. Discussion
By use of a rather time consuming and quite labour intensive two step post processing procedure we have been able to provide rather coherent results of the distribution of plankton, fish and mesopelagic organisms in the Arctic Ocean, from the Svalbard shelf to the North Pole. We have taken advantage of the state-of-the-art acoustic equipment and sampling devices that can be operated from R/V “Kronprins Haakon”, and through the LSSS system been able to delete noise from ice breaking and other disturbances. Through the KORONA module and the plankton mode of the LSSS system, and the information obtain from directed trawl and plankton net sampling, we have been able to convert the recordings to nautical area back scattering strengths to biological taxa as plankton and fish, to plankton categories as amphipods and euphausiids, and even to fish species as capelin, cod and redfish.
The second post processing gave added value in the conversion of the area back scattering to the biological units including taxa, families or specific species. This was facilitated by the KORONA facility which enabled separation of the area back scattering to crustacean families as amphipods and euphausiids, and likewise to fish species as capelin and cod. The latter was also done manually during the post processing onboard, but with more certainty during the second post processing based on the separation of the back scattering objects on the LSSS display. Especially, when substantial recordings of young-of-the year fish were encountered on the way south on the shelf and along the western coast of Svalbard, the KORONA based separation of the recordings was very useful. Often such recordings are difficult to separate during manual allocation of the area back scattering values.
Based on our standardization and description, the overall results from the surveys would likely have been quite similar if the echo recordings had been scrutinized by different teams. However, differences may also have occurred because of substantial subjective elements in the scrutinizing process, in spite of a rather strict protocol for how the process should be carried out. Even if this is a well-known element in the marine acoustic survey process, there are few studies addressing the subjectivity in allocation of acoustic recordings to taxa, families and species during marine acoustic surveys. Korsbrekke and Misund [
21] found substantial heterogeneities in the judging of acoustic records between different teams. In a recent study Fall et al. [
22] found that seven teams scrutinizing the same data from Barents Sea acoustic and trawl surveys largely agreed on the total acoustic energy attributable to marine organisms, but there was significant variation in how the teams split this energy to different categories of marine organisms. This was mainly caused by differences in applied thresholds for separating fish and plankton recordings among the teams, as well as disagreements in species classification. Quite remarkably, the effect of the teams either dominated or was of the similar magnitude as the variability between segments when scaled up to the number of acoustic segments in a typical survey. Fall et al. (2024) argues that further standardization of the scrutinizing process is needed to reduce the variability among different teams in allocation of acoustic energy to different categories of marine organisms. Application of algorithms with elements of machine learning as the KORONA module in LSSS or the krill separation algorithm in Echoview [
12] will help standardizing the allocation of area back scattering strengths to different categories of marine organisms.
There is a certain element of machine learning built into the KORONA module of LSSS enabling allocation to taxa, categories, and even species. In future development of post processing systems, such modules could be developed further based on modern principles of machine learning and quite possibly also artificial intelligence. Instead of the quite laborious two step post process presented here, future processing of acoustic recordings should be based on giving initial boundary conditions as ocean area to be surveyed, depths to be anticipated for given geographic positions, and taxa, categories and species of plankton and fish expected to be recorded. Biological information from aimed trawling and plankton nets could be entered underway. Then the future post processing system should be able to covert the volume back scatter recorded from the echo sounder unit to nautical area back scattering for different taxa, categories and species in the area, and finally to biomass of the taxa, categories and fish species in the area surveyed. In future post processing systems, user friendliness should be prioritized. Existing systems are quite user and data capacity demanding, with numerous options and settings to consider before starting to use the systems. For basic survey use the number of settings and options should be reduced. Hopefully such a development will result in systems that contribute to better monitoring of marine ecosystems both in polar waters and other challenging areas.
As evident from our study, much of the scrutinising process onboard was about removing sections with icebreaking induced noise. The allocation of area back scattering strength to taxa, families and species was rather straight forward, however. In boreal waters with a higher diversity the allocation to taxa, families and species of marine organisms may be more complicated. And in tropical waters with a regionally high diversity, it is necessary to group the allocation to just a few taxa and family groups like plankton, pelagic group I (often clupeoids, anchovies, sardines), a pelagic II group (carangids, mackerels etc), and a demersal group (groupers etc.). With a development of postprocessing systems as outlined above, hopefully there will be better resolution in the allocation of area back scattering strengths to different marine organisms even in areas with a higher diversity. With an increasing pressure on the living marine resources of the world, such a development may help advising on sustainable fisheries [
26].
Author Contributions
Conceptualization, OAM, HH and RK; methodology, OAM, VS, and RK; software, RK; validation, OAM, VS, and RK; formal analysis; AN, VS, and OAM; visualization, AN; writing – original draft preparation, OAM; writing – review and editing, OAM, AN, VS, RK and HH; supervision, RK and HH; project administration, HH; funding acquisition, OAM and HH.
Funding
The expeditions were supported by the Ministry of Foreign Affairs, the Fram Centre Project Sustainable Development of the Arctic Ocean (SUDARCO), the Research Council of Norway Bottom Sea ice Respiration and nutrient Exchanges Assessed for THE Arctic (BREATHE), and the Norwegian Polar Institute.
Data Availability Statement
The cruises from which the data analysed in this study are found in reported by Dodd et al., 2022 [
17] and Hop et al., 2023 [
19].
Acknowledgements
We thank captains and crews of RV Kronprins Haakon (July – August 2022, August 2023).
Conflicts of Interest
the authors declare no conflicts of interests.
Abbreviations
The following abbreviations are used in this manuscript:
| AO2022 |
Arctic Ocean cruise 2022 |
| AO2023 |
Arctic Ocean cruise 2023 |
| CAO |
Central Arctic Ocean |
| IMR |
Institute of Marine Research |
| KPH |
R/V “Kronprins Haaakon” |
| NASC |
nautical area back scattering strength, sA with the unit (m2/(nautical mile)2
|
References
- Foote, K.G. Acoustic scattering by marine organisms. In Encyclopedia of Ocean Sciences (Third edition); Cochran, K., Bokuniewics, H., Yager, P.L., Eds.; Academic Press, 2019; pp. 260-273. [CrossRef]
- Holliday, D.V.; Pieper, R.E.; Kleppel, G.S. Determination of Zooplankton size and distribution with multifrequency acoustic technology. J. Cons. 1989, 46, 52–61. [Google Scholar] [CrossRef]
- Misund, O. A. Underwater acoustics in marine fisheries and fisheries research. Rev. Fish Biol. Fish. 1997, 7, 1–34. [Google Scholar]
- Simmonds, E. J and MacLennan, D. N. Fisheries Acoustics: Theory and Practice, 2nd edn. Fish and Fisheries Series, Blackwell Publishing, Oxford, 2005, 456 p.
- Dragesund, O.; Olsen, S. On the possibility of estimating year-class strength by measuring echo-abundance of O-group fish. FiskDir. Skr. Ser. Havunders. 1965, 13, 48–62. [Google Scholar]
- Foote, K.G. 1987. Fish target strengths for use in echo integrator surveys. J. Acoust. Soc. Am. 1987, 82, 981–987. [Google Scholar] [CrossRef]
- Blindheim, J. , Eide, P.K., Knudsen, H.P. and Vestnes, G. A ship-born data logging and processing system for Acoustic Fish Surveys. Fish. Res. 1982, 1, 141–153.
- Knudsen, H.P. Long-term evaluation of scientific-echosounder performance. ICES J. Mar. Sci. 2009, 66, 1335 – 1340.
- Mitson, R.B. and Knudsen, H.P. 2003. Causes and effects of underwater noise on fish abundance estimation. Aquatic Living Resources, 16: 255 – 263.
- Knudsen, H.P. The Bergen Echo integrator – an introduction. J. Cons. 1990, 47, 167–174. [Google Scholar] [CrossRef]
- Foote, K.G.; Knudsen, H.P.; Korneliussen, R.J.; Nordbø, P.E.; Røang, K. Postprocessing system for echo sounder data. J. Acoust. Soc. of Am. 1991, 90, 37–47. [Google Scholar]
- Myriax. Echoview@. Hobart, TAS, 2024, Available online at http://echoview.com.
- Korneliussen, R.J. The Bergen echo integrator post-processing system, with focus on recent improvements. Fish. Res. 2004, 68, 159–169. [Google Scholar]
- Korneliussen, R.J.; Heggelund, Y.; Macaulay, G.; Johnsen, E. Acoustic identification of marine species using a feature library. Meth. Oceanogr. 2016, 17, 187–205. [Google Scholar] [CrossRef]
- Mathisen, S. (ed.). “Kronprins Haakon”, Orkana, 2019, 1-190 (In Norwegian).
- Andersen, L.N. , Chu, D.Z., Heimvoll, H., Korneliussen, R., MacCaulay, G.J. and Ona, E. Quantitative processing of broadband data as implemented in a scientific splitbeam echosounder. arXiv2021: 2014.07248. [CrossRef]
- Dodd P, Nikolopoulos A, Buckley S et al. Arctic Ocean 2022 Cruise report, 19 July-23 August 2022. 98 pp. https://hdl.handle.net/11250/3013026.
- Ingvaldsen, R.B.; Eriksen, E.; Gjøsæter, H.; Engås, A.; Schuppe, B.K.; Assmann, K.M.; Cannaby, H.; Dalpadado, P.; Bluhm, B.A. Under-ice observations by trawls and multi-frequency acoustics in the Central Arctic Ocean reveals abundance and composition of pelagic fauna. Sci. Rep. 2023, 13:1000. [CrossRef]
- Hop H, Wold A, Misund O (eds.). NPI Arctic Ocean Cruise II. 1-29 August 2023. 98 pp.
- Midttun, L.; Nakken, O. On acoustic identification, sizing and abundance estimation of fish. FiskDir. Skr. Ser. Havunders. 1971, 16, 36–48. [Google Scholar]
- Korsbrekke, K.; Misund, O.A. On subjectivity in the judging of acoustic records: comparison of degree of homogeneity inn allocation of echo values by different teams. International Council for the Exploration of the Sea, Copenhagen, 1993.
- Fall, J.; Gjøsæter, H.; Tvete, I.F.; Aldrin, M. Classification of acoustic survey data: A comparison between seven teams of experts. Fish. Res. [CrossRef]
- Stanton, T.K.; Wiebe, P.H.; Chu, D.; Goodman, L. Acoustic characterization and discrimination of marine zooplankton and turbulence. ICES J. Mar. Sci. 1994a.51, 469–479. [CrossRef]
- Stanton, T.K.; Wiebe, P.H.; Chu, D.; Benfield, M.C.; Scanlon, L.; Martin, L.; Eastwood, R.L. On acoustic estimates of zooplankton biomass. ICES J. Mar. Sci. 51, 505–512. [CrossRef]
- Demer, D.A.; Conti, S.G. Validation of the stochastic distorted wave Born approximation model with broad bandwidth total target strength measurements of Antarctic krill. ICES J. Mar. Sci. 2003, 60, 625–635. [Google Scholar] [CrossRef]
- Misund, O.A. Why should scientists lead? To underpin policy on marine and polar ecosystems. ICES J. Mar. Sci. 2024, 81, 823–832. [Google Scholar] [CrossRef]
|
Disclaimer/Publisher’s Note: The statements, opinions and data contained in all publications are solely those of the individual author(s) and contributor(s) and not of MDPI and/or the editor(s). MDPI and/or the editor(s) disclaim responsibility for any injury to people or property resulting from any ideas, methods, instructions or products referred to in the content. |
© 2025 by the authors. Licensee MDPI, Basel, Switzerland. This article is an open access article distributed under the terms and conditions of the Creative Commons Attribution (CC BY) license (http://creativecommons.org/licenses/by/4.0/).