Submitted:
07 March 2025
Posted:
10 March 2025
You are already at the latest version
Abstract
The lack of an in-depth understanding of electrical conduction behaviour in anisotropic carbon fibre-reinforced laminates was reflected by the fact that there was no measurement standard. Various ad hoc experimental techniques were used, involving a range of extrinsic parameters with little or no rigorous control. Not only were the widely varying values of electrical conductivity, if not incorrect values, generated, but also the effects of extrinsic parameters were attributed erroneously to those of intrinsic parameters. This predicament was compounded by different techniques used in measurements of volume and surface electrical conduction. This paper formulated the most effective experimental method, using two well-argued solid electrodes, to evaluate electrical conduction with rigorous control of all extrinsic parameters. Its main objectives were to investigate anisotropic volume and surface electrical conduction with focus on the effects of electrode-specimen contact resistance, clamping pressure, conductive paint, contact face preparations, lay-ups, and specimen dimensions. Unique results and data trends provided the step-changing understanding of electrical conduction such that the contributions of extrinsic factors were clearly established. The specifical findings showed that (1) 2-probe method was the only viable technique to measure both volume and surface conductivities, (2) all conductivity values were dependent on clamping torques and contact face machining, (3) the conductive paint enhancement effect was an artefact, and (4) obtaining surface conductivities by multiplying volume conductivities with laminate thickness was incorrect.
Keywords:
Anisotropic electrical conduction
; solid electrode
; 2-probe method
; volume conductivity
; surface conductivity
; extrinsic factor
; conductive paint
; clamping pressure
1. Introduction
The widely spread applications of continuous carbon fibre-reinforced composite laminates in aerospace, automotive, wind energy, and marine industries are well known mostly for their superior specific strength and stiffness in addition to weight savings. Further explorations of these high performance materials for their multi-functionalities through their electrical conduction have attracted a lot of attention in applications such as electromagnetic interference (EMI) shielding [1,2], lighting strike protection [3,4,5], built-in damage detection techniques [6,7,8,9,10,11], electro-thermal de-icing systems [12], composite antennas [13], high-speed composite electromagnetic rotors [14], and electrification of aircraft components [15]. While the only volume electrical conduction was required in some of these applications [4,5,6,7,8,9,10,11,12], the rest [1,2,3,13,15] desired both surface and volume electrical conduction. Part of major difficulty for structure designers to achieve multi-functionalities cost-effectively in these anisotropic laminates stemmed from not only the lack of established and consistent methodology for the evaluation of both volume and surface electrical conduction but also the lack of rigorous control of measurement variables and conditions. Because of these, there was at present a paucity of reliable experimental data and data trends in electrical conduction of anisotropic carbon fibre-reinforced polymers (CFRP), especially carbon/epoxy laminates.
The lack of a measurement standard for electrical conduction in anisotropic CFRP has led to numerous experimental techniques being used, each involving different types and number of electrodes, in addition to a large range of extrinsic parameters. The combinations in these ad hoc techniques included vastly different electrode types (solid board, flexible foil, and brushed liquid paint) [16], various contact conditions between electrodes and specimen contact faces [15], different electrode-probe linkages for foil or paint electrodes [16], with/without clamping torques [3], and with/without conductive paint [8,15]. While the use of solid electrodes was most popular, the 2-probe and 4-probe measurement methods (aka 2PM and 4PM) [11] were widely used. For the 4PM technique used in the volume electrical conduction measurements, composite materials at contact faces for current and voltage probes were simply not the same, which was the significant fault of 4PM. In addition, the randomly selected distances between the current and voltage probes became the additional variables in surface conduction measurements [8]. The lack of rigorous control for measurement conditions was reflected through the routine use of conductive paint and through randomly applied, unknown in many cases, clamping torques in the case of solid electrodes. Both conditions were shown to significantly affect the electrical conductivities of woven fabric-based carbon/epoxy laminates in both in-plane and TTT directions [17]. These salient features not only created very significant variations in reported electrical conductivity values for similar carbon/epoxy laminates, but also made comparisons meaningless, as they were generated with different techniques under different measurement conditions.
In this paper, a systematic development of experimental method for evaluating both surface and volume electrical conduction in commercial-grade carbon/epoxy laminates was presented, including rigorous control of key extrinsic parameters and valuable insights into measurement conditions. The objectives were to formulate a solid electrode-based method for both surface and volume electrical conduction measurements at room temperature, with rigorous control for contact clamping torque, conductive paint, specimen size (i.e. coupon specimens of three or four different lengths), and preparation of as-manufactured laminate surfaces. This rigorous overall control was extended to the prior knowledge of fibre volume fractions of the used laminates, as the latter affected electrical conduction mechanisms. The findings obtained through robust analysis of vast amounts of data demonstrated success of the formulated methodology and made a significant contribution to the knowledge and in-depth understanding of electrical conduction in all three directions of anisotropic CFRP in UD and other lay-ups. Before this work, electrical conduction of UD carbon/epoxy laminates in the TTT direction was regarded to be the same as that of the in-plane transverse direction [8,18]. It was shown here that such understanding was practically incorrect and contradicted the present results. The simplicity of this overall experimental set-up and the rigour of overall control for extrinsic parameters paved the way for this methodology to be standardised in the future. In addition, the present accurately and reliably determined electrical conductivity data will aid a study of lightning strike damage and EMI shielding effectiveness of damage-tolerant carbon/epoxy laminate enclosures.
2. Materials and Methods
2.1. Carbon/Epoxy Specimens and Preparations
Carbon/epoxy laminates were made of UD tape prepregs, which contained 12k PAN-based Grafil 34-700 carbon fibres and LTM45 epoxy resin. Several laminate panels of 300×300 mm were laid up in UD, symmetrical cross-ply (CP) and symmetrical quasi-isotropic (QI) lay-ups, with a cured ply thickness of 0.128 mm. Lay-ups of 16 and 32 ply CP laminates were in (00/900)4s and (00/900)8s, respectively, whereas those of QI laminates were in (450/00/–450/900)2s and (450/00/–450/900)4s. All the laminate panels were cured in an autoclave at 600C under a pressure of 0.62 MPa (90 psi) for 16 hours to have a nominal thickness of 2 and 4 mm, respectively. A nominal value of electrical conductivity is 1.4x10⁻¹² S/m for LTM45 epoxy resin [11] and is 55556 S/m for Grafil 34-700 carbon fibre filaments [19], though it was not clear whether the fibre measurements were made to individual filaments or fibre tows.
One rigorous control of key variables was to ensure that all cross-sectional contact faces of each specimen in a selected measurement direction were machined to parallel. Among six faces of each specimen shown in Figure 1, four vertical cross-sectional contact faces were cut cross sections (two pairs, front and back, left and right), whereas the top and bottom surfaces were as manufactured. To keep the amount of machining to a reasonable level, the only one pair of the two cross-sectional contact faces from each specimen was used for in-plane electrical conduction evaluation. It was worth noting that in UD laminates, the as-manufactured surfaces, the longitudinal cross-sectional faces (front and back, showing the cross sections of exposed fibre tows in their axial direction), and transverse cross-sectional faces (left and right, showing the cylindrical surfaces of exposed individual fibre tows) were distinctively different. For CP and QI laminates, the two cut cross sections were likely to be very similar, if not identical.
For preparations of individual coupon specimens, strips of specifically selected widths shown in Figure 2 were cut out of a large square panel first using a water-cooled diamond-coated bench saw (the left illustration in Figure 2) and then the cut cross sections of each strip were milled to parallel. Individual specimens of rectangular or square shapes were finally cut off the milled strips, as illustrated on the right in Figure 2. A machining of as-manufactured surfaces for the TTT volume measurements was generally not recommended, as that could alter the fibre volume fraction of the specimens. Nevertheless, to ensure two contact surfaces of a specimen to be parallel in TTT direction measurements, some selected 16-ply (about 2 mm) QI square specimens had both as-manufactured surfaces milled symmetrically as part of the measurement condition studies. The finished thickness of the panel was about 1.86 mm, and thus about half of a cured ply thickness was machined off from each surface. Examples of specimens for both in-plane and TTT measurements are shown in Figure 3. The nominal dimensions of the square specimens for TTT measurements were 10x10 mm, 20x20 mm, and 30x30 mm, respectively. The rectangular coupon specimens of 10 mm wide had the respective lengths of 10 mm, 20 mm, 30 mm, and 40 mm for measurements of both in-plane and TTT volume electrical conduction. For surface measurement specimens, the lengths of 30 mm, 40 mm, and 50 mm were used. The length of coupon specimens for the in-plane fibre direction measurements in the presently formulated method had to be limited to avoid potential global buckling under varying clamping torques. A few specimen groups were selected to have a single brush of conductive paint applied uniformly on their contact faces.
2.2. Determination of Fibre Volume Fraction Using Burn-Off Methods
Accurate values of fibre volume fractions for the present composite laminates were vital to the understanding of their electrical conduction, to some extent, aided with rule of mixtures (RoM). This was because the surface machining often altered actual fibre volume fractions of the relatively small coupon specimens. Both muffle furnace (conforming to the Procedure G of ASTM D3171-15) and thermogravimetry (TGA) (conforming to ASTM E1131-08) burn-off tests were used to determine the respective weight fractions of the laminate samples due to that the outcome of each method was dependent on both temperature and heating rate used. Thus, neither muffle furnace (isothermal under constant temperature) nor TGA (non-isothermal with constant heating rate) alone allowed accurate results to be obtained outright. Additionally, the former method that allowed relatively large composite samples (in hundreds of milligrams to grams) to be used was more likely to preserve faithfully as-manufactured fibre volume fractions. Nevertheless, the latter method that permitted only small samples (in tens to a hundred milligrams) allowed thermal history responses to be available at the end of tests, which was vital to effective identification of critical temperatures, at which resin sublimation started and completed.
A muffle furnace testing took place in air, requiring a setting of a constant temperature and duration, in addition to a ramp rate. To achieve maximum burn-off of epoxy resin and to retain carbon fibres without sublimation, several groups of disk specimens of about 30 to 250 mg each were tested using various temperatures from 500°C up to 600°C with an increment of 250C with duration of either three hours or 4 hours at each temperature. These extensive tests were aided with the corroborative SEM observations of residues to ensure that resin was completely removed. With the known fibre and resin densities (ρf and ρm), a fibre volume fraction Vf was calculated from the accurately determined residual weight fraction Wf via Equation (1):
TGA tests also took place in air with a constant heating rate of 5 °C/min. The upper limit temperature was set from 540°C to 630°C with an increment of 100C with an average sample weight of about 32 mg. The average fibre volume fraction of about 61% was obtained for these laminates.
2.3. Method Development for Surface and Volume Electrical Conduction Measurement
The effective development of a methodology for evaluating electrical conduction in anisotropic CFRP must meet five key challenging requirements. The first one was that an experimental set-up must be repeatable, reliable, consistent, and relatively simple. In this regard, solid copper-board electrodes were the only viable electrode choice to meet the requirements. Although conductive paint/paste or flexible copper/aluminium foils [16], as disposable electrodes, offered the advantages of avoiding machining of specimen contact faces and not requiring clamping torques, they lacked basic repeatability and hence reliability.
The second one was a fundamental understanding of volume conduction mechanisms in CFRP due to their anisotropic nature. Generally, there were two volume conduction mechanisms in two orthogonal planes. One, for the in-plane fibre direction, was that a conduction path network was formed by conductive carbon fibre tows. The other for the TTT direction as well as the in-plane transverse direction in UD laminates was that a conduction network was dominated by tunnelling-through of insulative resin, though there were reports [9,20] claiming that such network was formed by randomly distributed fibre-to-fibre contact points. The effectiveness of this latter network could be affected by other intrinsic factors such as fibre volume fraction [9,12], lay-up [8,20], fibre waviness [20] and manufacturing-related consolidation pressures [6,7]. These conduction mechanism characteristics were related to the respective independent pairs of contact faces, as shown in Figure 1, which in turn provided vital guidance for how many and where current and voltage probes/electrodes should be arranged.
The third one was that in the case of volume electrical conduction, both current and voltage probes/electrodes must be placed on contact faces of a specimen, which were of identical material pattern or nature, in which in turn they appeared only in pairs, as shown in Figure 1. This was essential to the validity of electrical conduction measurements. Consequently, 2PM was the only viable arrangement for the volume electrical conduction measurements when current supply and pick-up of voltage drops were shared through the same electrodes in such a way that two probes/electrodes were either placed on cut cross sections at the ends of a specimen (front and back or left and right in Figure 1) for the in-plane measurements or on surfaces (top and bottom) for the TTT measurements [6]. However, if the current probes remained at the cross sections and the voltage probes were placed at separate locations in volume electrical conduction measurements (4PM), they could be placed only on the surface faces. Such arrangement, common for isotropic and homogeneous materials, was due to the lack of understanding of the anisotropic construction of fibre-matrix mixtures in CFRP, which dominated the two distinctively different volume conduction mechanisms. Thus, such set-up arrangement, if used, could generate only invalid results, as the patterns of the material textures on the contact faces with the current probes were very different from those with the voltage probes. Other improper 4PM set-ups in the TTT direction were reported to measure ‘through-volume’ electrical conduction [21], which corresponded to neither of the two recognised electrical conduction mechanisms.
The fourth one was that it must be capable of measuring both surface and volume electrical conduction under the same experimental set-up. Although 4PM was suited for the surface electrical conduction measurements, it could not meet the requirements for the volume electrical conduction measurements, as discussed above. In addition, 4PM required a selection of two spacings between current-to-voltage and voltage-to-voltage probes, which could become additional variables to increase data uncertainty. A larger spacing that was desirable for achieving the greater uniformity of current density between the voltage probes [16] required much larger specimens. Having evaluated all these considerations, the combination of 2PM with solid electrodes that offered the clear advantages was chosen to form a basis of the present methodology. Its additional advantages included a feasibility of examining the effects of conductive paint on electrical conduction.
The final one was in what shape coupon specimens should be, that is, a square or rectangular shape. A choice was dictated by three factors: requirements for relatively small constant contact areas for specimens in in-plane measurements; the configuration that was more likely to lead to more accurate and reliable measurement data; and reasonable experimental costs. The advantages of the square shape were that (i) one configuration could be used for both in-plane and TTT measurement specimens so that specimen preparations could be simpler, and (ii) the values of in-plane conductivity could be theoretically independent of any in-plane dimensions, once the thickness of the square specimens was held constant. Its disadvantages included three aspects. The first aspect was that contact areas could be relatively large for ‘relatively long’ specimens and could not be constant, if a group of specimens of varying lengths needed to be measured. The second aspect, related to the first point, was that preparations of the larger cross-sectional contact areas could be more difficult so that the quality of preparations could have a greater negative influence over data accuracy and reliability. The third aspect was that specimens in the square shape for the in-plane measurements could use significantly greater amounts of materials than those in the rectangular shape, thereby increasing measurement material costs. It was due to these considerations that the rectangular shape in the present methodology was chosen for all in-planes as well as some TTT measurements.
2.4. Experimental Set-Up for Electrical Conduction Measurement
The present experimental set-up that was designed and constructed to meet the above requirements was shown in Figure 4 and it consisted of two solid copper electrode boards, a coupon specimen, a digital multimeter (Fluke 8050A model, not shown), and a precision mechanical vise whose jaw movements were driven by a digital torque wrench. The two larger commercial sandwich electrode boards had two copper plates separated by a thick insulative thermoplastic plate. Each of the outer faces of copper electrode boards was bonded onto each jaw face with double-sided adhesive tapes and their inner faces with ample space had probe leads soldered on permanently.
One key feature of the presently formulated methodology was to apply controlled clamping torques using a digital torque wrench to a coupon specimen via solid electrodes to ensure current flow, as shown in Figure 4. While clamping square specimens for the TTT measurements through the much bigger surfaces was straightforward, doing so to the much smaller cross-sectional areas of the in-plane specimens up to the same pressure levels must be exercised with caution to ensure ideally constant clamping pressures. A high-pressure value could cause thin specimens with less than perfect contact faces to bend or buckle globally, if the contact areas were very small. Non-machined contact faces could exacerbate a non-uniform distribution of micro-asperity to precipitate potentially out-of-plane bending or global buckling under the clamping torques, whereas a low value could lead to poor contact between the solid electrodes and the specimen and hence poor current flow. Thus, a recommended value of torque levels must be accompanied by a moderate ratio (less than 10 Nm) of the length to the thickness. In the present work, two digital torque wrenches, with the respective capacity range of 0.5 to 1.5 Nm and 1 to 25 Nm, were used to regulate torque levels.
To evaluate volume electrical conduction, a DC current of 10 mA up to 2 A was supplied to a clamped specimen with a length of L, a width of b and a thickness of t via electrodes for duration of 1 minute for current to settle. The apparent electrical resistance R of the specimen between the two electrodes was obtained to allow the value of electrical conductivity in S/m to be calculated using Ohm’s law in Equation (2a), along with specimen dimensions. This resistance also included the contact resistance at the electrode-specimen contact interfaces on both sides. A total of over six hundred tests were conducted on these carbon/epoxy laminate coupon specimens in UD, CP, and QI lay-ups in two (CP and QI) or three (UD) directions, with three different sizes, and mostly without conductive paint. Each group consisted of at least three specimens to ensure data repeatability.
in which J denotes current density on contact area, and ΔV voltage drop. The current density concept could be useful to dealing with correct representations of the fibre area/volume fraction of a specimen on the contact faces, as it depended on the micro-roughness and on applied clamping pressures [22], and the ratio of the length to the area [23]. This conductivity was slightly overestimated due to the inclusion of contact resistance at the electrode-specimen contact interfaces.
For surface electrical conduction, two solid square electrodes of 10 mm by 10 mm were located at the ends of each rectangular coupon specimen of width b and were separated by a length of L. The apparent surface resistance Rs of the specimen between the electrodes was measured and was used to calculate the value of surface electrical conductivity in S through Equation (2b):
2.5. Rule of Mixtures for Electrical Conductivity
For UD laminates, it was known [24] that its electrical conductivities in the in-plane fibre (kIP0), the in-plane transverse (kIP90), and the TTT directions (kTTT) could be presented by parallel and serial models of RoM, respectively, as
in which kfa denotes the electrical conductivity of carbon fibres in the axial direction, kft the electrical conductivity of carbon fibres in the transverse direction, and km the electrical conductivity of resin matrix. Equations (4) and (5) appeared to suggest that the performance of electrical conduction in the TTT direction of UD laminates was the same as that of the in-plane transverse direction due to these numerical approximations of varying degree, as kfa >> kft >> km. Although this was commonly assumed [8,18], it contradicted to the present experimental results, as shown later.
For symmetrical laminates in a lay-up of CP and QI, the one-dimensional nature of RoM implied that the current generated electrical conductance flowed in a single direction only, say, fibre or 00 direction so that current diverted into other non-fibre directions was not considered (the equipotential surface concept [25]). As a result, how many fibres that conducted current flow in the given laminate was taken care of by the concept of the efficiency factor [25]. Due to symmetry, the in-plane longitudinal electrical conductivity (kIP0) remained the same as the transverse electrical conductivity (kIP90) and was calculated by
in which the efficiency factor c is 1 for UD, 0.5 for CP and 0.375 for QI [25]. In the above derivations, it was implicitly assumed that the completely straight participating carbon fibres carried 100% current through physically invisible electrodes so that a complete uniformity of current densities at the electrode-specimen contact faces was guaranteed. In the TTT direction, the electrical conduction was expected to be completely dominated by that of resin. For the present PAN-based Grafil 34-700 carbon fibres with epoxy, along with the respective fibre volume fractions adjusted due to the varying degree of participation of conductive fibres, Equation (6) predicted that the fibre direction conductivities were 33889 S/m for UD, 8472 S/m for CP, and 5038 S/m for QI, whereas Equation (5) predicted 2.74x10⁻¹³ S/m in the TTT direction.
3. Results and Discussion
3.1. Contact Resistance in In-Plane Volume Electrical Conduction
An existence of contact resistance at the electrode-specimen contact interfaces could affect the calculations of electrical conductivity, which needed to be addressed in the present solid electrode-based methodology. This was usually achieved indirectly by deploying a group of similar specimens with varying lengths. Measured contact resistance was plotted against the ratio of length to area and then its level could be extrapolated at zero ratio. Consequently, the value of electrical conductivity could be adjusted (or increased), if necessary. Figure 5 shows the measured resistance data from symmetrical 2 mm thick QI laminates in the lengths of 10, 20, and 30 mm in both in-plane directions. Data from both the unpainted (open symbols) and painted (closed symbols) specimens fell on top of one another, forming a single linear trend with the length-to-area ratios. An interception on contact resistance axis was taken to be about 0.005 ohm at each contact interface. Clearly, contact resistance depended on the specimen length and were just a few percent for the longest ones, like the case in [3]. The present data also showed that the use of conductive paint on the contact faces made little difference to the levels of contact resistance, when conduction mechanism was dominated by carbon fibres.
In the TTT direction, the measured conductance (reciprocal of resistance) data plotted against their area-to-length ratios also formed a linear trend for each group of three different areas, as shown in Figure 6. Since both group data tended to intercept vertical conductance axis at the approximately same location, the average of 2 S could be used for both, just like the in-plane case. Nevertheless, as the contact areas here were much larger than those of the in-plane ones, these data appeared to suggest that the relative contribution of the contact resistance to the total in the TTT direction could be much greater than that in the in-plane direction due to the 2 mm length (i.e. thickness). It could also be because the interior conduction path network in the TTT direction was attributed to a random combination of tunnelling-through of tiny resin gaps between fibres and ‘fibre-to-fibre contact’, which could be dominated by the former.
3.2. Anisotropic Volume Electrical Conduction in UD Laminates
The anisotropic nature of electrical conduction was demonstrated in Figure 7, Figure 8 and Figure 9 through average electrical conductivity values, which were obtained from 4 mm thick UD laminates with a supplied current of 0.5 A and a clamping torque of 5 Nm. In the in-plane fibre direction, continuous carbon fibre tows served as a conduction path network and dominated their electrical conduction performance. The average values of 4 mm thick UD specimens in Figure 7 varied from 9155, 10762, to 9744 S/m for the respective specimens of 20-, 30-, and 40-mm length. In the in-plane transverse direction, a conduction path network was dominated by a sequence of tunnelling-through of insulative epoxy resin and transverse cross-fibre diameter conduction. The average values of electrical conductivity, as given in Figure 8, were 84, 75, to 62 S/m, respectively, which were more than two orders of magnitude smaller than those of fibre direction, as expected. In the TTT direction where measurements were conducted directly on as-manufactured surfaces, a conduction path network was theoretically viewed being the same as the in-plane transverse direction, the average values shown in Figure 9 were only 17, 17, to 15 S/m, respectively, which were considerably lower than those of the in-plane transverse direction, thereby contradicting to the present consensus. This difference between these two non-fibre directions was attributed to speculation that fibre-to-fibre gaps in the in-plane transverse direction were likely to be smaller than those in the TTT direction, due to the greater resin flow under consolidation pressure throughout curing so that tunnelling through them was relatively easier.
3.3. Surface Electrical Conduction
The electrical conduction measurements directly from as-manufactured laminate specimen surfaces led to nothing, as expected. This was because the surface plies of the specimens had carbon fibre filaments well preimpregnated by epoxy throughout the curing process in autoclave, thereby showing the insulative responses. Thus, about a half (0.068 mm) of the surface plies on the measuring surfaces of as-manufactured laminate specimens was machined off. Figure 10 shows the values of surface electrical conductivity from three different electrode-to-electrode spacing lengths of UD specimens, each under three levels of clamping torques. These values depended not only on electrode-to-electrode spacings but also on clamping torques.
Since under the present conditions, the measured surface resistance Rs reflected the contribution of a small amount of exposed carbon fibres, it could easily be envisaged that without them, Rs could be much greater than the in-plane volume resistance R, which was dominated by the conductive carbon fibre network. As a result, for anisotropic carbon/epoxy laminates, it was false to approximate the surface electrical conductivity by multiplying the value of volume electrical conductivity with the specimen thickness shown in Equation (7), as reported in [8,14]. This was significant to applications of using surface electrical conductivities or resistivities to deduce occurrences of interior delaminations.
Likewise, it could be equally risky to use a depth zeff of current penetration into the surface ply of the as-manufactured surfaces through Equation (8) in [26] to estimate surface resistance Rs, as such penetration into the laminate thickness could be met with the different conduction mechanisms.
3.4. Effect of Clamping Torque on Volume Electrical Conduction
As another key feature of this methodology, the application of clamping torques at the solid electrode-specimen contact interfaces was bound to affect electrical conduction, as surface micro-roughness and applied clamping pressures were also found in [22] to depend on current density. A thermal stress analysis of uniaxial compression of a laminate coupon specimen between two solid electrodes in [17] showed via Equation (9) that clamping pressure was positively proportional to volume electrical conductivity of the specimen.
in which R0 denotes resistance at room temperature T0, α temperature resistance coefficient in per degree, T raised temperature, P clamping pressure, Ec either fibre-direction compressive modulus in the in-plane measurements or compressive modulus of epoxy in the TTT measurements, ν12 and ν21 their major and minor Poisson’s ratios of the laminate. The coefficient α could be either positive in conductive materials such as in the in-plane directions of composite laminates, when the resistance increased with an increase in temperature due to Joule heating, or negative in non-conductive materials (in the TTT direction) when the resistance fell with an increase in temperature [27].
Figure 11 shows the in-plane electrical conductivity variations of the 4 mm thick QI specimens in three different lengths with clamping torques varying from 1 to 5 Nm. All the specimen groups demonstrated consistent parabolic trends, as suggested by Equation (9). As the contact faces of all specimens were machined to be flat and parallel, their electrical conductivity values varied by as much as 50% with the increase of clamping torques in the present torque range. Similar parabolic trends were obtained for the 4 mm thick QI specimens in the TTT direction in Figure 12.
Since the apparent values of electrical conductivity depended on the level of clamping torques, what an electrical conductivity value of the given carbon/epoxy laminates should be used as a true value for the material required further considerations. It would be inevitable that either an extrapolated value at zero clamping torque was used, as the lower end value of a range, or the value corresponding to a specific level of clamping torques was used, as the upper end (i.e. a specific torque level, say, 5 Nm). The latter value must not cause the coupon specimens to bend. Moreover, while the use of clamping torques in the present methodology was convenient, nevertheless, the use of clamping pressures could provide better indication for the response of the specimens, as different contact areas could have different clamping pressures under a given clamping torque.
3.5. Effect of Conductive Paint on Volume Electrical Conduction
The most common practice in the evaluations of electrical conduction in CFRP was to apply conductive paint or paste on the specimen contact faces with intention not only to minimise contact resistance but also to avoid the need to machine the contact faces. The responses of the contact faces of carbon/epoxy laminates to current were complex, as the contact faces without conductive paint were discrete periodically non-conductive. These non-conductive resin regions on the contact faces did not react to the current, but raised electrical contact resistance [15], whereas the conductive carbon fibres carried constricted current flow. Since this ‘partial’ electrical conduction through the cross-sections of carbon fibre tows on the electrode–contact faces reflected the true nature of the material, the use of conductive paint may dissipate thermal energy to lead to the lesser increase of temperature in the volume of the specimens, thereby showing the enhanced values of electrical conductivities. Figure 13 shows that the in-plane direction electrical conductivity values increased only by 14% for the 20 mm specimens and 21% for the 30 mm specimens. These in-plane direction enhancements for both laminates were modest and were not much greater than the respective data scatters. In the TTT direction, the averages of the laminates shown in Figure 14 had the respective enhancements of 63% and 107%. These conductive paint enhancements were significant.
Since the application of conductive paint on the contact faces of the specimens could not have altered the interior conduction path networks in either direction, these enhancements thus merely reflected the distortions of the fibre area/volume fraction representations on those faces in such a way as if the conductive areas/volumes were greater than they were, rather than the genuine performance of the specimens. Such distortions may be associated with the fact that some limited number of carbon fibre filaments that were not in contact were brought in contact through the applied conductive paint, though the contact faces of all the specimens were well machined. This speculation was further supported by the fact that the data scatters of the unpainted specimen groups were consistently greater than those of the painted groups. The present findings clearly indicate that such conductive paint enhancing effect on the values of electrical conductivities could be viewed either as an artefact or at the best as the idealised upper limits of the value ranges. Therefore, the values of the electrical conductivities obtained from the specimens with machined cross-sectional contact faces but without the aid of conductive paint should be used.
Application of conductive paint on contact faces was one practice of clearly distorting the electrical conduction performance of the laminates shown in Figure 13 and Figure 14. Machining the as-manufactured surfaces of the laminates specimens to expose some carbon fibres in both the TTT volume and surface electrical conduction measurements was another one of similar nature, as the TTT volume conductivity measured through the as-manufactured surfaces was significantly different from the machined surfaces, as shown in Figure 15, which all data were obtained from 2 mm thick QI data at a current of 0.5 A with a torque of 1.3 Nm. Nevertheless, it was very challenging in the TTT measurements for two as-manufactured surfaces to be completely geometric flat and parallel without machining, as they offered much larger contact areas with the square specimens.
3.6. Effect of Lay-Ups on Volume Electrical Conduction
The lay-up effects on volume electrical conduction in the laminate coupon specimens remained as important material issues, which must be evaluated in the design process. Such effects were of the anisotropic nature, as the electrical conduction mechanisms in both in-plane and TTT orthogonal directions were completely different. As expected, in the in-plane direction, they were relatively easy to appreciate, as shown in Table 1. The UD values of electrical conductivity were assumed to correspond to the state of the specimens with 100% colinear carbon fibres contributing to electrical conduction and thus were taken as reference for purpose of comparisons. They were shown to dwindle down from UD, CP, to QI, when the participating carbon fibres were reduced in the 00 fibre direction. In the 4 mm thick laminate cases, the measured appeared to be in reasonable agreements with predictions of Equation (6) for 20 mm and 30 mm length data. However, for the 2 mm thick QI data, the substantially higher measured values were obtained. This suggested that there might have been some cross-ply contacts between individual 00 or 900 and 450 or –450 neighbouring fibre tows as well as fibre-to-fibre connections in the same fibre tows, contributing to the electrical conduction network.
In the TTT direction, the electrical conduction mechanism was dominated sequentially by tunnelling-through of epoxy and less conductive carbon fibres in the diametric direction, with a nominal electrical conductivity of only around 333 S/m [28]. The lay-up effects shown in Table 2 were much more difficult to observe, as there was no clear trend across both data from both thicknesses. For the 2 mm thick laminates, spreading carbon fibres out through all four ply groups resulted in an increase in electrical conduction in three out of four specimen length groups. For the 4 mm thick laminate data, the UD values of electrical conductivity were significantly greater than those of CP or QI specimens. That the QI values were consistently greater than the CP ones due probably to the same reasoning as above.
3.7. Effect of Specimen Sizes on Volume Electrical Conduction
3.7.1. Length Effect on In-Plane Electrical Conductivities
The establishment of electrical conduction data trends derived from coupon specimens was important to a deeper understanding of electrical conduction characteristics in large composite components in their exploitations for multi-functionality, as electrical conductivity was dependent on the dimensions of the specimens [3,5]. Figure 16 shows the variations of the values of in-plane electrical conductivity from the 4 mm thick UD specimens obtained with a current of 0.5 A under a clamping torque of 5 Nm. It appeared to show a slight initial nonlinear transition, followed by a steady rising region. That the two parts of the data trend were not linked up was because specimen lengths at which the electrical conduction transition occurred were not established experimentally. Theoretically, such an initial transition must occur. Figure 17 shows similar data trends from the 4 mm thick CP and QI specimens but both with significantly steady rising regions.
3.7.2. Area Effects on TTT Electrical Conductivities
Figure 18 shows the variations of the TTT electrical conductivity values with the rectangular contact areas from both 4 mm thick UD and QI specimens obtained with a current of 0.5 A under a clamping torque of 5 Nm. These data appeared to indicate that holding the length dimension constant but varying just one dimension of the contact areas did not seem to have any effect on the values of their TTT electrical conductivities.
4. Conclusions
The most effective experimental method for evaluating both volume and surface electrical conduction in anisotropic carbon fibre-reinforced laminates was formulated using well-argued two solid electrodes with rigorous control of key extrinsic parameters such as contact face preparations of specimens, clamping torques, conductive paint, and specimen dimensions. As an additional warranty for data accuracy and reliability of the method, prior knowledge of electrode-specimen contact resistance, conduction path network, and fibre volume fraction of laminate specimens must be accompanied to ensure robustness of data analysis.
The specifical findings showed the following unique step-changing insights. (1) The presently formulated 2-probe method was the only viable method to correctly measure both volume and surface conductivities, though the latter depended on electrode-to-electrode spacings. (2) The anisotropic nature was demonstrated in laminates of all lay-ups with the in-plane fibre-direction electrical conductivities being two orders of magnitude greater than their respective in-plane transverse and TTT values, and with the in-plane transverse direction electrical conductivities in UD being several times greater than their TTT values. (3) As all conductivity values were found to depend on clamping torques, the use of multiple-level digitally controlled clamping torques over contact faces was essential to generate a range of enhanced conductivity values. In this way, the corresponding conductivity values at zero clamping torques could be obtained, if required. (4) The conductive paint enhancing effect in the volume conductivities was shown to be an artefact, as the presence of conductive paint did not alter the interior electrical conduction path networks. Therefore, if the values of electrical conductivities were required for design analysis, conductive paint should not be used on contact faces. (5) Measuring surface electrical conductivities has proven to be challenging, which will require future studies, especially, for a genuine surface conductivity from as-manufactured laminate surfaces. Nevertheless, deriving them by multiplying volume electrical conductivities with the laminate thickness was incorrect. (6) The electrical conductivity values were found to depend on specimen length but not much on contact area. (7) Machining or polishing as-manufactured laminate surfaces in the TTT measurements led to exaggerated electrical conductivity values. (8) The in-plane fibre-direction electrical conductivities were affected by lay-ups.
This comprehensive thorough investigation provided a significant physical insight into and an aid to future studies of shielding effectiveness of electromagnetic waves, lightning strikes, and electro-thermal de-icing systems. It paved the way for the present methodology to be established as a measurement standard.
Author Contributions
G.Z. conceived the research idea, acquired funding, supervised all phases of the research project, performed experiments, collected and analysed data, and wrote/reviewed the manuscript; W.S. conceived the research idea, acquired funding, and reviewed the manuscript. All authors have read and agreed to the published version of the manuscript.
Funding
Part of research work was funded jointly by Loughborough University, UK and C-Power Ltd, Tianjin, China.
Data Availability Statement
The datasets used and/or analysed during the current study are available from the corresponding author on reasonable request.
Acknowledgments
Authors acknowledge the financial support from Loughborough University and C-Power Ltd, China. The first author also acknowledges the execution of measurements by project students, N. Patel, K. Suri, V. Timofti, I. Bamgbose, and E. Mikinka.
Conflicts of Interest
The authors declare that they have no competing interests.
References
- Luo, X.; Chung, D. Electromagnetic interference shielding using continuous carbon-fibre carbon-matrix and polymer-matrix composites. Composites Part B 1999, 30(3), 227–231. [Google Scholar] [CrossRef]
- Mualli, D.; Dimitrakis, G.; Chronopoulos, D.; Greedy, S.; Long, A. Electromagnetic shielding effectiveness of carbon fibre reinforced composites. Composites Part B 2019, 173, 106906. [Google Scholar] [CrossRef]
- Cinquin, J.; Heinrich, C.; Balland, E.; Pons, F.; Gaztelumendi, I.; Vavouliotis, A.; Kostopoulos, V.; Kostagiannakopoulou, C. Volume electrical conductivity measurement on organic composite material. In Proc of the SETEC13 Conference, Germany, 2013, pp.192-204.
- Russello, M.; Diamanti, E.; Catalanotti, G.; Ohlsson, F.; Hawkins, S.; Falzon, B. Enhancing the electrical conductivity of carbon fibre thin ply laminates with directly grown aligned carbon nanotubes. Composite Structures 2018, 206, 272–278. [Google Scholar] [CrossRef]
- Khan, J.B.; Smith, A.C.; Tuohy, P.M.; Gresil, M.; Soutis, C.; Lambourne, A. Experimental electrical characterisation of carbon fibre composites for use in future aircraft applications. IET-Sci Measurement and Tech 2019, 13(8), 1131-1138.
- Irving, P.; Thiagarajan, C. Fatigue damage characterization in carbon fibre composite materials using an electrical potential technique. Smart Materials and Structures 1998, 7(4), 456–466. [Google Scholar] [CrossRef]
- Abry, J.; Bochard, S.; Chateauminois, A.; Salvia, M.; Giraud, G. In situ detection of damage in CFRP laminates by electrical resistance measurements. Composites Sci and Tech 1999, 59(6), 925–935. [Google Scholar] [CrossRef]
- Louis, M.; Joshi, S.; Brockman, W. An experimental investigation of through-thickness electrical resistivity of CFRP laminates. Composites Sci and Tech 2001, 61(6), 911–919. [Google Scholar] [CrossRef]
- Todoroki, A.; Yoshida, J. Electrical resistance change of unidirectional CFRP due to applied load. JSME Int J 2004, 47, 357–364. [Google Scholar] [CrossRef]
- Park, J.; Hwang, T.; Kim, H.; Doh, Y. Experimental and numerical study of the electrical anisotropy in unidirectional carbon fibre reinforced polymer composites. Smart Materials and Structures 2007, 16, 57–66. [Google Scholar] [CrossRef]
- El Sawi, I.; Olivier, P.; Demont, P.; Bougherara, H. Processing and electrical characterization of a unidirectional CFRP composite filled with double walled carbon nanotubes. Composites Sci and Tech 2012, 73(1), 19–26. [Google Scholar] [CrossRef]
- Yao, X.; Falzon, B.; Hawkins, S.; Tsantzalis, S. Aligned carbon nanotube webs embedded in a composite laminate: A route towards a highly tunable electro-thermal system. Carbon 2018, 129, 486–494. [Google Scholar] [CrossRef]
- Galehdar, A.; Rowe, W.; Ghorbani, K.; Callus, P.; John, S.; Wang, C. The effect of ply orientation on the performance of antennas in or on carbon fiber composites. Progress in Electromagnetic Research 2011, 116, 123–136. [Google Scholar] [CrossRef]
- Li, W.; Qiu, H.; Zhang, X.; Cao, J.; Yi, R. Analyses on electromagnetic and temperature fields of super high-speed permanent-magnet generator with different sleeve materials. IEEE Transactions on Industrial Electronics 2014, 61(6), 3056–3063. [Google Scholar] [CrossRef]
- Zantout, A.; Zhupanska, O. On the electrical resistance of carbon fiber polymer matrix composites. Composites Part A 2010, 41(11), 1719–1727. [Google Scholar] [CrossRef]
- Abid, R. Electrical characterisation of aerospace grade carbon-fibre-reinforced polymers, Thesis PhD, Cardiff University, Cardiff, UK, 2015.
- Zhou, G.; Mikinka, E.; Bao, X.; Sun, W. Electrical conduction investigation of pre-stressed carbon/epoxy fabric laminates heated by ampere-level currents. Functional Composite Materials 2023, 4, 1–13. [Google Scholar] [CrossRef]
- Takahashi, T.; Hahn, H.T. Investigation of temperature dependency of electrical resistance changes for structural management of graphite/polymer composite, Journal of Composite Materials 2011, 45(25), 2603-2611.
- Chung, D.; Eddib, A. Effect of fiber lay-up configuration on the electromagnetic interference shielding effectiveness of continuous carbon fiber polymer-matrix composite. Carbon 2019, 141, 685–691. [Google Scholar] [CrossRef]
- Yu, H.; Heider, D.; Advani, S. A 3D microstructure based resistor network model for the electrical resistivity of unidirectional carbon composites. Composite Structures 2015, 134, 740–749. [Google Scholar] [CrossRef]
- Karakassides, A.; Karakassides, A.; Konstantinidou, M.; Paipetis, A.S.; Papakonstantinou, P. Enhanced out of plane electrical conductivity in polymer composites induced by co2 laser irradiation of carbon fibers. MDPI-Applied Sciences 2020, 10, 3561. [Google Scholar] [CrossRef]
- Coste, J.; Pechery, P. Influence of surface profile in polymer-metal contact charging. Journal of Electrostatics 1981, 10, 129–136. [Google Scholar] [CrossRef]
- Tse, K.W.; Moyer, C.A.; Arajs, S. Electrical conductivity of graphite fiber-epoxy resin composites. Materials Science and Engineering 1981, 49, 41–46. [Google Scholar] [CrossRef]
- Knibbs, R.; Morris, J. The effects of fibre orientation on the physical properties of composites. Composites 1974, 5(5), 209–218. [Google Scholar] [CrossRef]
- Harris, B. Engineering Composite Materials, 2nd ed.; Institute of Materials Communications: London, UK, 1999. [Google Scholar]
- Hart, R.J.; Zhupanska, O.I. The role of electrical anisotropy and effective conducting thickness in understanding and interpreting static resistance measurements in CFRP composite laminates. Journal of Composite Materials 2020, 54(7), 867–882. [Google Scholar] [CrossRef]
- Kupke, M.; Schulte, K.; Schüler, R. Non-destructive testing of FRP by D.C. and A.C. electrical methods, Composites Sci and Tech 2001, 61, 837-847.
- Pierson, H.O. Handbook of carbon, graphite, diamond, and fullerenes: properties, processing, and applications; Noyes Publications: New Jersey, USA, 1993. [Google Scholar]
Figure 1.
Six faces of continuous fibre-reinforced laminate specimens in UD and CP lay-ups.
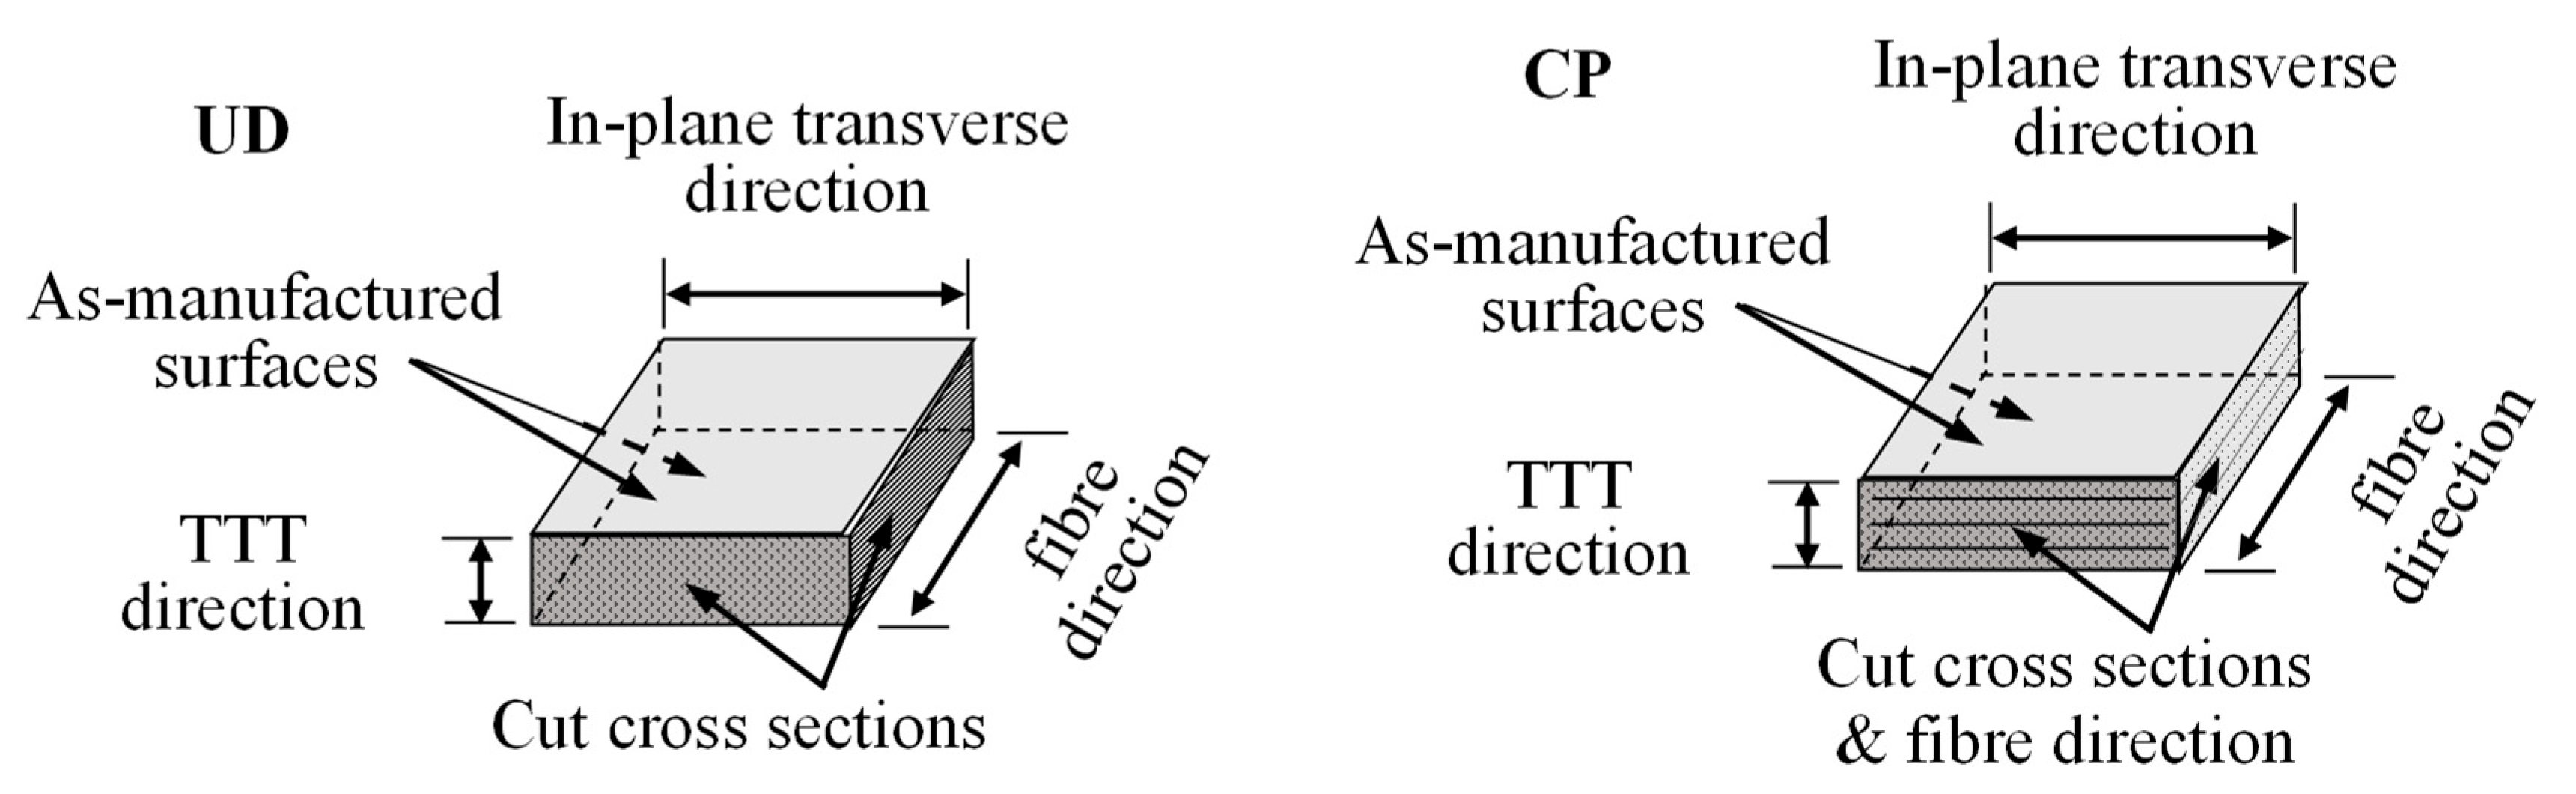
Figure 2.
Scheme of individual specimen cutting from panel, strips, to specimens.
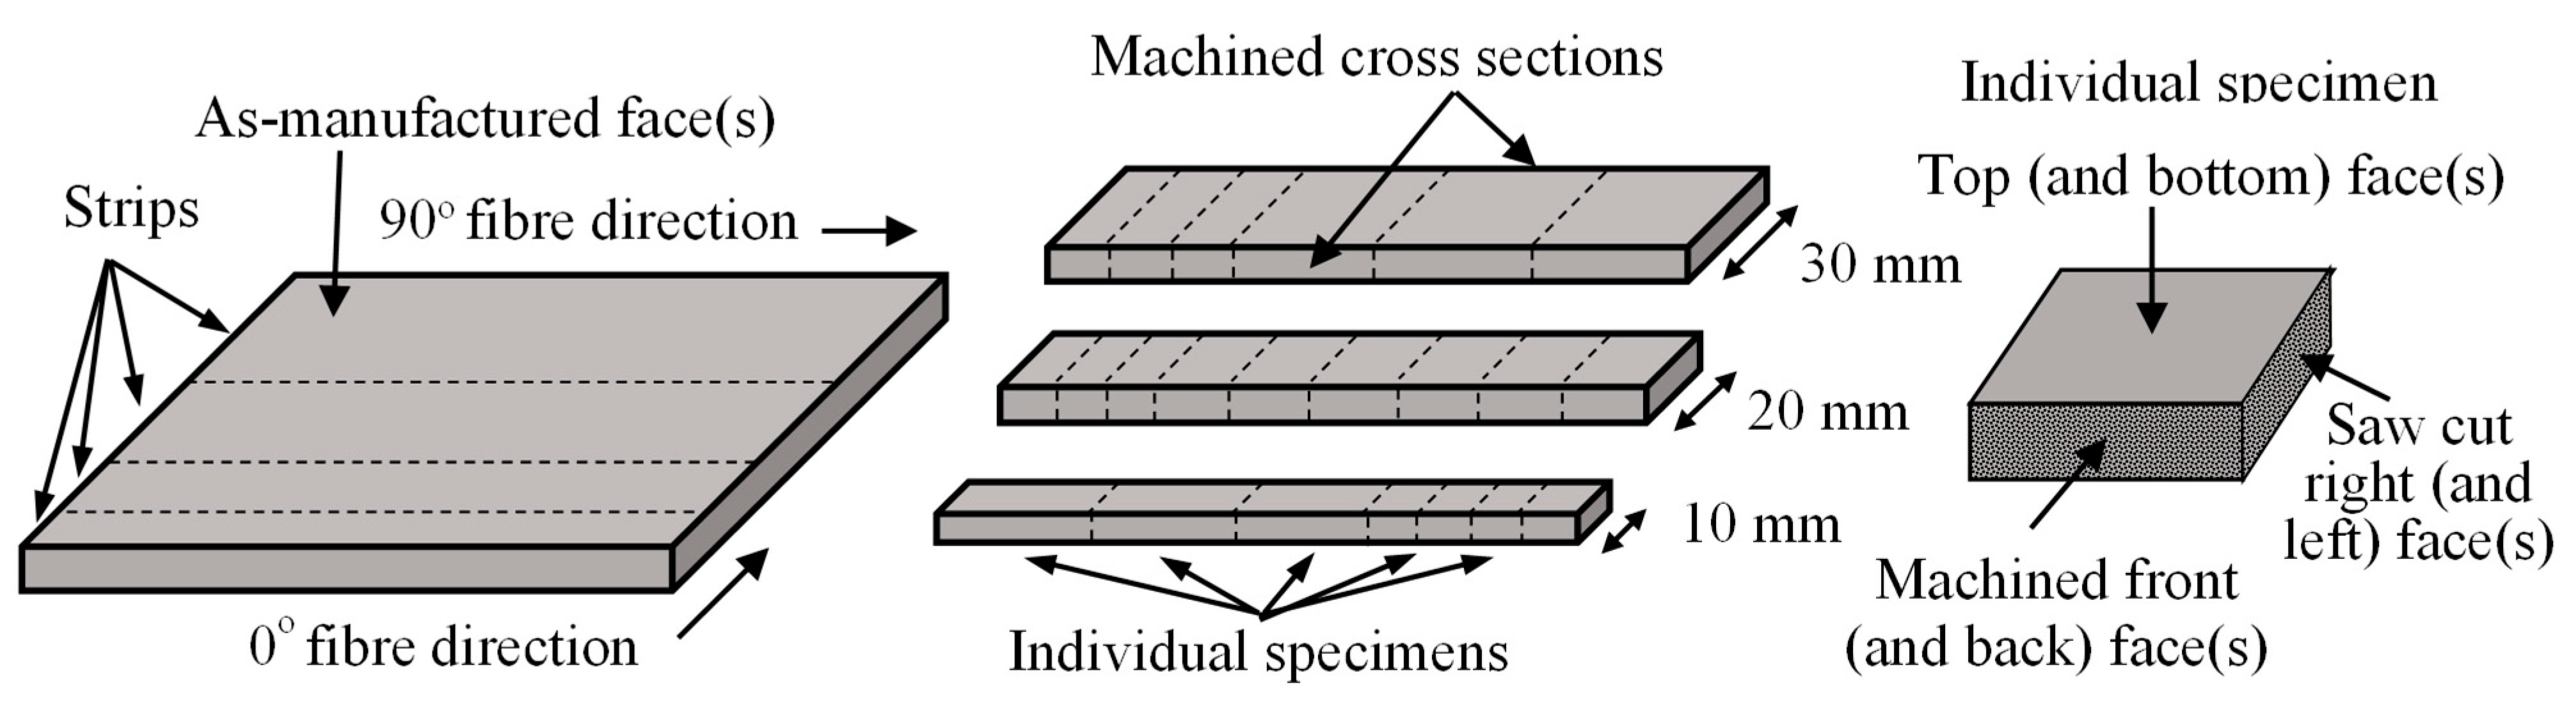
Figure 3.
Illustration of carbon/epoxy coupon specimens for electrical conduction measurements in (a) in-plane direction and (b) through-the-thickness direction.
Figure 3.
Illustration of carbon/epoxy coupon specimens for electrical conduction measurements in (a) in-plane direction and (b) through-the-thickness direction.
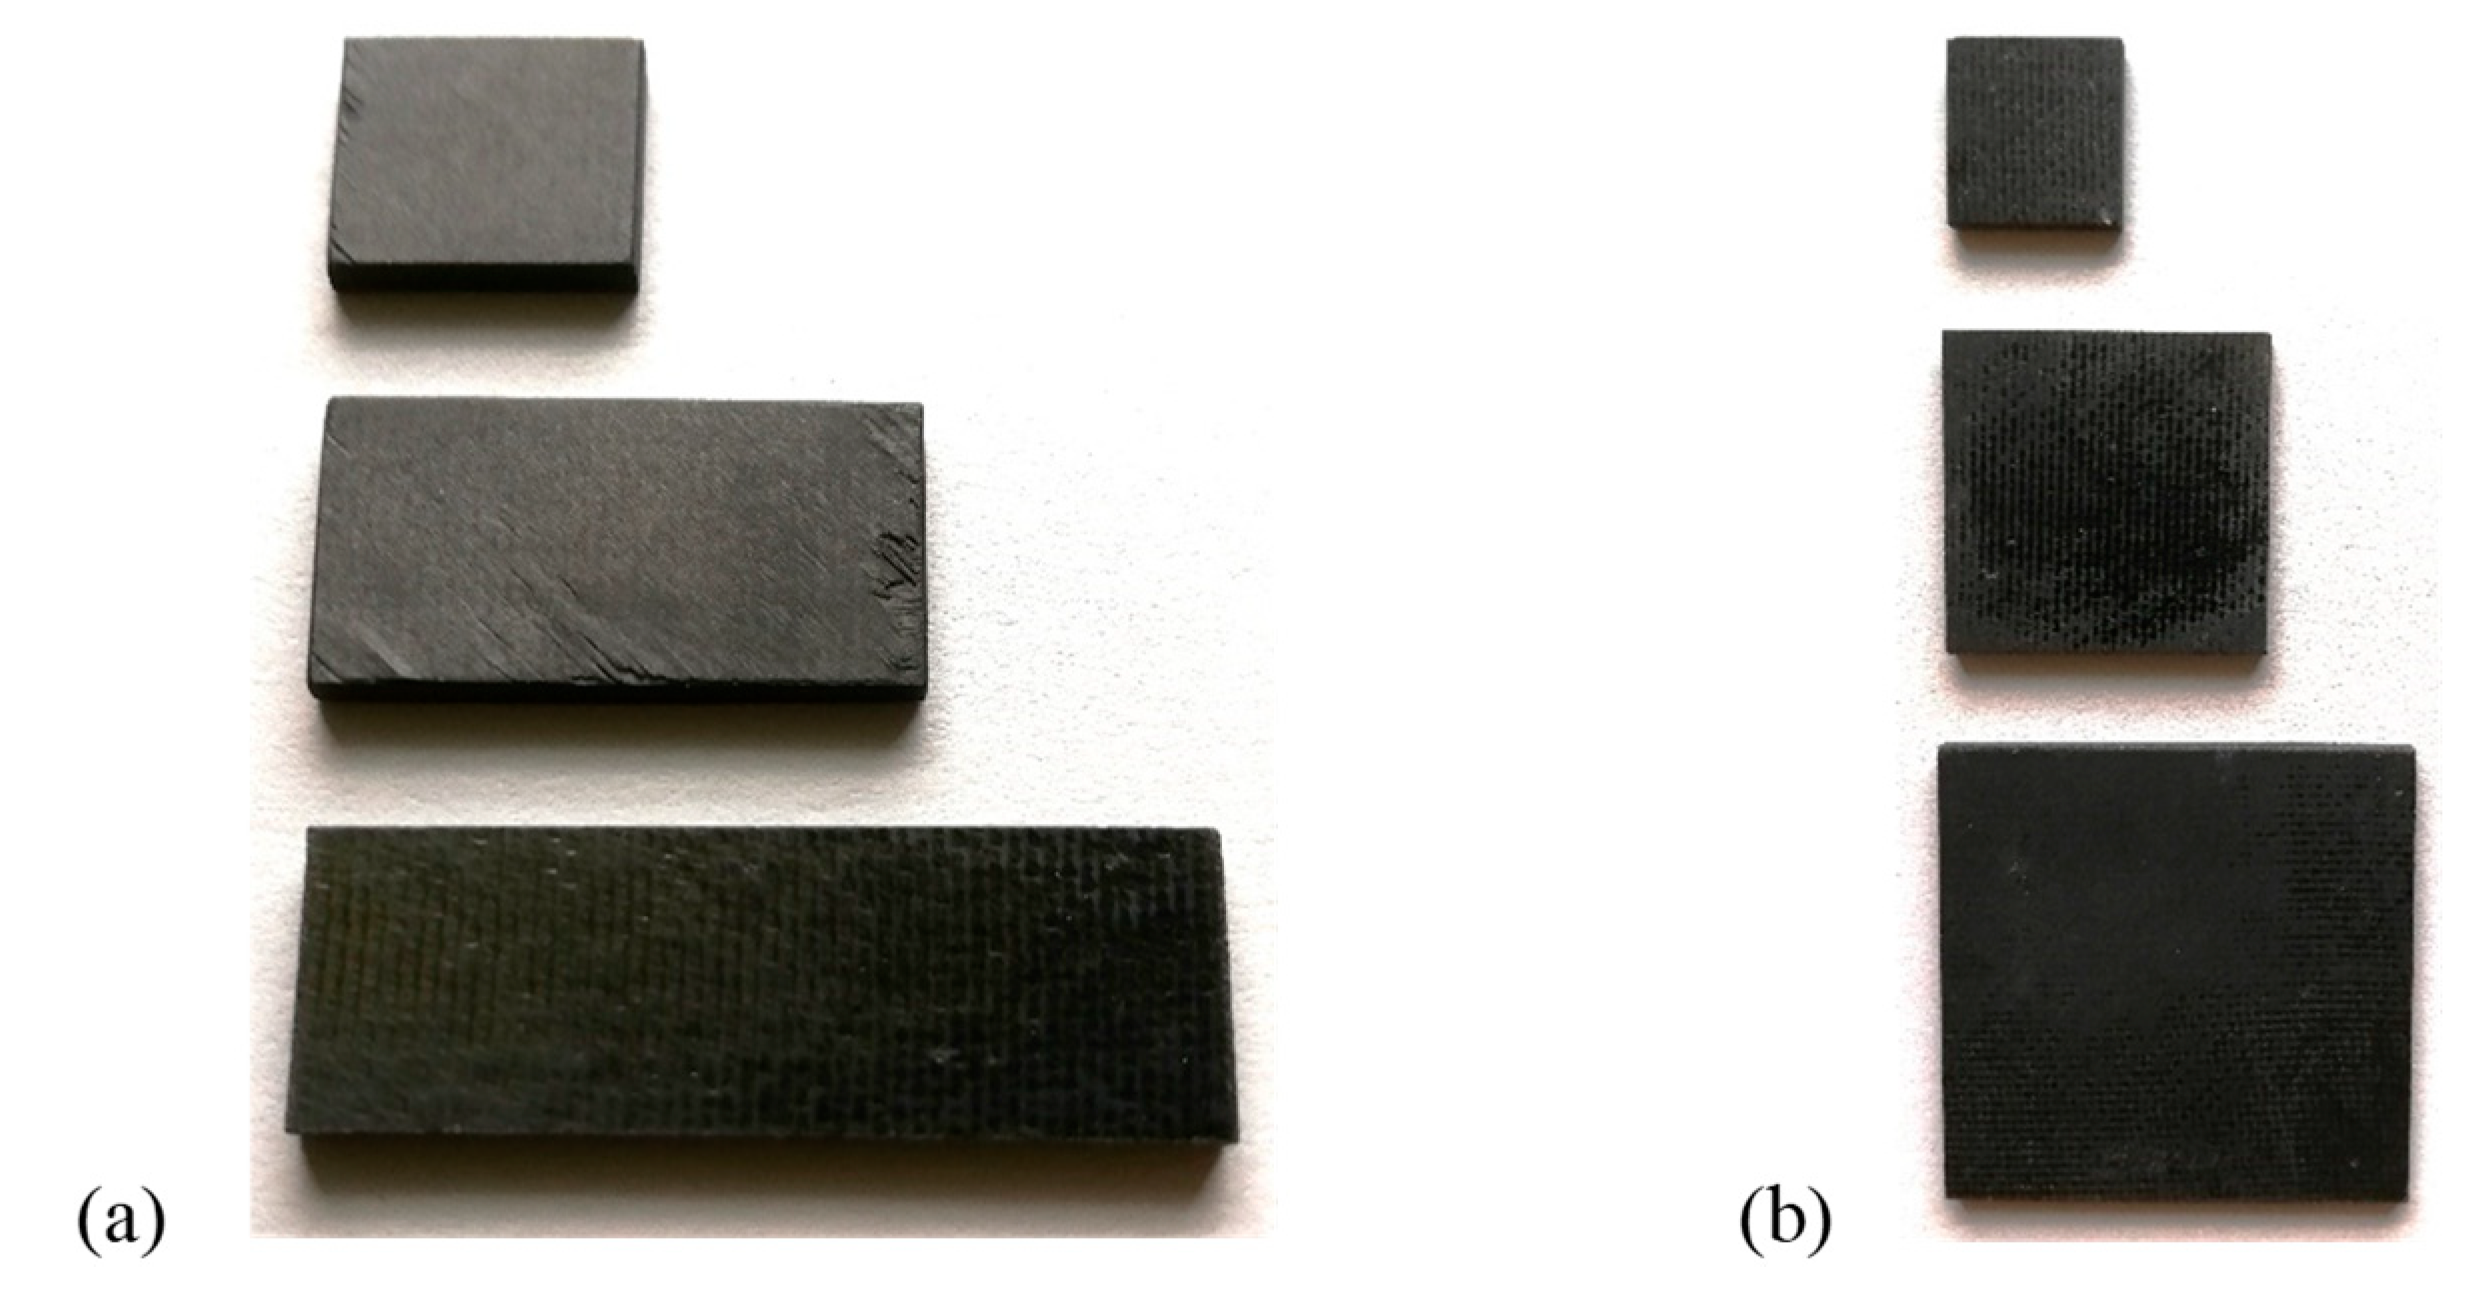
Figure 4.
Two-probe method for measurements of (a) volume and (b) surface electrical conductivities.
Figure 4.
Two-probe method for measurements of (a) volume and (b) surface electrical conductivities.
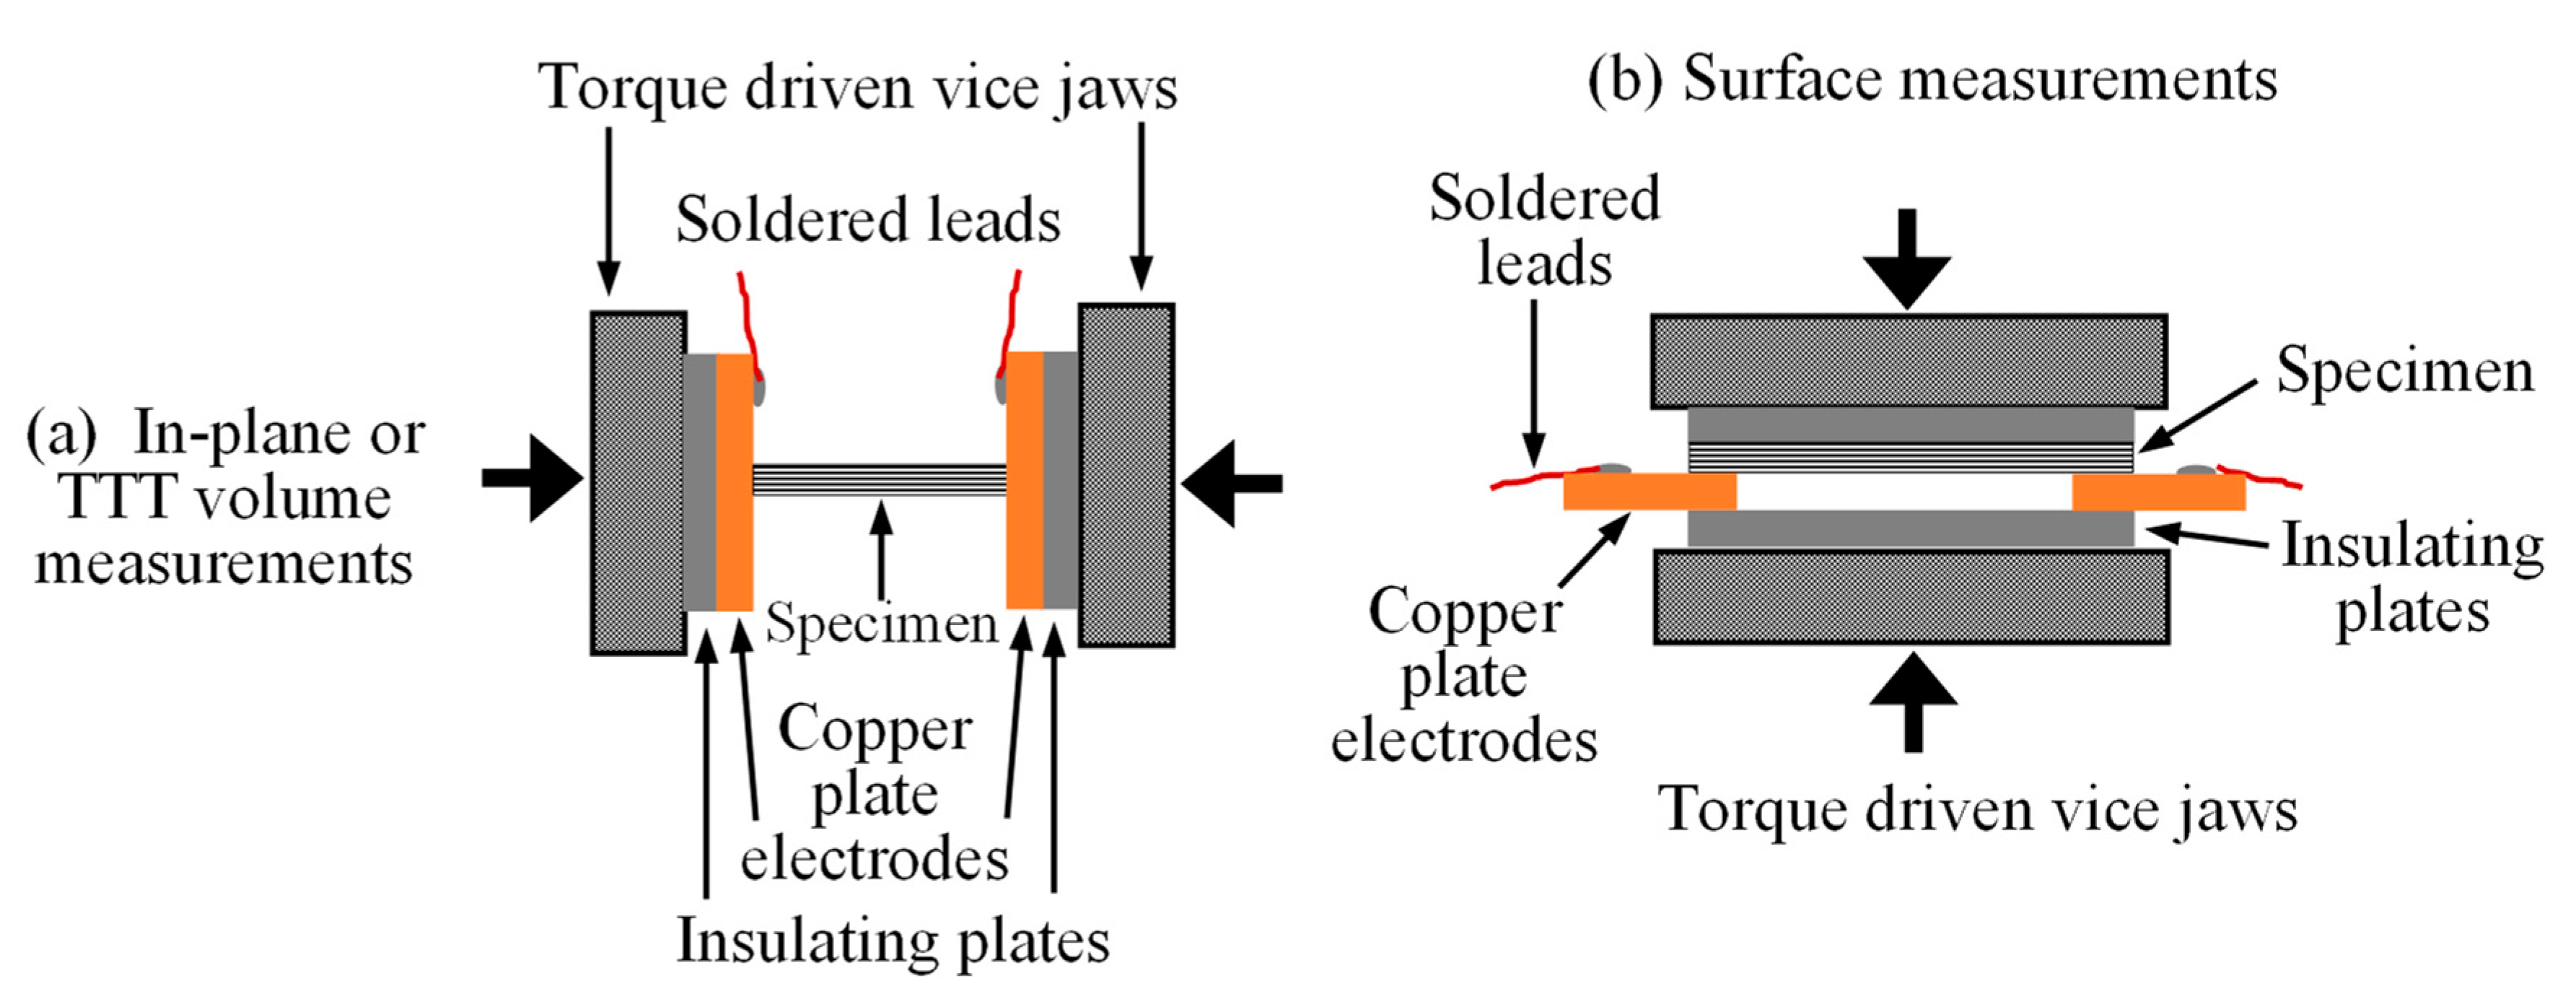
Figure 5.
Contact resistance in the in-plane direction of 32 ply QI laminates.
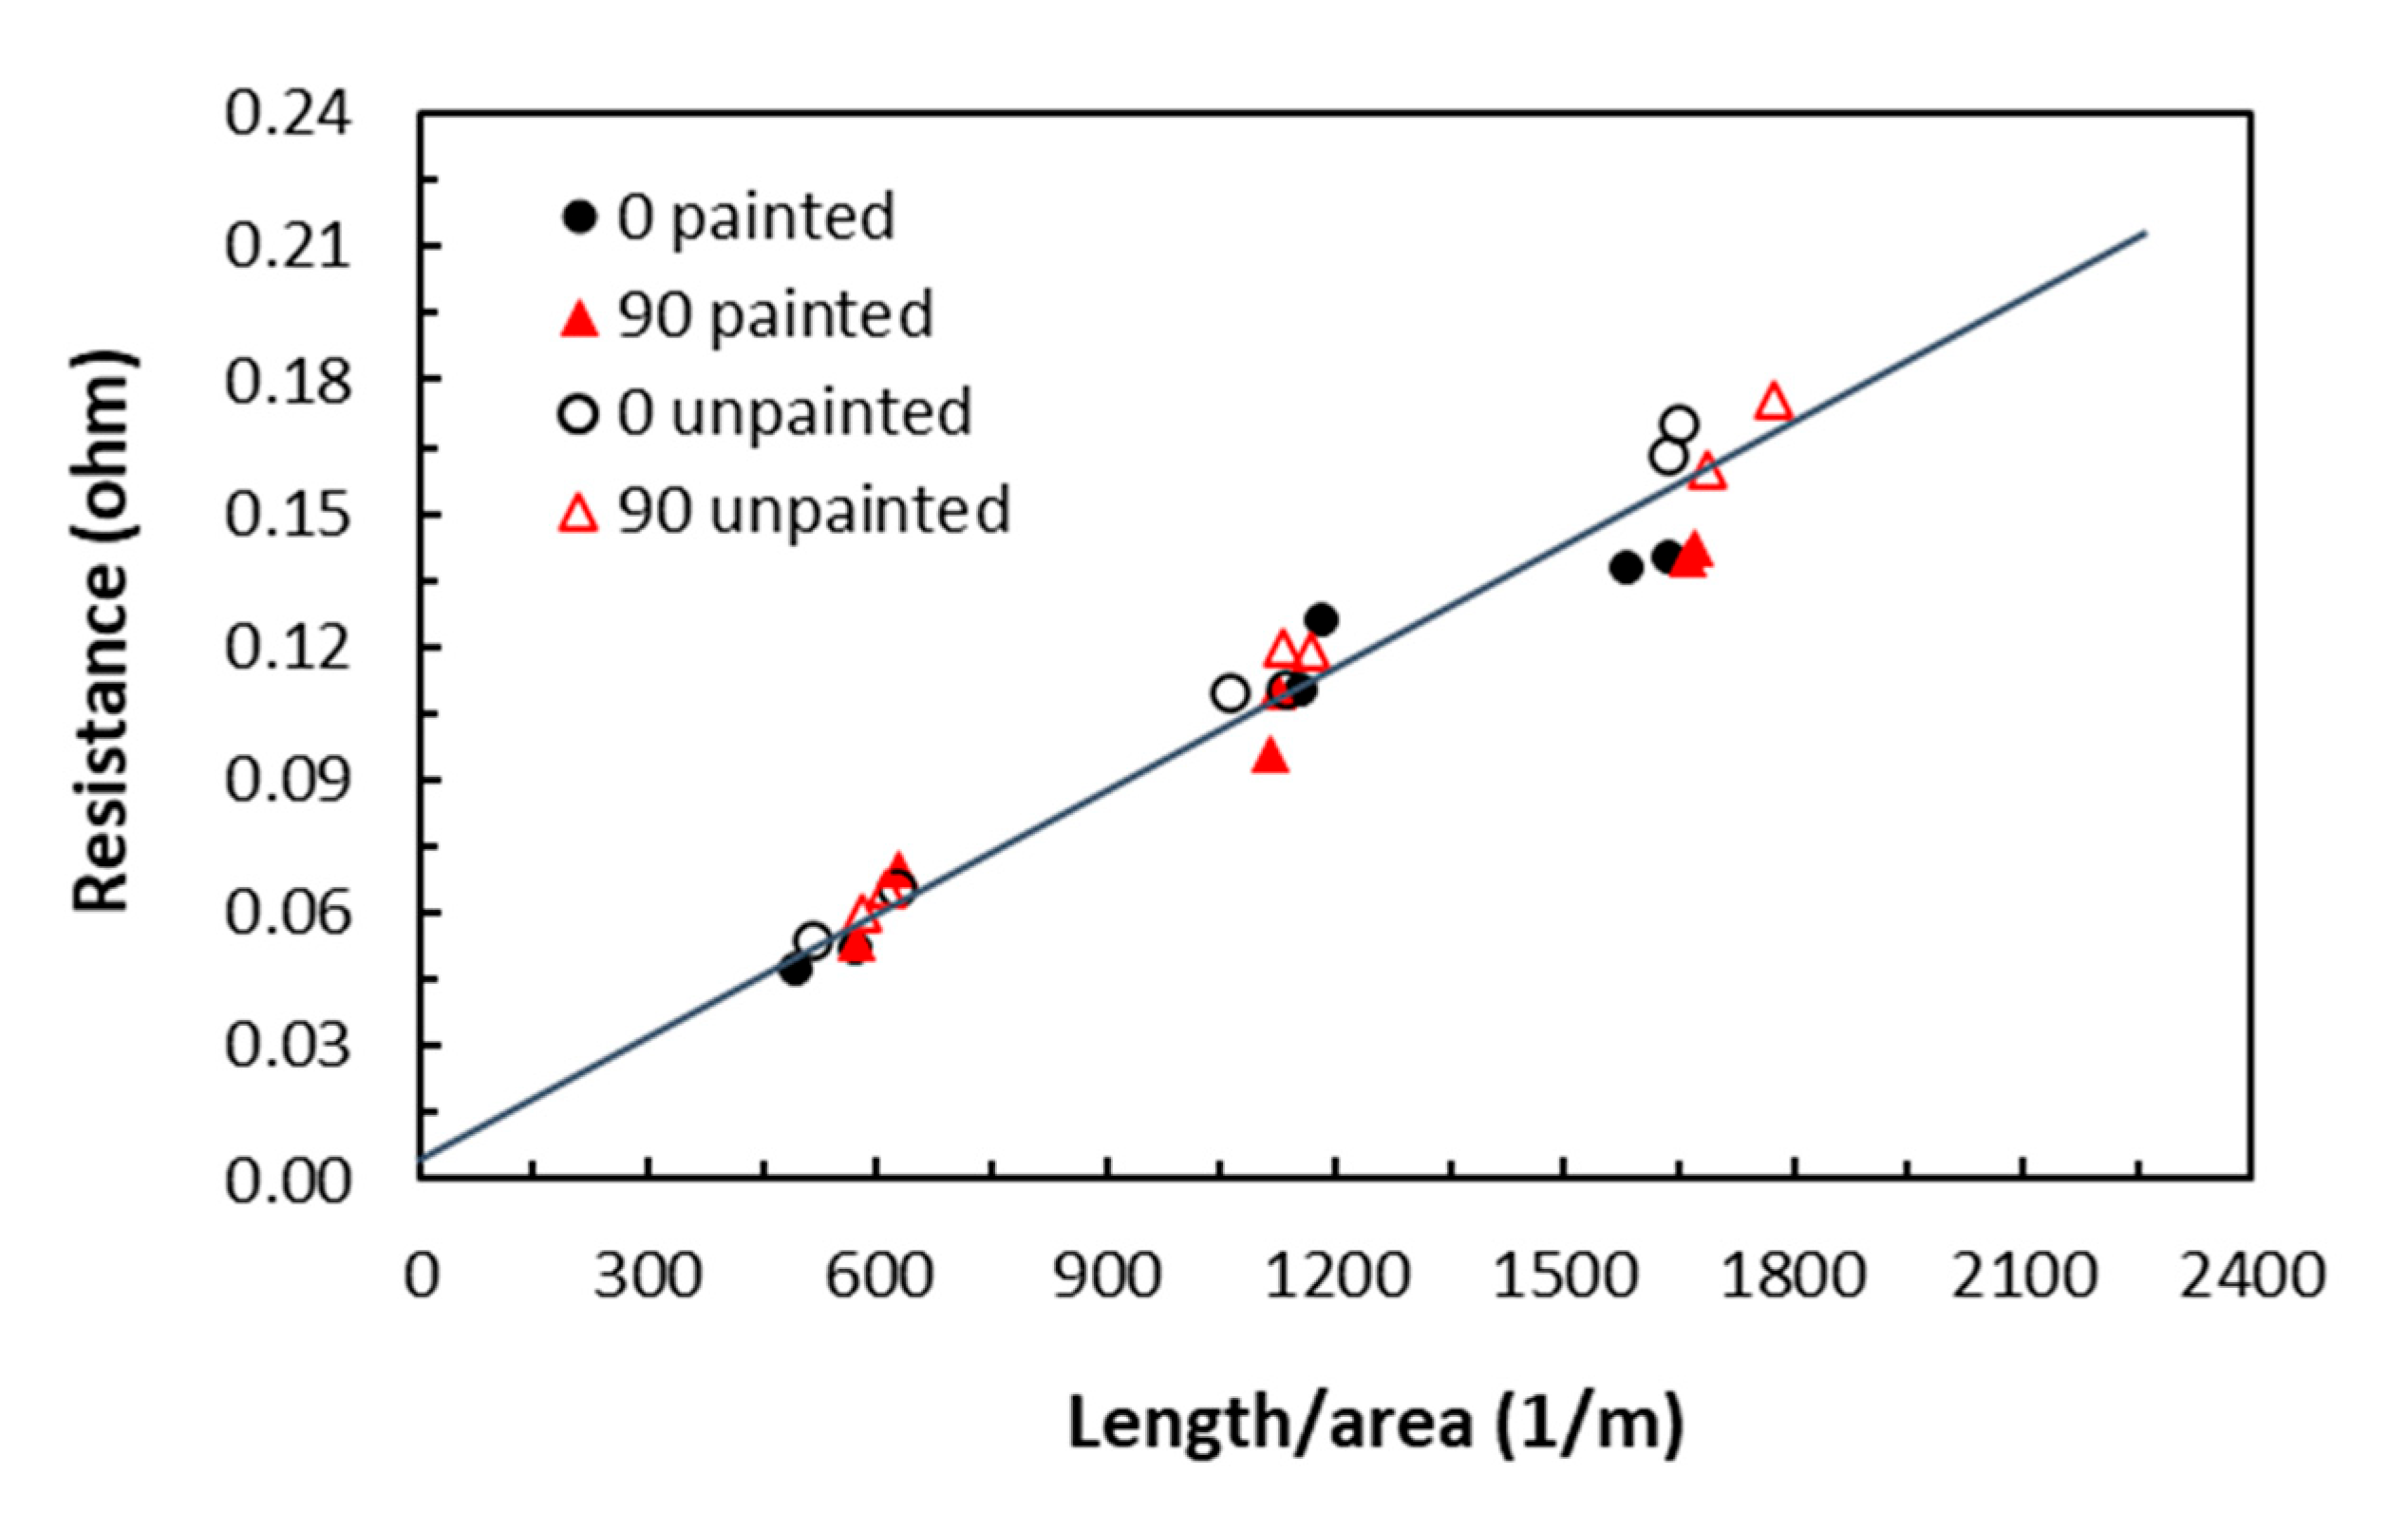
Figure 6.
Contact resistance in the TTT direction of 32 ply QI laminates.
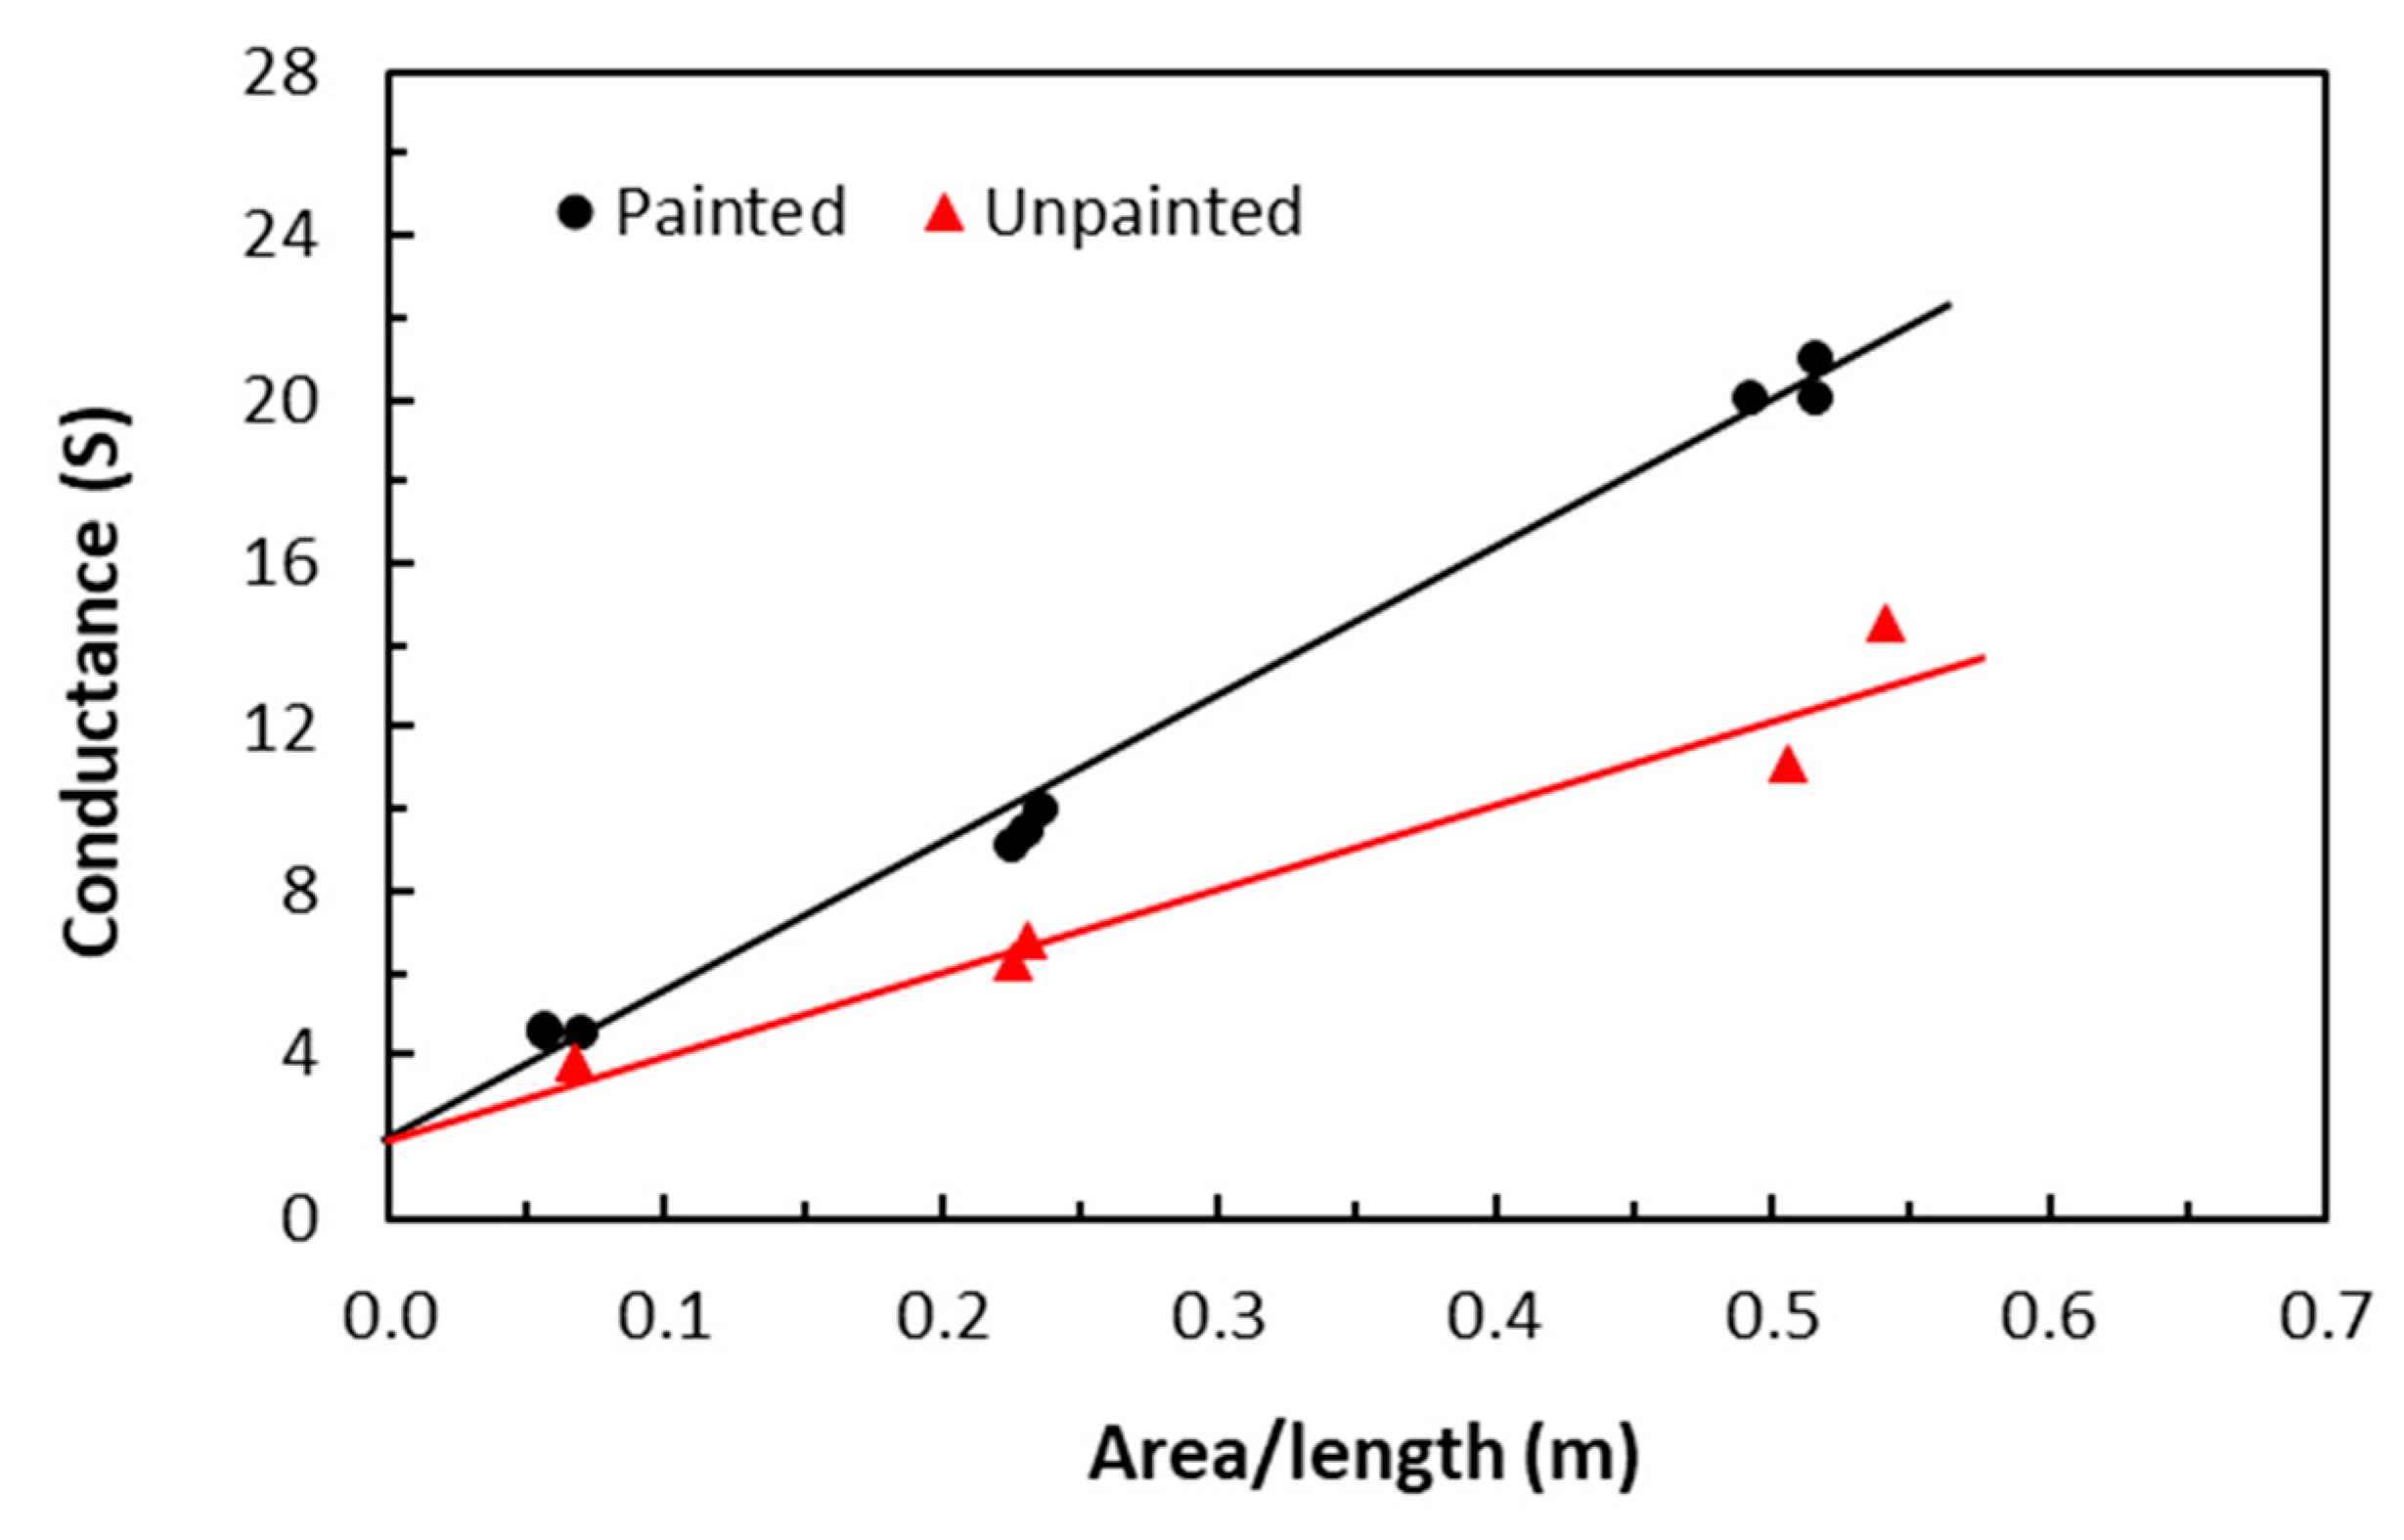
Figure 7.
In-plane fibre direction volume electrical conductivities of 4 mm thick UD laminates.
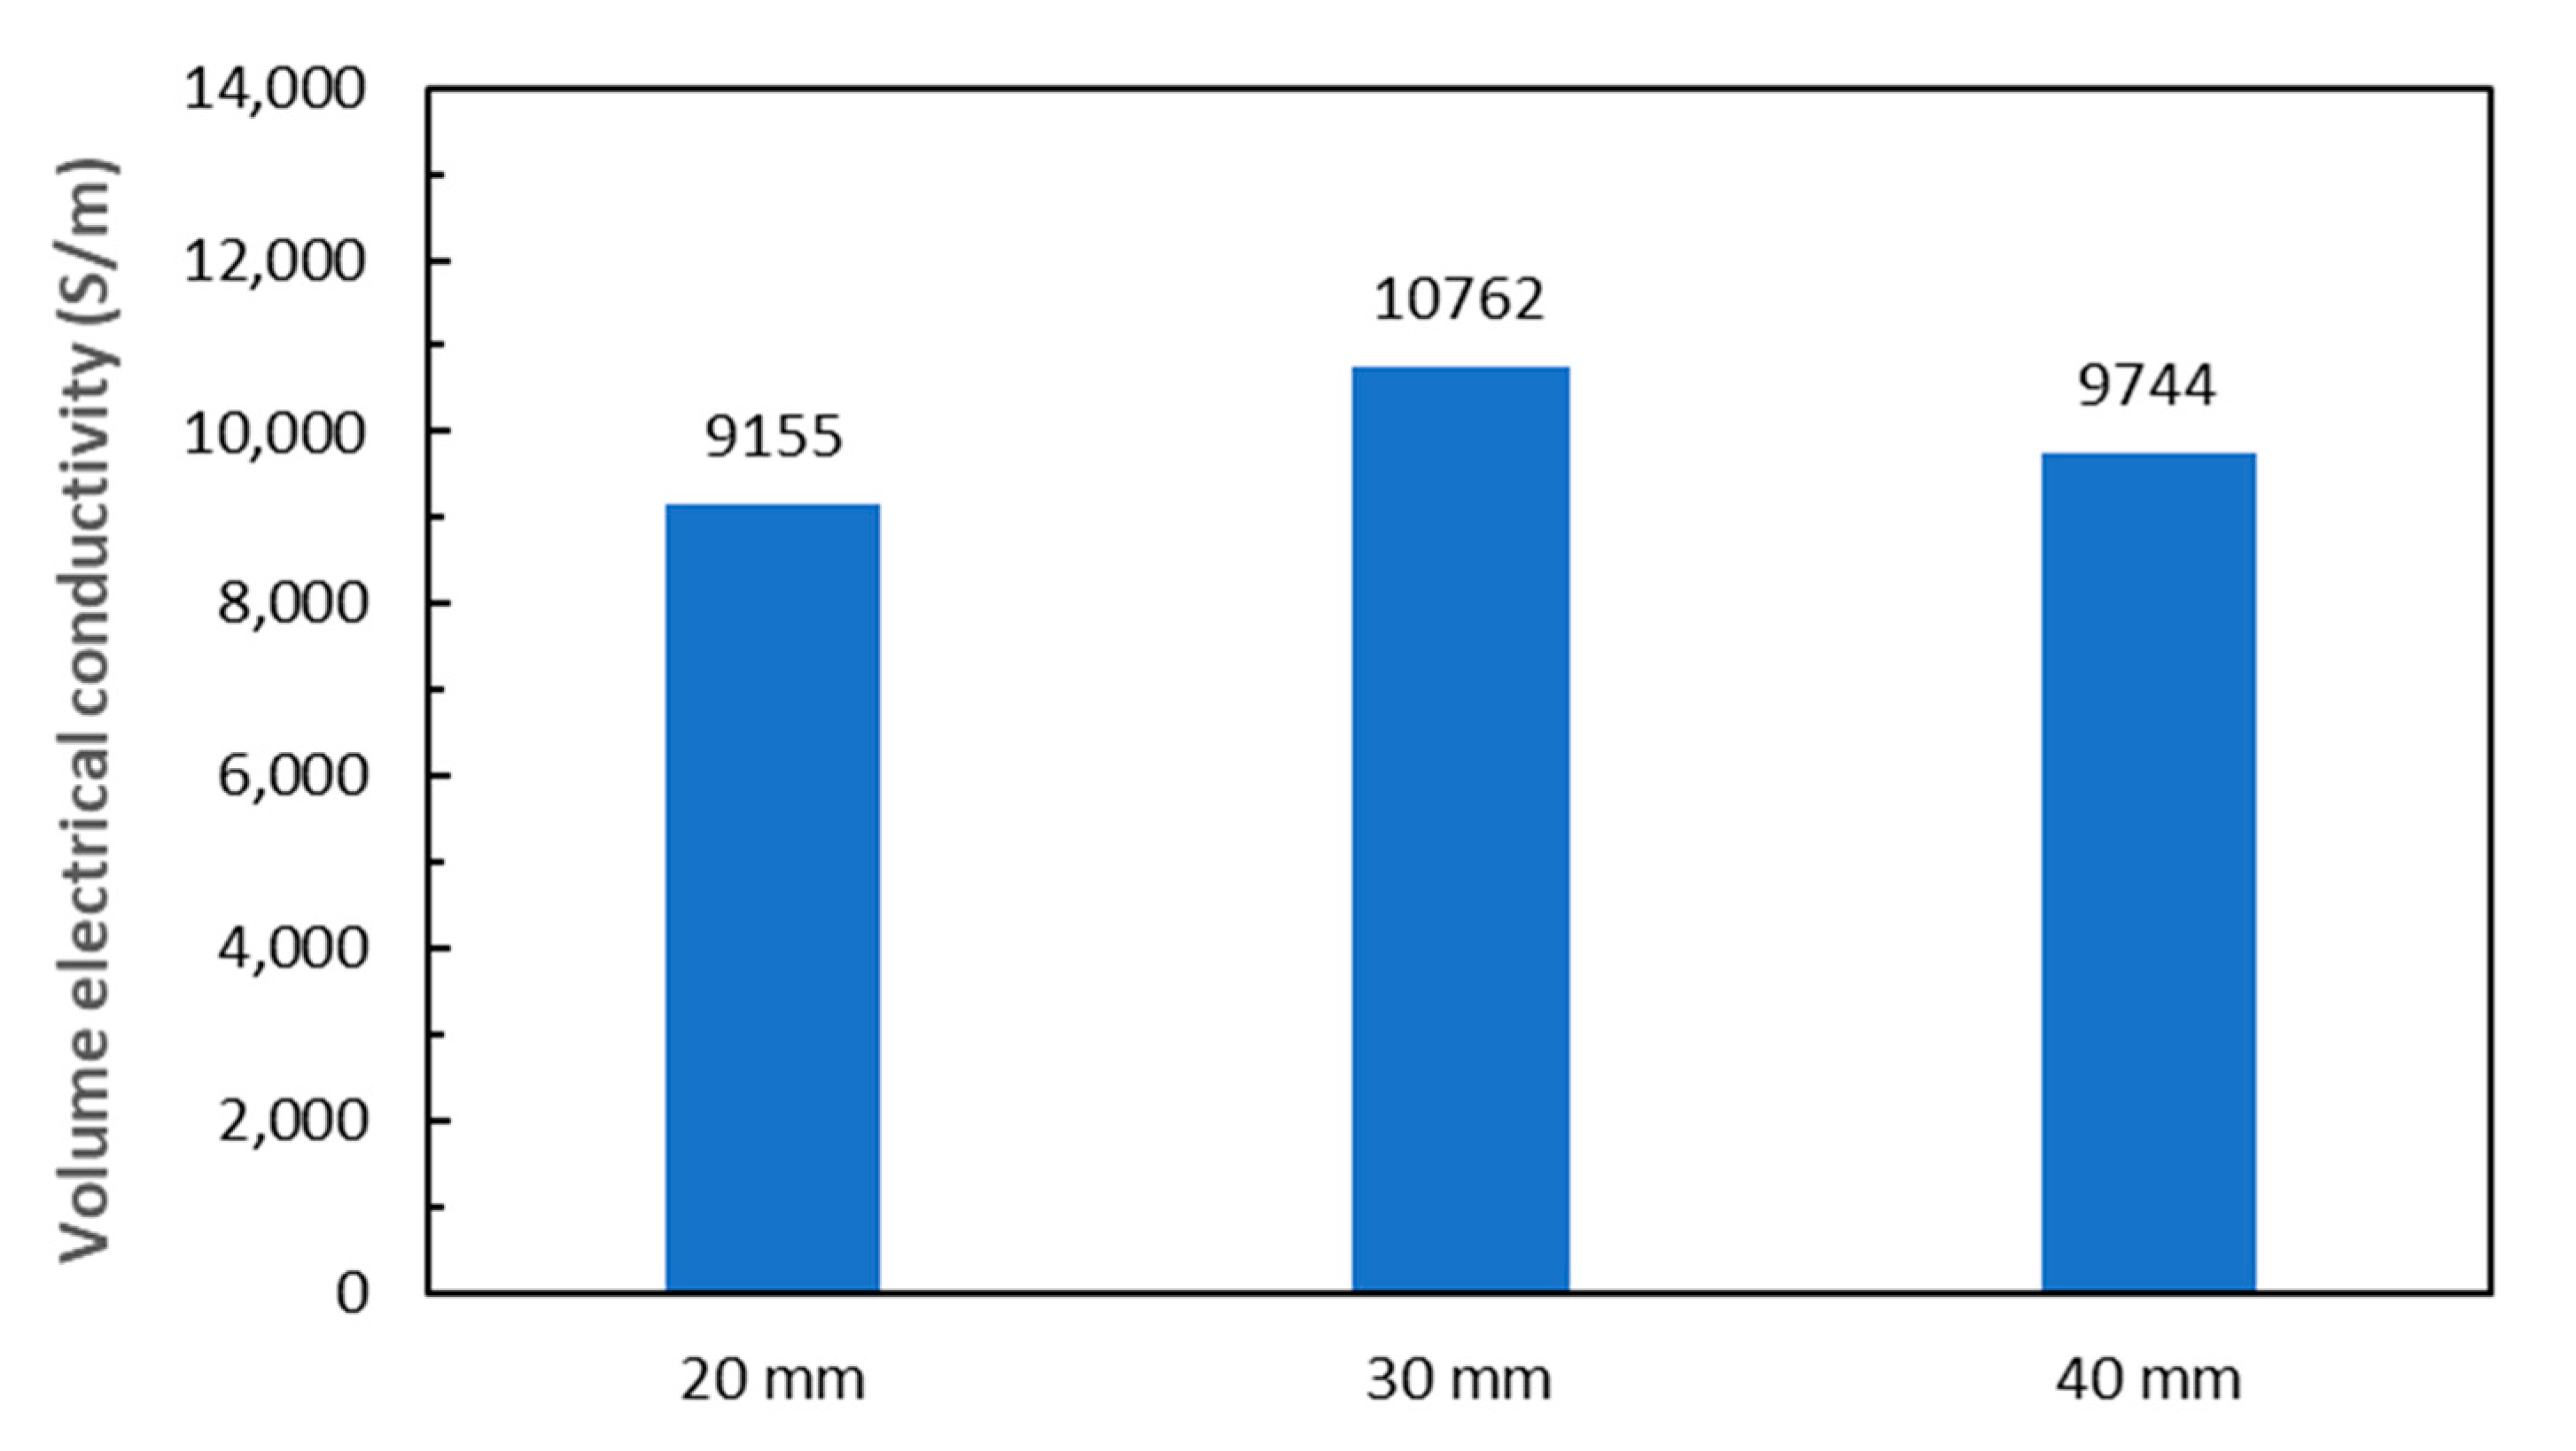
Figure 8.
In-plane transverse volume electrical conductivities of 4 mm thick UD laminates.
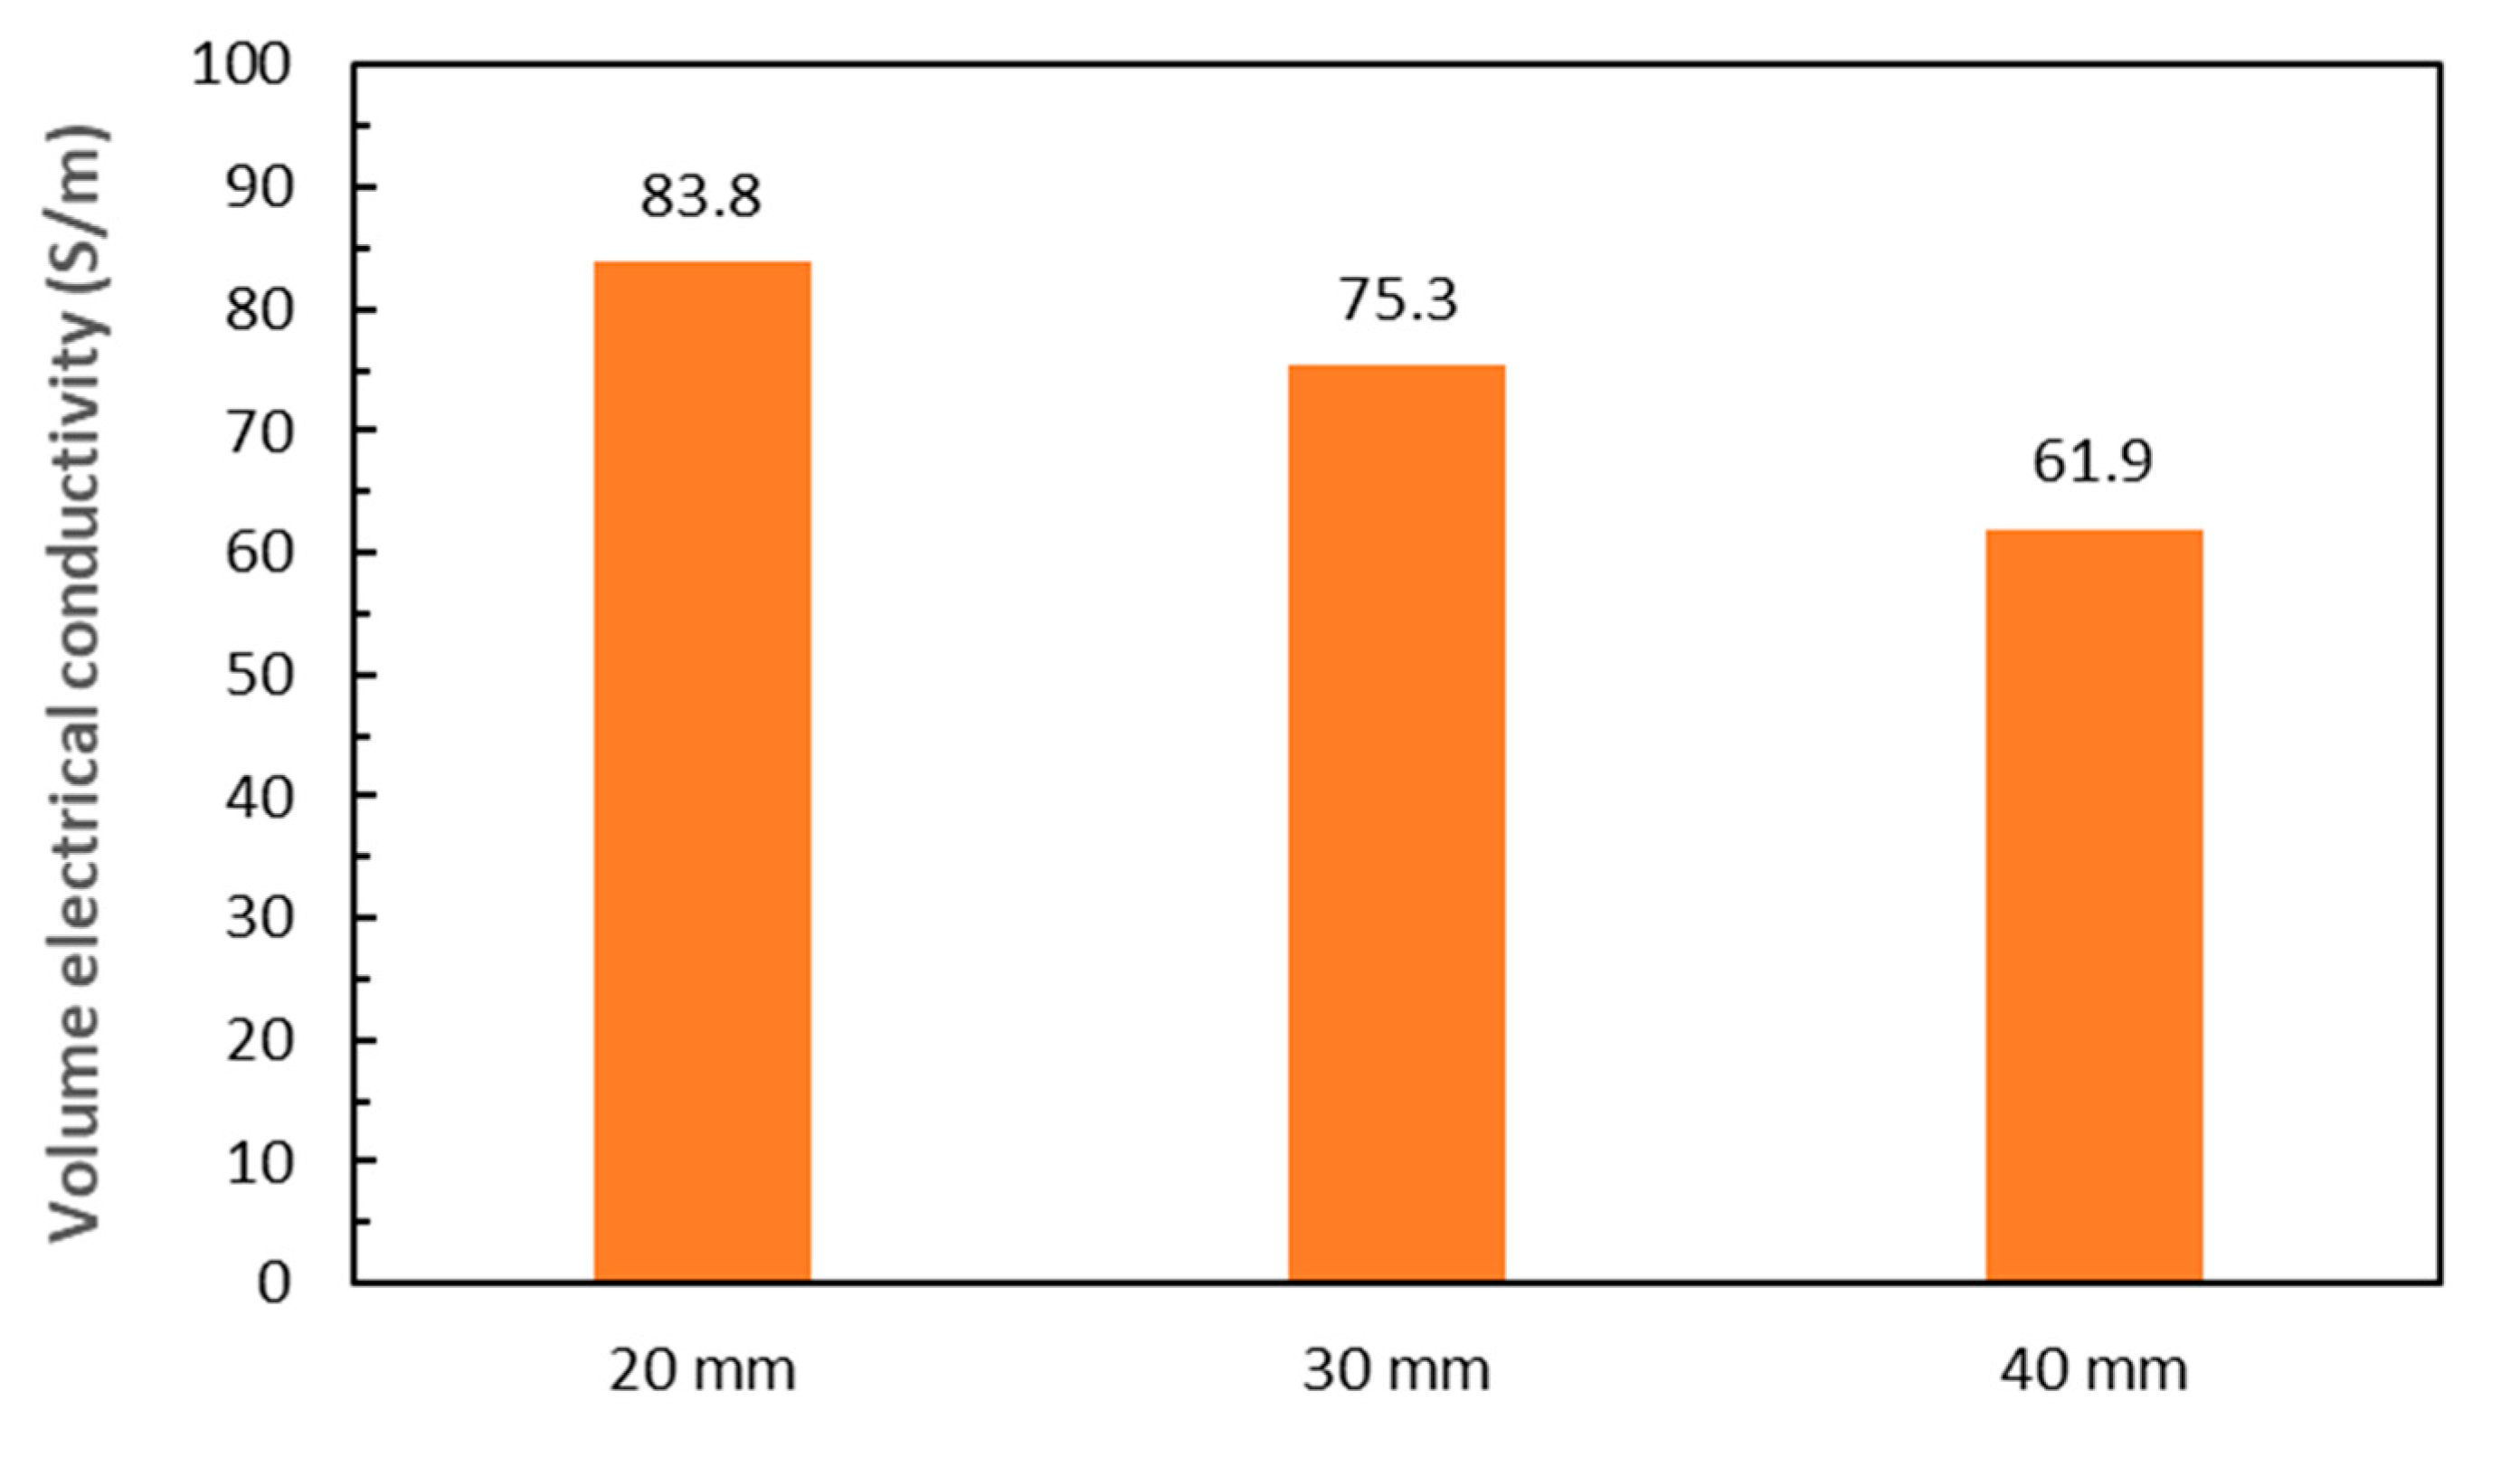
Figure 9.
TTT volume electrical conductivities of 4 mm thick UD laminates.
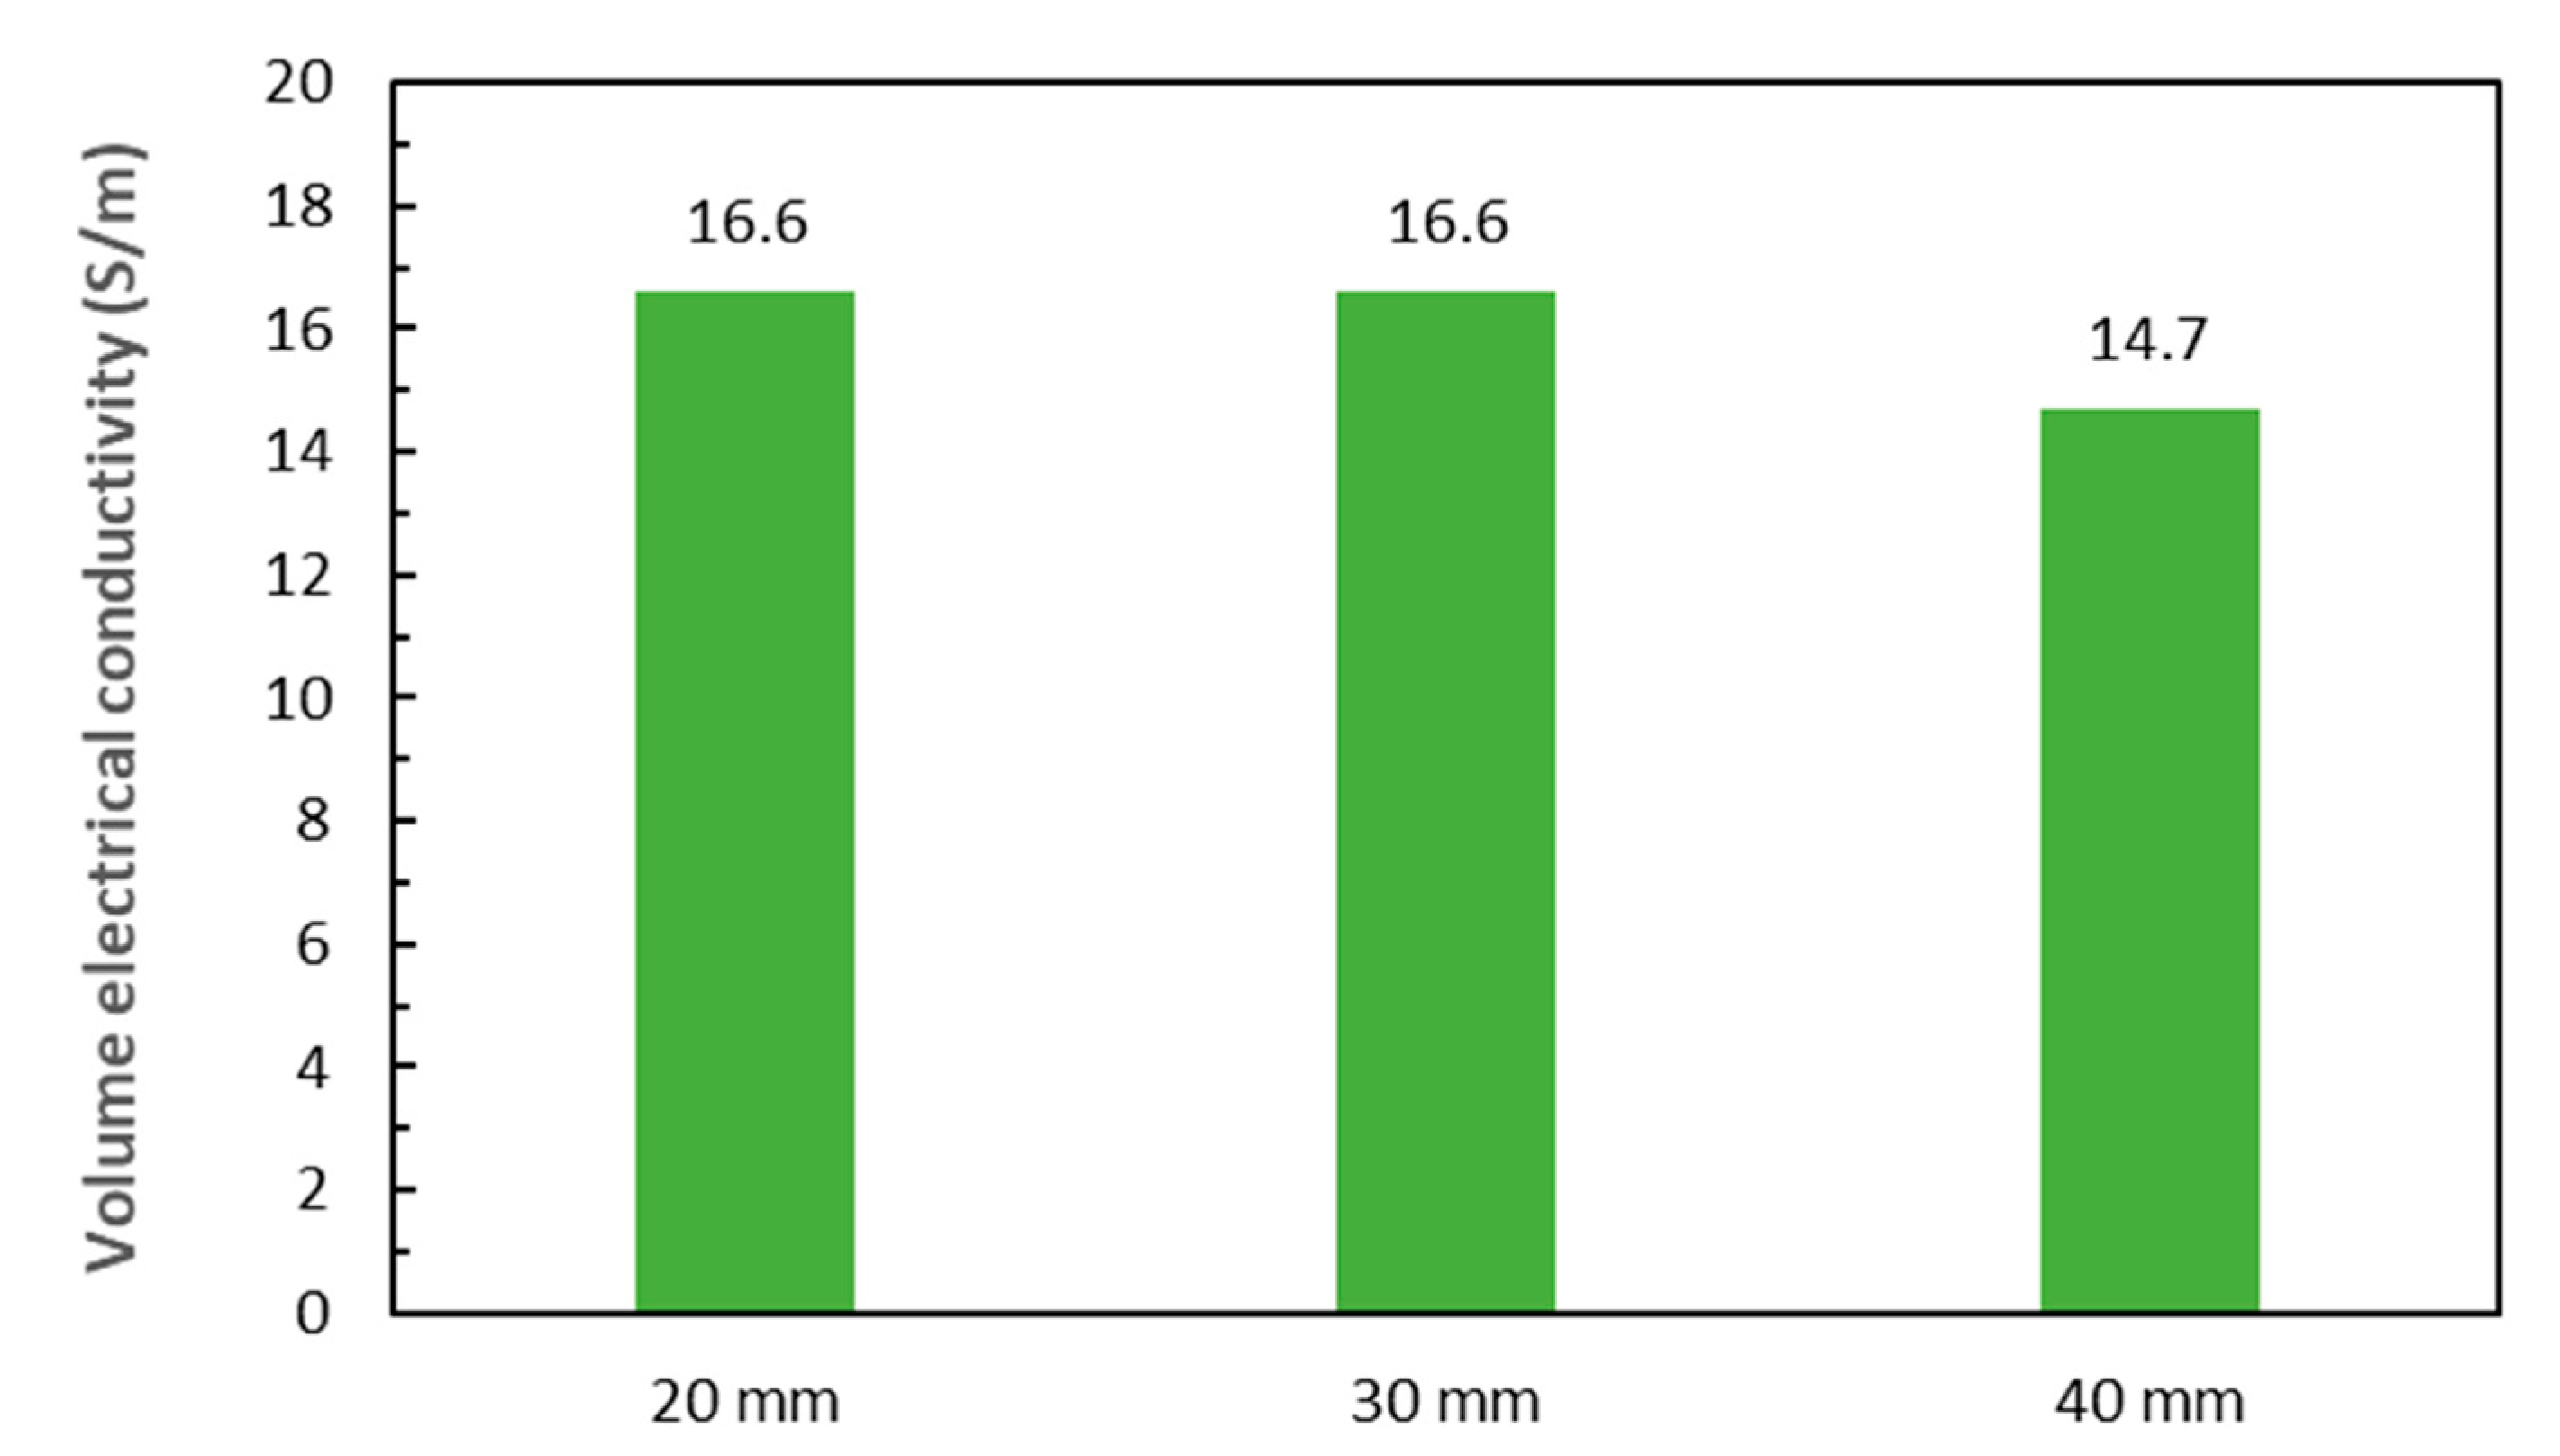
Figure 10.
Effects of electrode spacing and clamping torque on surface electrical conductivities.
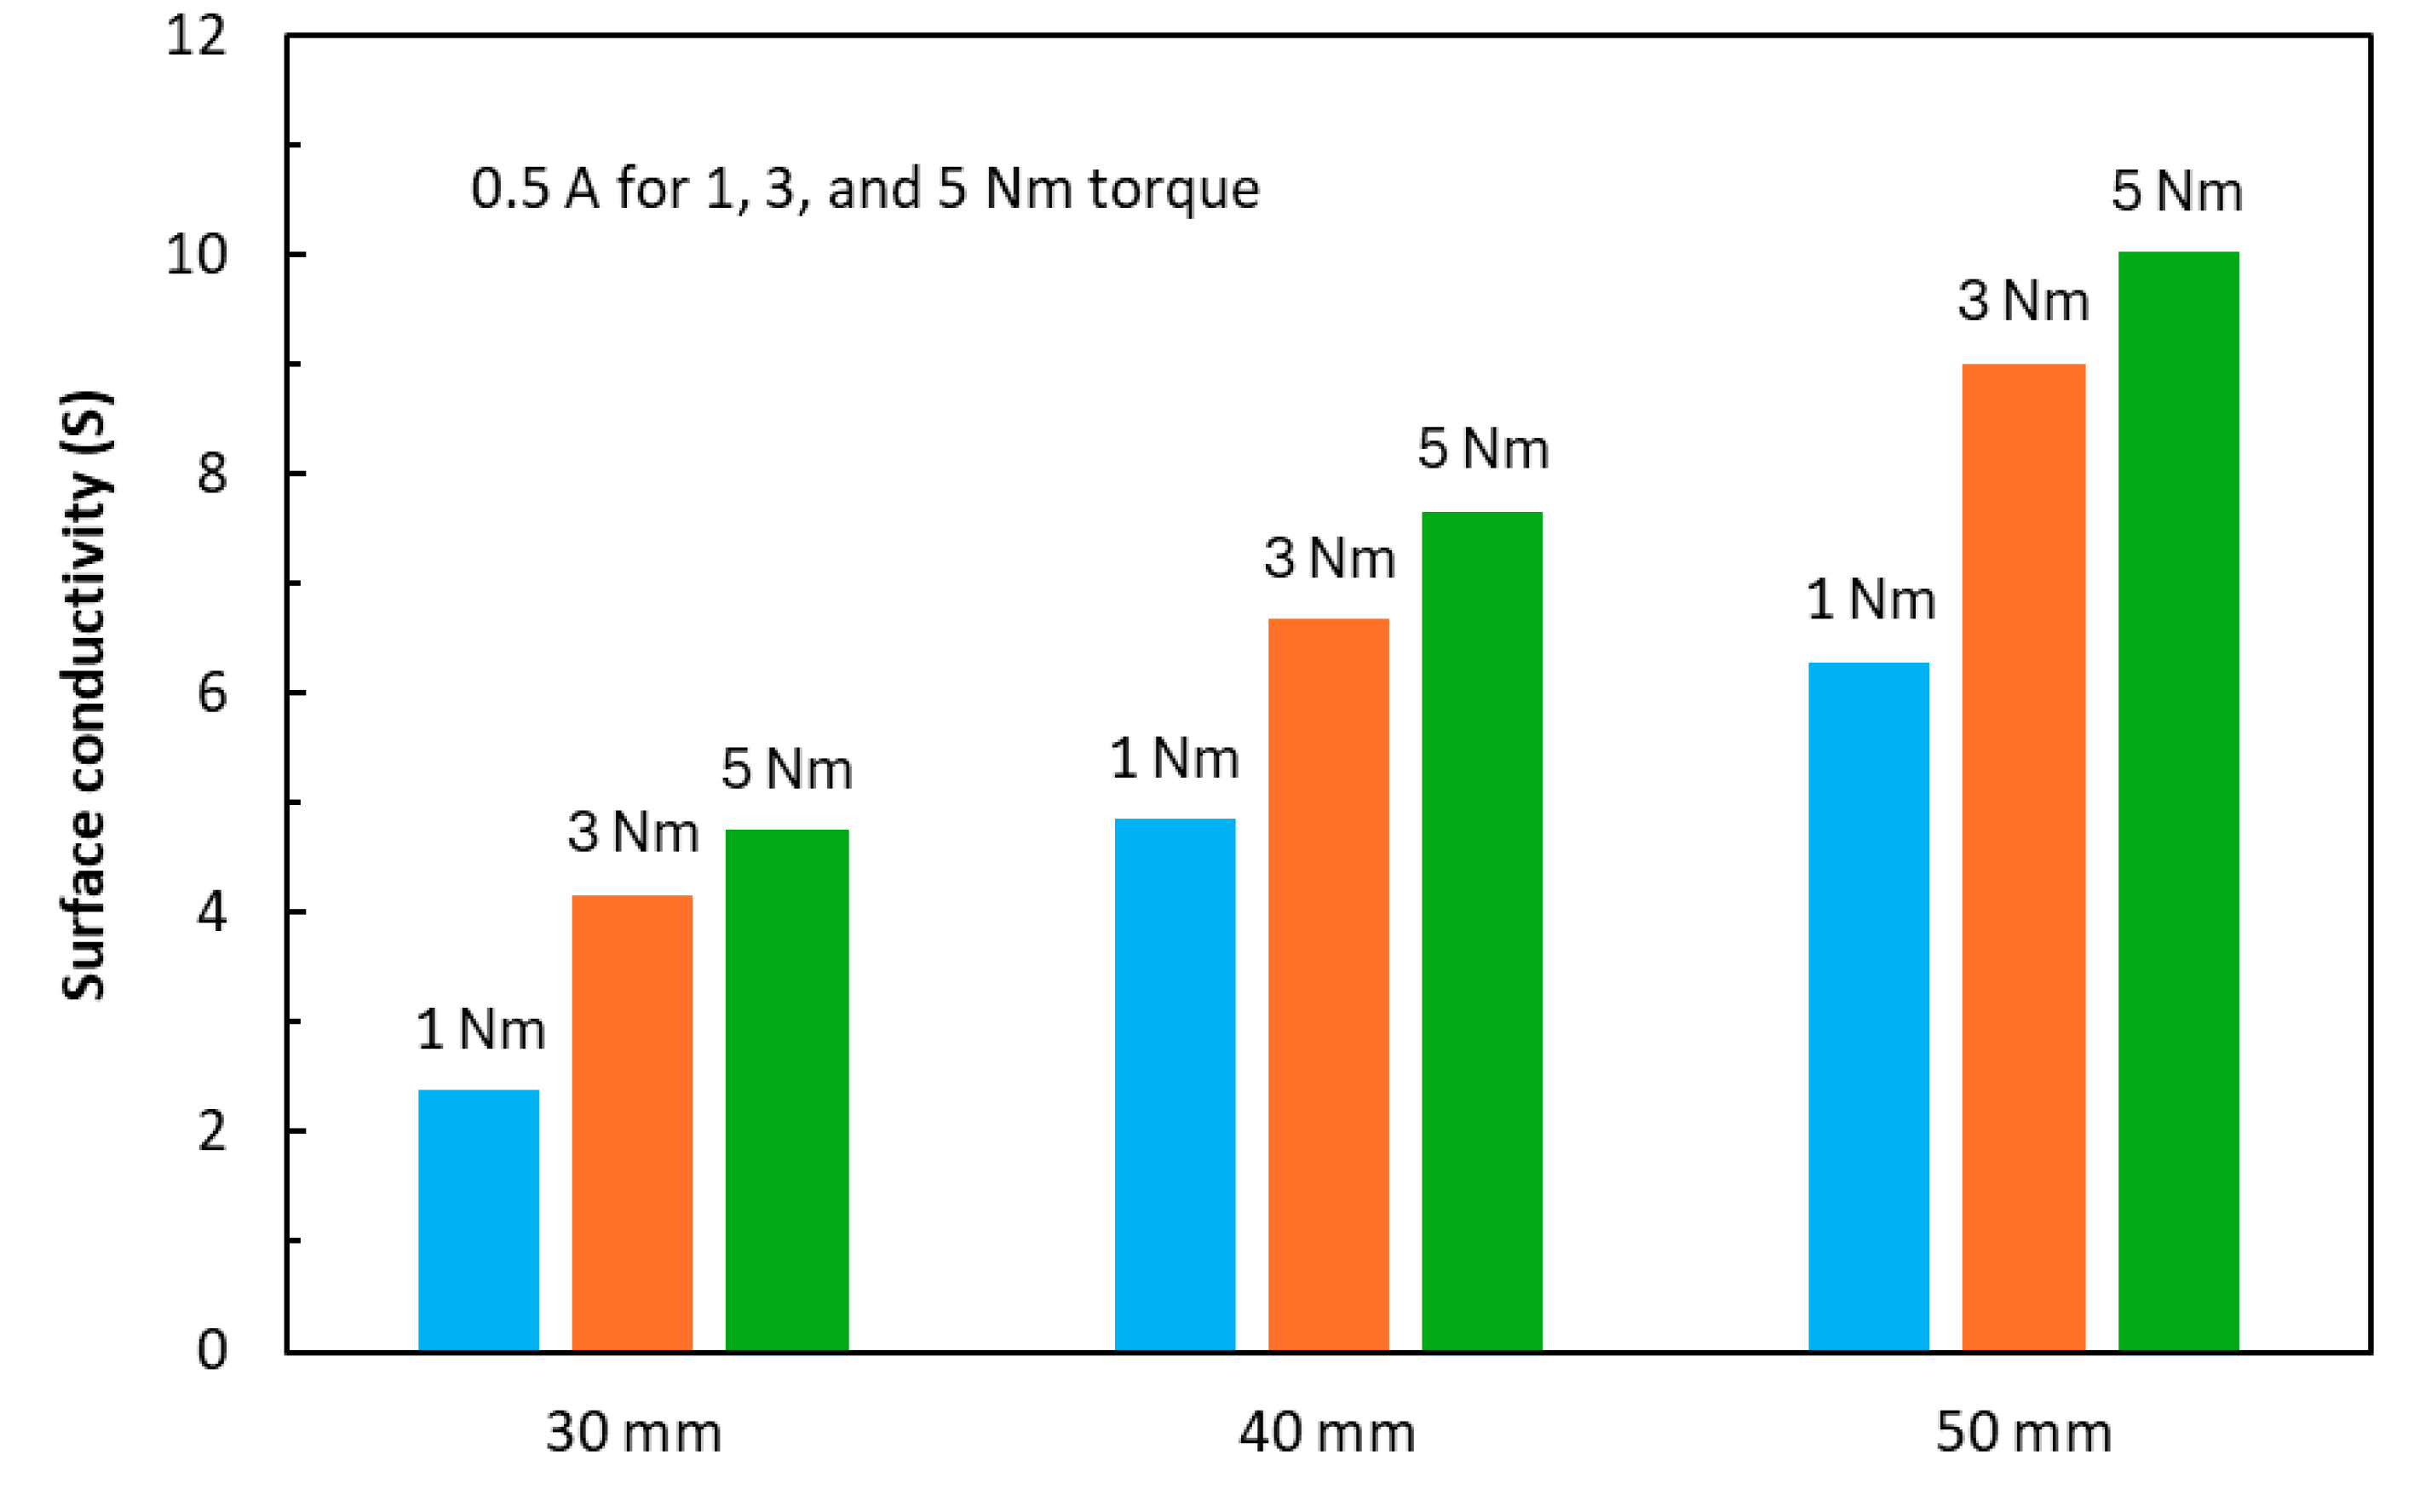
Figure 11.
Effects of clamping torque on in-plane volume electrical conductivities of 4 mm thick QI laminates.
Figure 11.
Effects of clamping torque on in-plane volume electrical conductivities of 4 mm thick QI laminates.
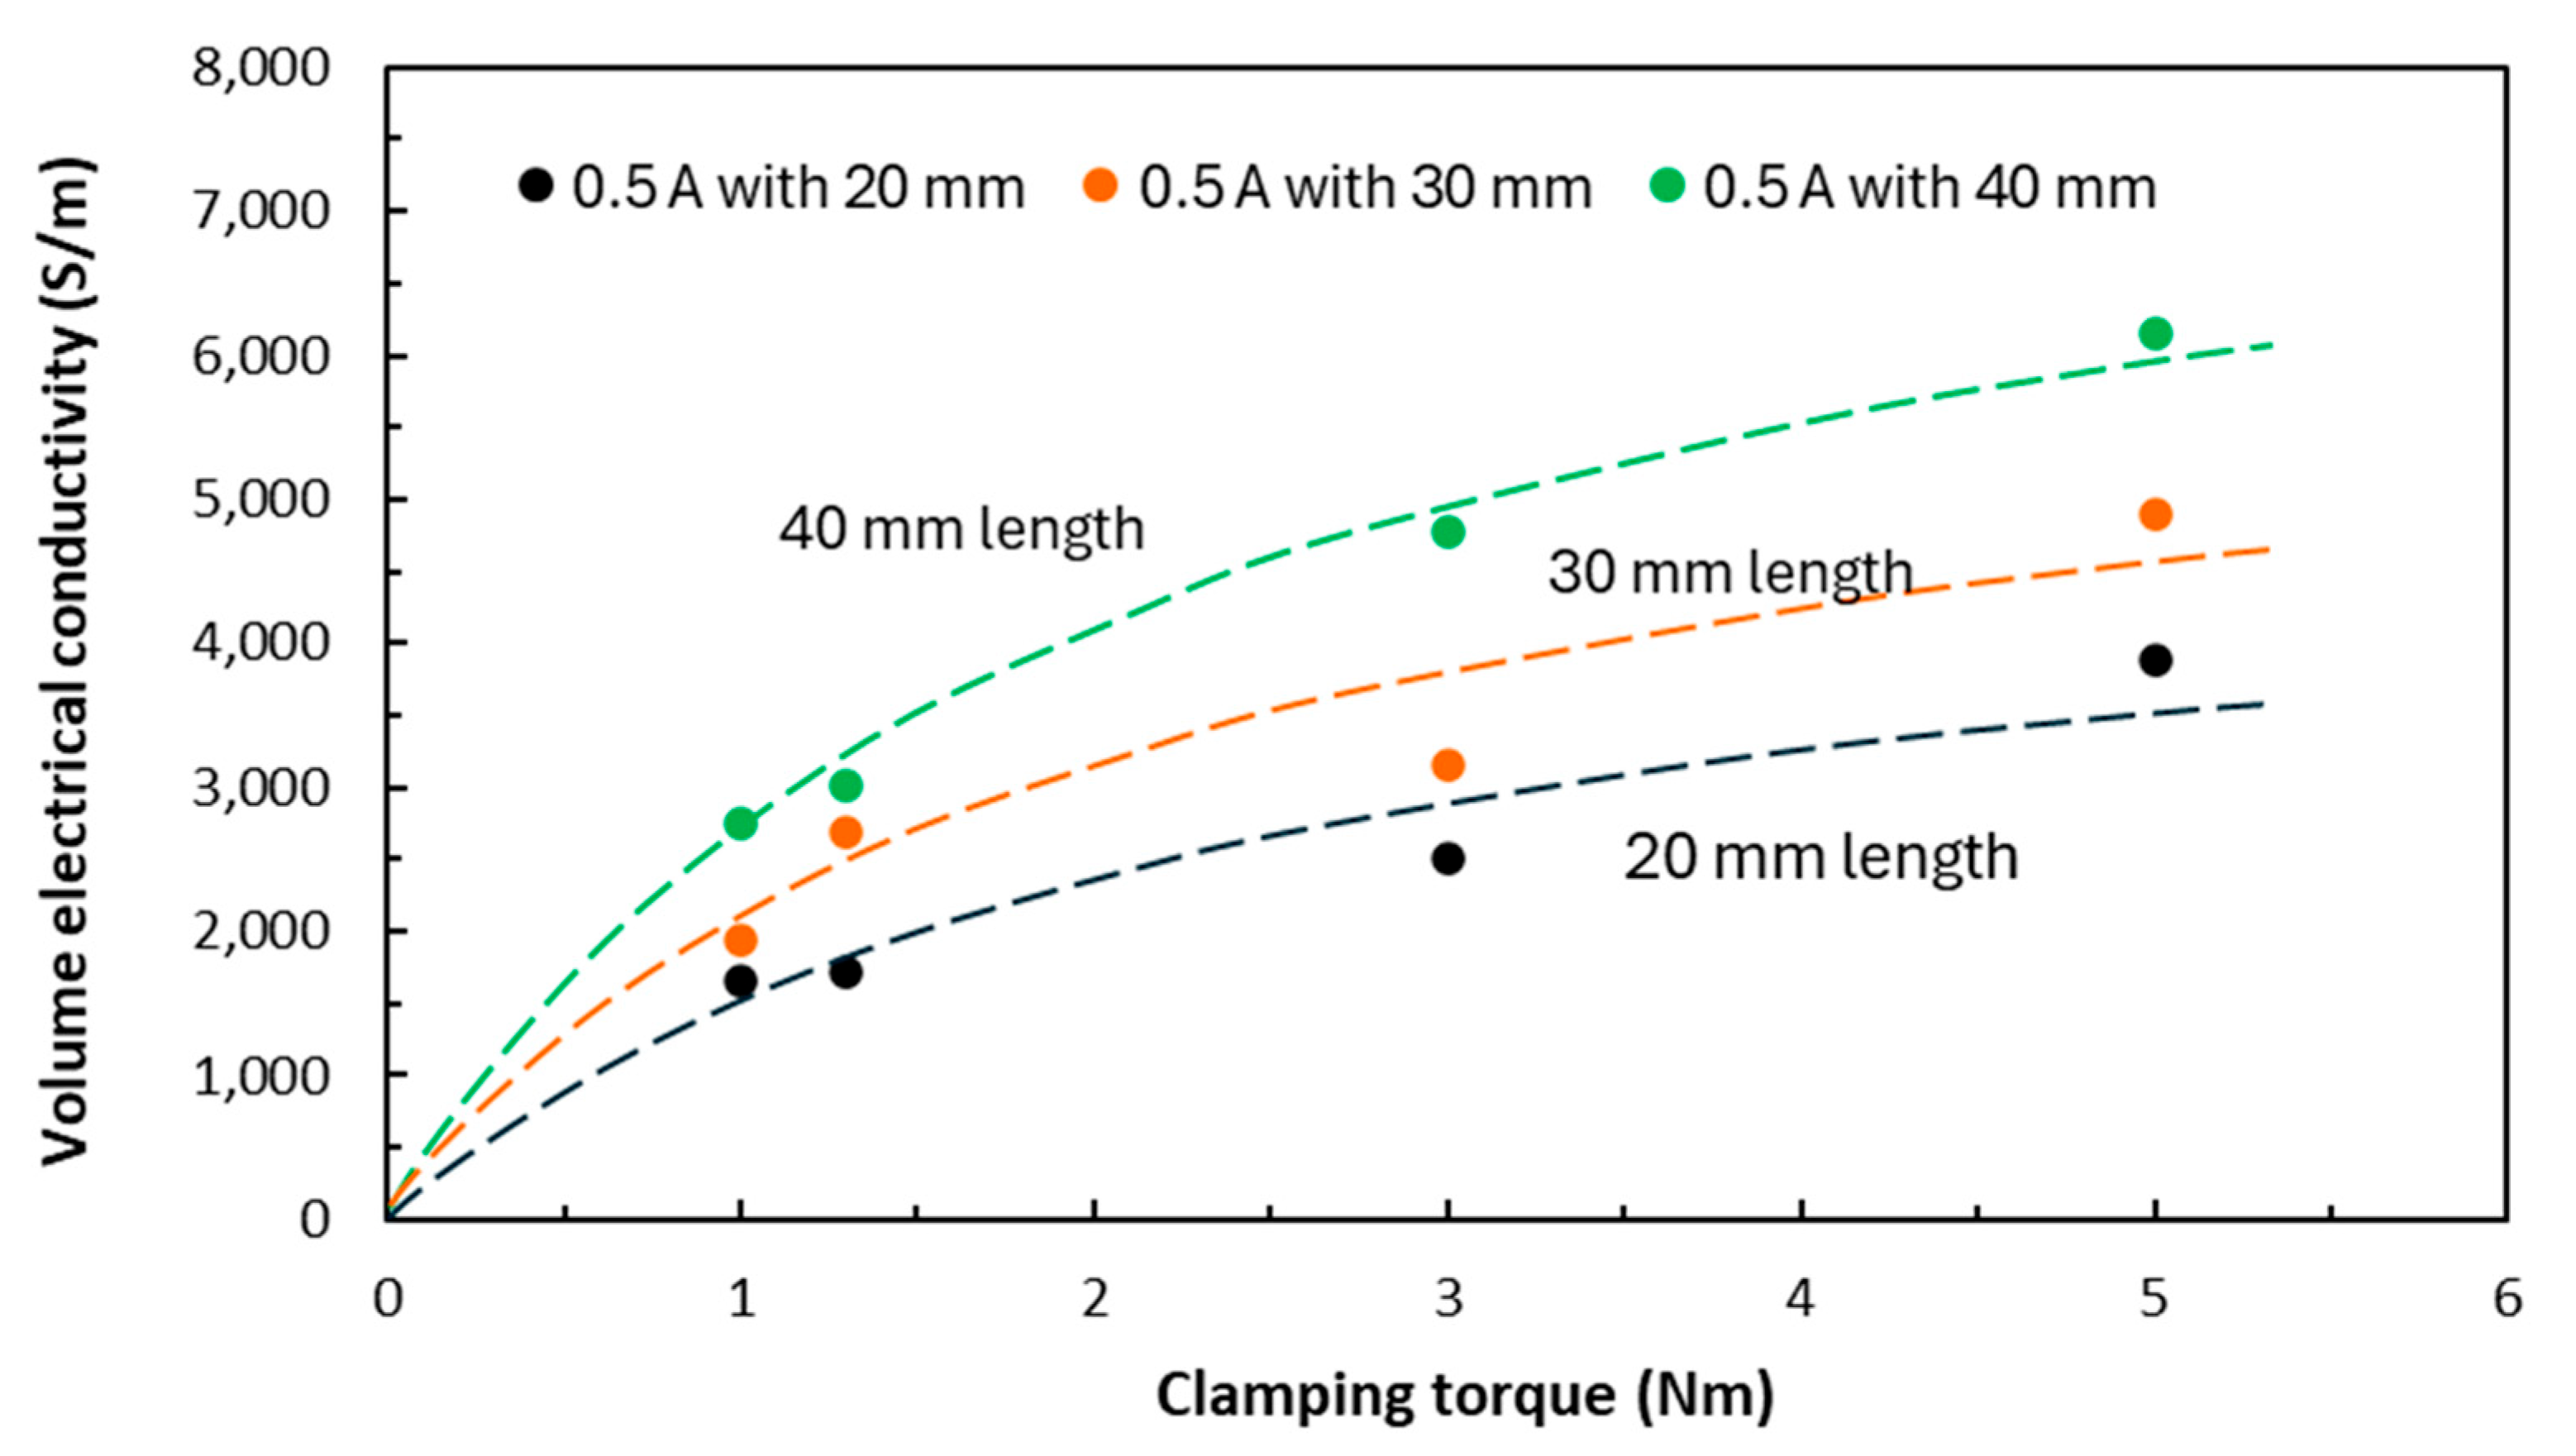
Figure 12.
Effects of clamping torque on TTT electrical conductivities of 4 mm thick QI laminates.
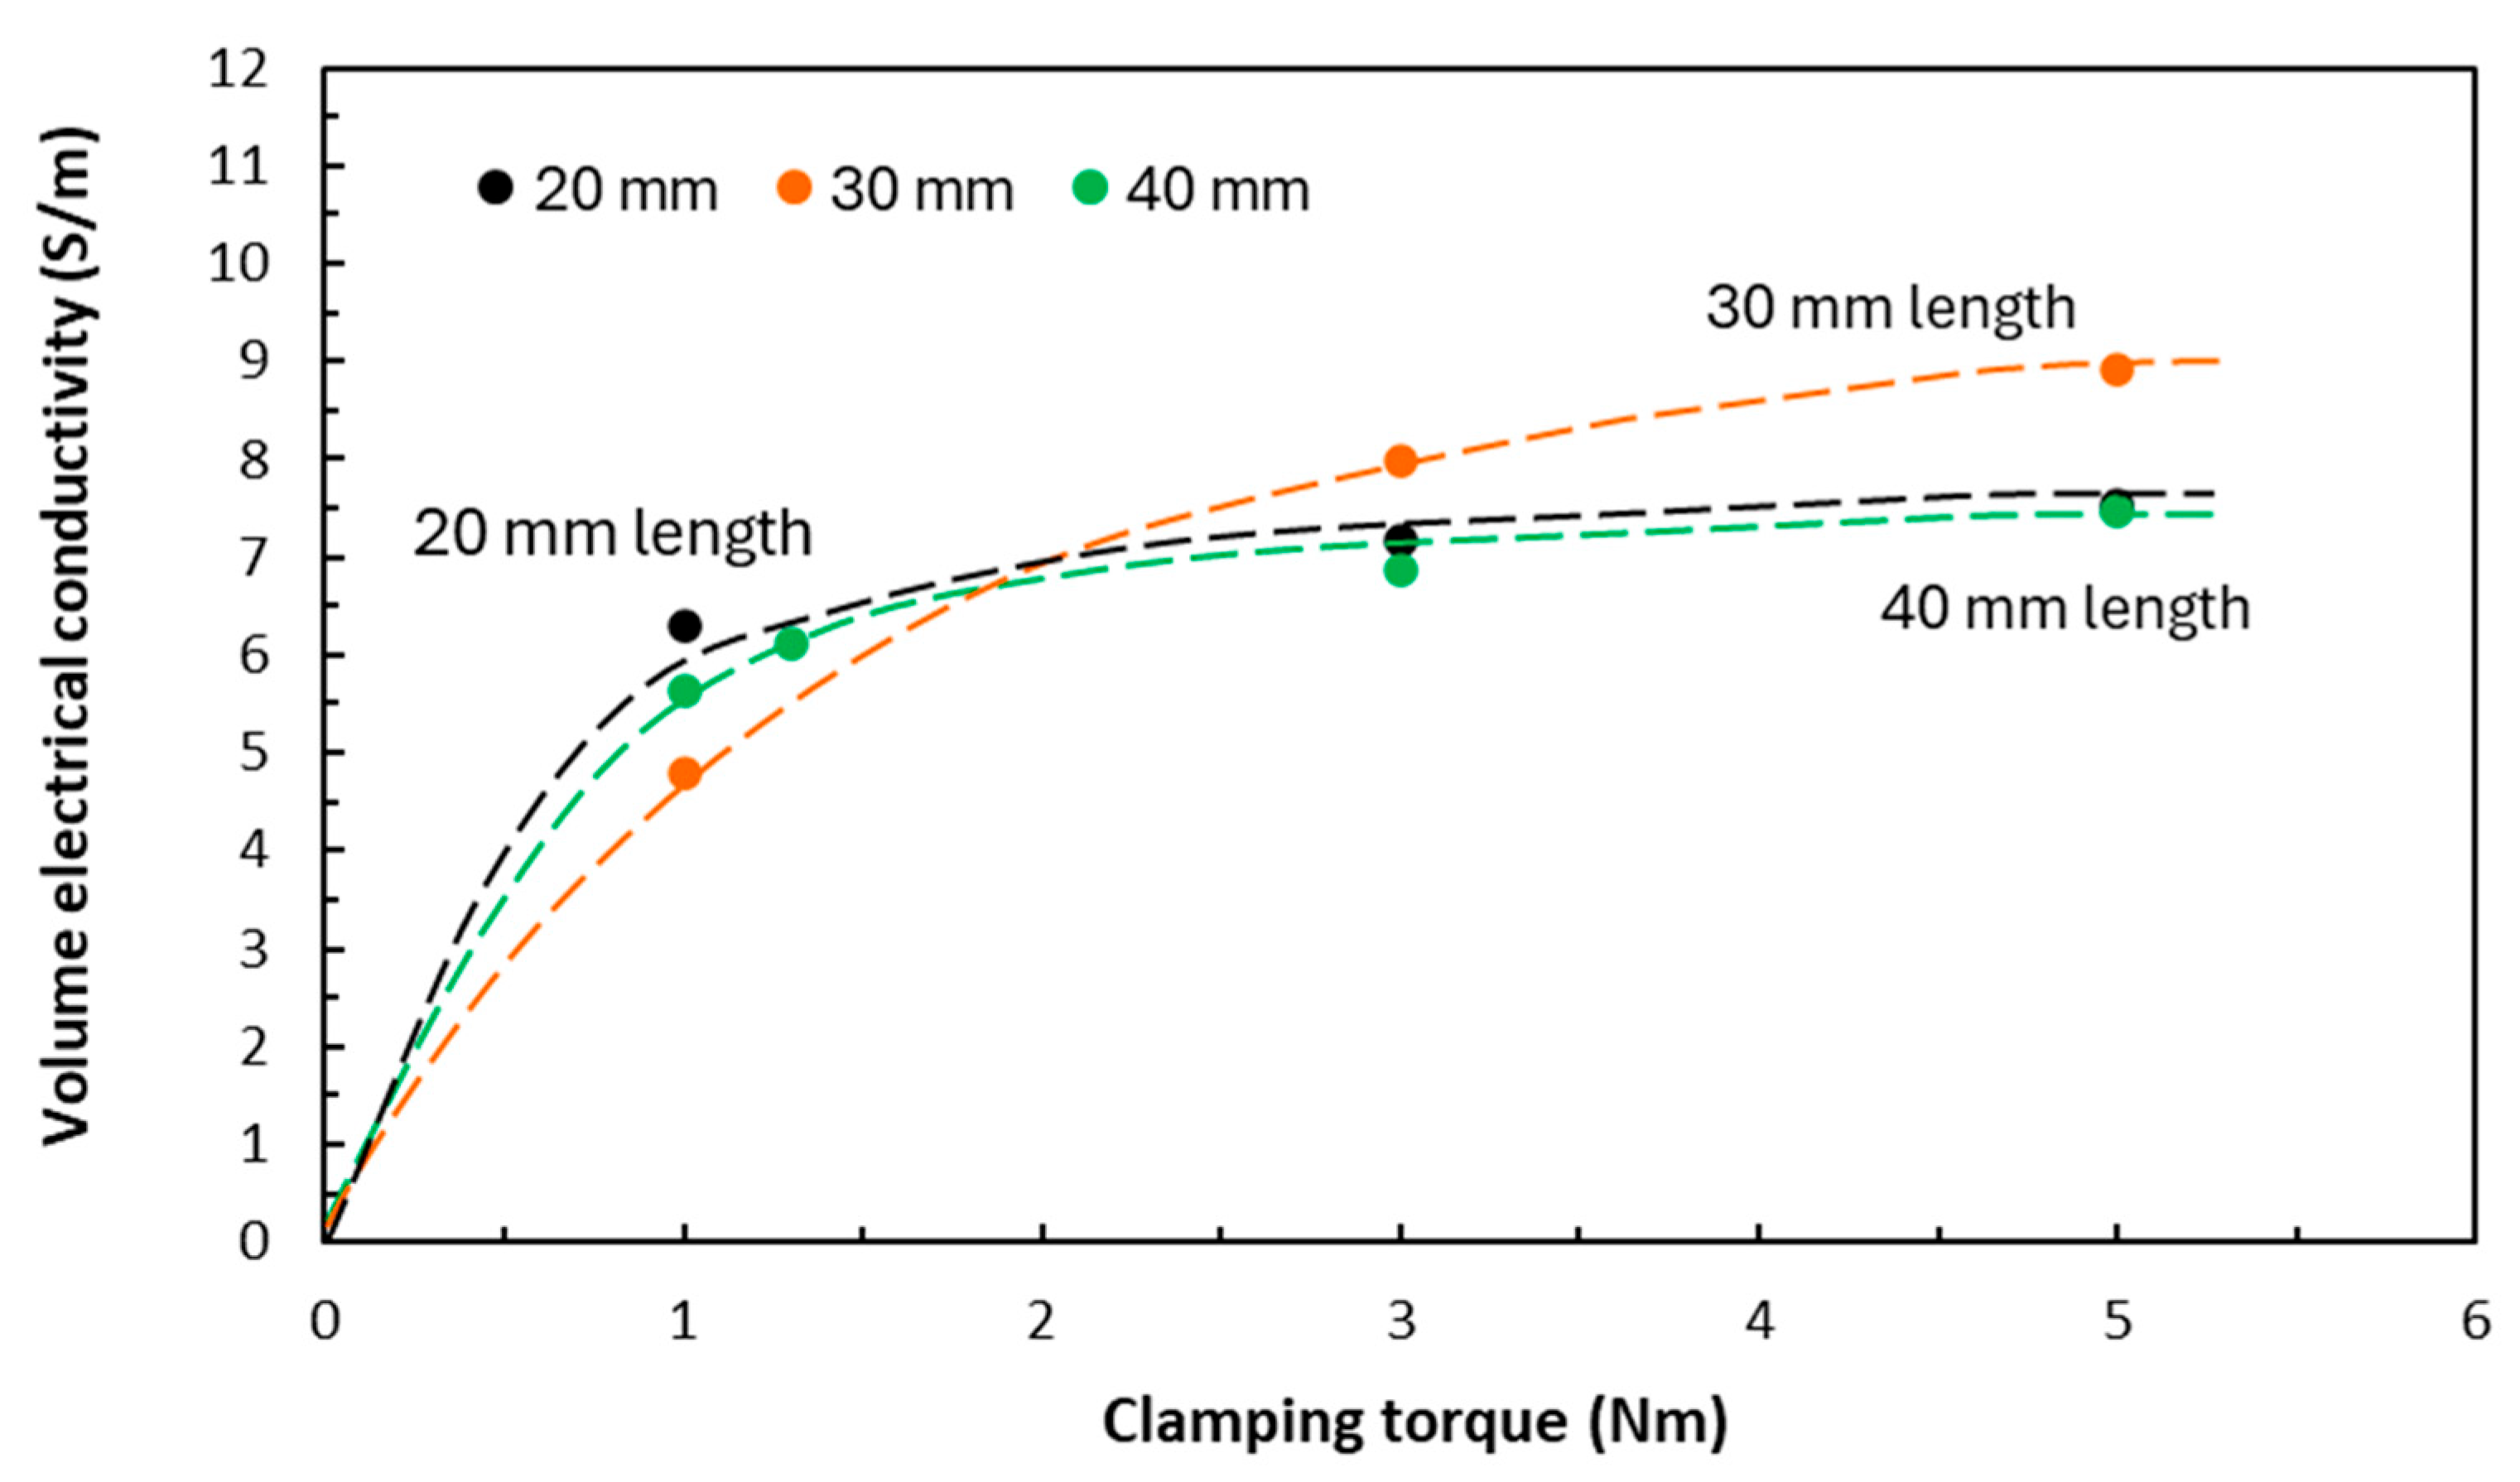
Figure 13.
In-plane electrical conductivities of 2 mm thick QI laminates with and without conductive paint.
Figure 13.
In-plane electrical conductivities of 2 mm thick QI laminates with and without conductive paint.
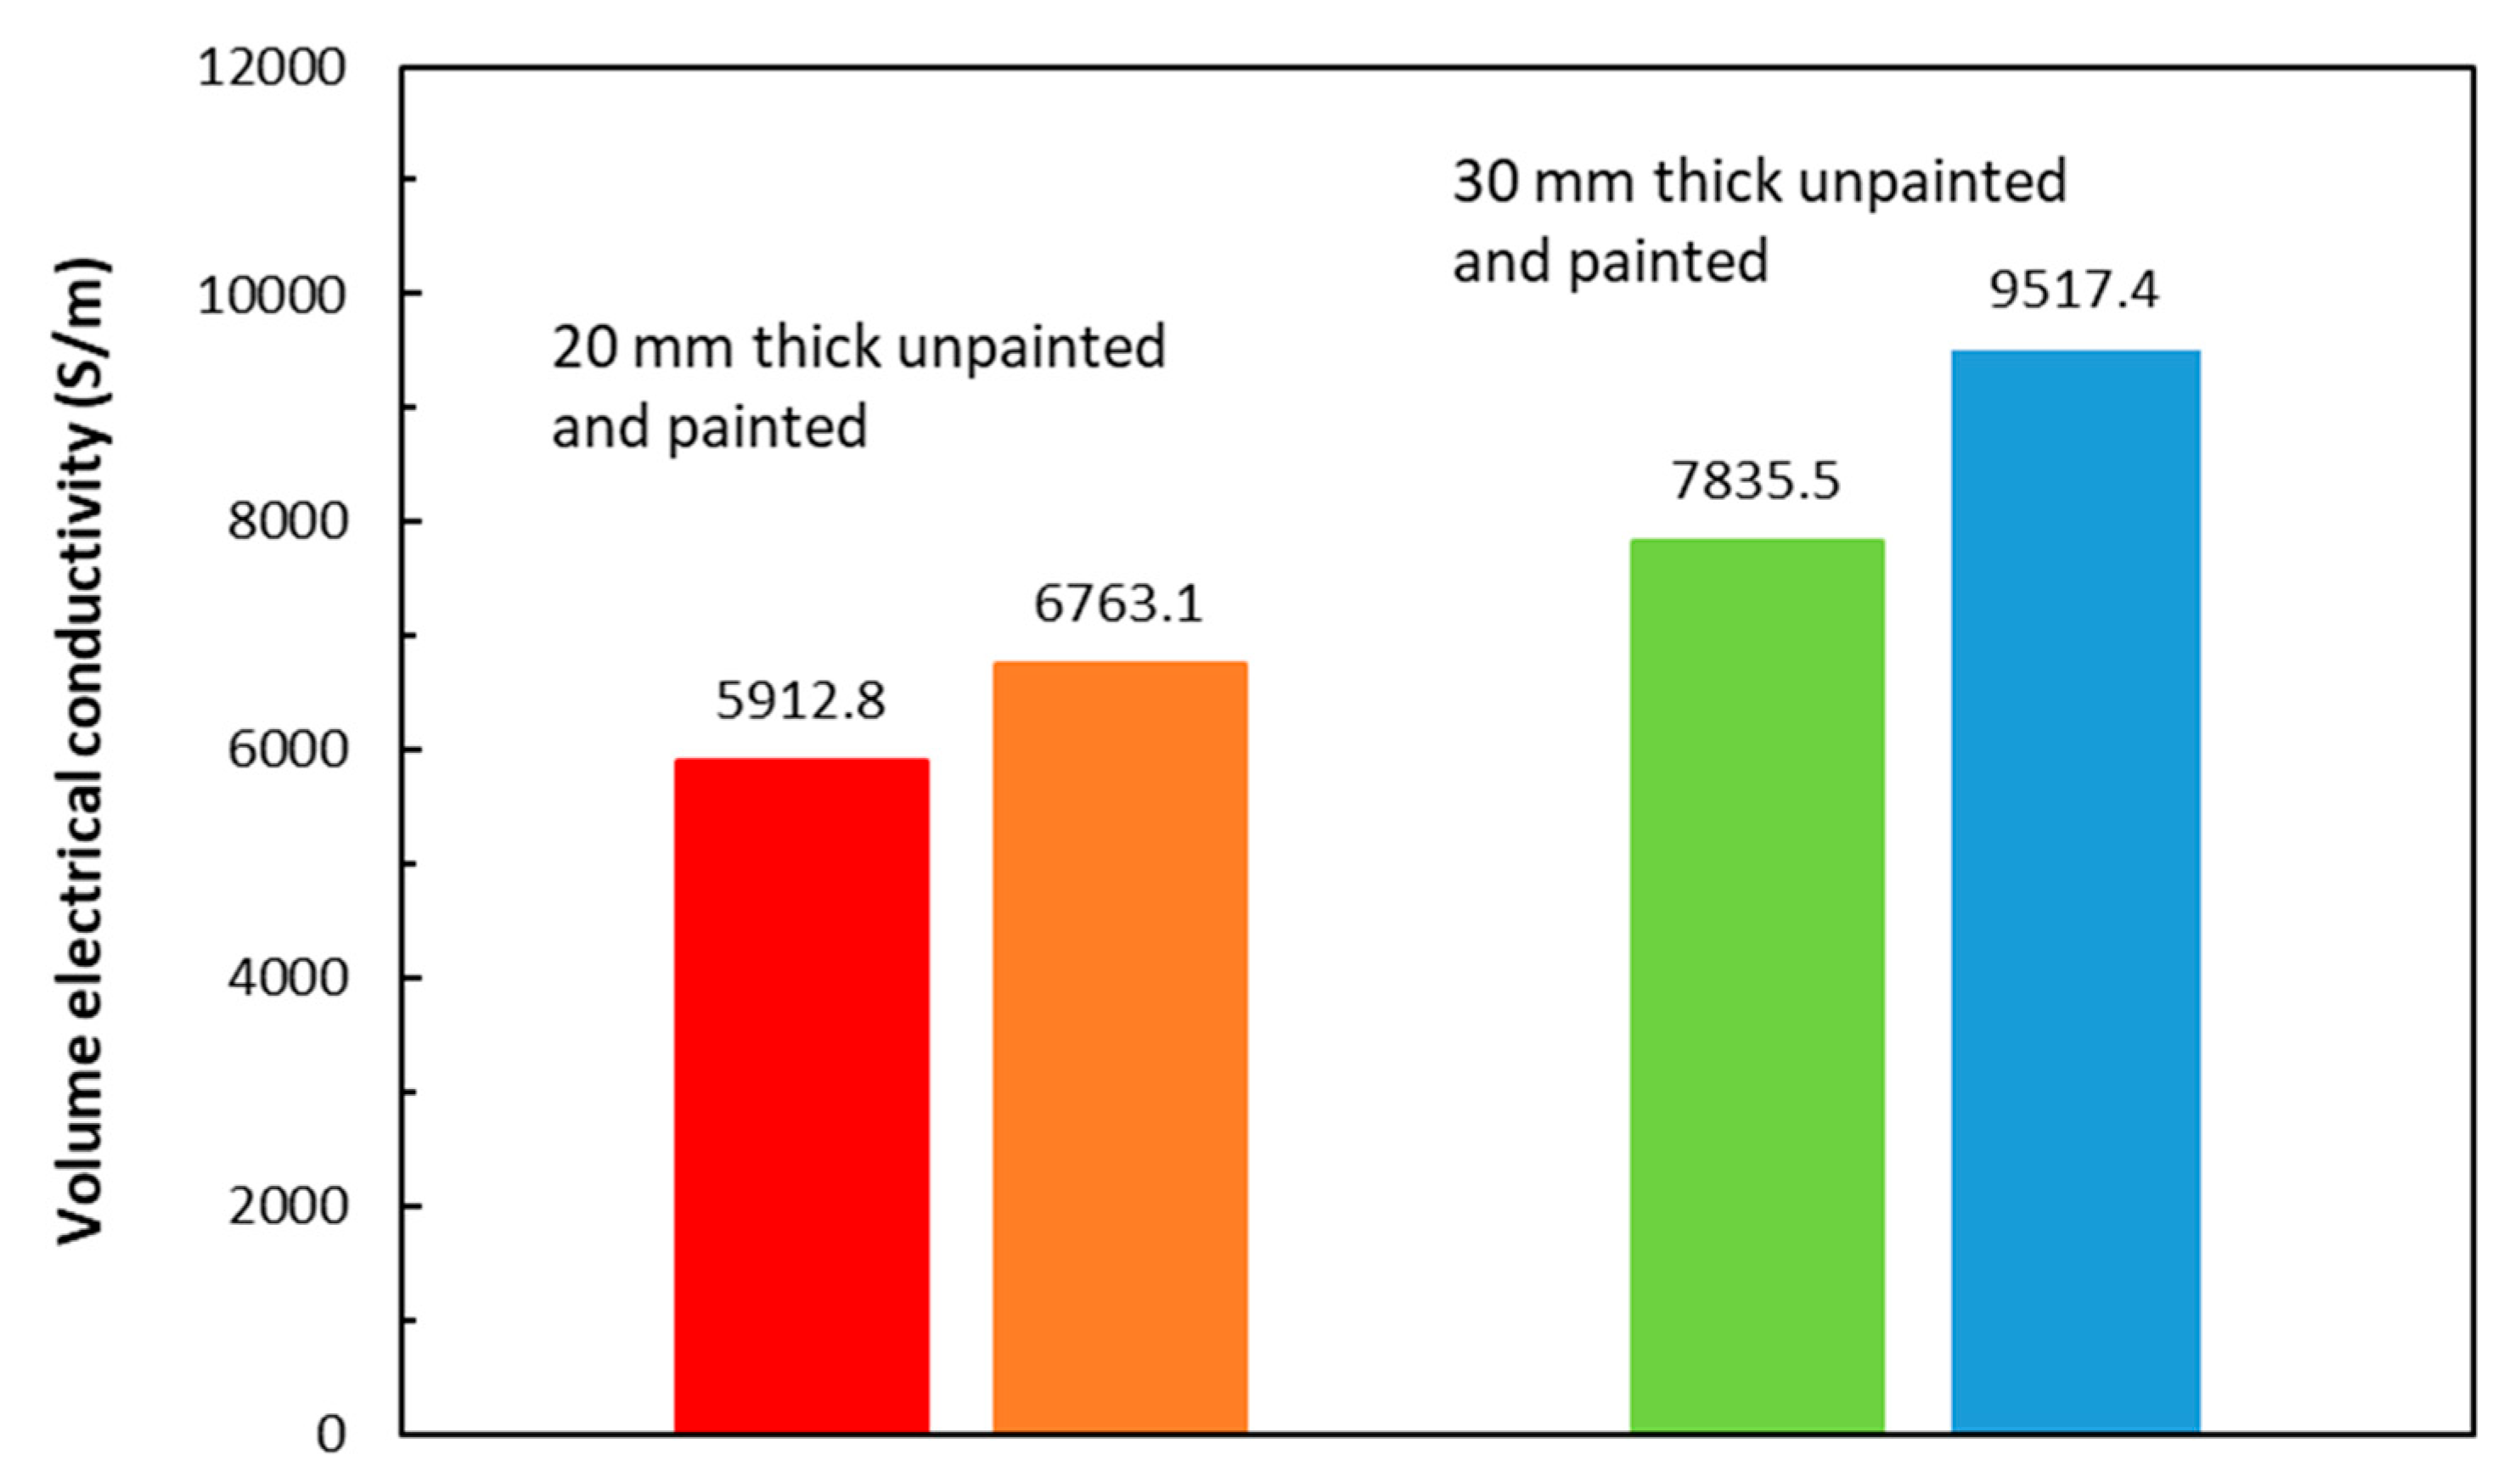
Figure 14.
TTT electrical conductivities of 2 mm thick QI laminates with and without conductive paint.
Figure 14.
TTT electrical conductivities of 2 mm thick QI laminates with and without conductive paint.
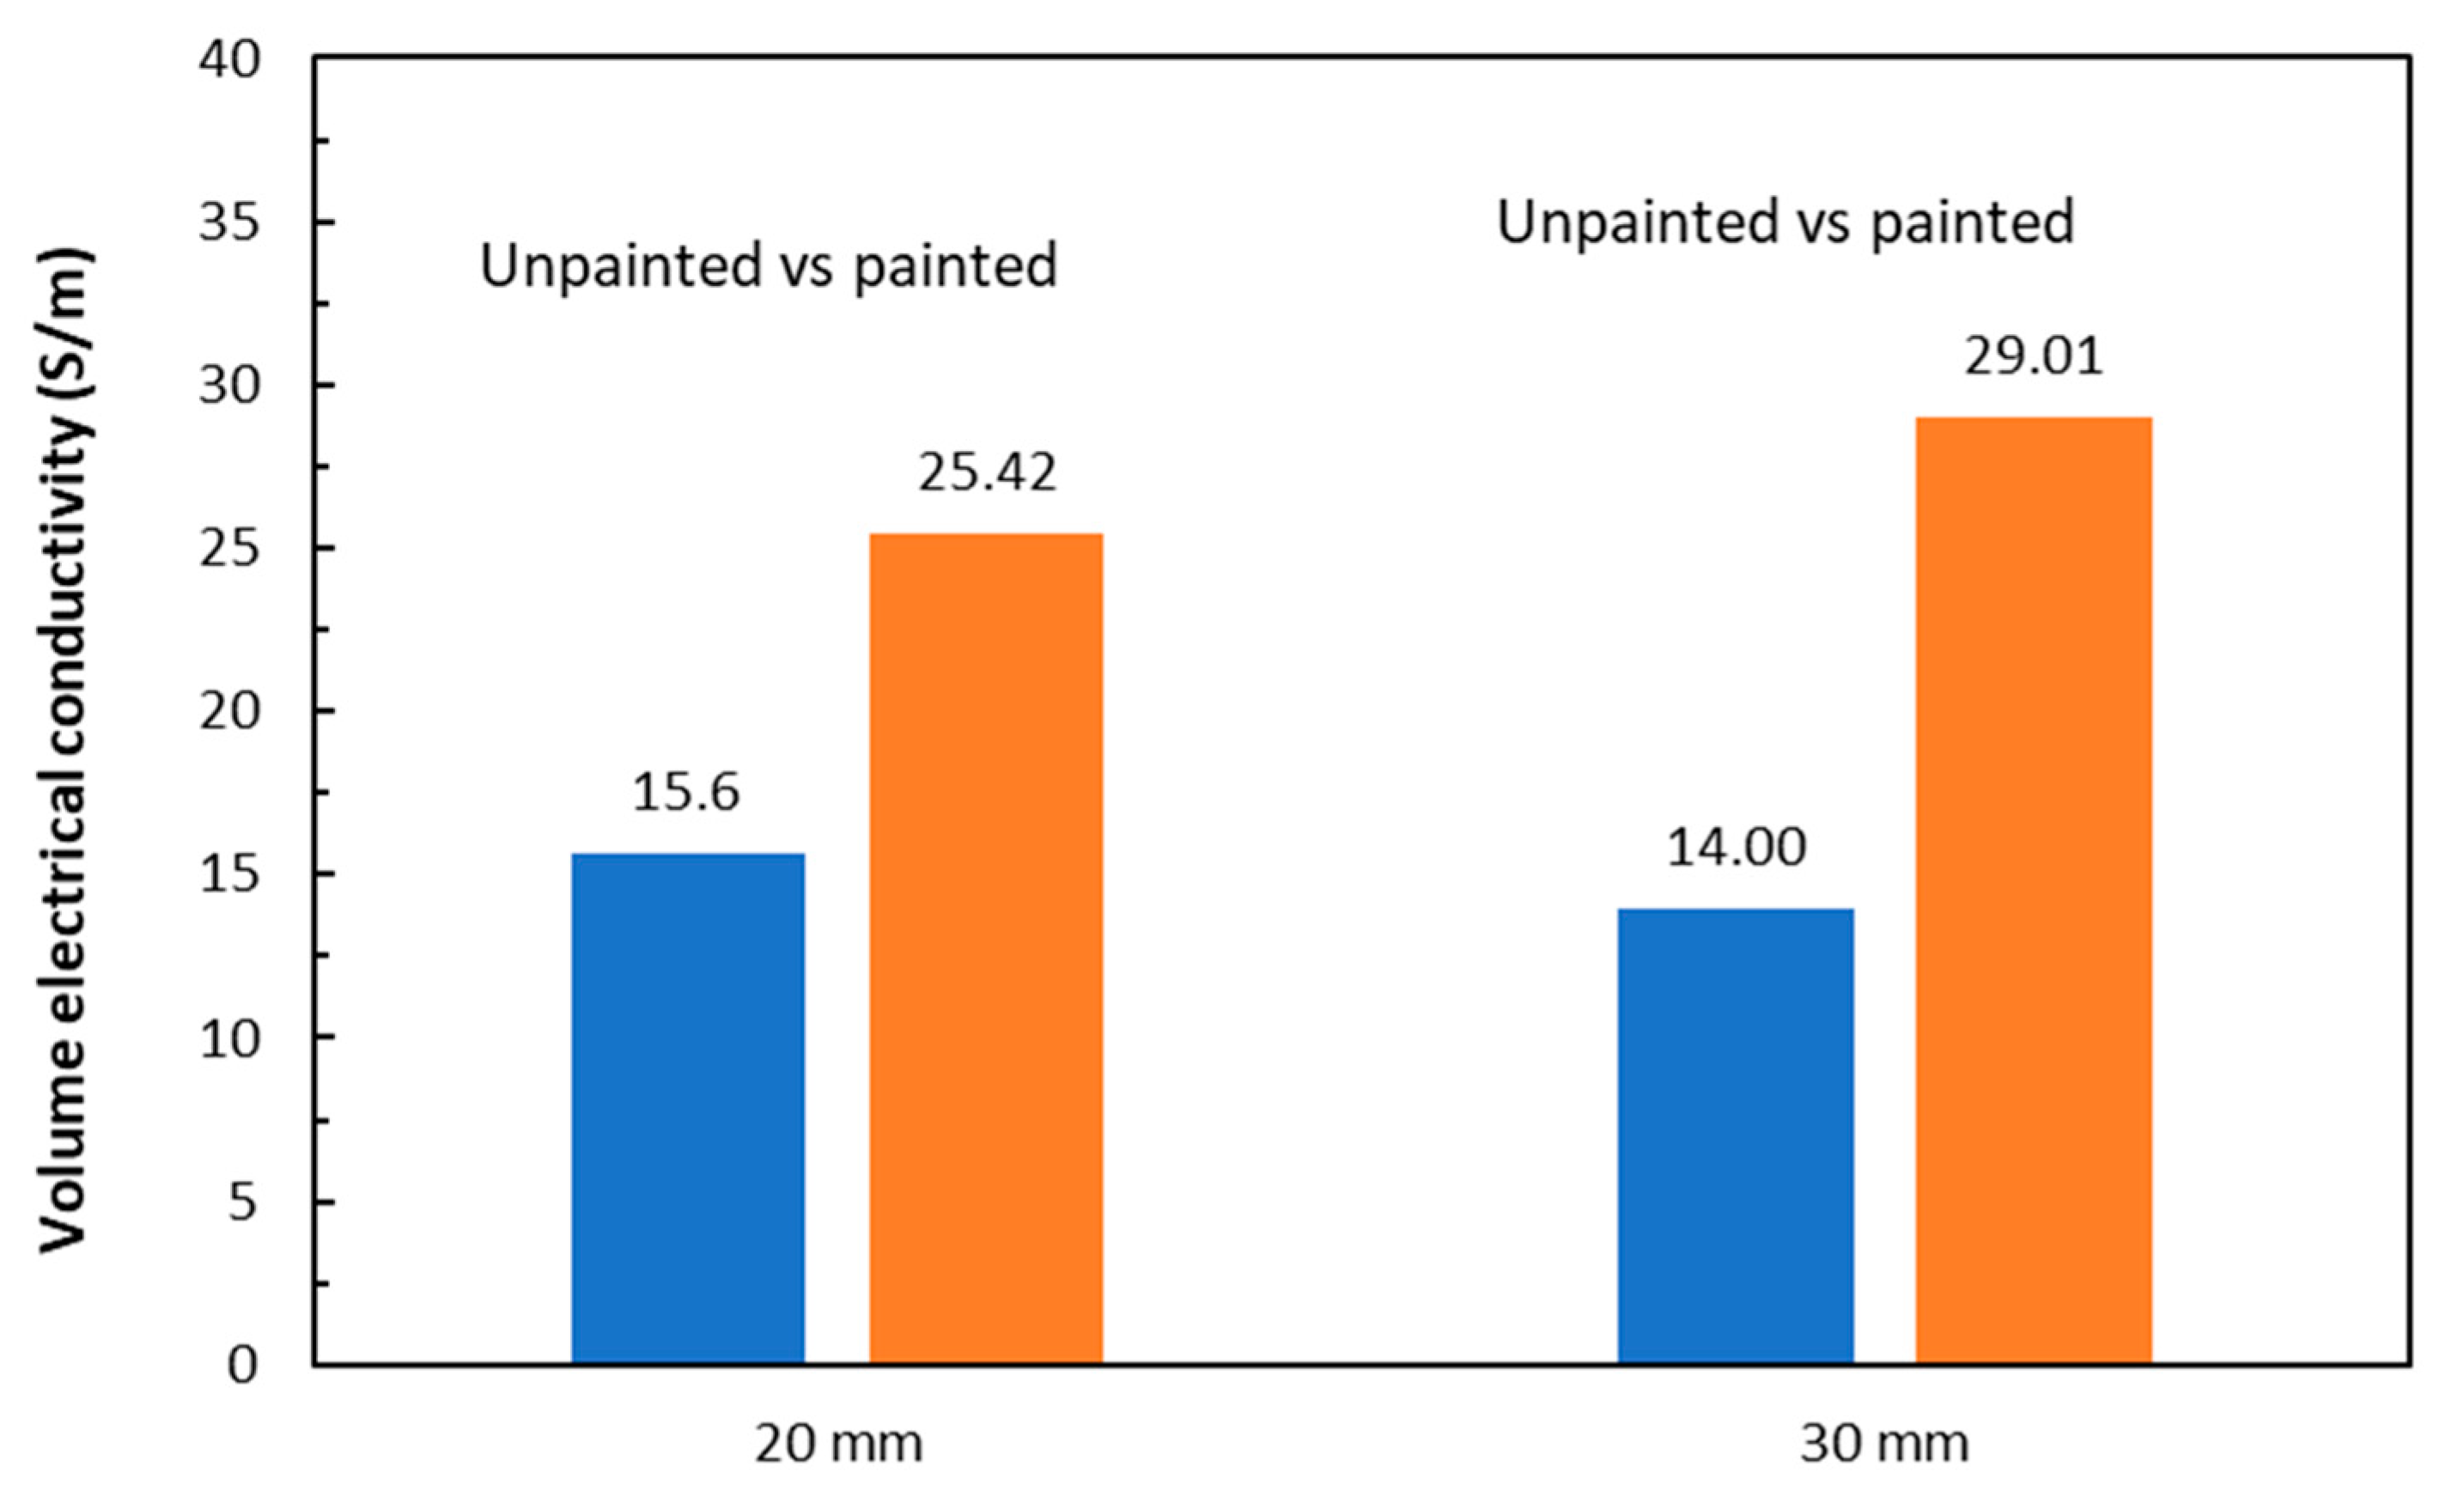
Figure 15.
As-manufactured vs machined surface in TTT measurements of 2 mm thick QI laminates.
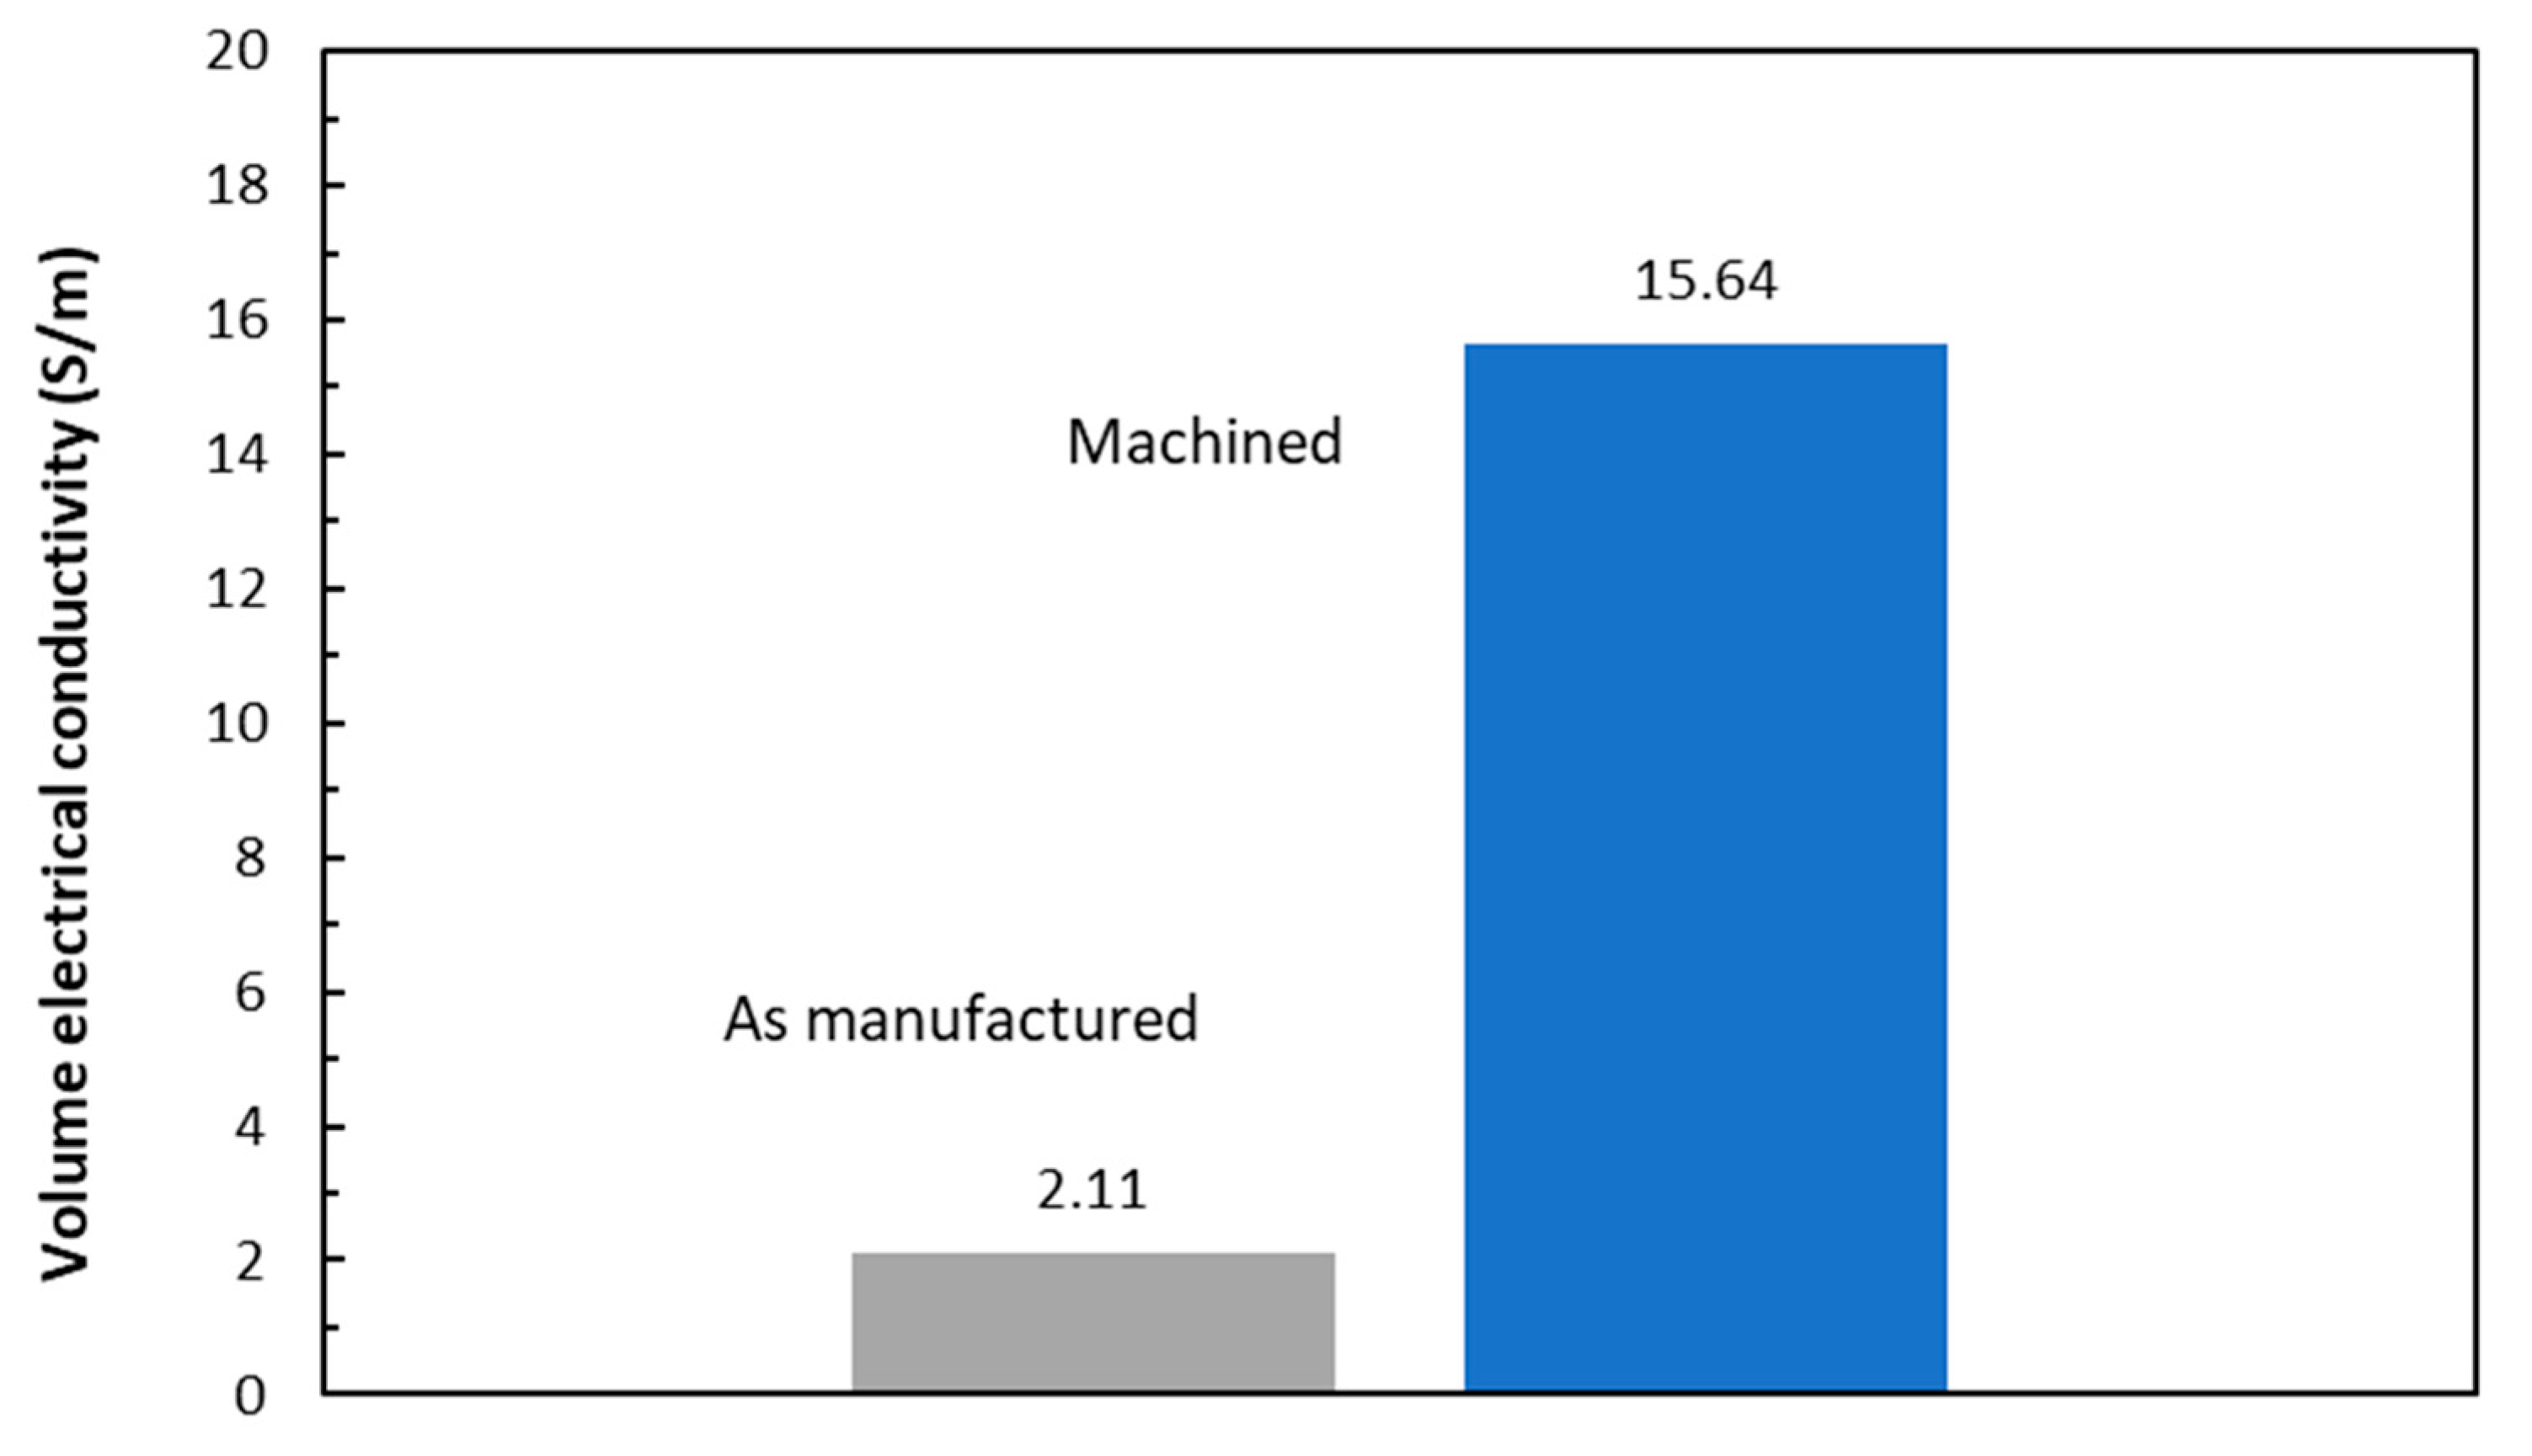
Figure 16.
Length effects on in-plane electrical conductivities for UD laminates.
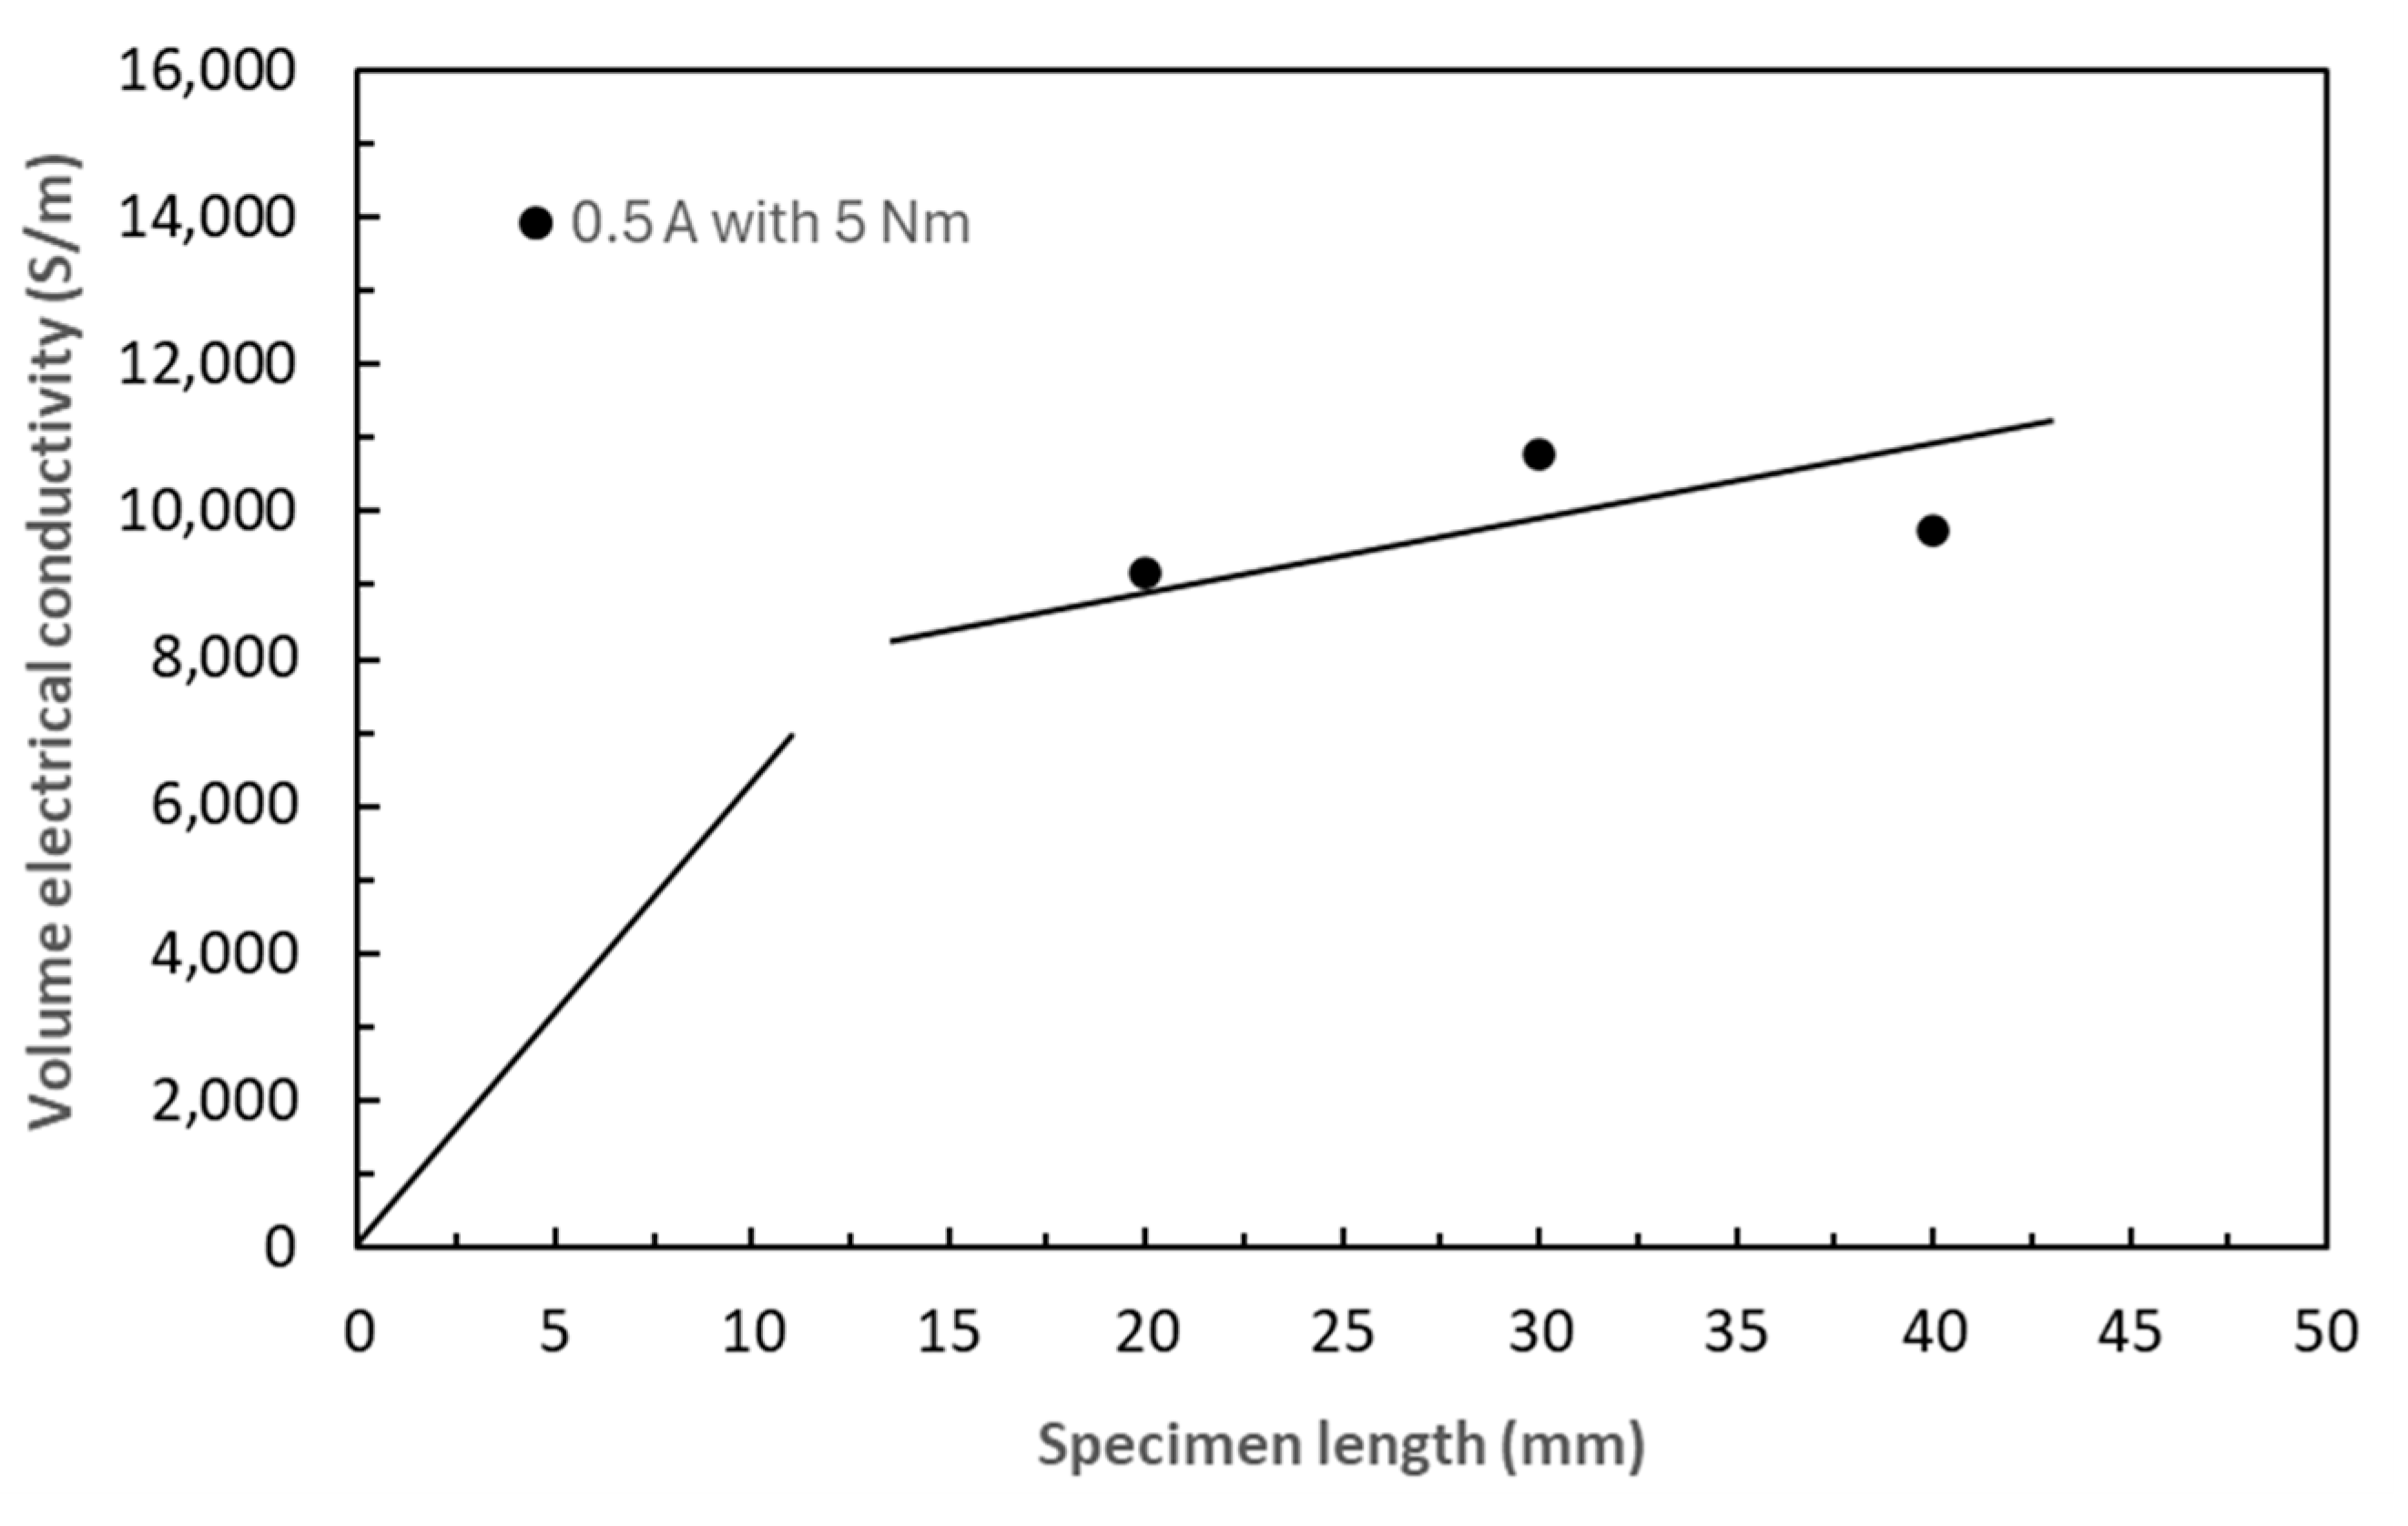
Figure 17.
Length effects on in-plane electrical conductivities for CP and QI laminates.
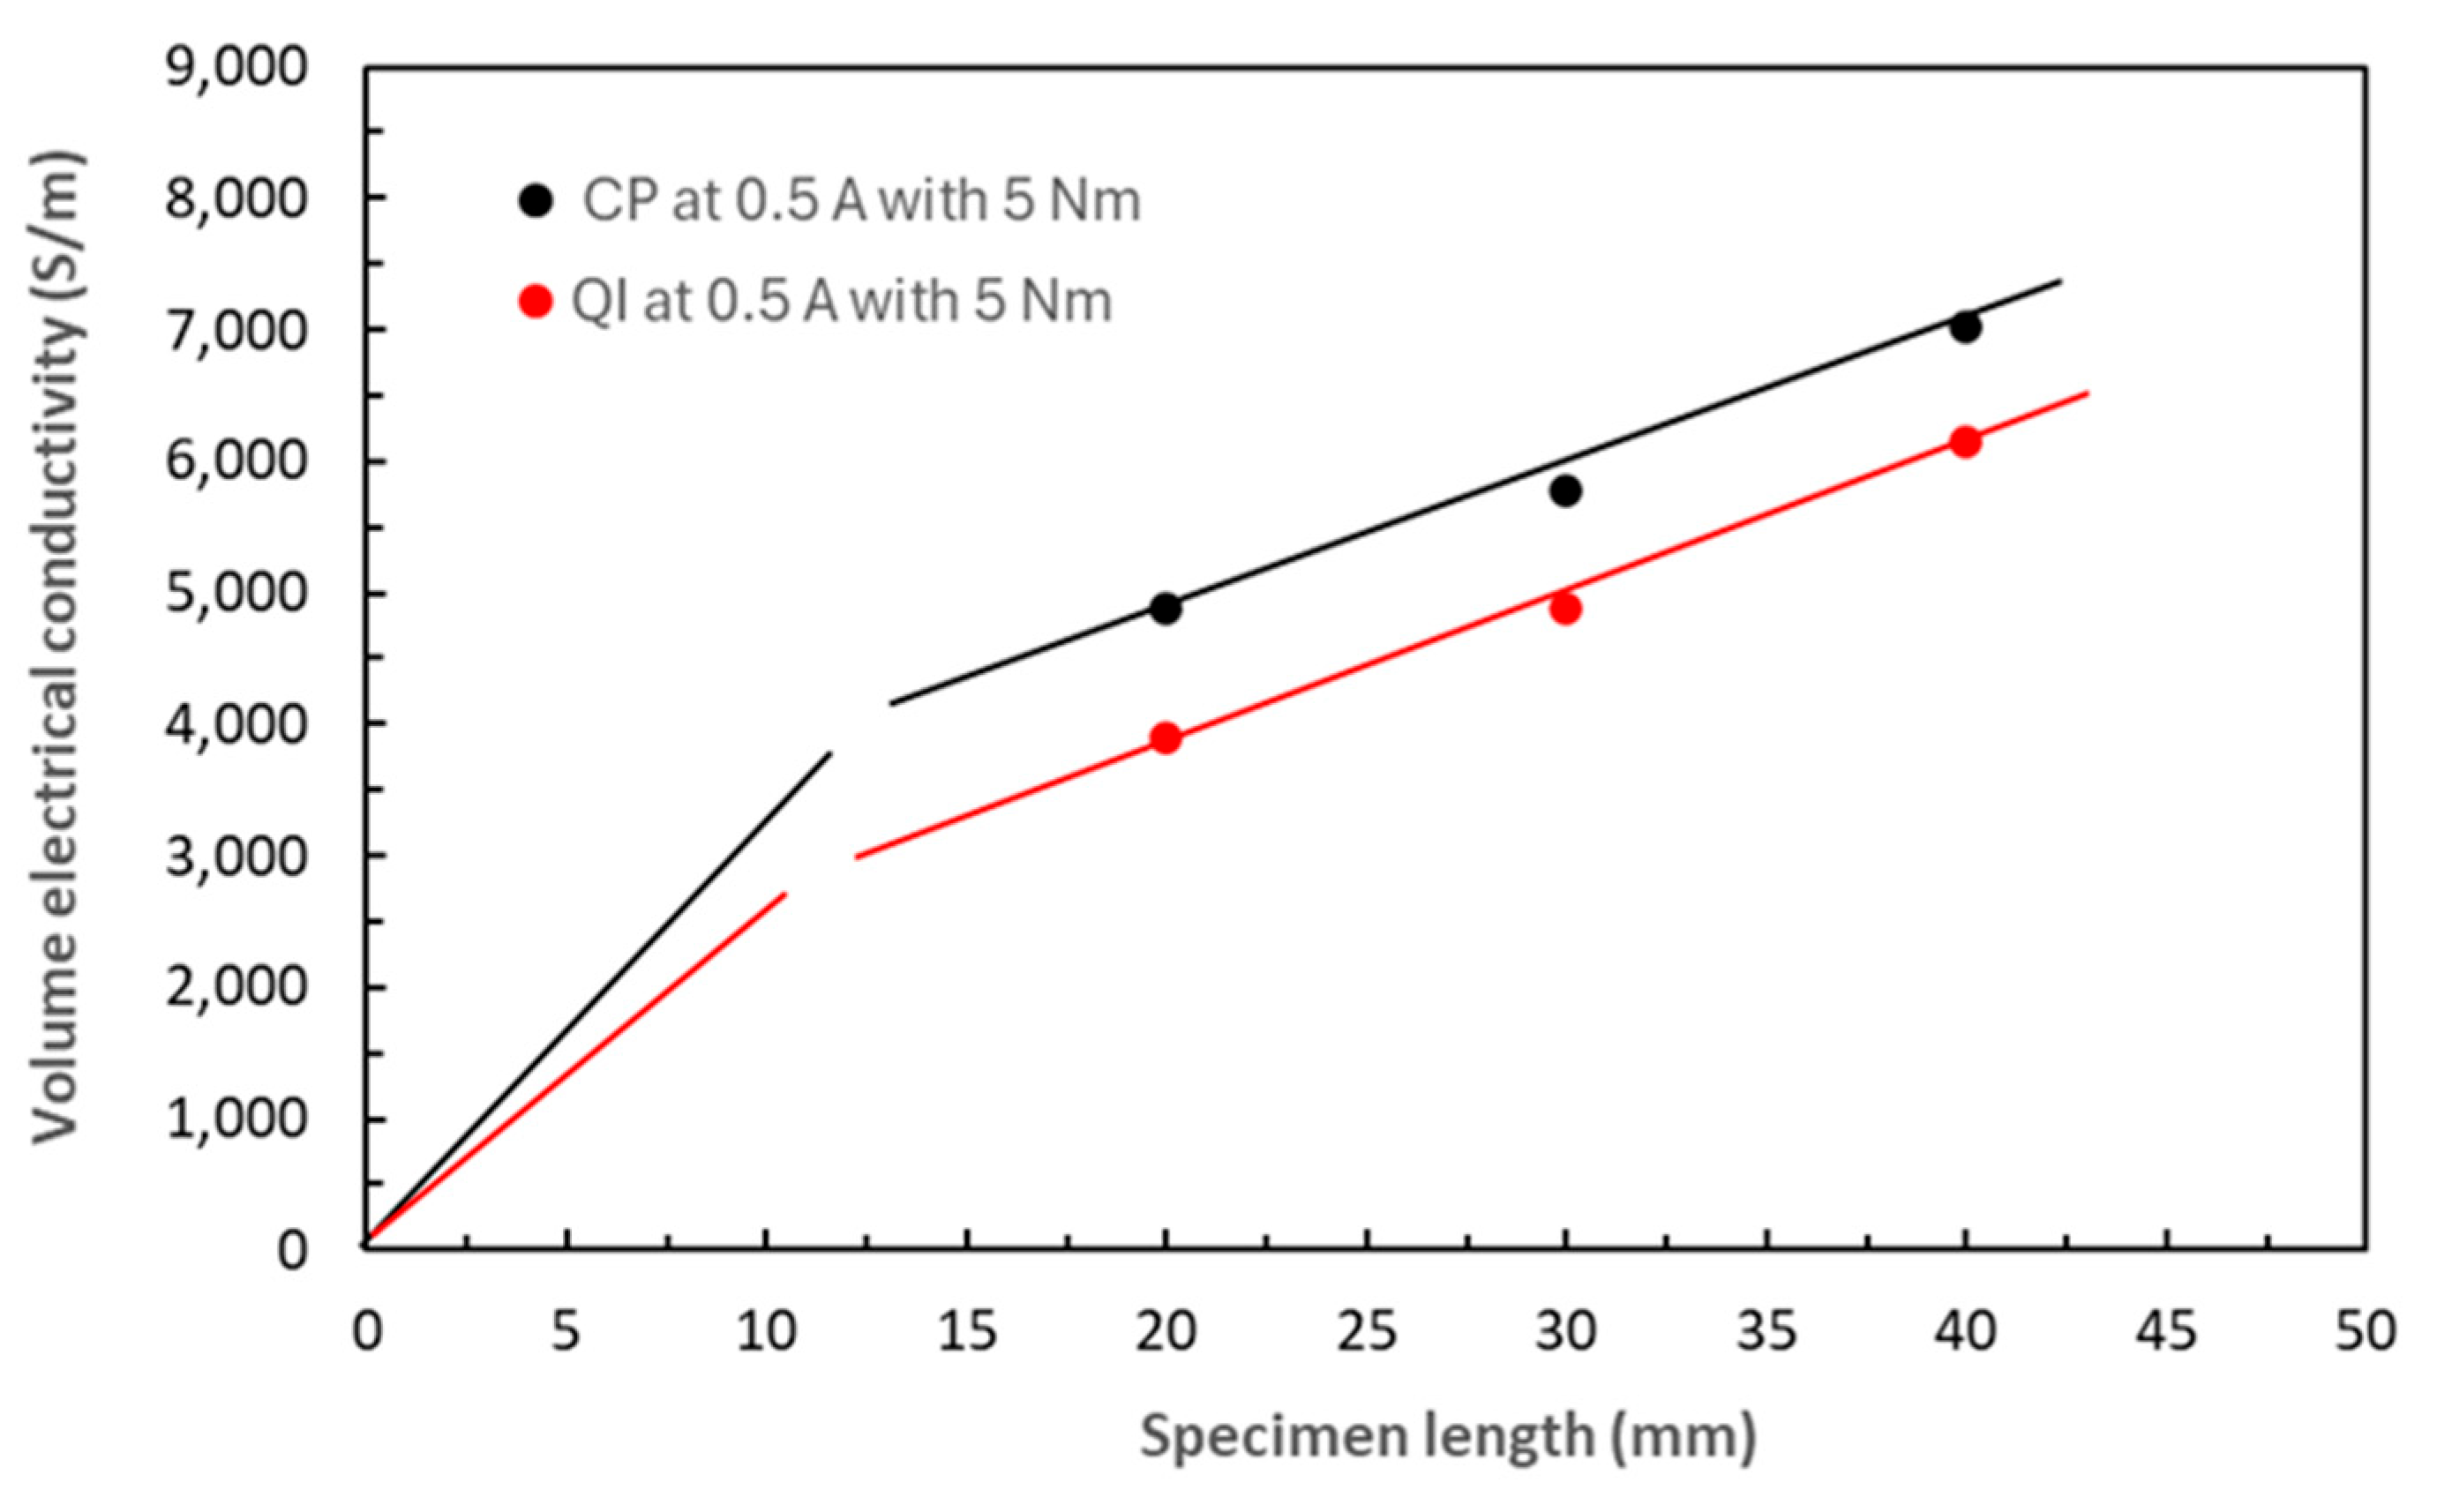
Figure 18.
Area effects on TTT electrical conductivities for UD laminates.
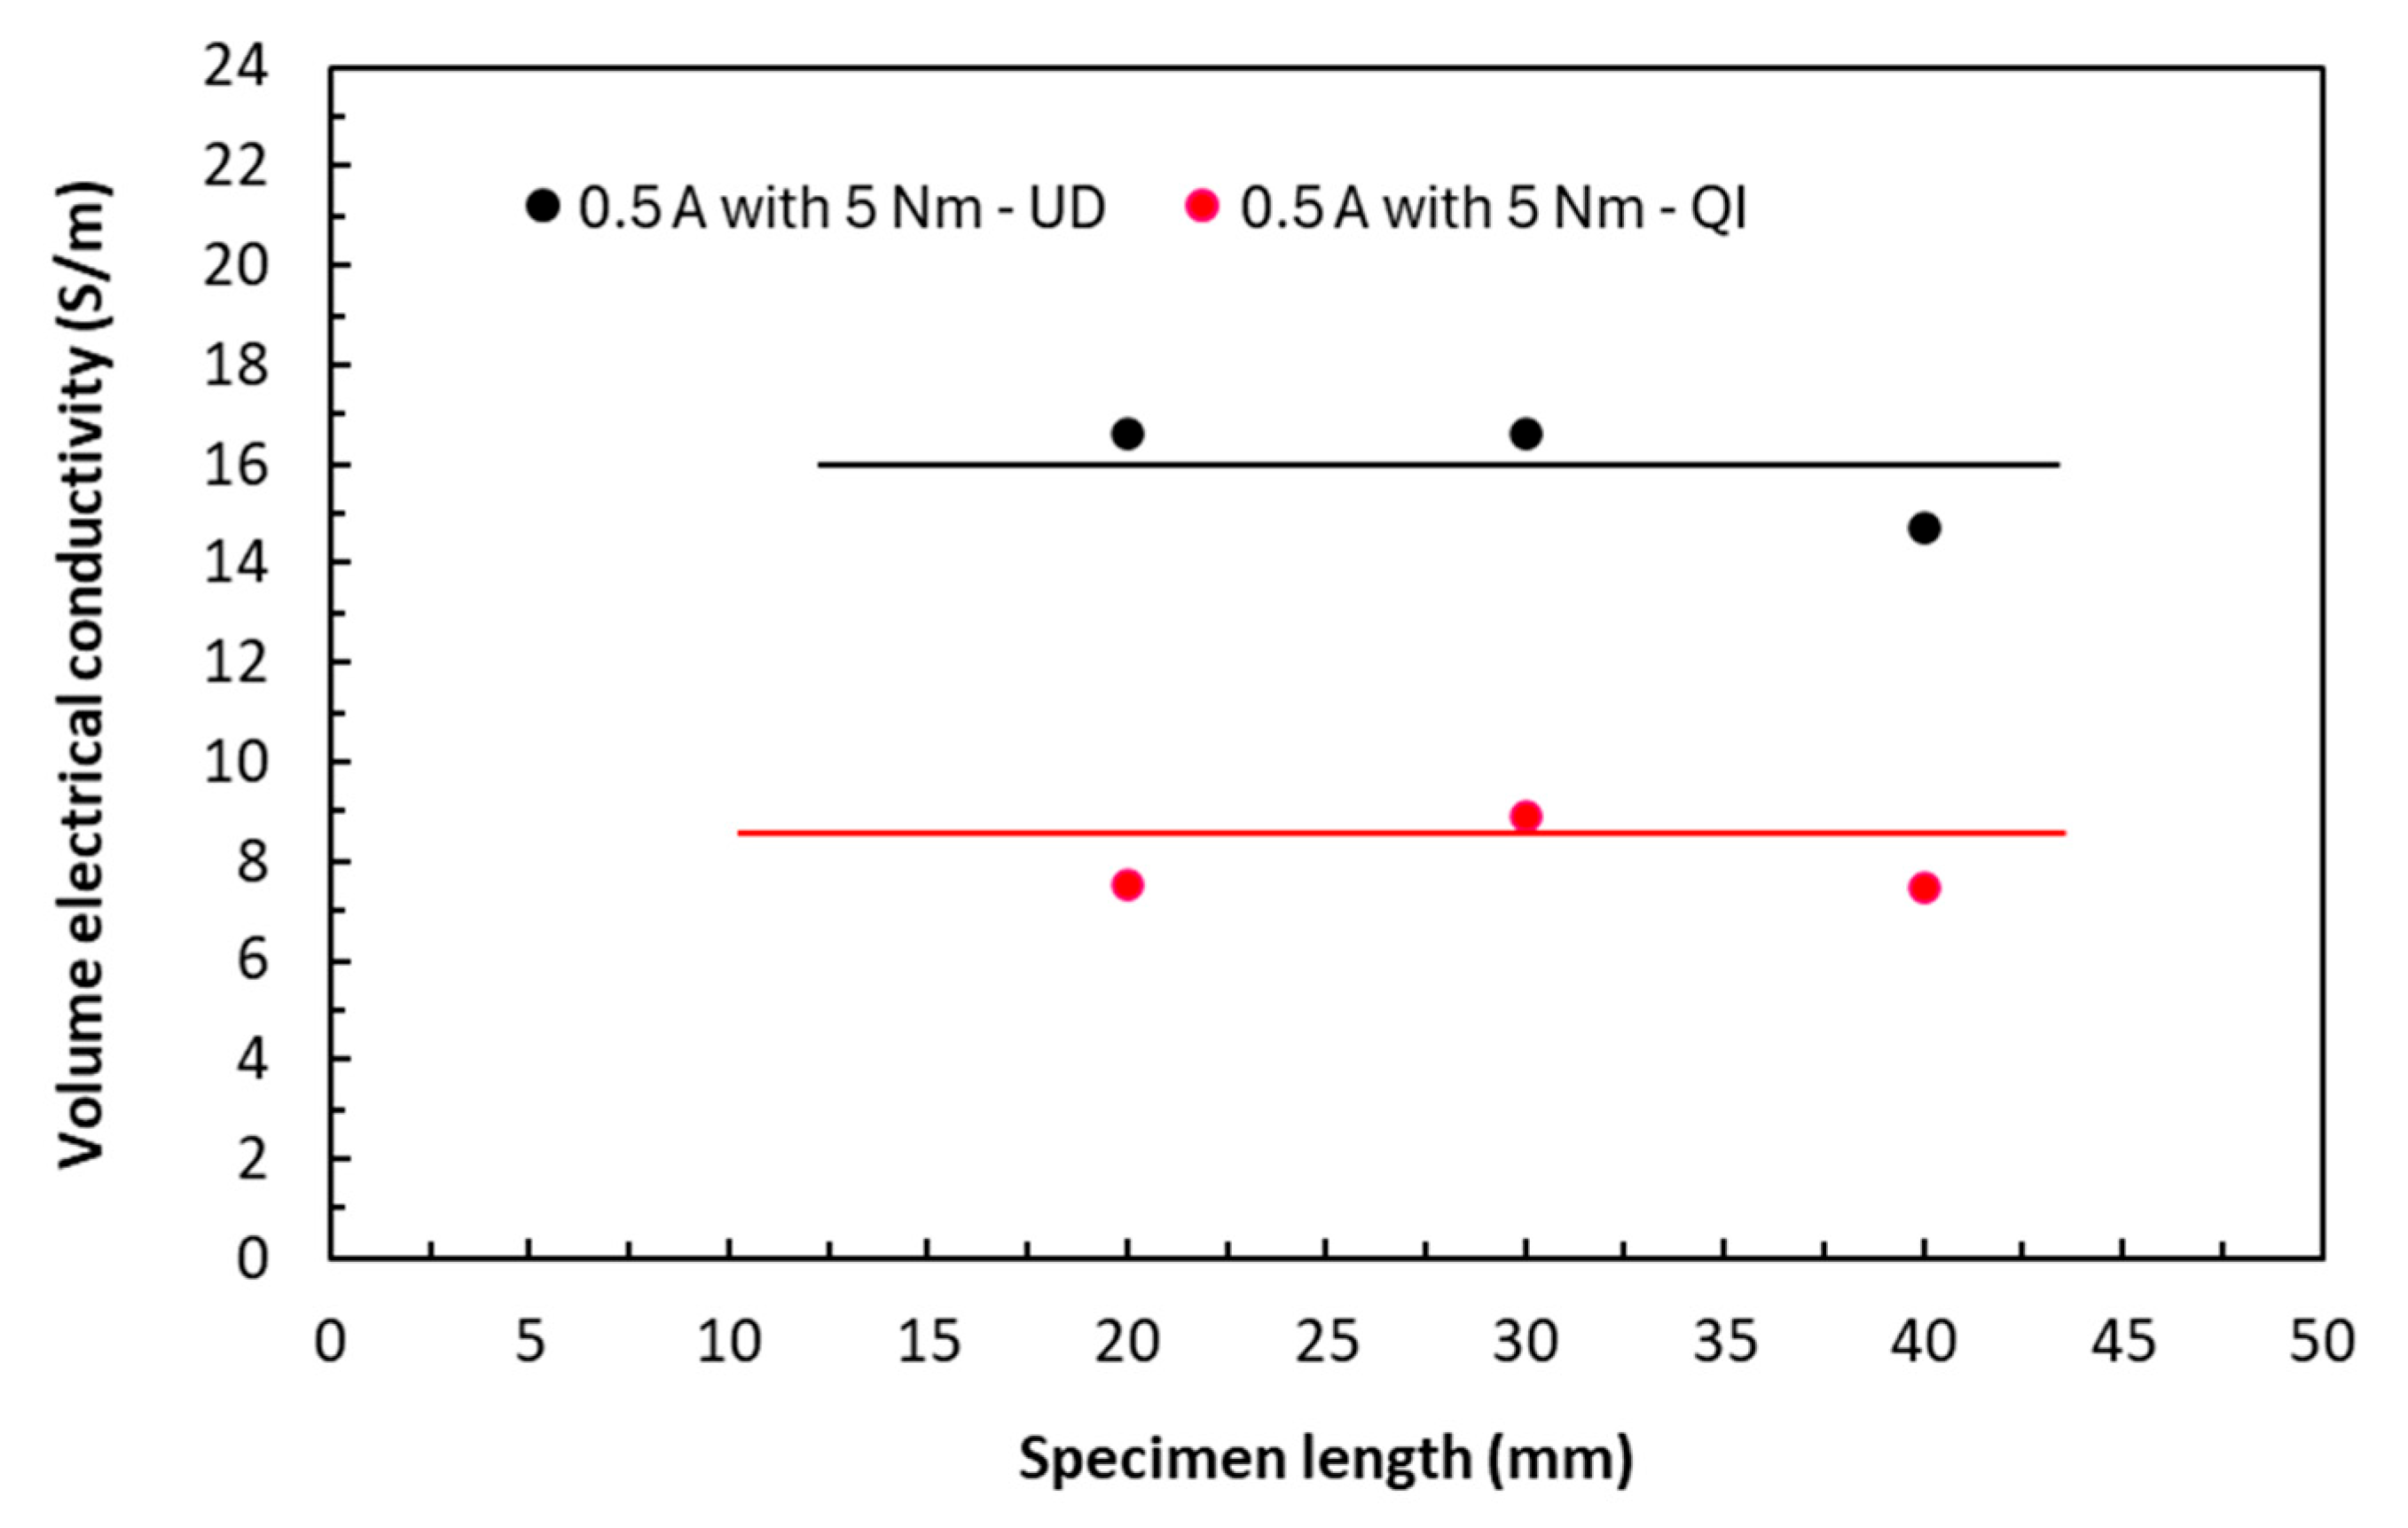

Table 1.
Lay-up effects on in-plane volume electrical conductivity in 34-700/LTM carbon/epoxy laminates
measured at 0.5 A with a clamping torque of 5 Nm.
Table 1.
Lay-up effects on in-plane volume electrical conductivity in 34-700/LTM carbon/epoxy laminates
measured at 0.5 A with a clamping torque of 5 Nm.
| Thickness | Dimensions | Lay-up | Electrical conductivity | Lay-up | Electrical conductivity | Diff. from UD | Lay-up | Electrical conductivity | Diff. from UD |
|---|---|---|---|---|---|---|---|---|---|
| mm | mm x mm | - | S/m ± S.D. | - | S/m ± S.D. | % | - | S/m ± S.D. | % |
| 2 | 10 x 10 | UD | 10544 ± 2236 | - | - | - | QI | 6357 ± 1107 | +60.8 |
| 20 x 10 | 11815 ± 1447 | - | - | - | 8128 ± 892 | +83.5 | |||
| 30 x 10 | 11780 ± 964 | - | - | - | 11074 ± 1081 | +150.7 | |||
| 40 x 10 | 18978 ± 3099 | - | - | - | 13035 ± 1117 | +83.2 | |||
| 4 | 20 x 10 | UD | 9155 ± 1614 | CP | 4877 ± 1024 | +6.5 | QI | 3892 ± 492 | +13.4 |
| 30 x 10 | 10762 ± 2133 | 5773 ± 528 | +7.3 | 4888 ± 731 | +21.1 | ||||
| 40 x 10 | 9744 ± 3470 | 7016 ± 1092 | +44.0 | 6151 ± 624 | +68.3 |
Table 2.
Lay-up effects on TTT volume electrical conductivity in 34-700/LTM carbon/epoxy laminates measured at 0.5 A with a clamping torque of 5 Nm.
Table 2.
Lay-up effects on TTT volume electrical conductivity in 34-700/LTM carbon/epoxy laminates measured at 0.5 A with a clamping torque of 5 Nm.
| Thickness | Dimensions | Lay-up | Electrical conductivity | Lay-up | Electrical conductivity | Lay-up | Electrical conductivity |
|---|---|---|---|---|---|---|---|
| mm | mm x mm | - | S/m ± S.D. | - | S/m ± S.D. | - | S/m ± S.D. |
| 2 | 10 x 10 | UD | 9.75 ± 5.82 | - | - | QI | 12.0 ± 4.98 |
| 20 x 10 | 6.23 ± 2.79 | - | - | 4.15 ± 1.04 | |||
| 30 x 10 | 2.22 ± 0.96 | - | - | 3.98 ± 1.81 | |||
| 40 x 10 | 1.36 ± 0.58 | - | - | 3.18 ± 0.82 | |||
| 4 | 20 x 10 | UD | 16.6 ± 7.50 | CP | - | QI | 7.54 ± 0.14 |
| 30 x 10 | 16.6 ± 4.99 | 6.87 ± 0.10 | 8.93 ± 1.47 | ||||
| 40 x 10 | 14.7 ± 5.09 | 5.12 ± 0.08 | 7.48 ± 0.47 |
Disclaimer/Publisher’s Note: The statements, opinions and data contained in all publications are solely those of the individual author(s) and contributor(s) and not of MDPI and/or the editor(s). MDPI and/or the editor(s) disclaim responsibility for any injury to people or property resulting from any ideas, methods, instructions or products referred to in the content. |
© 2025 by the authors. Licensee MDPI, Basel, Switzerland. This article is an open access article distributed under the terms and conditions of the Creative Commons Attribution (CC BY) license (http://creativecommons.org/licenses/by/4.0/).
Copyright: This open access article is published under a Creative Commons CC BY 4.0 license, which permit the free download, distribution, and reuse, provided that the author and preprint are cited in any reuse.


