Preprint
Article

This version is not peer-reviewed.

Flow Cytometric Analysis and Sorting of Enteric Nervous System Cells: From Human to Mouse, an Optimized Protocol

A peer-reviewed article of this preprint also exists.

Submitted:

10 March 2025

Posted:

11 March 2025

You are already at the latest version

Abstract

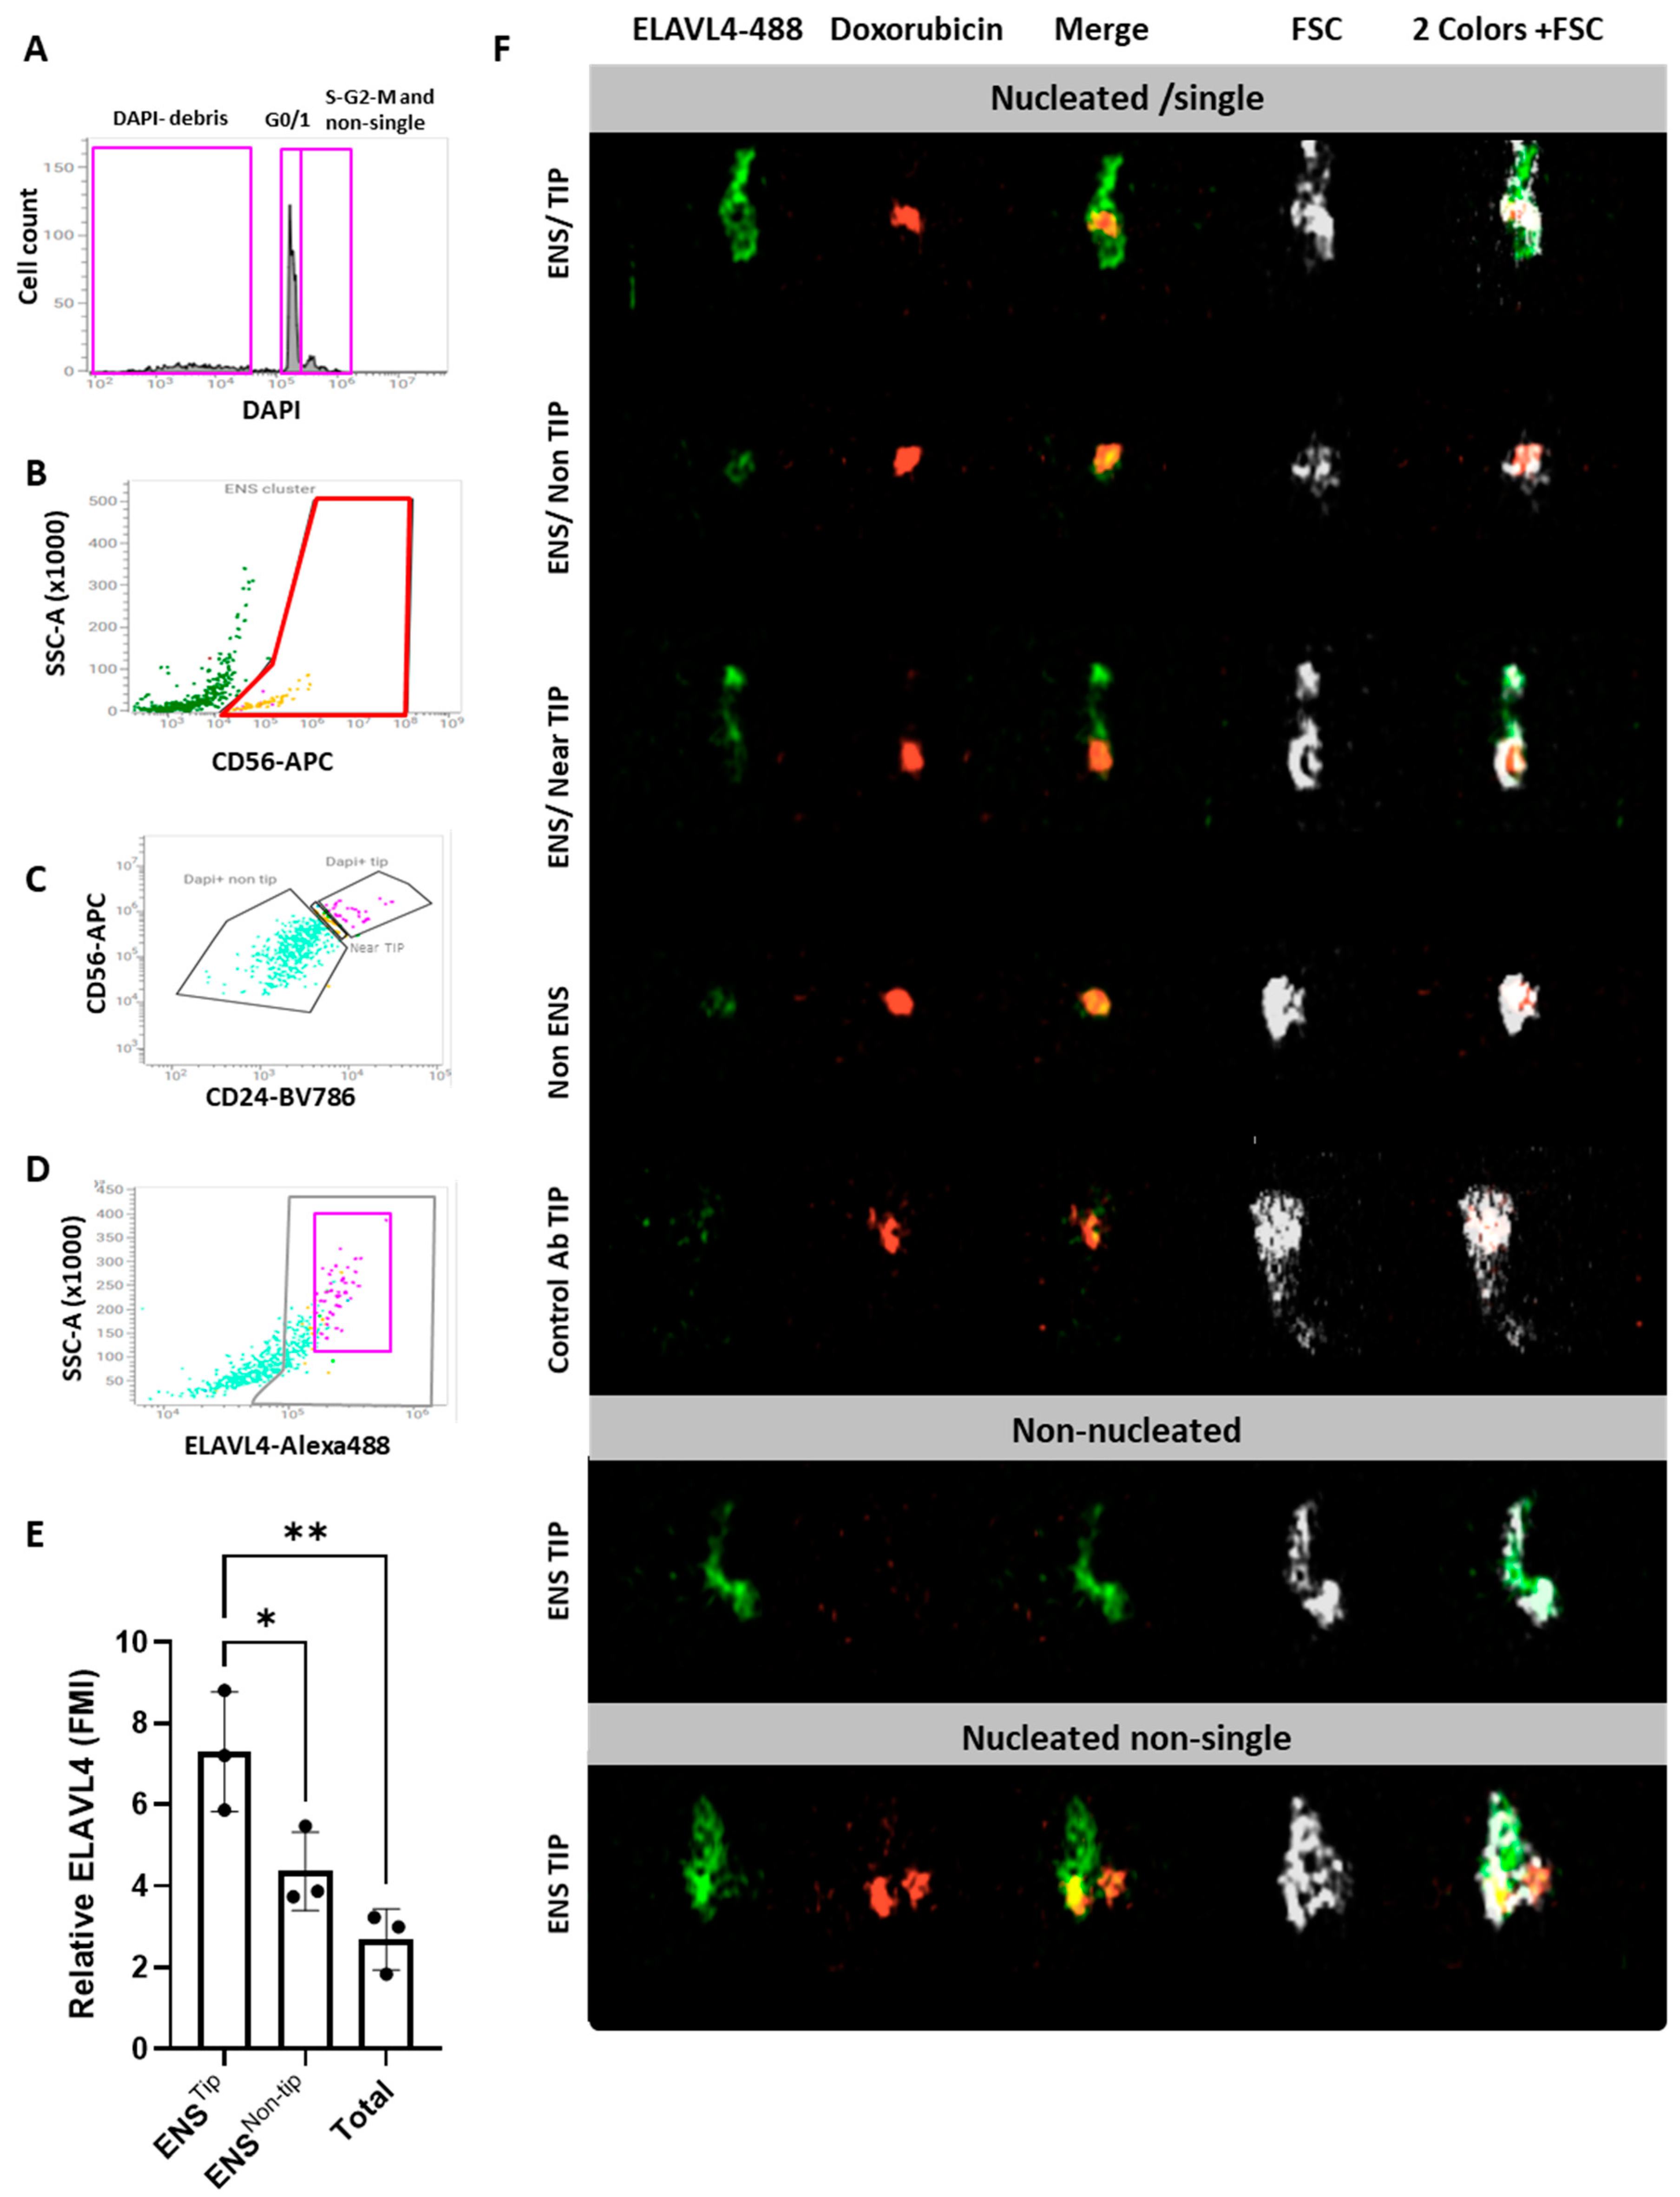
Isolation of neurons and glial cells from the enteric nervous system (ENS) enables ex-vivo studies, including analysis of genomic and transcriptomic profiles. While we previously reported a fluorescence activated cell sorting (FACS)-based isolation protocol for human ENS cells, no equivalent exists for mice. As directly applying the human protocol to mouse tissue, resulted in low recovery of live ENS cells, we compared different protocols to optimize tissue dissociation of mouse colons. A 30-minute Liberase-based digestion showed optimal recovery of viable ENS cells, with CD56 and CD24 emerging as the most reliable markers to select and subdivide these cells. ENS identity was further validated by FACS using neuronal (TUBB3) and glial (SOX10) markers, and reverse transcriptase quantitative PCR (RT-qPCR) on sorted fractions. Overall, the mouse ENS expression profile significantly overlapped with the human one, confirming that current dissociation protocols yield a mixed staining pattern of enteric neurons and glia. Nonetheless, using the imaging flow cytometer BD S8 FACS Discover, and ELAVL4 as a neuronal soma-associated marker, we observed enrichment of neurons, at the TIP of the CD56/CD24 population. In conclusion, we present here a protocol for high purity FACS-based isolation of viable enteric neurons and glial cells, suitable for downstream applications.

Keywords: 
;  ;  ;  ;  

1. Introduction

The enteric nervous system (ENS) is a finely tuned network of neurons and glial cells, organized in enteric ganglia within the gastrointestinal (GI) tract. The ENS is located in the myenteric and submucosal plexuses. However, enteric glia are also located in the mucosa and within muscles [1]. The myenteric plexus is found between the circular and longitudinal muscle layers, and the submucosal plexus is situated between the muscle and mucosa [2,3]. The myenteric plexus predominantly regulates muscle contraction, while the submucosal plexus governs fluid secretion and absorption, blood flow, and senses stimuli from the epithelium and lumen, to maintain bowel function [4]. The critical role of the ENS is underscored by the array of enteric neuropathies arising from congenital abnormalities in its development, such as Hirschsprung disease (HSCR) and chronic intestinal pseudo-obstruction [5]. Precise mapping of the ENS and its embryonic development becomes necessary to understand these congenital conditions. However, isolating the ENS poses significant challenges, due to its deep embedding in the GI tract, making it difficult to extract without damaging the delicate ganglionic network [6]. Furthermore, enteric neurons comprise a small proportion of intestinal cells (about 0.01% of the total human colon [6]), and thus ENS enrichment becomes technically demanding.
Recently, we developed a reliable method for isolating human ENS cells, which combined an efficient dissociation protocol with an optimized fluorescent activated cell sorting (FACS) staining panel, yielding high-quality ENS cells suitable for downstream analysis [7]. Although using human tissue provides the most directly applicable insights into embryonic development and disease mechanisms, it is not always feasible to obtain. Often access to human biopsies is limited, especially from embryonic stages, and therefore, using alternative in vivo models, such as mice, allows for a more accessible and consistent source of material. Several mouse models have also been established for studying the ENS as well as enteric neuropathies [8,9,10], contributing to our understanding of genetic complexity and developmental origins of ENS malformations. Previous studies [11] have tried to map the cellular composition of the mouse ENS, using transgenic mice in which ENS cells are labelled. Although this approach allowed the characterization of numerous neuronal subsets, recapitulating ENS heterogeneity, creating transgenic mice is technically challenging, time-consuming and expensive. To overcome these issues, a previous study isolated and cultured the myenteric and submucosal plexuses from mouse, to obtain co-cultures of ENS cells with other non-neuronal intestinal cell types [12]. However, this method was limited in selectively isolating ENS cells or characterizing specific neuronal or glial cell subtypes.
In the current study, we developed a highly specific FACS-based method to efficiently isolate murine ENS cells, enabling detailed analysis and characterization of these cells. We found that CD56 (neural cell adhesion molecule 1 (NCAM1) and CD24 (HAS; a neuronal differentiation marker discriminating neurons from glia), are able to identify the ENS cluster, and enrich for neurons vs glial cells, similarly to what we have described for humans [7]. The best output was achieved using a Liberase-based protocol, allowing isolation of highly pure and viable enteric neurons and glial cells from murine colonic material, suitable for downstream applications.

2. Results

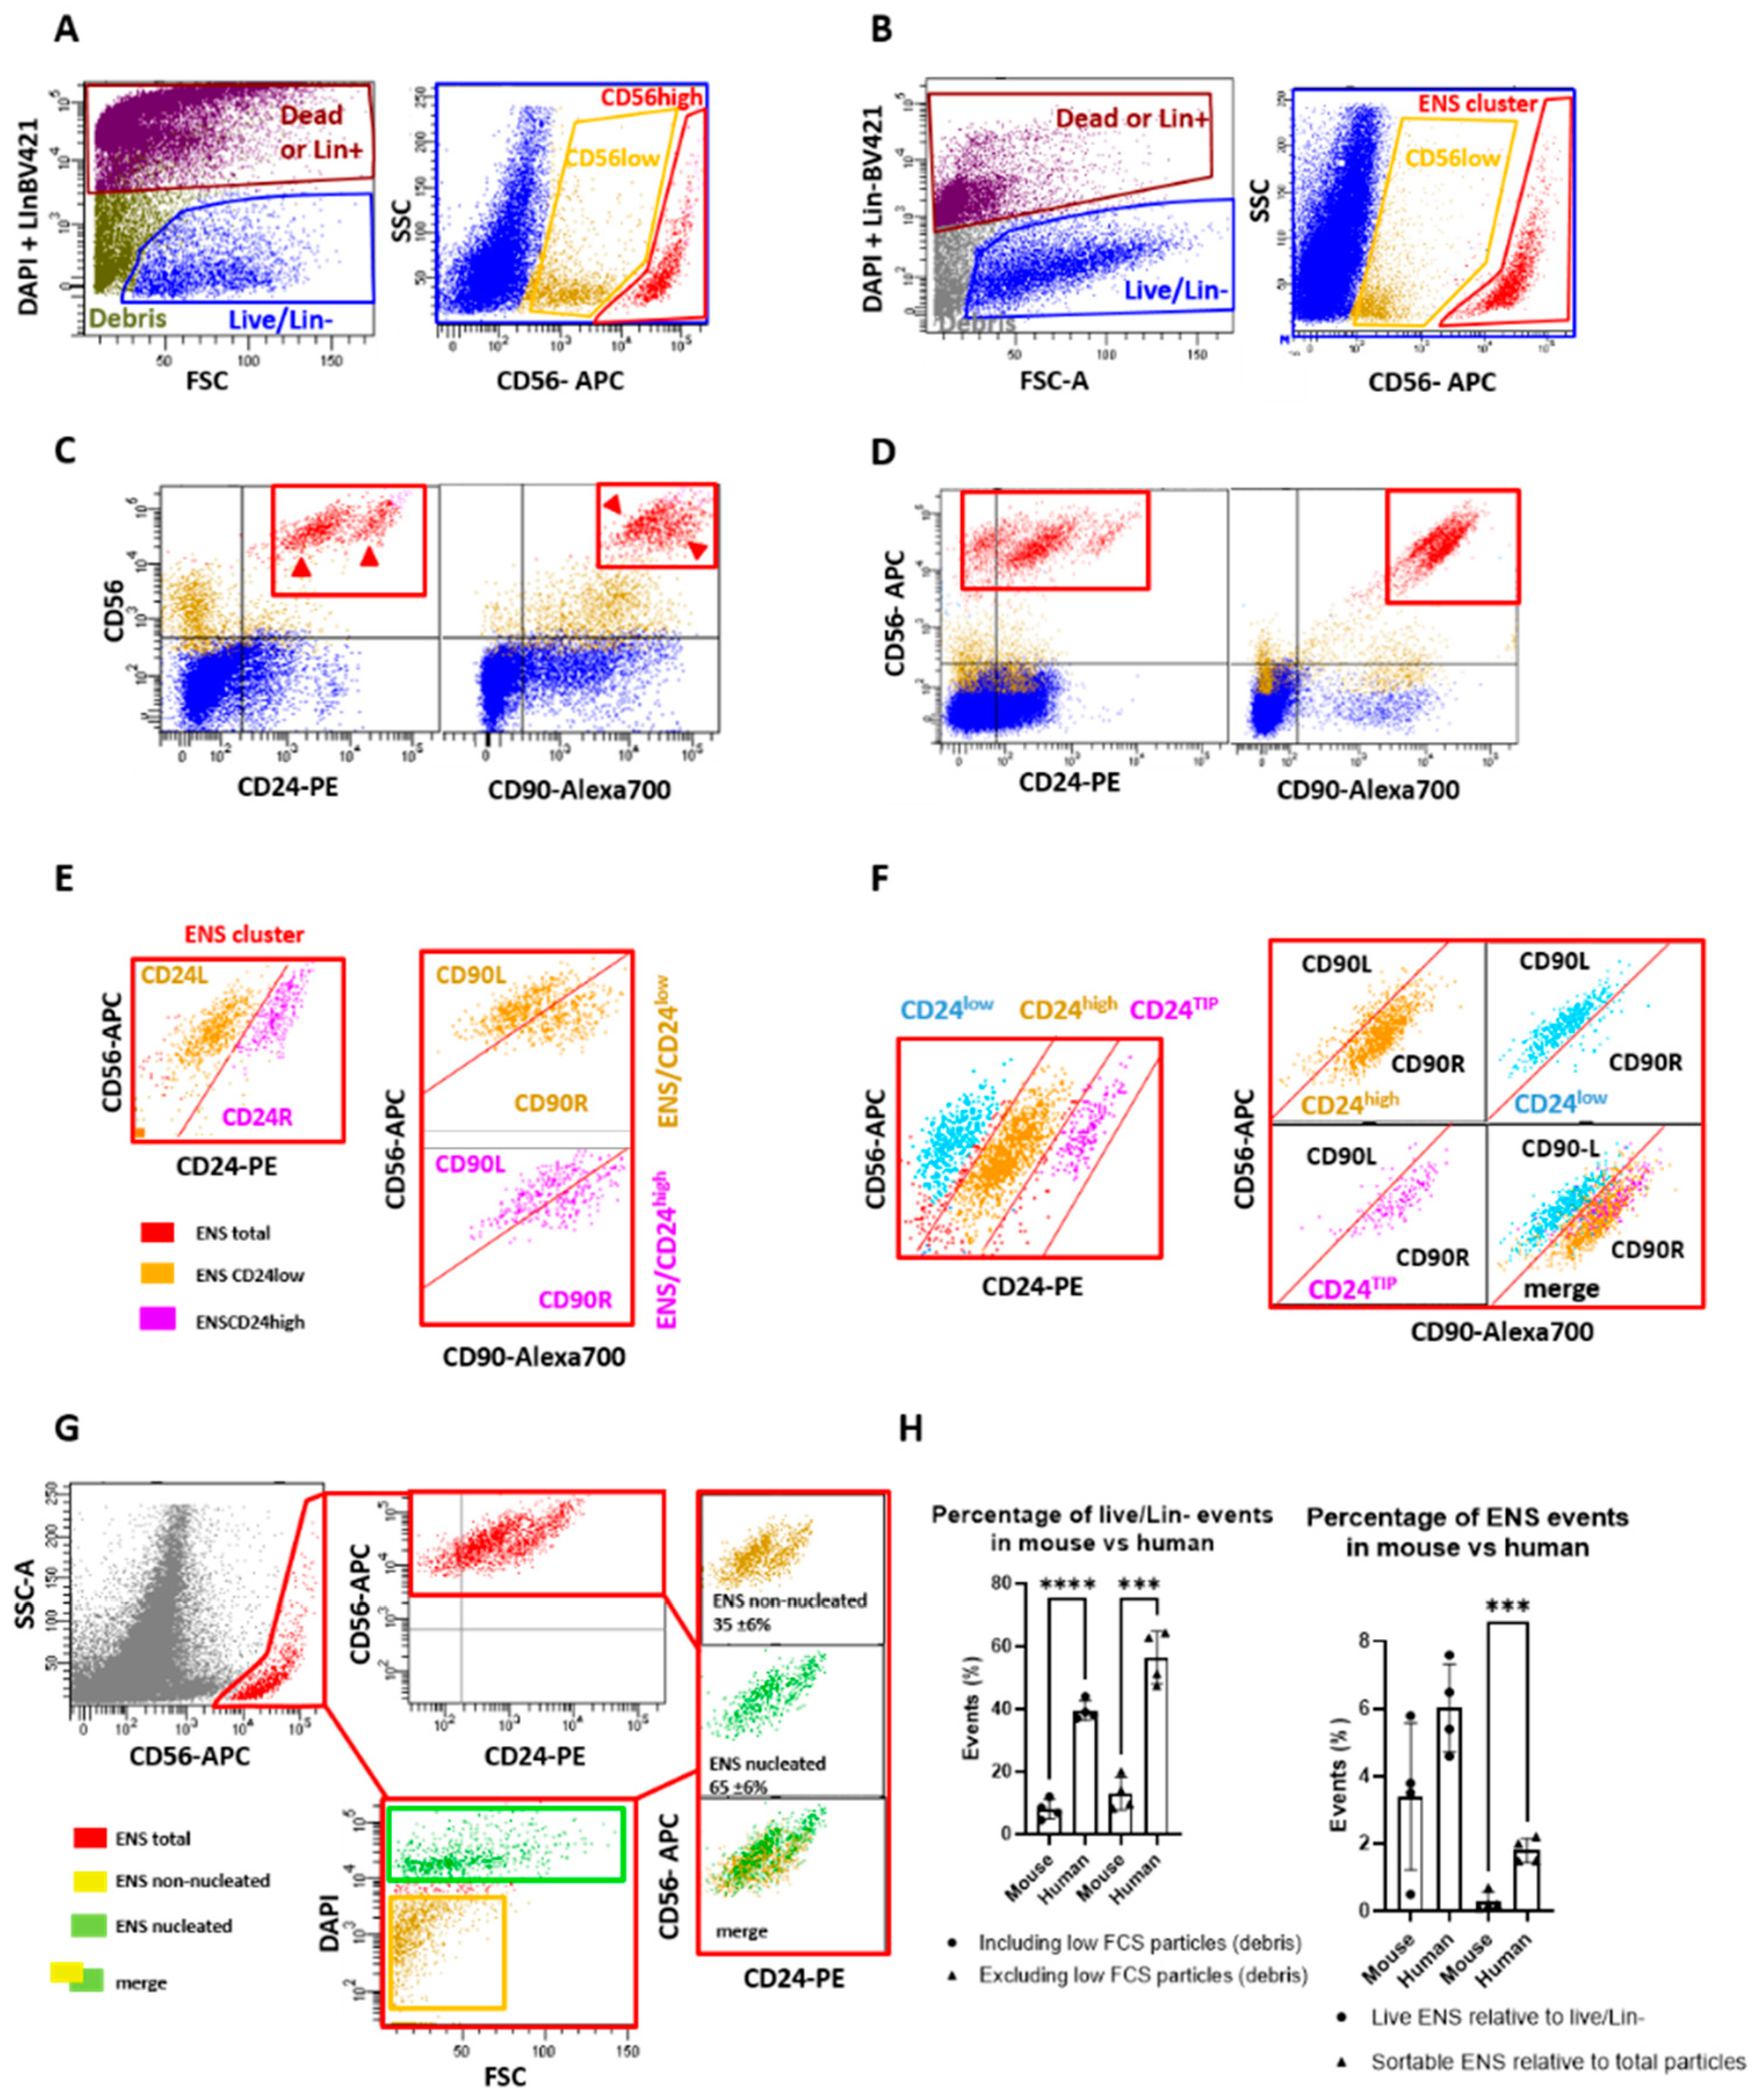
2.1. Mouse ENS Cells Are Successfully Isolated with the Human Protocol, but with Low Viability

Based on our previously developed FACS protocol, which allowed for isolation and subclustering of human ENS cells [7], we started by exploring its suitability for mouse tissue. Following dissociation of mouse colons with Collagenase II/Dispase, the single cell suspension obtained was stained with the same cell surface markers previously used for human cells, only using mouse-reactive antibodies (Table 1) [7]. CD45 (immune-hematopoietic cell marker) and CD31 (immune-hematopoietic and endothelial cell marker) were added as exclusion markers. Cells positive for these markers were referred to as Lin+. Red blood cells (RBC) were removed by RBC lysis and DAPI was used to discriminate live from dead cells on the same FACS Aria channel used for the Lin markers (i.e. BV421/DAPI channel, Table 1). Based on our previous results [7], CD56, CD24 and CD90 (Thy-1) were used as positive markers to identify and eventually subdivide the ENS cluster. In parallel, we also performed the assay on human colon biopsies, with the same antibodies previously used [7], and compared the outcome to the murine colon digestion.
The gating strategy applied was the same as the one used for human tissue [7]. Briefly, following selection of the region of interest (FSC-A vs SSC-A) with preliminary exclusion of multicellular clusters as well as very small particles (Figure 1A), a large single-cell gate was applied (FSC-A vs FSC-W) and live/Lin- events were selected (Figure 1A,B). CD56 expression was then examined to identify the ENS cluster. This marker was selected based on the evidence that it has the highest specificity for ENS cells in human tissue [7]. In mouse, a putative ENS cluster was detected with high CD56 expression (CD56high) (Figure 1A), which matched well the human ENS cluster (Figure 1B). A lower CD56 expression (CD56low) cluster was also identified, but we noticed that it was more pronounced in mouse than in human samples (Figure 1A,B). Next, we examined co-expression of CD56 with CD24 and CD90 (Figure 1C,D). The CD56high cluster was positive for both CD90 and CD24 in mice, as well as in humans. This evidence supported the hypothesis that CD56high corresponds to the ENS cluster in both systems. In contrast, the CD56low cluster was mostly CD24 negative, suggesting that it is probably not composed by ENS cells. Using CD56, CD24 and CD90 in mouse, showed that CD56high cells were sub-clustered in CD24 right (CD24R) and CD24 left (CD24L), and CD90 left (CD90L) and CD90 right (CD90R), respectively (Figure 1E). Human ENS cells showed the expected CD24low, CD24high, CD24TIP, as well as CD90L and CD90R subclusters (Figure 1F). Since CD24 levels were higher in mouse than in human ENS, we preferred to use the definition of CD24R and CD24L subclusters to differentiate them from the CD24low and CD24high clusters defined in the human system (Figure 1F). Interestingly, comparison of the CD24L and CD24R, to, respectively, the CD90L and CD90R subclusters, did not show correspondence as found in the human ENS (Figure 1E,F). Interestingly, a CD24TIP was also not immediately visible in the mouse ENS, whereas human samples showed, as expected [7], a small but clearly separate CD24TIP subcluster, which roughly corresponded to the upper part of CD90R (Figure 1E,F).
In human colon preparations, we have showed that the ENS cluster is made by both cells and non-nucleated debris, largely overlapping in scattering levels and staining pattern [7]. Moreover, glial cells seemed to always carry neuronal remnants, and vice-versa, inevitably leading to a mixed neuronal/glial staining pattern. With these premises, we investigated the presence of real ENS cells vs debris in the mouse samples. Nuclear staining performed with DAPI on sorted and formalin fixed live/Lin- fractions (Figure 1h), showed that about 35% of total ENS events belonging to the live fraction, were nucleated. Interestingly, this value overlapped with the percentage found in human colons (31±8%). However, further comparison of the percentage of live/Lin- events in human and mouse samples, showed that they were significantly lower in mice (Figure 1G). The mean percentage of ENS events, relative to the total number of live/Lin- cells, was also lower when compared with the human system, although this difference alone was not statistically significant. However, when comparing the number of ENS events in the live gate (i.e., the sortable fraction) relatively to the total raw number of events, the former were significantly lower in mouse than in human samples (Figure 1G). These results, indicated the need to optimize the dissociation protocol for better recovery of the murine ENS.

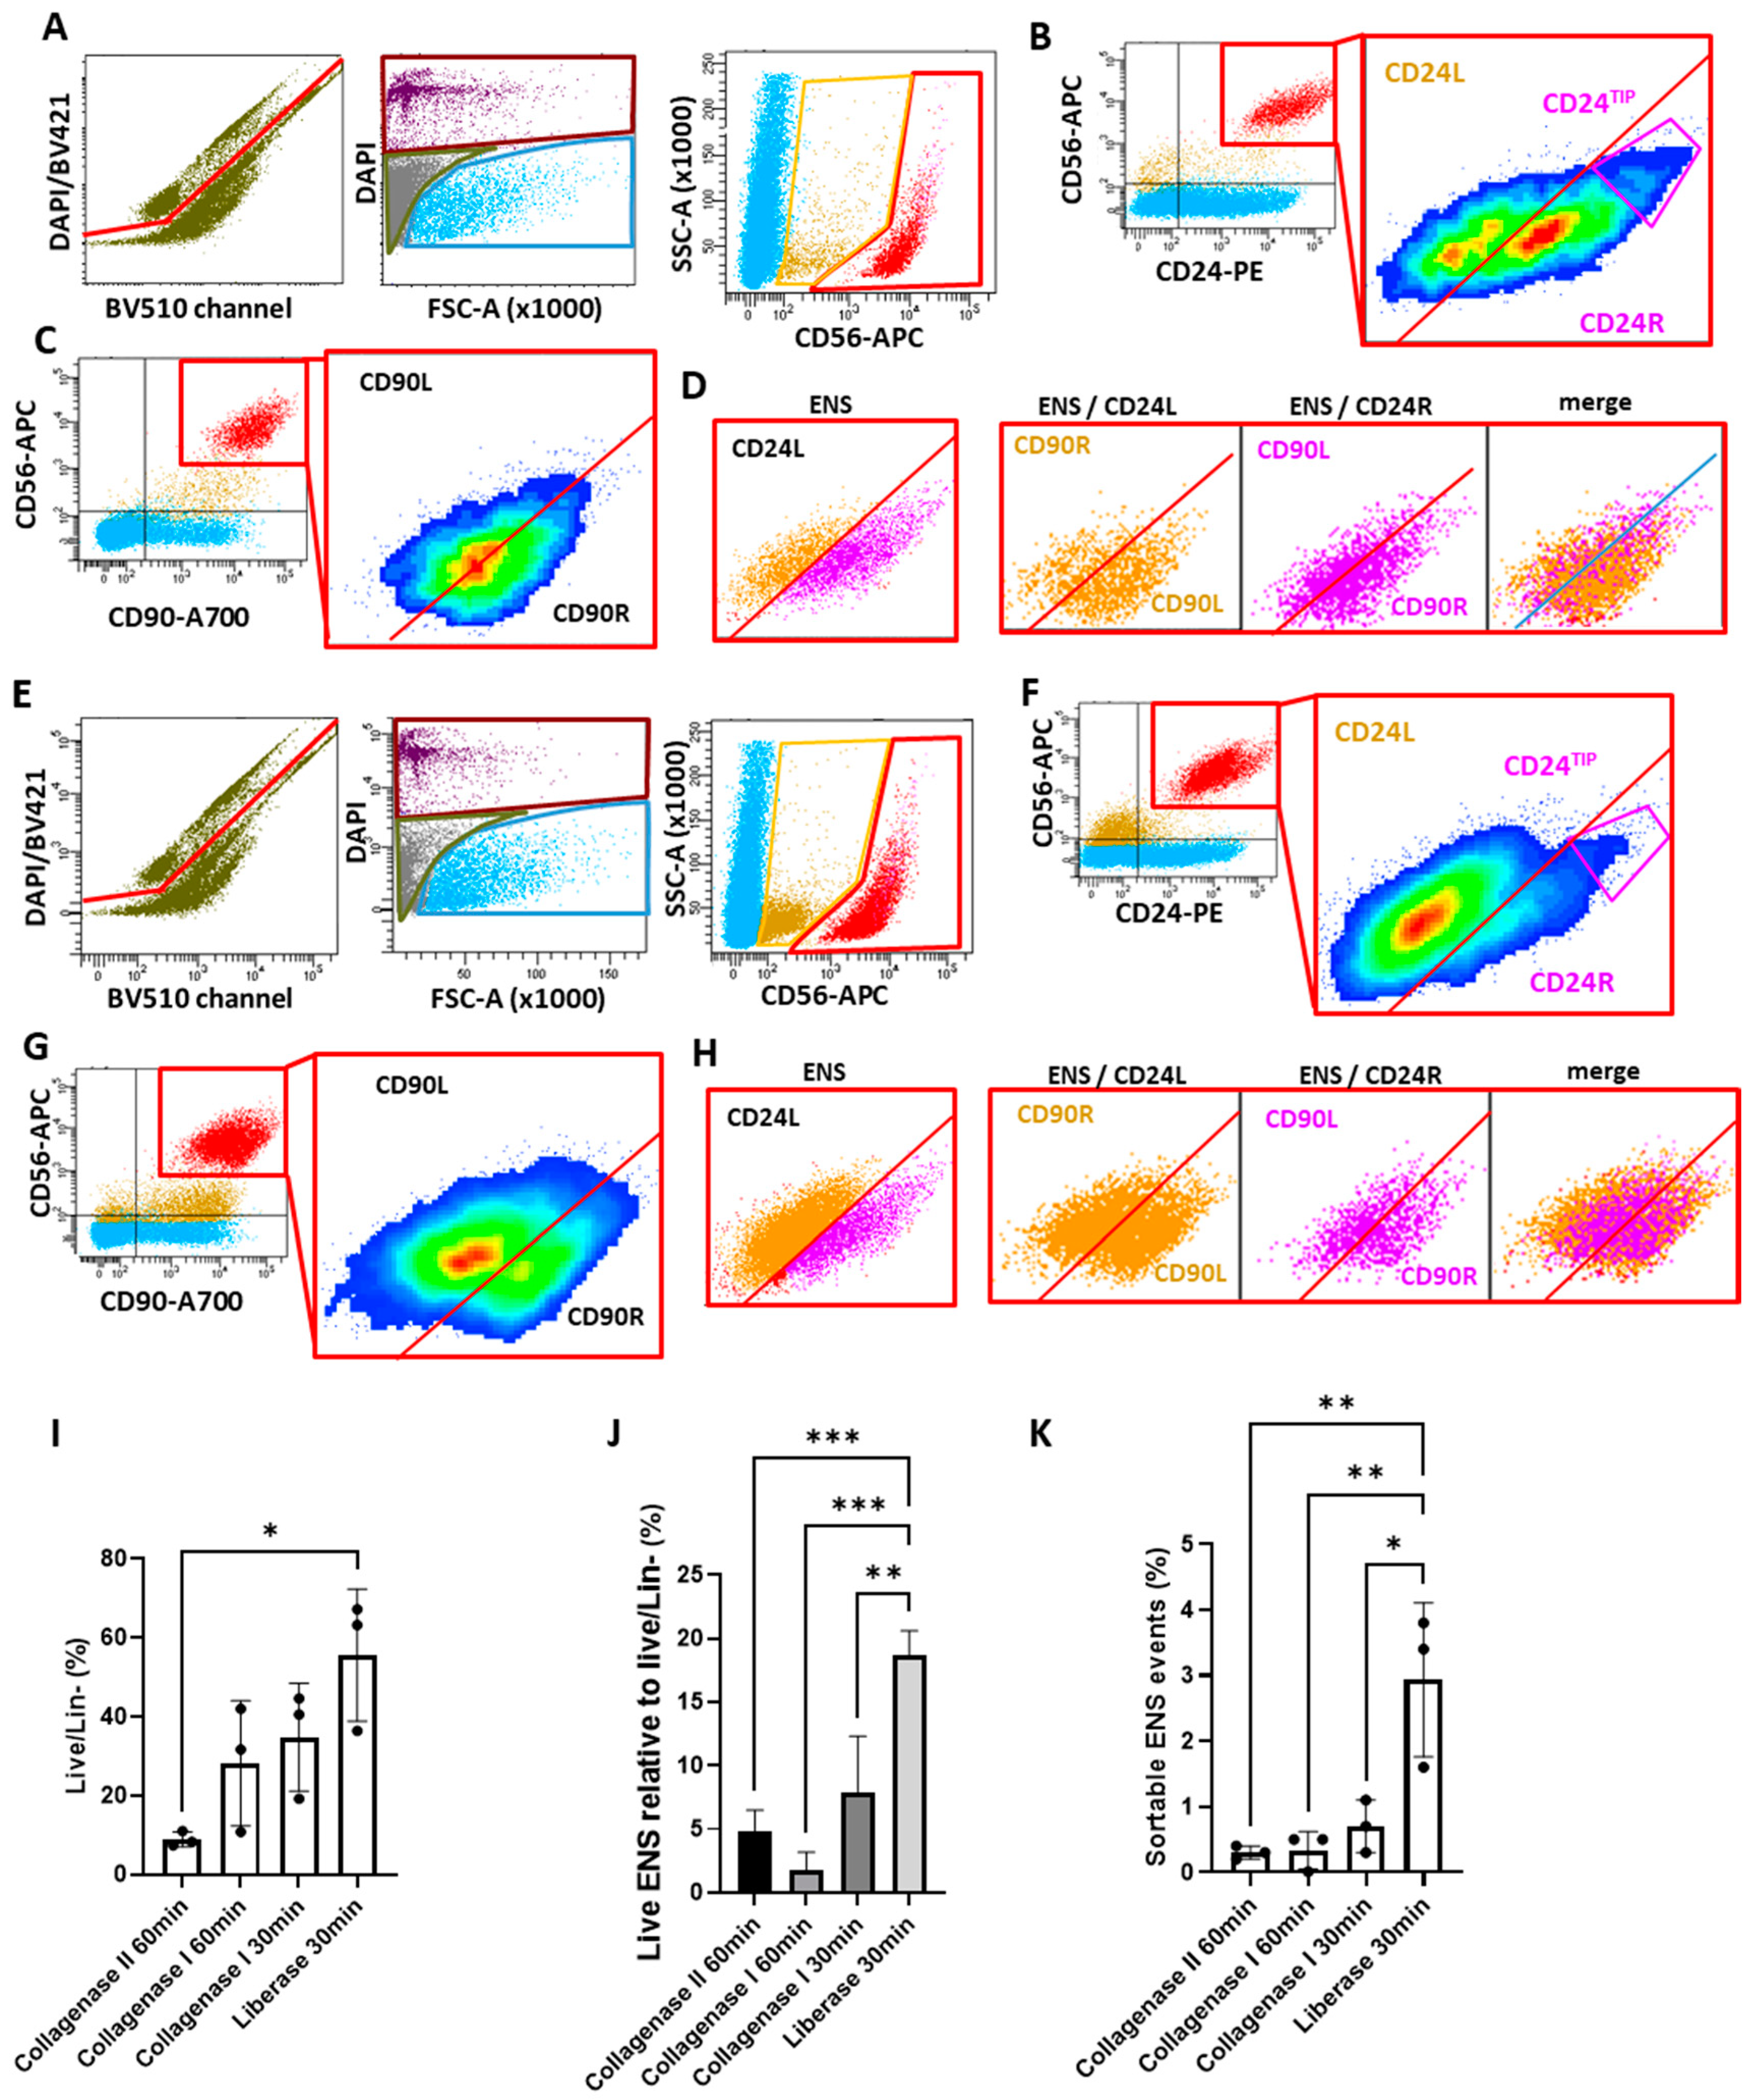
2.2. New Dissociation Protocols for Isolation of Murine ENS Cells

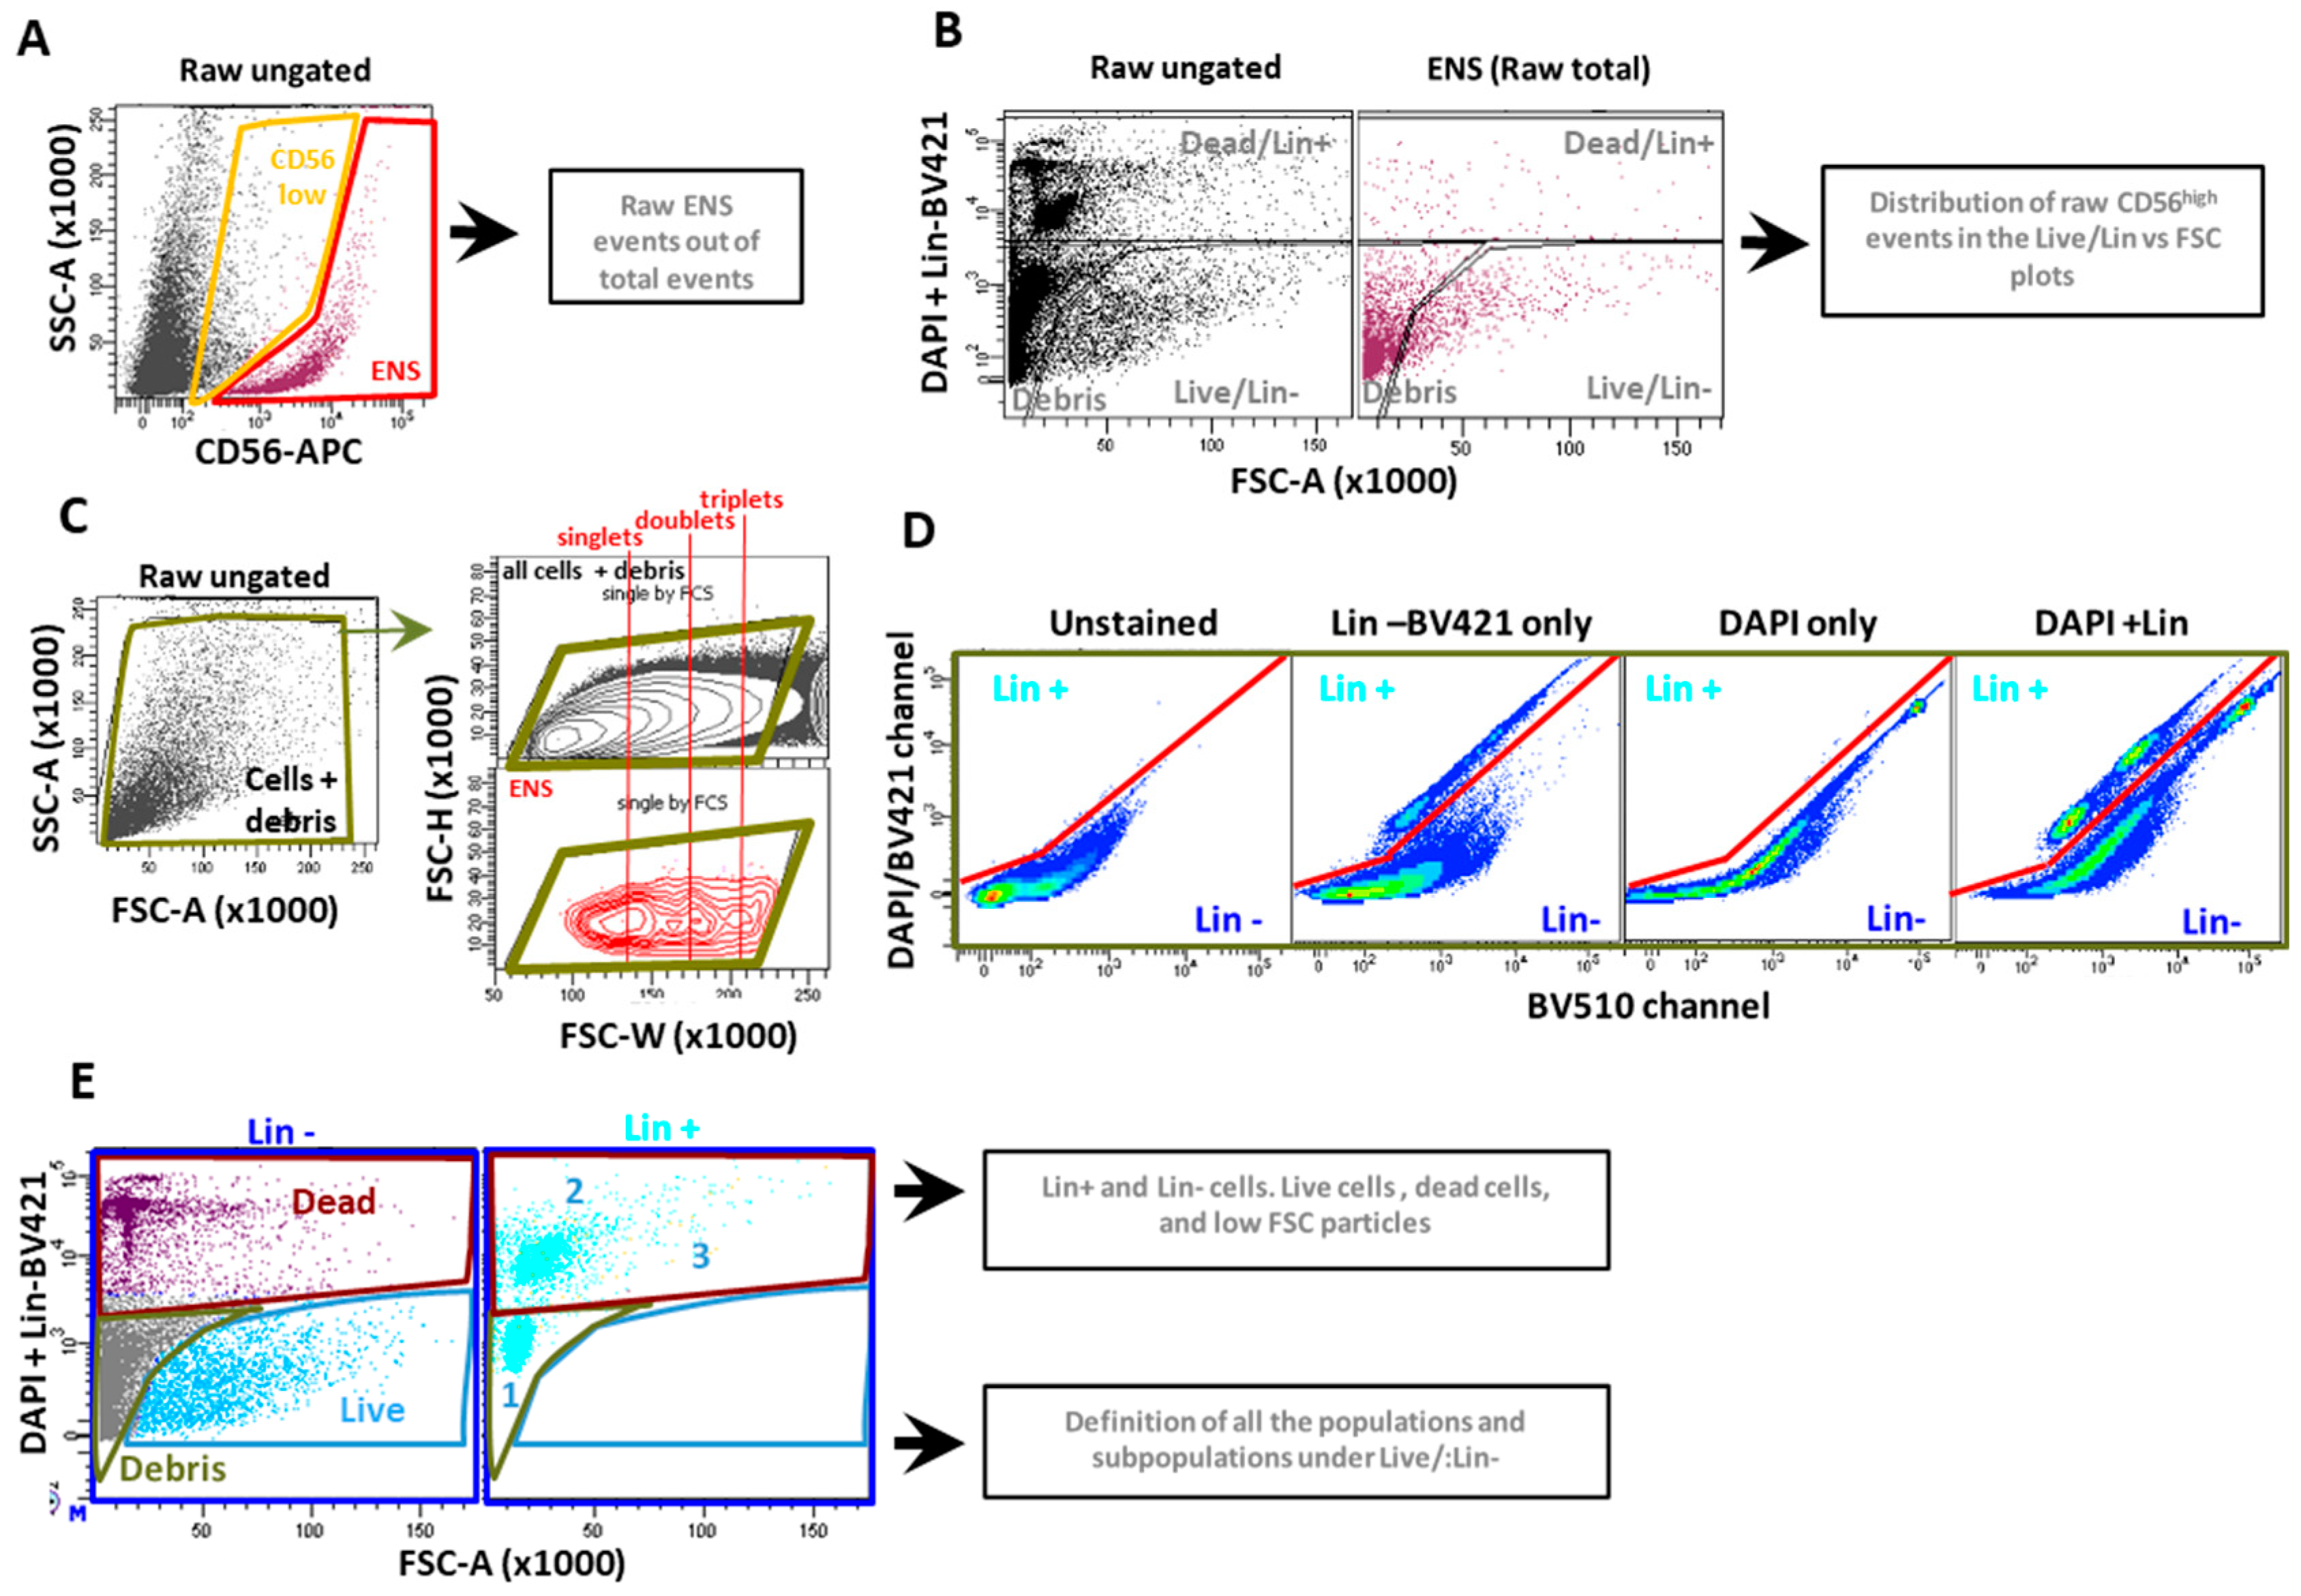
2.2.1. New Dissociation Protocols and Gating Strategy

To improve the dissociation protocol and increase the percentage of viable neural cells isolated, we adjusted its composition and duration. Replacing Collagenase II with Collagenase I was the first adjustment made, as different types of Collagenase breakdown different types of collagen. By replacing the type of Collagenase and decreasing its concentration, while increasing the concentration of Dispase, we aimed to improve the dissociation efficiency, as described before [13]. In parallel, we tested a Liberase-based protocol [14], that is a mixture of Collagenase I and II, where Thermolysin replaces Dispase. We also considered that ENS cells are fragile relatively to other intestinal cells types, and therefore decreased the dissociation time from 60 to 30 minutes (‘). This change was associated with the fact that at 60’, the samples seemed to be over-digested. In addition, the RBC lysis step was removed to further shorten the protocol and reduce unnecessary stress. As an alternative, an anti-TER119 antibody was added to the Lin antibodies, to stain for and gate out all red blood cells. Prior to any comparison, though, we decided to establish a new gating approach. This functioned as quality control for us, to better understand the reasons behind the different outputs potentially observed with different protocols, and examine the suitability of the alternative digestion approaches (Figure 2 and Figure S1). As a preliminary step, the threshold on FCS was lowered till the smallest DAPI+ cells were visible, to make sure all dead cells were included in the analysis (Figure S1a). Then, we first gated the CD56high particles out of total (recorded) events, thus including all putative ENS particles that were present in suspension (Figure 2A). These raw events included live and dead ENS cells, debris, and multicellular aggregates. With this approach, we aimed to determine the total fraction of CD56high particles extracted with each dissociation protocol, and identify to which region they corresponded (live, dead or debris) (Figure 2B). Eventual biases in ENS distribution introduced by each dissociation protocol, could be identified with this approach, e.g. we were able to visualize if missing ENS events in the live region were counterbalanced by an increase of dead cells or small debris. In other words, we could follow the viability and integrity of our putative ENS cells.
In parallel to this unbiased analysis, we followed a standard gating approach to refine our populations (Figure 2C). An initial gate was applied on FSC-A vs SSC-A to exclude the biggest clusters, but include all detectable debris. This was followed by an inclusive “single cell gating” on FSC-H vs FSC-W, as previously reported [7] and also applied in Figure 1. Notably, the “single cell gate” was calibrated not on all cells, but on the final ENS population, thus including singlets, but also multicellular aggregates until, approximately, the scattering level of triplets/quadruplets. This was necessary to prevent eventual loss of big and irregular shaped cells, as dissociated neurons are predicted to be. More stringent doublet exclusion gating, when necessary, was performed at a later stage based on DNA staining [7]. In addition, DAPI+ (dead) and Lin+ cells were gated separately, as opposed to what was done before, leading to a clear evaluation of Lin+ and dead cells. To this purpose, we plotted the DAPI/BV421 channel vs the free BV510 channel (Figure 2D). Due to a more red-shifted emission spectrum, DAPI showed stronger relative fluorescence in the BV510 than in the BV421 channel, when compared with the BV421-conjugated Lin antibodies, making possible a clear-cut separation of the two fluorochromes. Lin- events were further gated in a DAPI/FSC-A plot and subdivided in three regions: live, dead and low FSC particles or debris. For the sake of clarity, Lin+ cells were also shown in parallel to visualize the presence of the expected Lin+ clusters (Figure 2E). Overall, this approach allowed to distinguish low viability from an excess of Lin+ cells, and also to draw cleaner live/dead gates. Finally, the live/Lin- events were further analyzed with respect to their CD56, CD24, and CD90 staining pattern to detect the ENS cluster. All this information, including qualitative and quantitative elements, was taken into account for proper comparison of the protocols. Representative plots were obtained using a sample dissociated with Collagenase I/Dispase for 30’.

2.2.2. The Liberase-Based Protocol Increases Overall Viability and ENS Recovery from Mouse Colons

Once the strategy was defined, we compared the new Collagenase I/Dispase- and Liberase-based protocols. For a more linear data flow, we describe in parallel, FACS plots relative to Collagenase I/Dispase (Figure 3A–D) and Liberase samples (Figure 3E–H).
Following preliminary definition of Lin- and live cells, we gated our putative ENS events (Figure 3A,E). The pattern was as expected, with both protocols showing a C56high and a CD56lowcluster. As a second step, we analyzed the expression of CD24 and CD90 (Figure 3B,C,F,G). CD24 was highly expressed by the CD56high cluster and not by the CD56low cluster. The subdivision in CD24R and CD24L was as previously observed, but the CD24R subcluster was less pronounced in the Liberase samples (Figure 3F vs 1B). With both protocols we could detect some ENS particles at very high CD56/CD24 levels, which we defined as CD56/CD24TIP (Figure 3B,F). Although not as well separated as in the human ENS, a density plot confirmed the mouse CD56/CD24TIP to be a small cluster with its own identity. Notably, although the CD24R cluster was smaller in the Liberase samples, the CD56/CD24TIP was comparable with that of the Collagenase samples. Since we expected only the CD24TIP to be enriched for neurons, we did not consider a lower amount of CD24R to be a major issue. CD90 was, as expected, 100% highly expressed by the CD56high cluster (Figure 3C,G). Subdivision in CD90L and CD90R was hardly detectable with the CollagenaseI/Dispase protocol, but well visible with the Liberase protocol. Interestingly, with both protocols there was no overlap of CD24L and CD24R with CD90L and CD90R, respectively (Figure 3D,F), confirming what we observed with the human dissociation protocol (Figure 1E,F). Due to this, and considering that CD90 is not a neuronal selective marker and, also, that common anti-CD90 antibodies do not work with all mouse strains (Table 2), we decided to base our selection and sub-clustering of the ENS population in mouse, with only CD56 and CD24.
Full statistical analysis of the different populations and subpopulations, clearly showed that the 30’ Liberase protocol significantly increased the percentage of live/Lin- cells, as well as the number of sortable ENS events in the live region (Figure 3I,J). Also, the total amount of raw and unbiased ENS particles extracted with the Liberase protocol, was significantly higher than with other protocols (Figure S1). Based on these results, we considered the 30’ Liberase protocol to be the most efficient for mouse ENS isolation.

2.3. Validation and Subdivision of the ENS Cluster

To validate the identity of the ENS cluster following dissociation with the Liberase protocol, we first performed live nuclear staining to discriminate real ENS cells from ENS debris. This step was essential to define the effective suitability of the dissociation protocol for ENS cell enrichment, as we wanted these cells to be suitable for downstream analysis, such as single cell RNA sequencing or reverse transcriptase quantitative PCR (RT-qPCR). For this purpose, we added the cell permeant nuclear dye Dye Cycle Green, to the standard staining panel. Due to this, CD24-BV605 was used instead of CD24-PE, to avoid spillover from the Dye Cycle Green to the PE channel. This set-up, allowed us to confirm that the ENS cluster obtained with the Liberase protocol was made of nucleated cells and non-nucleated particles of different sizes (Figure 4A and Figure S2a,b), as previously found with the human protocol. Notably, also the average fraction of nucleated ENS cells (34 ±11%), perfectly overlapped with the one obtained with the human protocol (Figure 1H). This indicates that the fraction of nucleated ENS events out of those gated in the live/Lin- fraction, is not significantly influenced by the digestion protocol or the percentage of live cells. On the other hand, prolonged handling or even simple prolonged storage of ENS samples on ice, can significantly and selectively reduce ENS cells viability (Figure S2c,d) and thus, the percentage of nucleated ENS events in the live region. Interestingly, we also observed that the CD56/CD24TIP, considered to be enriched for neurons [7], was more pronounced in the nucleated than in the non-nucleated fraction (Figure 4A–D).
To further validate the identity of the CD56high population, selective neuronal and glial markers were used. In parallel, the CD56low population was also analyzed. We started by using CD24 as a cell-surface/neuron-selective marker within the ENS cluster. Previous analysis (Figure 3E–H and Figure 4A) clearly showed that CD24 expression is associated with the ENS cluster. To better address this point, we made in depth statistical analysis of those samples (Figure 4D). All ENS particles (cells and debris) were confirmed to be 100% CD24+, vs. 8 % of CD56low and 22% of CD56- (Figure 4D). The presence of CD24+ cells in the CD56- fraction was expected, as epithelial crypt bottom cells are CD24+. We then performed a more stringent validation of the ENS population using intracellular staining on formalin fixed cells, as previously reported [7]. Tubulin Beta 3 (TUBB3/Tuj1) was used as a neuronal selective marker, and SRY-Box Transcription factor 10 (SOX10) as a glial selective marker (Figure 4E,F) [11,15]. To discriminate nucleated from non-nucleated events, and single vs non-single cells, DAPI was added to the samples. As expected, all putative ENS cells (CD56high) were positive for both markers (Figure 4F,G). On the other hand, CD56low and CD56- cells were negative for Sox10, showing the same background noise (around 10%), as expected when gating positive vs negative events in the context of a low staining index. Regarding Tubb3 expression, CD56- cells were totally negative, while CD56low showed a small fraction of cells with dim Tubb3 staining. Based on these results, CD56high were confirmed to be ENS cells, whereas the staining pattern of CD56low was not compatible with either glial or neuronal cells. As described for the human samples [7], we observed the presence of a mixed neuronal and glial staining pattern in all ENS cells, with all the markers tested. This confirmed that neuronal and glial cells cannot be extracted pure by any of the dissociation protocols tested by us until now, as they seem to always carry, respectively, glial or neuronal fragments attached.
For the sake of completeness, we have also analyzed the expression of these ENS markers among non-nucleated events. Interestingly, ENS debris already shown to be CD24+ (Figure 4D), were also totally positive for Tubb3, indicating that all of them were pure neuronal or mixed neuronal/glial fragments, mostly resulting from broken terminations. On the other hand, Sox10 positivity was not universal, indicating the presence of debris that only contain neuronal fragments but no glial ones at all (or not enough to stain positive).
Additional validation of the ENS cluster was also performed by RT-qPCR using neuronal and glial markers (Elavl4; Tubb3; Sox10; Cd56/Ncam). Our results showed that the CD56high population is indeed enriched for Cd56 as expected, but also for neuronal and glial markers (Figure 4G).

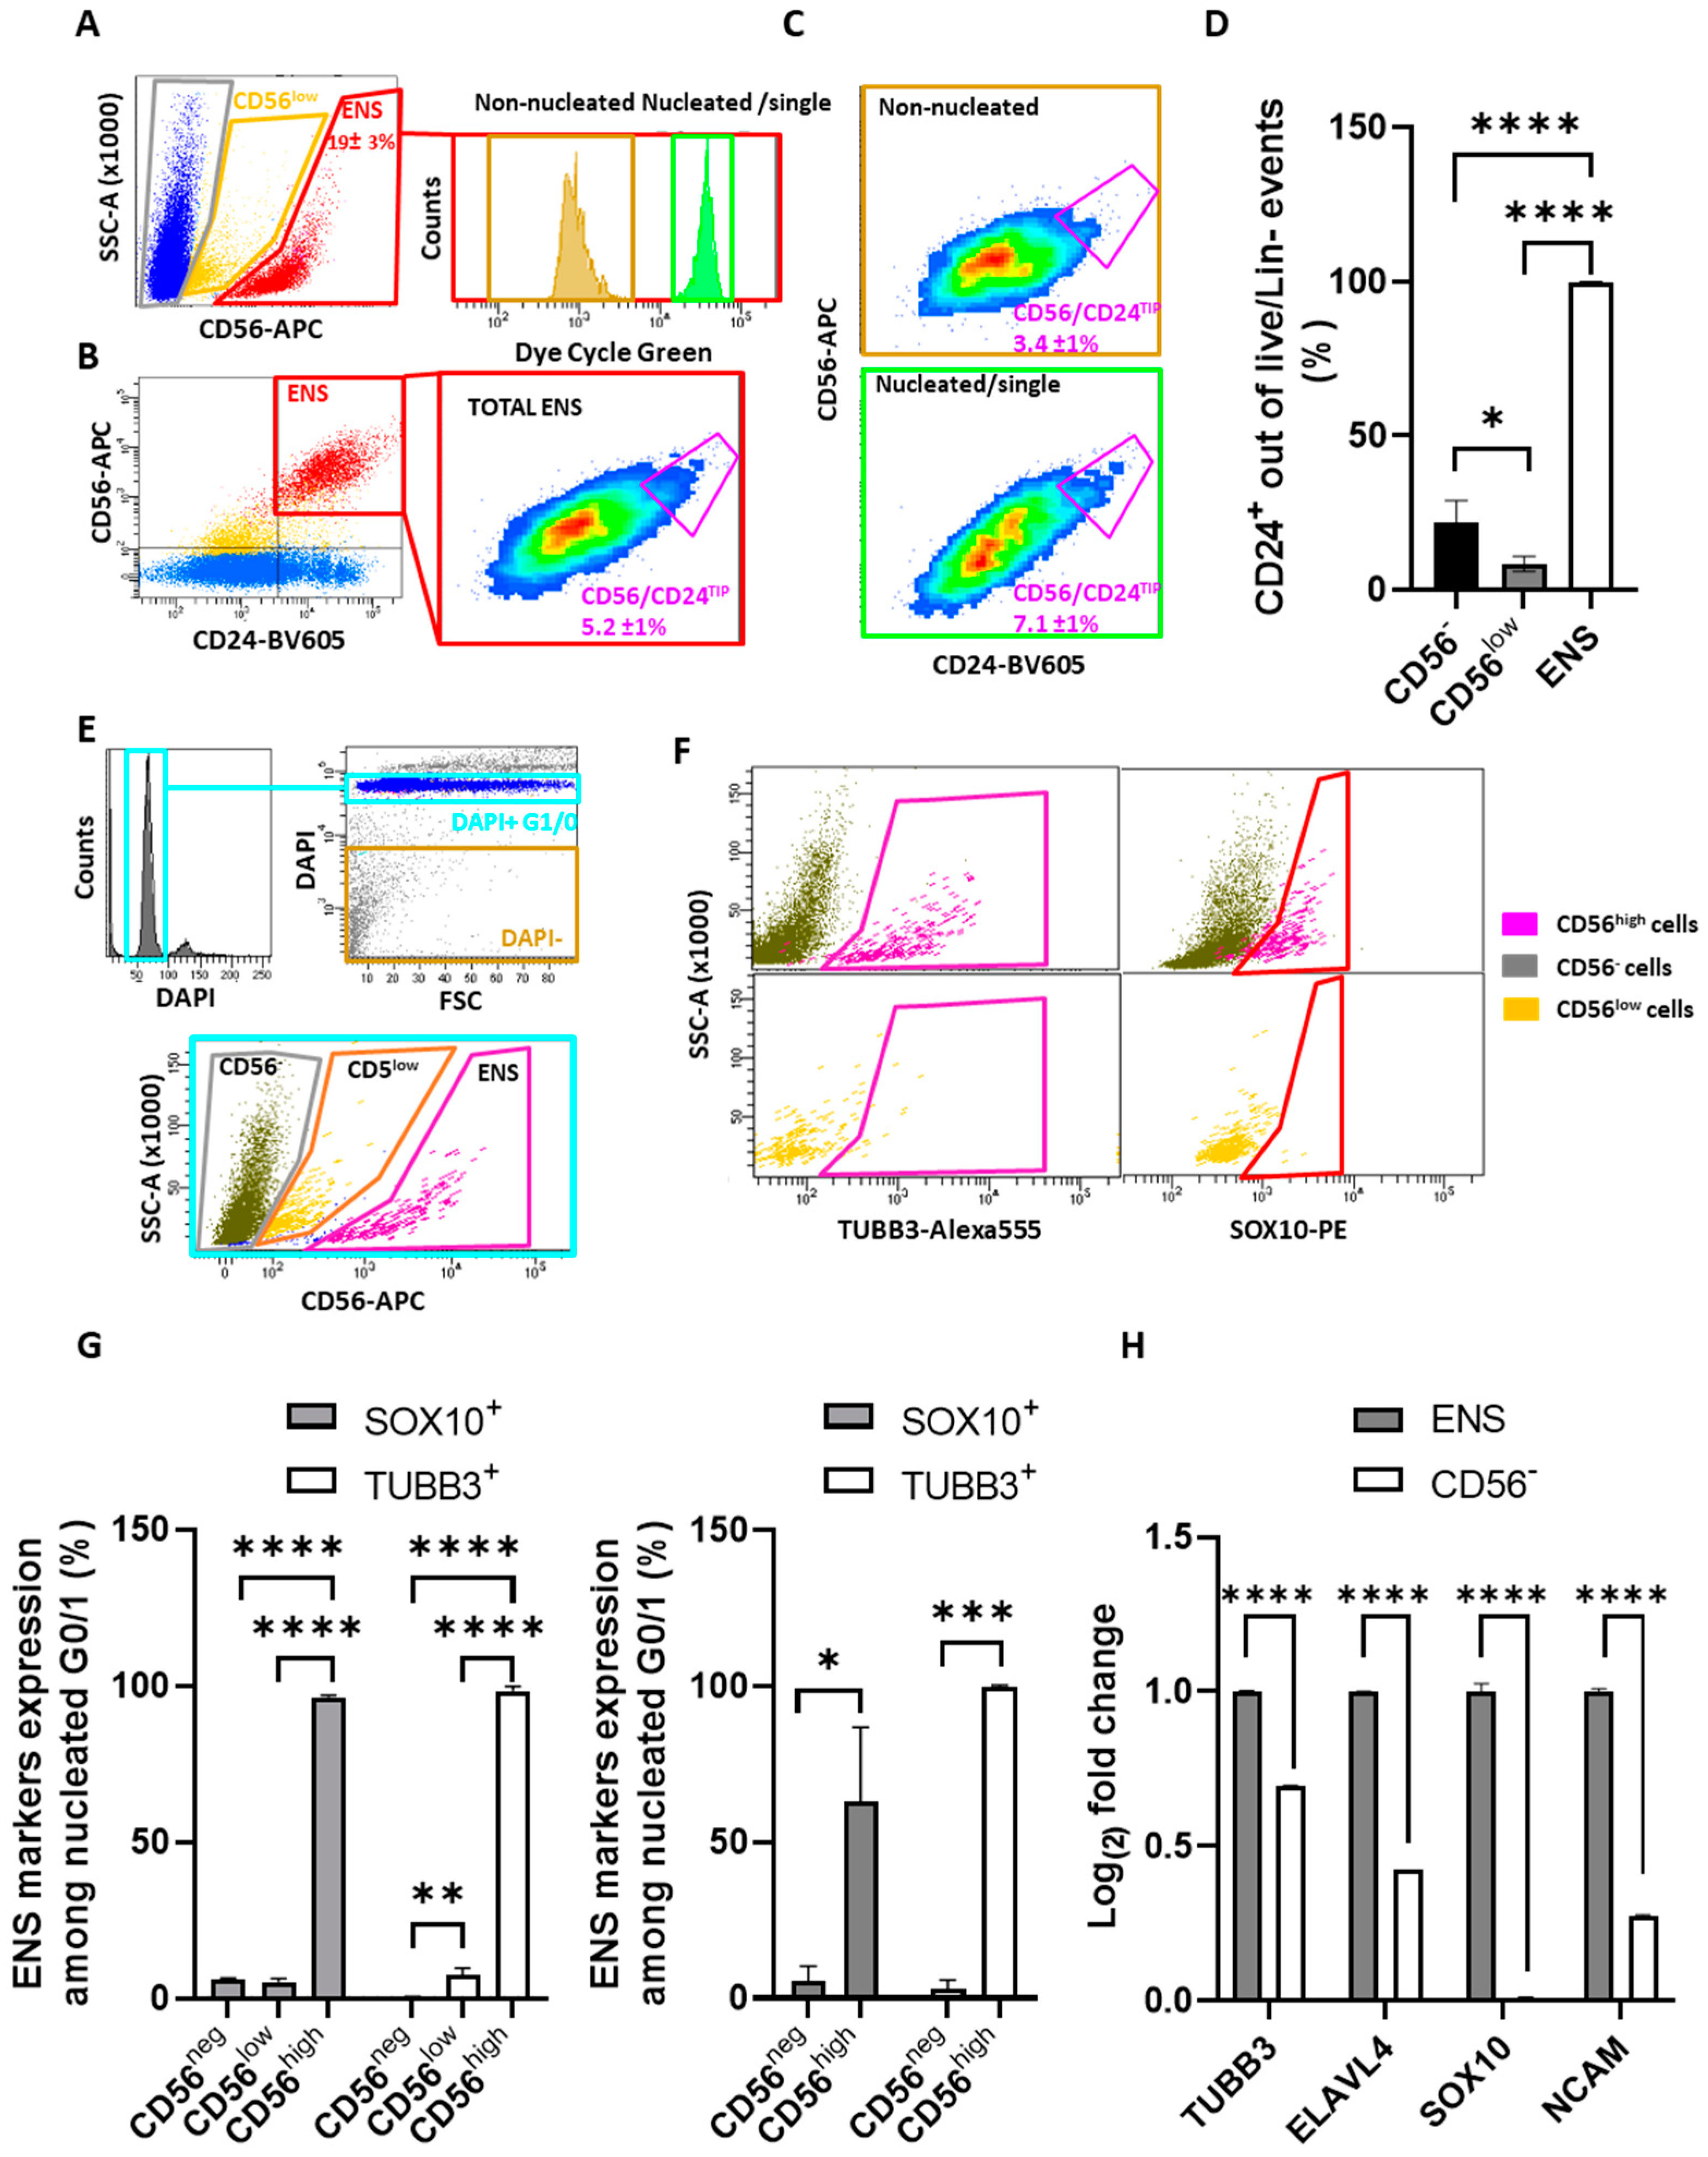
2.4. CD56/CD24TIP Is Enriched in Neurons

In an attempt to subdivide neurons from glial cells, we tested the hypothesis that murine neurons as human neurons, should have higher levels of CD24 and be enriched in the CD56/CD24TIP. This hypothesis was tested, as a first approach, by staining for ELAVL4, a selective intracellular neuronal marker concentrated in the neuronal soma and rapidly decreasing to the terminations [7]. As an alternative to the BD FACS Aria III platform, we used the new flow cytometer BD S8 FACS Discover, which combines spectral flow cytometry with cell view technology, providing spatial and morphological insights on the events under analysis. Since imaging with FACS Discover is only possible on three blue-laser dependent channels (green, red, and far red), DAPI was not suitable as a nuclear probe, but was still used as a reference nuclear dye. Also, being the green channel dedicated to ELAVL4, we decided to visualize the nuclei using the red emitting Doxorubicin. The latter binds DNA and its excitation and emission spectra, with peaks at 480 and 590 nm respectively, matches well the second imaging channel (Table 2), with little spillover to the first (green) channel. Doxorubicin was further calibrated to minimize its green spillover (Table 2). In addition, to minimize spectral interference of CD24 with the red imaging channel, a near-infrared version of the anti-CD24 antibody (BV786 conjugate) was used.
The gating strategy on FACS Discover is presented in Figure 5A–D. Briefly, following a preliminary gate on FSC vs SSC, and a standard, preliminary doublet exclusion strategy, CD56high and CD56- events were selected (Figure 5A). These events were then divided in nucleated and non-nucleated, by means of DAPI staining (Figure 5A). The nucleated fraction was further subdivided to have single G1/G0 cells, i.e. the region of interest for post-mitotic ENS cells, and a fraction containing a few proliferating and non-single cells (Figure 5B). ENS cells were further subdivided in TIP vs non-TIP region (Figure 5C). TIP cells showed high ELAVL4 staining (Figure 5D) and also high SSC levels, as expected with potential neurons. Statistical analysis of ELAVL4 median fluorescent intensity (MFI) performed vs a control antibody, showed significantly higher ELAVL4 levels in the TIP (Figure 5E), followed by the rest of the ENS cells. Non-ENS cells had, as expected, the lowest FMI level.
Although statistical analysis was only performed on single G1/G0 cells, to correct for different cell sizes, we used a ratio approach vs control Ab, instead of the most common subtraction of control Ab noise levels. Imaging of single G1/G0 cells clearly showed the prevalence of ELAVL4 bright cellular shapes compatible with neurons in the TIP, and ELAVL4 dim cells in the ENS/non TIP region and non-ENS cells (Figure 5I). The region near the TIP (border between TIP and non TIP) was characterized by intermediate patterns, among them some that resembled ELAVL4- glial cells carrying neuronal fragments (ELAVL4+) on their putative proximal part. Imaging with Doxorubicin confirmed that all single cells selected by DAPI, had a single red nucleus. On the other hand, the non-nucleated fraction gated with DAPI, was confirmed to be devoid of Doxorubicin-positive nuclear-like structures. Interestingly, the CD56/CD24TIP of the non-nucleated fraction was enriched with structures resembling broken neurons containing part of the soma and/or the proximal part of their terminations. Moving to the doublet/triplet regions, it was possible to observe different combinations, among them some ELAVL4- glial cells attached to ELAVL4+ neurons. These results confirmed the selectivity of the staining for putative neurons.

3. Discussion

In this study, our aim was to develop an optimized protocol for enrichment and sorting of mouse ENS cells. Our initial approach was to apply the human protocol that we previously developed, based on the use of CD56, CD90 and CD24 markers [7]. Although these markers appeared functional in the identification of putative mouse ENS cells, which were qualitatively similar to the human ones, there were key differences observed. Specifically, CD90 appeared to be non-essential, highlighting the unique features of each specie, which require tailored approaches. In addition, the viability of the ENS cluster was insufficient for downstream applications. A series of adjustments were, therefore, made to the dissociation protocol, including testing different enzyme combinations and incubation times. Alternating Collagenase II with Collagenase I improved the output, however not significantly. On the other hand, Liberase increased significantly the number of ENS events. However, this was only the case when the dissociation was performed for 30’. Extending this process to 60‘, led to over-digestion of the tissue, resulting in no ENS yield. Based on these results, we were able to show the importance of fine-tuning protocols to ensure the best outcomes for cell sorting, particularly in compartments as complex as the ENS.
Further characterization of the ENS cluster obtained, was performed to validate the neural nature of these cells. With this purpose, selective markers for neurons (Cd24, Tubb3 and Elavl4) and glial cells (Sox10) were used. Interestingly, while RT-qPCRs on sorted samples, further confirmed the ENS identity of these cells, the staining pattern obtained was characterized by co-expression of glial and neuronal markers on the same cells, mirroring our findings in the human ENS [7]. This observation points to the intricate relationship between enteric neurons and glial cells, which makes it difficult to extract them as pure populations, at least with the digestion protocols tested until now, since they inevitably carry membrane remnants of each other. As a consequence, defining if a single cell is a neuron or a glial cell carrying proximal or distal neuronal terminations is quite challenging. Nonetheless, by using advanced analysis techniques, such as imaging flow cytometry with the S8 FACS discover, we were able to show that our gating strategy with the selection of CD56/CD24TIP can indeed enrich for neurons vs glial cells. Taken together, we have developed a FACS–based protocol for isolation of viable mouse ENS cells, which also allows preliminary discrimination of neurons from glia.

4. Materials and Methods

4.1. Animals and Intestinal Isolation

For this study, intestines were removed from C57/BL6 or FVB mice and separated into small intestine and colon. The later was placed in a petri dish with cold 1X PBS. Fat was removed and colon was cut open with a blunt end scissor. The tissue was cleared from faeces and placed on a pre-cooled chopping board and gently scraped with a glass slide to remove debris on the luminal side. Finally, the colon was cut into 1mm pieces with a razorblade.

4.2. Dissociation of Mouse Colon Tissue

The pieces were transferred to a gentleMACS C-tube (Miltenyi Biotec, 130-093-237) with 5 ml/mouse of the selected dissociation medium (Table 1) and placed in a gentleMACS Octo Dissociator (Miltenyi Biotec, 130-095-937). The tissue was dissociated for 30’ or 60’ at 37°C. After dissociation, the suspension was mixed with 5 ml Hanks' balanced salt solution (HBSS) (14175095, Thermo Fisher Scientific) containing 10% fetal bovine serum (FBS) (FBS-12A, Capricorn Scientific), and gently triturated with a 19G needle and syringe. If needle occlusion was detected, the occluded piece of tissue was removed with a wet wipe and discarded. Then the suspension was filtered through a 70 μm cell strainer (352350, Falcon®) and mixed with 10 ml HBSS-10% FBS. Subsequently, the suspension was centrifuged at 4°C, 400 RCF for 9’, re-suspended in 2 ml HBSS-10% FBS.

4.3. Intracellular and Extracellular Staining

Primary and secondary antibodies, and the corresponding dilutions or final concentrations are listed in Table 2. Cell suspension was first stained for the selected extracellular markers. The antibody mix was diluted in HBSS 8% FBS, and incubated on ice for 30‘. Cells were then washed twice using HBSS 2% FBS, followed by centrifugation and resuspension of the pellet in HBSS 8% FBS containing DAPI (1 μg/ml; D9542, Sigma-Aldrich) for dead cell exclusion during FACS analysis. For intracellular staining, live cells were incubated with a LIVE/DEAD violet fixable viability dye (130-109-816, Miltenyi Biotech), for 10’ at room temperature (RT). Then cells were fixed in 4% paraformaldehyde for 30’ at RT, washed twice with PBS, permeabilized and blocked with PBS-0.2% Triton X-100, 10% FBS 4h to O/N. For intracellular staining, both primary and secondary antibodies were diluted in PBS, 0.2% Triton X-100, 10% FBS. For conjugated antibodies, cells were stained on ice for 3h, washed twice with 1 ml PBS-2% FBS, centrifuged at 4°C, 540 RCF for 3’ and resuspended in 100 μl PBS. For unconjugated primary antibodies, cells were washed and stained for an extra 2 hours with secondary antibodies, then washed again 3 times.
When staining with secondary Fab monovalent antibodies, 0.25 µg of the primary mouse or rabbit antibody were mixed with 0.75 µg of the secondary Fab at a ratio 1:3, and incubated for 5’ at RT. Pre-dilutions from the antibody stocks were eventually used. The excess of secondary antibody was then blocked with 4 µl of mouse (015-000-120, Jacksonimmuno) or rabbit (NS01L-1ML, Sigma-Aldrich) serum, depending on the secondary antibody used. The mix was immediately diluted in PSS 10% FBS and used for staining, keeping the final concentration of the primary antibody as described in Table 2. Mouse and rabbit control IgGs were pre-incubated with Fab secondary antibodies, and then incubated with cells at the same concentrations used for the corresponding primary antibodies.

4.4. Fluorescence-Activated Cell Sorting

FACS analysis and sorting were performed with a BD FACS Aria III or BD S8 FACS Discover (BD Biosciences, New Jersey, USA) using a 100 micron nozzle for standard analysis and sorting. All the details about FACS Aria settings and reagents used are reported in Table 2. With FACS Discover, the standard available configuration was used, with 5 lasers and 78 detectors for fluorescence detection. Forward and side scattering were available on both blue and violet laser. Light loss was also available, to detect the loss of laser light produced by intercepted particles. Imaging was available on blue laser only, with 3 channels (green, red, and far red) and additional parameters, among them forward and side scattering, and light loss. Imaging does not allow compensations between fluorescent channels. Thus, for the sake of simplicity, we limited our FACS Discover usage to simple imaging and small antibody panels to minimize spillover between channels. Also, complex imaging parameters were not used to gate cells, keeping our gating structure close to the one used on FACS Aria III. Prior to analysis or sorting, the cell suspension was filtered through a 40 μm cell strainer (352340, Falcon®). Initially, samples were gated by size and granularity using a Side Scatter (SSC-A) versus a Forward Scatter (FSC-A) plot, to allow exclusion of the smallest debris and bigger cell clusters. Non-single cells were partially excluded using an FSC-H vs FSC-W gating. The latter gate was not applied stringently, to ensure inclusion of neurons with high FSC. Dead cells were excluded using DAPI, plotted against FSC-A. CD31 (endothelial cells), CD45 (immune cells), and TER119 (red blood cells) positive cells, were also gated out in the same channel as dead cells, to keep other channels free for additional markers. All unstained and compensation controls were applied as previously reported [7].

4.5. Gene Expression Analysis

Total RNA was extracted from sorted ENS cells using the RNeasy Micro Kit (QIAGEN, cat. no. 74034), following the manufacturer’s protocol. Concentration of isolated RNA was determined using the DeNovix DS-11 (DeNovix), and complementary DNA (cDNA) was prepared using the iScript™ cDNA Synthesis Kit (Bio-rad, cat. no. 1708890 and 1708891), following manufacturer’s instructions. For quantification of gene expression, RT-qPCR was performed using iTaq SYBR Green Supermix (Bio-rad, cat. no. 1725120). For normalization of gene expression levels, Gapdh and β-Actin were used as housekeeping genes and the 2−∆∆Ct method was used for calculations. Primer sets used are listed in Table 3. Three independent experiments were performed to ensure robustness and reliability of the results.

4.6. Quantification and Statistical Analysis

Data was analysed using GraphPad Prism version 9 (Graphpad Software®, La Jolla, CA, USA). Data were tested for normality, using the Shapiro–Wilk test. The Mann–Whitney U test was used if data were not normally distributed. Differences were tested for statistical significance using either unpaired Student’s t-tests or one-way ANOVA. Data are presented as means with standard deviations. Significance thresholds (p-value) were set as follows: p < 0.05 (*), p < 0.01 (**), p < 0.001 (***), p < 0.0001 (****).

Supplementary Materials

The following supporting information can be downloaded at the website of this paper posted on Preprints.org.

Author Contributions

Conceptualization, JDW, MMA and AS; methodology, MMA and AS; software, AS; validation, FK, IB, JDW, SS, LvZ and AS; formal analysis, FK, MMA and AS; investigation, FK, IB, JDW, SS, LvZ, MMA and AS; resources, MMA and AS; data curation, AS; writing—original draft preparation, FK and AS; writing—review and editing, FK, IB, JDW, SS, LvZ, MMA and AS; visualization, FK, IB, JDW, SS, LvZ, MMA and AS; supervision, MMA and AS; project administration, MMA and AS; funding acquisition, MMA and AS. All authors have read and agreed to the published version of the manuscript.

Funding

This work was funded by the Friends of the Sophia Foundation (SSWO WAR22-76).

Institutional Review Board Statement

In this study we used C57/BL6 or FVB mouse cadavers from surplus mice that had to be sacrificed, and that were killed within the mouse facility of the Erasmus Medical Center, Rotterdam, The Netherlands. As we were reusing mice without a specific protocol, Ethical review and approval were waived for this study.

Informed Consent Statement

Not applicable.

Data Availability Statement

Further information and requests for reagents may be directed to, and will be fulfilled by Maria M. Alves (m.alves@erasmusmc.nl) and Andrea Sacchetti (a.sacchetti@erasmusmc.nl).

Acknowledgments

The authors would like to thank Rosalie Joosten (Department of Pathology), Robbert Rottier (Department of Pediatric Surgery), Giacomo Zundo, Dejan Stevic and Tessa Huizer (Department of Clinical Genetics) of the Erasmus University Medical center, Rotterdam, NL, for their valuable technical assistance.

Conflicts of Interest

The authors declare no conflicts of interest.

References

  1. Gulbransen, B.D.; Sharkey, K.A. Novel functional roles for enteric glia in the gastrointestinal tract. Nature Reviews Gastroenterology & Hepatology 2012, 9, 625–632. [Google Scholar] [CrossRef]
  2. Spencer, N.J.; Hu, H. Enteric nervous system: sensory transduction, neural circuits and gastrointestinal motility. Nature Reviews Gastroenterology & Hepatology 2020, 17, 338–351. [Google Scholar] [CrossRef]
  3. Goyal, R.K.; Hirano, I. The enteric nervous system. N Engl J Med 1996, 334, 1106–1115. [Google Scholar] [PubMed]
  4. Avetisyan, M.; Schill, E.M.; Heuckeroth, R.O. Building a second brain in the bowel. J Clin Invest 2015, 125, 899–907. [Google Scholar] [PubMed]
  5. Holland, A.M.; Bon-Frauches, A.C.; Keszthelyi, D.; Melotte, V.; Boesmans, W. The enteric nervous system in gastrointestinal disease etiology. Cell Mol Life Sci 2021, 78, 4713–4733. [Google Scholar] [PubMed]
  6. Graham, K.D.; López, S.H.; Sengupta, R.; Shenoy, A.; Schneider, S.; Wright, C.M.; Feldman, M.; Furth, E.; Valdivieso, F.; Lemke, A.; et al. Robust, 3-Dimensional Visualization of Human Colon Enteric Nervous System Without Tissue Sectioning. Gastroenterology 2020, 158, 2221–2235 e2225. [Google Scholar] [PubMed]
  7. Windster, J.D.; Sacchetti, A.; Schaaf, G.J.; Bindels, E.M.; Hofstra, R.M.; Wijnen, R.M.; Sloots, C.E.; Alves, M.M. A combinatorial panel for flow cytometry-based isolation of enteric nervous system cells from human intestine. EMBO Rep 2023, 24, e55789. [Google Scholar] [PubMed]
  8. Bondurand, N.; Southard-Smith, E.M. Mouse models of Hirschsprung disease and other developmental disorders of the enteric nervous system: Old and new players. Dev Biol 2016, 417, 139–157. [Google Scholar] [PubMed]
  9. McQuade, R.M.; Singleton, L.M.; Wu, H.; Lee, S.; Constable, R.; Di Natale, M.; Ringuet, M.T.; Berger, J.P.; Kauhausen, J.; Parish, C.L.; et al. The association of enteric neuropathy with gut phenotypes in acute and progressive models of Parkinson's disease. Sci Rep 2021, 11, 7934. [Google Scholar] [PubMed]
  10. Baydi, Z.; Limami, Y.; Khalki, L.; Zaid, N.; Naya, A.; Mtairag, E.M.; Oudghiri, M.; Zaid, Y. An Update of Research Animal Models of Inflammatory Bowel Disease. ScientificWorldJournal 2021, 2021, 7479540. [Google Scholar] [PubMed]
  11. Drokhlyansky, E.; Smillie, C.S.; Van Wittenberghe, N.; Ericsson, M.; Griffin, G.K.; Eraslan, G.; Dionne, D.; Cuoco, M.S.; Goder-Reiser, M.N.; Sharova, T.; et al. The Human and Mouse Enteric Nervous System at Single-Cell Resolution. Cell 2020, 182, 1606–1622 e1623. [Google Scholar] [PubMed]
  12. Llorente, C. Isolation of Myenteric and Submucosal Plexus from Mouse Gastrointestinal Tract and Subsequent Co-Culture with Small Intestinal Organoids. Cells 2024, 13. [Google Scholar] [CrossRef] [PubMed]
  13. Schonkeren, S.L.; Küthe, T.T.; Idris, M.; Bon-Frauches, A.C.; Boesmans, W.; Melotte, V. The gut brain in a dish: Murine primary enteric nervous system cell cultures. Neurogastroenterology & Motility 2022, 34, e14215. [Google Scholar] [CrossRef]
  14. Morarach, K.; Mikhailova, A.; Knoflach, V.; Memic, F.; Kumar, R.; Li, W.; Ernfors, P.; Marklund, U. Diversification of molecularly defined myenteric neuron classes revealed by single-cell RNA sequencing. Nature Neuroscience 2021, 24, 34–46. [Google Scholar] [CrossRef] [PubMed]
  15. Windster, J.D.; Kakiailatu, N.J.M.; Kuil, L.E.; Antanaviciute, A.; Sacchetti, A.; MacKenzie, K.C.; Peulen-Zink, J.; Kan, T.W.; Bindels, E.; de Pater, E.; et al. Human Enteric Glia Diversity in Health and Disease: New Avenues for the Treatment of Hirschsprung Disease. Gastroenterology 2024. [Google Scholar] [CrossRef]
Figure 1. Mouse colon digested using the human dissociation protocol and FACS gating strategy [7], is compared with human colon biopsies: (a) and (b) Discrimination of Live/Lin- cells (left), and gating on CD56 levels (right) in mouse and human colon, respectively. CD56high (human ENS cluster and putative ENS cluster in mouse), is highlighted in red, CD56low in dark yellow; (c) and (d) Expression of CD24 (left plot) and CD90 (right plot) in mouse (c) is compared to human (d). CD56high and CD56low are in red and dark yellow, respectively; (e) Magnification in mouse colon, of the CD56high cluster in CD56 vs CD24 and CD56 vs CD90 plots (left and right, respectively), shows a division in 2 subclusters with both CD24 and CD90. Differently from the human system, the CD24L (left) and CD24R (right) subclusters do not match the CD90L and CD90R subclusters; (f) Magnification in human colon of the CD56high cluster in CD56 vs CD24 and CD56 vs CD90 plots (left plot and small right plots, respectively), confirms the expected subdivision in three subclusters with CD24, and two with CD90 [7]. Moreover, CD24L (left) and CD24R (right) subclusters matched the CD90L and CD90R subclusters. The CD24TIP was also visible on the upper part of the CD90R subcluster; (g) The mouse ENS cluster is confirmed to be made of both nucleated and non-nucleated events, largely overlapping in scattering and staining pattern. Here live/Lin- sorted mouse cells were fixed and stained with DAPI. The percentage ±SD (N=3) of nucleated ENS events within the Live/Lin- gate was 35± 6%, overlapping with that of human colons (31± 8%); (h) Comparative summary (mouse vs human) of the fraction of events falling in the live/Lin- region (left). For the sake of clarity, the percentage of Live/Lin- cells has been calculated on total events after preliminary FCS/SSC and FSC-H|/FSC-W gating, and “corrected” excluding the debris region from the ratio. Right: percentage of ENS events out of live/Lin- events and percentage of live sortable ENS events out of the total events. N=4; Student’s t-test.
Preprints 151879 g001
Figure 2. New gating strategy applied to the comparison of different tissue dissociation protocols. (a) CD56 plotted vs SSC-A on the total ungated (raw) events identifies the total (raw) CD56high (ENS) and CD56low particles, independently of whether these belong to live or dead cells, small multicellular clusters, or debris; (b) Left plot: based on the distribution of raw ungated events, it was possible to identify three main regions of raw ungated events: live/Lin-, dead or Lin+, and low-FSC particles (debris). Right plot: the distribution of raw CD56high events was defined using these three gates; c) Left plot: a preliminary gate was applied to exclude the largest particles (clusters), but keeping in all the low scattering region. Upper plot: after the first selection, a large single cell gate was applied on FSC-H vs FSC-W, as described before [7]. This gate was calibrated on CD56high events, as shown in the lower plot, to approximately include not only singlets but doublets and triplets/quadruplets; (d) Lin+ events were separately gated out by plotting the DAPI/BV421 channel vs the “free” BV510 channel. Despite large spectral overlap, plotting the two channels together showed a clear-cut separation of Lin+ from DAPI+. No compensation was applied here, since the separation of Lin+ and dead cells was good enough, while compensation may produce an unwanted deformation of DAPI+ events; (e) Left plot: selected Lin- cells were further gated in a DAPI/FSC plot and subdivided in live (including nucleated cells), dead, and low FSC particles or debris. Right plot: Lin+ events were also plotted in the same frame, leading to the identification of various subclusters. All representative plots were obtained using a sample dissociated with Collagenase I/Dispase.
Preprints 151879 g002
Figure 3. Comparison of alternative tissue dissociation protocols: (a) Representative plots showing a sample digested with Collagenase I/Dispase for 30’. Lin⁺ cells were excluded (left), Lin- cells were gated as live, dead, and debris (middle), and the CD56+ cluster was identified (right); (b) CD24 vs. CD56 plot (left) reveals a CD24high ENS cluster. Right inset: magnification of the CD56high/CD24high cluster using a density plot. This cluster can be subdivided into two main regions (CD24L, CD24R) and a potential CD56/CD24TIP population; (c) Right plot: CD90 vs. CD56 (left) identifies a CD56high/CD90high ENS cluster. Right: density plot showing magnification of the cluster and tentative subdivision into CD90L and CD90R regions, though separation was not clearly defined with this protocol; (d) As in Figure 1c, the CD24-based ENS subclusters are plotted in CD90 vs. CD56, confirming no match between CD24L/CD24R and CD90L/CD90R; (e–h) The same analysis shown in (a-d) is repeated here for Liberase-digested samples, with two differences: (1) The CD24R subcluster is smaller than CD24L; (2) CD90 shows clearer separation between L and R, though variability exists across samples; (i-k) Summary statistics (N=3; Student’s t-test) comparing Liberase and Collagenase I/Dispase protocols, including the human protocol (Collagenase II/Dispase) as a reference.
Preprints 151879 g003
Figure 4. Liberase-dissociated sample is analyzed to define the presence of ENS cells vs debris, to identify the CD56/CD24TIP, and to validate the ENS identity of CD56high cells vs CD56- and CD56low cells: (a) After gating on live/Lin-, CD56high and low events were identified (left) and subdivided in nucleated vs non nucleated (right) by means of live nuclear staining with Dye Cycle Green; (b) In parallel the whole CD56high cluster is visualized in a CD24 vs CD56 plot (left) and investigated for the presence of a CD56/CD24TIP region (right, big inset). CD24-BV786 was used, instead of CD24-PE, to minimize the spillover from Dye Cycle Green to the PE channel; (c) Crossing information from (a) and (b), both non-nucleated debris (upper density plot) and nucleated CD56high cells (lower density plot) showed the presence of a CD56/CD24TIP. The latter is more pronounced in the nucleated fraction (percentage ±SD, N=4, is reported inside the plots); (d) The percentage CD24+ cells in the different fractions is reported (N=4; one-way ANOVA). Being expressed on epithelial cells, CD24+ cells are expected to be present in the CD56- subcluster. Notably, CD56low cells had a lower CD24+ fraction than CD56-; (e) Pre-stained samples with CD56-APC were formalin fixed and post stained for TUBB3 and SOX10. Following DAPI staining, nucleated single cells in G1/0 were selected (upper plots), and CD56 regions were selected; (f) Cells present in the CD56 regions were investigated for the expression of TUBB3/Tuj1 (left) as neuronal marker, and SOX10 (right) as glial marker. CD56high and CD56- cells are in the upper plots in magenta and dark green, respectively. CD56low cells are represented alone in yellow (lower plots); (g) Histogram plots showing statistical analysis of TUBB3 and SOX10 expression (N=3). On the left nucleated cells are compared (one-way ANOVA). On the right non-nucleated debris fractions are shown (Student’s t-test); (h) RT-qPCR performed on samples collected from sorted live mouse ENS cells vs non-ENS fraction, showed that neuronal and glial markers are higher expressed in the ENS cluster (N=3; Student’s t-test).
Preprints 151879 g004
Figure 5. Formalin fixed ENS cells, pre-stained for CD56 and CD24, were stained for ELAVL4: (a) Based on DAPI staining, non-nucleated debris were divided from nucleated cells as shown in Figure 4e. The latter were subdivided, by crossing DAPI levels with a DAPI-A vs DAPI-W plot (not shown here) in a cluster of interest containing single cells in G1/0, single cycling cells in S-G2/M, and multicellular aggregates; (b) After doublet exclusion, ENS cells were selected. Non-nucleated particles were similarly gated (not shown here); (c) ENS cells were visualized in a CD56 vs CD24 plot, to gate ENS TIP vs non TIP. A non-nucleated ENS TIP was also gated and analyzed separately as in Figure 4c; (d) The ENS TIP appeared at higher ELAVL4 and SSC levels than other ENS cells, i.e. compatible with neurons. The ELAVL4+ region defined based on a control antibody, is gated in gray; (e) Statistical analysis of ELAVL4 levels, measured as Fluorescence Median Intensity (FMI), in ENS TIP vs ENS non TIP and non ENS cells (N=3; one-way ANOVA). To correct for different cell size, potentially influencing the total ELAVL4 fluorescence, the raw FMI of each population was divided by the corresponding FMI obtained with a control antibody; (f) Visualization of the cells under analysis using a BD S8 FACS Discover, equipped with the new cell view technology. ELAVL4 is in green and Doxorubicin, used to visualize the nuclei, is in red. FSC-imaging was used here as a microscopy brightfield-equivalent, to visualize the cells and debris under analysis. The ENS TIP is enriched with ELAVL4bright putative neurons. The ENS non TIP is mostly composed of ELAVL4dim or ELAVL4- cells, associated with ELAVL4dim (neuronal) terminations. Intermediate figures can be observed at the border between ENS TIP and non TIP (see gap in c), e.g. putative glial cells carrying proximal neuronal terminations, as shown on the third row. Overall these data point to the existence of a gradient of ELAVL4bright to ELAVL4dim figures, which move down from the ENS TIP to the ENS bottom, most of them being glial cells associated with proximal neuronal fragments and finally distal terminations.
Preprints 151879 g005
Table 1. Dissociation media.
Components Manufacturer Cat. No. Final concentration Dissociation medium1
DMEM/F12 Gibco 11320-074 N/A A & B & C
HEPES (1M) Thermo Fisher Scientific 15630106 10 mM A & B & C
DNase I Sigma 11284932001 200 µg/ml A & B & C
Dispase Gibco 17105-041 0.25 mg/ml A
Dispase Gibco 17105-041 1 mg/ml B
FBS Capricorn Scientific FBS-12A 5% B
Collagenase II Gibco 17101-017 3mg/ml A
Collagenase I Gibco 17101-015 1 mg/ml B
Liberase Roche 5401119001 0.5 mg/ml C
1 A: Collagenase II/Dispase medium; B: Collagenase I/Dispase medium; C: Liberase medium.
Table 2. FACS Aria settings and antibodies.
Fluorophore Lasers BP filter (nm) LP filter (nm)
Hoechst/DAPI/BV421 405 nm 450/40 -
FITC/A488/Cycle Green 488 nm 530/30 502
PE 561 nm 582/15 -
APC 633 nm 660/20 -
Alexa 700 633 nm 730/45 690
BV605 405 nm 610/20 570
BV786 405 nm 780/60 750
BV510 405 nm 530/30 502
Primary antibody Reactivity1 Fluorochrome Supplier; Cat.# Dilution Application
CD56 H APC Biolegend, 362504 1:40 FACS Aria
CD90 H Alexa 700 Sony, 2240600 1:40 FACS Aria
CD24 H PE BD, 555428 1:20 FACS Aria
CD31 H BV421 Biolegend 564089 1:0 FACS Aria
CD45 H BV421 Biolegend 304031 1:40 FACS Aria
CD24 M PE Biolegend; 101807 4 µg/ml FACS Aria
CD24 M BV786 BD 744470 4 µg/ml FACS Aria
CD24 M BV605 Biolegend 101827 4 µg/ml FACS Aria
CD56 M APC R&D systems; FAB2408A-100UG 4 µg/ml FACS Aria
CD90 M Alexa 700 Biolegend; 105320 4 µg/ml FACS Aria
CD45 M BV421 Biolegend; 103133 4 µg/ml FACS Aria
CD31 M BV421 Biolegend; 102423 4 µg/ml FACS Aria
TER119 M BV421 BD 563998 4 µg/ml FACS Aria
TUBB3 M/H Alexa 555 BD 560339 1 µg/ml FACS Aria
TUBB3 M/H Alexa 488 Biolegend (Covance) A488-435L FACS Aria
SOX103 M/H Unconjugated ThermoFisher; 10422-1-AP 0.4 µg/ml FACS Aria
ELAVL4 M/H CL 488 Proteintech, 67835-1-Ig 1 µg/ml FACS Discovery S8
Control Mouse IgG - Unconjugated Santa Cruz, sc-2025 1 µg/ml FACS Discovery S8
Control Rabbit IgG - Unconjugated Biolegend, 910801 0.4 µg/ml FACS Discovery S8
Secondary antibody Reactivity Supplier; Cat.# Dilution FACS Discovery S8
Anti-mouse Cy3 Jackson; 715-165-150 1:200 FACS Discovery S8
Anti-rabbit Rabbit IgGs Alexa 568 ThermoFisher; A10042 1:200 FACS Discovery S8
Goat anti-rabbit (Fab) Rabbit IgGs PE Jacksonimmuno; 111-117-008 - FACS Discovery S8
Donkey anti-mouse (Fab) Mouse IgGs Alexa 488 Jacksonimmuno; 715-547-003 - FACS Discovery S8
Nuclear staining
Dye Cycle™ Green - - Termofisher, V35004 1:40002 FACS Aria/ FACS Discovery S8
Doxorubicin - - Pharmachemie, 51.223.805 0.4 µg/ml2 FACS Discovery S8
DAPI - - Sigma Aldrich 1 µg/ml2 FACS Aria
1 M: mouse reactive; H: human reactive. Being irrelevant in this context, cross-reactivity with other species is not mentioned. 2 The indicated concentration is suitable for samples with ≤1 x10⁶ cells /ml.
Table 3. Primers used for RT-qPCR.
Gene Forward primer (5→3) Reverse primer (5→3)
Tubb3 CAGATAGGGGCCAAGTTCTGG GTTGTCGGGCCTGAATAGGT
Elavl4 TCAGACTCCAGACCAAAACCA TGATGCGACCGTATTGAGAGA
Sox10 GCAAGACACTAGGCAAGCTC CCTCTCAGCCTCCTCAATGA
Ncam1 CACCATCTACAACGCCAACA GGGGTTGGTGCATTCTTGAA
β-Actin CTCCACCAGTCTTAAATGGA AACATAACAACTCTGCAGTCA
Gapdh ACTTTGGCATTGTGGAAGGG ACAGTCTTCTGGGTGGCAGTG
Disclaimer/Publisher’s Note: The statements, opinions and data contained in all publications are solely those of the individual author(s) and contributor(s) and not of MDPI and/or the editor(s). MDPI and/or the editor(s) disclaim responsibility for any injury to people or property resulting from any ideas, methods, instructions or products referred to in the content.
Copyright: This open access article is published under a Creative Commons CC BY 4.0 license, which permit the free download, distribution, and reuse, provided that the author and preprint are cited in any reuse.
Prerpints.org logo

Preprints.org is a free preprint server supported by MDPI in Basel, Switzerland.

Subscribe

Disclaimer

Terms of Use

Privacy Policy

Privacy Settings

© 2025 MDPI (Basel, Switzerland) unless otherwise stated