
Submitted:
11 March 2025
Posted:
11 March 2025
You are already at the latest version
Abstract
Epidemiological studies have linked higher serum and dietary phosphorus to an in-creased risk of prostate cancer (PC) and its lethal state. These findings do not distinguish between the impact of inorganic phosphorus (Pi) per se or its homoeostatic regulators. Thus, this study aimed to determine the in vitro tumorigenic effects of elevated Pi concen-trations per se on androgen-dependent epithelial-like PLum-AD murine PC cells at molec-ular and cellular levels. Physiologically attainable elevated levels and supraphysiological levels of sodium (NaPi) and potassium phosphate (KPi) were used to assess PLum-AD cell proliferation, viability, migration, and epithelial-mesenchymal transition (EMT) marker expression, which were determined by the thiazolyl blue tetrazolium bromide cell assay, trypan blue exclusion assay, wound healing assay, and immunofluorescence staining, respectively. Treatment of Plum-AD cells with supraphysiological levels of NaPi (20 mM) significantly reduced cell proliferation, whereas KPi did not, suggesting a poten-tial sodium- dependent Pi uptake mechanism. Furthermore, physiologically relevant ele-vated concentrations of NaPi (3 mM) and KPi (1 and 3 mM) increased relative vimentin expression of PLum-AD PC cells, a biomarker of EMT. Our findings suggest that elevated Pi levels per se, in hyperphosphatemia range, can directly promote EMT in PC, highlight-ing its potential role in tumor progression.
Keywords:
Inorganic phosphorus
; prostate cancer
; in vitro
; epithelial-mesenchymal transition
; PLum-AD murine PC cells
1. Introduction
Prostate cancer (PC) was ranked as the second most frequently diagnosed cancer and the fifth leading cause of cancer-related deaths among males worldwide in 2020, with an estimated 1.4 million new cases and 375 thousand deaths, respectively [1]. Patients with localized PC often have a nearly 100% five-year survival rate due to a slow tumor growth rate, while those diagnosed with high-risk PC experience a poor survival rate of less than 30% due to rapid progression and metastasis, highlighting the need to address the current rising burden of advanced PC [2,3,4,5,6,7]. Although the exact molecular mechanisms driving PC carcinogenesis and progression remain unclear, the transformation of the prostate gland’s benign epithelial cells into malignant phenotypes is thought to stem from genetic and epigenetic alterations [8]. Progression from the first stage of tumor development to the metastatic stage is characterized by a decrease in cells expressing cytokeratin 8 (CK8), cytokeratin 18 (CK18), and the tumor suppressor gene p63. This progression is driven by the activation of genes regulating the epithelial-mesenchymal transition (EMT) pathway, consequentially involving the repression of epithelial markers like E-cadherin and the upregulation of mesenchymal markers such as vimentin (Vim) [9,10]. The risk factors for PC include both non-modifiable and modifiable factors. Non-modifiable risk factors include advanced age, specific genetic mutations, ethnicity, and family history [11]. Modifiable factors include diet and lifestyle [12], in which both serum levels and intakes of phosphorus were reported to be associated with an increased risk of PC and its advanced lethal stage [13].
Phosphorus is an essential mineral crucial for various biological functions like nucleic acid production, cell signaling, and energy transfer. Serum concentration of inorganic phosphorus (Pi) is tightly regulated between 0.8-1.45 mmol/L [14,15], and hyperphosphatemia is defined as a serum Pi exceeding 1.45 mmol/L, while severe hyperphosphatemia is defined as levels greater than 4.52 mmol/L [16]. The homeostatic regulation of phosphorus is highly controlled at the level of the kidney [17] and this makes fasting serum level a weak indicator of intake [18,19]. Nonetheless, diurnal variations in serum Pi exist and these are related to the postprandial changes following meal ingestion. The magnitude of these changes is up to 0.5 mmol/L and mainly dependent on meal content in term of phosphorus and carbohydrate [20,21,22]. Interestingly, excreting 1500 mg/day of dietary phosphorus was reported to take up to 20 hours, suggesting a temporary storage pool in the intracellular fluid (ICF), as higher doses was shown to normalize serum levels within 8 hours [23].
Epidemiological data suggest that high dietary phosphorus intake is associated with an increased risk for PC [13,24,25]. Both higher serum phosphate and dietary phosphorus intake were linked with a 7% and 8% increase in PC risk, respectively (13). Furthermore, results from a Mendelian randomization (MR) study indicated that genetically predicted high serum phosphorus was associated with a 19% higher PC risk per standard deviation increase [13]. Data from the 2020 UK Biobank reported that circulating phosphate levels were associated with an increased PC risk, while the Health Professionals Follow-Up Study linked higher dietary phosphorus intake with a greater risk of lethal and high-grade PC [24,25]. Although these studies support an association between phosphorus (both serum levels and dietary intake) and PC, the underlying mechanisms remain unclear. Beyond its well-established role in energy metabolism, phosphorus is closely linked to the regulation of parathyroid hormone (PTH), fibroblast growth factor 23 (FGF23), and vitamin D—factors that have been implicated in prostate cancer, though their precise relationship is not fully understood [26,27,28]. The current work focuses on determining the none hormonally (PTH, FGF23, Vitamin D) related aspects of phosphorus on PC cells.
Therefore, we studied the short-term tumorigenic effects of elevated extracellular Pi concentrations per se using a 2D murine early-stage prostate cancer model at both cellular and molecular levels. To this end, PC cells were treated with two different types of Pi for up to 72 hours at varying concentrations to reflect normal serum levels, physiologically relevant hyperphosphatemia, and severe hyperphosphatemia.
2. Results
2.1. Effect of Pi on Cell Proliferation of PLum-AD Cells
Cells treated with increasing concentrations of sodium phosphate (NaPi) and potassium phosphate (KPi), ranging from 1 to 20 mM for up to 72 hours, were assessed for proliferation using the 3-(4, 5-dimethylthiazol-2-yl)-2, 5-diphenyltetrazolium bromide (MTT) assay. Our data showed that cell proliferation was not significantly enhanced upon treatment with 1, 3, 6, or 9 mM NaPi or KPi (Figure 1a,b). However, at 24 hours post-treatment, a significant reduction in cellular proliferation was observed in cells treated with 20 mM NaPi (p < 0.05) but not 20 mM KPi (Figure 1a,b). A similar trend upon treatment with 20 mM NaPi and KPi was observed at 48 and 72 hours, though it was not statistically significant. Given that such levels are unlikely to occur physiologically, even in rare instances, we did not explore their effects in further experimental procedures. Importantly, no significant changes in cellular proliferation were detected in cells treated with sodium chloride (NaCl) or potassium chloride (KCl) (Figure 1b,c), implying that the cell proliferation inhibitory effect is unrelated to sodium or potassium.
2.2. Effect of Pi on Cell Viability of PLum-AD Cells
Cells treated with increasing concentrations of NaPi and KPi (1 – 9 mM) for 24, 48, and 72 hours, were assessed for viability using the trypan blue assay. No significant changes in cell viability of PLum-AD cells were observed at any concentration or time point upon treatment with NaPi, KPi, or KCl (Figure 2a,b,d). However, treatment with 3 and 6 mM NaCl significantly increased viability at 24 hours (p < 0.01), while treatment with 9 mM NaCl significantly decreased cell viability at 72 hours (p < 0.01) (Figure 2c). Since supraphysiological hyperphosphatemia (≥ 6 mmol/L) is very rare, further experiments focused on treating cells with lower concentrations.
2.3. Effect of Pi on the Migratory Ability of PLum-AD Cells
The migratory ability of PLum-AD cells in response to 1 and 3 mM NaPi and KPi treatment was assessed using the wound healing assay. Analysis of the percentage of open wound areas showed no significant differences between the treatment groups, with all the conditions achieving a complete wound closure after 14 hours (Figure 3a). Our results demonstrate that treatment with 1 mM NaPi or KPi, reflecting physiologically relevant hyperphosphatemia and 3 mM NaPi or KPi, reflecting severe hyperphosphatemia does not affect the migratory capacity of PLum-AD cells (Figure 3b,c).
2.4. Effect of Pi on Vimentin Expression in PLum-AD Cells
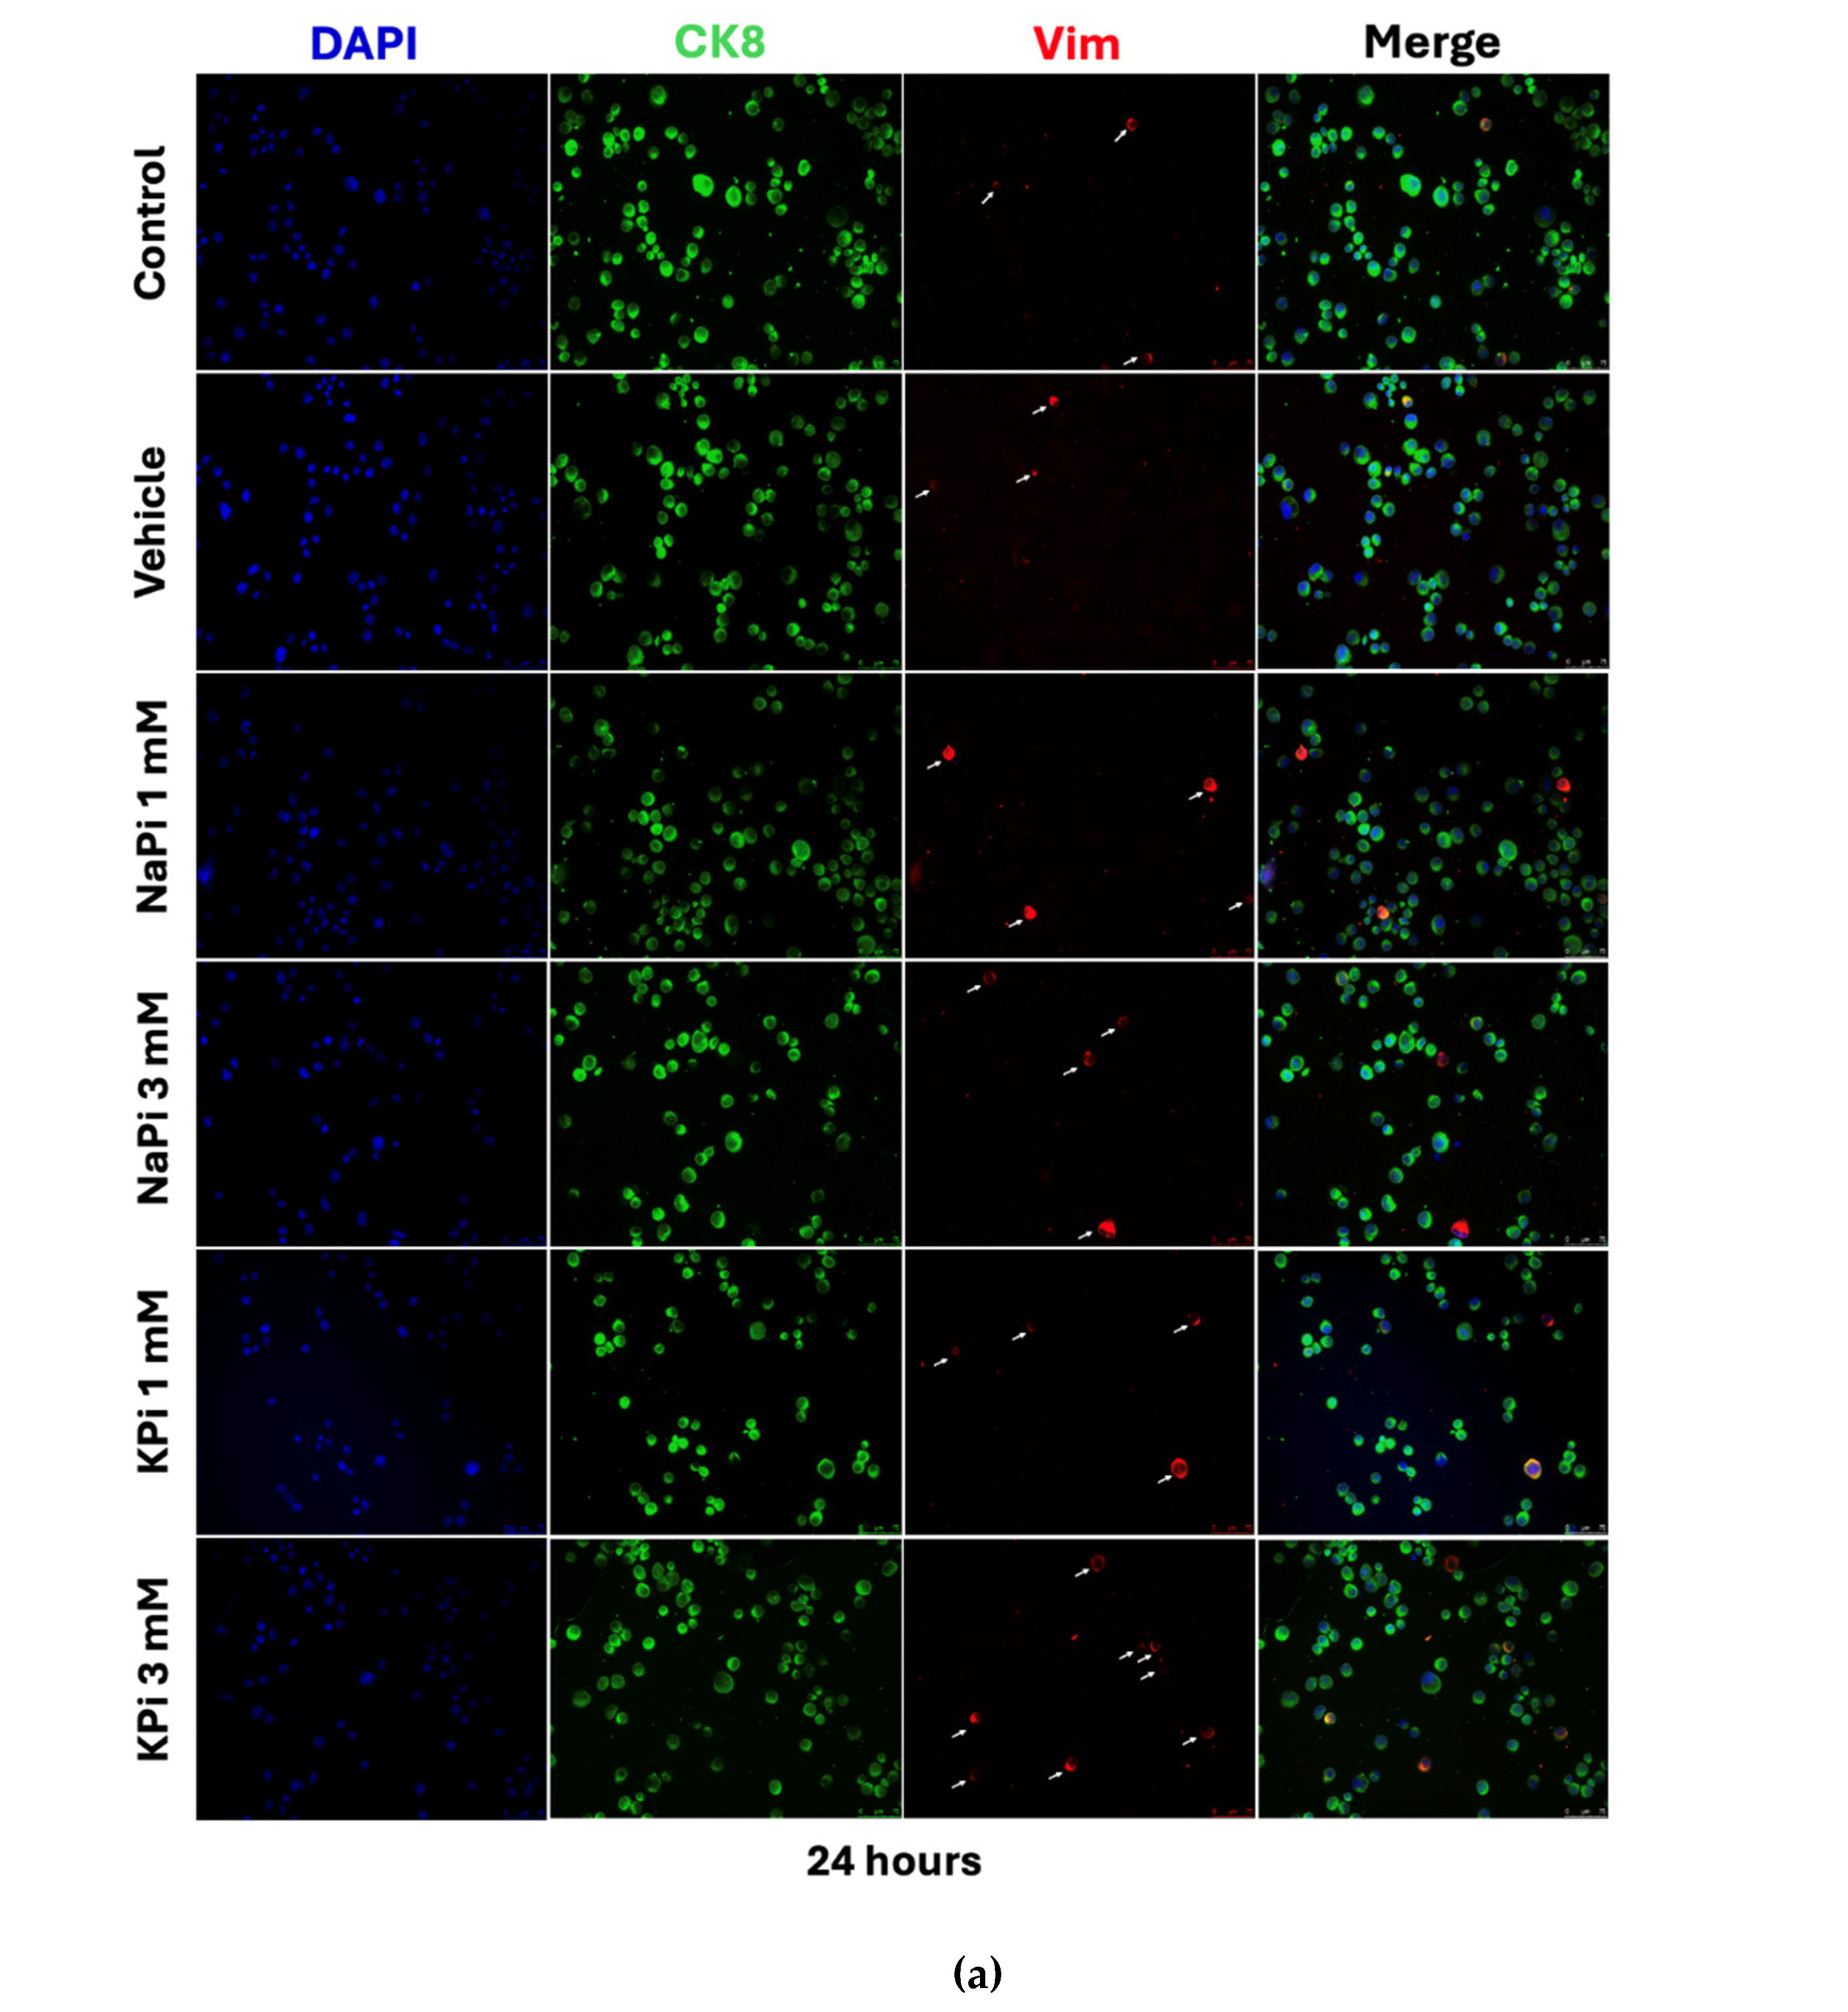
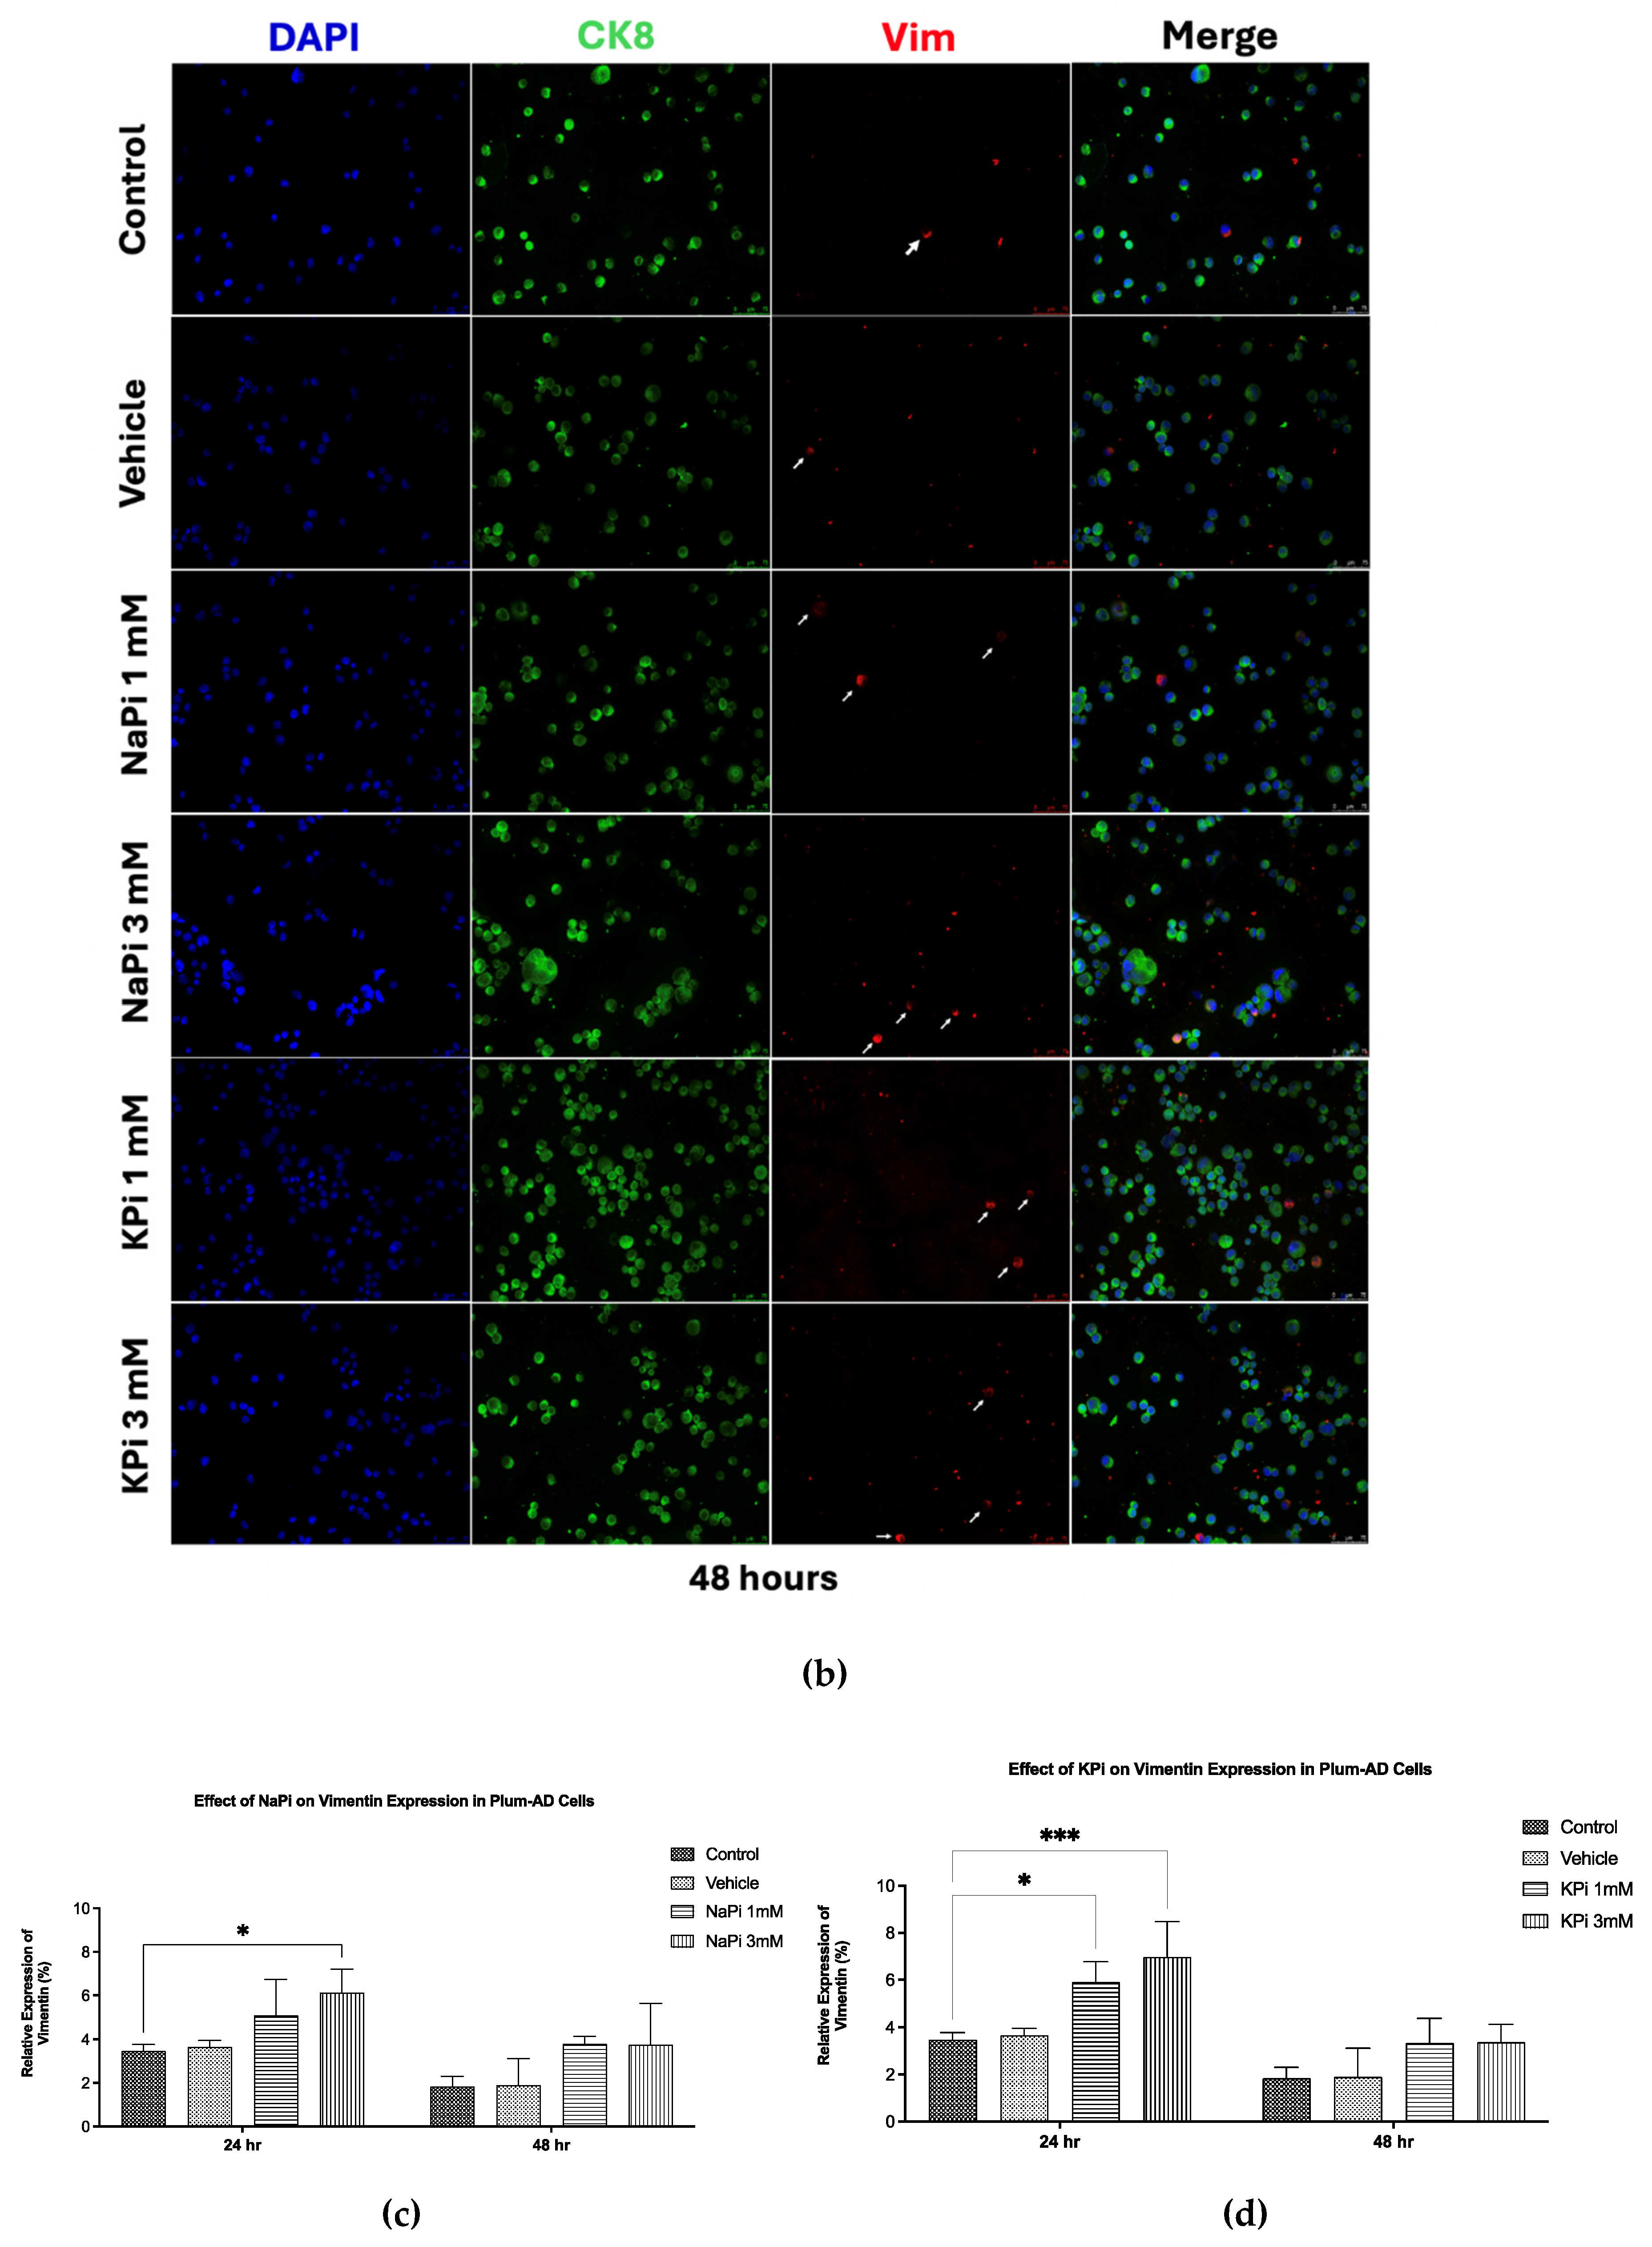
Treatment of PLum-AD cells with 1 or 3 mM NaPi and KPi for 24 and 48 hours did not significantly affect CK8 expression. However, treatment with 3 mM NaPi and 1 and 3 mM KPi significantly increased the relative expression of Vim at 24 hours post-treatment (p < 0.05 and p < 0.01, respectively). A similar trend was observed at 48 hours following treatment with both concentrations of NaPi and KPi; however, the increase in relative vimentin expression did not reach statistical significance (Figure 4c,d). These findings suggest that physiologically relevant and severely elevated concentrations of NaPi and KPi, enhance the expression of Vim, a biomarker for EMT, in PLum-AD cells.
3. Discussion
The current in vitro study investigated the effect of Pi per se on the growth and progression of PC, with a focus on utilizing Pi concentrations within a range attainable in humans.
The observed reduction in cell proliferation of PLum-AD cells treated with 20 mM NaPi aligns with others. Incubation of human embryonic kidney 292 (HEK 293) and cervical cancer (HeLa) cells with 16 mM of NaPi and above was reported to trigger apoptosis [29], while others observed apoptosis starting at even lower concentration (>2.5 mM NaPi) in endothelial cells [30]. On the other hand, the failure of similar concentrations of KPi, NaCl, and KCl to reduce cell proliferation indicates that the observed differential effect upon treatment with 20 mM NaPi may not be related to potential changes in osmolarity or individual impact of Na or Pi but may be related to the possible presence and role of Na-dependent P transporters. Na-dependent Pi transporters, such as sodium-dependent phosphate transport protein 2B (NaPi2b), are reported to play an important role in cancer metastasis. Inhibiting Na-dependent Pi transporters induced the mesenchymal-epithelial transition (MET) in triple-negative breast cancer cells, thus reducing their migration ability [31]. These transporters are overexpressed in 90% of epithelial ovarian cancers and other malignancies such as breast, thyroid, and lung cancers [32,33,34]. NaPi2b has also emerged as a potential predictive marker for targeted ovarian cancer therapy [35]. Thus, identifying and characterizing Pi transport mechanisms in PC cell lines could help elucidate their role in PC tumorigenesis and potentially serve as a way to target the uptake of Pi by PC cells. Nonetheless, the reduction in cell proliferation may not be relevant in vivo as they appeared at a concentration far above attainability in humans.
Cell viability and cell proliferation of non-cancerous and cancerous cell lines were reported to increase with increased concentration of NaPi and this was seen even at physiological concentrations. He et al. [29] found that increased extracellular NaPi (up to 10 mM) enhanced cell viability and proliferation of human HEK 293 and HeLa cells. Likewise, treatment with increasing Pi concentrations (1-10 mM) accelerated the growth of human lung cells through the activation of the protein kinase B (AKT) and mitogen-activated protein kinase (MAPK) signaling pathways [36]. Camalier et al. [37] demonstrated that physiological increases in phosphate could promote cell proliferation in an epidermal cell line through activation of extracellular signal-regulated kinase 1/2 (ERK1/2) and AKT. However, our data showed that the proliferation and viability of PLum-AD cells were not enhanced by physiologically relevant or severe concentrations of Pi in the form of NaPi and KPi. Further investigations are needed to elucidate the mechanisms underlying these variations, particularly the involvement of AKT, MAPK, and ERK1/2 signaling pathways.
Similarly, our results showed that when Pi (NaPi or KPi) concentrations of 3 mM and below did not affect the migratory ability of PLum-AD cells, contrary to findings by Lin et al. [38] on endothelial cells. This discrepancy may stem from the differences in the models used. Lin et al. [38] studied the effect of elevated Pi on the migratory abilities of a non-cancerous endothelial cell model in the presence of cancerous cells, while our study determined the effect of elevated Pi concentrations on a malignant cell line already having a high basal migration rate. Additionally, PLum-AD cells migrated toward the scratch area, completely closing the wound by 14 hours post-Pi treatment, potentially before Pi could mediate its intracellular effects.
On the other hand, the relative expression of the EMT marker Vim was upregulated following treatment with physiologically relevant elevated concentrations of NaPi and KPi. Specifically, 1 mM KPi and 3 mM NaPi induced a 1.7-fold increase in Vim expression, while 3 mM KPi resulted in a 2-fold increase compared to the control, suggesting that elevated Pi concentrations, relative to normal serum levels, can promote EMT in PC. Similarly, recent findings showed that supraphysiological Pi levels enhance EMT by suppressing E-cadherin while upregulating Vim expression in HEK 293 and HeLa cells [39]. Additionally, chemical or genetic inhibition of Pi transporters was shown to prevent high-Pi-mediated EMT of HEK 293 and HeLa cells [29].
According to the growth rate hypothesis, tumor cells exhibit a high demand for Pi as a cause of their increased growth rates and energy requirements. Specifically, elevated amounts of ribosomes and phosphorus-rich RNA components are required for creating proteins in cancer cells with rapid proliferation [40]. Tumor cells such as ovarian carcinomas, thyroid, lung, and breast cancer, have been shown to express higher levels of NaPi2b, allowing them to absorb increased amounts of Pi from the tumor microenvironment (TME) [41]. Additionally, the concentration of serum Pi was found to be 2 folds higher in patients with head, neck, lung, or cervical tissue cancer compared to healthy individuals [42]. Bobko et al. [40] reported an increase in Pi in the microenvironment of breast tumors derived from a mouse model compared to the normal tissue and identified it as a new TME for tumor progression. Excess intracellular Pi has been proposed to increase the metabolic activity of tumors, induce growth-promoting cell signaling, and potentially promote metastasis [39]. While physiologically elevated concentrations of Pi did not affect proliferation, viability, or migratory abilities of PC cells, our findings suggest that elevated Pi in the TME increased Vim expression, thereby promoting EMT. These effects are independent of the regulatory endocrine factors such as FGF-23, calcitriol, and PTH which were suggested to affect PC tumorigenesis [27,28,43].
A strength of this study includes using the PLum-AD cell line, which has Pten and TP53 deletions, enabling self-renewal, growth into castration resistant prostate cancer (CRPC) cells, and EMT-driven metastasis, allowing us to investigate the tumorigenic effects of elevated Pi concentrations [44]. Additionally, we used a spectrum of Pi concentrations representing the physiological range seen in human hyperphosphatemia, enhancing our findings' clinical relevance. While our short-term focus provided immediate insights into Pi’s effect on PC cell behaviour, a limitation was the lack of long-term Pi impact analysis. Furthermore, our study design did not capture the complex interplay between increased serum Pi and regulatory endocrine factors in PC progression. Future research directions should investigate the modulation of key signaling pathways, such as AKT, MAPK, and EMT, in response to elevated Pi levels in PLum-AD PC cells. Additionally, targeted inhibitors should be used against these pathways to elucidate their mechanistic contribution to Pi induced cell proliferation suppression and upregulation of Vim expression.
4. Materials and Methods
4.1. Cell Line
The PLum-AD cell line, generated from murine orthotopic adenocarcinoma tumors, representing early-stage PC, was used in this study. PLum-AD cells exhibit an epithelial morphology with high CK8 and low Vim [45]. Harbouring Pten and TP53 gene deletions, this cell line displayed the potential for self-renewal, growth into castration-resistant PC cells, and metastasis through the EMT, as such being a cellular model of PC progression [44].
4.2. Cell Culture
PLum-AD PC cells were cultured in Dulbecco’s Modified Eagle Medium/Ham’s F-12 (Advanced DMEM/F-12) medium containing 1 mM Pi (Gibco), supplemented with 5μg/ml Plasmocin® Prophylactic (InvivoGen), 1% penicillin-streptomycin (Sigma-Aldrich), 1% GlutaMAX (Gibco), 1% HEPES (Gibco), and 5 ng/mL of EGF (R&D Systems). Cells were maintained in a humidified atmosphere with 5% CO2 at 37oC and kept mycoplasma free.
4.3. Treatment Protocols
NaPi and KPi were used as separate sources of Pi, with NaCl and KCl serving as controls, respectively. To prepare the NaPi stock solution, sodium phosphate dibasic (HNa2O4P; Sigma-Aldrich) and sodium phosphate monobasic dihydrate (H2NaO4P • 2H2O; Sigma-Aldrich) were dissolved in double distilled water (ddH2O) at a 4:1 ratio. Similarly, the KPi solution was prepared by dissolving potassium phosphate dibasic (HK2O4P; Sigma-Aldrich) and potassium phosphate monobasic (H2KO4P; Sigma-Aldrich) in ddH2O at a 4:1 ratio [46]. The pH of each stock solution was measured and, if necessary, adjusted to 7.4 ± 0.2 and stored at 4°C for up to 3 weeks.
In all experiments, untreated cells cultured in a complete medium containing 1 mM Pi were used as controls reflecting normal serum levels while those cultured in 2% ddH₂O were used as vehicle controls. Cells were treated with 1 mM NaPi or KPi to model physiologically relevant hyperphosphatemia. Severe hyperphosphatemia was modelled using 3 mM NaPi or KPi, while supraphysiological hyperphosphatemia was modelled with concentrations of 6 mM or higher.
4.4. Thiazolyl Blue Tetrazolium Bromide Cell Proliferation Assay
The in vitro proliferative effects of NaPi and KPi were assessed using the MTT (Sigma-Aldrich) colorimetric assay [47]. PLum-AD cells (2.5x10³ cells/well) were seeded in triplicates in 96-well plates (Corning) and cultured overnight. The cells were then treated with 1, 3, 6, 9, and 20 mM of NaPi and KPi, and 1, 6, and 20 mM of NaCl and KCl for 24, 48, and 72 hours. At each time point, 5 mg/mL of MTT reagent (Sigma-Aldrich) was added to each well and incubated at 37oC with 5% CO2 for 3 hours, followed by the addition of the solubilizing agent 2-propanol (Sigma-Aldrich). Optical density (OD) was measured at 595 nM using the Tristar Multimode Reader (BERTHOLD). The proliferation percentage relative to the control was then calculated and represented.
4.5. Trypan Blue Exclusion Cell Viability Assay
The trypan blue exclusion assay was used to assess the effects of NaPi and KPi on cell viability [48]. PLum-AD cells (15x103 cells/well) were seeded in duplicates in 24-well plates and cultured overnight. Cells were then treated with 1, 3, 6, and 9 mM of NaPi, KPi, NaCl, and KCl for 24, 48, and 72 hours. At each time point, attached cells were harvested and stained with trypan blue solution (Sigma-Aldrich). Viable cells were counted using a hemocytometer under an Axiovert inverted light microscope from Zeiss (San Diego, CA, USA). Viability was represented as a percentage relative to the control.
4.6. Wound Healing Cell Migration Assay
The migratory capacity of PLum-AD cells upon treatment with NaPi and KPi was evaluated using the wound healing/scratch assay [49]. PLum-AD cells (9x10⁴ cells/well) were seeded in duplicate in 24-well plates and cultured overnight. To inhibit cell proliferation, cells were treated with 10 μg/mL of Mytomycin C (Sigma-Aldrich) for 30 minutes at 37 °C in a 5% CO2 humidified incubator. Then, a uniform scratch was made in each well using a sterile 200 μl micropipette tip, after which the cells were gently washed with 1X phosphate-buffered saline (PBS) solution to remove any detached cell debris. The cells were then treated with 1 and 3 mM of NaPi and KPi. Images of the wound area in each well were captured at 0, 3, 6, 9, 12, and 14 hours post-treatment using Axiovert bright-field microscopy from Zeiss at 5X magnification. Wound area was analyzed using the ImageJ software, and the percentage of wound closure for the different time points (t) was calculated for each condition.
4.7. Immunofluorescence Staining and Analysis
PLum-AD cells were seeded onto 100 x 20 mm petri dishes and cultured overnight, followed by treatment with 1 and 3 mM of NaPi and KPi for 24 and 48 hours. At each time-point, 100μL of the cell suspension from each condition was deposited onto Starfrost slides (Knittel Glass) using a CytospinTM 4 Centrifuge (Thermo Scientific). Cells were fixed with 4% paraformaldehyde (PFA) (Sigma-Aldriched), permeabilized with 0.5% Triton X-100 in PBS, and blocked with a buffer solution [0.1 % Bovine Serum Albumin (BSA), 0.2% Triton X-100, 0.05% Tween-20, and 10% Normal Goat Serum (NGS) in 1X PBS] at room temperature. The cells were stained and incubated overnight at 4oC with the primary antibodies anti-CK8 (1/200 dilution; Santa Cruz Biotechnology) and anti-Vim (1/200 dilution; Santa Cruz Biotechnology). On the second day, the cells were incubated for 1 hour with the secondary antibodies Alexa 488 and 568 conjugated IgG (1/200 dilution; ThermoFisher Scientific). Slides were then mounted with 4′,6-diamidino-2-phenylindole (DAPI) for nuclear staining, and fluorescent signals were captured from four random representative fields using a Leica DM6 B Fully Automated Upright Microscope with a 20X objective. Quantification of CK8 and Vim expression was performed manually as a percentage of DAPI-stained cells.
4.8. Statistical Analysis
Statistical analysis and data graph plots were performed using the GraphPad Prism 9 software version 9.5.1 (GraphPad Software, USA). Data are expressed as the mean ± standard error of the mean (SEM) of at least 3 independent experiments. Differences between individual groups were analyzed using two-way ANOVA followed by Bonferroni post-hoc tests for multiple comparisons. Statistical significance was reported at p-values < 0.05 (* p < 0.05, ** p < 0.01, and *** p < 0.001).
5. Conclusions
While epidemiological studies established an association between higher phosphorus intakes and risk of lethal and high-grade PC, our in vitro study results suggest that elevated Pi levels per se, in the hyperphosphatemia range, can directly promote EMT in PC and thus may play a role in tumor progression. This finding highlights the potential role of targeting Pi in the TME of PC cells in managing advanced stages of the disease.
Author Contributions
Conceptualization, C.M., O.O., W.A.K; methodology, C.M.K., F.G., C.M., L.J., O.O., W.A.-K; formal analysis, C.M.K, F.G.; investigation, C.M.K..; data curation, C.M.K..; writing—original draft preparation, C.M.K.; writing—review and editing, visualization, C.M.K.; supervision, F.G., S.H., A.Y.; L.J., C.M., F.G., O.O.; resources, O.O., W.A.K.; All authors have read and agreed to the published version of the manuscript.
Funding
This research was funded by the University Research Board (URB)
Data Availability Statement
The data supporting the findings of this study are available from the corresponding authors upon request.
Acknowledgments
We would like to acknowledge the staff of the core facilities at the Faculty of Agriculture and Food Sciences, the Faculty of Medicine, and the Kamal A. Shair Central Research Science Laboratory at the American University of Beirut. We would also like to extend a special acknowledgment to Dr. Mark Doumit for his guidance in the immunofluorescence assay.
Conflicts of Interest
The authors declare no conflicts of interest. Also, the funders had no role in the design of the study; in the collection, analyses, or interpretation of data; in the writing of the manuscript; or in the decision to publish the results.
Abbreviations
The following abbreviations are used in this manuscript:
| AKT | Protein Kinase B |
| CK18 | Cytokeratin 18 |
| CK8 | Cytokeratin 8 |
| CRPC | Castration Resistant Prostate Cancer |
| DAPI | 4′,6-Diamidino-2-Phenylindole |
| ddH2O | Double Distilled Water |
| EMT | Epithelial-Mesenchymal Transition |
| ERK1/2 | Extracellular Signal-Regulated Kinase ½ |
| FGF23 | Fibroblast Growth Factor 23 |
| HEK 293 | Human Embryonic Kidney 293 |
| HeLa | Cervical Cancer Cells |
| ICF | Intracellular Fuid |
| KCL | Potassium Chloride |
| KPi | Potassium Phosphate |
| MAPK | Mitogen-Activated Protein Kinase |
| MET | Mesenchymal-Epithelial Transition |
| MR | Medelian Randomization |
| MTT | 3-(4, 5-Dimethylthiazol-2-Yl)-2, 5-Diphenyltetrazolium Bromide |
| NaCl | Sodium Chloride |
| NaPi | Sodium Phosphate |
| NaPi2b | Sodium-Dependent Phosphate Transport Protein 2B |
| PBS | Phosphate-Buffered Saline |
| PC | Prostate Cancer |
| Pi | Inorganic Phosphate |
| PTH | Parathyroid Hormone |
| TME | Tumor Microenvironment |
| Vim | Vimentin |
References
- Sung, H.; Ferlay, J.; Siegel, R.L.; Laversanne, M.; Soerjomataram, I.; Jemal, A.; Bray, F. Global Cancer Statistics 2020: GLOBOCAN Estimates of Incidence and Mortality Worldwide for 36 Cancers in 185 Countries. CA Cancer J Clin 2021, 71, 209–249. [Google Scholar] [CrossRef] [PubMed]
- Tang, Y.; Pan, J.; Huang, S.; Peng, X.; Zou, X.; Luo, Y.; Ren, D.; Zhang, X.; Li, R.; He, P.; et al. Downregulation of miR-133a-3p promotes prostate cancer bone metastasis via activating PI3K/AKT signaling. J Exp Clin Cancer Res 2018, 37, 160. [Google Scholar] [CrossRef]
- Kensler, K.H.; Rebbeck, T.R. Cancer Progress and Priorities: Prostate Cancer. Cancer Epidemiol Biomarkers Prev 2020, 29, 267–277. [Google Scholar] [CrossRef]
- Rebello, R.J.; Oing, C.; Knudsen, K.E.; Loeb, S.; Johnson, D.C.; Reiter, R.E.; Gillessen, S.; Van der Kwast, T.; Bristow, R.G. Prostate cancer. Nat Rev Dis Primers 2021, 7, 9. [Google Scholar] [CrossRef]
- Leslie, S.W.; Soon-Sutton, T.L.; R, I.A.; Sajjad, H.; Skelton, W.P. Prostate Cancer. In StatPearls; StatPearls Publishing 2024.
- Daher, M.; Telvizian, T.; Dagher, C.; Abdul-Sater, Z.; Massih, S.A.; Chediak, A.E.; Charafeddine, M.; Shahait, M.; Alameddine, R.; Temraz, S.; et al. High rates of advanced prostate cancer in the Middle East: Analysis from a tertiary care center. Urol Ann 2021, 13, 418–423. [Google Scholar] [CrossRef] [PubMed]
- Siegel, R.L.; Miller, K.D.; Wagle, N.S.; Jemal, A. Cancer statistics, 2023. CA Cancer J Clin 2023, 73, 17–48. [Google Scholar] [CrossRef]
- Coleman, W. Molecular Pathogenesis of Prostate Cancer. 2018; pp. 555-568.
- Børretzen, A.; Gravdal, K.; Haukaas, S.A.; Mannelqvist, M.; Beisland, C.; Akslen, L.A.; Halvorsen, O.J. The epithelial–mesenchymal transition regulators Twist, Slug, and Snail are associated with aggressive tumour features and poor outcome in prostate cancer patients. The Journal of Pathology: Clinical Research 2021, 7, 253–270. [Google Scholar] [CrossRef] [PubMed]
- Odero-Marah, V.; Hawsawi, O.; Henderson, V.; Sweeney, J. Epithelial-Mesenchymal Transition (EMT) and Prostate Cancer. In Cell & Molecular Biology of Prostate Cancer: Updates, Insights and New Frontiers, Schatten, H., Ed.; Springer International Publishing: Cham, 2018; pp. 101–110. [Google Scholar]
- Berenguer, C.V.; Pereira, F.; Câmara, J.S.; Pereira, J.A.M. Underlying Features of Prostate Cancer-Statistics, Risk Factors, and Emerging Methods for Its Diagnosis. Curr Oncol 2023, 30, 2300–2321. [Google Scholar] [CrossRef]
- Mandair, D.; Rossi, R.E.; Pericleous, M.; Whyand, T.; Caplin, M.E. Prostate cancer and the influence of dietary factors and supplements: a systematic review. Nutrition & Metabolism 2014, 11, 30. [Google Scholar] [CrossRef]
- Lv, L.; Ye, D.; Chen, J.; Qian, Y.; Fu, A.N.; Song, J.; Yang, H.; Liu, B.; Sun, X.; Du, L.; et al. Circulating phosphorus concentration and risk of prostate cancer: a Mendelian randomization study. The American Journal of Clinical Nutrition 2022, 115, 534–543. [Google Scholar] [CrossRef]
- Gutierrez, O.; Kalantar-Zadeh, K.; Mehrotra, R. Clinical Aspects of Natural and Added Phosphorus in Foods; 2017.
- Goretti Penido, M.; Alon, U.S. Phosphate homeostasis and its role in bone health. Pediatr Nephrol 2012, 27, 2039–2048. [Google Scholar] [CrossRef]
- Leone, K.A. 166 - Calcium, Magnesium, and Phosphorus. In Emergency Medicine (Second Edition), Adams, J.G., Ed.; W.B. Saunders: Philadelphia, 2013; pp. 1405–1417. [Google Scholar]
- Berndt, T.J.; Schiavi, S.; Kumar, R. "Phosphatonins" and the regulation of phosphorus homeostasis. Am J Physiol Renal Physiol 2005, 289, F1170–1182. [Google Scholar] [CrossRef] [PubMed]
- Nadkarni, G.N.; Uribarri, J. Phosphorus and the kidney: What is known and what is needed. Adv Nutr 2014, 5, 98–103. [Google Scholar] [CrossRef]
- de Boer, I.H.; Rue, T.C.; Kestenbaum, B. Serum phosphorus concentrations in the third National Health and Nutrition Examination Survey (NHANES III). Am J Kidney Dis 2009, 53, 399–407. [Google Scholar] [CrossRef] [PubMed]
- Portale, A.A.; Halloran, B.P.; Morris, R.C., Jr. Physiologic regulation of the serum concentration of 1,25-dihydroxyvitamin D by phosphorus in normal men. J Clin Invest 1989, 83, 1494–1499. [Google Scholar] [CrossRef]
- Nishida, Y.; Taketani, Y.; Yamanaka-Okumura, H.; Imamura, F.; Taniguchi, A.; Sato, T.; Shuto, E.; Nashiki, K.; Arai, H.; Yamamoto, H.; et al. Acute effect of oral phosphate loading on serum fibroblast growth factor 23 levels in healthy men. Kidney Int 2006, 70, 2141–2147. [Google Scholar] [CrossRef]
- Khattab, M.; Abi-Rashed, C.; Ghattas, H.; Hlais, S.; Obeid, O. Phosphorus ingestion improves oral glucose tolerance of healthy male subjects: a crossover experiment. Nutr J 2015, 14, 112. [Google Scholar] [CrossRef] [PubMed]
- Wang, M.; Zhang, J.; Kalantar-Zadeh, K.; Chen, J. Focusing on Phosphorus Loads: From Healthy People to Chronic Kidney Disease. Nutrients 2023, 15. [Google Scholar] [CrossRef]
- Perez-Cornago, A.; Fensom, G.K.; Andrews, C.; Watts, E.L.; Allen, N.E.; Martin, R.M.; Van Hemelrijck, M.; Key, T.J.; Travis, R.C. Examination of potential novel biochemical factors in relation to prostate cancer incidence and mortality in UK Biobank. British Journal of Cancer 2020, 123, 1808–1817. [Google Scholar] [CrossRef]
- Wilson, K.M.; Shui, I.M.; Mucci, L.A.; Giovannucci, E. Calcium and phosphorus intake and prostate cancer risk: a 24-y follow-up study. Am J Clin Nutr 2015, 101, 173–183. [Google Scholar] [CrossRef]
- Brändstedt, J.; Almquist, M.; Manjer, J.; Malm, J. Vitamin D, PTH, and calcium in relation to survival following prostate cancer. Cancer Causes Control 2016, 27, 669–677. [Google Scholar] [CrossRef] [PubMed]
- Feng, S.; Wang, J.; Zhang, Y.; Creighton, C.J.; Ittmann, M. FGF23 promotes prostate cancer progression. Oncotarget 2015, 6, 17291–17301. [Google Scholar] [CrossRef] [PubMed]
- Kim, W.T.; Bang, W.J.; Seo, S.P.; Kang, H.W.; Byun, Y.J.; Piao, X.M.; Jeong, P.; Shin, K.S.; Choi, S.Y.; Lee, O.J.; et al. Parathyroid hormone is associated with prostate cancer. Prostate Int 2020, 8, 116–120. [Google Scholar] [CrossRef]
- He, P.; Mann-Collura, O.; Fling, J.; Edara, N.; Hetz, R.; Razzaque, M.S. High phosphate actively induces cytotoxicity by rewiring pro-survival and pro-apoptotic signaling networks in HEK293 and HeLa cells. Faseb j 2021, 35, e20997. [Google Scholar] [CrossRef]
- Di Marco, G.S.; Hausberg, M.; Hillebrand, U.; Rustemeyer, P.; Wittkowski, W.; Lang, D.; Pavenstädt, H. Increased inorganic phosphate induces human endothelial cell apoptosis in vitro. Am J Physiol Renal Physiol 2008, 294, F1381–1387. [Google Scholar] [CrossRef] [PubMed]
- Russo-Abrahão, T.; Lacerda-Abreu, M.A.; Gomes, T.; Cosentino-Gomes, D.; Carvalho-de-Araújo, A.D.; Rodrigues, M.F.; Oliveira, A.C.L.d.; Rumjanek, F.D.; Monteiro, R.d.Q.; Meyer-Fernandes, J.R. Characterization of inorganic phosphate transport in the triple-negative breast cancer cell line, MDA-MB-231. PLOS ONE 2018, 13, e0191270. [Google Scholar] [CrossRef]
- Shyian, M.; Gryshkova, V.; Kostianets, O.; Gorshkov, V.; Gogolev, Y.; Goncharuk, I.; Nespryadko, S.; Vorobjova, L.; Filonenko, V.; Kiyamova, R. Quantitative analysis of SLC34A2 expression in different types of ovarian tumors. Exp Oncol 2011, 33, 94–98. [Google Scholar]
- Kiyamova, R.; Shyian, M.; Lyzogubov, V.V.; Usenko, V.S.; Gout, T.; Filonenko, V. Immunohistochemical analysis of NaPi2b protein (MX35 antigen) expression and subcellular localization in human normal and cancer tissues. Exp Oncol 2011, 33, 157–161. [Google Scholar]
- Gryshkova, V.; Goncharuk, I.; Gurtovyy, V.; Khozhayenko, Y.; Nespryadko, S.; Vorobjova, L.; Usenko, V.; Gout, I.; Filonenko, V.; Kiyamova, R. The study of phosphate transporter NAPI2B expression in different histological types of epithelial ovarian cancer. Exp Oncol 2009, 31, 37–42. [Google Scholar]
- Nurgalieva, A.K.; Popov, V.E.; Skripova, V.S.; Bulatova, L.F.; Savenkova, D.V.; Vlasenkova, R.A.; Safina, S.Z.; Shakirova, E.Z.; Filonenko, V.V.; Bogdanov, M.V.; et al. Sodium-dependent phosphate transporter NaPi2b as a potential predictive marker for targeted therapy of ovarian cancer. Biochemistry and Biophysics Reports 2021, 28, 101104. [Google Scholar] [CrossRef]
- Chang, S.H.; Yu, K.N.; Lee, Y.S.; An, G.H.; Beck, G.R., Jr.; Colburn, N.H.; Lee, K.H.; Cho, M.H. Elevated inorganic phosphate stimulates Akt-ERK1/2-Mnk1 signaling in human lung cells. Am J Respir Cell Mol Biol 2006, 35, 528–539. [Google Scholar] [CrossRef] [PubMed]
- Camalier, C.E.; Young, M.R.; Bobe, G.; Perella, C.M.; Colburn, N.H.; Beck, G.R., Jr. Elevated phosphate activates N-ras and promotes cell transformation and skin tumorigenesis. Cancer Prev Res (Phila) 2010, 3, 359–370. [Google Scholar] [CrossRef] [PubMed]
- Lin, Y.; McKinnon, K.E.; Ha, S.W.; Beck, G.R., Jr. Inorganic phosphate induces cancer cell mediated angiogenesis dependent on forkhead box protein C2 (FOXC2) regulated osteopontin expression. Mol Carcinog 2015, 54, 926–934. [Google Scholar] [CrossRef]
- Lewis, E.; Seltun, F.; Razzaque, M.S.; He, P. Phosphate Toxicity and Epithelial to Mesenchymal Transition. Adv Exp Med Biol 2022, 1362, 73–84. [Google Scholar] [CrossRef]
- Bobko, A.A.; Eubank, T.D.; Driesschaert, B.; Dhimitruka, I.; Evans, J.; Mohammad, R.; Tchekneva, E.E.; Dikov, M.M.; Khramtsov, V.V. Interstitial Inorganic Phosphate as a Tumor Microenvironment Marker for Tumor Progression. Scientific Reports 2017, 7, 41233. [Google Scholar] [CrossRef] [PubMed]
- Brown, R.B.; Razzaque, M.S. Phosphate toxicity and tumorigenesis. Biochimica et Biophysica Acta (BBA) - Reviews on Cancer 2018, 1869, 303–309. [Google Scholar] [CrossRef]
- Lacerda-Abreu, M.A.; Meyer-Fernandes, J.R. Inorganic Phosphate (Pi) in the Breast Cancer Microenvironment: Production, Transport and Signal Transduction as Potential Targets for Anticancer Strategies. Curr Cancer Drug Targets 2023, 23, 187–198. [Google Scholar] [CrossRef]
- Trump, D.L. Calcitriol and cancer therapy: A missed opportunity. Bone Reports 2018, 9, 110–119. [Google Scholar] [CrossRef]
- Abou-Kheir, W.; Hynes, P.G.; Martin, P.; Yin, J.J.; Liu, Y.N.; Seng, V.; Lake, R.; Spurrier, J.; Kelly, K. Self-renewing Pten-/- TP53-/- protospheres produce metastatic adenocarcinoma cell lines with multipotent progenitor activity. PLoS One 2011, 6, e26112. [Google Scholar] [CrossRef]
- Daoud, G.; Monzer, A.; Bahmad, H.; Chamaa, F.; Hamdar, L.; Mouhieddine, T.H.; Shayya, S.; Eid, A.; Kobeissy, F.; Liu, Y.N.; et al. Primary versus castration-resistant prostate cancer: modeling through novel murine prostate cancer cell lines. Oncotarget 2016, 7, 28961–28975. [Google Scholar] [CrossRef]
- Lin, H.; Zhou, Y.; Lei, Q.; Lin, D.; Chen, J.; Wu, C. Effect of inorganic phosphate on migration and osteogenic differentiation of bone marrow mesenchymal stem cells. BMC Dev Biol 2021, 21, 1. [Google Scholar] [CrossRef]
- van Meerloo, J.; Kaspers, G.J.; Cloos, J. Cell sensitivity assays: the MTT assay. Methods Mol Biol 2011, 731, 237–245. [Google Scholar] [CrossRef]
- Strober, W. Trypan Blue Exclusion Test of Cell Viability. Curr Protoc Immunol 2015, 111, A3.B–1. [Google Scholar] [CrossRef]
- Justus, C.R.; Leffler, N.; Ruiz-Echevarria, M.; Yang, L.V. In vitro cell migration and invasion assays. J Vis Exp 2014. [Google Scholar] [CrossRef]
Figure 1.
Supraphysiological elevated concentrations of NaPi inhibit cell growth of murine prostate cancer cells. The effect upon treatment with varying concentrations of NaPi (a), KPi (b), NaCl (c), and KCl (d) on PLum-AD cell proliferation was assessed using the MTT assay. PLum-AD cells were seeded in triplicates in 96-well plates and incubated for 24, 48, and 72h with or without the indicated concentrations of the treatment. Results are expressed as the percentage of cellular proliferation of the treated group compared to the control at each time point. Data represents an average of three independent experiments, reported as mean ± SEM, and analyzed using two-way ANOVA. Statistical significance reported at p-values < 0.05 (* p < 0.05). MTT, 3-(4, 5-dimethylthiazol-2-yl)-2, 5-diphenyltetrazolium bromid; NaCl, sodium chloride; NaPi, sodium phosphate; KPi, potassium phosphate; KCl, potassium chloride.
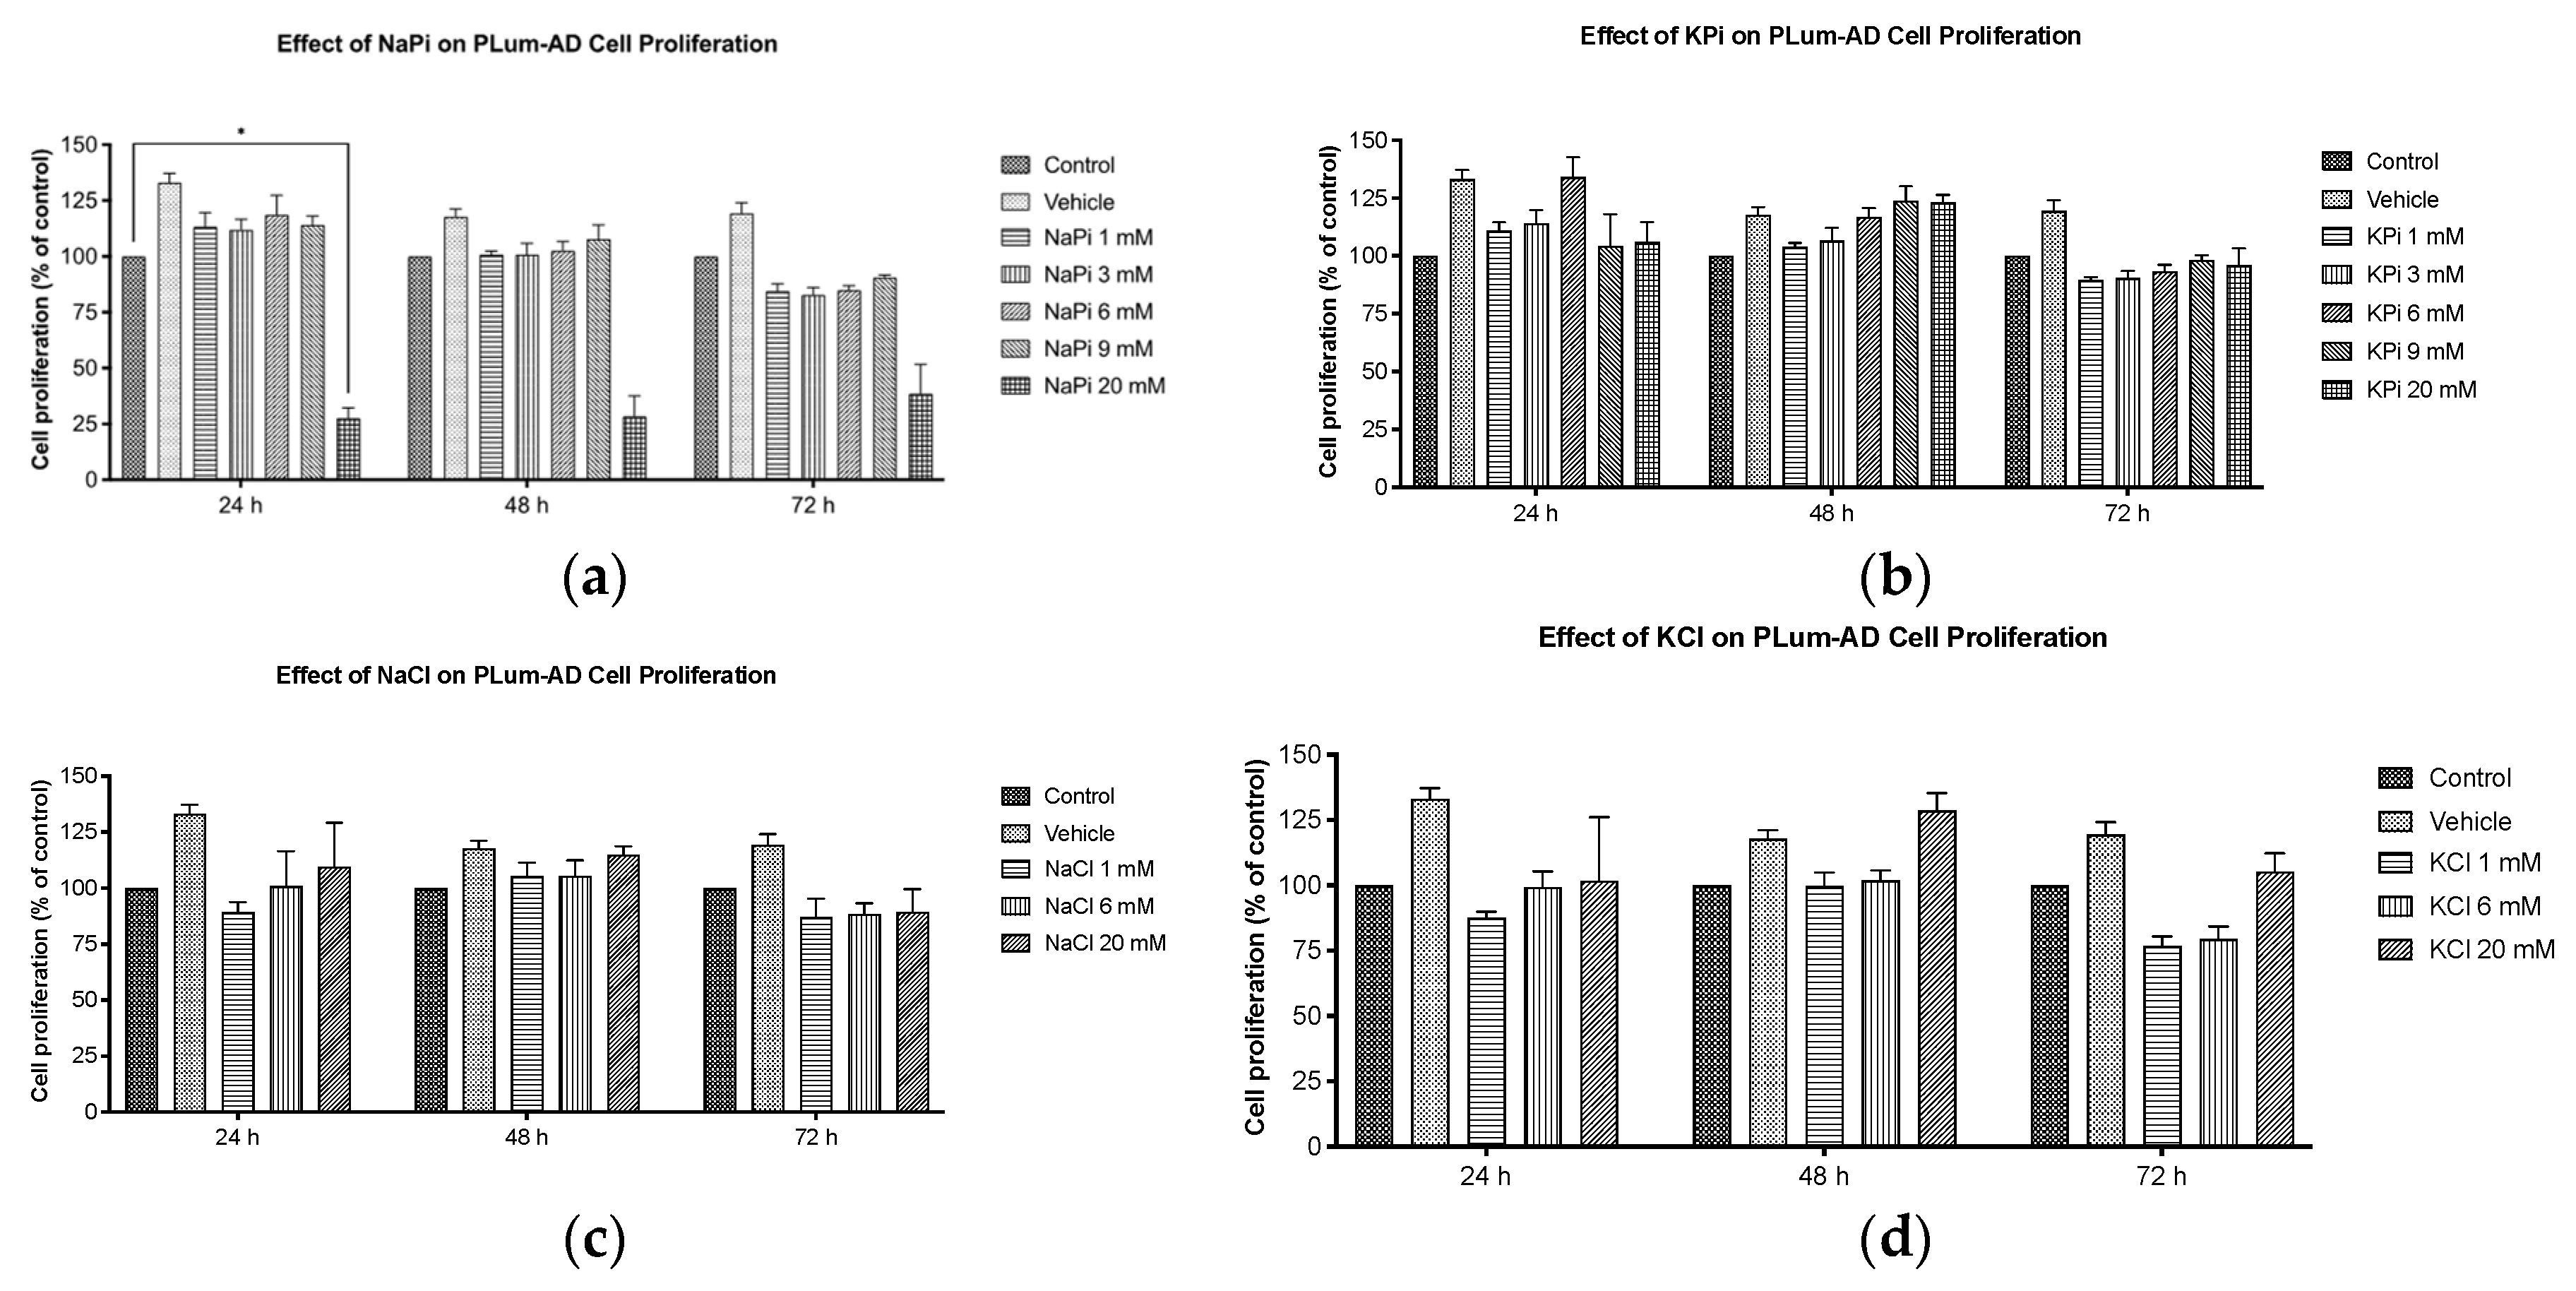
Figure 2.
Increased concentrations of NaPi and KPi exert no effect on the cell viability of murine prostate cancer cells. PLum-AD cells were seeded in duplicates in 24-well plates. After incubation for 24, 48, and 72h with or without the indicated treatment concentrations, cell viability was assessed using the trypan blue exclusion assay. Results are expressed as a percentage of viability of the NaPi (a), KPi (b), NaCl (c), and KCl (d) groups compared to control at 24, 48, and 72 h time points. Data represents an average of four independent experiments, reported as mean ± SEM, and analyzed using two-way ANOVA. Statistical significance reported at p-values < 0.05 (* p < 0.05 and ** p < 0.01). NaCl, sodium chloride; NaPi, sodium phosphate; KPi, potassium phosphate; KCl, potassium chloride.
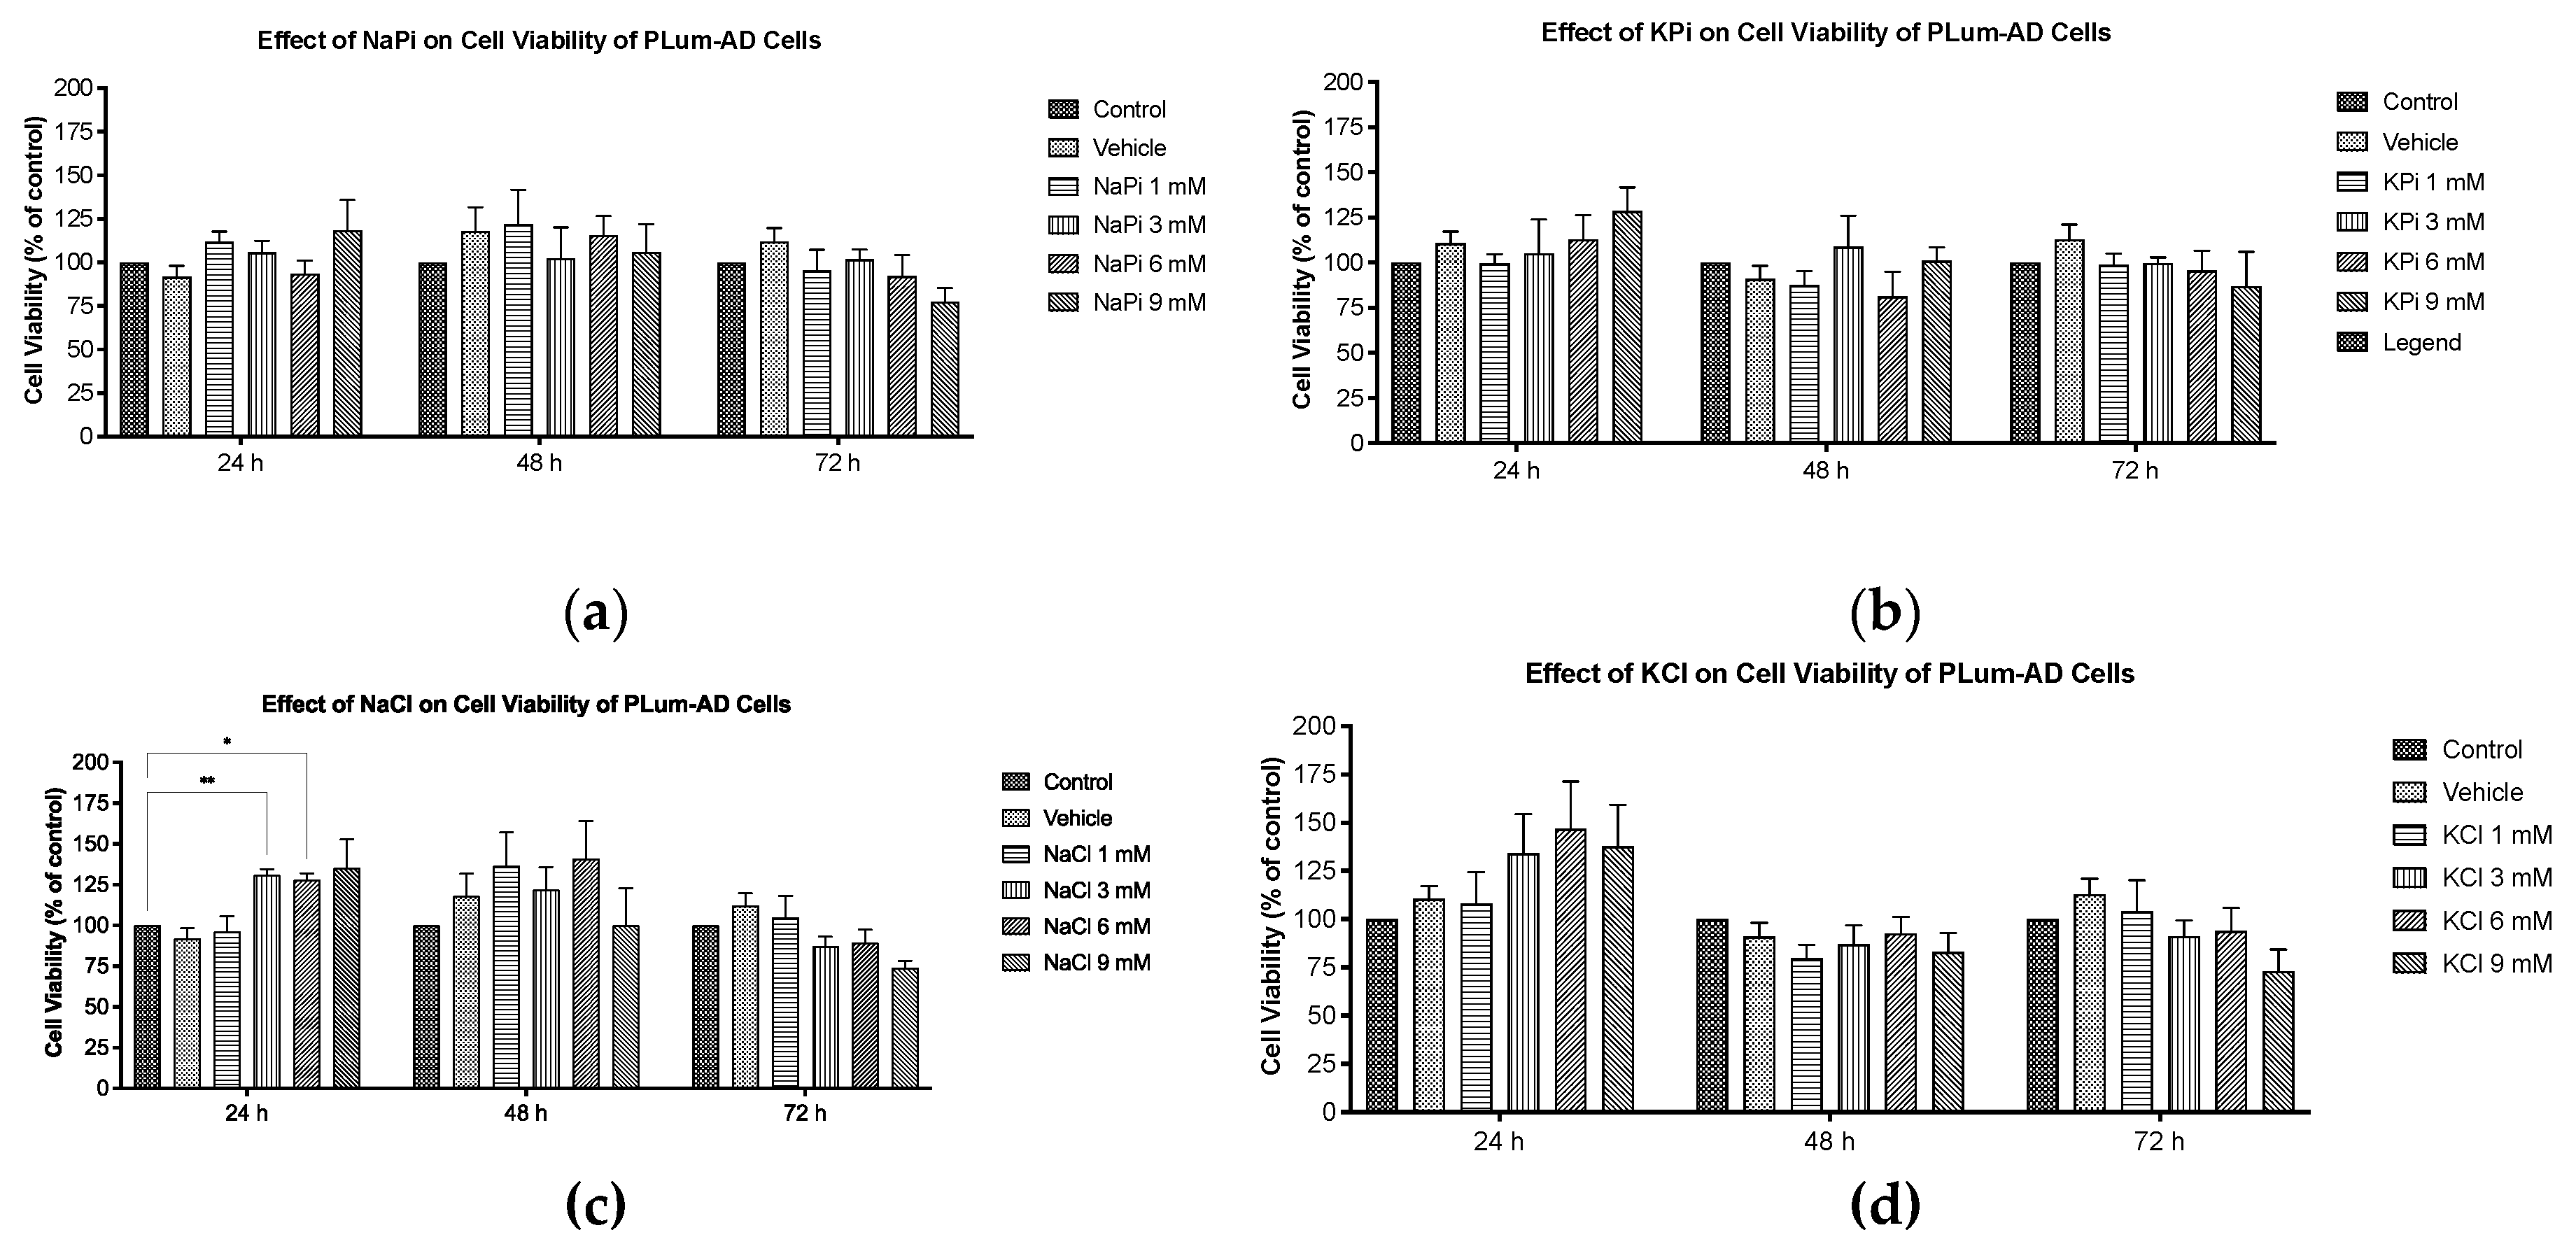
Figure 3.
Elevated concentrations of NaPi and KPi exert no effect on the migratory ability of murine prostate cancer cells. PLum-AD cells were seeded in duplicates in 24-well plates. A uniform scratch was made on confluent cells using a 200 μL tip and images were then taken at 0, 3, 6, 9, 12, and 14h with or without the indicated treatment concentrations. Representative images at 5x (scale bar = 200 μm) at 0, 9, and 14 h, analyzed using ImageJ software, are shown (a). Quantification of the open wound area was assessed over time using the ImageJ software. Results are expressed as a percentage of open wound area of the NaPi treated groups (b) and KPi treated groups (c) compared to control at each time point. Data represents an average of three independent experiments, reported as mean ± SEM, and analyzed using two-way ANOVA. NaPi, sodium phosphate; KPi, potassium phosphate.
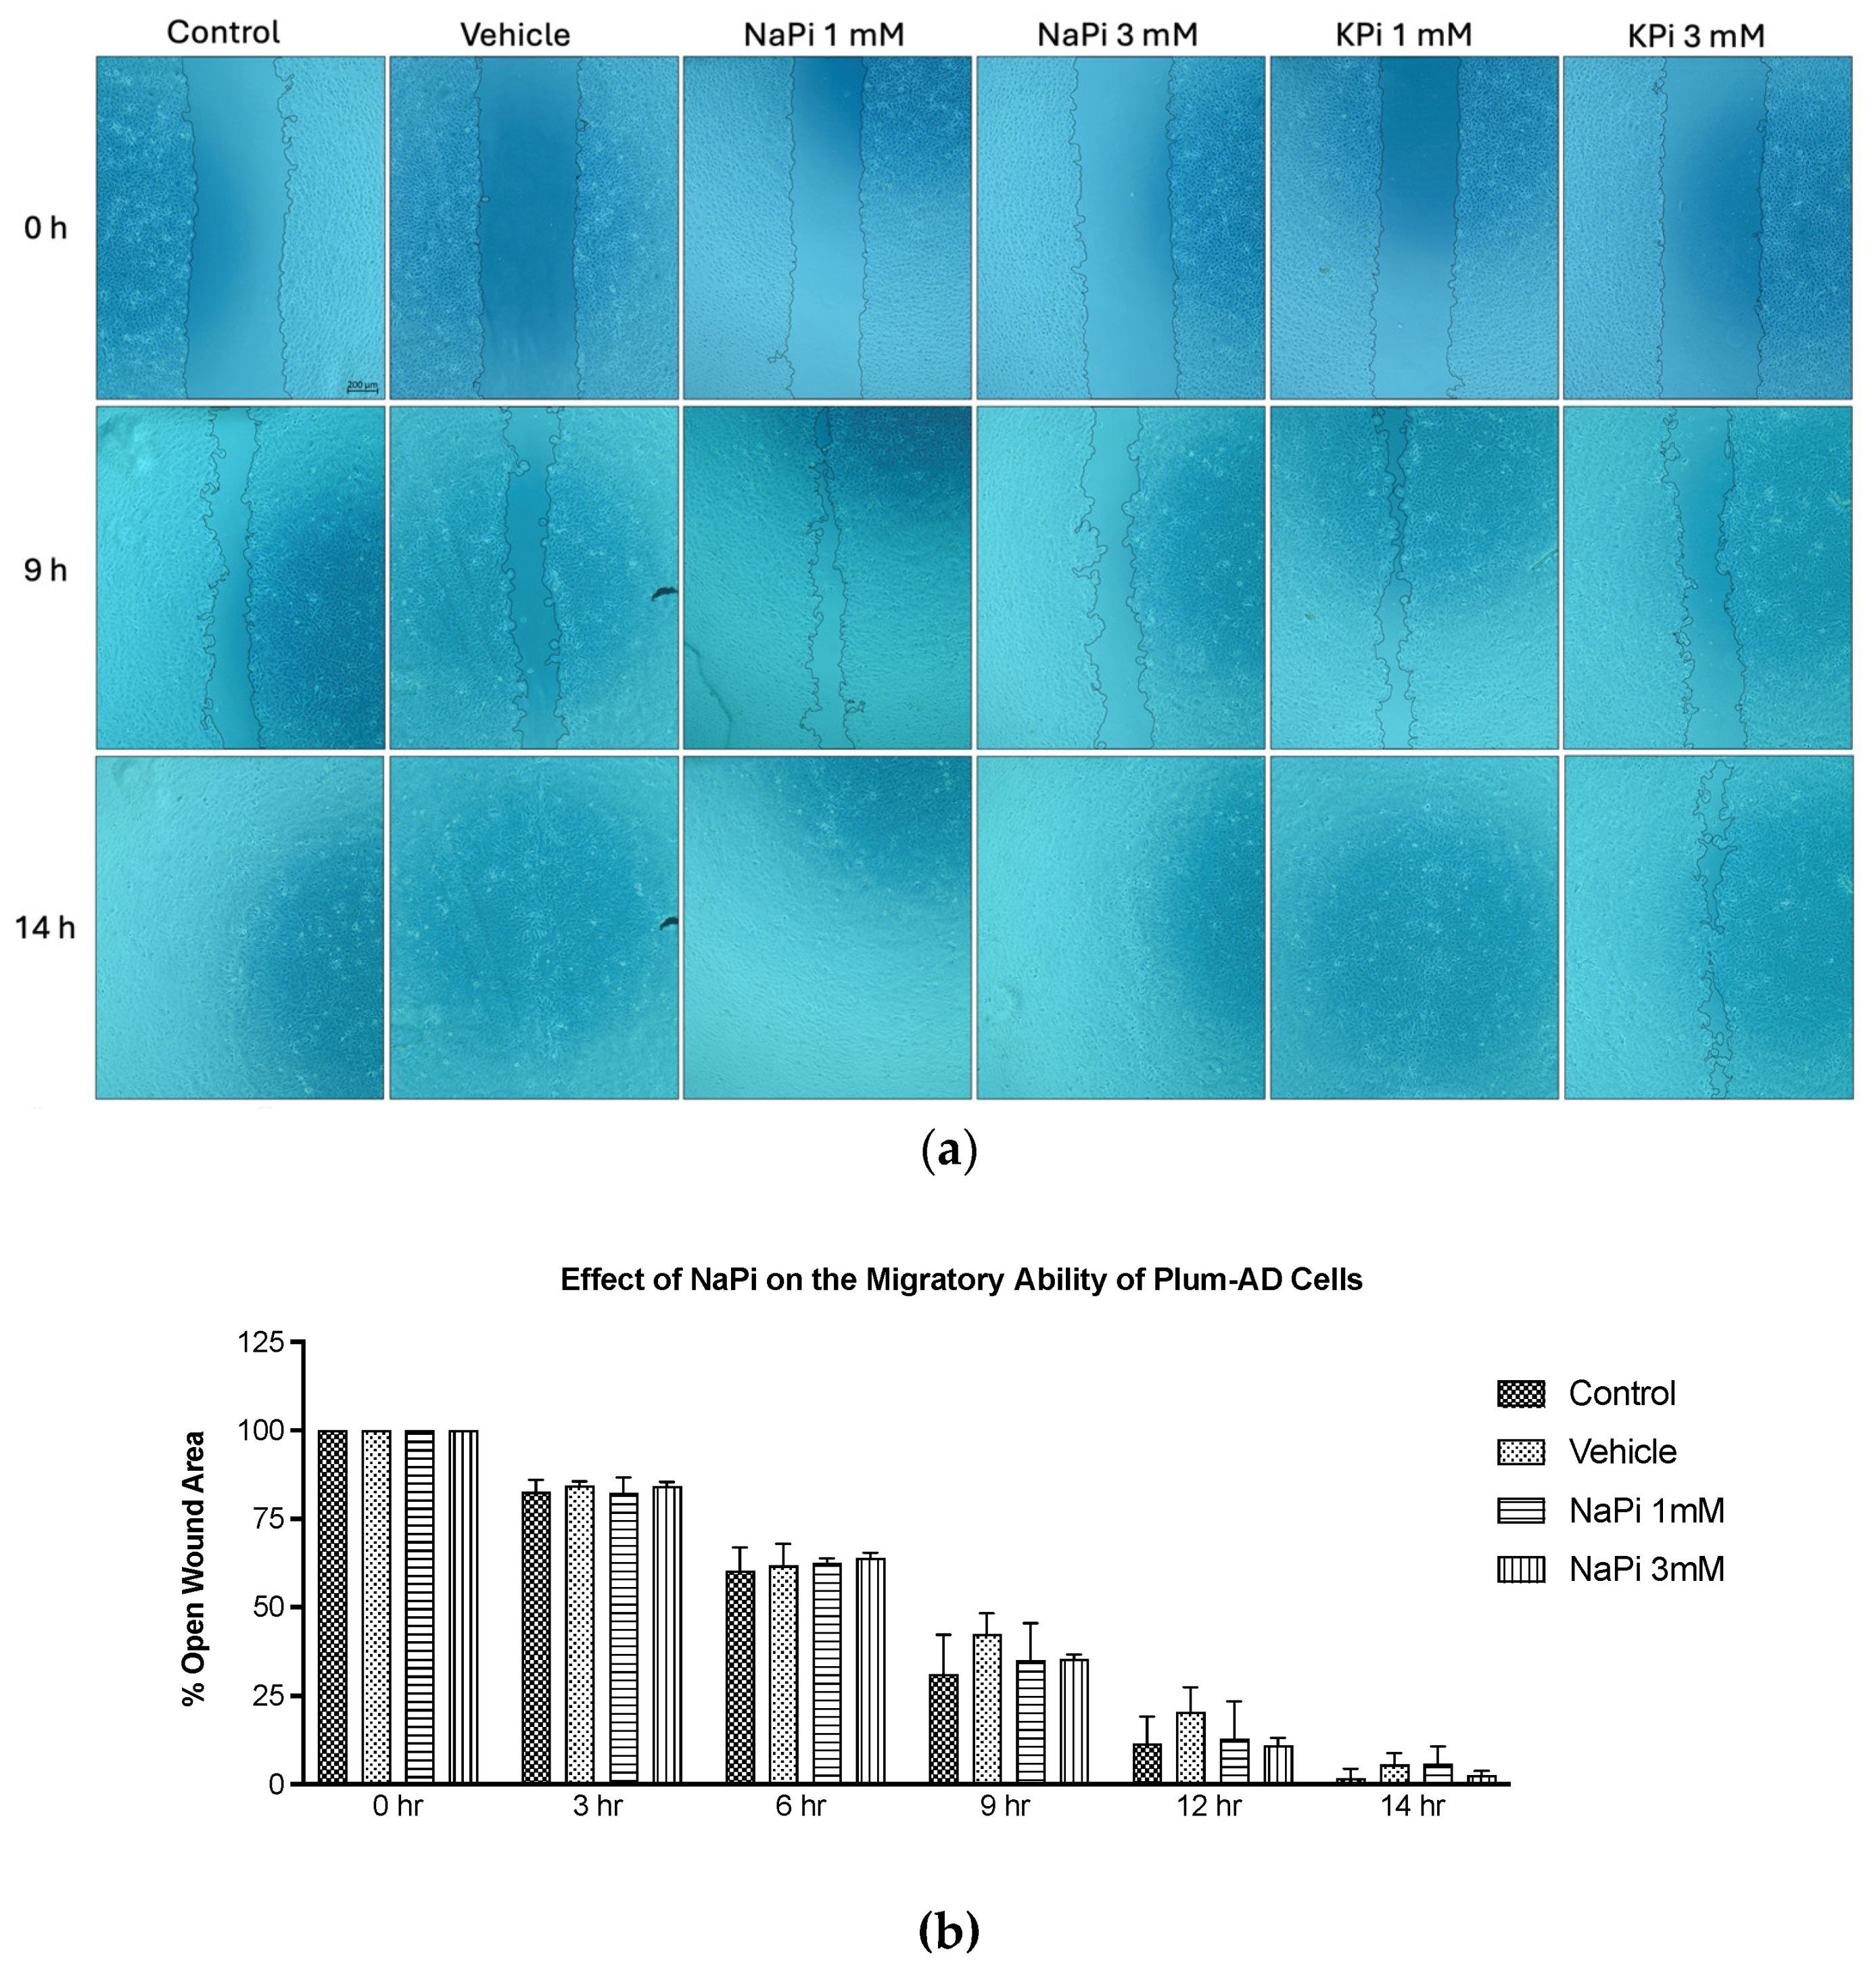
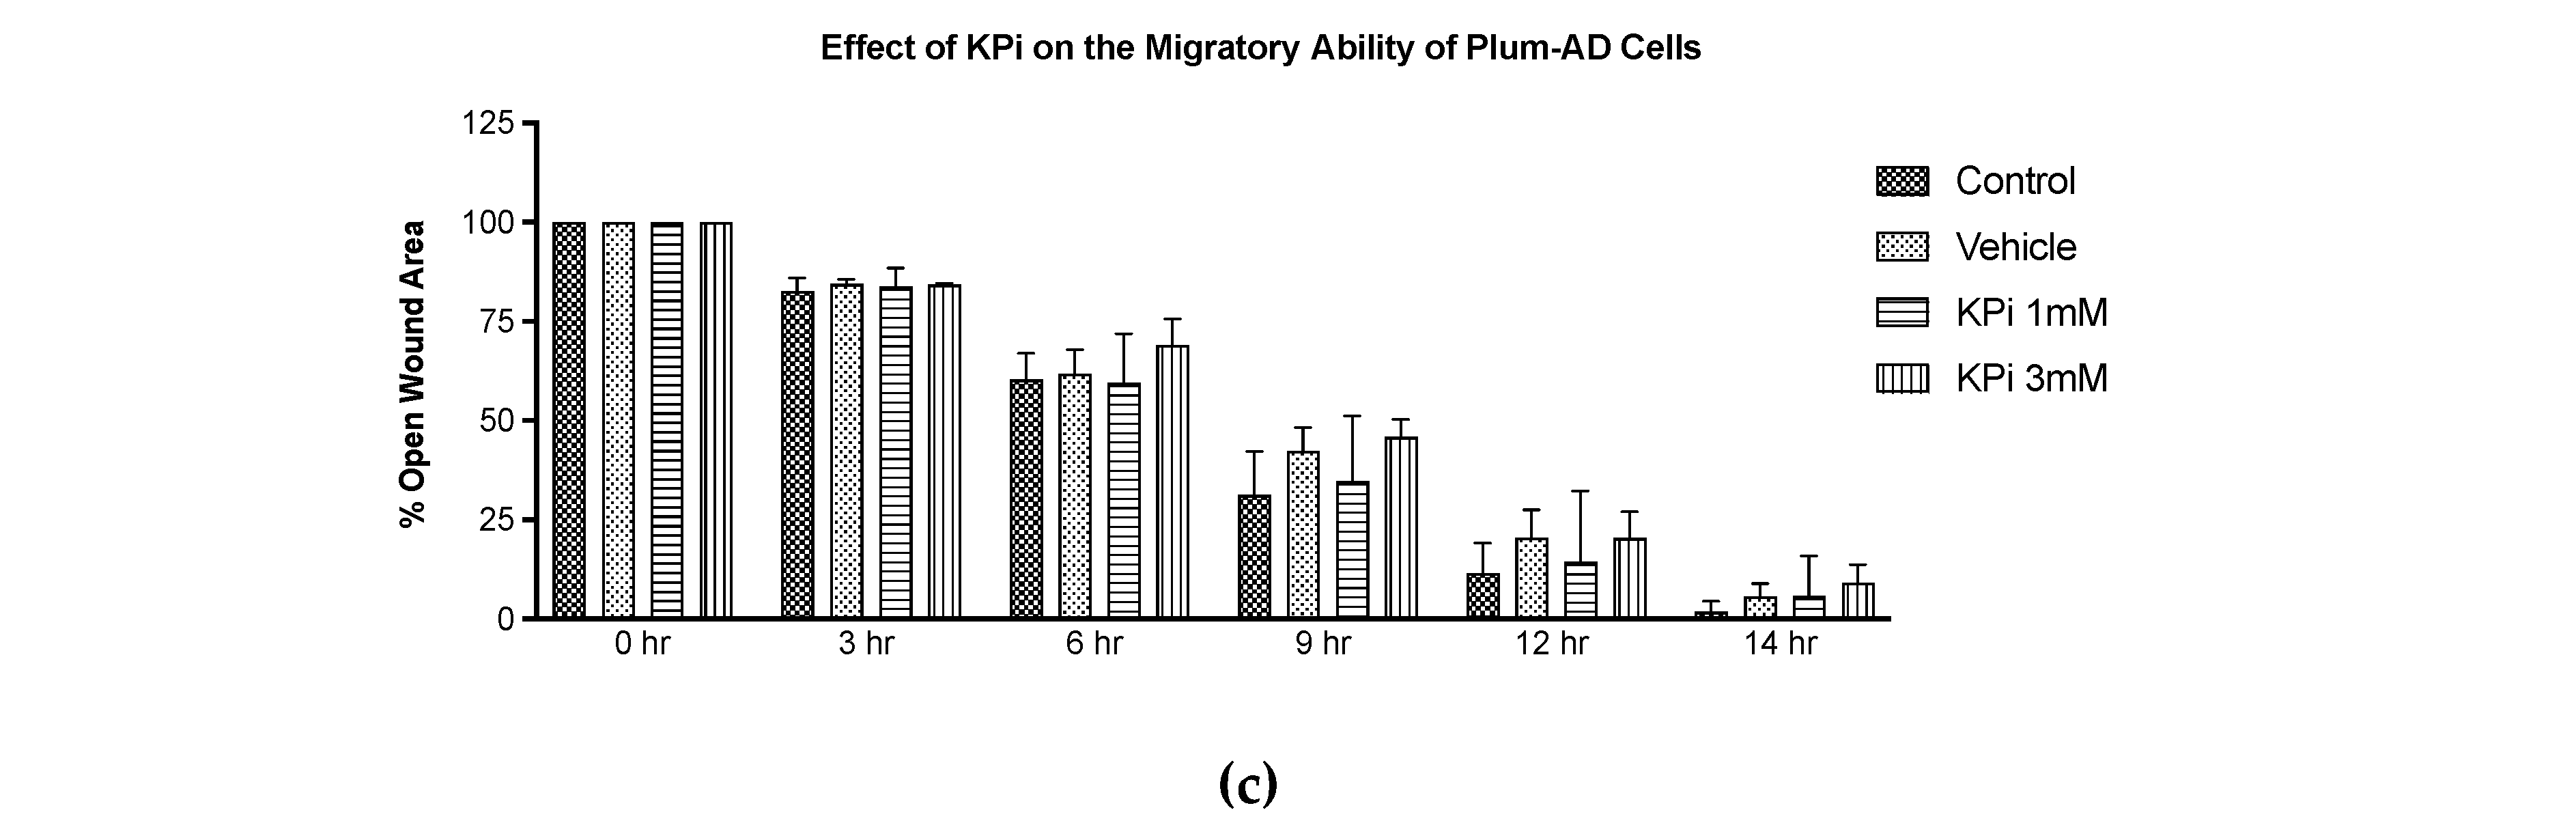
Figure 4.
Elevated concentrations of NaPi and KPi increased the relative expression of Vimentin in murine prostate cancer cells. Representative immunofluorescent images of PLum-AD cells stained for EMT markers (epithelial CK8 and mesenchymal Vim) and the nuclear counterstain DAPI are shown at 20X (scale bar = 75 μm) for time points 24 (a) and 48h (b) with or without treatment. Cells positively stained for Vim after treatment with 1 and 3 mM NaPi (c) and KPi (d) for 24 and 48 hr, were plotted as percentages out of the total number of positively stained cells for DAPI per experiment. Data represents an average of three independent experiments, reported as mean ± SEM, and analyzed using two-way ANOVA. Statistical significance reported at p-values < 0.05 (* p < 0.05, ** p < 0.01, *** p < 0.001). DAPI, 4′,6-diamidino-2-phenylindole; CK8, cytokeratin 8; NaPi, sodium phosphate; KPi, potassium phosphate; Vim, vimentin.
Disclaimer/Publisher’s Note: The statements, opinions and data contained in all publications are solely those of the individual author(s) and contributor(s) and not of MDPI and/or the editor(s). MDPI and/or the editor(s) disclaim responsibility for any injury to people or property resulting from any ideas, methods, instructions or products referred to in the content. |
© 2025 by the authors. Licensee MDPI, Basel, Switzerland. This article is an open access article distributed under the terms and conditions of the Creative Commons Attribution (CC BY) license (https://creativecommons.org/licenses/by/4.0/).
Copyright: This open access article is published under a Creative Commons CC BY 4.0 license, which permit the free download, distribution, and reuse, provided that the author and preprint are cited in any reuse.


