
Submitted:
13 March 2025
Posted:
14 March 2025
You are already at the latest version
Abstract
Background: Understanding the impact of different learning materials in terms of comprehension and engagement is essential for optimizing educational strategies. While digital learning tools are increasingly used, offering and multiplying different educational solutions, their effects on learners’ mental workload, attention, and engagement remain underexplored. This study aims to investigate how different types of learning contents — educational videos, academic videos, and text reading—affect cognitive processing and engagement. Methods: Neurophysiological signals, including electroencephalography (EEG), electrodermal activity (EDA), and photoplethysmography (PPG), were recorded from experimental participants while they were engaged with each learning content. Subjective assessments of cognitive effort and engagement, together with a quiz to assess the knowledge acquisition, were collected through questionnaires for each tested content. Key neurophysiological metrics, such as engagement and Human Distraction Index (HDI), were computed and compared across conditions. Results: Findings indicate that video-based learning materials, particularly educational videos with visual enhancements, elicited higher engagement and lower cognitive load compared to text-based learning. The text reading condition was associated with increased mental workload and a higher distraction index, suggesting greater cognitive demands. Correlation analyses confirmed strong associations between neurophysiological indicators and subjective evaluations. Conclusions: The results highlight the potential of neurophysiological measures to objectively assess learning experiences, paving the way for designing more effective and engaging learning platforms.
Keywords:
Neurophysiology
; Learning
; Mental states
; EEG
1. Introduction
The quest to understand and optimize the learning process is a cornerstone of educational research. Unraveling the cognitive mechanisms underlying knowledge acquisition not only enhances theoretical understanding but also paves the way for more effective, personalized and inclusive teaching methodologies. By integrating insights from neuroscience, psychology, and educational technology, researchers can develop personalized learning strategies that cater to diverse learner needs, ultimately improving educational outcomes. While traditional assessment methods like tests and questionnaires provide valuable information, they offer a limited window into the dynamic, internal cognitive and affective states that shape learning. To gain a deeper understanding, researchers are increasingly turning to neurophysiological measures, capturing the subtle physiological changes that accompany relevant cognitive processes of the learner such as mental effort, attention, engagement, and distraction. This approach, often termed educational neuroscience, promises to provide objective, real-time insights into the learner's experience, moving beyond subjective self-reports and behavioral observations.
The application of neurophysiological signals-based approaches, such as the ones based on electroencephalography (EEG), electrodermal activity (EDA), and photoplethysmography (PPG), in real-world educational settings is gaining a constant interest among the scientific community [1,2]. Unlike fMRI or other neuroimaging techniques that require constrained laboratory environments, EEG, EDA, and PPG are relatively portable and less sensitive to movement artifacts, making them suitable for studying learning in more naturalistic contexts. This is crucial for capturing the complexities of real-world learning experiences, which often involve dynamic interactions and a variety of stimuli. Researchers have begun to use these tools to investigate learning in classrooms, online environments, and even during outdoor activities [3,4,5,6]. The existing literature demonstrates the potential of these neurophysiological signals to reveal subtle differences in cognitive and affective states during various learning tasks. Studies have shown that EEG can differentiate between levels of mental workload during problem-solving [7,8,9], identify periods of inattention during lectures [10,11,12], and even predict learning outcomes based on neural activity patterns [13,14,15]. EDA and PPG have been used to assess stress levels during exams, monitor engagement during interactive simulations [13,16], and detect emotional responses to different types of learning materials [17,18,19,20].
However, a comprehensive investigation of how different types of learning materials, commonly used in real-world educational settings, impact cognitive responses from a neurophysiological point of view, remain an area to be explored [21,22,23,24]. Specifically, the comparative effects of visually rich educational videos, interactive training videos designed to promote skill acquisition, and traditional text-based learning materials on students' cognitive and affective states need to be systematically examined using a unified neurophysiological framework. Many existing studies focus on a single modality (e.g., only EEG) or compare very dissimilar learning activities, making it difficult to draw direct comparisons. This study aims to address these gaps by investigating the neurophysiological impact of three common learning contents: an educational learning video with advanced graphic solutions and a simpler communicative language style, a more traditional academic content based on a PowerPoint presentation with a voice-over, and classical text reading. The overarching objective is to objectively characterize the distinct neurophysiological reactions associated with each learning content, using a multimodal neurophysiological approach and, more importantly, to provide objective insights about which one could be the most engaging and efficient learning environment. By simultaneously recording brain activity, electrodermal and cardiovascular responses, it was aimed to capture the interplay between cognitive workload, attentional focus, and emotional engagement elicited by each type of material.
2. Materials and Methods
2.1. Participants
Ten volunteers from Sapienza University, including Master thesis students, Ph.D. candidates, and staff members, ranging in age from 24 to 37 years (M = 28.6, SD = 4.56), were involved in the presented study. They participated in the study without any reward. The experimental task consisted in using the three selected educational contents, related to the same topic, maintaining focus and striving to absorb as much information as possible, as they were informed of a subsequent questionnaire. Before starting, each participant received a clear explanation of the study's procedures and provided written informed consent. While the overall procedure was explained, the specific focus on comparing cognitive engagement across different material types was not explicitly highlighted to avoid influencing their natural viewing behavior. Following the observation period, a comprehensive debriefing session clarified the study's full objectives. Permission to use any visual recordings from the session was also secured. This research was conducted in accordance with the Declaration of Helsinki (1975, revised in 2008) and received ethical approval from the Sapienza University of Rome ethics committee (protocol code 2024/03-002 and 21/03/2024).
2.2. Experimental Protocol
This study presented each participant with three distinct educational contents concerning a single topic: Bluetooth wireless technology. This topic was chosen for its broad relevance in order to avoid any bias due to individual interests. Limiting the study to a single topic was deemed appropriate for this initial investigation. The three educational contents were:
- Task “Educational video”: A popular science video (6 minutes 49 seconds) incorporating short video clips, infographics, and practical examples (Educational video link).
- Task “Academic video”: A traditional lecture-style video (7 minutes 17 seconds) featuring PowerPoint slides and a voice-over narration (Academic video link).
- Task “Text reading”: An encyclopedic text excerpt, designed to be read within approximately 7 minutes (Text reading link).
Participants performed each task individually, seated comfortably in front of a computer monitor with audio delivered via external speakers (Figure 1). The order of presentation of the three contents was randomized across participants to mitigate potential order effects, such as habituation or expectation. Neurophysiological data were recorded continuously from each participant during each task. Prior to the start of each experimental session, a 60-second resting-state baseline was recorded for each participant at their workstation.
2.3. Neurophysiological Data Collection and Processing
2.3.1. Electroencephalography (EEG)
During the experimental tasks, participants' cerebral activity (EEG) was captured using the Mindtooth Touch EEG wearable system (Brain Products GmbH, Gilching, Germany & BrainSigns srl, Rome, Italy, [25]). The device embeds eight recording EEG channels, placed over the prefrontal and parietal regions, specifically at the AFz, AF3, AF4, AF7, AF8, Pz, P3, and P4 locations, in accordance with the 10-10 International System, reference and ground specifically on the right and left mastoids, and sample rate of 125Hz.
Initially, a pre-processing phase was carried out to identify and correct both physiological and non-physiological artifacts unrelated to the cerebral activity of interest, such as ocular, muscular, and movement-induced signals. In this regard, the EEG signal was band-pass filtered with a 5th-order Butterworth filter in the interval 2–30 (Hz). The eye blink artefacts were detected and corrected by employing the o-CLEAN method [26]. For further sources of artefacts, such as the ones deriving by muscular activity and movements, ad-hoc algorithms based on the EEGLAB toolbox [27] were applied. More specifically, one statistical criterion was applied to the 1-second-long pre-processed EEG signal. Firstly, EEG epochs with the signal amplitude exceeding ±80 μV were marked as “artefacts’’. Secondly, such EEG epochs marked as “artefacts” were removed from the EEG dataset in order to proceed for the EEG processing by considering exclusively the cleaned channels.
Once the EEG pre-processing steps were completed, the Global Field Power (GFP) was calculated for the EEG frequency band of interest for computing the mental states on which the present study focused. Therefore, the EEG GFP features were computed within the Theta, Alpha, and Beta frequency bands. It has to be underlined that the GFP was chosen as the parameter of interest describing brain EEG activity since it has the advantage of representing, within the time domain, the degree of synchronization on a specific cortical region of interest in a specific frequency band [28], [29]. In terms of technical implementation, the GFP was mathematically computed according to the approach described by Vecchiato and colleagues [30]. Concerning the EEG GFP features computation, the frequency bands were defined according to the Individual Alpha Frequency (IAF) value [31] computed for each participant. In order to compute the IAF, a 60-seconds-long experimental condition was collected while the participants kept their eyes closed, since the Alpha peak is consistently prominent in such a condition. Subsequently, the EEG GFP was computed over all the EEG channels for each 1-second-long epoch through a Hanning window of the same length (1 s, which means 1 Hz of frequency resolution according to the time resolution required from the presented approach) as follows:
where N is the number of the considered EEG channels and is the i-th EEG channel filtered within the selected EEG frequency band. After the EEG data preprocessing, the EEG GFP-derived features were computed according to the research objectives. More specifically, the mental workload, attention, and cognitive engagement were computed according to the following:
where and were computed by considering the AFz, AF3, AF4, AF7, and AF8 EEG channels, while the , were computed by considering the Pz, P3, and P4 EEG channels. In this context, the mental workload index calculation was based on prior research using EEG to assess mental workload [5,32,33,34]. The Attention index was defined as the inverse of the Theta-Beta Ratio, an established EEG marker of attentional deficits in Attention Deficit Hyperactivity Disorder (ADHD) [35,36] and a validated measure of distributed attention during concurrent task performance [37,38]. The Engagement index was defined according to prior scientific works which validated the cognitive aspect of engagement in similar learning context [39]. Subsequently, the above-described neurophysiological metrics were z-score normalized according to the eyes open-condition, considered as baseline. Then, the mental workload and attention metrics were furtherly combined to compute the Human Distraction index (HDI), based on the assumption that a high workload does not necessarily imply task engagement, since mental resources can also be devoted to activities not related to the task being performed (i.e. mind wandering [40,41,42]. Such an index was already successfully proposed by Ronca and colleagues [43] in a highly realistic simulated driving context. Such an index was defined according to the following:
2.3.2. Photoplethysmography (PPG)
Photoplethysmography (PPG) signals, crucial for evaluating volumetric variations in blood content within biological tissues, were collected using the advanced Shimmer3 GSR+ apparatus (Shimmer Sensing, Dublin, Ireland). This instrument was securely positioned on the wrist of the participant's non-dominant hand, ensuring stable and precise signal capture at a sampling rate of 64 Hz. The untarnished PPG datasets underwent a digital filtration process using a 5th-order Butterworth band-pass filter, specifically spanning a frequency range of 1–5 Hz. This filtering protocol was carefully designed to effectively exclude the underlying continuous components and mitigate the influence of any gradual signal drift, whilst accentuating the characteristic pulsatile oscillations inherent in the PPG signal, which are indicative of cardiac activity. To further delve into the detailed cardiac rhythms, the distinguished Pan–Tompkins’s algorithm [44] QRS Detection was deployed. This algorithm is adept at discerning pulse-associated peaks, which subsequently facilitated the computation of the Inter-Beat Intervals (IBI signal). The resultant IBI datasets, however, occasionally contained aberrations or artefacts. To address this, the comprehensive HRVAS Matlab suite [45] was harnessed to refine and enhance the data quality. Subsequently, these purified IBI signals were algorithmically processed to deduce the Heart Rate (HR), typically represented in the metric "Beats per minute". To ensure individual specificity and normalization, the derived HR metrics for each participant were systematically adjusted by deducting their personalized baseline HR mean and then normalizing the outcome using their unique HR standard deviation.
2.3.3. Electrodermal Activity (EDA)
Electrodermal activity (EDA) signals, indicative of fluctuations in the skin's electrical conductance as a consequence of modulations in sweat gland activity, were acquired employing the advanced Shimmer3 GSR+ unit (Shimmer Sensing, Dublin, Ireland), the same cutting-edge apparatus mentioned previously. This device was positioned on the wrist of the participant's non-dominant hand to guarantee optimal data fidelity, with EDA signals being recorded at a detailed sampling rate of 64 Hz. The raw EDA signals underwent a series of computational refinements. Initially, the signals were passed through a low-pass filter with a discriminative cut-off frequency set at 1 Hz, serving to emphasize the desired frequency components and attenuate unwanted high-frequency noise. Post this filtration step, an advanced artefact correction tool within the Matlab framework was wisely employed to repair and eliminate any evident signal anomalies, such as sudden discontinuities and unwarranted spikes. To further refine and process these signals, the Ledalab suite [R] was deployed, a specialized open-source software toolbox seamlessly integrated within the Matlab (MathWorks Inc., Natick, MA, USA) ecosystem, tailored specifically for advanced EDA signal analysis. Employing the principles of continuous decomposition analysis [46], the suite enabled the separation of the EDA signal into its constituent tonic (SCL) and phasic (SCR) components. The SCL, or Skin Conductance Level, represents the gradual and sustained modulations in the EDA signal and predominantly encapsulates the overarching arousal state of the participant. Conversely, the SCR, or Skin Conductance Response, mirrors the transient and rapid fluctuations in the EDA and is conventionally attributed to discrete stimulus-driven physiological reactions. However, given the inherent limitations stemming from the involved devices' relatively low sampling frequency, this study had to prudently prioritize and focus on the more steady-state SCL component for its analytical rigor. As a final step in the data normalization process, the extracted SCL values for each individual were systematically adjusted to a standard scale. This was achieved by deducting the participant-specific baseline SCL, followed by normalization using the unique SCL standard deviation pertinent to each participant.
2.4. Subjective and Behavioral Data Collection
Following each experimental condition, participants completed a five-question quiz designed to assess comprehension and retention of the material presented. Crucially, the quiz questions were specific to the content of each individual modality, preventing potential learning transfer effects across conditions. Practically speaking, even if all the three contents were related to the same topic, the quiz was designed in order to be related to information contained only in that specific content. In addition to the comprehension quiz, participants answered five questions evaluating their subjective learning experience, adapted from previously validated questionnaires [47,48]. More specifically, these inquiries solicited participants to assign a rating, on a numerical continuum from 1 to 10, reflecting their subjective experiences concerning:
- The simplicity with which they could comprehend the disseminated information.
- The facility with which they could internalize the content.
- The capacity to sustain attention during the entirety of the task.
- The degree of interest elicited by the employed narrative modality.
- The extent of engagement is provoked by the narrative approach.
In the evaluation process, careful attention was taken to ensure procedural consistency; every participant was presented with an identical set of questions, which bolstered the uniformity and comparability of the assessment metrics.
3. Results
This section was divided into different subparagraphs in order to organize all the results on the basis of the related data source, i.e., questionnaires (subjective results), learning performance (behavioral results), and neurophysiological ones.
Among all the comparisons, only the analysis providing statistically significant results are here reported.
3.1. Neurophysiological Results
The statistical analysis performed on the autonomic-derived parameters, i.e., SCL and SCR computed from the EDA and the PPG-derived features, did not reveal any statistical effect between the tested experimental conditions.
Concerning the EEG-based parameters, ANOVA showed a statistically significant main effect of the experimental conditions in terms of HDI and Engagement index (HDI: F = 6.560, p = 0.007; ω2 = 0.204; Engagement index: F = 19.641, p < 0.001; ω2 = 0.357) (Figure 2 and Figure 3). More specifically, the post-hoc analysis showed that during the Educational video condition, participants exhibited the lowest HDI (p < 0.01), and the highest Engagement index (p < 0.006). Any statistically significant differences were observed between the Academic video and Text reading conditions in terms of HDI and Engagement index (all p > 0.10).
3.2. Correlation Analysis
Finally, a conclusive statistical analysis was performed to assess the correlation between the neurophysiological measurements related to the impact of the different learning material and their respective subjective scores provided by the participants along the experimental conditions. More specifically, the repeated measure correlation analysis [49] was performed between the EEG-based Engagement index and its respective subjective score (i.e., EP). As shown in Figure 4, the analysis revealed a strong and significant correlation between these two measurements (R = 0.621; p = 0.002), indicating that the measured cognitive impact of the different learning materials in terms of engagement was temporally coherent with the subjective perceptions of the participants.
3.3. Subjective Reuslts
The subjective data collected along the experimental protocol were combined in order to obtain two subjective scores. The first one is associated with the required cognitive resources perception (CRP), computed by averaging the subjective scores related to the first three dimensions of the above-described questionnaire (i.e., the higher the better, since high scores were associated with easy task perceptions). The second one is associated with the subjective engagement perception (EP) (i.e., the higher the better, since high scores were associated with engaging task perceptions), obtained by averaging the latter two dimensions of the above-described questionnaire.
The statistical analysis revealed a significant main effect of the experimental condition associated with the subjective CRP and EP scores (CRP: Friedman chi-squared = 10.474, p = 0.001, η2 = 0.335; EP: Friedman chi-squared = 15.436, p < 0.001, η2 = 0.459). More specifically, the post-hoc analysis showed that the Text reading condition was perceived as more requiring in terms of cognitive resources and less engaging (all p < 0.01). Additionally, the post-hoc analysis showed that the Educational video condition resulted statistically more engaging (p < 0.001) compared to the Text reading one (Figure 5).
3.4. Behavioral Results
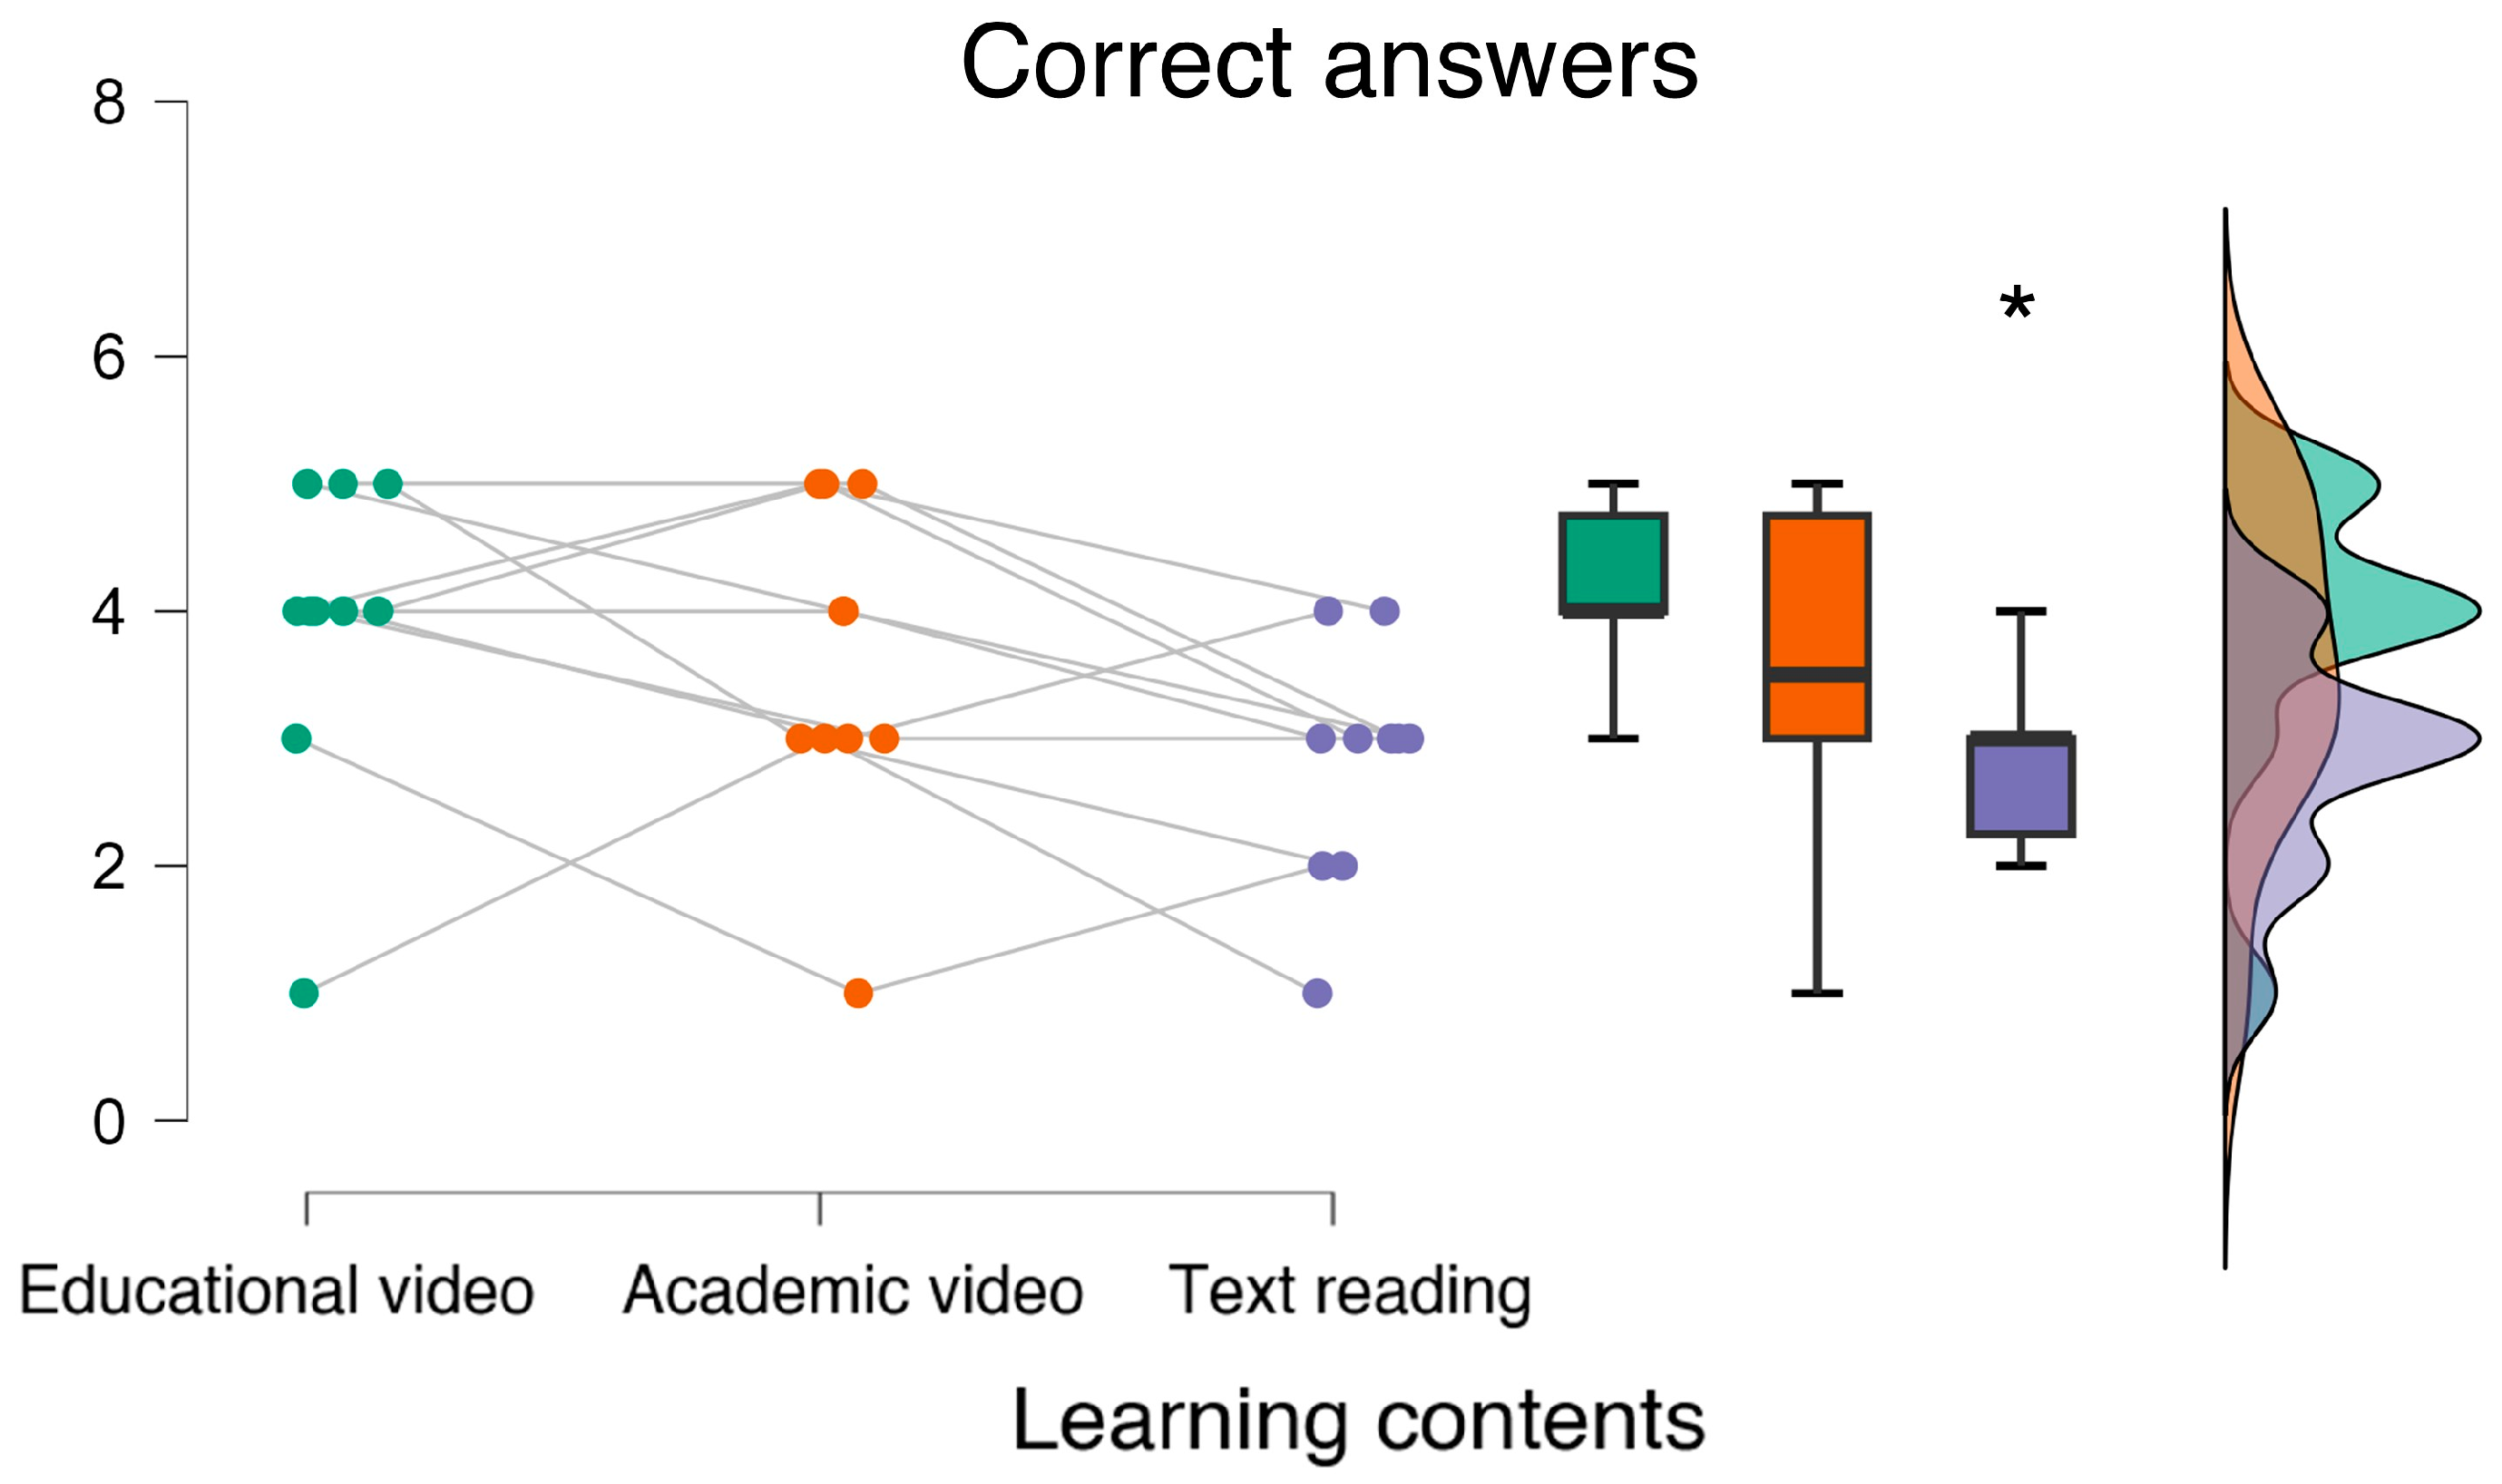
The non-parametric repeated measure analysis performed on the behavioral data, i.e., the correct answers recorded for each experimental condition, revealed that participants committed the highest error rate during the Text reading condition (Friedman chi-squared = 6.178, p = 0.032, η2 = 0.116; post-hoc: p = 0.02) (Figure 6).
4. Discussion
This study aimed to neurophysiologically characterize the impact of different learning materials by employing a multimodal approach that integrated EEG, EDA, and PPG recordings, in parallel with subjective measurements. The results demonstrated that different educational contents elicit distinct neurophysiological responses, highlighting how cognitive load, engagement, and attentional mechanisms vary depending on the format of the learning content.
The findings indicate that video-based learning materials, particularly Educational video enriched with visual elements and structured narration, were associated with higher engagement levels, as evidenced by EEG-derived metrics. This is consistent with previous literature suggesting that dynamic and multimodal learning experiences enhance cognitive processing and memory retention. Conversely, the text-based learning condition (i.e., Text reading) elicited higher cognitive distraction and a lower engagement index, as reflected in EEG-derived parameters. This aligns with prior research showing that passive reading demands sustained attention and greater cognitive effort, potentially leading to increased mental fatigue. The strong correlation between subjective engagement scores and neurophysiological engagement indices further validates the robustness of the proposed multimodal framework. This consistency between self-reported experiences and objective measures highlights the potential of neurophysiological monitoring as a reliable tool for assessing learning effectiveness in real-world educational settings.
However, some limitations must be acknowledged. The study involved a relatively small sample size, limiting the generalizability of the results. Additionally, the experimental design focused on a single topic, which may not fully capture the variability of different subject matters. Future research should expand the dataset, include a broader range of learning materials, and explore individual differences in cognitive responses.
Despite these limitations, this study represents a step forward in understanding how learning materials shape cognitive and emotional engagement, paving the way for more personalized and effective digital learning experiences.
5. Conclusions
This study investigated the impact of different learning materials on specific cognitive processes by employing a multimodal approach that integrated EEG, EDA, and PPG recordings with subjective measurements. The findings demonstrated that different educational modalities elicit distinct neurophysiological responses, providing objective insights into how cognitive load, attentional mechanisms, and engagement vary depending on the format of the learning content.
The results underscore the potential of neurophysiological measures to optimize learning experiences by providing real-time, objective assessments of cognitive processes specifically related to learning. More importantly, the proposed multimodal approach relies on wearable equipment for collecting neurophysiological signals, coupled with signal processing methods fully compatible with real-world applications [4,50,51,52,53].
5.1. Future trends
The effectiveness of the proposed neurophysiological framework in distinguishing between different learning conditions highlights its potential applicability in adaptive learning environments. By integrating real-time neurophysiological feedback, future e-learning systems could dynamically adjust content delivery to optimize learning efficiency and reduce cognitive overload.
Future e-learning platforms could leverage this approach to dynamically adjust instructional materials based on individual cognitive responses, enhancing learning efficiency and reducing distractive behaviors [54], [55,56,57]. In conclusion, this research represents a preliminary, but significant step forward in understanding how different learning materials impact cognitive and engagement, paving the way for more adaptive and personalized educational experiences.
Author Contributions
Conceptualization, G.D.F., V.R., and L.T.; methodology, V.R., P.A., G.D.F.; software, V.R., P.A., G.D.F.; validation, V.R., L.T., G.D.F.; formal analysis, V.R. and L.T.; investigation, V.R., L.T., G.D.F.; resources, P.A., V.R., G.D.F.; data curation, V.R.; writing—original draft preparation, V.R..; writing—review and editing, V.R., P.A., G.D.F.; visualization, V.R..; supervision, P.A., G.D.F.; project administration, G.D.F.; funding acquisition, V.R., P.A., G.D.F. All authors have read and agreed to the published version of the manuscript.
Funding
This work was co-funded by the HORIZON 2.5 project “CODA: COntroller adaptive Digital Assistant” (GA n. 101114765), SESAR 3 Joint Undertaking project “TRUSTY: TRUStworthy inTellingent sYstem for remote digital tower” (GA n. 101114838), the ERASMUS+ Programme of the EU “WE-COLLAB” project under the Agreement 2021-1-HR01-KA220-HED-000027562, and “SOULSS” (KA2, 2022-1-IT02-KA220-HED-000090206).
Institutional Review Board Statement
The study was conducted in accordance with the Declaration of Helsinki, and approved by the Institutional Review Board (or Ethics Committee) of Sapienza University of Rome (protocol code 2024/03-002 and 21/03/2024).
Informed Consent Statement
Informed consent was obtained from all subjects involved in the study.
Data Availability Statement
The data that support the findings of this study are available from the corresponding authors upon reasonable request. The data are not publicly available since they are biometric data and they are considered as sensitive data as of EU GDPR n. 2016/679.
Conflicts of Interest
The authors declare no conflicts of interest.
References
- C. M. Michel, M. M. Murray, G. Lantz, S. Gonzalez, L. Spinelli, and R. Grave De Peralta, “EEG source imaging,” Clinical Neurophysiology, vol. 115, no. 10, pp. 2195–2222, Oct. 2004. [CrossRef]
- J. Protzak and K. Gramann, “Investigating established EEG parameter during real-world driving,” Front Psychol, vol. 9, no. NOV, p. 412837, Nov. 2018. [CrossRef]
- “EEG correlates of task engagement and mental workload in vigilance, learning, and memory tasks - PubMed.” Accessed: Mar. 03, 2025. [Online]. Available: https://pubmed.ncbi.nlm.nih.gov/17547324/.
- G. Di Flumeri et al., “EEG-Based Index for Timely Detecting User’s Drowsiness Occurrence in Automotive Applications,” Front Hum Neurosci, vol. 16, May 2022. [CrossRef]
- G. Di Flumeri et al., “EEG-based mental workload neurometric to evaluate the impact of different traffic and road conditions in real driving settings,” Front Hum Neurosci, vol. 12, Dec. 2018. [CrossRef]
- Y. Wang and T. P. Jung, “A collaborative brain-computer interface for improving human performance,” PLoS One, vol. 6, no. 5, 2011. [CrossRef]
- Y. Zhu, Q. Wang, and L. Zhang, “Study of EEG characteristics while solving scientific problems with different mental effort,” Sci Rep, vol. 11, no. 1, Dec. 2021. [CrossRef]
- Y. Yu, Y. Oh, J. Kounios, and M. Beeman, “Dynamics of hidden brain states when people solve verbal puzzles,” Neuroimage, vol. 255, Jul. 2022. [CrossRef]
- K. Kim, N. T. Duc, M. Choi, and B. Lee, “EEG microstate features according to performance on a mental arithmetic task,” Sci Rep, vol. 11, no. 1, Dec. 2021. [CrossRef]
- T. L. Varao-Sousa and A. Kingstone, “Memory for Lectures: How Lecture Format Impacts the Learning Experience,” PLoS One, vol. 10, no. 11, p. e0141587, Nov. 2015. [CrossRef]
- J. D. Wammes, P. O. Boucher, P. Seli, J. A. Cheyne, and D. Smilek, “Mind wandering during lectures I: Changes in rates across an entire semester.,” Scholarsh Teach Learn Psychol, vol. 2, no. 1, pp. 13–32, Mar. 2016. [CrossRef]
- D. A. Munoz and C. S. Tucker, “Assessing Students’ Emotional States: An Approach to Identify Lectures That Provide an Enhanced Learning Experience,” Proceedings of the ASME Design Engineering Technical Conference, vol. 3, Jan. 2015. [CrossRef]
- M. Mazher, A. Abd Aziz, A. S. Malik, and H. Ullah Amin, “An EEG-Based Cognitive Load Assessment in Multimedia Learning Using Feature Extraction and Partial Directed Coherence,” IEEE Access, vol. 5, pp. 14819–14829, Jul. 2017. [CrossRef]
- C. M. Chen and Y. C. Sun, “Assessing the effects of different multimedia materials on emotions and learning performance for visual and verbal style learners,” Comput Educ, vol. 59, no. 4, pp. 1273–1285, Dec. 2012. [CrossRef]
- G. Di Flumeri et al., “A Neuroergonomic Approach Fostered by Wearable EEG for the Multimodal Assessment of Drivers Trainees,” Sensors 2023, Vol. 23, Page 8389, vol. 23, no. 20, p. 8389, Oct. 2023. [CrossRef]
- D. Mutlu-Bayraktar, P. Ozel, F. Altindis, and B. Yilmaz, “Split-attention effects in multimedia learning environments: eye-tracking and EEG analysis,” Multimed Tools Appl, vol. 81, no. 6, pp. 8259–8282, Mar. 2022. [CrossRef]
- C. M. Chen and Y. C. Sun, “Assessing the effects of different multimedia materials on emotions and learning performance for visual and verbal style learners,” Comput Educ, vol. 59, no. 4, pp. 1273–1285, Dec. 2012. [CrossRef]
- A. Babiker, I. Faye, W. Mumtaz, A. S. Malik, and H. Sato, “EEG in classroom: EMD features to detect situational interest of students during learning,” Multimed Tools Appl, vol. 78, no. 12, pp. 16261–16281, Jun. 2019. [CrossRef]
- F. Bashir, A. Ali, T. A. Soomro, M. Marouf, M. Bilal, and B. S. Chowdhry, “Electroencephalogram (EEG) Signals for Modern Educational Research,” Innovative Education Technologies for 21st Century Teaching and Learning, pp. 149–171, Jan. 2021. [CrossRef]
- I. Simonetti et al., “Neurophysiological Evaluation of Students’ Experience during Remote and Face-to-Face Lessons: A Case Study at Driving School,” Brain Sci, vol. 13, no. 1, Jan. 2023. [CrossRef]
- N. Zhang, C. Liu, J. Li, K. Hou, J. Shi, and W. Gao, “A comprehensive review of research on indoor cognitive performance using electroencephalogram technology,” Build Environ, vol. 257, p. 111555, Jun. 2024. [CrossRef]
- R. Yuvaraj et al., “A Machine Learning Framework for Classroom EEG Recording Classification: Unveiling Learning-Style Patterns,” Algorithms 2024, Vol. 17, Page 503, vol. 17, no. 11, p. 503, Nov. 2024. [CrossRef]
- J. Cuevas, “Is learning styles-based instruction effective? A comprehensive analysis of recent research on learning styles,” http://dx.doi.org/10.1177/1477878515606621, vol. 13, no. 3, pp. 308–333, Oct. 2015. [CrossRef]
- A. Kumar et al., “Blended Learning Tools and Practices: A Comprehensive Analysis,” IEEE Access, vol. 9, pp. 85151–85197, 2021. [CrossRef]
- N. Sciaraffa et al., “Evaluation of a New Lightweight EEG Technology for Translational Applications of Passive Brain-Computer Interfaces,” Front Hum Neurosci, vol. 16, p. 458, Jul. 2022. [CrossRef]
- Vincenzo Ronca et al., “o-CLEAN: a novel multi-stage algorithm for the ocular artifacts’ correction from EEG data in out-of-the-lab applications,” J Neural Eng, 2024.
- A. Delorme and S. Makeig, “EEGLAB: an open source toolbox for analysis of single-trial EEG dynamics including independent component analysis,” J Neurosci Methods, vol. 134, no. 1, pp. 9–21, Mar. 2004. [CrossRef]
- W. Klimesch, “EEG alpha and theta oscillations reflect cognitive and memory performance: a review and analysis,” Brain Res Rev, vol. 29, no. 2–3, pp. 169–195, Apr. 1999. [CrossRef]
- P. Sauseng, W. Klimesch, M. Schabus, and M. Doppelmayr, “Fronto-parietal EEG coherence in theta and upper alpha reflect central executive functions of working memory,” Int J Psychophysiol, vol. 57, no. 2, pp. 97–103, Aug. 2005. [CrossRef]
- G. Vecchiato et al., “Enhance of theta EEG spectral activity related to the memorization of commercial advertisings in Chinese and Italian subjects,” Proceedings - 2011 4th International Conference on Biomedical Engineering and Informatics, BMEI 2011, vol. 3, pp. 1491–1494, 2011. [CrossRef]
- W. Klimesch, “Alpha-band oscillations, attention, and controlled access to stored information,” Trends Cogn Sci, vol. 16, no. 12, p. 606, Dec. 2012. [CrossRef]
- F. Babiloni, “Mental Workload Monitoring: New Perspectives from Neuroscience,” in Communications in Computer and Information Science, Springer, Nov. 2019, pp. 3–19. [CrossRef]
- G. Borghini, V. Ronca, A. Vozzi, P. Aricò, G. Di Flumeri, and F. Babiloni, “Monitoring performance of professional and occupational operators,” in Handbook of Clinical Neurology, vol. 168, Elsevier B.V., 2020, pp. 199–205. [CrossRef]
- M. S. Young, K. A. Brookhuis, C. D. Wickens, and P. A. Hancock, “State of science: mental workload in ergonomics,” Ergonomics, vol. 58, no. 1, pp. 1–17, Jan. 2015. [CrossRef]
- M. Arns, C. K. Conners, and H. C. Kraemer, “A Decade of EEG Theta/Beta Ratio Research in ADHD: A Meta-Analysis,” J Atten Disord, vol. 17, no. 5, pp. 374–383, Jul. 2013. [CrossRef]
- H. Heinrich, K. Busch, P. Studer, K. Erbe, G. H. Moll, and O. Kratz, “EEG spectral analysis of attention in ADHD: Implications for neurofeedback training?,” Front Hum Neurosci, vol. 8, no. AUG, p. 99913, Aug. 2014. [CrossRef]
- X. Ma, S. Qiu, and H. He, “Time-Distributed Attention Network for EEG-Based Motor Imagery Decoding from the Same Limb,” IEEE Transactions on Neural Systems and Rehabilitation Engineering, vol. 30, pp. 496–508, 2022. [CrossRef]
- A. Morillas-Romero, M. Tortella-Feliu, X. Bornas, and P. Putman, “Spontaneous EEG theta/beta ratio and delta–beta coupling in relation to attentional network functioning and self-reported attentional control,” Cogn Affect Behav Neurosci, vol. 15, no. 3, pp. 598–606, Sep. 2015. [CrossRef]
- A. Apicella, P. Arpaia, M. Frosolone, G. Improta, N. Moccaldi, and A. Pollastro, “EEG-based measurement system for monitoring student engagement in learning 4.0,” Sci Rep, vol. 12, no. 1, Dec. 2022. [CrossRef]
- G. Di Flumeri et al., “Brain–Computer Interface-Based Adaptive Automation to Prevent Out-Of-The-Loop Phenomenon in Air Traffic Controllers Dealing With Highly Automated Systems,” Front Hum Neurosci, vol. 13, Sep. 2019. [CrossRef]
- Y. Zhang and T. Kumada, “Relationship between workload and mind-wandering in simulated driving,” PLoS One, vol. 12, no. 5, pp. e0176962-, May 2017, [Online]. [CrossRef]
- Smallwood, “Mind wandering and attention.,” in The handbook of attention., Cambridge, MA, US: Boston Review, 2015, pp. 233–255.
- V. Ronca et al., “A Novel EEG-Based Assessment of Distraction in Simulated Driving under Different Road and Traffic Conditions,” Brain Sciences 2024, Vol. 14, Page 193, vol. 14, no. 3, p. 193, Feb. 2024. [CrossRef]
- J. Pan and W. J. Tompkins, “A Real-Time QRS Detection Algorithm,” IEEE Trans Biomed Eng, vol. BME-32, no. 3, pp. 230–236, Mar. 1985. [CrossRef]
- J. Ramshur, “Design, Evaluation, and Application of Heart Rate Variability Analysis Software (HRVAS),” Electronic Theses and Dissertations, Jul. 2010, Accessed: Mar. 03, 2025. [Online]. Available: https://digitalcommons.memphis.edu/etd/83.
- J. Cohen, “Statistical Power Analysis for the Behavioral Sciences,” Statistical Power Analysis for the Behavioral Sciences, May 2013. [CrossRef]
- S. E. Kassab, A. El-Baz, N. Hassan, H. Hamdy, S. Mamede, and H. G. Schmidt, “Construct validity of a questionnaire for measuring student engagement in problem-based learning tutorials,” BMC Med Educ, vol. 23, no. 1, pp. 1–7, Dec. 2023. [CrossRef]
- P. Griffin, H. Coates, C. McInnis, and R. James, “The Development of an Extended Course Experience Questionnaire,” Quality in Higher Education, vol. 9, no. 3, pp. 259–266, 2003. [CrossRef]
- J. Z. Bakdash and L. R. Marusich, “Repeated measures correlation,” Front Psychol, vol. 8, no. MAR, p. 456, 2017. [CrossRef]
- V. Ronca et al., “Validation of an EEG-based Neurometric for online monitoring and detection of mental drowsiness while driving,” Annu Int Conf IEEE Eng Med Biol Soc, vol. 2022, pp. 3714–3717, Jul. 2022. [CrossRef]
- V. Ronca et al., “Wearable Technologies for Electrodermal and Cardiac Activity Measurements: A Comparison between Fitbit Sense, Empatica E4 and Shimmer GSR3+,” Sensors 2023, Vol. 23, Page 5847, vol. 23, no. 13, p. 5847, Jun. 2023. [CrossRef]
- D. Zhao et al., “Cooperation objective evaluation in aviation: validation and comparison of two novel approaches in simulated environment,” Front Neuroinform, vol. 18, p. 1409322, Sep. 2024. [CrossRef]
- V. Ronca et al., “Neurophysiological Assessment of An Innovative Maritime Safety System in Terms of Ship Operators’ Mental Workload, Stress, and Attention in the Full Mission Bridge Simulator,” Brain Sciences 2023, Vol. 13, Page 1319, vol. 13, no. 9, p. 1319, Sep. 2023. [CrossRef]
- S. Khanal and S. R. Pokhrel, “Analysis, Modeling and Design of Personalized Digital Learning Environment,” May 2024, Accessed: Mar. 03, 2025. [Online]. Available: https://arxiv.org/abs/2405.10476v1.
- R. Van Schoors, J. Elen, A. Raes, S. Vanbecelaere, and F. Depaepe, “The Charm or Chasm of Digital Personalized Learning in Education: Teachers’ Reported Use, Perceptions and Expectations,” TechTrends, vol. 67, no. 2, pp. 315–330, Mar. 2023. [CrossRef]
- “Technologies and Tools for Creating Adaptive E-Learning Content,” Математика и инфoрматика, vol. 63, no. 4, pp. 382–390, 2020.
- U. C. Apoki, H. K. M. Al-Chalabi, and G. C. Crisan, “From Digital Learning Resources to Adaptive Learning Objects: An Overview,” Communications in Computer and Information Science, vol. 1126 CCIS, pp. 18–32, 2020. [CrossRef]
Figure 1.
Experimental settings. The participant sat in front of the PC to provide learning materials and wearing the EEG, PPG, and EDA signals collection equipment.
Figure 1.
Experimental settings. The participant sat in front of the PC to provide learning materials and wearing the EEG, PPG, and EDA signals collection equipment.
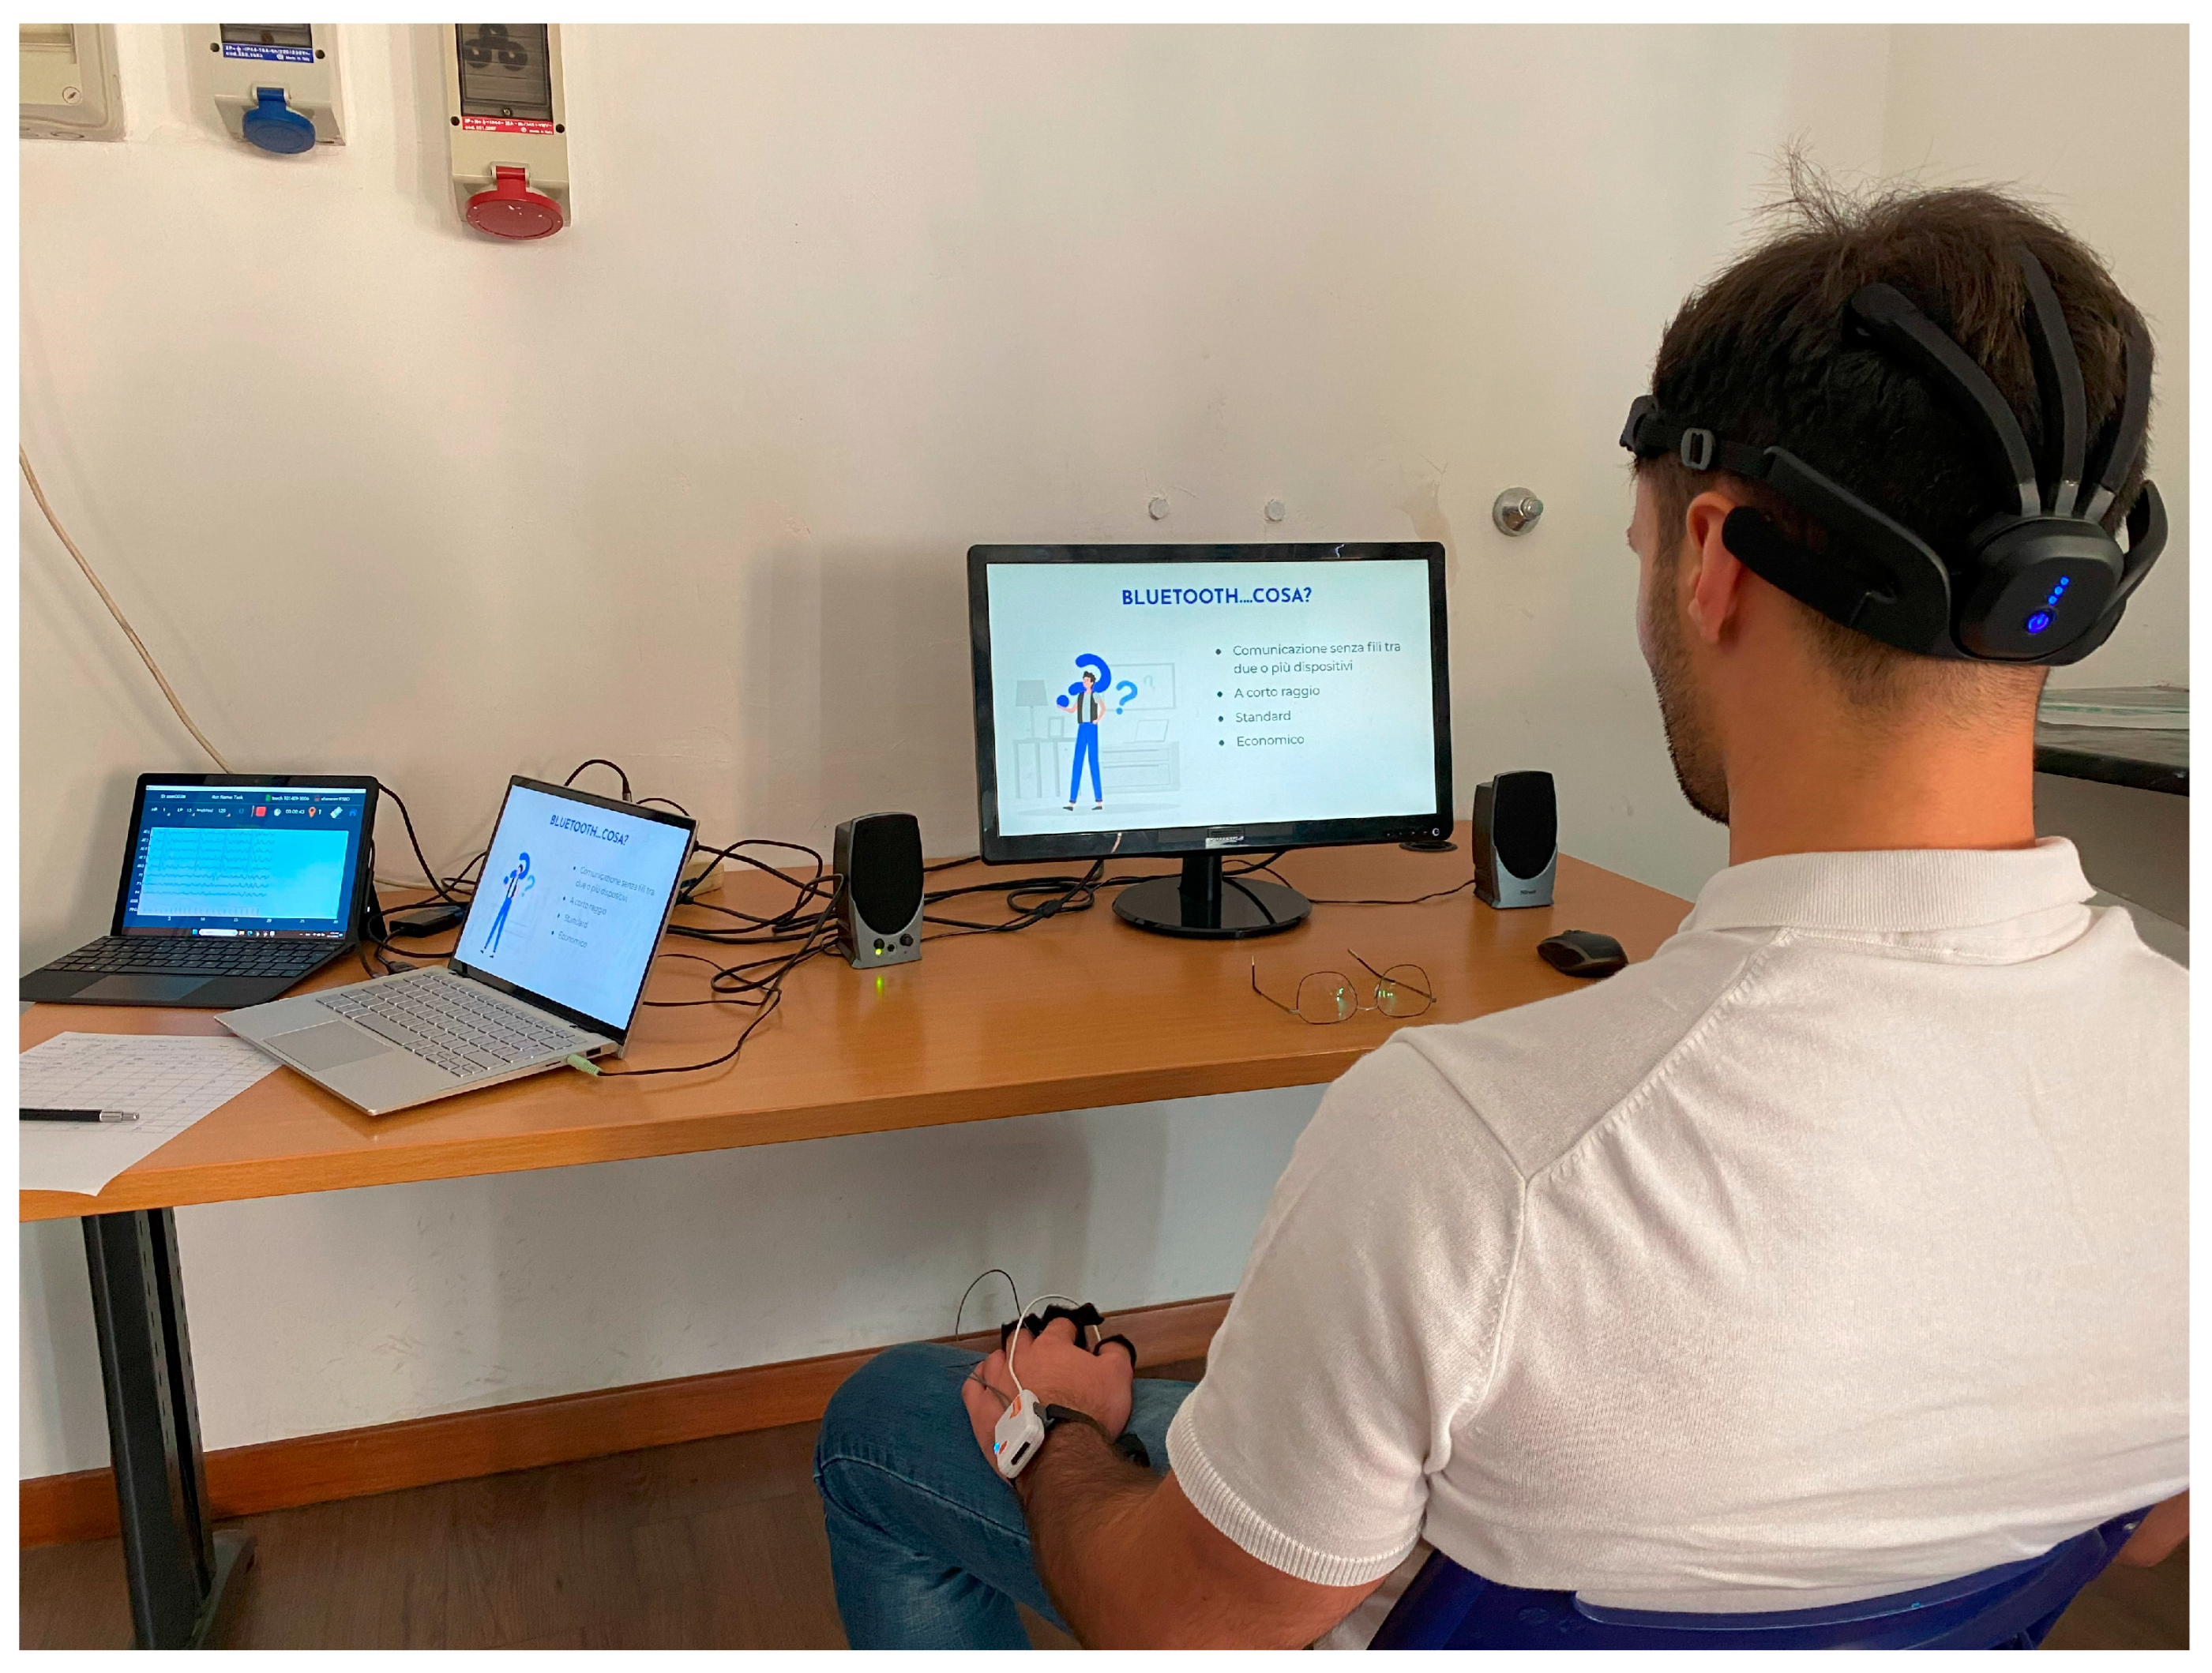
Figure 2.
The ANOVA performed on the Human Distraction Index (i.e., HDI) revealed that the neurophysiological distraction evaluation was statistically lower when accessing the Educational video material.
Figure 2.
The ANOVA performed on the Human Distraction Index (i.e., HDI) revealed that the neurophysiological distraction evaluation was statistically lower when accessing the Educational video material.
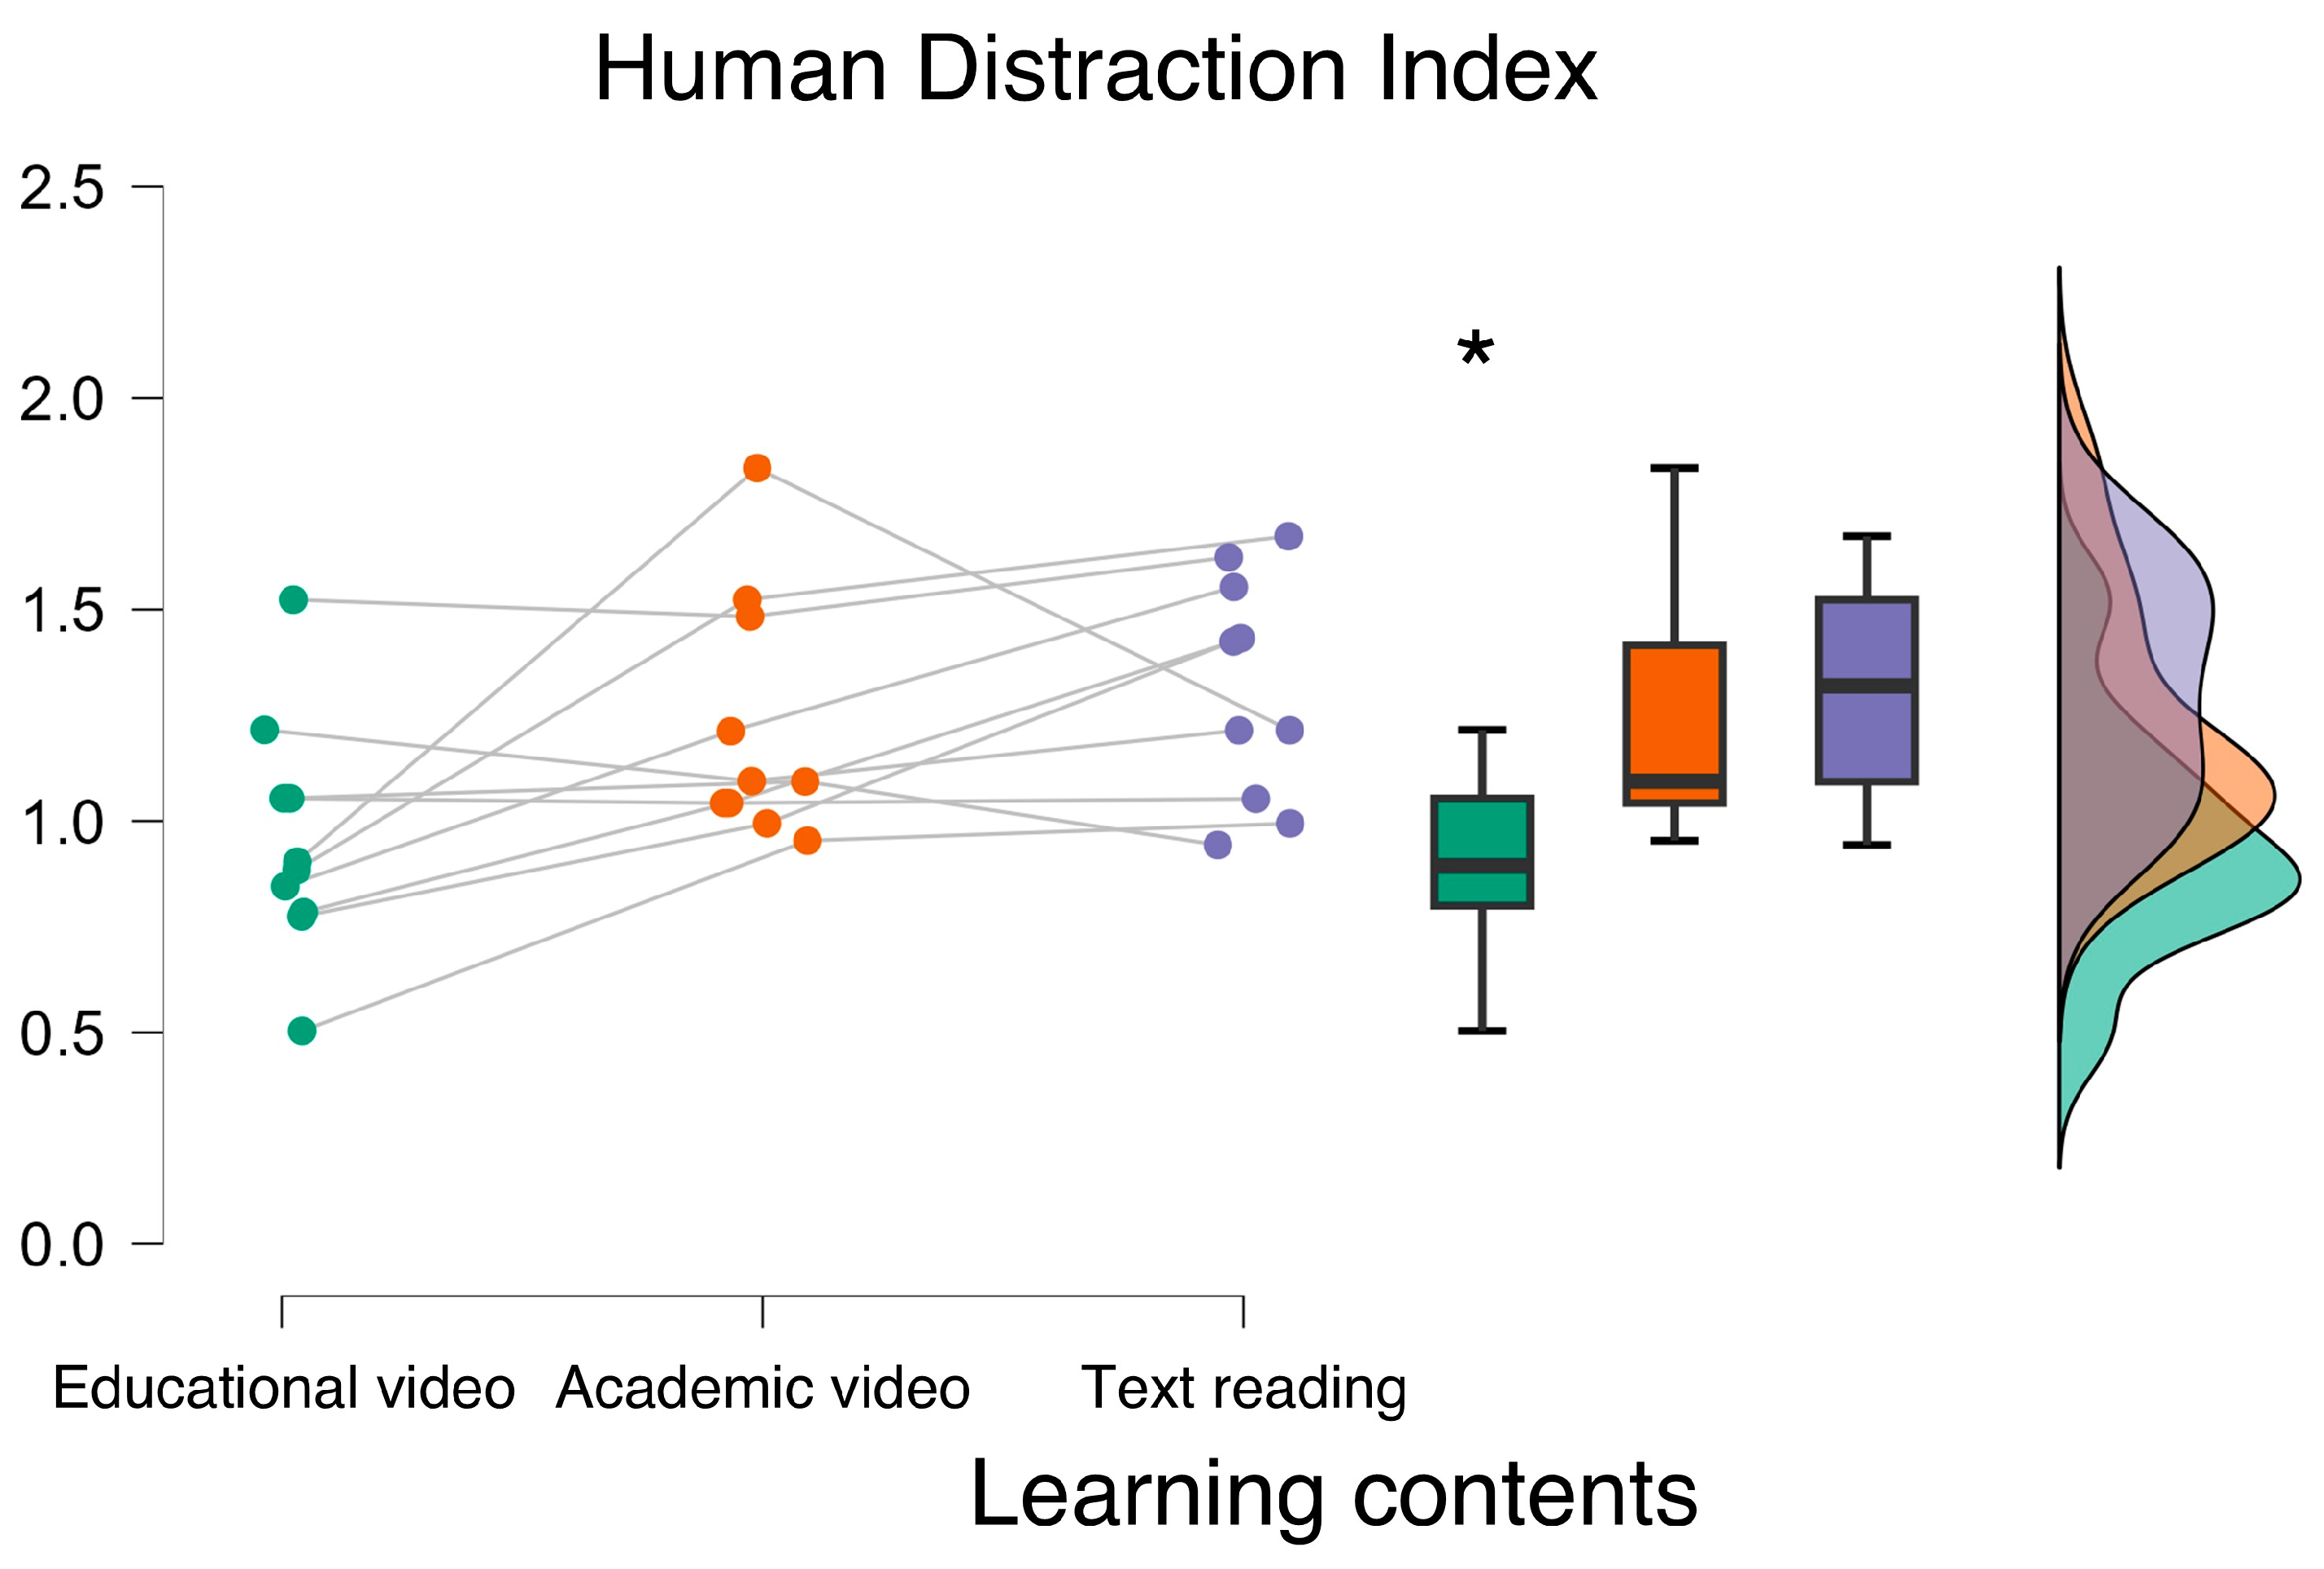
Figure 3.
The ANOVA performed on the EEG-based engagement index revealed that participants were neurophysiologically more engaged when accessed to the Educational video material.
Figure 3.
The ANOVA performed on the EEG-based engagement index revealed that participants were neurophysiologically more engaged when accessed to the Educational video material.
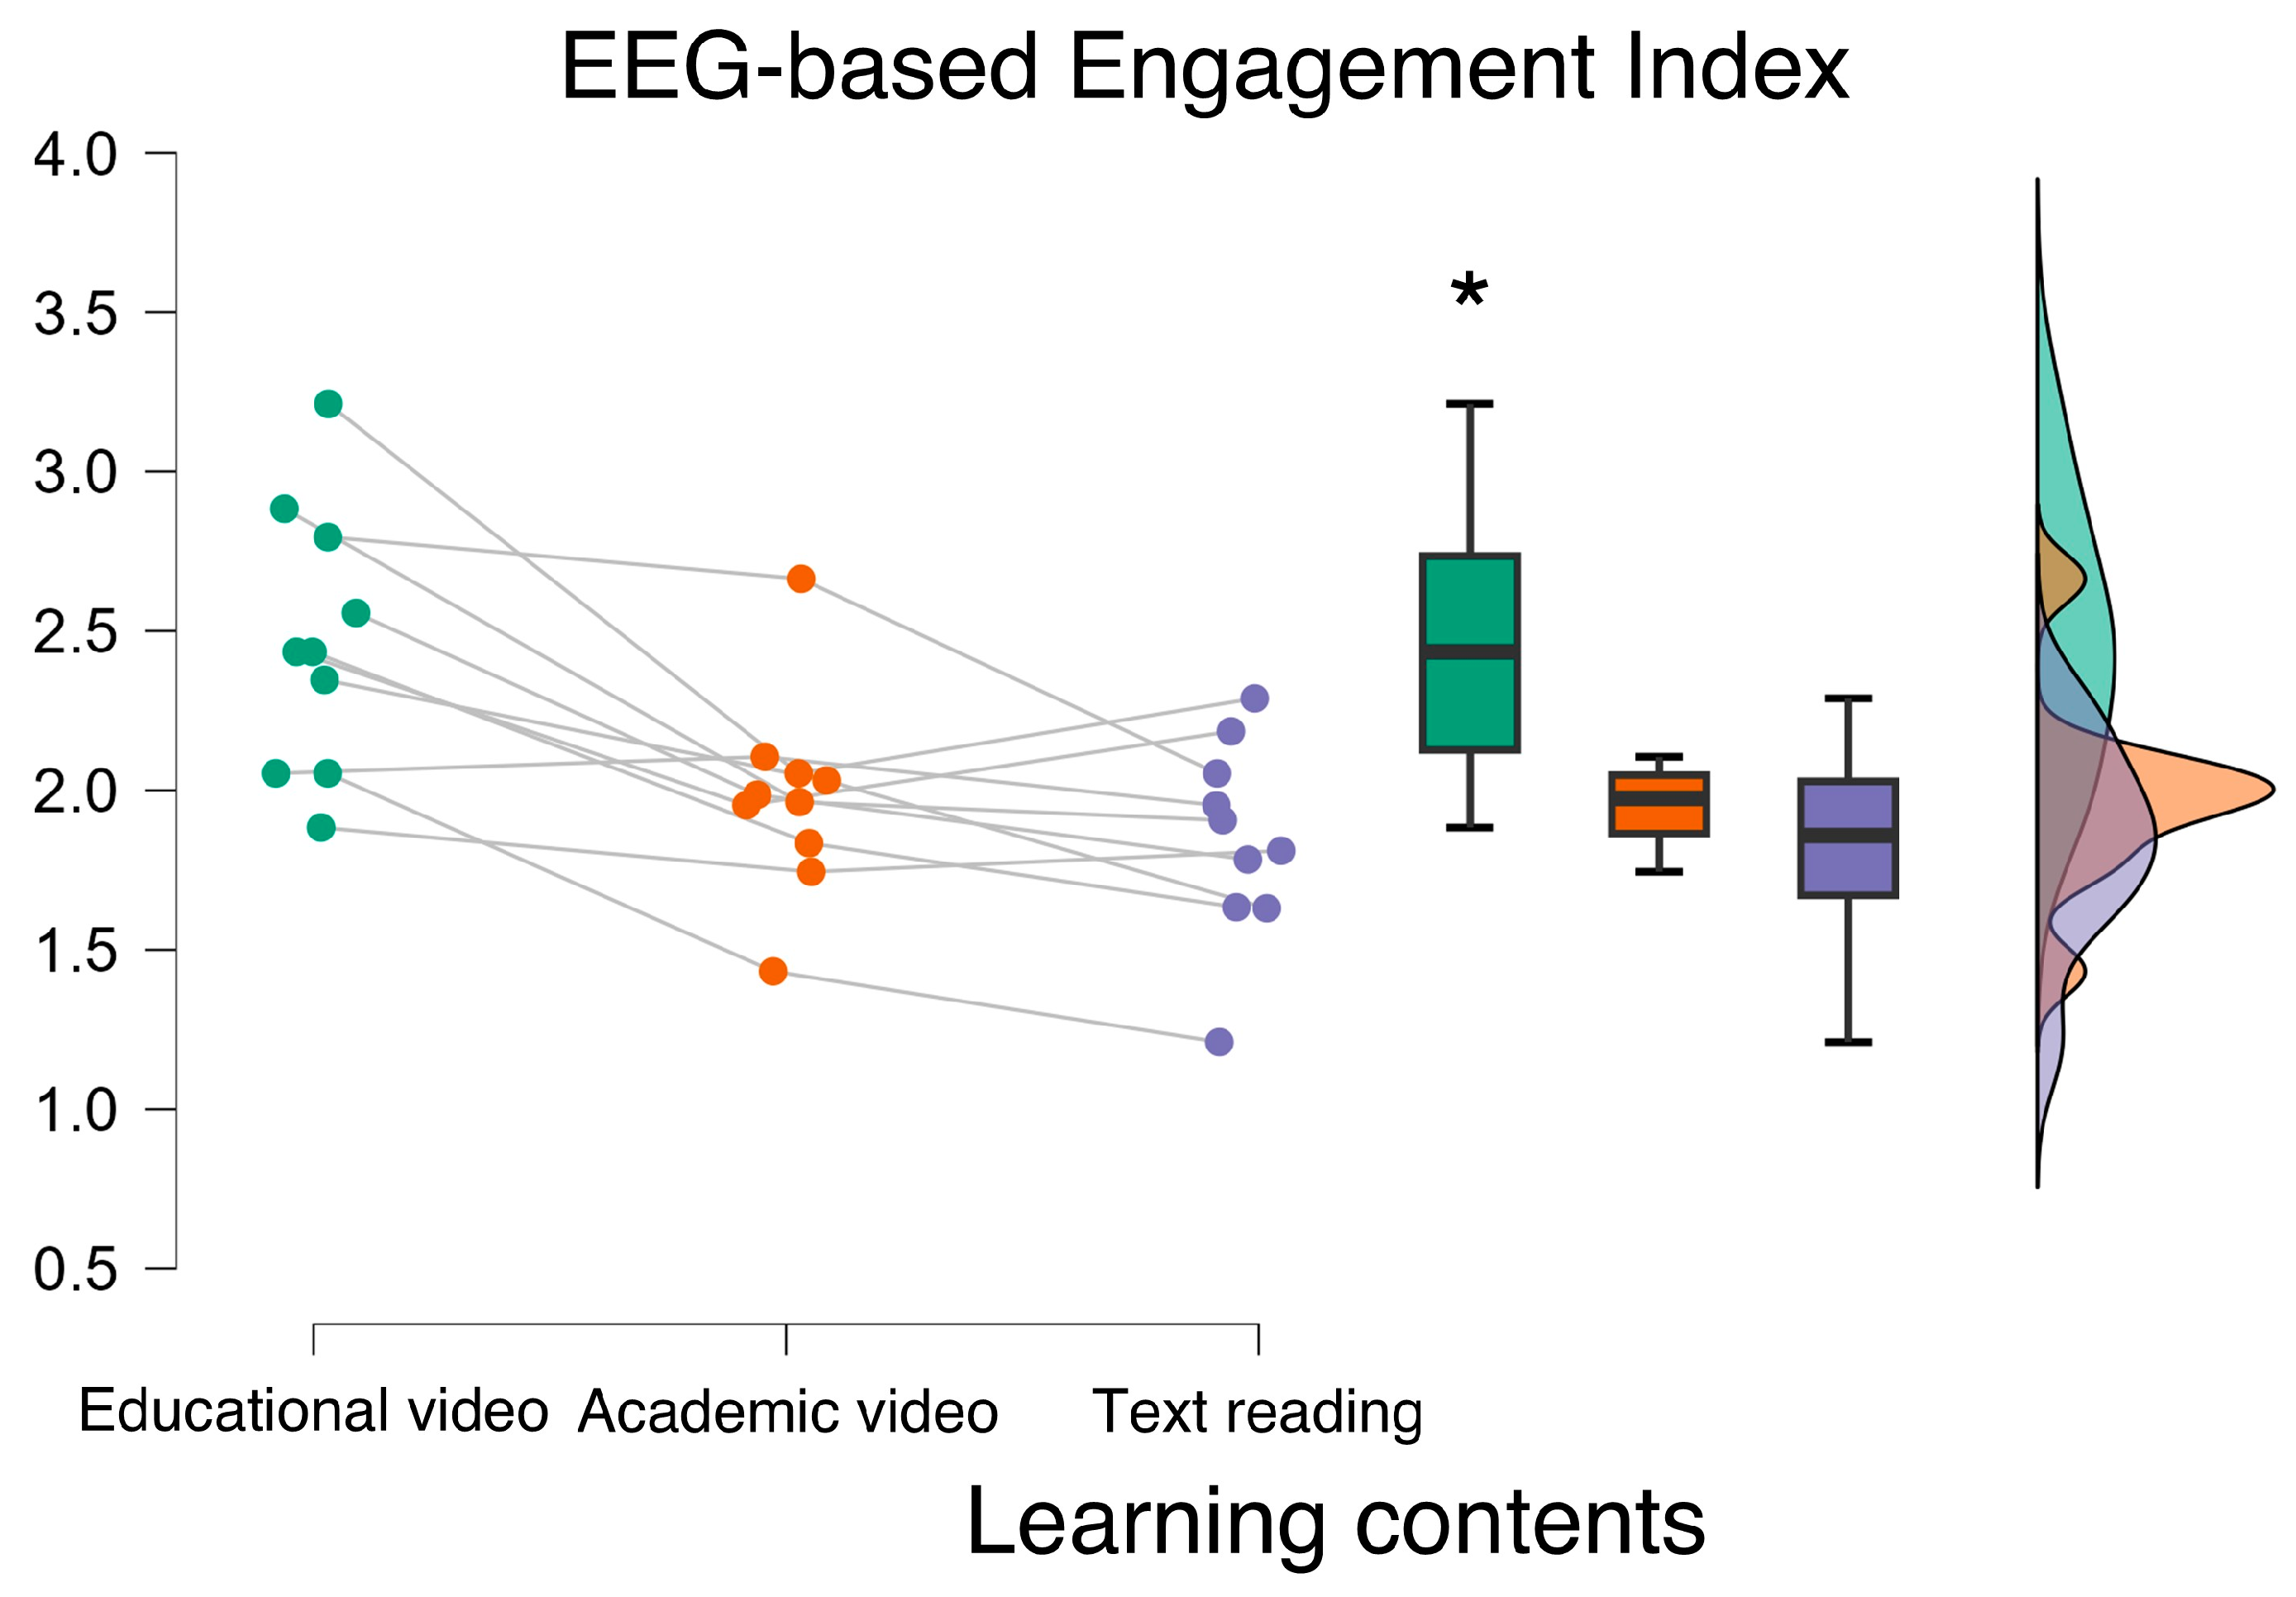
Figure 4.
The repeated measure correlation analysis showed that the neurophysiological engagement index and the respective subjective perceptions exhibited a similar temporal dynamic along the experimental conditions.
Figure 4.
The repeated measure correlation analysis showed that the neurophysiological engagement index and the respective subjective perceptions exhibited a similar temporal dynamic along the experimental conditions.
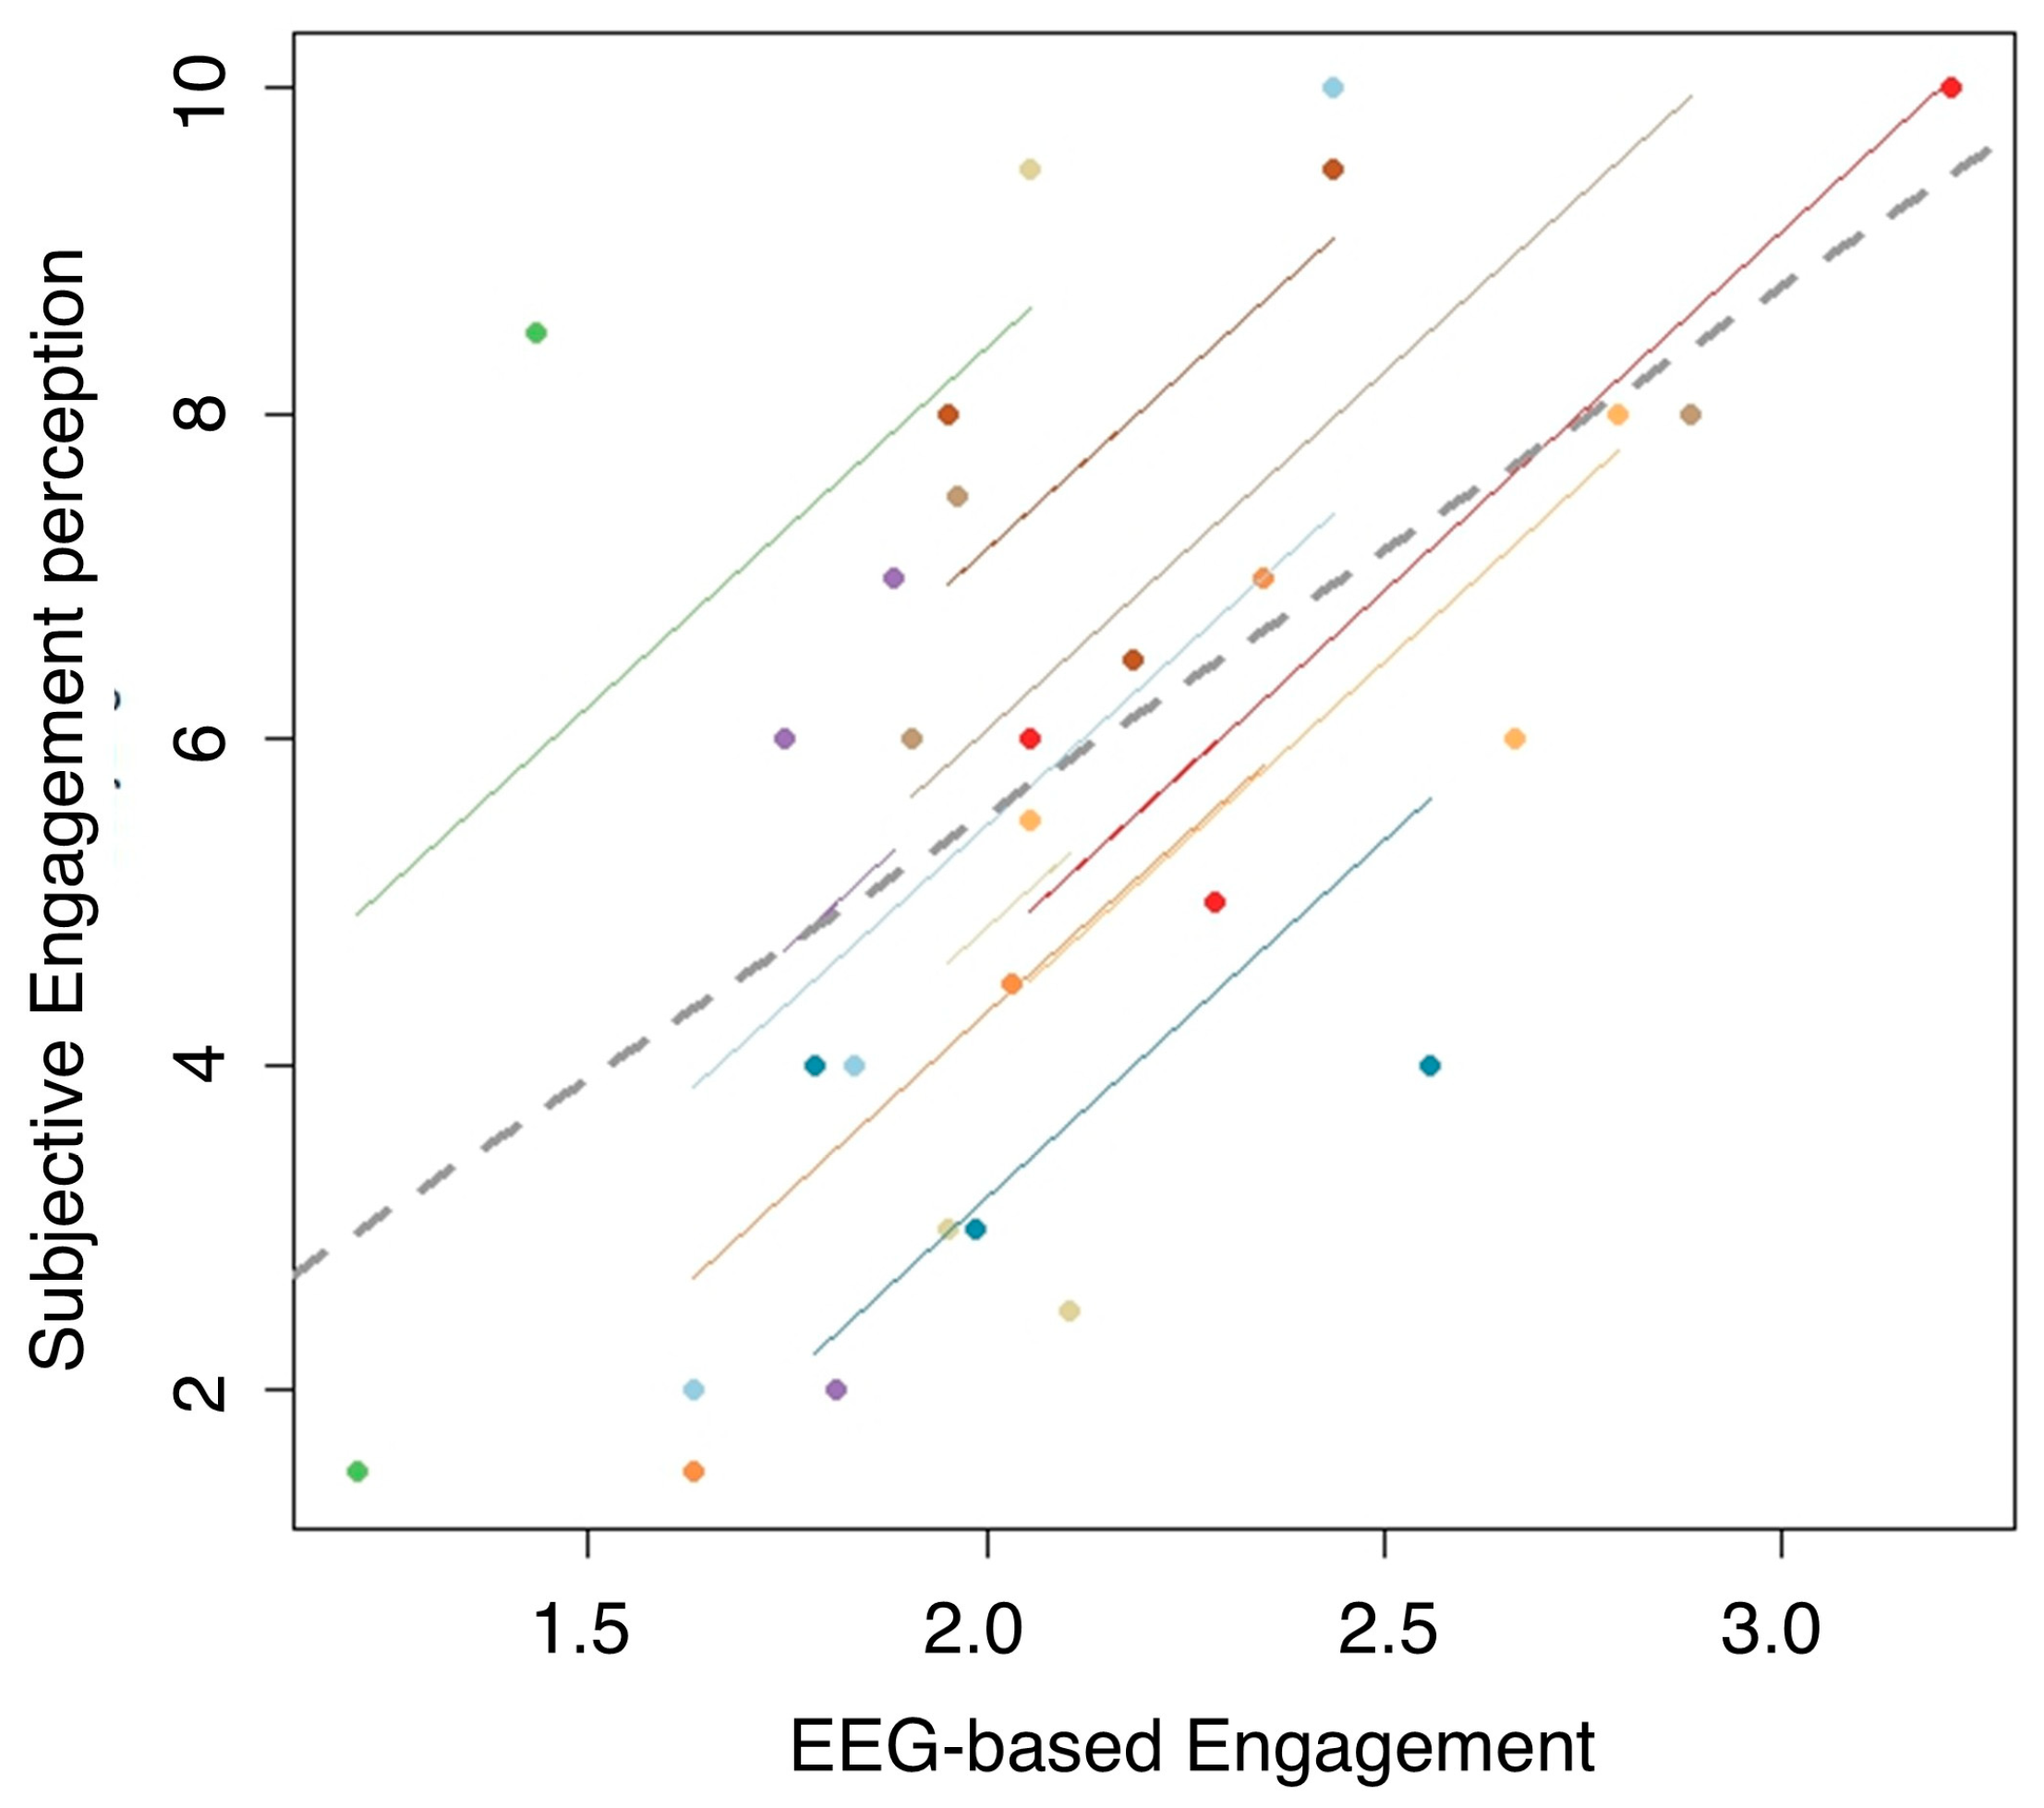
Figure 5.
The statistical analysis of the subjective scores revealed that participants perceived as easier and more engaging the Educational video in terms of cognitive impact.
Figure 5.
The statistical analysis of the subjective scores revealed that participants perceived as easier and more engaging the Educational video in terms of cognitive impact.
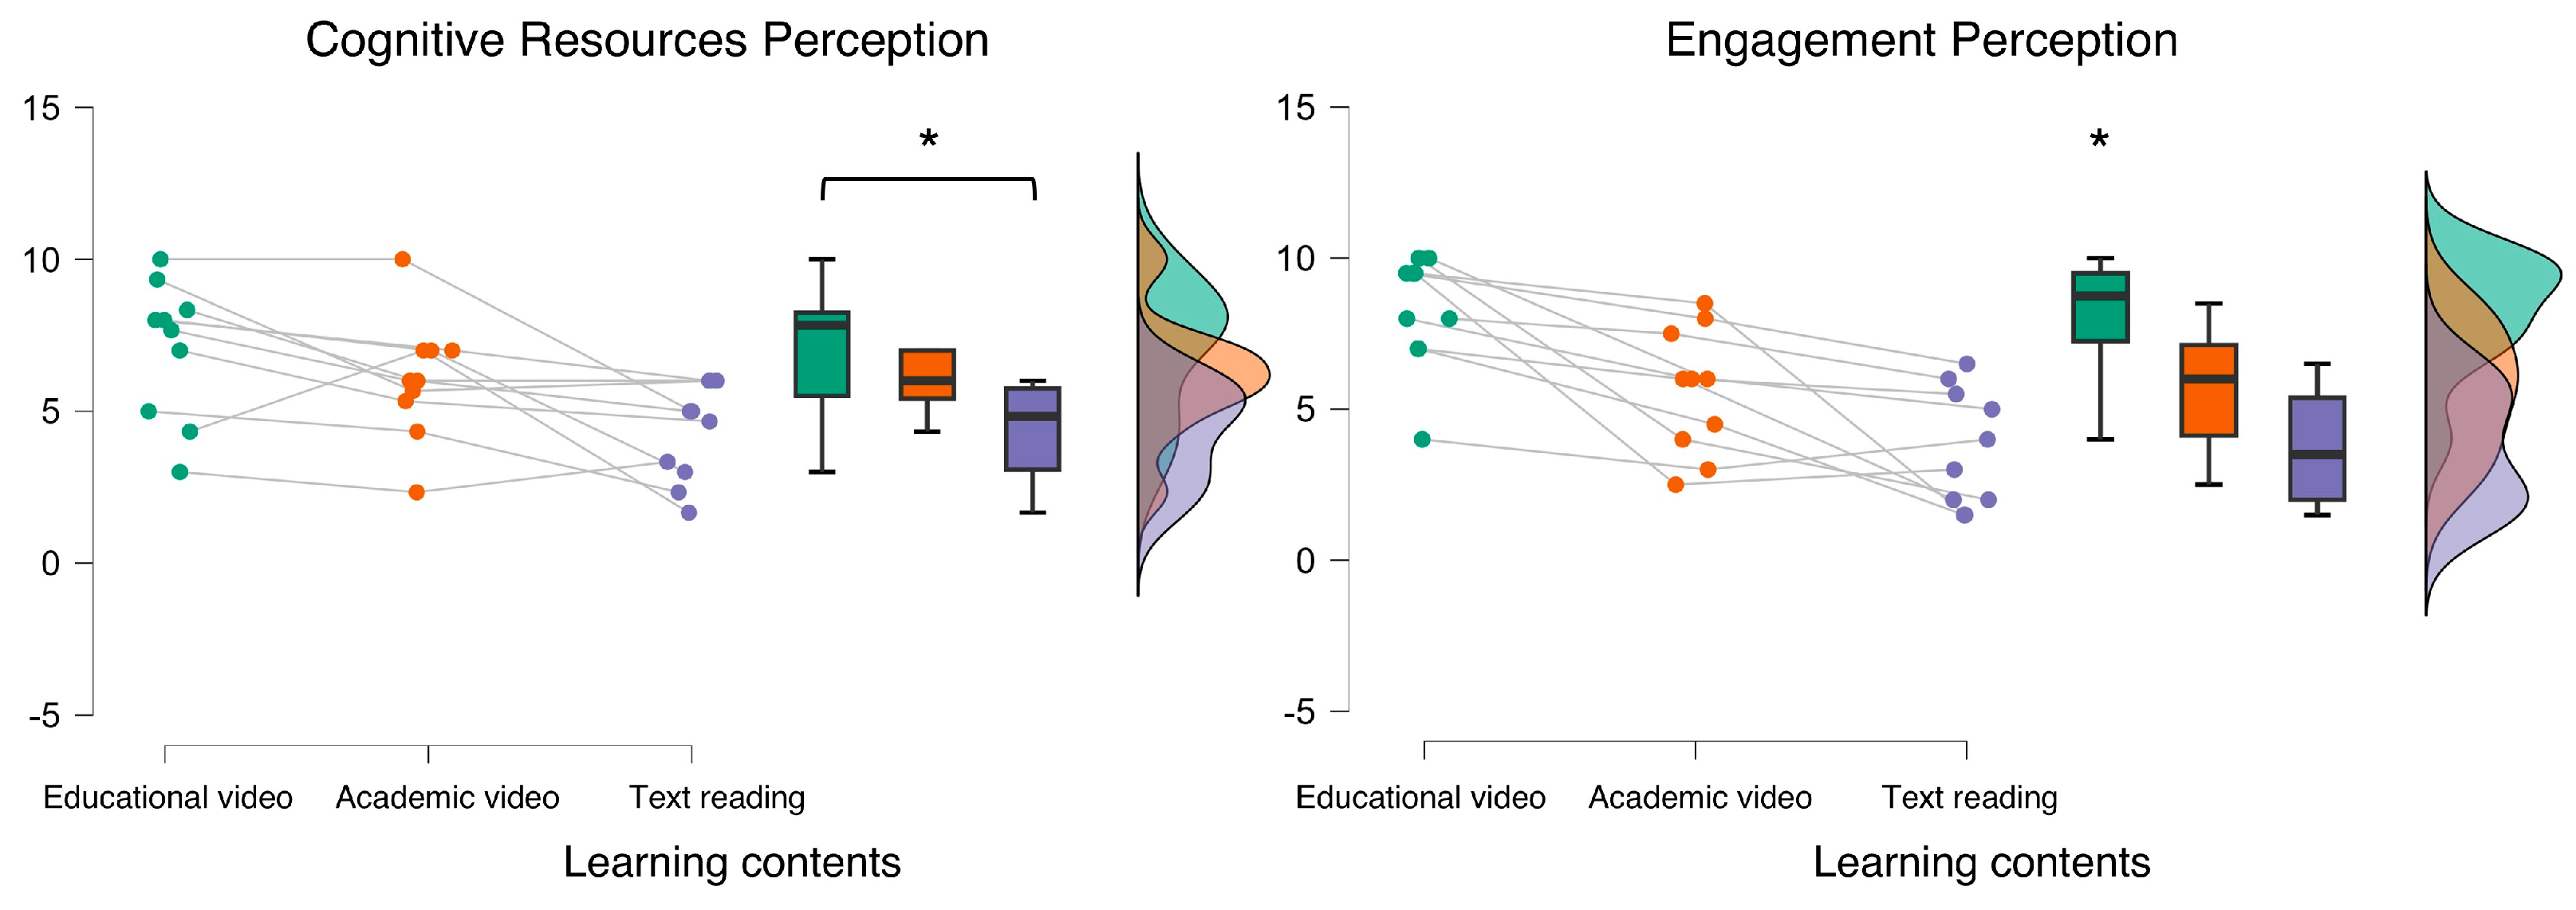
Figure 6.
The statistical analysis showed that the participants provided lower correct answers when accessed to the Text reading material.
Figure 6.
The statistical analysis showed that the participants provided lower correct answers when accessed to the Text reading material.
Disclaimer/Publisher’s Note: The statements, opinions and data contained in all publications are solely those of the individual author(s) and contributor(s) and not of MDPI and/or the editor(s). MDPI and/or the editor(s) disclaim responsibility for any injury to people or property resulting from any ideas, methods, instructions or products referred to in the content. |
© 2025 by the authors. Licensee MDPI, Basel, Switzerland. This article is an open access article distributed under the terms and conditions of the Creative Commons Attribution (CC BY) license (http://creativecommons.org/licenses/by/4.0/).
Copyright: This open access article is published under a Creative Commons CC BY 4.0 license, which permit the free download, distribution, and reuse, provided that the author and preprint are cited in any reuse.


