
Submitted:
15 March 2025
Posted:
17 March 2025
You are already at the latest version
Abstract
The presence of mixed-mode stresses, combining both opening and shearing components, complicates fatigue life estimation when applying the Paris law. To address this, the crack path, along with mode I (opening) and mode II (shear) components, was numerically analyzed using Franc2D based on the linear elastic fracture mechanics (LEFM) approach. Accordingly, fatigue life and stress intensity factors (SIFs) under various biaxial loading ratios (λ) were calculated using the Paris law and compared with available data in the literature. The results show that crack growth is primarily driven by the mode I component, which exhibited the largest magnitude. Thus, KI was adopted for the numerical integration of the fatigue life equation. Furthermore, the influence of normal and transverse loads (σx and σy, respectively) on the crack path and SIF was examined for λ. The analysis revealed that lower λ values lead to faster crack propagation, while higher λ values result in extended fatigue life due to an increased number of cycles to failure. The comparison demonstrates good agreement with reference data, confirming the reliability of the proposed modeling approach over a wide range of biaxial loading conditions.
Keywords:
Biaxial Fatigue
; Biaxial stress ratio
; Cruciform joint
; Franc2D
; Mixed mode fracture
1. Introduction
Biaxial stresses have a significant influence on crack propagation paths in cruciform joints and sheet materials when loads are applied simultaneously in two perpendicular directions. Under such conditions, cracks experience mixed-mode loading, combining both opening (mode I) and shearing (mode II) components. Understanding and modeling this behavior is critical for the design and safety assessment of structural components made of metals and non-metals, particularly in engineering fields such as aerospace and automotive industries [1].
Despite advances in fracture mechanics, the application of Linear Elastic Fracture Mechanics (LEFM) to simulate fatigue crack growth under biaxial loading remains challenging. Most experimental studies on fatigue crack growth are typically conducted under uniaxial, constant-amplitude loading due to the complexity and cost associated with biaxial testing. Moreover, calculating stress intensity factors (SIFs) for cracks under biaxial loading introduces additional analytical and numerical difficulties. Nevertheless, understanding fatigue crack propagation under mixed-mode loading is essential for the reliable assessment of structural integrity in critical components [2].
Various cruciform specimen designs have been developed to perform both static and cyclic biaxial loading tests [3,4,5,6]. It is well established that the direction of fatigue crack growth under mixed-mode loading can be effectively predicted using the Erdogan-Sih criterion [7], , which assumes that crack propagation occurs under a pure mode-I condition [2]. , thereby enabling the application of LEFM. Numerical fracture analysis tools, such as Franc2D [8] , have been employed to calculate SIFs in welded joints subjected to uniaxial loading [9]. Accurate SIF solutions using Franc2D for uniaxial tensile loads have been reported in previous studies [9,10,11], where numerical integration of Paris’ law and backward analysis techniques were applied.
In conventional cruciform specimens, biaxial stresses are introduced by applying loads along both x- and y-directions. The ratio of these stresses, referred to as the biaxial stress ratio, is a critical parameter in analyzing fracture behavior. Variations in this ratio influence the fracture mode and alter the stress distribution near the crack tip. The biaxial stress ratio promotes mixed-mode crack growth and affects the crack path, consequently impacting the overall structural integrity.
To the best of the author's knowledge, it is crucial to investigate how the biaxial stress ratio affects the development of mixed-mode conditions at the crack tip and to identify the specific load ratios that result in crack propagation aligned with the opening mode. Achieving a crack path governed by pure mode-I loading has important implications for crack growth rates, SIFs, and fatigue life. However, the relationship between these parameters is complex and influenced by multiple factors, making it challenging to predict.
The present work examines the validity of considering only mode-I loading in fatigue life predictions. This approach is supported by previous observations indicating that, after an initial stage of crack growth, mode-II SIFs tend to diminish, and the crack continues to propagate under predominant mode-I conditions [12,13]. Accordingly, under symmetric stress distributions, mode-I SIFs (KI) were employed in the calculations of fatigue life and fatigue strength, as mode-II components (KII) approached zero.
This study aims to characterize the fracture behavior of cruciform-type sheet specimens subjected to various biaxial loading ratios using Franc2D. Based on these analyses, the influence of the biaxial stress ratio on the crack path evolution will be systematically investigated.
2. Materials and Methods
The flat cruciform joint with un-notched and the smooth central area was simulated. The material is a flat finite plate of aluminum alloy 2.3 mm thick. Young modulus, yield strength, and ultimate tensile strength are equal to 69 GPa, 165 MPa, and 205 MPa, respectively.
One central crack is assumed to be propagated due to the two axes of loads (see Figure 1a). The crack length in a specimen is 38 mm (i.e, ai=19 mm in one half in symmetrical specimen).
Figure 1b illustrates an example of the mesh pattern used in the FEM-Franc2d analyses. Given the complex nature of the specimen and the applied loads, several iterations were conducted to determine and define an appropriate mesh size and density.
2.1. FEM Simulation
The asymmetric cruciform specimen was modeled under a wide range of cyclic tensile loading conditions along the x- and y-axes, expressed in terms of the biaxial stress ratio (λ). A crack was inserted into the model, and the surrounding area was remeshed. A crack tip rosette was defined on both sides with a specified number of elements, as shown in Figure 2. FRANC2D provides such facilities; however, precise selection is necessary to prevent potential errors.
Crack-tip remeshing was performed during the propagation of the crack, which is a characteristic feature of this fracture analysis code. This approach enables the automatic determination of the crack path, distinguishing it from other commercial software and codes. However, expertise and effort are required to carefully select the mesh, crack increment (∆a), and the number of steps. The latter parameter must be chosen carefully to prevent program errors and potential interruptions during the analysis.
The actual stress distribution around the arms, and radius explained the effect of joint geometry on the crack growth. Moreover, the growth of the single crack under mixed-mode loading is simulated. Under biaxial loading, the stresses around the crack tip become asymmetric and heterogeneous. This means that the crack propagates uniaxially, in a direction parallel to the crack plane, with mode-I being the dominant fracture mode. Figure 3 illustrates the symmetrical stress distributions and the effect of the notch radius in un-cracked and cracked specimen (see Figure 3). As the biaxial stress ratio (λ) changes, the stress distribution around the crack tip also evolves. This variation necessitates consideration of the influence of λ on both mode-I and mode-II fracture behaviors. Notably, a balance between these two modes occurs at a stress ratio of 1. Furthermore, the principal stress highlights the regions of potential cracking and areas of elevated stress concentration. Since this study focuses on crack propagation paths, the effective and maximum shear stress distributions provide critical insights into the crack opening trajectory, see Figure 3.
3. Numerical Calculations
3.1. Effect of Biaxial Ratio on the Mixed Mode Bahvaiour
The biaxial ratio plays a critical role in influencing the mixed-mode behavior at the crack tip. Therefore, the impact of the biaxial ratio on Mode-I and Mode-II fracture mechanics has been investigated. Under symmetrical stress conditions around the crack tip, Mode-I typically dominate. Additionally, LEFM remains valid in these cases. Table 1 shows the parameters that have been used.
The results will also demonstrate the variation in tensile and shear SIFs for different biaxial ratios. There exists a specific stress ratio that transitions the state of the crack tip into a mixed-mode condition, effectively converting the uniaxial opening mode into a mixed-mode scenario.
3.2. Paris’ Fatigue Life Calculation
The coefficients of Paris’ law, C, and m values are determined equal to 1.9199e-15, and 4.1908, respectively [14]. Traditionally, the crack growth direction is predicted by Erdogan-Sih criterion due to the symmetrical crack growth and stress distribution around the crack tips. The crack growth rate, and FAT are estimated by Paris’ law as based on the fracture mechanics method (Eq 1) where KI (opening mode) was considered [9].
The determination of the number of cycles (N) until failure is done by integration of the crack growth relation from ai up to reaching a final crack length at break-through (af) as follows [9]:
The SIF range inside is:
where Δσ is the applied stress range, a is the crack length, and Y is the correction factor as a function of f(a/t), consequently:
Thus, the number of cycles for one increment is determined as follows:
The crack length vector and calculated SIF are transferred to Excel and integrated numerically using to Eq 6 [9]. Then, the total life N can be calculated for each increment as follows:
where j is the step’s number. Various stress levels were used, and the results of fatigue life are recorded to determine the S-N curve.
4. Results and Discussion
4.1. Biaxial Loading Effect
The biaxial stress ratio (λ) plays a crucial role in transforming the distributed stresses around the crack tip into a mixed-mode condition, resulting in the presence of both modes I and mode II SIFs. Consequently, KI also becomes significant. To ensure consistency and enable reliable comparison, the same crack growth increment (∆a=5 mm) and propagation steps were applied throughout the analysis. For each value of λ, the stresses at the crack tip were calculated. It was observed that increasing λ leads to changes in the crack trajectory, causing it to curve, as illustrated in Figure 4.
4.2. Crack Path and Propgation
The crack tip position was recorded at each propagation step. In this model, two crack tips exist, one on the left and one on the right side of the crack (with a total crack length of 2a = 38 mm). The crack coordinates on both sides are nearly identical, with only minor differences caused by slight variations in the crack kink angle between the left and right tips. To present a consistent and positive crack path, the crack tip located on the right side was selected for analysis and illustration
Figure 5 shows the crack propagation path and highlights the influence of the biaxial ratio on crack trajectory. The figure demonstrates how variations in the load ratio lead to a transition from a straight crack path to a curved one.
4.3. Stress Intensity Factor Analysis and Comparison
The effect of sliding mode (KII) and tensile opening mode (KI) during the propagation can be observed for λ≤1, because the crack path still straight. The stress distributions around the crack tip are identical. After a few steps and when λ>1, KII value becomes nearly zero due to the changing of the crack path direction, hence the pure mode-I cracking is predominated.Franc2D [8] was used in SIF calculations in case of uni-axial loading [9,15]. However, its application in biaxial fracturing has yet to be explored in this work.
The stress intensity factor (SIF) was calculated considering the effect of the biaxial ratio (λ), accounting for both shear and tensile stresses. The mode I SIF (KI) at each crack tip was used to characterize the driving force for crack growth. Results show that for λ up to 1.5, the crack propagates along a straight path parallel to its initial plane. When λ exceeds 1.5, the crack begins to curve, and KI increases significantly with crack extension, as illustrated in Figure 6. Additionally, while KI initially decreases as λ increases, a noticeable change in its value occurs once λ surpasses 1.5, especially for longer cracks. Therefore, the effect of biaxial ratio on the stress at the crack tip exhibits nonlinear behavior, as shown in Figure 7. Initially, the crack tip stresses decrease with increasing λ, reaching a minimum around λ = 1.5. Beyond this point, as λ continues to increase, the crack tip begins to experience moderate stress levels, which leads to a subsequent increase in the SIF at the crack tip.
Breitbarth [16] conducted both FE-ANSYS simulations and experimental tests on aluminum alloy AA5028 to predict crack paths under biaxial loading. To validate the current findings, the proposed models and approach were compared with the experimental and numerical results from Ref. [16], where a biaxial ratio of λ=3 was investigated (Figure 8a). The present numerical model demonstrates strong agreement with the finite element (FE) simulations performed using ANSYS, as well as with the experimental data reported in the literature (Figure 8b). Furthermore, the crack path predicted by the current models aligns well with the reference data, confirming that the models have been successfully benchmarked.
The schematic points representing the crack path coordinates (x, y) obtained from the current results have been compared with the experimental and ANSYS simulation results (λ = 3.0) for the AA2024-T351 specimen reported in [15]. The comparison shows that the current results are generally in good agreement with the numerical and experimental data, as illustrated in Figure 9.
4.4. Fatigue Crack Growth: A Comparative Study
The crack growth paths obtained from the current simulations agree well with the experimental results reported in [18], confirming the validity of the proposed model and approach for fatigue life prediction. Using this validated model, fatigue life can be reliably calculated. From a fracture mechanics perspective, increasing the biaxial ratio λ (i.e., higher transverse stress σₓ) leads to an increase in the number of cycles to failure, as shown in Figure 5. This is because crack propagation is primarily driven by opening mode I, while the contribution of sliding mode II, which arises due to increasing σₓ, has only a minor effect on crack growth. The current results, based on mode I SIF-KI calculated using the Franc2D code and the numerical integration of Paris' law, show good agreement with the experimental observations reported in Ref. [17], as illustrated in Figure 11. Overall, increasing the biaxial ratio leads to an extended fatigue life
The selection of the cracking steps and ∆a size needs some precautions. At the crack length of 140 mm, the specimen will be defined as failed by fatigue [18].
By using the simplest form of Paris’ equation, the crack growth curves are shown for λ=0.5-1.5 as used in Ref [18]. The fatigue crack growth was faster for a smaller λ due to the opening stress effect (see Figure 12). This result agrees well with Eun et al. [18]. The increasing of λ will increase the fatigue life. [19]. The comparison with these results is shown in Figure 12 in case of IP [18].
Fatigue crack growth resistance and overall fatigue strength increase with higher biaxial ratios. This is primarily because increasing the biaxial ratio reduces the SIF, as shown in Figure 6. Moreover, the crack path tends to remain straight and aligned parallel to σx, without significant deviation. As a result, the number of cycles to failure increases, thereby enhancing the fatigue strength, as illustrated in Figure 13.
4.5. Fatigue Life and SIF Under High Biaxial Ratios
As mentioned earlier, the crack path and fatigue life were compared and validated, confirming that the current model and simulation approach are properly benchmarked. Building on this validation, the present study extended the analysis to higher biaxial ratios, specifically λ = 2.5 and λ = 3. These higher ratios exhibit a nonlinear and inconsistent behavior in terms of crack path (Figure 13) and SIF evolution (Figure 14a), where the SIF increases sharply after a certain crack length, deviating from the general trend observed for lower biaxial ratios.
At higher biaxial ratios, the crack tends to curve significantly and eventually becomes nearly perpendicular to σx, aligning itself with the direction of the applied transverse stress. Nevertheless, although the final stage of crack growth is fully governed by opening mode (perpendicular to the σx direction), the same trend of increasing fatigue life with increasing stress ratio is observed, as shown in Figure 14b.
5. Conclusions
Many studies have focused on simulating crack growth under uniaxial stress conditions; however, simulating crack propagation in specimens subjected to biaxial stresses remains a critical and complex challenge in fracture prediction for engineering applications. This study aimed to demonstrate the capability of Franc2D in simulating biaxial crack growth and accounting for biaxial loading effects. Fatigue crack growth analysis under biaxial loading, using Franc2D based on LEFM, remains relatively underexplored in the literature. To address this gap, LEFM was employed to calculate the SIFs using Franc2D for biaxial fatigue crack growth. The crack growth rate in biaxial stressed specimens made of structural aluminum alloys was analyzed and compared with available experimental and numerical results from the literature. A biaxial fatigue crack growth simulation was developed for cruciform specimens subjected to various biaxial stress ratios. The effects of these biaxial ratios on SIF and fatigue life were thoroughly investigated. The study modeled a central crack in a finite cruciform plate under biaxial loading and used mode-I for fatigue life predictions based on Paris' law, which was validated through comparison with published experimental data. The results demonstrated that the crack growth rate and crack path are significantly influenced by the biaxial stress ratio. It was found that as the biaxial ratio increases, the SIF decreases, resulting in longer fatigue life. However, when the biaxial ratio exceeds 1.5, the crack path begins to curve and aligns more perpendicular to the increasing transverse load. Consequently, for higher ratios (λ = 2 to 3), the SIF begins to rise again due to the altered crack orientation. Nevertheless, despite this increase in SIF at higher ratios, the overall trend of increasing fatigue life with higher biaxial ratios remains consistent. In summary, a novel and validated simulation approach for describing biaxial fatigue crack growth behavior has been developed, offering valuable insights into the impact of biaxial loading on crack path, SIF, and fatigue life in structural components.
Author Contributions
Conceptualization, A. Al-Mukhtar; methodology, A. Al-Mukhtar and C. Koenke; validation, A. Al-Mukhtar; formal analysis, A. Al-Mukhtar; investigation, A. Al-Mukhtar; resources, A. Al-Mukhtar; data curation, A. Al-Mukhtar; writing—original draft preparation, A. Al-Mukhtar and C. Koenke; writing—review and editing, A. Al-Mukhtar; visualization, A. Al-Mukhtar; supervision, C. Koenke.; project administration, A. Al-Mukhtar; funding acquisition, C. Koenke. All authors have read and agreed to the published version of the manuscript.
Funding
This research received no external funding.
Data Availability Statement
The original contributions presented in the study are included in the article, further inquiries can be directed to the corresponding author.
Acknowledgments
The first author acknowledges the support from Bauhaus-Universität Weimar.
Conflicts of Interest
The authors declare no conflicts of interest.
References
- Al-Mukhtar, A.M. Aircraft Fuselage Cracking and Simulation. Procedia Structural Integrity 2020, 28, 124–131. [Google Scholar] [CrossRef]
- M. Kikuchi, “Fatigue crack growth simulation under mode I+ II mixed mode condition,” Dep. Mech. Eng. Fac. Sci. Technol. Sci. Univ. Tokyo Trans. SMiRT, vol. 16.
- Lebedev, A.A.; Muzyka, N.R. Design of cruciform specimens for fracture toughness tests in biaxial tension (Review). Strength Mater 1998, 30, 243–254. [Google Scholar] [CrossRef]
- Radon, J.C.; Leevers, P.S.; Culver, L.E. A simple testing technique for fracture under biaxial stresses: A mechanical-hydraulic machine for biaxial fatigue and ramp loading of precracked plate specimens is described. Preliminary results show that crack behavior in PMMA is independent of the stress acting parallel to the crack plane. Experimental Mechanics 1977, 17, 228–232. [Google Scholar] [CrossRef]
- Wu, X.-D.; Wan, M.; Zhou, X.-B. Biaxial tensile testing of cruciform specimen under complex loading. Journal of materials processing technology 2005, 168, 181–183. [Google Scholar]
- Makinde, A.; Thibodeau, L.; Neale, K.W. Development of an apparatus for biaxial testing using cruciform specimens. Experimental Mechanics 1992, 32, 138–144. [Google Scholar] [CrossRef]
- Erdogan, F.; Sih, G.C. On the crack extension in plates under plane loading and transverse shear. Journal of basic engineering 1963, 85, 519–525. [Google Scholar] [CrossRef]
- Cornell Fracture Group FRANC2D Version 3. Available online: http://www.cfg.cornell.edu/software/franc2d_casca.htm (accessed on Jul 7, 2013).
- Al-Mukhtar, A.M.; Biermann, H.; Hübner, P.; Henkel, S. Determination of Some Parameters for Fatigue Life in Welded Joints Using Fracture Mechanics Method. Journal of Materials Engineering and Performance 2010, 19, 1225–1234. [Google Scholar] [CrossRef]
- Al-Mukhtar, A.M. The Safety Analysis Concept of Welded Components under Cyclic Loads Using Components under Cyclic Loads Using, Technische Universität Bergakademie Freiberg, 2010.
- Kariya, M.; Hatano, K.; Horibe, S. Influence of Compressive Pre-strain on Tensile Fatigue in Two Types of Aluminum Alloys. Journal of materials engineering and performance 2010, 19, 1205–1207. [Google Scholar] [CrossRef]
- Al-Mukhtar, A.M. Mixed-Mode Crack Propagation in Cruciform Joint using Franc2D. Journal of Failure Analysis and Prevention 2016, 1–7. [Google Scholar] [CrossRef]
- Shlyannikov, V.N.; Tumanov, A.V.; Zakharov, A.P. The mixed mode crack growth rate in cruciform specimens subject to biaxial loading. Theoretical and Applied Fracture Mechanics 2014, 73, 68–81. [Google Scholar] [CrossRef]
- A. S. and A. M. P. de Jesus, “Fatigue Behaviour of Welded Joints Made of 6061-T651 Aluminium Alloy,” in Aluminium Alloys, Theory and Applications, 2011.
- Al-Mukhtar, A.; Biermann, H.; Henkel, S.; Hübner, P. Comparison of the Stress Intensity Factor of Load-Carrying Cruciform Welded Joints with Different Geometries. Journal of Materials Engineering and Performance 2010, 19, 802–809. [Google Scholar] [CrossRef]
- Breitbarth, E.; Besel, M. Fatigue crack deflection in cruciform specimens subjected to biaxial loading conditions. International Journal of Fatigue 2018, 113, 345–350. [Google Scholar] [CrossRef]
- Pook, L.P. Five decades of crack path research. Engineering Fracture Mechanics 2010, 77, 1619–1630. [Google Scholar] [CrossRef]
- Lee, E.U.; Taylor, R. Biaxial Fatigue of Aluminum Alloy 1100. Multiaxial Fatigue & Fracture (ICMFF9), Italy.
- Al-Mukhtar, A.M. Consideration of the residual stress distributions in fatigue crack growth calculations for assessing welded steel joints. Fatigue & Fracture of Engineering Materials & Structures 2013, 36, 1352–1361. [Google Scholar] [CrossRef]
Figure 1.
(a) aluminum cruciform specimen, dimensions in mm [12]; (b) mesh pattern (Franc2d).
Figure 1.
(a) aluminum cruciform specimen, dimensions in mm [12]; (b) mesh pattern (Franc2d).
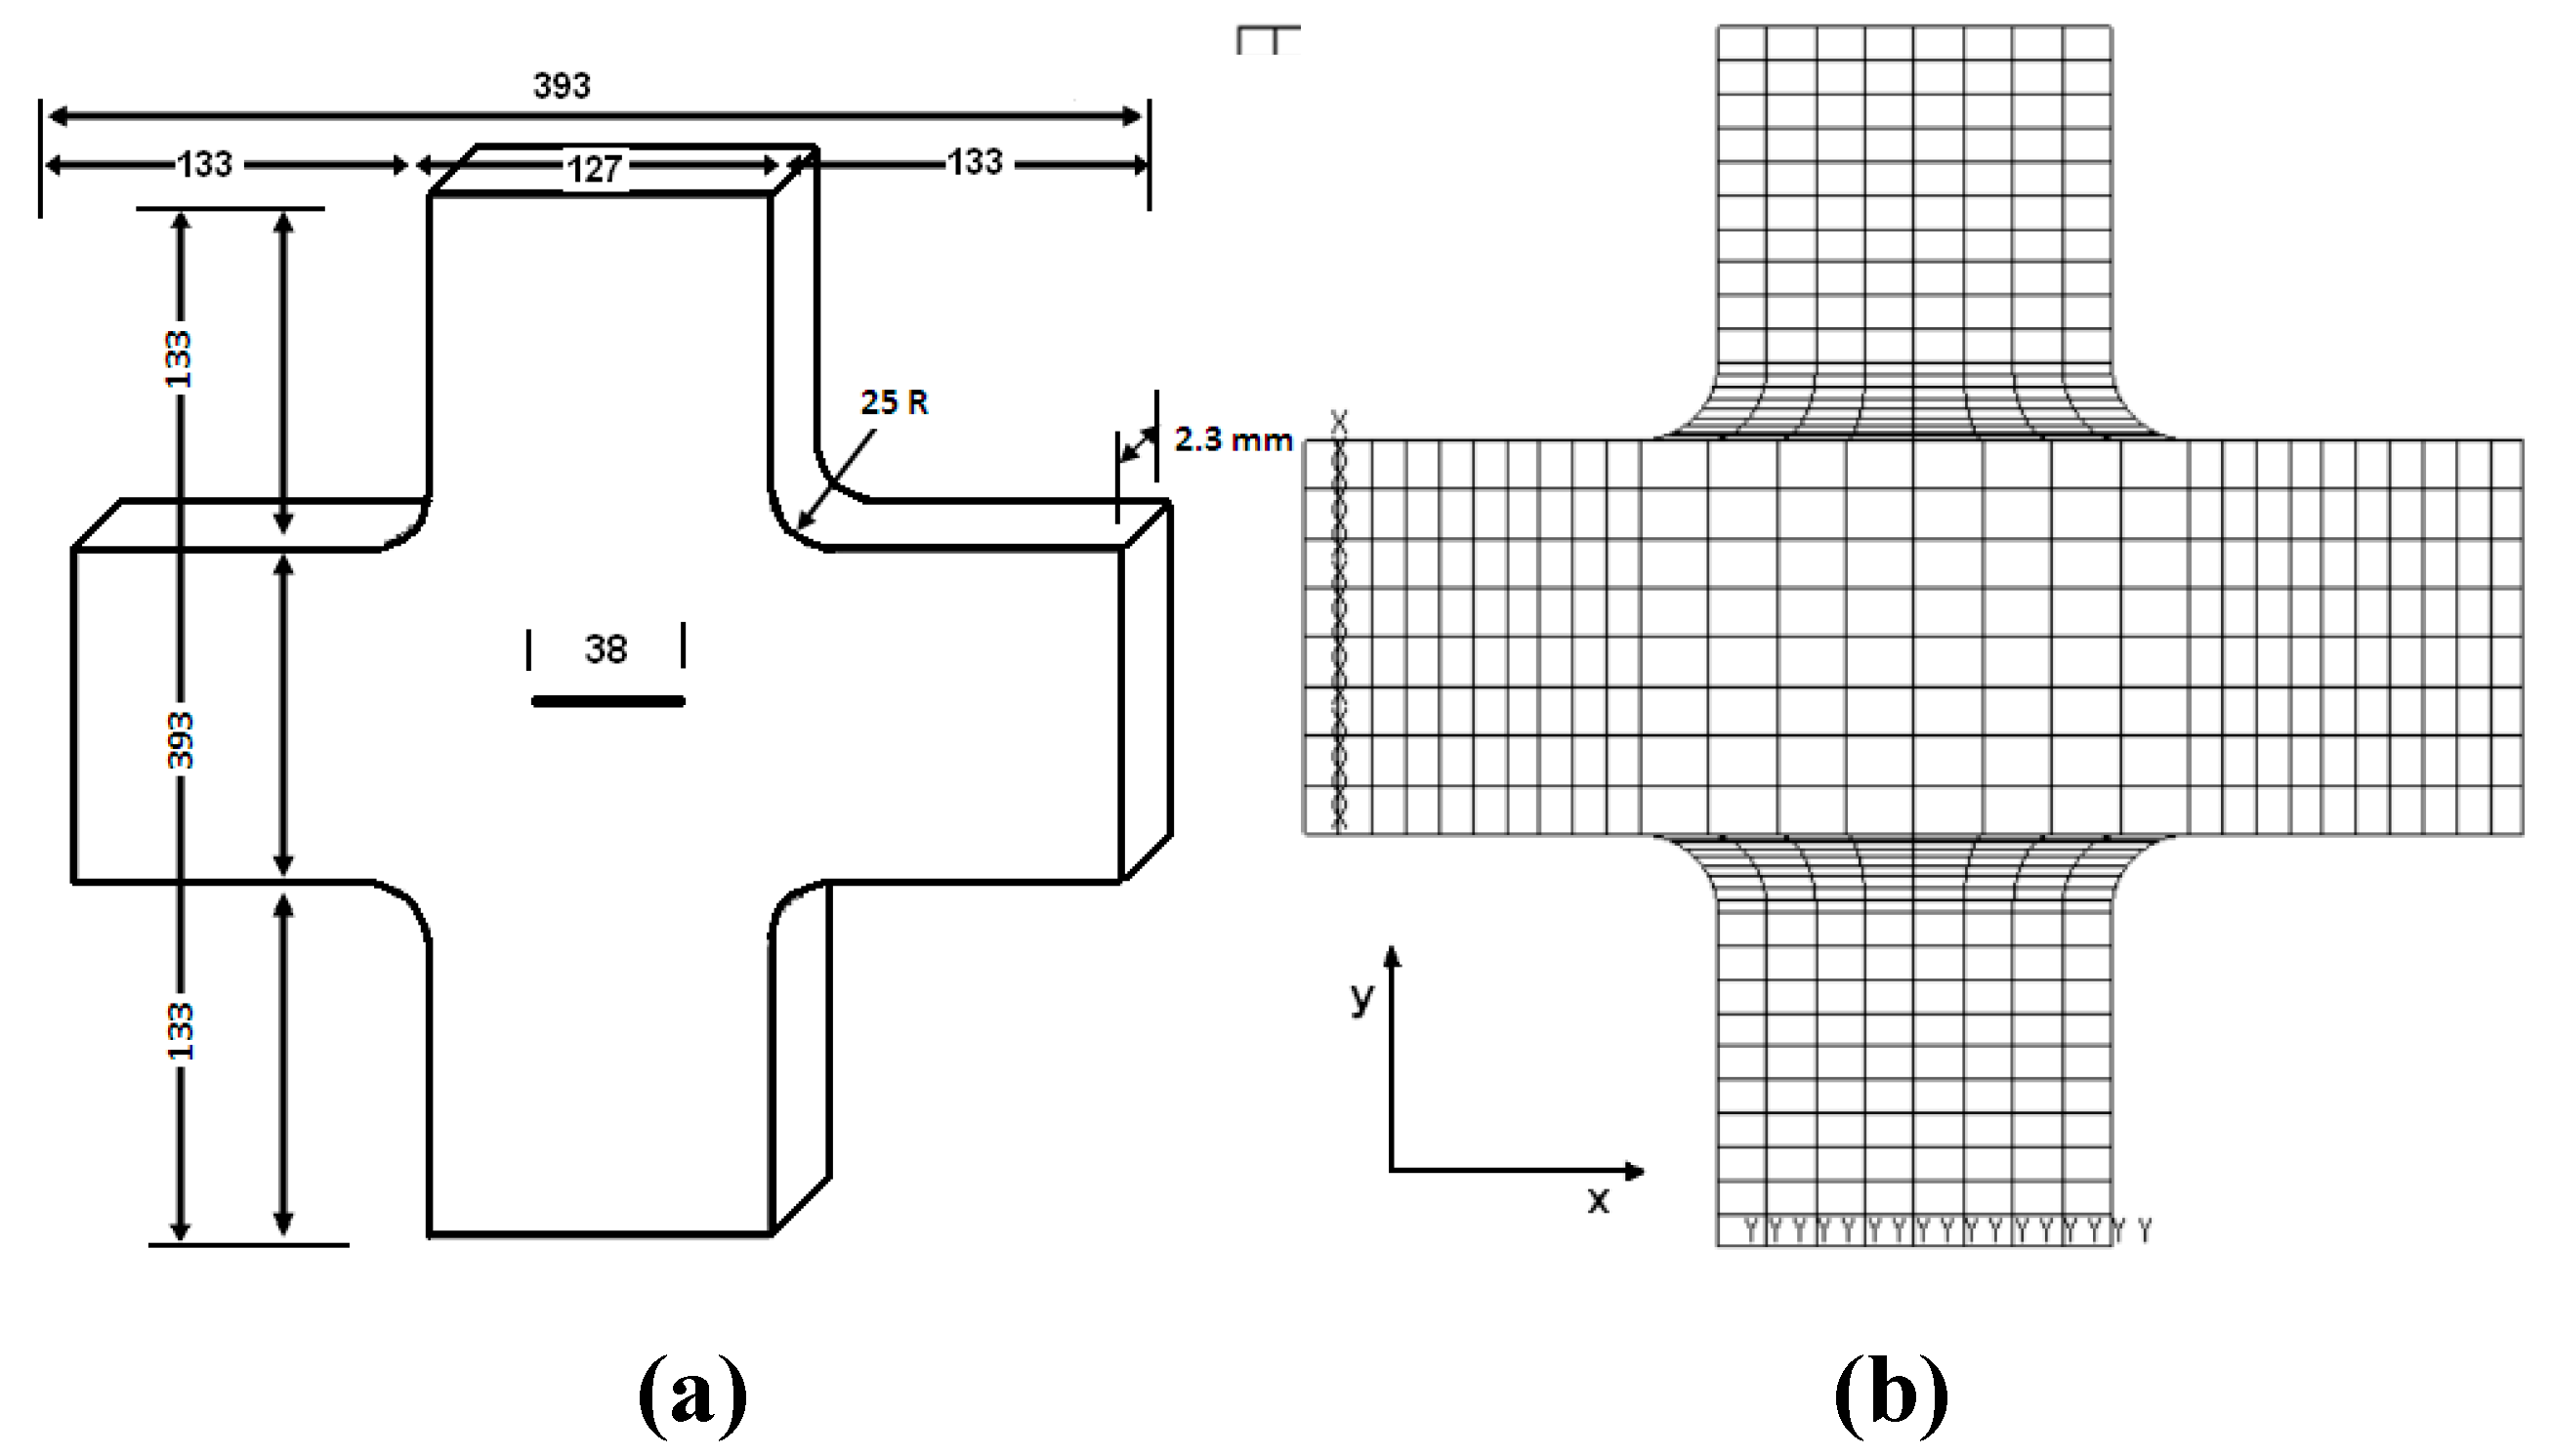
Figure 2.
Remeshing and crack creation. The crack length is 38 mm, and the material properties were incorporated into the model during its application.
Figure 2.
Remeshing and crack creation. The crack length is 38 mm, and the material properties were incorporated into the model during its application.
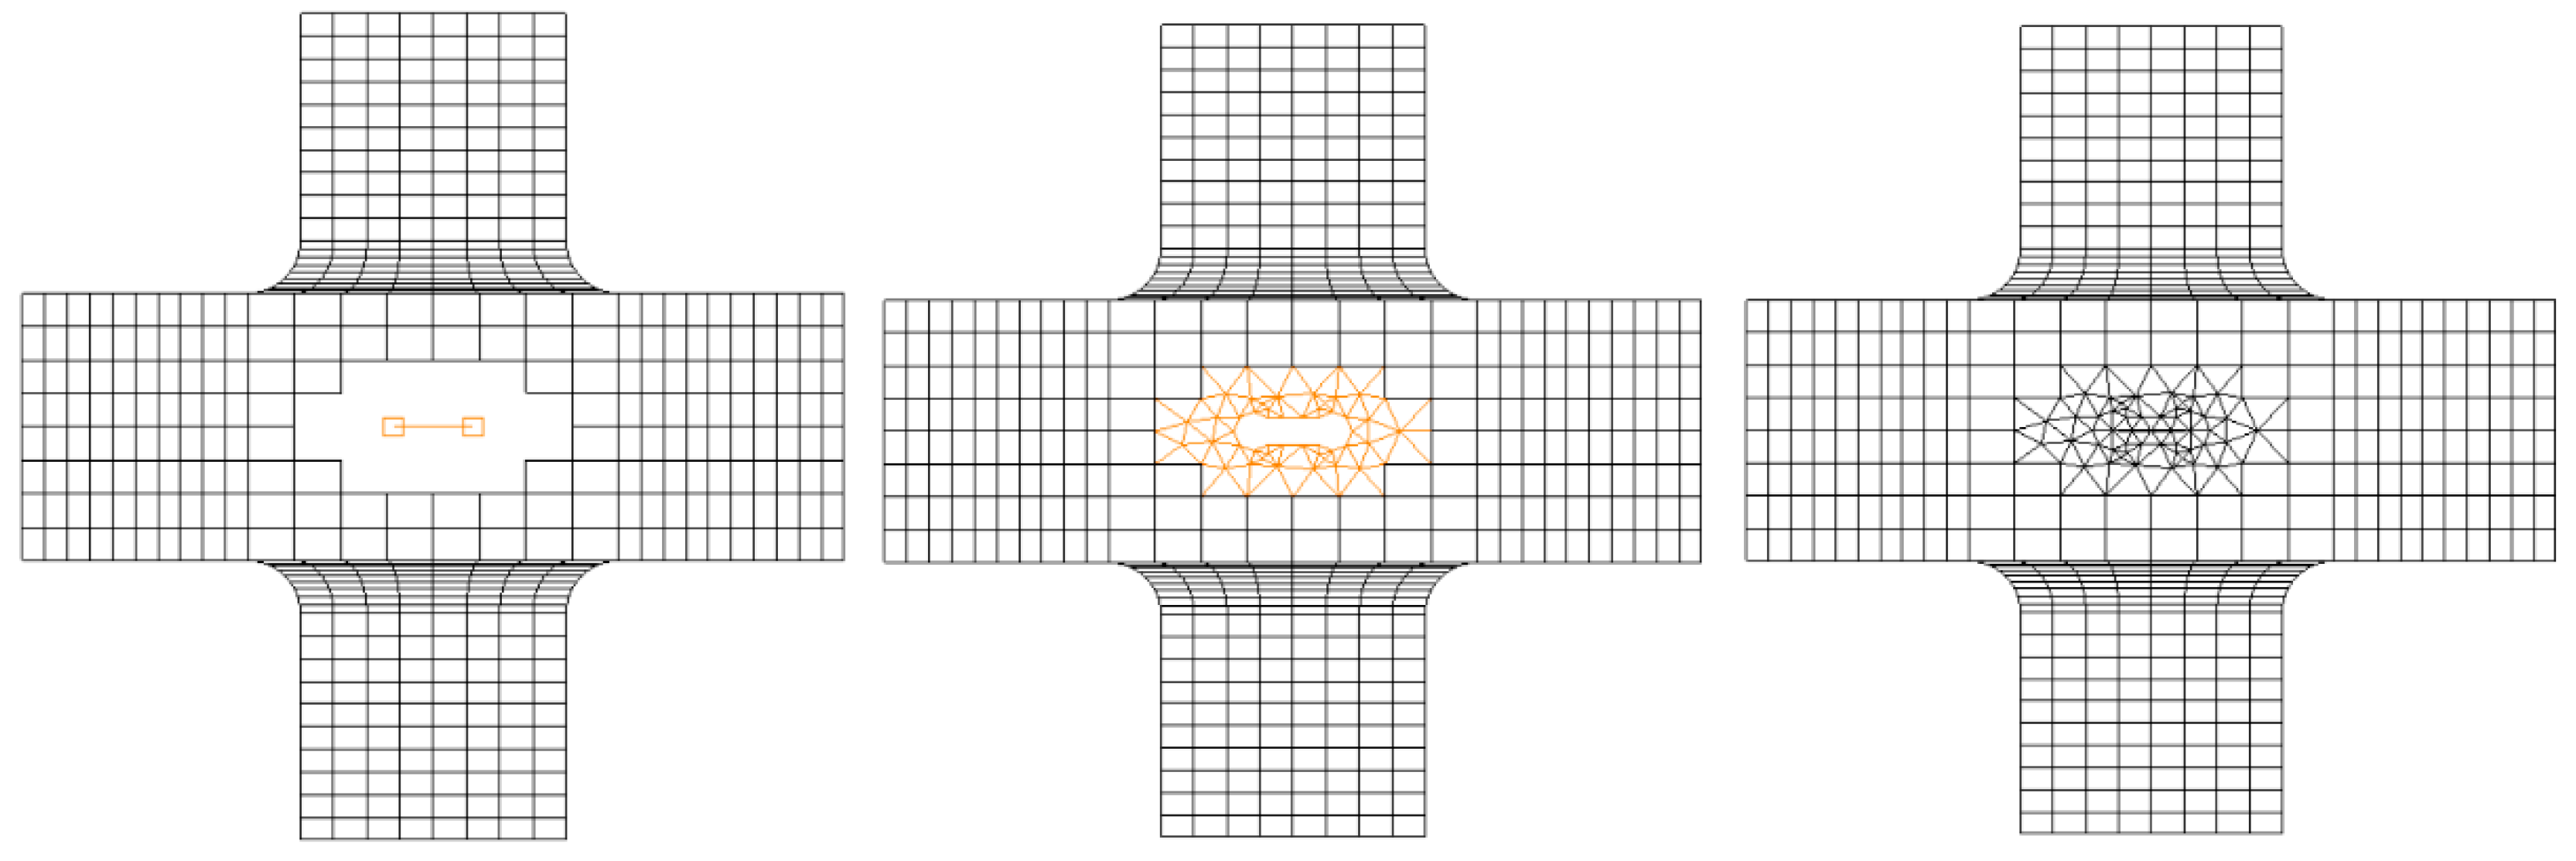
Figure 3.
Symmetrical stress distributions, σy=35.7 MPa; where λ=σx/σy=1; (a) without crack; (b) with crack.
Figure 3.
Symmetrical stress distributions, σy=35.7 MPa; where λ=σx/σy=1; (a) without crack; (b) with crack.
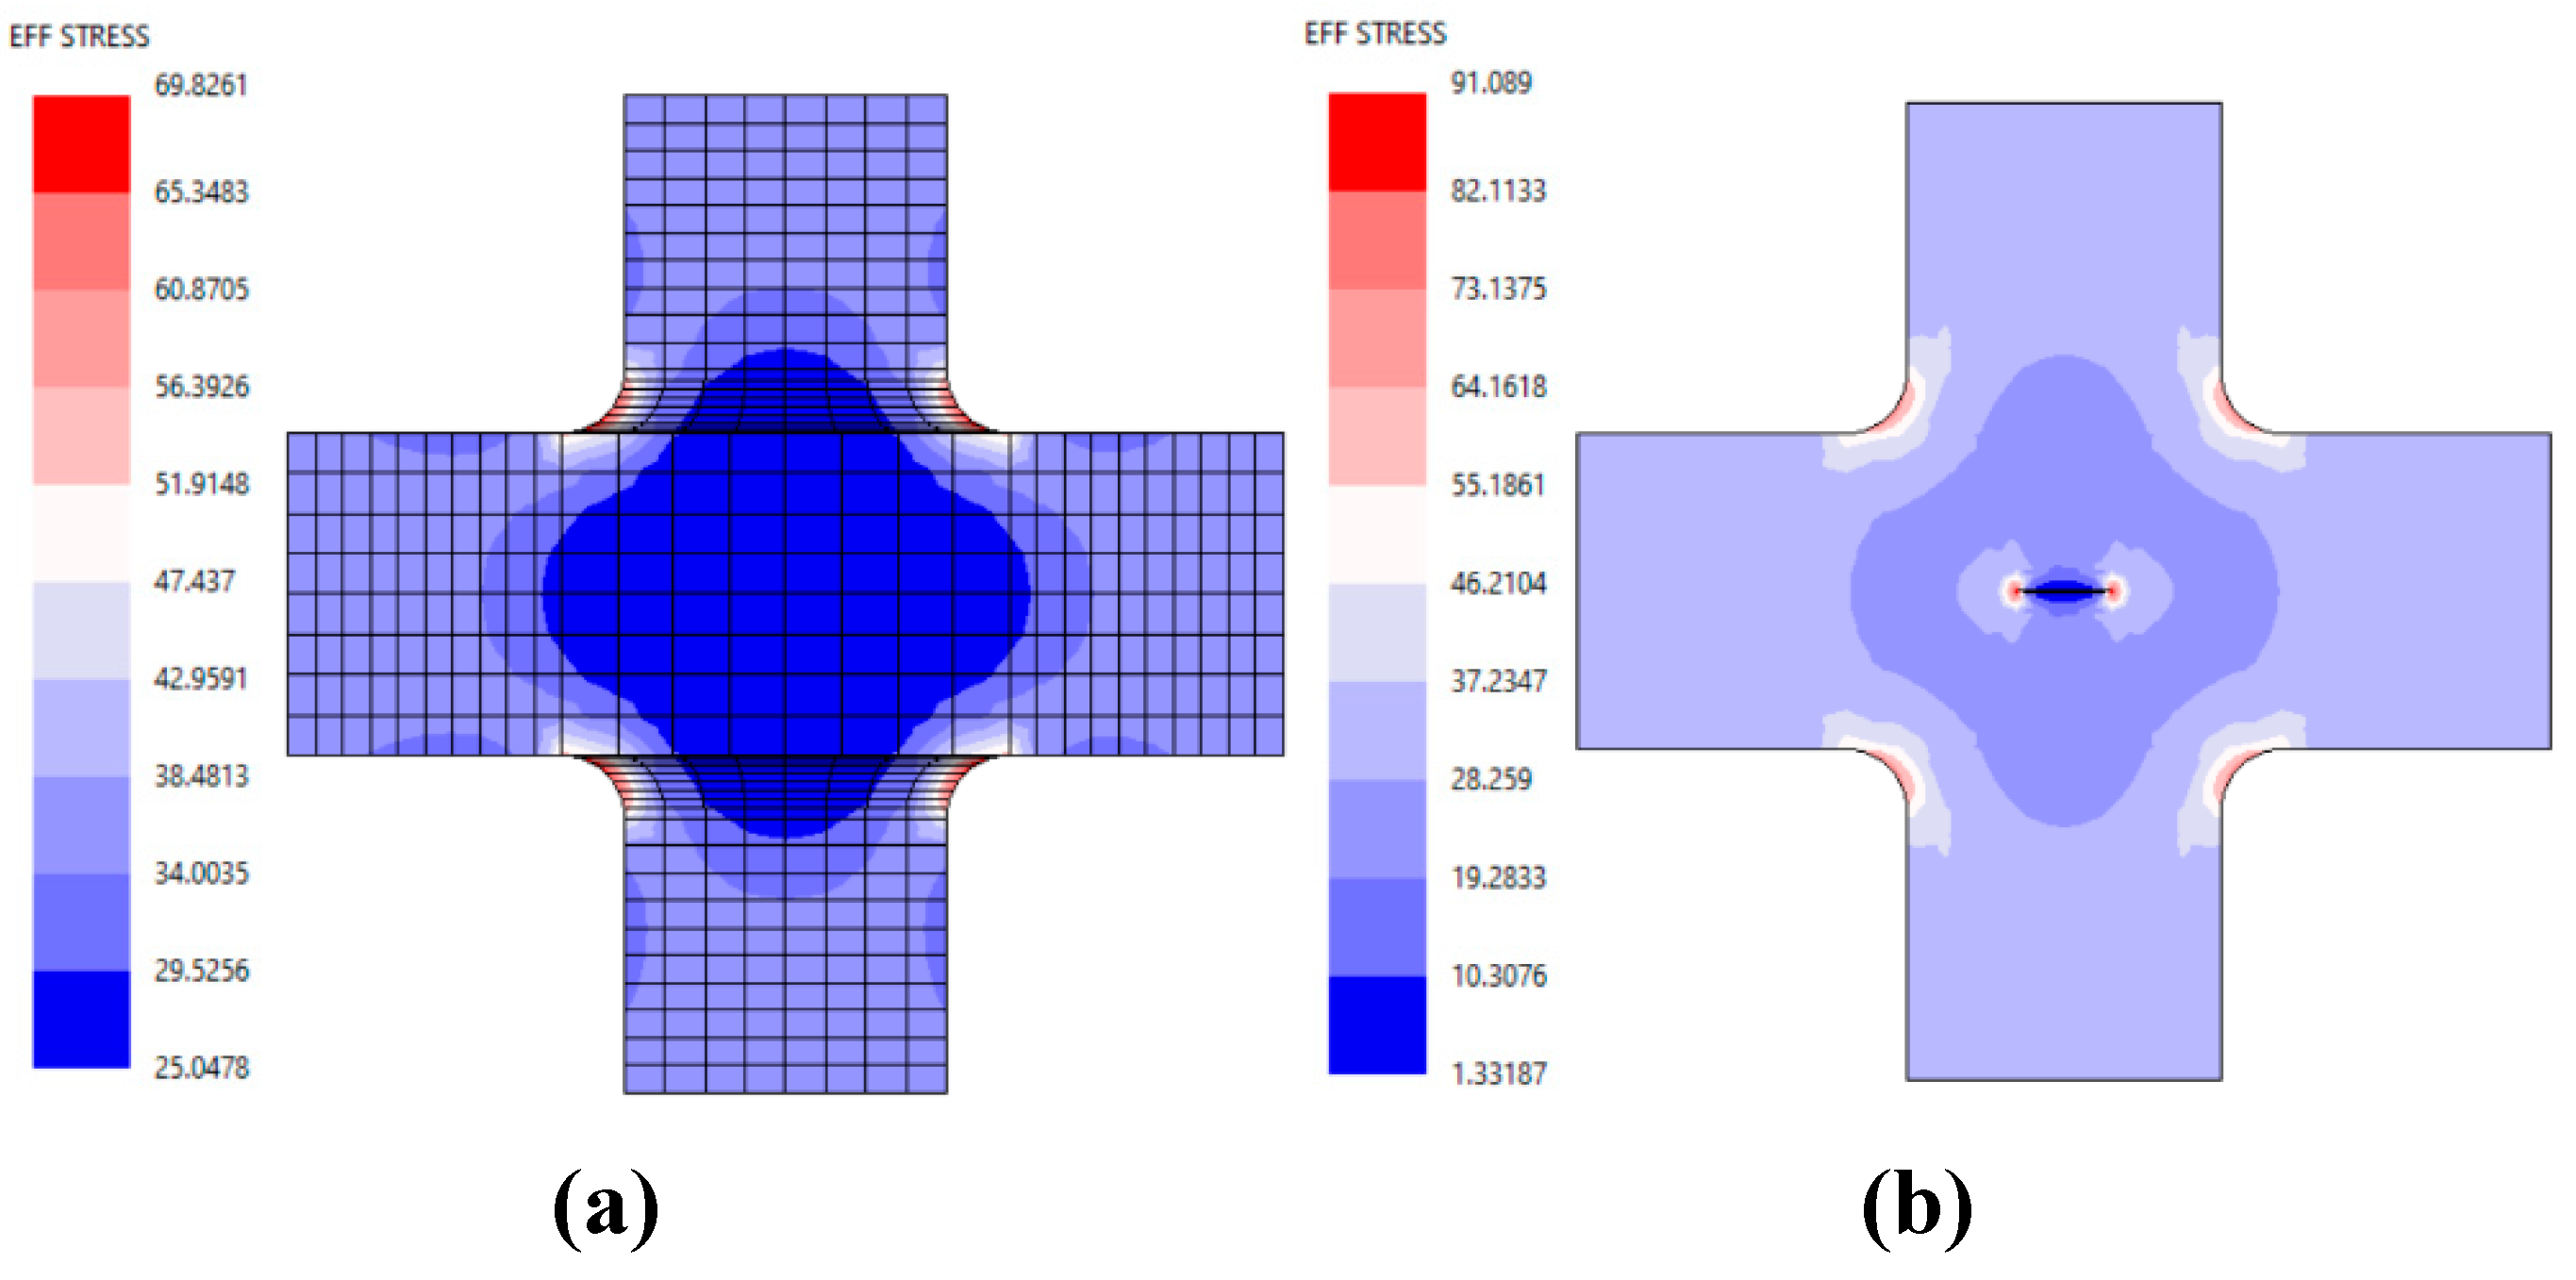
Figure 4.
The effect of stress ratio on the stress distribution at the crack tip. The nonlinear behavior are shows for the maximum stress at the tip.
Figure 4.
The effect of stress ratio on the stress distribution at the crack tip. The nonlinear behavior are shows for the maximum stress at the tip.
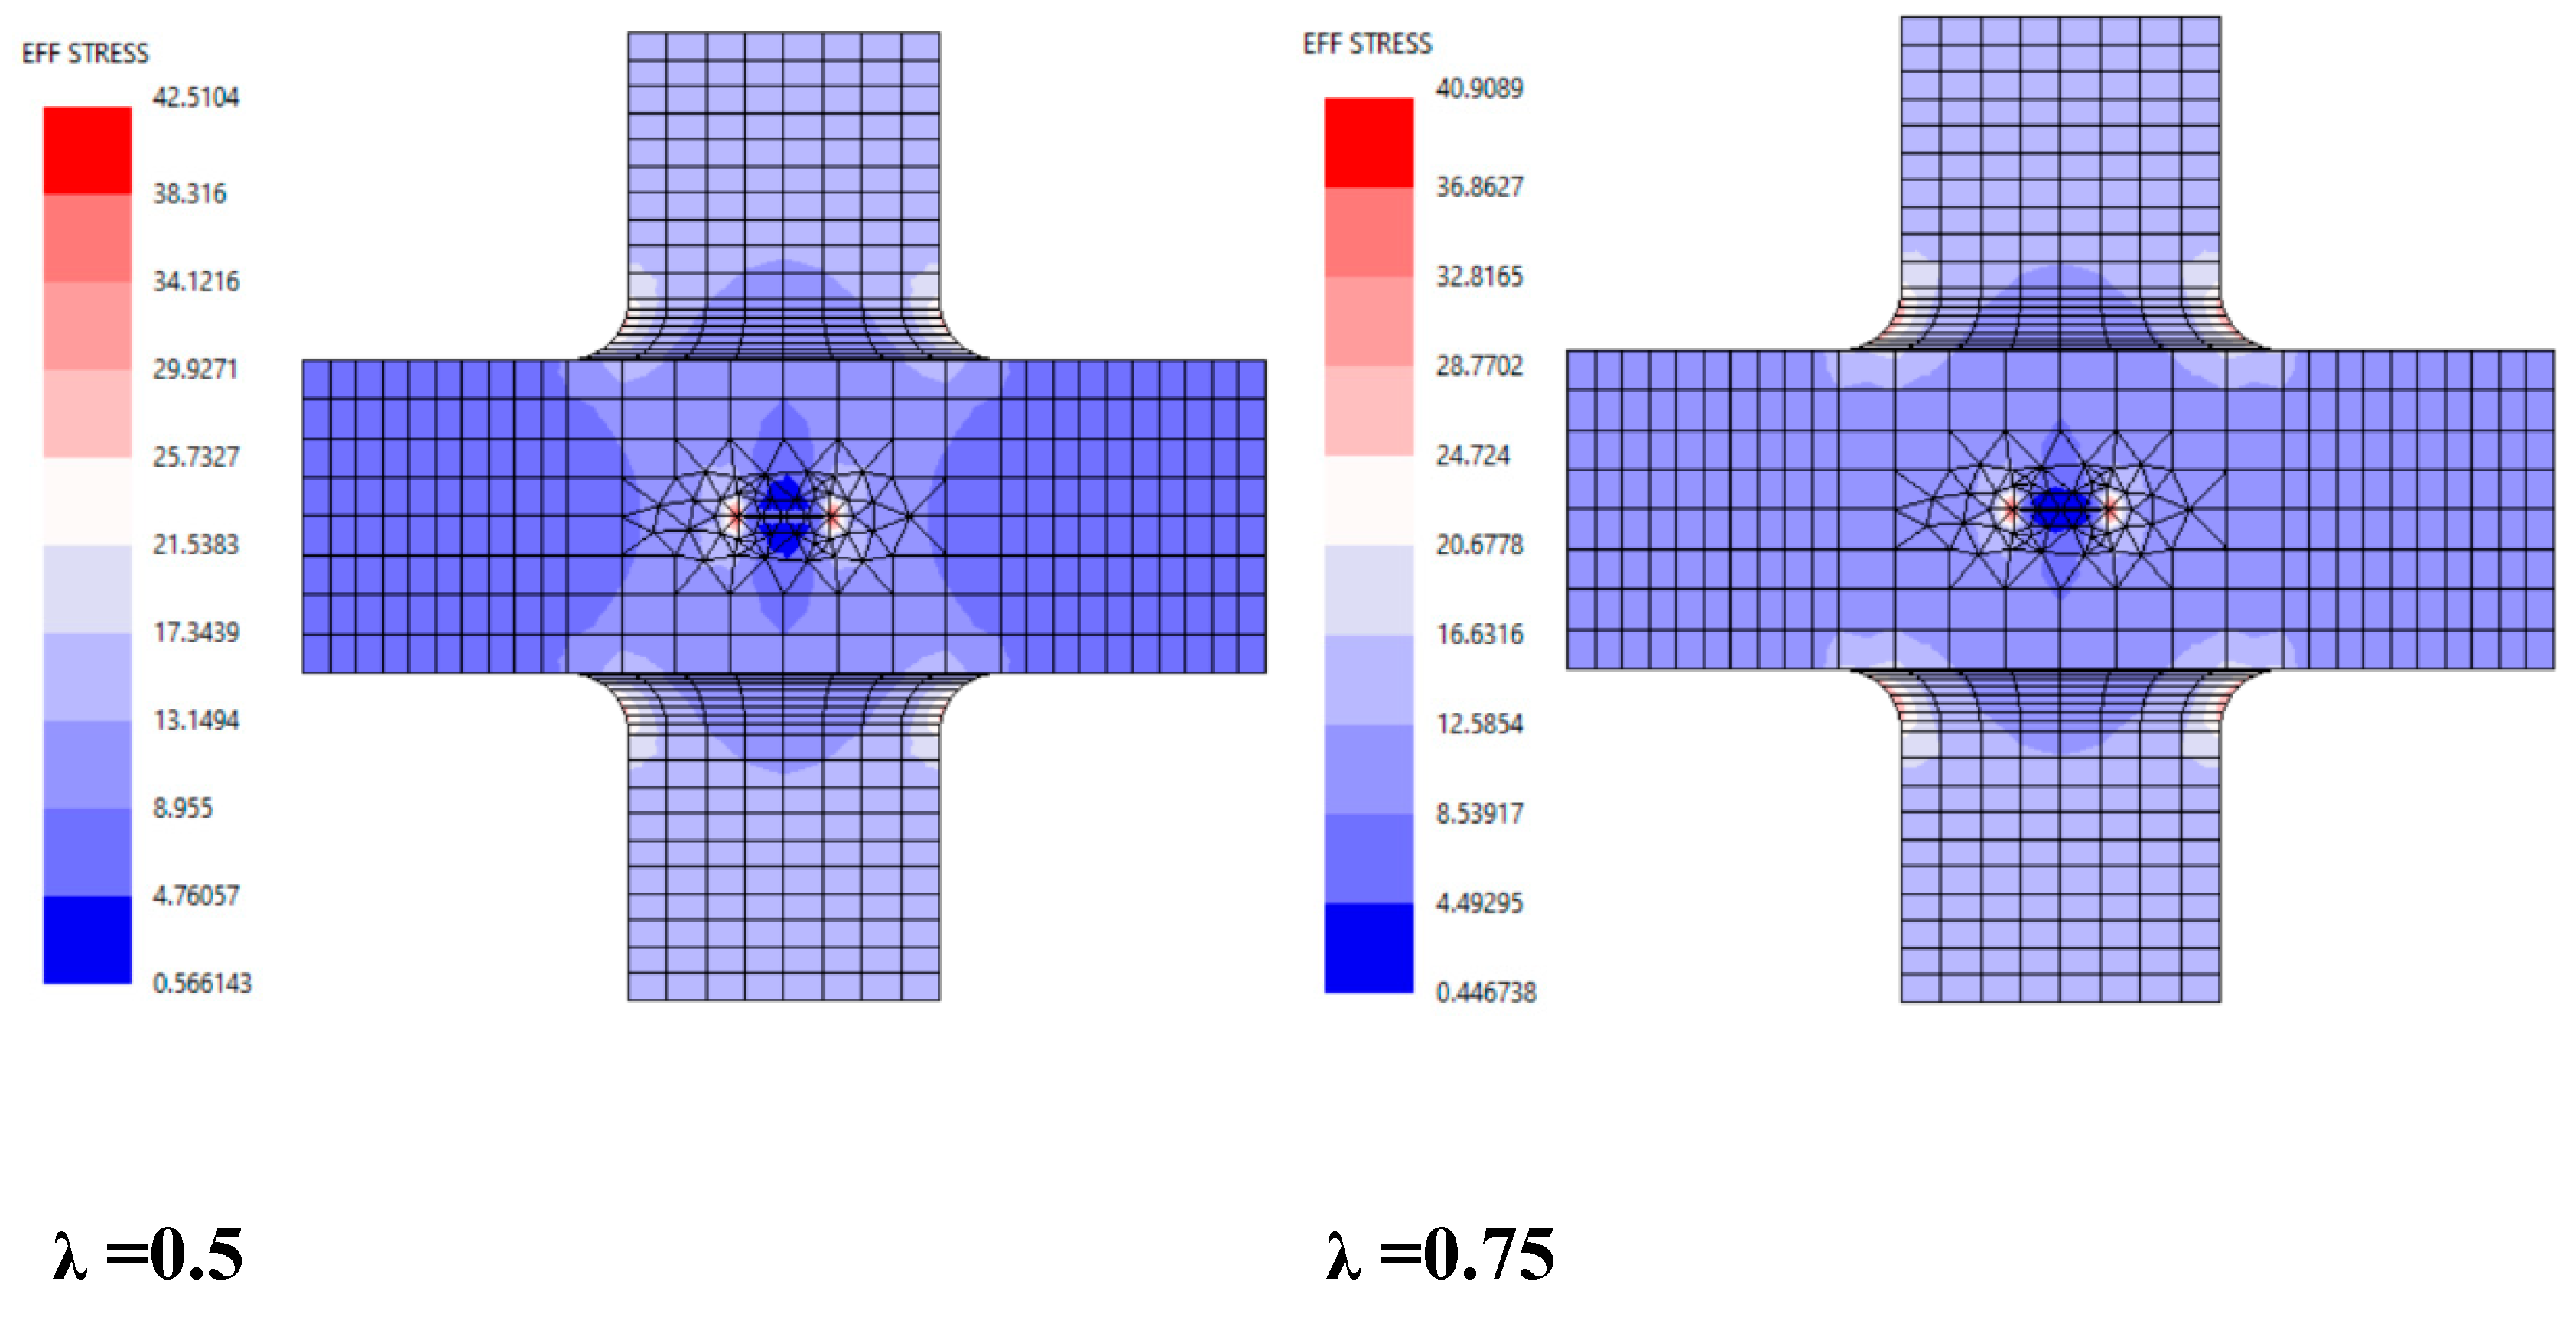
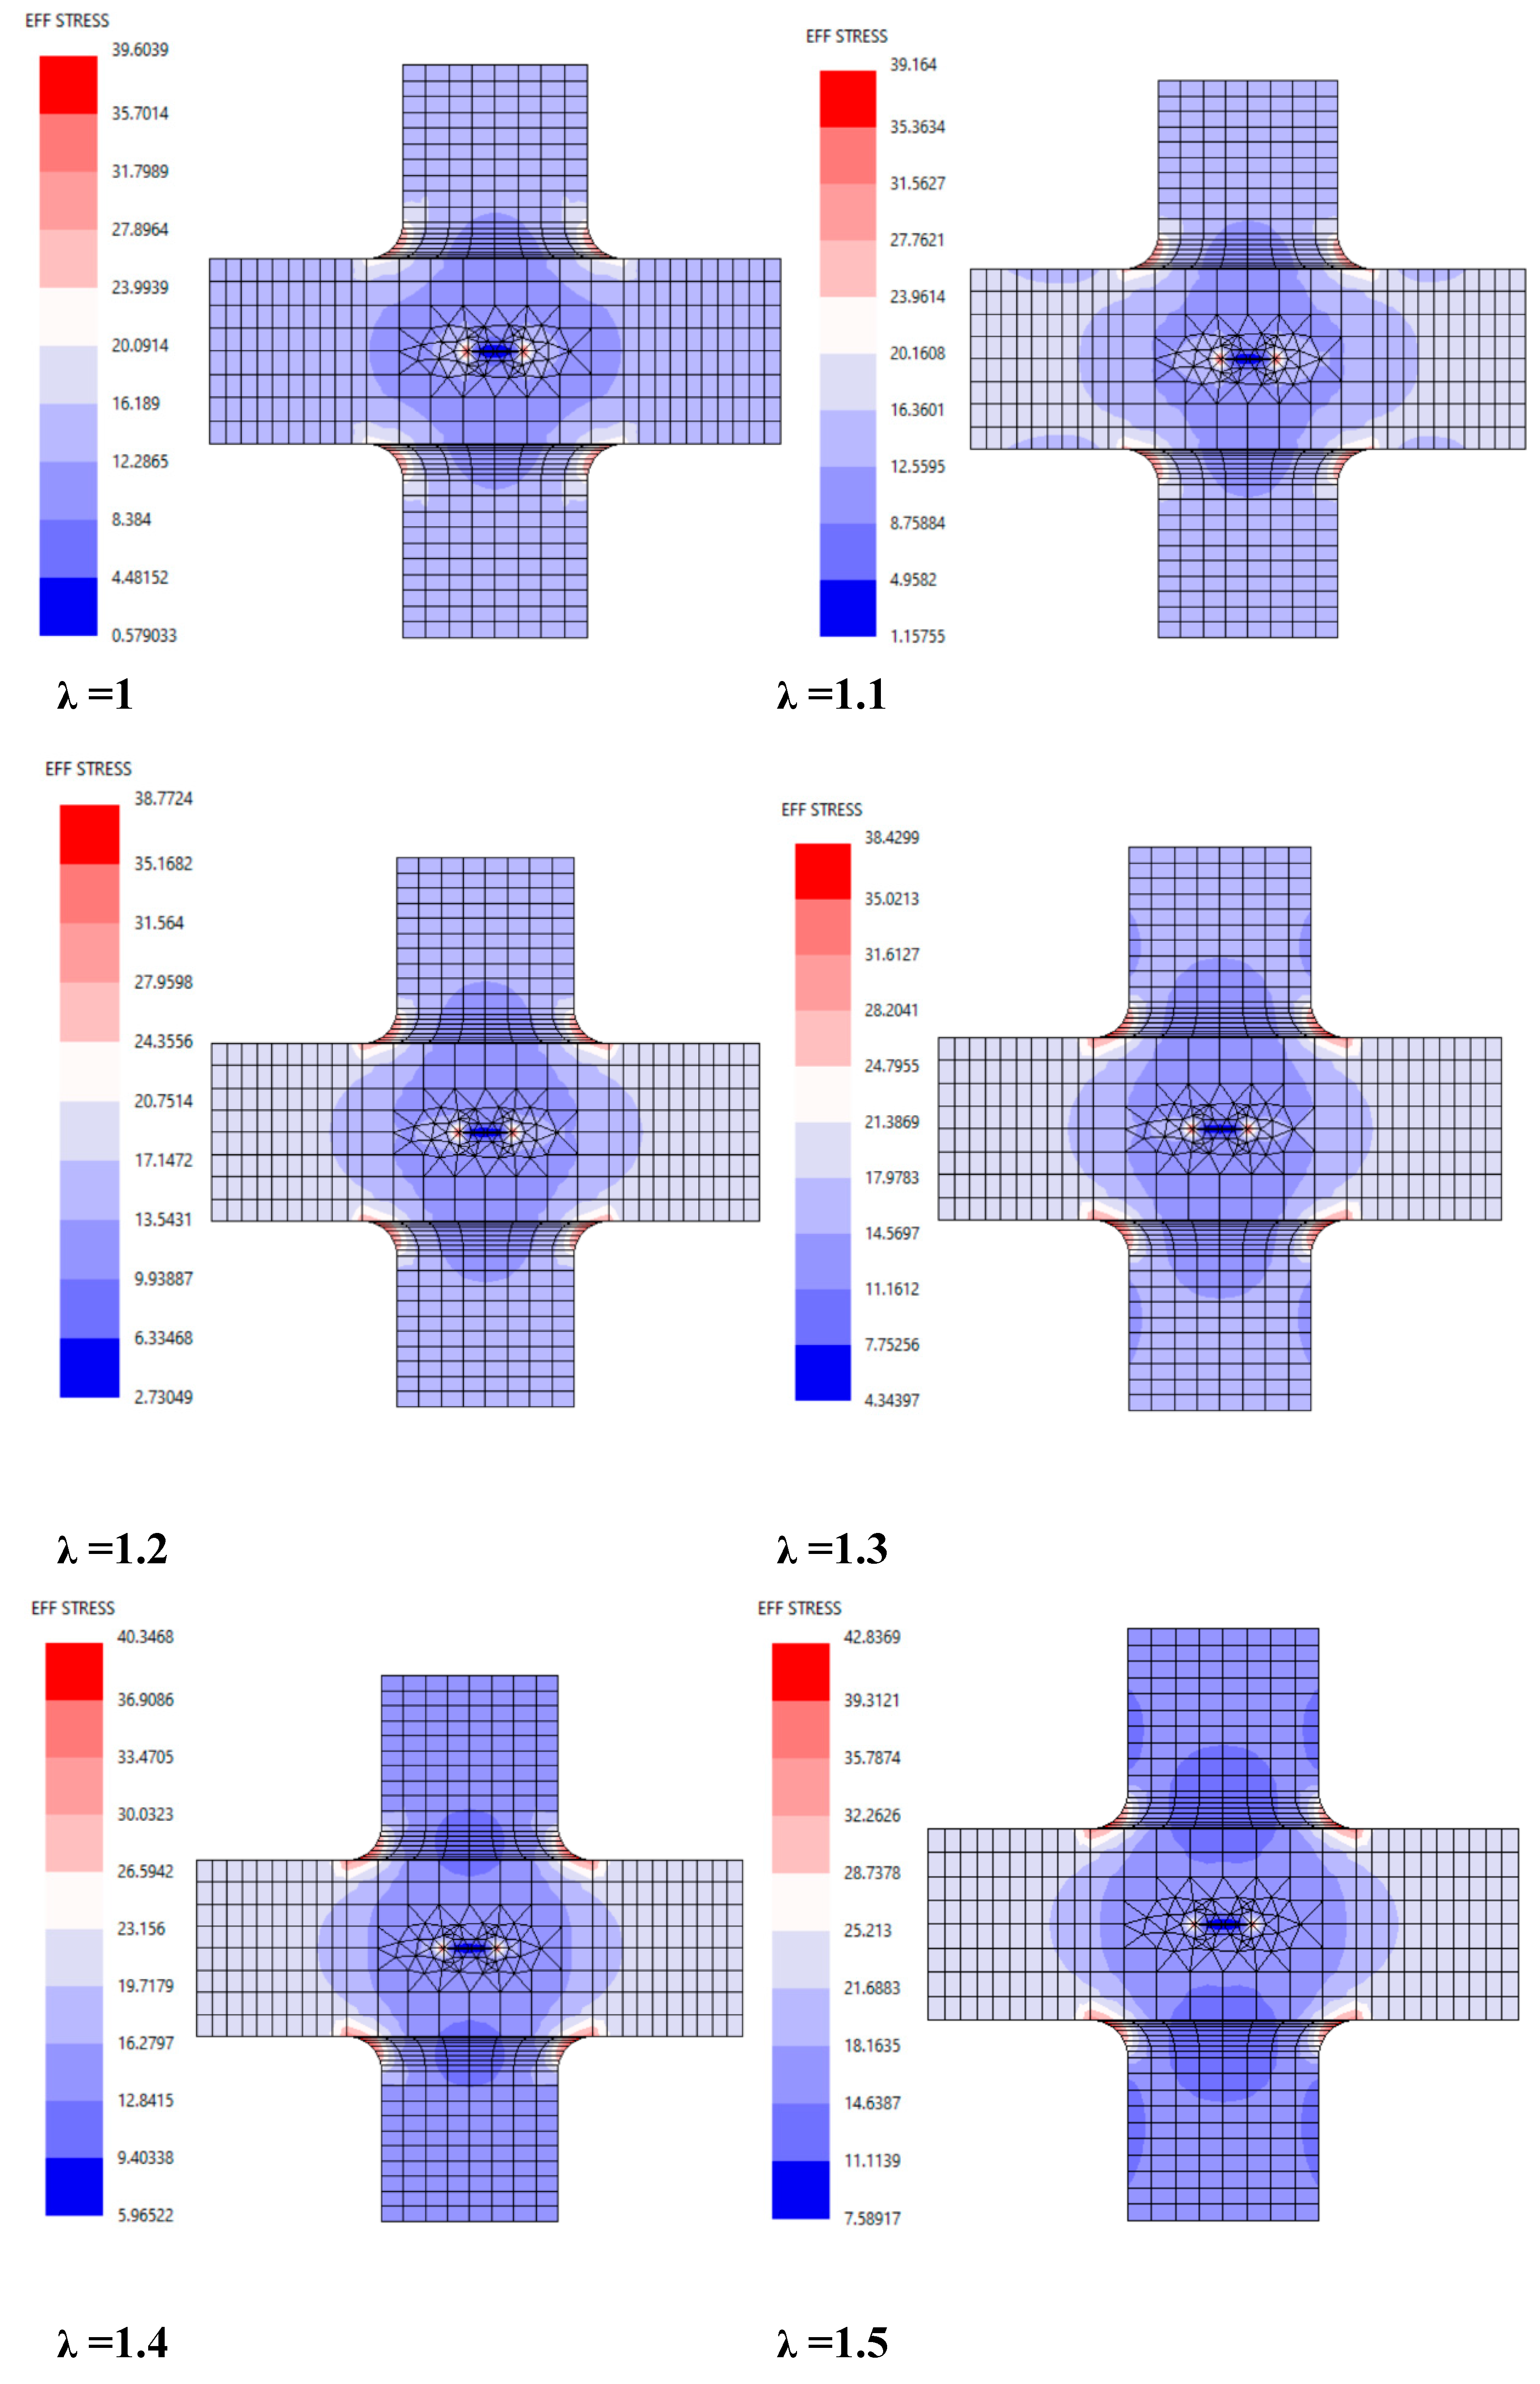
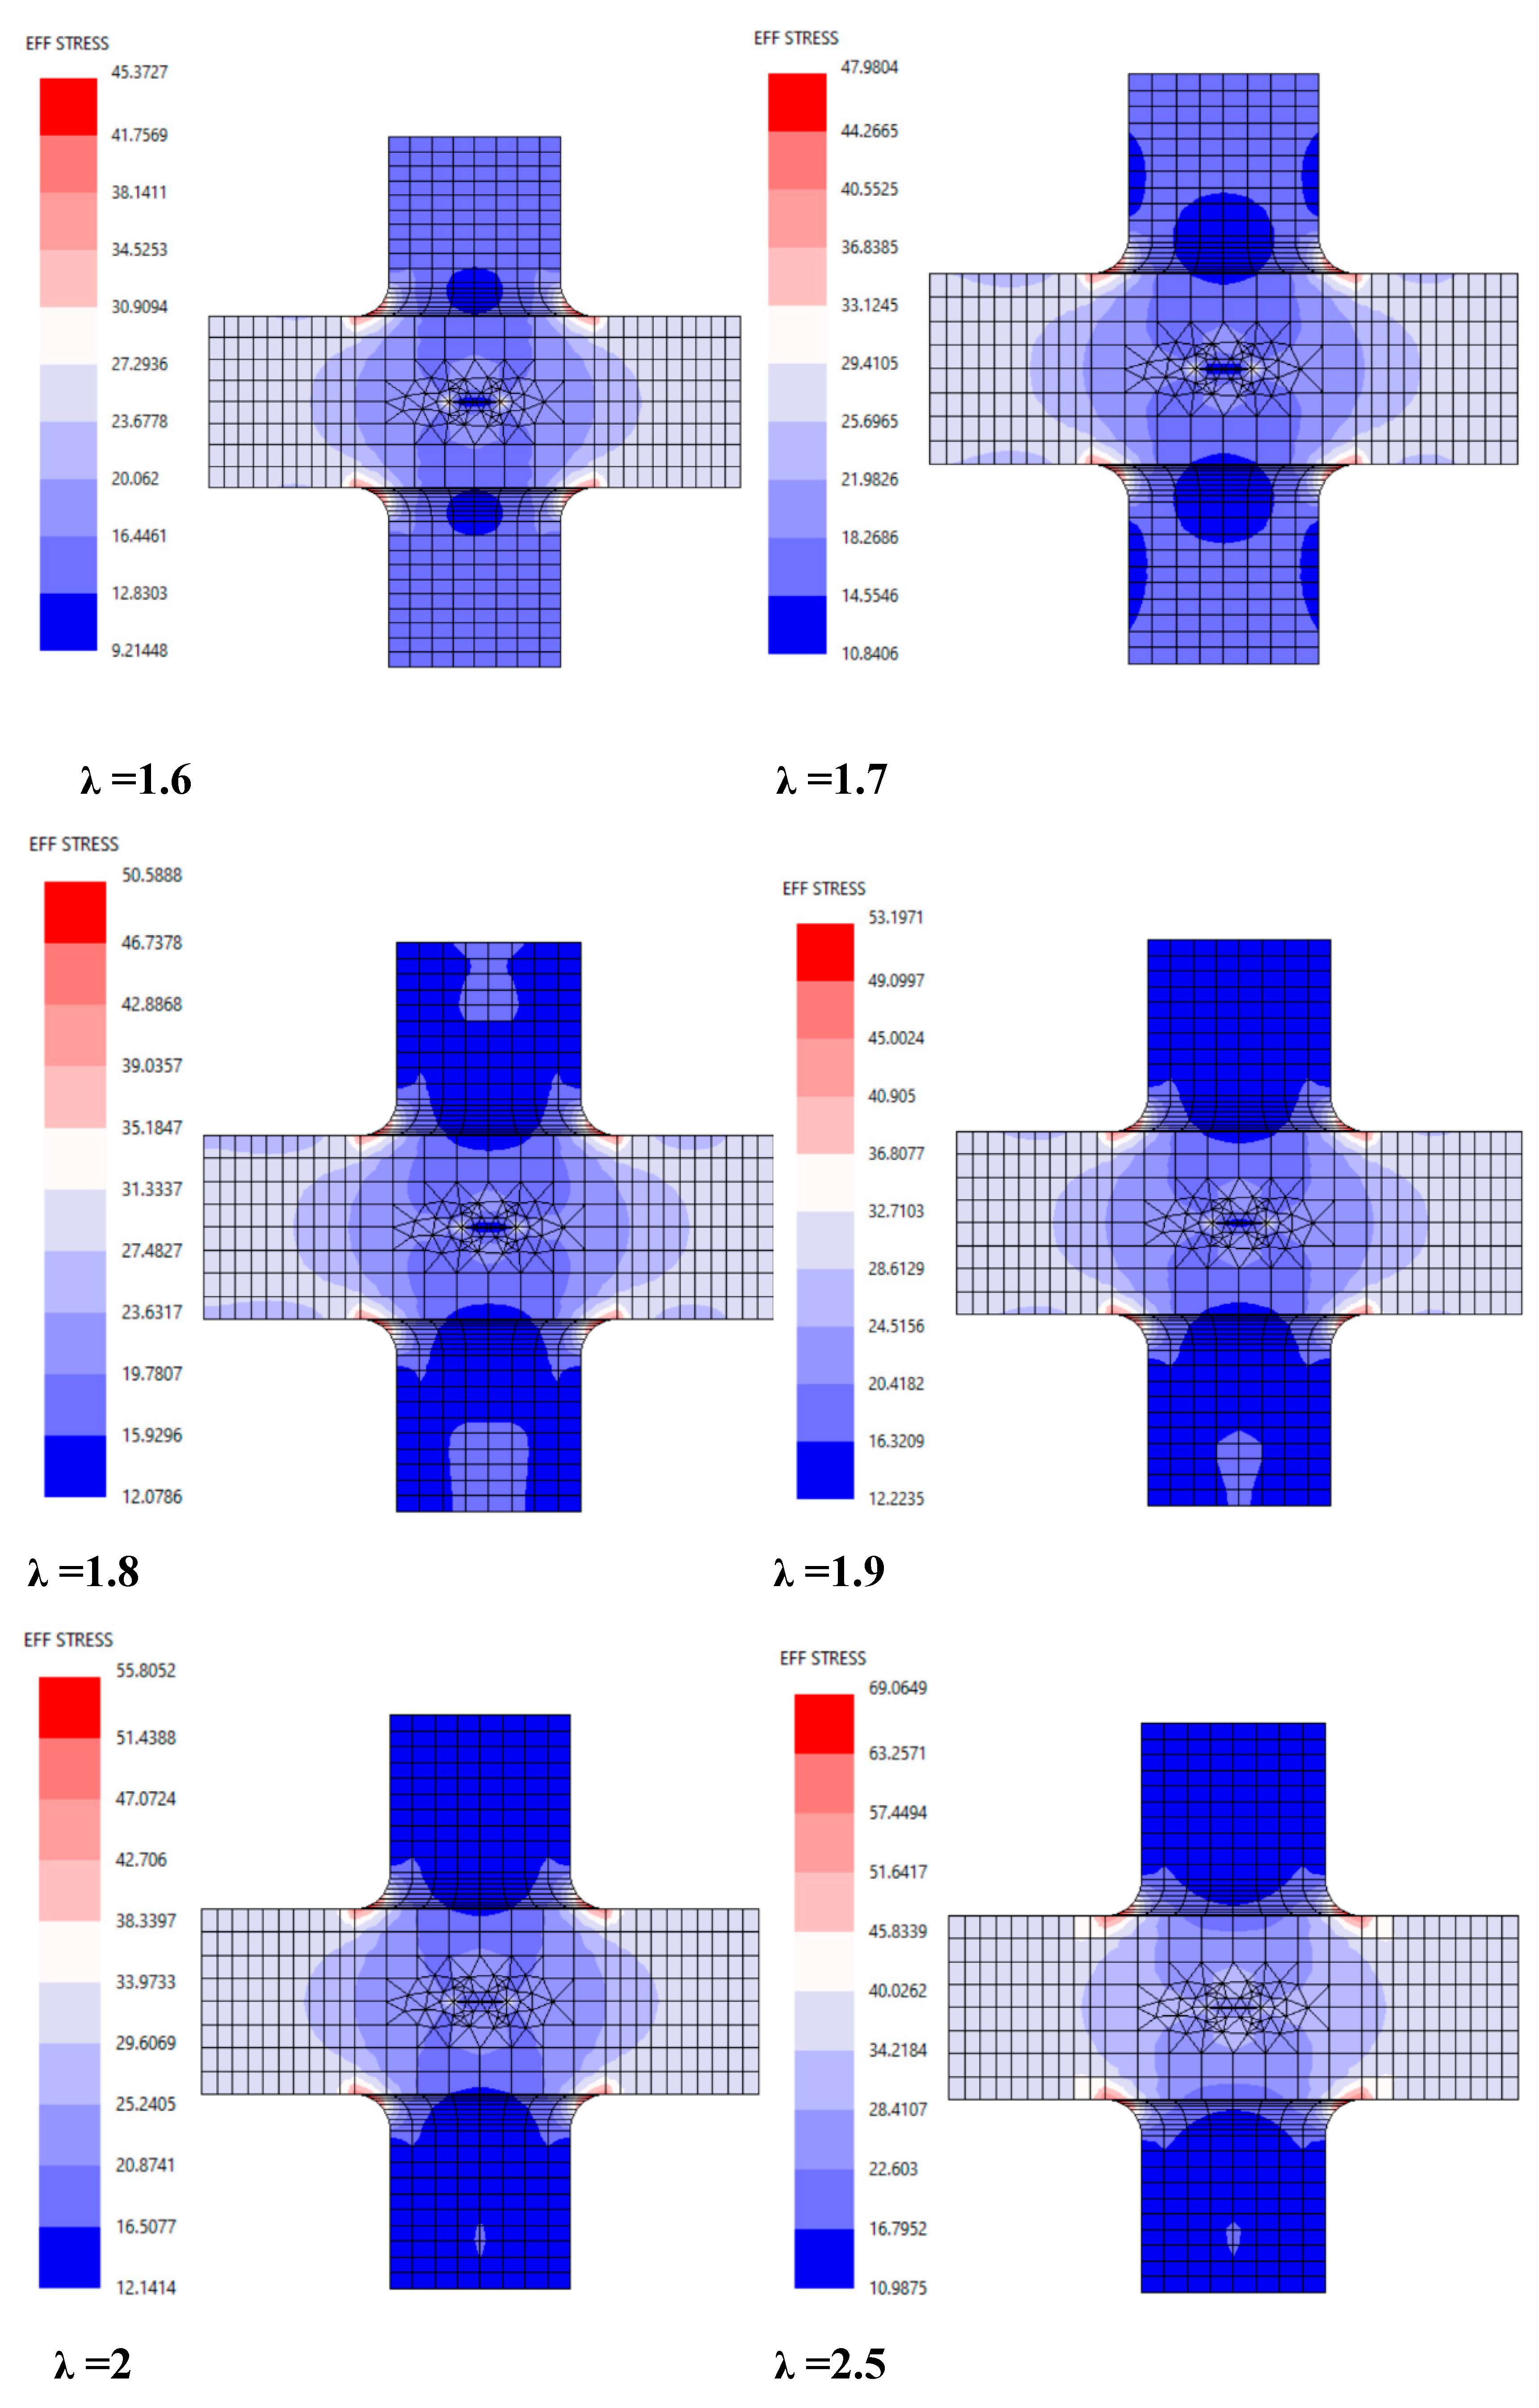
Figure 5.
The crack path for differ stress ratio showing how the biaxial stress can develop a mix mode CP, ∆a=5 mm.
Figure 5.
The crack path for differ stress ratio showing how the biaxial stress can develop a mix mode CP, ∆a=5 mm.
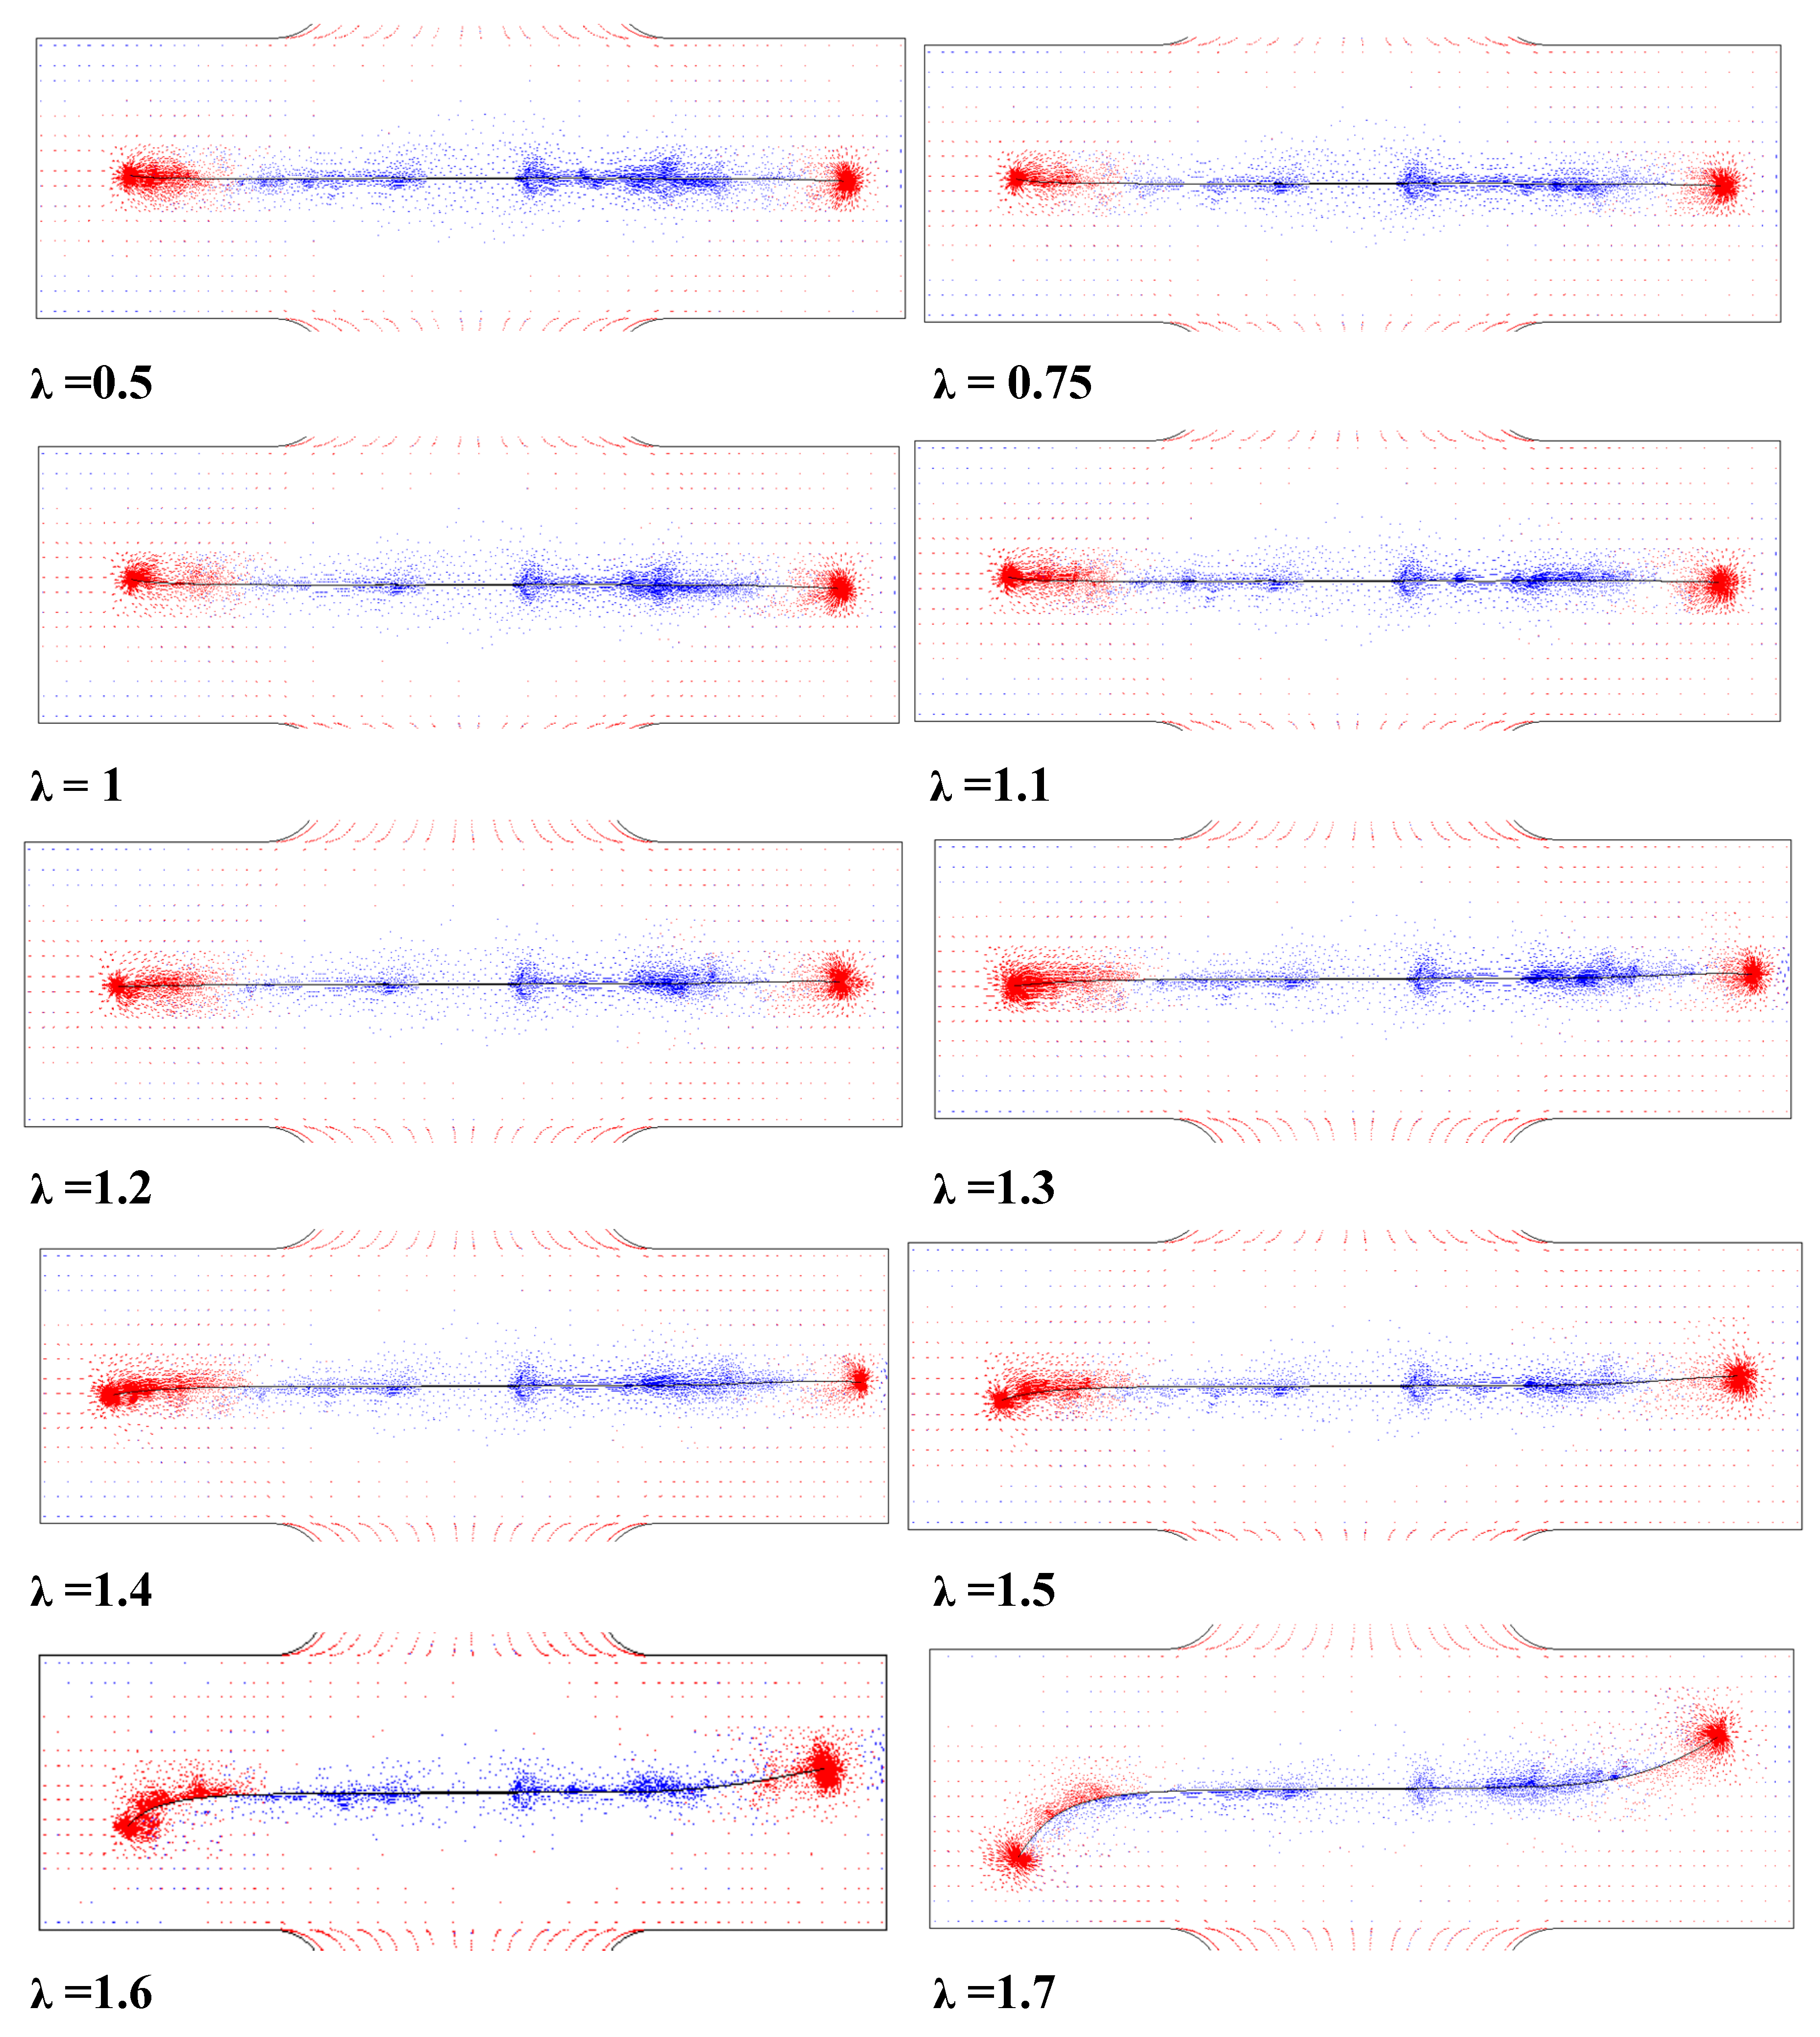
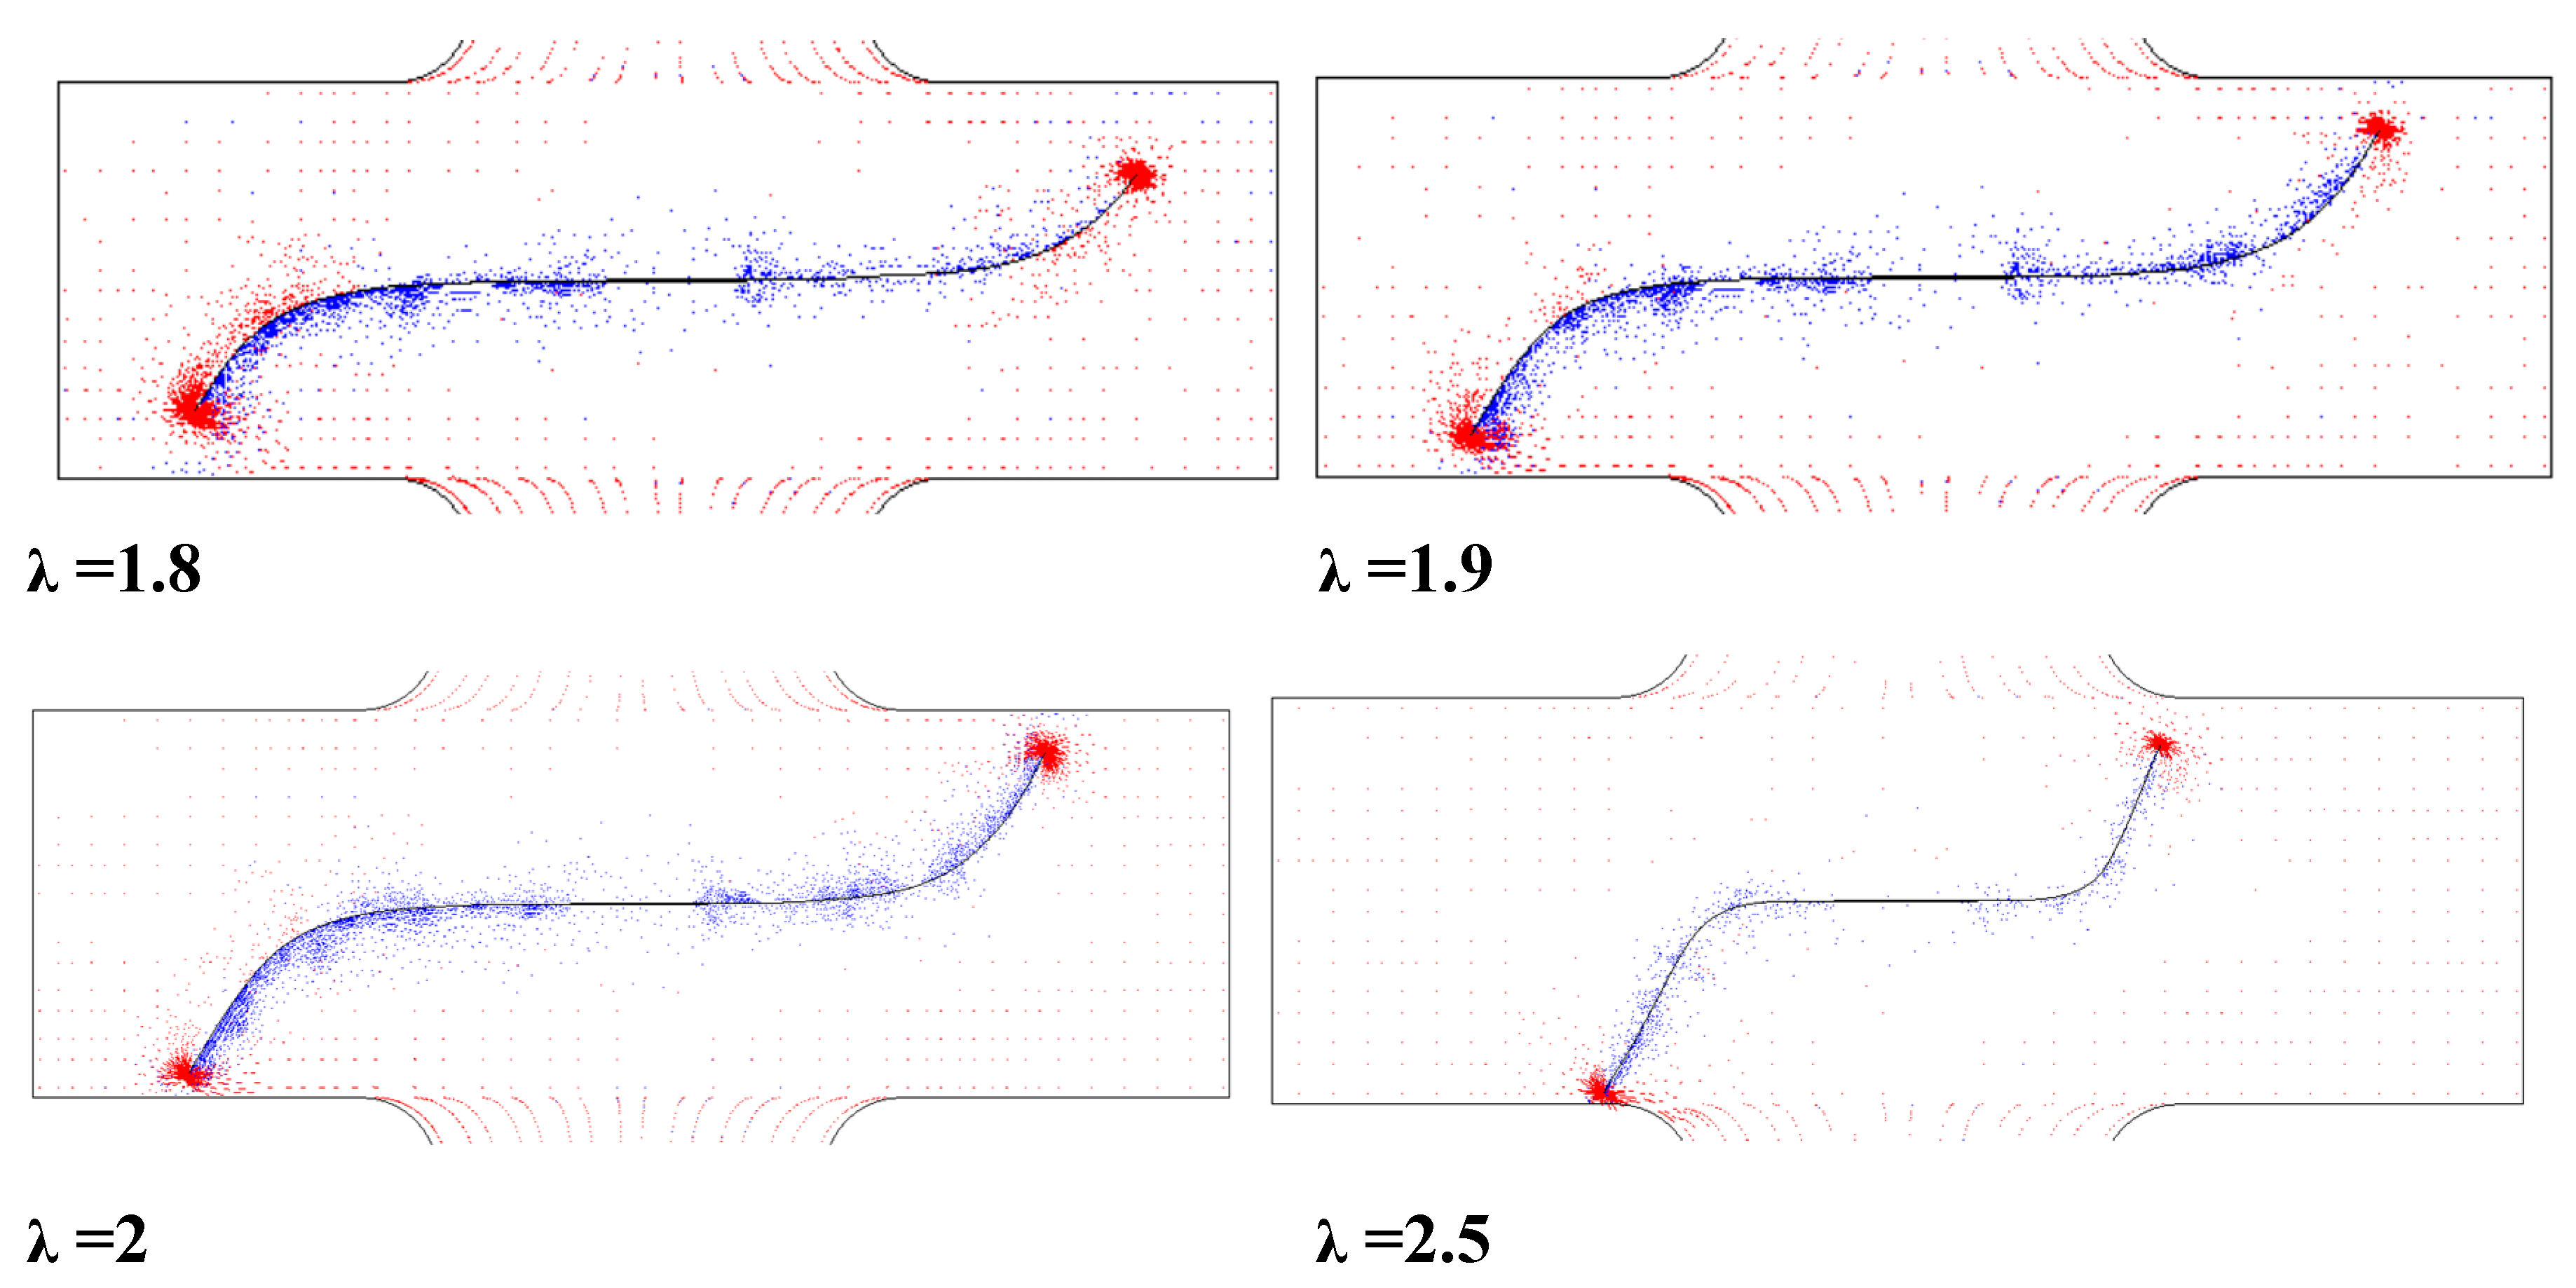
Figure 6.
Variation of SIF with crack length for biaxial ratios λ=0.5-2; specimen thickness=2.3 mm.
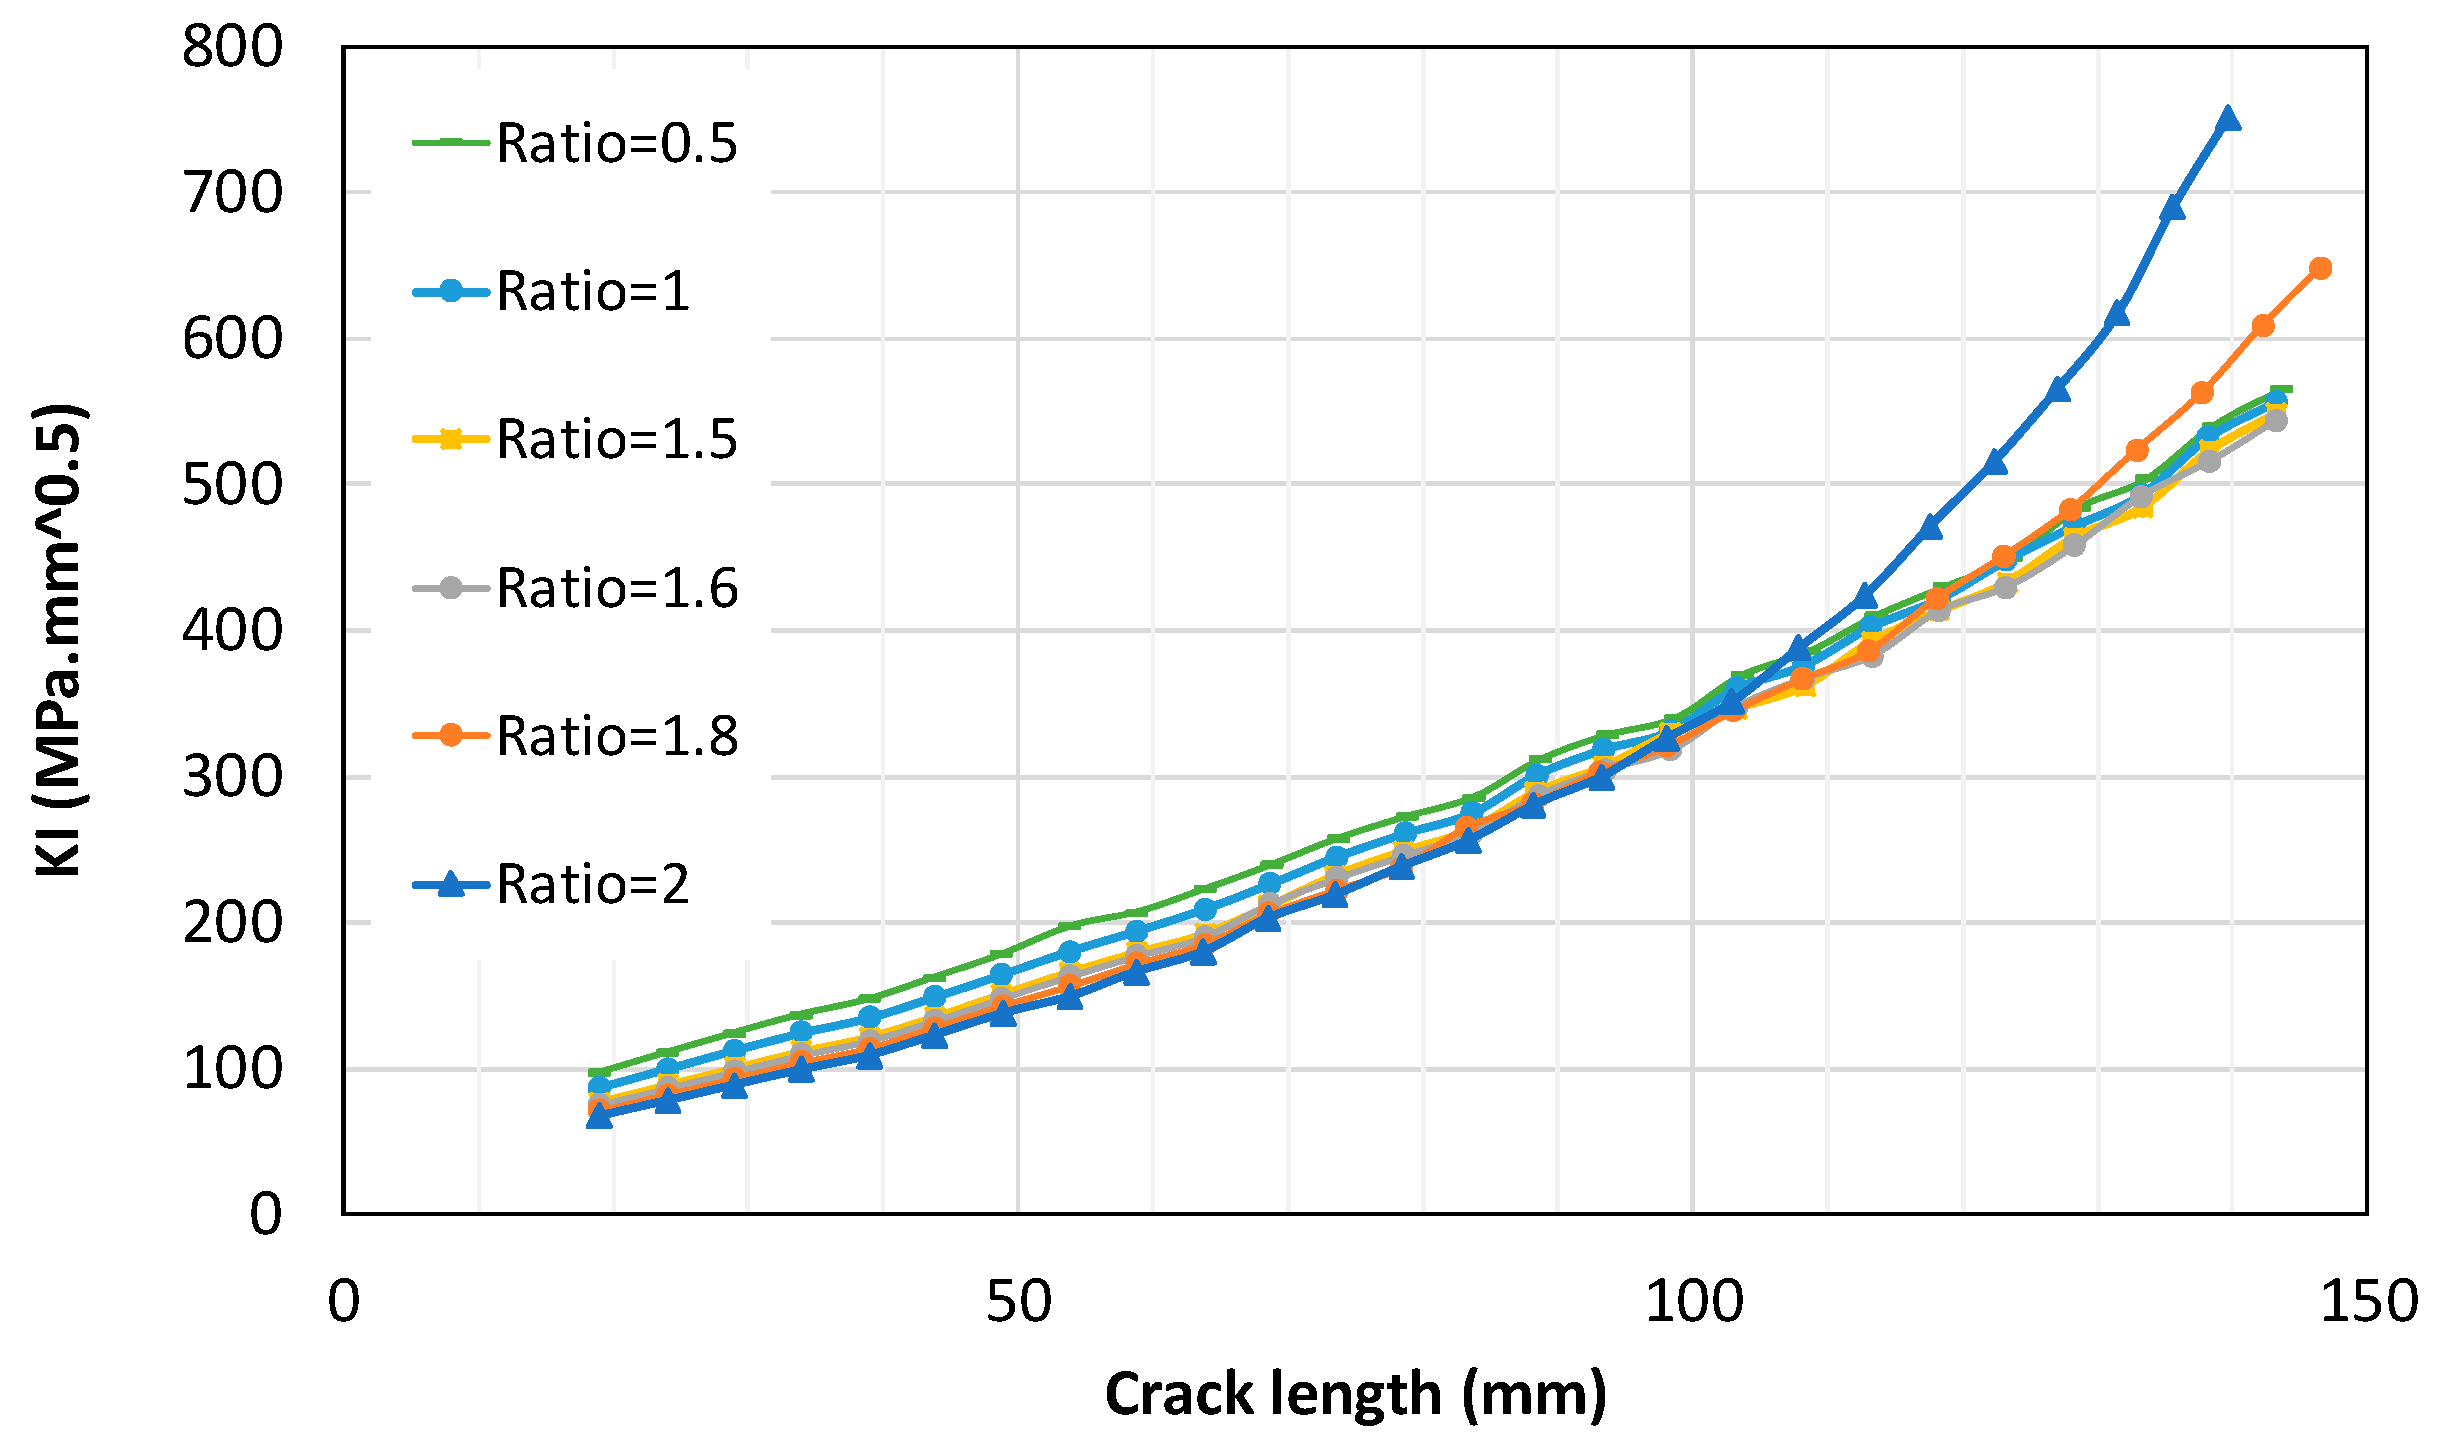
Figure 7.
The changing in crack tip stress according to the biaxial ratio λ=0.5-2.5.
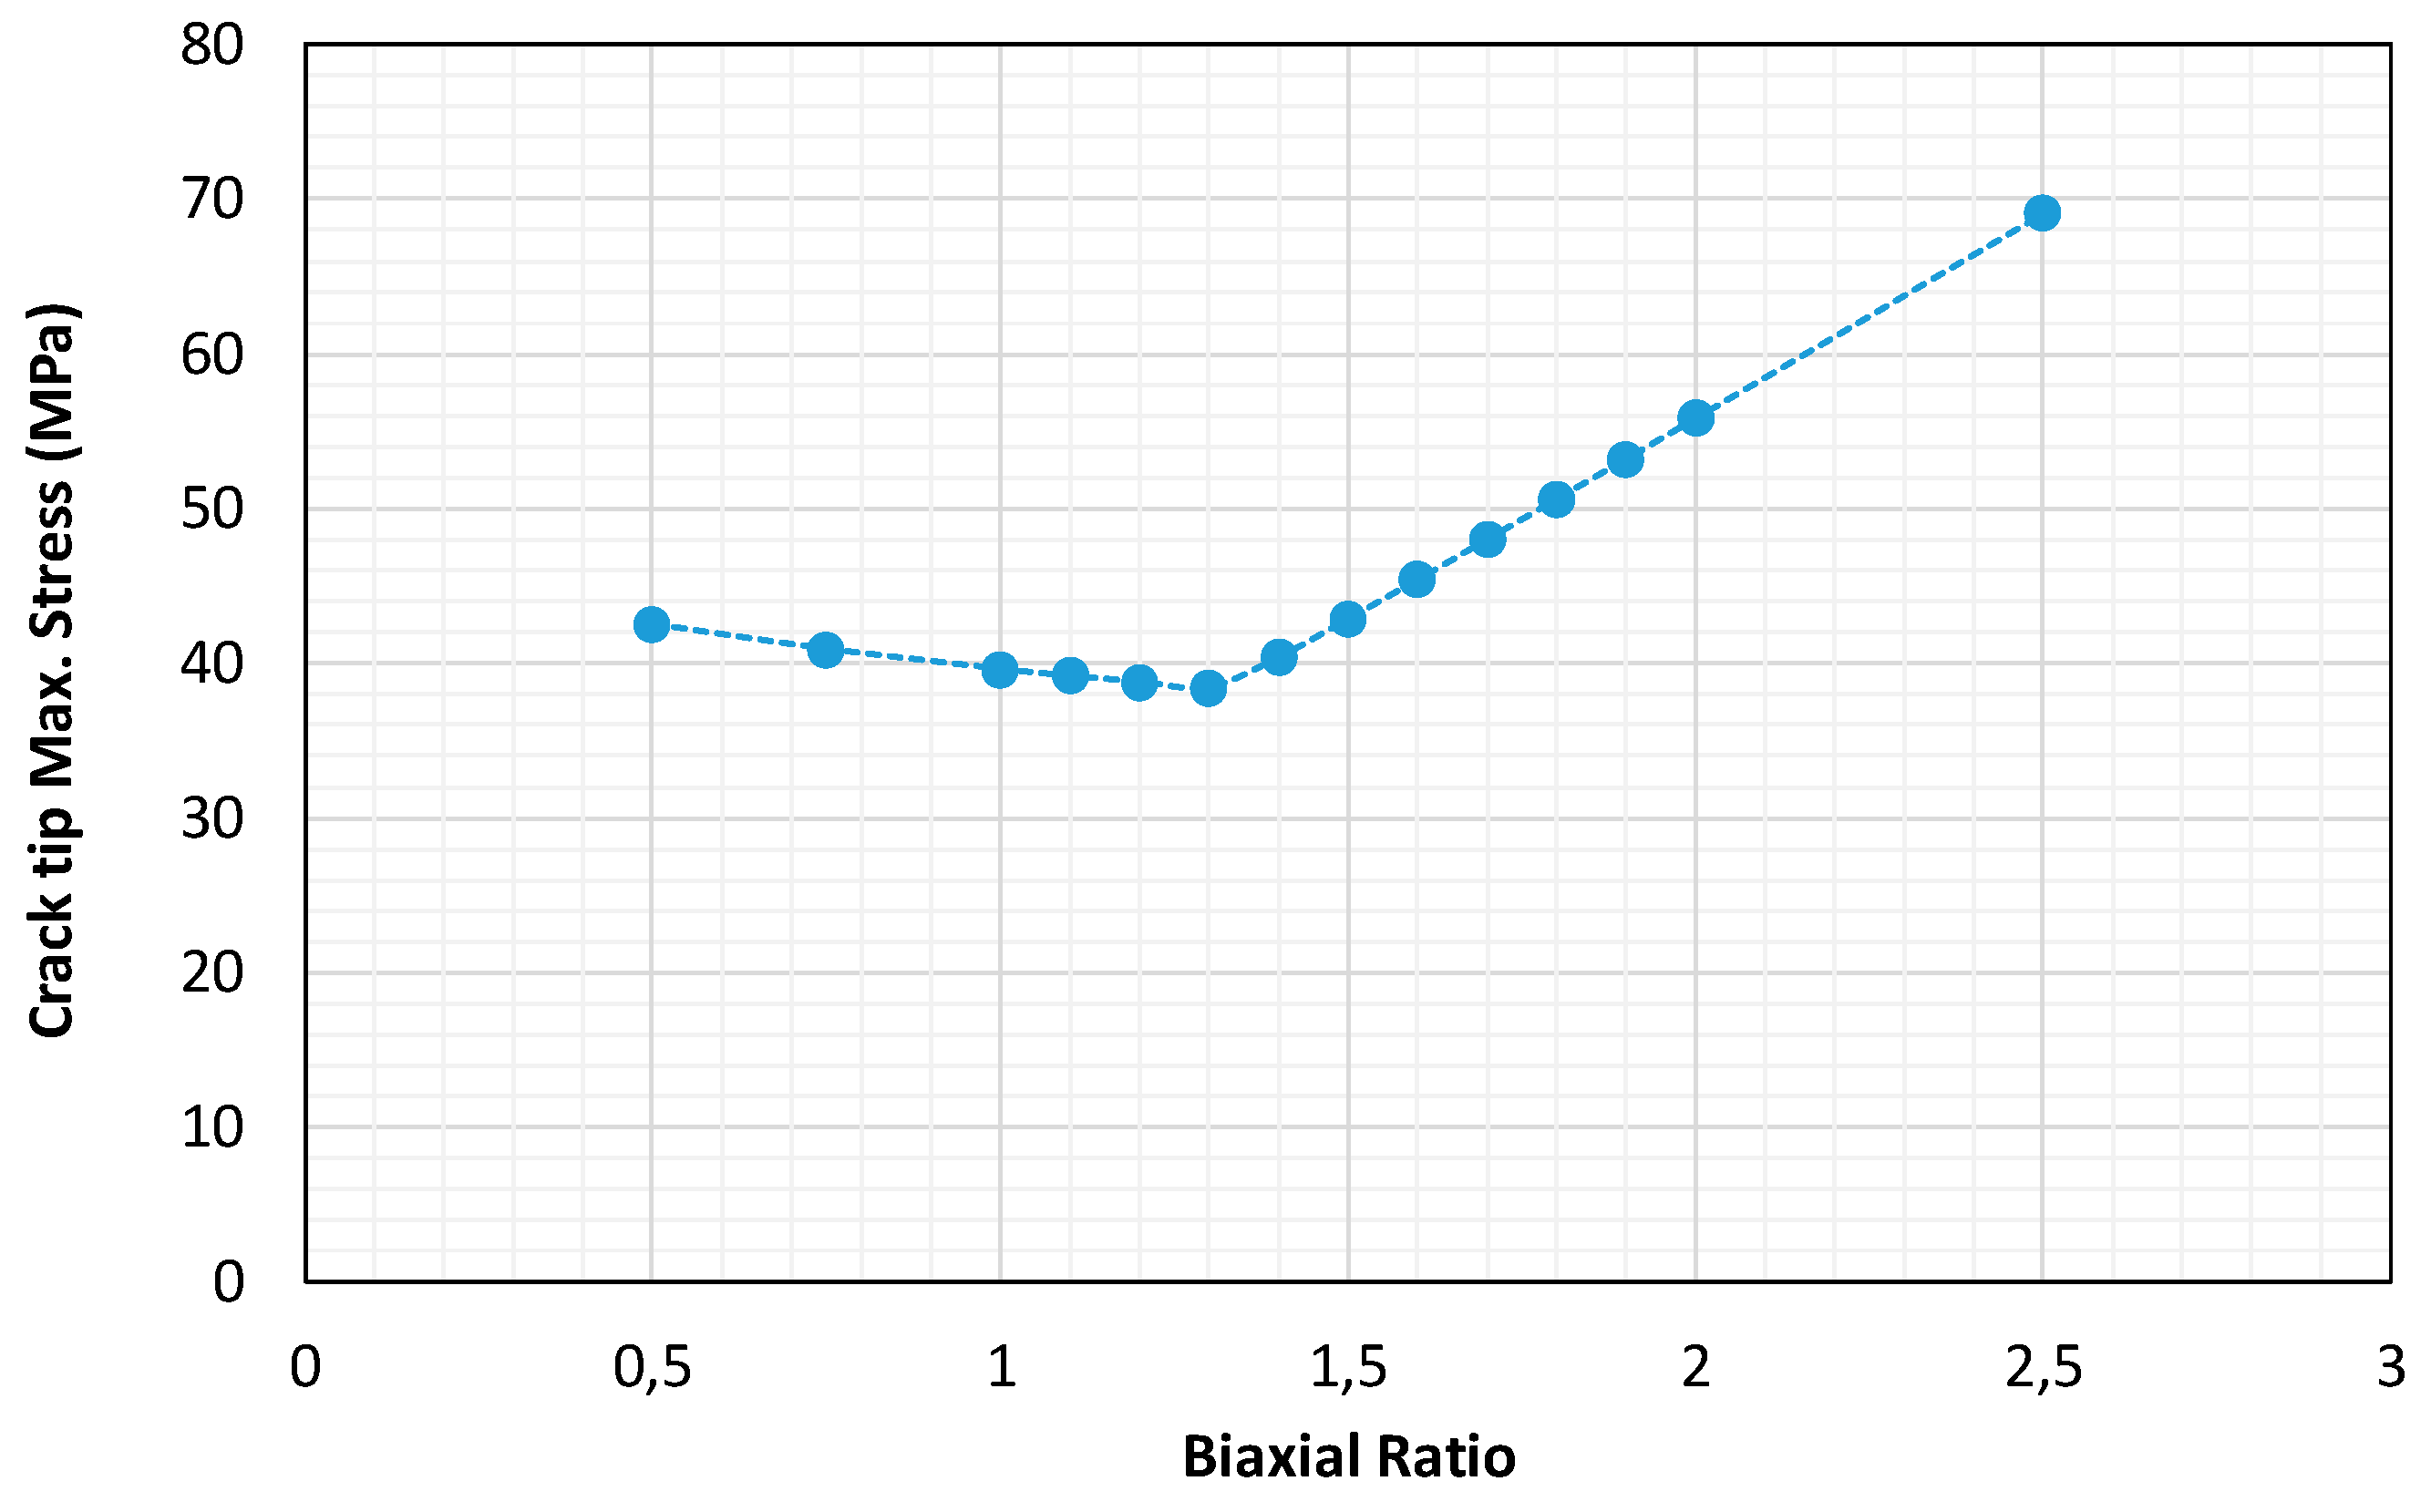
Figure 8.
(a), and (b) Comparison of the experimental and FE model results from Ref. [16] with the current model at λ=3.
Figure 8.
(a), and (b) Comparison of the experimental and FE model results from Ref. [16] with the current model at λ=3.
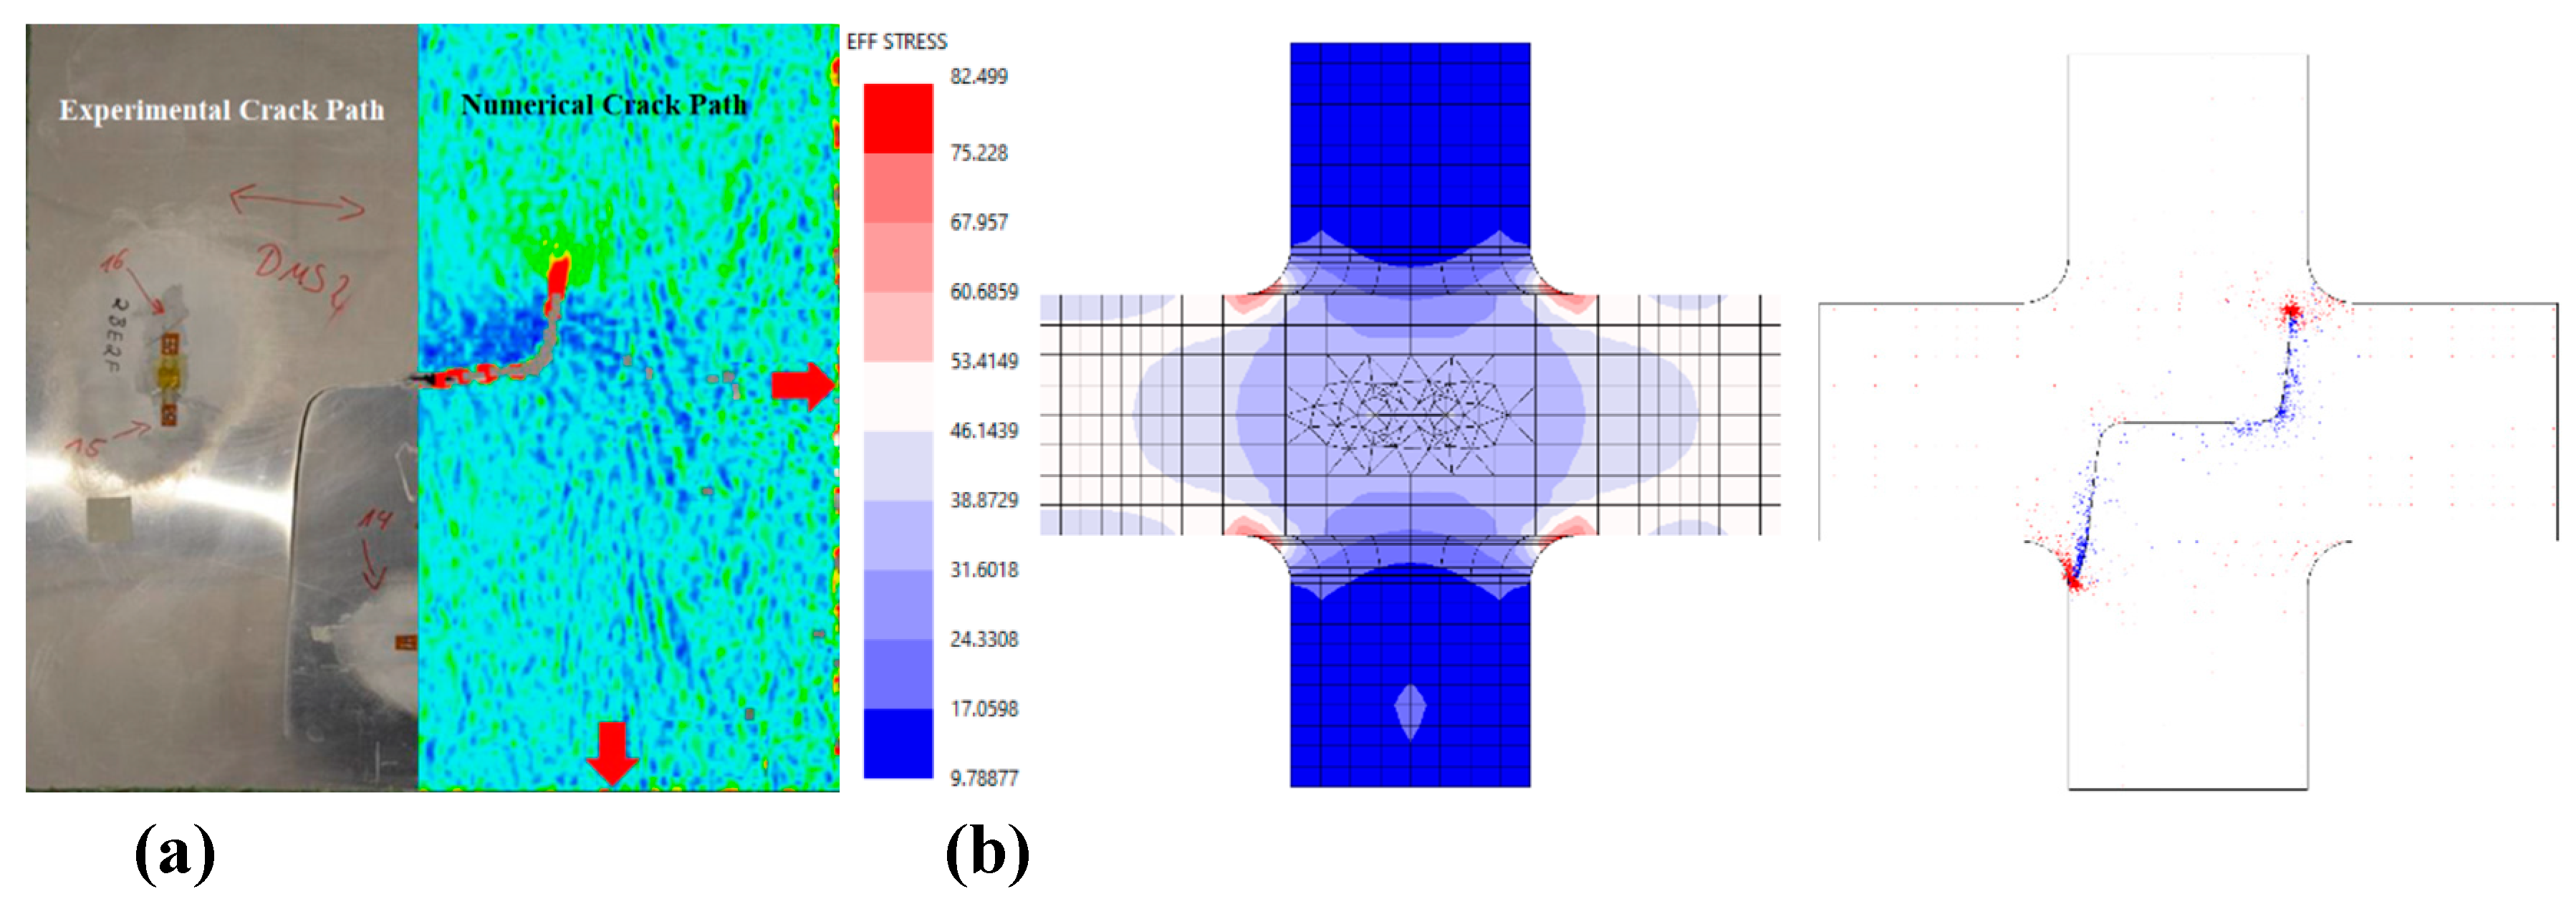
Figure 9.
Validation of current approach at λ=3 as compared with previous numerical and experiment crack path [16].
Figure 9.
Validation of current approach at λ=3 as compared with previous numerical and experiment crack path [16].
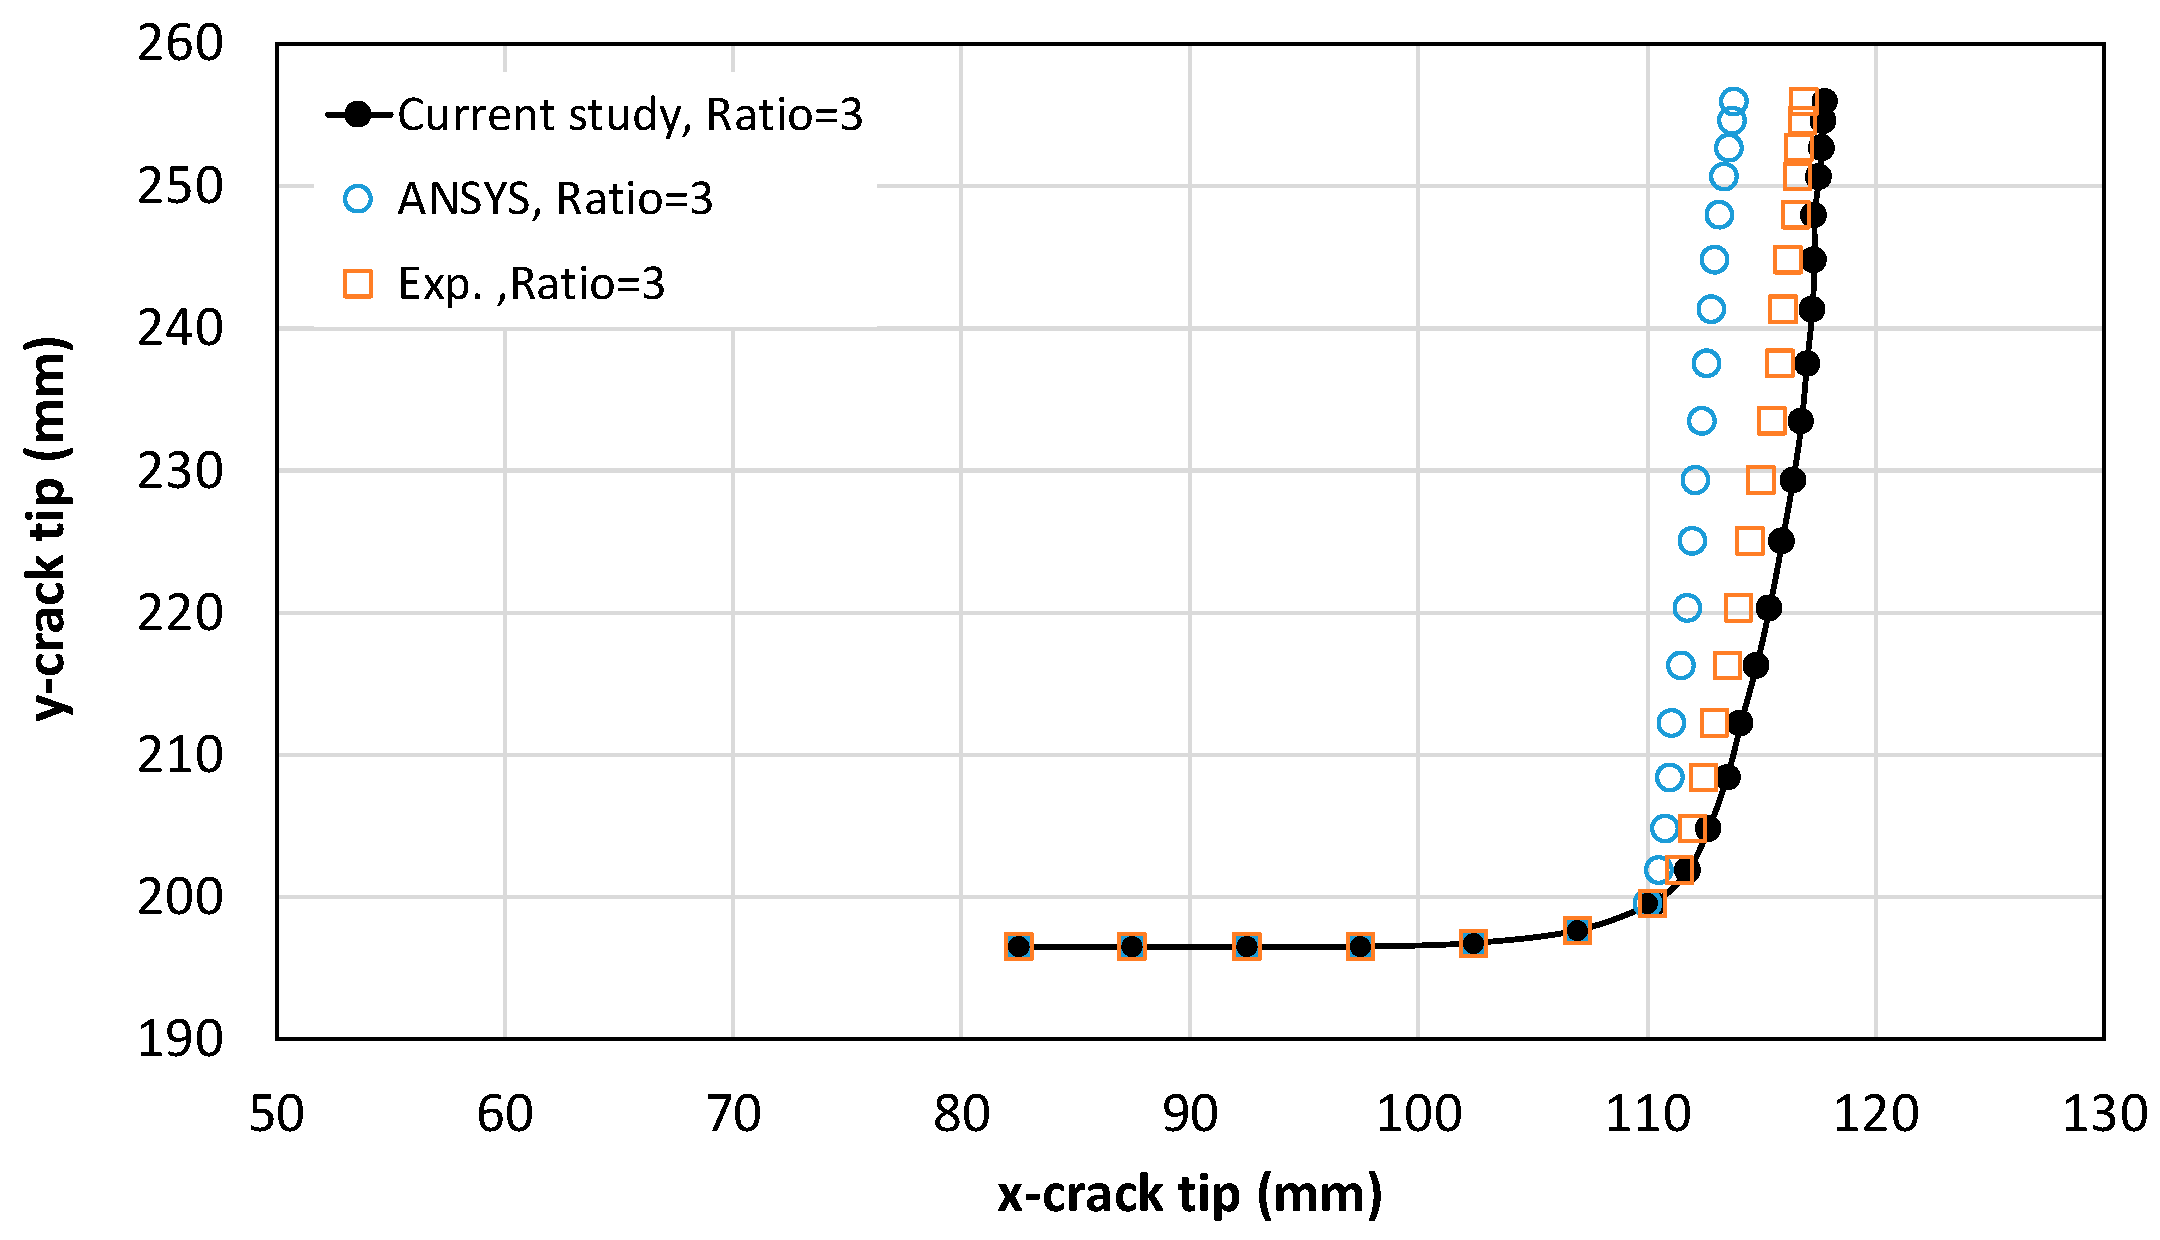
Figure 10.
Validation of crack growth at λ= 2; (a) experimental results from Ref. [17]; (b) current FE model.
Figure 10.
Validation of crack growth at λ= 2; (a) experimental results from Ref. [17]; (b) current FE model.
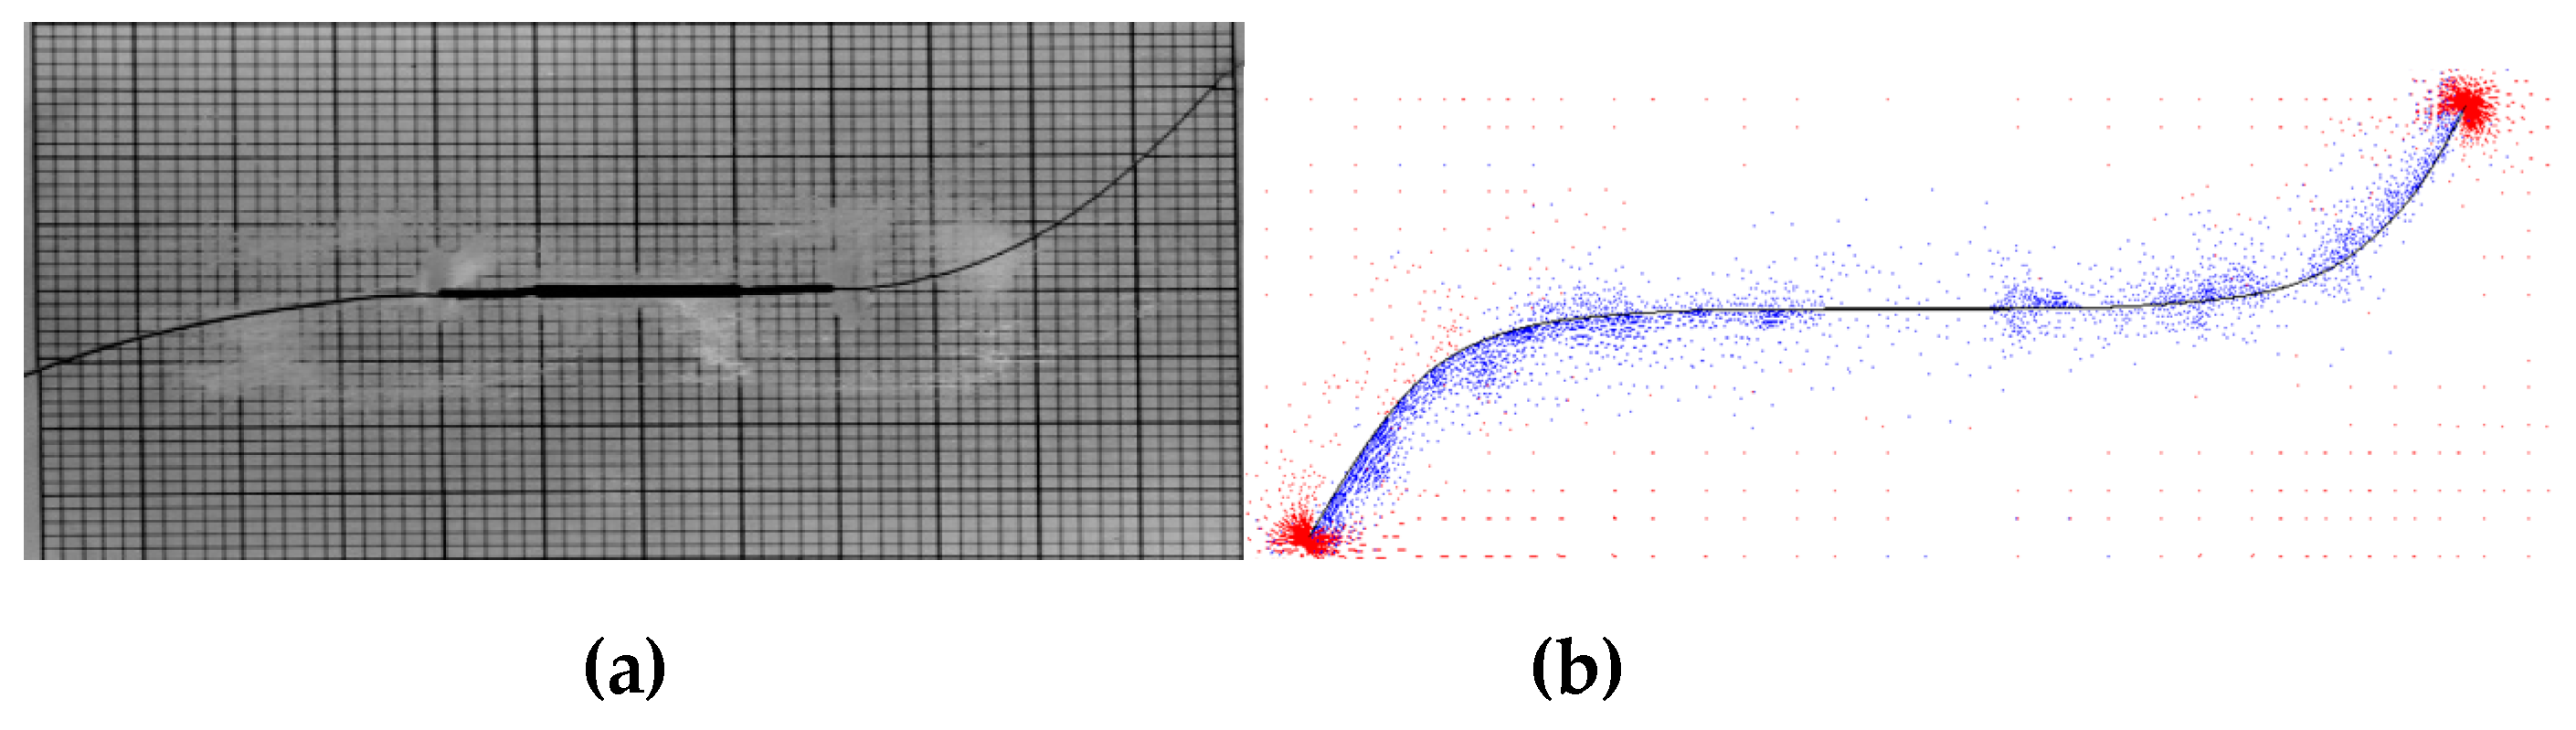
Figure 11.
Comparison the fatigue crack growth between current model and experiment from Ref [18].
Figure 11.
Comparison the fatigue crack growth between current model and experiment from Ref [18].
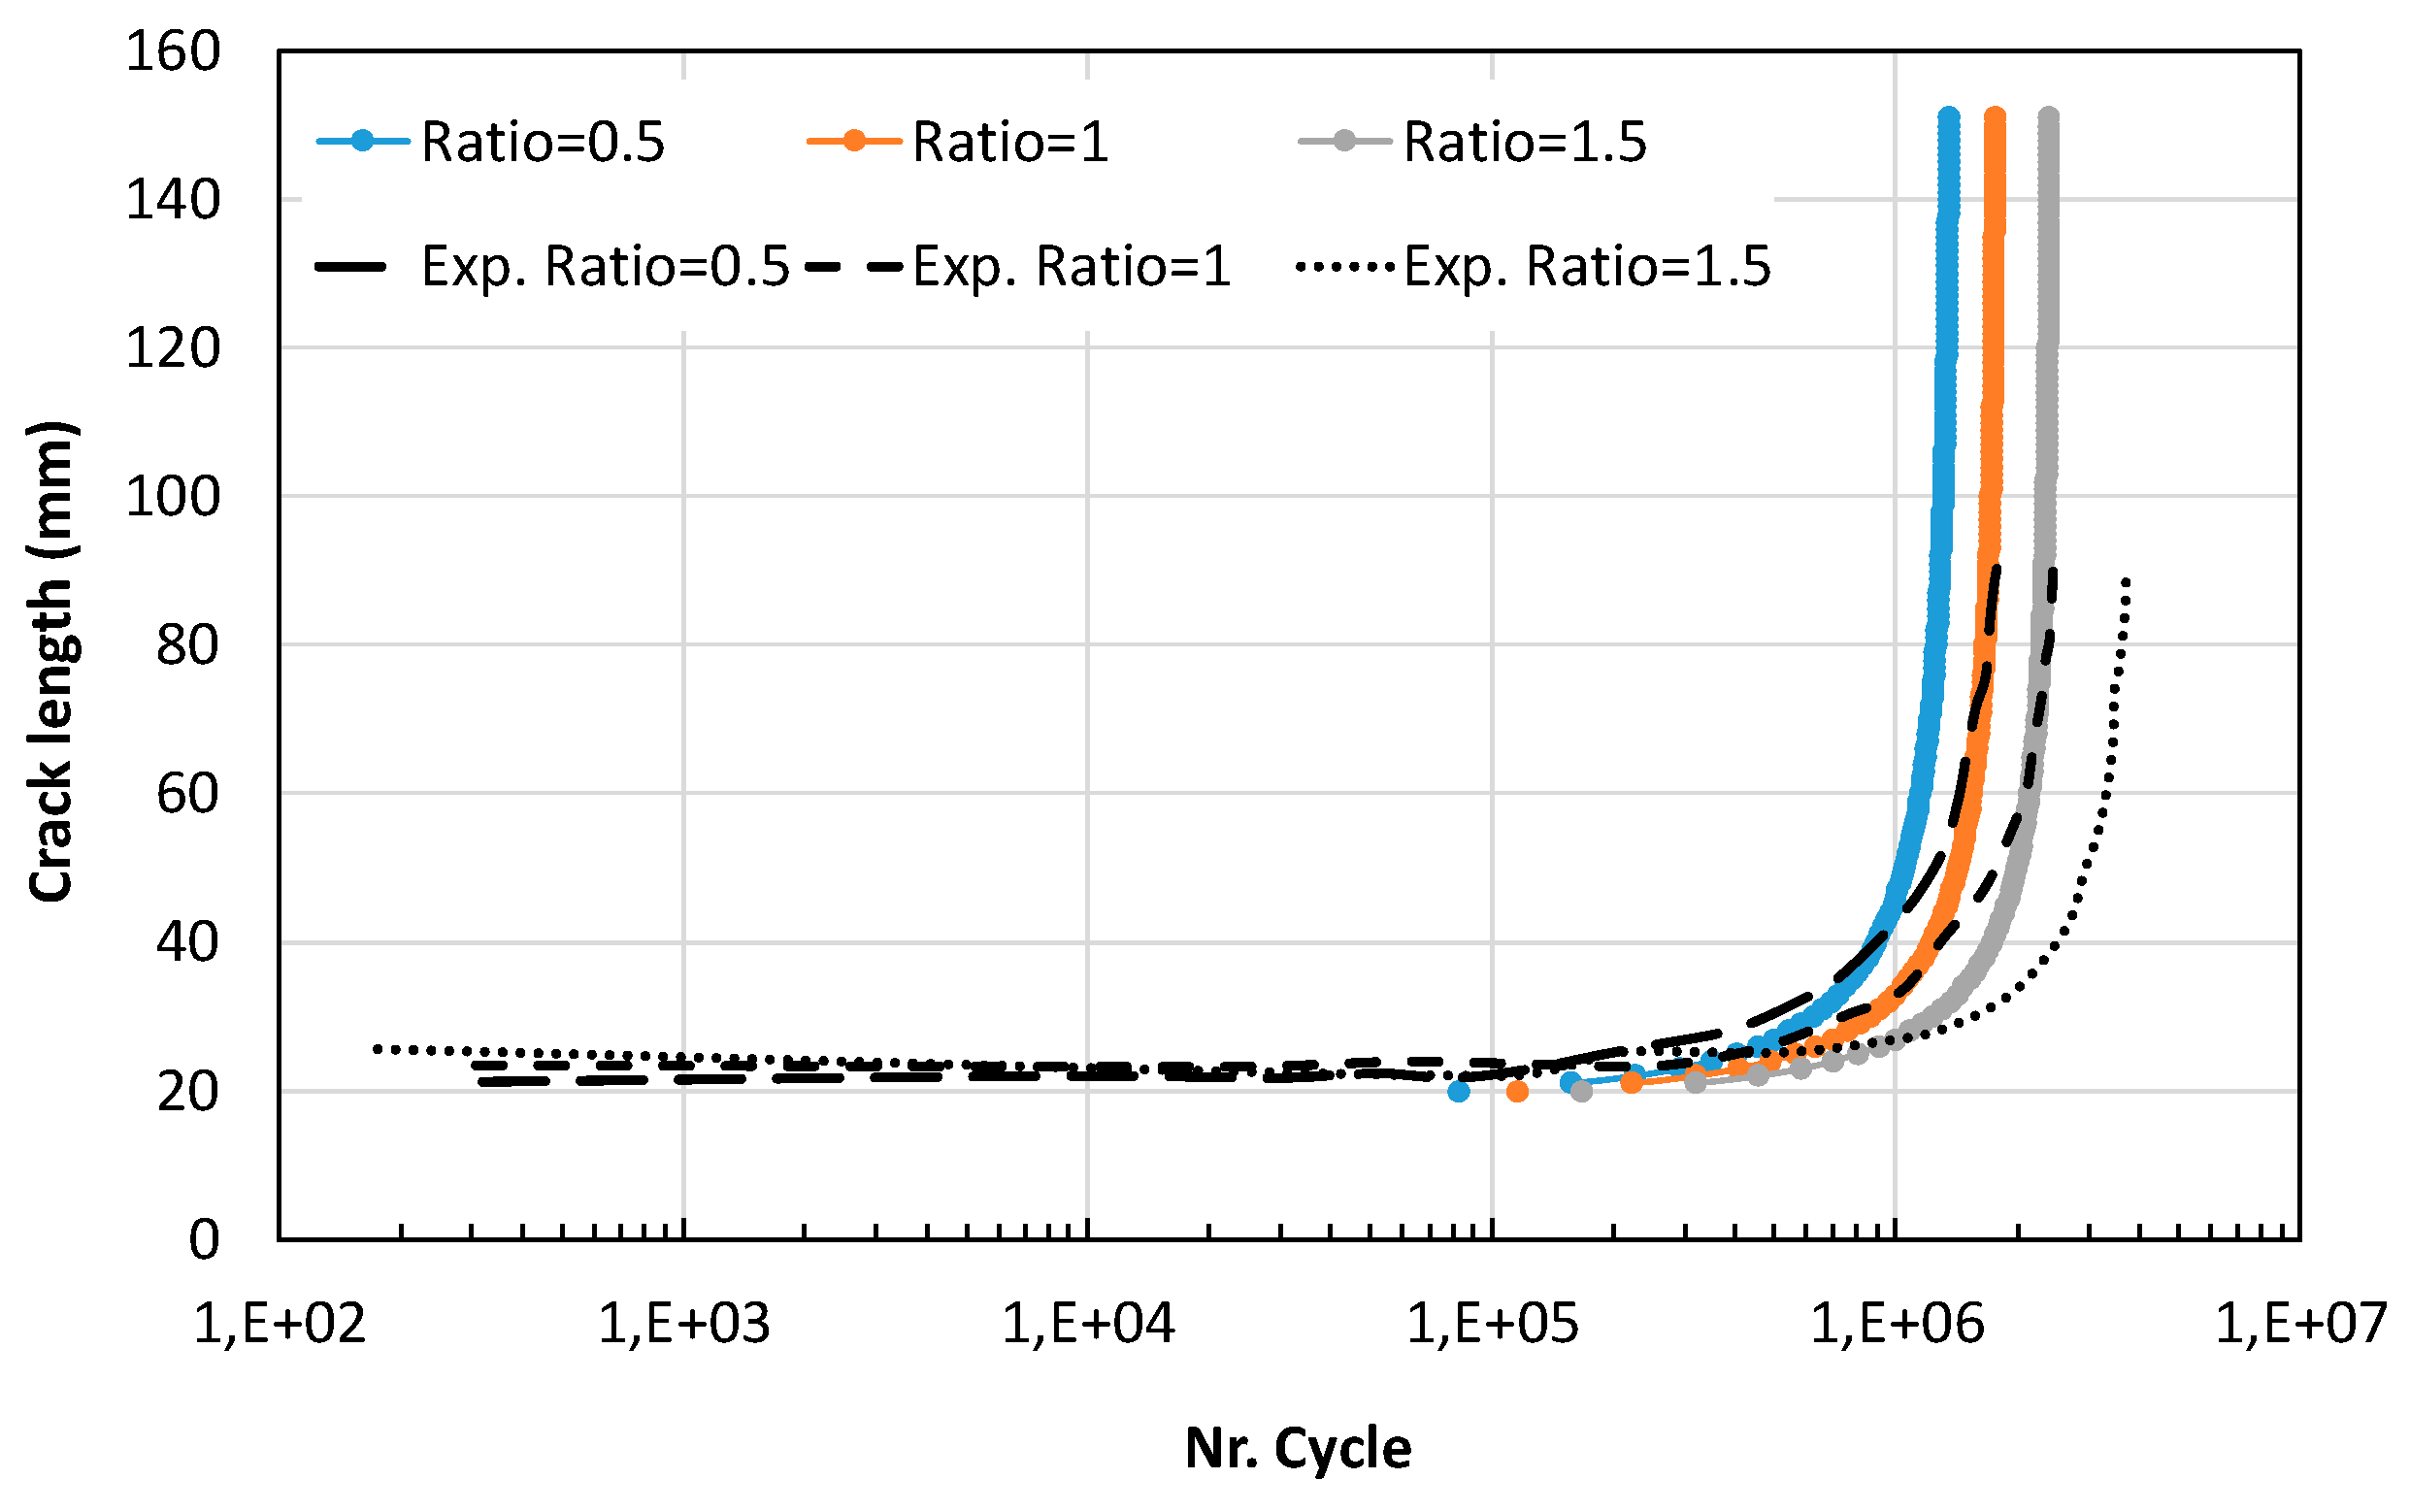
Figure 12.
the comparison of fatigue life between current model and experiment from Ref IP [18].
Figure 12.
the comparison of fatigue life between current model and experiment from Ref IP [18].
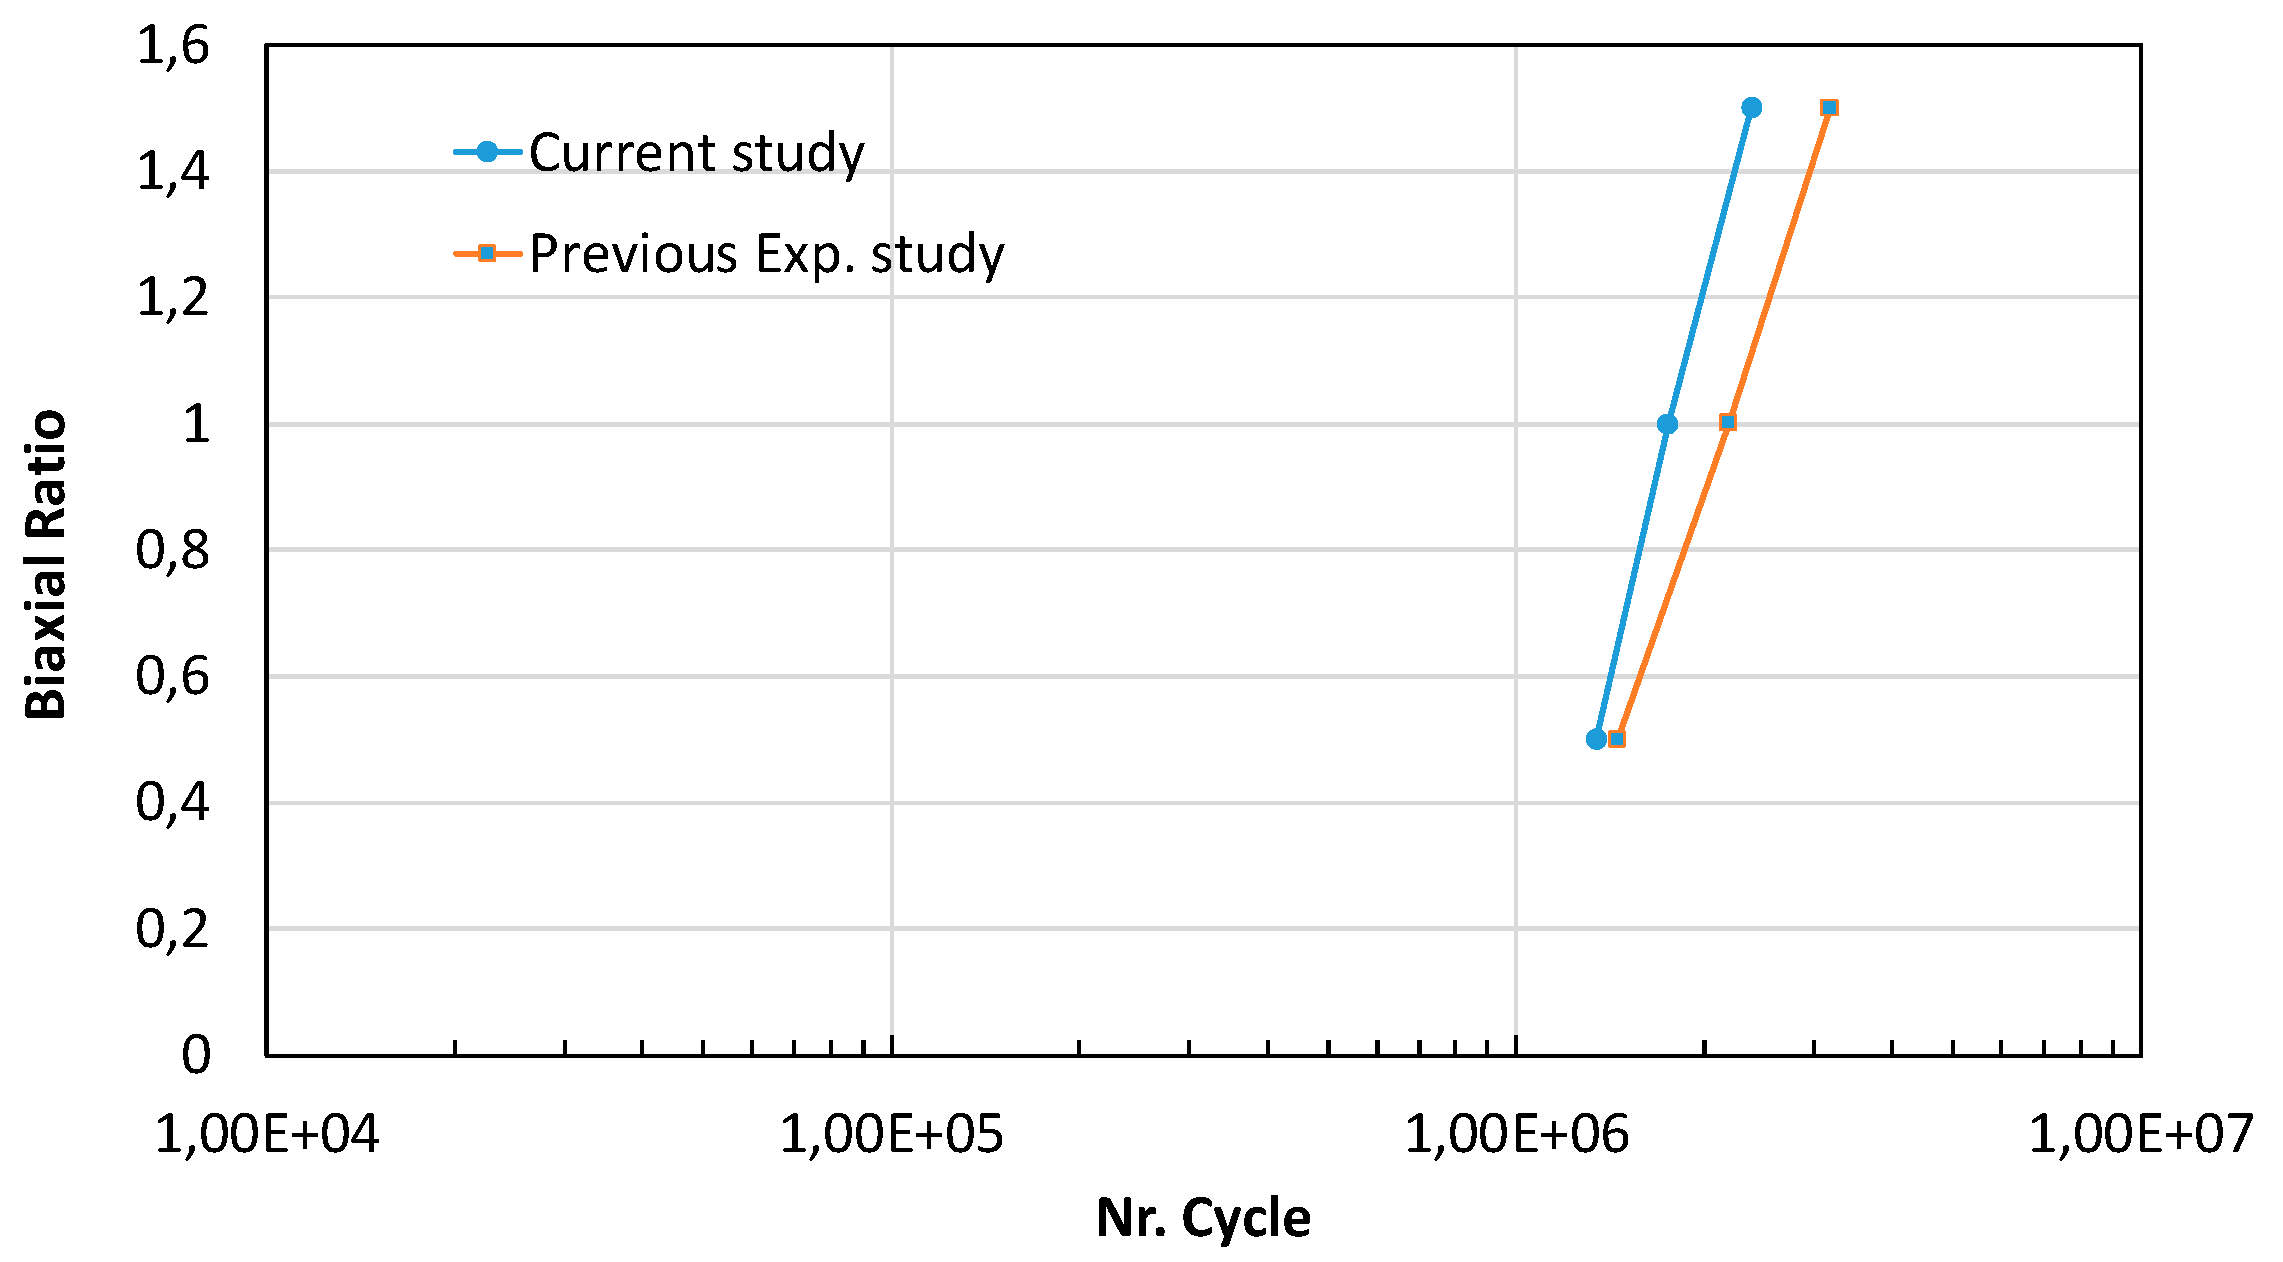
Figure 13.
Crack paths for different biaxial stress ratios.
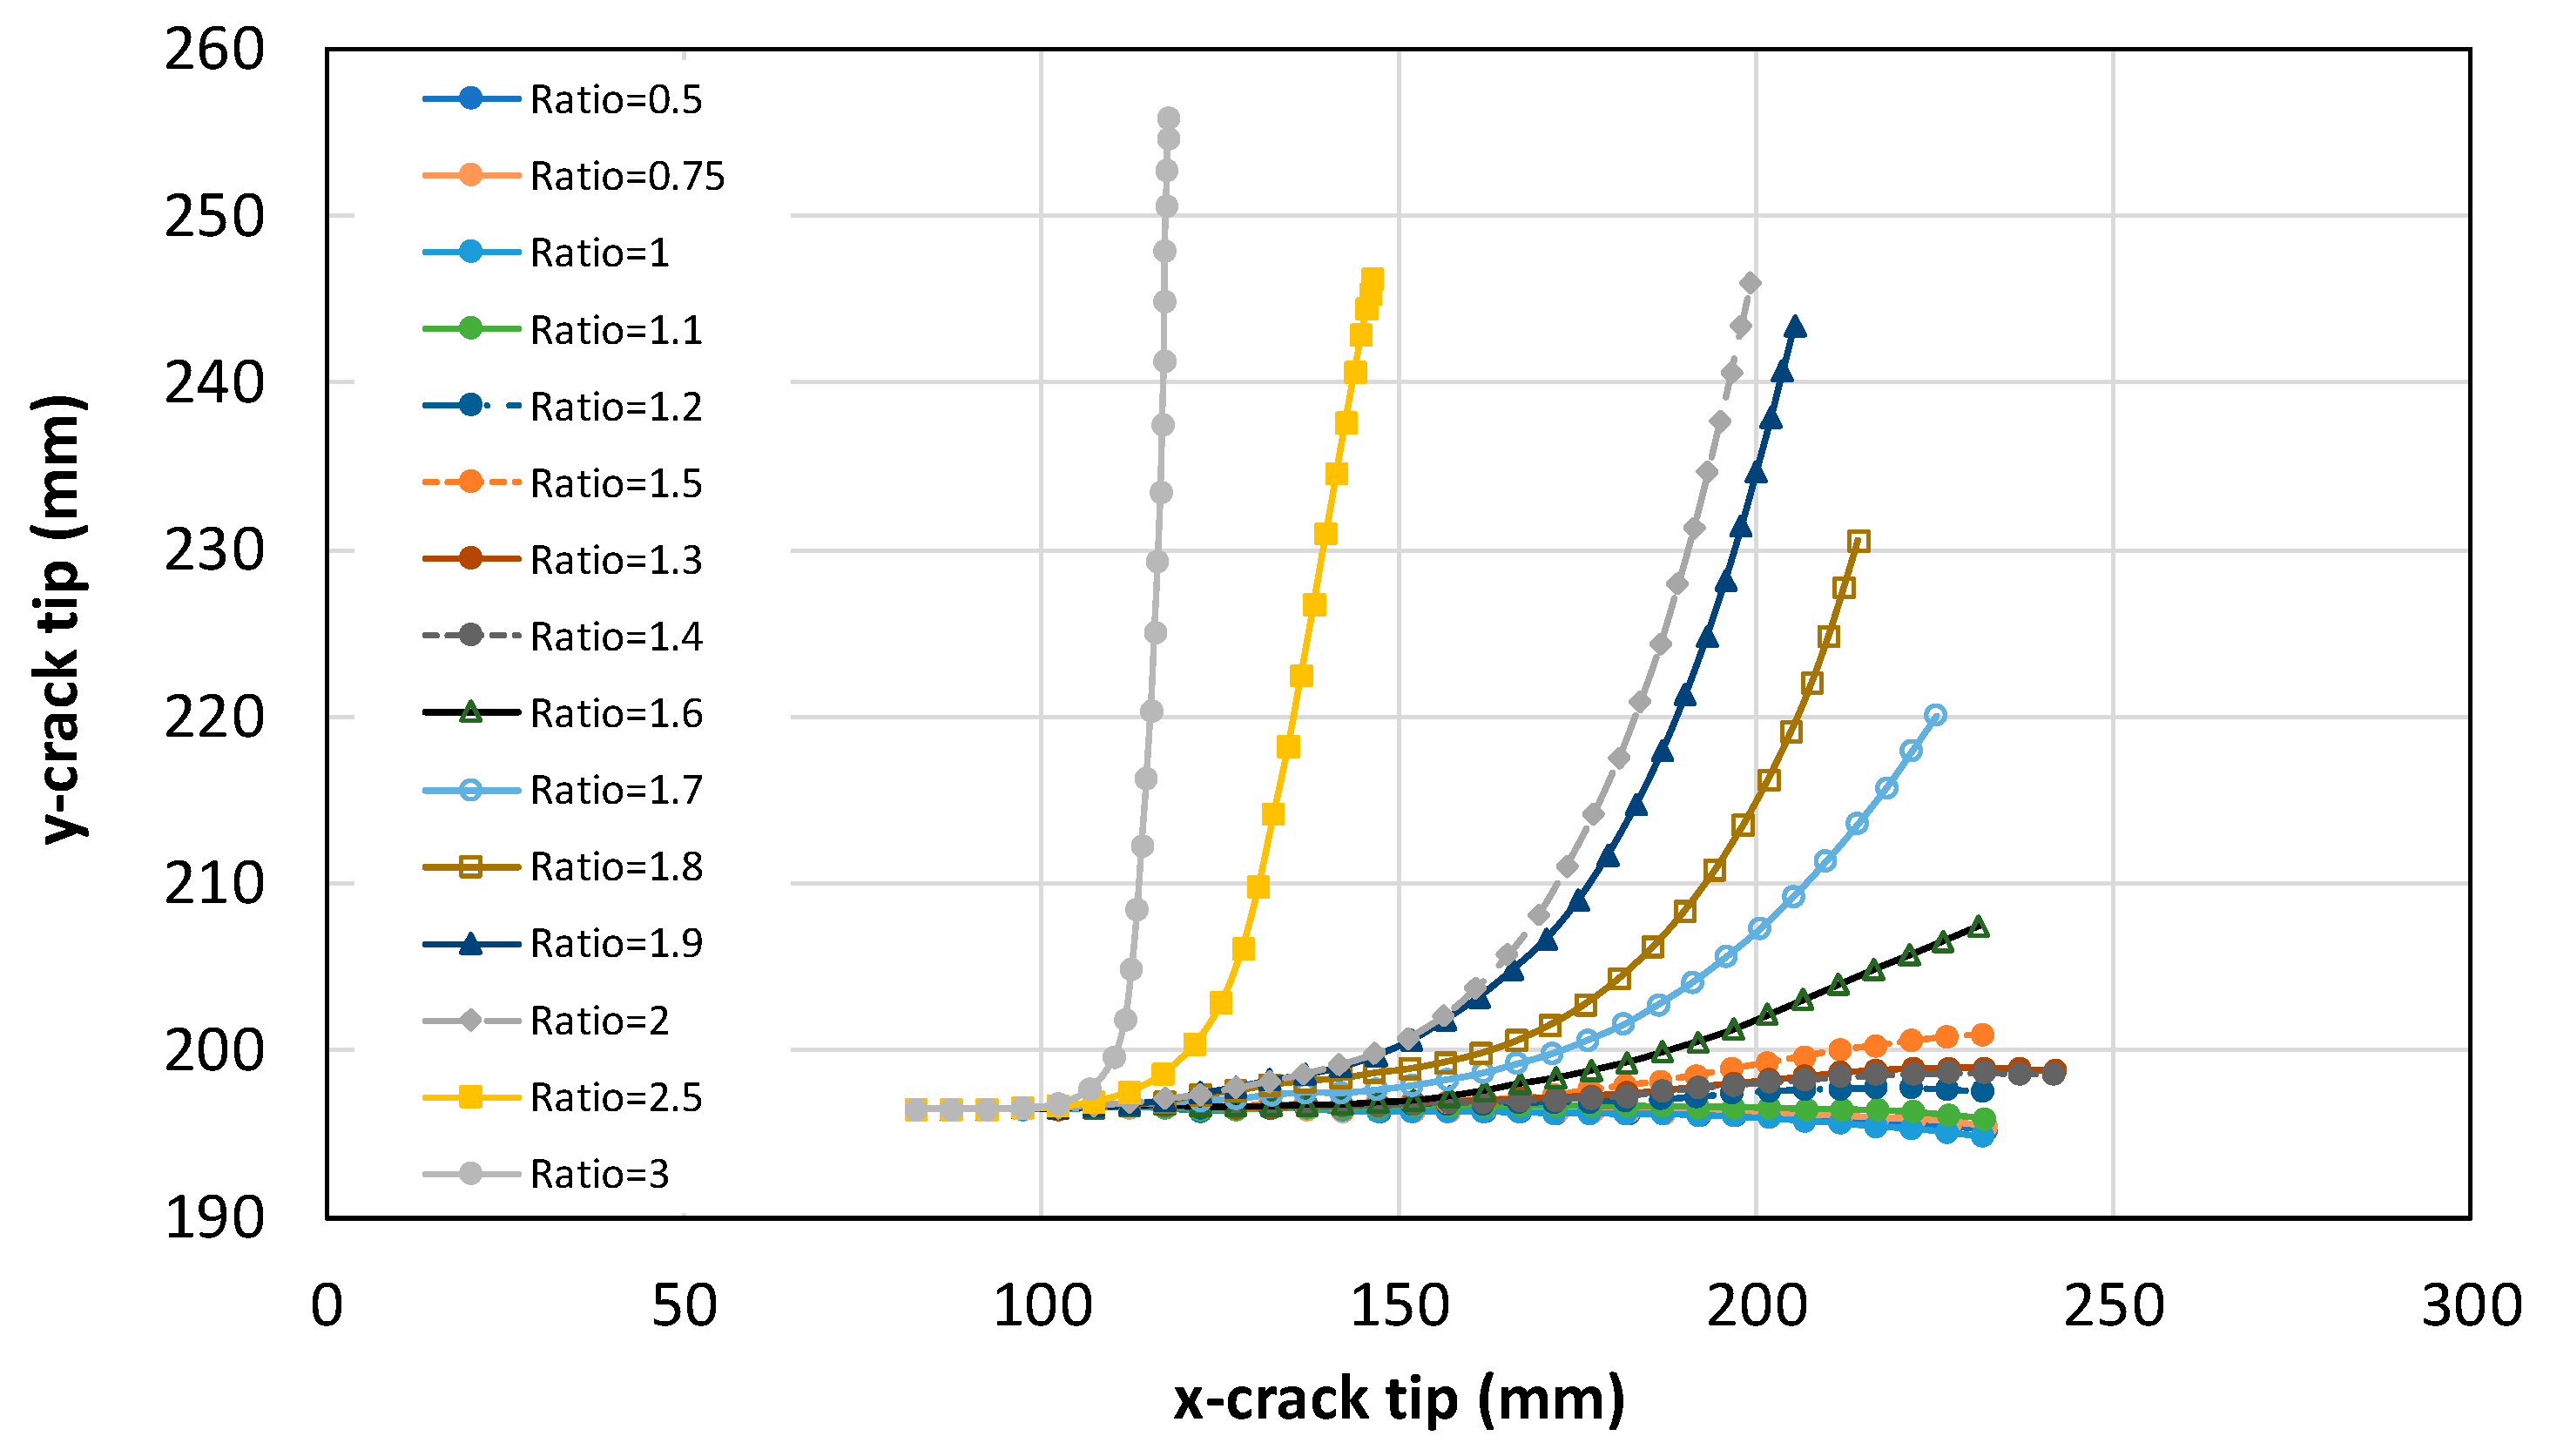
Figure 14.
(a) SIF and (b) fatigue life for biaxial ratios ranging from 0.5 to 3. Increasing the biaxial ratio leads to a higher number of cycles to failure.
Figure 14.
(a) SIF and (b) fatigue life for biaxial ratios ranging from 0.5 to 3. Increasing the biaxial ratio leads to a higher number of cycles to failure.
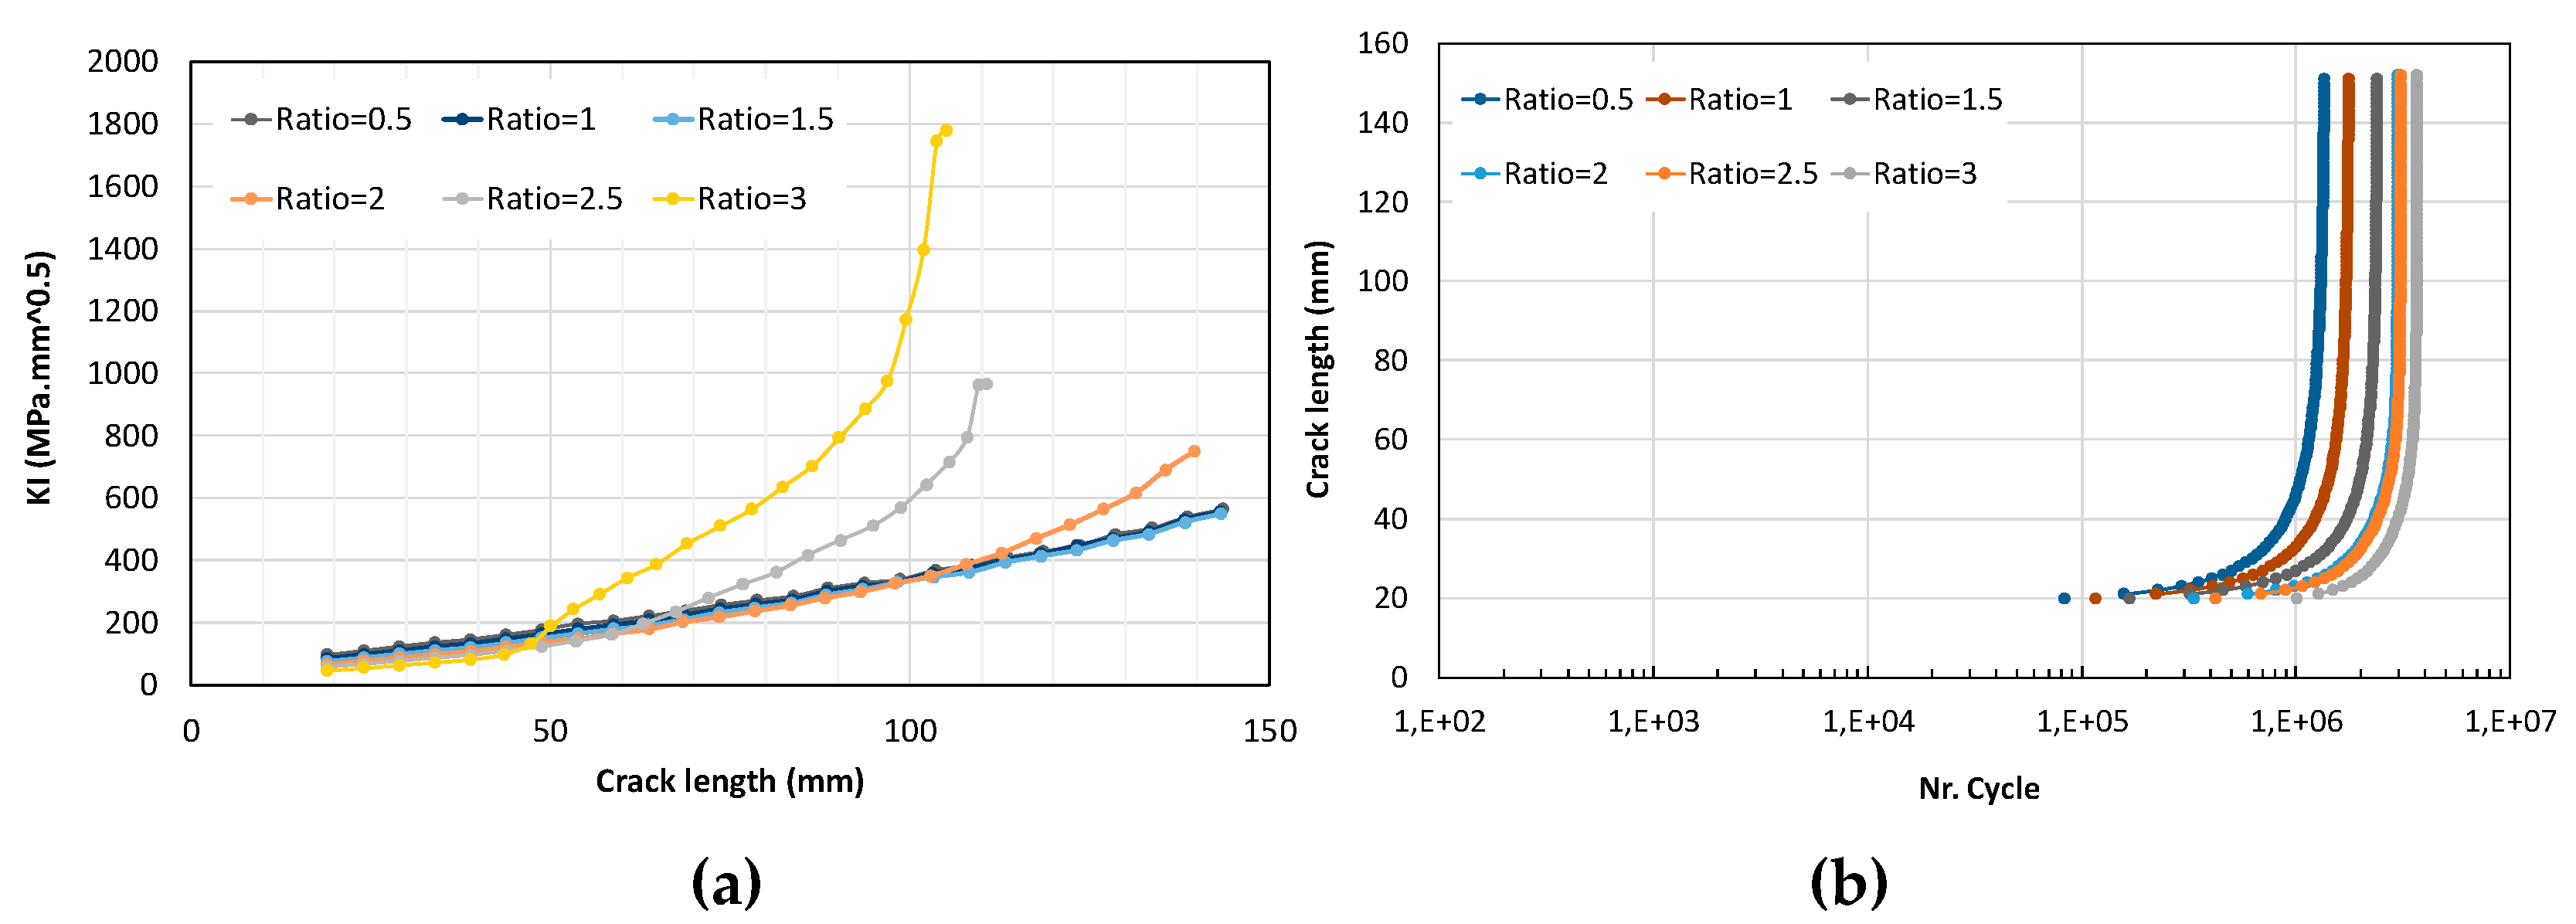

Table 1.
Biaxial stress ratio λ= σx/σy, 2a=38 mm.
| λ | σy | σx |
|---|---|---|
| 1 | 35.7 | 35.7 |
| 1.1 | 35.7 | 39.27 |
| 1.2 | 35.7 | 42.84 |
| 1.3 | 35.7 | 46.41 |
| 1.4 | 35.7 | 49.98 |
| 1.5 | 35.7 | 53.55 |
| 1.6 | 35.7 | 57.12 |
| 1.7 | 35.7 | 60.69 |
| 1.8 | 35.7 | 64.26 |
| 1.9 | 35.7 | 67.83 |
| 2 | 35.7 | 71.4 |
| 2.5 | 35.7 | 89.25 |
Disclaimer/Publisher’s Note: The statements, opinions and data contained in all publications are solely those of the individual author(s) and contributor(s) and not of MDPI and/or the editor(s). MDPI and/or the editor(s) disclaim responsibility for any injury to people or property resulting from any ideas, methods, instructions or products referred to in the content. |
© 2025 by the authors. Licensee MDPI, Basel, Switzerland. This article is an open access article distributed under the terms and conditions of the Creative Commons Attribution (CC BY) license (http://creativecommons.org/licenses/by/4.0/).
Copyright: This open access article is published under a Creative Commons CC BY 4.0 license, which permit the free download, distribution, and reuse, provided that the author and preprint are cited in any reuse.


