Submitted:
15 March 2025
Posted:
18 March 2025
You are already at the latest version
Abstract
Background/Objectives: Unhealthy nutritional behaviors and excess body weight constitute a serious challenge for public health in children and adolescents. The aim of this study was to examine changes in body mass index (BMI), body fat mass (FM) and nutritional behaviors in the same group of children during a 4-year observation between 10th and 14th years of age. Methods: BMI and FM using bioelectrical impedance were assessed. To assess nutritional behavior, a questionnaire was used. The study was done in the group of 250 children, starting from the age of 10 and finishing at the age of 14. The measurements were done in the year 2017 and 2021. The results were compared and analysed. Results: The excessive BMI (overweight and obesity) was more often in girls (28.29%) than boys (23.63%), while normal body weight was more often in boys (65.76%) than girls (60.96%). Between the initial and final assessment, percentage of children with normal body mass decreased from 65.65% to 61.07%. Excessive BMI (overweight and obesity) increased from 27.09% to 29.50% in girls, and from 21.26% to 26.00% in boys. The mean percentage of FM was higher in girls than boys (23.17% vs. 16.20%, respectively). The mean FM decreased from 17.80% to 14.60% in boys and increased from 21.77% to 24.57% in girls. The poor nutritional behaviors were observed in 20.35% of children, more often in boys (22.25%) than girls (18.50%). Between the initial and final assessment, an increase in the mean consumption of fruit, whole grain bread, milk was noted. These were products that should be consumed more often in a healthy diet. However, the consumption of products that should be limited in a healthy diet as fried flour dishes, fried meat dishes, fatty cheeses, butter, fast food, sweets, and carbonated drinks, also increased. Boys more often than girls consumed red meat and poultry meat, eggs, butter, and fast food while girls more often than boys consumed fruit, vegetables, yoghurts, cottage cheese, wholemeal bread, fruit, and sweets. Conclusions: Children usually showed moderate nutritional behavior. With age, in the evaluated group unfavorable nutritional behaviors and excessive body weight share increased. A higher overweight and obesity share and a higher body fat content were more often in girls than boys. Although girls’ nutritional behaviors were more healthy, they were at a higher risk of excessive body weight. Increasing the promotion of healthy nutritional behaviors and elevated physical activity to decrease overweight and obesity in children and adolescents is highly recommended.
Keywords:
body mass index
; children
; fat mass
; nutritional behaviors
; obesity
1. Introduction
Children and adolescents are especially at risk for obesity and unhealthy nutritional behaviors [1]. A 2024 World Health Organization (WHO) report indicated that nearly 1/4 of adolescents are overweight or obese [2,3]. The COVID-19 pandemic and related lockdowns have contributed to an increase in this unfavorable trend. Estimates of the global level of overweight and obesity suggest that the incidence of overweight is fastest in children and adolescents [1,4]. Poland is one of the countries in which adolescents gain weight at a very rapid rate [5]. In Poland, 1/3 of school-age children are overweight or obese [6]. A healthy diet and regular physical activity (PA) are essential in preventing and controlling excess body weight and related noncommunicable diseases [4]. Numerous factors influence a child’s dietary choices, including biological, economic, and social factors such as the influence of parents, peers, advertisements, and social media patterns. Adolescence is particularly important in shaping dietary habits. Studies have demonstrated that adolescents’ dietary habits usually change unfavorably compared to childhood. [7,8,9]. Unfortunately, an increased consumption of highly processed foods rich in fat, sugars, and salt, excessive consumption of sweets and carbonated drinks, and excessive consumption of carbonated drinks are often observed [10]. Furthermore, differences in dietary behaviors between girls and boys are also visible [10,11].
Nutritional recommendations for children and adolescents are presented in graphic form, as a healthy eating plate that shows the correct composition of the diet [12,13]. According to the recommendations, the diet of school-age children should be based on vegetables and fruits, low-fat dairy products, eggs, whole grain products, thick groats, and other foods with high nutrient density. Red meat should be replaced with lean poultry and wheat bread with whole-grain and coarse groats rich in dietary fiber. It is important to limit fried meat or flour dishes as well as fatty foods [13]. The basic drink should be water. Unfortunately, studies have shown many irregularities in the nutrition of children and adolescents, including a low consumption of vegetables, fruit, fish, and whole-grain products, with a high consumption of sweets, salty snacks, and sweet drinks [14]. The Health Behavior in School-aged Children Study has shown that only slightly over 1/3 of teenagers consume vegetables and fruit in the recommended amount, and the frequency of their daily consumption decreases with age in both sexes [15]. Furthermore, it was found that almost 2/3 of teenagers consumed sweets more often than once a week (girls more often than boys) and almost 1/2 often drank sweetened carbonated drinks (boys more often than girls) [15].
The recommended healthy diet for children and adolescents is most like the Mediterranean diet. Numerous epidemiological studies have emphasized the properties of Mediterranean diet in preventing non-communicable diseases and maintaining a healthy weight [16]. Mediterranean diet is characterized by a significant share of fruits and vegetables, legumes, whole grains, nuts and olive oil, with a higher consumption of lean poultry and fish than red meat, moderate consumption of dairy products and eggs [17]. Scientific evidence suggested a relationship between adherence to Mediterranean diet and normal body weight, higher physical fitness, and improved quality of life [17,18].
Obesity is the excessive accumulation of subcutaneous and organ adipose tissue, which poses a health risk [19]. Excessive body weight and too much body fat increase the risk of hyperlipidemia, type 2 diabetes, hypertension, decreased circulatory and respiratory capacity, reduced muscle strength and physical fitness, and rapid fatigability [1,2]. The main task of the obesity treatment and prevention program for school-age children should not only be to reduce body weight, but also to normalize the amount of adipose tissue. All obesity prevention strategies start with a healthy diet and increased PA [20,21,22,23]. Additionally, studies have shown that children who regularly exercise exhibit more favorable nutritional behaviors compared to children with more sedentary behaviors [24].
Body mass index (BMI), which determines the proportion of body weight to height, is used to assess nutritional status, but it does not provide information on the content of body fat mass (FM) [25,26,27]. In the assessment of adipose tissue content, dual-energy X-ray absorption is considered the gold standard [28]. This method is stationary and is not suitable for field studies outside of the laboratory. Therefore, the most commonly used method for assessing FM in school studies in children and adolescents is bioelectrical impenance analysis (BIA) [29]. BIA does not directly measure FM, but uses algorithms that take into account resistance and reactance parameters to estimate it. This method can be used to measure body composition, including FM, lean mass, skeletal muscle mass, water content, and others [28,29,30]. BIA is considered to be highly accurate and repeatable, and above all, it allows conducting studies directly in schools on large groups of children and adolescents [28,29]. Children and adolescents change their body composition with age. During puberty, a significant increase in FM in girls and muscle mass in boys is often observed [13,31,32]. usuallu nutritional behaviors are also changing, often in an unhealthy way. That’s why it is important to monitor your BMI, FM, and nutritional behaviors to assess the risk of overweight and obesity. The aim of this study was to examine changes in BMI, FM and nutritional behaviors in the same group of children during a 4-year observation between 10 and 14 years of age.
2. Materials and Methods
2.1. Participants
This was an observational cohort study that evaluated body fat, BMI, and nutritional behaviors in children. The study was done on the same group of children born in 2007 who attended 6 primary schools in Siedlce, a medium-sized city in central Poland. The initial phase of the study was conducted in 2017 (age approximately 10 years) and the final stage was conducted in 2021 (age approximately 14 years). Each class had 22–25 children in each class. The children who participated in the study came from a similar background and had a similar socioeconomic status. A total of 304 participants, including 142 girls and 162 boys agreed to take part in the study. The sampling strategy was based on convenience sampling, and therefore the selected groups were not equal. The sample size was justified by power analysis in G*power software (version 3.1.9.7; Universität Kiel, Kiel, Germany) [33]. The study consisted of two parts. The first part was a survey of nutritional behavior, and the second part was anthropometric measurements to determine BMI and body composition analysis to estimate FM.
The children were informed about the confidentiality of the results and the purpose of the study before they began the study. The project received a positive response from the management of each school, teachers, and parents. All parents or guardians gave written consent for their children to participate in the study. The parents declared that they would prepare the child for the measurements in accordance with detailed guidelines. The positive impact of parental involvement in preparing children for the measurements has been previously demonstrated [34]. The study was approved by the Research Ethics Committee at the University of Siedlce (No. 2/2016). The inclusion criteria for the study were as follows: (1) good health (no newly diagnosed chronic diseases, injuries, or wounds and good well-being); (2) age 10 years at the beginning of the study and 14 years at the end of the study; (3) consent from child and parents to participate in the study; (4) correctly completed questionnaire; (5) correctly performed anthropometric measurements and body composition analysis; (6) the child did not follow a special diet that could potentially affect the final result; (7) no injuries or wounds during the measurement session; (8) no pacemaker implanted, which could affect the BIA measurement result.
The study was conducted in schools following the same procedure. The research team performed anthropometric and body composition measurements and supervised the completion of the questionnaire on nutritional behaviors. Before the proper studies, in 2017, pilot studies were conducted on 10-11-year-old children to check the correctness of the adopted assumptions and methodology. The methods used in the initial study were accepted in the main study.
2.2. Procedure
The measurements were done by a qualified and trained team of dietitians. The measurements were taken on two dates: the initial session in September 2017 and the final session in September 2021. The measurements were performed using the same equipment used in all schools. BMI and FM values were interpreted based on percentile charts that were appropriate for age and gender [26,30,35]. Anthropometric measurements and body composition analysis were done according to the methodology described in our previous works [21,22,32,36].
Nutritional behaviors were assessed using an anonymous survey based on the Questionnaire of Eating Behavior (QEB) of the Polish Academy of Sciences [37]. The results were compared to nutritional reccomendations [12,13,17,18]. Children completed the same questionnaire in 2017 and 2021. The results showing nutritional behaviors of children at the age of 14 were published in our previous article [36].
The anthropometric and body composition measurements were performed between 10:00 and 11:00 a.m. in the gym, in the presence of a teacher, following the guidelines necessary for accurate measurement of body weight, height and body composition analysis. Parents were instructed not to allow their children to eat heavy and large meals after 9:00 p.m. the evening before the measurement, and on the day of the measurement, children were advised to eat a light breakfast. The research team recommended that the last organized physical activity, aside from necessary household chores, should not be performed at least 12 hours before the measurement. Before the measurement, children were asked not to eat or drink until the measurement was complete [28,29].
2.3. BMI
The body weight (kg) and height (cm) were measured, which allowed for the BMI calculation. BMI was calculated as body weight divided by height (kg/m2). BMI percentile charts were used to interpret the results [26,35]. Measurements were performed according to a standard procedure. Height was measured with a Seca 214 stadiometer (Seca GmbH & Co. KG, Hamburg, Germany) in an upright position with an accuracy of 1 cm. Body weight was measured using a Tanita SC-240MA device (Tanita Cooperation, Tokyo, Japan) with an accuracy of 0.1 kg [39,41,42]. According to the criteria, overweight was considered as BMI ≥ 85th percentile, obesity as BMI ≥ 95th percentile, and underweight as BMI ≤ 10th percentile [26,35]. Previous works described procedures for measuring body weight and height [21,22].
2.4. Fatt mass
BIA measurements were performed using a Tanita SC-240 MA body composition analyzer. The analysis allowed for estimation of FM. The collected results were only indicative, since the analyzer did not provide parameters of resistance, reactance, impedance, and phase angle [39,41,42]. The detailed procedure for preparing children for body composition analysis was described in previous works [32]. Percentile charts were used to interpret the results [30]. FM values were referred to the recommendations of McCarthy et al. (2013) [30]. Percentile 2nd and 85th indicated children with deficiency and excess of adipose tissue (respectively), and 95th indicated obese children. The body fat percentage indicated the ratio of fat to total body mass, while the fat mass in kg represented the actual body fat mass.
2.5. Questionnaire
The declared nutritional behaviors were examined using an anonymous questionnaire. There were 31 closed-ended questions with one possible answer to choose from in the survey. Children completed the survey twice in the initial and final session, respectively. Children were not time-limited. Participants received a short instruction before they started the sutvey.
The questionnaire asked the frequency of consumption of food products, dishes, and beverages. The first group of questions focused on foods that should be consumed frequently in a healthy diet (products with beneficial health properties), including milk, yogurts, cottage cheese, thick groats, oatmeal, whole-grain pasta, whole-grain bread, fish, poultry dishes, fruits, vegetables, legume dishes and eggs. The second group of questions focused on foods that should be consumed moderately or low in a healthy diet, including white rice, white bread, fine-grain groats, flour dishes, fried meat dishes, lard, butter, fatty cheeses, red meat dishes, cold cuts, sausages, frankfurters, canned meats, sweetened drinks, energy drinks, fast food and sweets. Moreover, the questionnaire included questions about the regularity of breakfast consumption, snacking between meals, and the most frequently chosen liquids to drink. The results were compared with the healthy diet reccomendations for children and adolescents [12,13,17,18].
Nutritional behaviors were evaluated on a three-point scale of very good, moderate, and poor. A very good score was given when whole grain products, thick groats, vegetables, fruits, milk and fermented dairy products (e.g. yoghurts), cottage cheese and eggs were eaten every day. Also when poultry meat, red meat, fish, legumes, butter, fatty cheeses, wheat bread, wheat pasta, small groats, fried flour dishes, and fried meat dishes were eaten several times a week. A very good score was also given if sweets, fruit juices, carbonated and energy drinks, cold cuts, sausages, frankfurters, lard, canned meat and fast food appeared several times a month or not at all.
A moderate score corresponding to moderate nutritional behaviors included daily consumption of red meat, legumes, butter, fatty cheeses, wheat bread, wheat pasta, small groats and fried flour or meat dishes, as well as consumption several times a week of whole grain products, coarse groats, whole grain pasta, oatmeal, vegetables, fruit, milk and fermented products, low-fat cottage cheese, fish and eggs. A moderate score was given if sweets, fruit juices, carbonated and energy drinks, fatty cold cuts, sausages, frankfurters, lard, canned meat and fast food appeared several times a week.
A poor score corresponding to unhealthy nutritional behaviors included daily consumption of sweets, fruit juices, carbonated and energy drinks, fatty cold cuts, sausages, frankfurters, lard, canned meats and fast food. A poor score was also given if the diet included only one or several times a week the desired whole grain products, such as thick groats, whole grain pasta, oatmeal, vegetables, fruits, milk, fermented milk products, cottage cheese, poultry or fish and eggs. Furthermore, it was given when red meat, cold cuts, butter, fatty cheeses, wheat bread, wheat pasta, small groats, fried flour dishes, and fried meat dishes were consumed daily. The detailed procedure related to the conduct of the research and analysis was presented in our earlier work [36]. The results of the research conducted in 14 years children were presented in our earlier work [36].
2.6. Statistical Analysis
The statistical calculations were performed using Microsoft Excel 365 (Microsoft, Corp., Washington, DC, USA) and Statistica 13 (Stat Soft, Krakow, Poland). The level of statistical significance was set at α ≤ 0.05. The mean at the level of gender and age was calculated.
The t-test, Shapiro–Wilk test, Mann–Whitney U test, one-way ANOVA, χ2 test and analysis of variance were used for statistical analysis of the results. The normality of the distribution was assessed using the Shapiro–Wilk test, and the assumption of homogeneity of variance was verified with Levene’s test for p > 0.05. The Mann–Whitney U test analysed parameters without a normal distribution.
Mean, median, standard deviations and 95% confidence intervals were calculated to assess body fat content at the level of sex and age profile. Effect size (ES) for the mean for FM of children was calculated based on Cohen’s d. Threshold values for ES statistics were as follows: >0.2 low, >0.5 medium, >0.8 high and >1.3 very high [43].
The χ2 test was used in the analysis of nutritional behavior. The strength of association between sex and nutritional behaviors was assessed using Cramer’s V (VC), which is based on Pearson’s χ2 statistic and has an inclusive value from 0 to 1, ranging from no association at 0 and increasing to full association at 1, respectively.
Additionally, a principal component analysis (PCA) was undertaken. The PCA used the average results of the initial and final measurement sessions for the BMI, FM, favorable nutritional behavior and unfavorable nutritional behaviors, for both girls and boys.
3. Results
3.1. Group Characteristics
During the initial phase of the study, 304 children (mean age 10.27 years) were included (girls 142; boys 162). In the survey, 278 questionnaires were included (girls 127; boys 151). Nearly 6% of the questionnaires for boys and 4% of girls were excluded because they were not filled out correctly. The first stage of anthropometric measurements was conducted among 245 children (girls 118; boys 127). About 17% of girls and 22% of boys did not participate in the measurements, despite initial consent.
In the final stage of the study, consent was obtained from 236 parents and adolescents. However, in the final analysis the results obtained from 213 participants (girs 106; boys 107) were included. The reason for the exclusion was the participant’s absence on the day of measurement. This considered 9.75% of children.
3.2. Anthropometric indicators
Table 1 presents the mean height, body mass and BMI at the beginning and end of the study. Compared to the initial period, the average height of the children increased on average by 24.24 cm (girls 22 cm; boys 26.48 cm; p= 0.001). Boys were taller than girls (girls 153.67 cm; boys 156.52 cm; p= 0.087). The weight gain in the entire group was on average 22.08 kg (girls 19.73 kg; boys 24.43 kg; p= 0.001). On average, girls had a lower body mass than boys (47.32 kg vs. 50.36 kg, respectively; p= 0.062). The mean increase in girls BMI was 2.78 kg/m2 from 18.28 to 21.06, and in boys 3.15 kg/m2 from 18.38 to 21.53 (p = 0.001). On average, girls had a slightly lower BMI compared to boys (19.67 vs. 19.95 kg/m2, respectively; p = 0.071). Girls and boys had similar BMI percentiles at the beginning (50th) and at the end of the study (75th). There was an increase in the mean BMI percentile from 50th to 75th in both girls and boys (p= 0.731).
3.3. BMI
A more detailed data set can be obtained by determining the patticular BMI categories in the group. On average, about 15% of children were overweight (girls 15.76%; boys 13.12%; p= 0.001), 11.51% obese (girls 12.53%; boys 10.50%; p= 0.000). Normal body weight was noted in 63.36% of children (Table 2). Excessive body weight (overweight and obesity) was significantly more common in girls (girls 28.29%; boys 23.63%; p= 0.024). Normal body weight occurred more often in boys (girls 60.96%; boys 65.76%; p= 0.031). The mean percentage of underweight children was similar in both sexes (boys 10.61%; girls 10.74%; p=0.671).
After four years, the average percentage of children with normal body weight decreased from 65.65% to 61.07% (p=0.001). In girls, this percentage decreased from 62.75% to 59.15% (p=0.023), in boys from 68.52% to 63% (p=0.000) (Figure 1). Throughout the study period, girls were more likely to be overweight or obese than boys. Between the initial and final measurement, a significant increase in the percentage of children with excessive body weight (overweight and obesity) was noted in girls from 27.09% to 29.50% (an increase of 2.41%; p=0.070), in boys from 21.26% to 26.00% (an increase of 4.74%; p=0.035). The mean percentage of underweight children increased slightly from 10.71% to 11.17% (p=0.091).
3.4. Fat Mass
On average, girls had a higher FM than boys over the entire study period (girls 23.17%; boys 16.20%; p = 0.011). Compared to the initial measurement, in boys, the mean FM decreased from 17.80% to 14.60% (p = 0.040), and in girls, it increased from 21.77% to 24.57% (p = 0.020) (Table 3). Girls had a higher FM expressed in kilograms than boys (11.80 kg and 8.68 kg, respectively; p = 0.001). Compared to the initial measurement, in girls the FM increased by an average of 6.15 kg; and in boys by 2.38 kg (p = 0.004).
The body fat content was interpreted based on FM percentile charts. The average from the entire stydy operiod showed overweight FM in 20.67% of children (girls 21.85%; boys 19.49%; p = 0.001). Obesisty FM was found in 12.45% of children (girls 12.60%; boys 11.89%; p = 0.074). Normal FM was found in 59.46% of children (girls 57.56%; boys 61.36%; p = 0.081). Underweight FM occurred in 8.24% of children (girls 7.98%; boys 8.51%; p = 0.091). (Table 4).
Compared to the initial period, the percentage of children with excessive FM (overweight and obesity) increased from 28.52% to 35.88% (p = 0.001). Similarly to BMI, girls had a higher average percentage of excessive FM than boys throughout the study period. Between the initial and final measurements, there was a significant increase in the percentage of children with excessive FM (overweight and obesity) in girls from 30.15% to 38.75% (an increase of 8.60%; p = 0.047), in boys from 26.88% to 33.02% (an increase of 6.14%; p = 0.035). The percentage of children who were overweight FM increased from 17.59% to 22.76%. This was especially evident in girls where the percentage of overweight FM increased from 18.95% to 24.75% (p = 0.057) and a lesser extent in boys – from 16.22% to 20.77% (p = 0.065) (Figure 2). The percentage of children with obesity FM increased from 10.93% to 13.12% (p = 0.095). In girls this percentage increased from 11.20% to 14.00% (p = 0.065), and in boys from 10.66% to 12.25% (p = 0.057). The percentage of children with normal FM decreased from 60.76% to 58.37% (p = 0.085). In girls and boys, the percentage decreased similarly from 59.33% to 55.80% and from 62.15% to 60.95% (p = 0.085). The percentage of children with FM who were underweight decreased from 10.75% to 5.73% (p = 0.025). In girls and boys, the percentage decreased similarly from 10.52% to 5.45% and from 10.99% to 6.03%, respectively (p = 0.001).
3.5. Nutritional Behaviors
The average declared frequency of food consumption during the entire study period is presented in Table 5. Between the initial and final sessions, a decrease in very good behaviors was noted. On average, 23.25% of children had very good nutritional behaviors during the entire study period. A higher percentage of children showing very good nutritional behaviors was noted in girls than in boys (26.30% and 20.25%, respectively; p = 0.071). At the beginning of the study, 28.40% of girls and 20.25% of boys received a very good assessment (p = 0.041), and at the final stage, 24.30% and 20.20%, respectively (p = 0.069). Moderate nutritional behaviors were noted in 57.50% of children (girls 56.40%; boys 58.20%; p = 0.097). The percentage of girls showing moderate nutritional behaviors was the same at the beginning and at the end of the study, i.e. 56.40%, while in boys, it decreased from 64.25% to 52.30% (p = 0.041). Poor nutritional behaviors were noted in 20.35% of children and were more common in boys (girls 18.50%; boys 22.25%; p = 0.096). It was observed that with age, the percentage of children with unfavorable nutritional behaviors increased. At the beginning of the study, poor nutritional behavior was shown in 16.30% girls and 16.25% boys (p = 0.192), and at the final stage, 20.20% and 28.40%, respectively (p = 0.092).
On average, most girls showed very good nutritional behaviors concerned consumption of milk (69.72%), yoghurts (61%), vegetables (57.48%) and fruit (54.55%). Energy drinks were not consumed at all by 81.75% of girls, 64.25% did not consume canned meat and 93.75% lard. Just 40.00% of girls drank carbonated drinks only 1–3 times a month, and 21.25% never at all. Unfortunately, 38.75% drank them more frequently. Moderate nutritional behaviors included consumption of poultry meat (40.50%), red meat (49.52%), fish (53.36%) and eggs (58.65%) once a week. Whole grain bread and cold cuts and sausages were consumed several times a week (38.84% and 60.79%, respectively), and once a week: coarse-grained groats (52.71%), fine-grained groats (54.04%), and cottage cheese (29.25%). Every day consumption of wheat bread was declared by 69.31% of gitls. Fast food was consumed 1–3 times a month by 52.43% of girls. Poor nutritional behaviors in girls concerned eating sweets every day (42.25%) and fruit juices only once a week (46.00%). Poor nutritional behaviors included also high consumption of fatty cheeses (54.38%) and fried meat dishes and fried flour dishes (66.75%). Also, 43.75% of girls only ate legume dishes 1–3 times a month. Every day consumption of butter was declared by nearly 46.50% of girls.
Very good nutritional behaviors in boys concerned daily consumption of fruit (46.26%) and vegetables (46.53%). Milk was consumed several times a week by 69.71% of boys, and yogurt by 65.25%, including those who consumed it every day. Canned meat was not consumed by 64.25% of boys, and lard by 90.25%. Majority of boys (73.75%) didn’t drink energy drinks at all.
Moderate nutritional behaviors in boys included consuming poultry meat (34.99%), red meat (44.97%), fish (52.74%), eggs (58.97%) and whole grain bread (33.62%). Among others, once a week were consumed coarse-grained groats (55.74%) and fine-grained groats (54.04%). Several times a week were consumed cold cuts and sausages (75.61%) and cottage cheese (44.25%). Daily consumption of wheat bread was declared by 79.50% of boys. Fast food was consumed 1-3 times a month by 44.36% of boys.
Poor nutritional behaviors concerned daily consumption of sweets (36.25%) and butter (48.25%). Fast food was consumed once a week by 48.05% of boys, and 46.25% drank carbonated drinks once a week. Poor nutritional behaviors included consumption of fruit juices only once a week (56.50%). Low consumption of legumes, only 1-3 times a month was noted (46.50%), and 35.00% did not eat the above products at all.
Children most often ate 4 meals a day (girls 37.34%; boys 40.51%; p = 0.071). About 30% of children ate 5 meals (girls 32.04%; boys 27.87%; p = 0.061). Almost 66% of participants ate breakfast every day (girls 66.84%; boys 63.83%; p = 0.310).
Snacks between main meals were consumed by 87.10% of participants, boys snacked slightly more often than girls (girls 86.07%; boys 87.52%; p = 0.730). Participants most often ate fruits every day (girls 54.00%; boys 46.26; p = 0.101), salty snacks (girls 26.67%; boys 24.50%; p = 0.080) and sweets (girls 42.25%; boys 36.25%; p = 0.315). Only 1.25% of children consumed vegetables between meals (girls 0.51%; boys 2.10%; p = 0.187). The most popular drink was water (girls 61.26%; boys 57.62%; p = 0.094). Tea without sugar was drunk by 16.45% of girls and 10.96% of boys (p = 0.061).
Daily milk consumption was more often in girls than boys (girls 39.31%; boys 27.95%; p = 0.046), yoghurts (20.75% vs. 15.50%; respectively; p = 0.033) and cottage cheese (girls 12%; boys 10.75%; p = 0.871), while the consumption of fatty cheeses was at a similar level (girls 17.13%; boys 17.00%; p = 0.130) (Table 5). The results showed that a high percentage of children, on average 74.40%, declared consumption of wheat bread at least once a day, more often boys than girls (79.50% vs. 69.31%; respectively; p = 0.034). Children rarely consumed whole grain products, with only 15.39% of participants consuming them daily (girls 18.68%; boys 12.10%; p = 0.010).Whole grain bread was consumed several times a week by 22.16% of girls and 18.75% of boys (p = 0.092). Only 6.25% of participants consumed coarse-grained groats or oatmeal once a day (girls 6.70%; boys 5.83%; p = 0.184). These products were consumed once a week by 52.71% of girls and 55.74% of boys (p = 0.071). More than half of the participants consumed white rice, fine-grained groats and white pasta once a week (girls 54.04%; boys 54.22%; p = 0.141). The frequency of consumption of these products by girls and boys was similar (p = 0.291).
On average, boys reported more frequent consumption of poultry meat dishes than girls. Once a week consumed them 40.25% of participants (girls 40.50%; boys 34.99%; p = 0.021), and 25% consumed them every day (girls 22.35%; boys 26.80%; p = 0.010). Children consumed poultry meat more often than red meat. Red meat was consumed most often once a week, on average by 47.24% (girls 49.52%, boys 44.97%; p = 0.000). Consumption of red meat several times a week was declared by 16.01% of girls and 34.56% of boys (p = 0.000). Participants reported high consumption of cold cuts and sausages. These products were consumed daily by 27.33% of girls and 41.37% of boys (p = 0.007). Children occasionally consumed canned meat, 65.00% of girls and 64.25% of boys did not consume canned meat at all (p = 0.694). High consumption of fried dishes, both meat and flour, was noted. Every day ate them 22.00% of children (girls 23.00%; boys 21.00%; p = 0.161), and 46% several times a week (girls 43.75%; boys 48.25%; p = 0.810). Girls consumed the above products more often than boys (p = 0.681). About 58.80% of children ate eggs once a week, and 22.01% several times a week (girls 19.04%; boys 24.99%; p=0.004). The frequency of fish consumption was low. Once a week ate them 53.05% of children (girls 53.36%; boys 52.74%; p = 0.841), and 26.33% once a month, while 17.08% did not eat fish at all.
The consumption of legumes was very low. Only 12.00% of girls and 12.50% of boys consumed them once a week, and about 45.12% 1-3 times a month (girls 43.75%; boys 46.50%; p=0.071). Legume dishes were not eaten at all by 35.10% of children (girls 35.25%; baoys 35.00%; p = 0.270). Girls consumed fruits and vegetables more often than boys. Vegetables were consumed daily by 57.48% of girls and 46.53% of boys (p=0.021), and several times a week by 26.83% and 30.58%, respectively (p=0.045). Fruit was consumed daily by 54.55% of girls and 46.26% of boys (p = 0.013).
Butter was the most frequently consumed fat. Every day consumed it 46.50% of girls and 48.25% of boys (p = 0.090), several times a week by 27.75% and 23.00%, respectively (p = 0.061). The most frequently declared consumption of fast food was 1-3 times a month declared by 52.43% of girls, and 44.36% of boys (p = 0.031), while once a week was declared by 35.62% and 48.05%, respectively (p = 0.002). Boys consumed fast food more often than girls (p = 0.016). The results showed a high consumption of sweets. Girls ate sweets more often than boys. Sweets were eaten daily by 42.25% of girls and 36.25% of boys (p = 0.040), and several times a week by 29.75% of girls and 25.50% of boys (p = 0.017). Lard was consumed very rarely. Only 6.10% of children consumed it consciously 1-3 times a month, and 92.00% declared that they did not eat it at all (girls 93.75%; boys 90.25%; p = 0.107).
Fruit juices were drunk more often than carbonated drinks by boys, and carbonated drinks more often thaj juices by girls. Participants usually chose juices once a week (girls 46.00%; boys 56.50%; p = 0.016). Juices were drunk 1-3 times once a month by 19.50% of girls and 16.25% of boys (p = 0.081). Sweetened carbonated drinks were drunk once a week by 28.00% of girls and 23.00% of boys (p = 0.101). Carbonated drinks were drunk 1-3 times a month by 38.50% of children (girls 39.75%; boys 37.25%; p = 0.767). On average, boys were more willing to drink carbonated drinks than girls (p = 0.147). In turn, energy drinks were not drunk at all by 81.75% of girls and 73.75% of boys (p = 0.030), and 16.25% drank them only 1-3 times a month (girls 15.50%; boys 17.00%; p = 0.083). Boys drank energy drinks more often than girls (p = 0.143).
Figure 3 shows the average consumption of products and drinks by children over the entire study period. The values from the indications of several times a week and every day were summed, and for less frequently consumed foods, such as fish, fruit juices, fast food, and carbonated drinks, the data from the indication of once a week was adopted.
The products most frequently consumed by children were white bread (girls 92%; boys 91.96%; p = 0.071); fruits (girls 85.10%; boys 81.16%; p = 0.097); vegetables (girls 84.31%; boys 77.11; p = 0.004), milk (girls 69.71; boys 69.35%; p = 0.911), butter (girls 74.25%; boys 71.25%; p = 0.101), cold cuts and sausages (girls 60.78%; boys 75.61%; p = 0.031), fried dishes, both flour and meat (girls 67.50%; boys 69.50%; p = 0.070), sweets (girls 71.50%; boys 61.75%; p = 0.022). Children were more likely to choose poultry than red meat (48.65% vs. 25.28%; respectively; p = 0.001), white bread was also consumed more often than wholemeal bread (91.98% vs. 34.84%; respectively; p = 0.001). Milk was consumed more often than yogurt (69.53% vs. 63.12%; respectively; p = 0.041). Most often fish was consumed once a week by 53.36% of girls, and 52.74% or boys (p = 0.187). Similarly fast food (girls 35.62%; boys 48.04%; p = 0.002). Juices were drank more often than carbonated drinks (51.25% vs. 25.50%; respectively; p = 0.001). Boys more often chose juices (girls 46%; boys 56.50%; p=0.001), while girls chose carbonated drinks (girls 28%; boys 23%; p=0.041).
3.6. Analysis of the Variability of Nutritional Behaviors
After four years, significant changes were noted in the consumption of food products, dishes and beverages in both the group of girls and boys. Figure 4 and Figure 5 present the average consumption at the beginning and at the end of the study of selected food products, dishes and beverages in the group of girls and boys. The values from the indications of several times a week and every day were summed, and for less frequently consumed foods, such as fish, fruit juices, fast food, and carbonated drinks, the data from the indication of once a week was adopted.
Girls most often consumed 4 meals a day (37.34%). Just 32.00% of girls consumed 5 meals and 25.00% 3 meals a day. Compared to the initial measurement, there was an increase in the consumption of 3 meals from 16.83% to 33.20% (p = 0.025) and a decrease in the consumption of 5 meals (from 45.54% to 18.45%; p = 0.001). At the beginning of the study, 70.25% of girls ate breakfast, and at the end 64.36% (p = 0.070). After four years, there was a decrease in snacking between meals from 91.09% to 81.06% (p = 0.088). Sweets and salty snacks between meals were eaten by 27.25% of girls, and fruit by 29.50%. Throughout the study period, the consumption of salty snacks chosen between main meals increased.
In girls, a significant increase was observed in the consumption of fruit (from 78.21% to 92.00%; p = 0.001), whole grain bread (from 32.67% to 45%; p = 0.031), fried meat and flour dishes (from 63% to 72%; p = 0.041), fatty cheeses (from 47.50% to 61.25%; p = 0.021) several times a week and fast food once a week (from 25.74% to 45.50%; p = 0.031) (Figure 4). There was also a slight increase in the consumption of milk (from 69.30% to 70.13%; p = 0.101), vegetables (from 87.13% to 81.50%; p=0.091), butter (from 73.50% to 75%; p = 0.079), sweets (from 70% to 73%; p=0.110) and carbonated drinks (from 27% to 29%; p = 0.970). The consumption of yoghurts decreased (from 69.50% to 52.50%; p=0.021); poultry meat (from 44.50% to 40%; p=0.189), red meat (from 19.80% to 12.22%; p=0.097), cold cuts and sausages (from 70.29% to 51.28%; p=0.001), eggs (from 21.78% to 17.52%; p=0.065) and juices (from 49.50% to 42.50%; p=0.091) several times a week and fish once a week (from 64.36% to 42.36%; p=0.000). The consumption of wheat bread several times a week was high both at the beginning and at the end of the study and amounted to 92.00%.
In girls, wheat bread was frequently eaten both at the beginning and at the end of the study, with an increase in its consumption (from 66.34% to 72.28%; p = 0.001). Daily consumption of wheat bread was still higher compared to wholemeal bread, with the daily consumption of wholemeal bread increasing from 13.86% to 23.50% (p = 0.140). Consumption of fine-grained groats and coarse-grained groats several times a week decreased from 43.56% to 24.04% (p = 0.001) and from 36.63% to 21.80% (p = 0.019), respectively. In girls, a decrease in the declared consumption of cold cuts and sausages was observed from 30.69% to 24.00% (p = 0.071). Poultry meat was still consumed more often than red meat. However, there was a decrease in the consumption of poultry meat dishes from 44.55% to 40.00% (p = 0.189). Compared to the begining of the study, the consumption of red meat decreased by almost 7.90% and poultry meat by 4.80%. Both at the beginning and the end of the study, fruits and vegetables were usually consumed every day, with an increase in their consumption. Daily fruit consumption increased from 40.59% to 69.00% (p = 0.001), and vegetables from 53.47% to 62% (p = 0.036). Daily butter consumption increased from 39.50% to 53.00% (p = 0.040). The consumption of fast food once a week increased significantly, from 25.74% to 45.50% (p = 0.031). The consumption of sweets every day increased from 41.00% to 43.50% (p = 0.072). Juices were usually drunk once a week, with a decrease in their consumption from 49.50% to 42.50% (p = 0.091). The consumption of carbonated drinks increased by from 27.10% to 29.20% 7% and energy drinks remained very low.
Boys most often consumed 4 meals a day (40.51%), 28.00% of boys consumed 5 meals and 27.12% 3 meals. Compared to the beginning of the study, an increase in the consumption of 3 meals was noted from 21.24% to 33% (p = 0.032) and a decrease in the consumption of 5 meals a day (from 32.74% to 23%; p = 0.091). At the beginning of the study, 68.00% of boys ate breakfast, while at the end 59.53% (p = 0.041). After four years, there was a decrease in snacking between meals from 92.04% to 83.00% (p = 0.171). Fruit between meals was eaten by 36.00% of boys, and salty snacks by 24.50%. Compared to the initial period, the consumption of fruit and salty snacks between the main meals increased.
In boys, an increase in the consumption of fruit (from 74.33% to 88%; p = 0.081), whole grain bread (from 17.69% to 44.00%; p = 0.001), fried meat and flour dishes (from 60.00% to 79.10%; p = 0.081), fatty cheeses (from 51.00% to 64.50%; p = 0.091) and fast food (from 41.59% to 55.00%; p = 0.011) was observed (Figure 5). There was also an increase in the consumption of milk (from 63.71% to 75%; p = 0.042), vegetables (from 75.22% to 79%; p = 0.191), butter (from 67% to 75.50%; p = 0.049), cold cuts and sausages (from 75.22% to 76%; p = 0.778), sweets (from 57% to 66.50%; p = 0.010) and carbonated drinks (from 20,25% to 26.50%; p = 0.780). The consumption of wheat bread was both high at the beginning and at the end of the study and amounted to 92.20%. The consumption of fermented milk drinks decreased (from 71% to 59.50%; p = 0.001); white meat (from 61.06% to 49%; p = 0.019), red meat (from 45.13% to 24%; p = 0.017), eggs (from 32.74% to 24.20%; p = 0.005) and fish (from 53.10% to 52.38%; p = 0.370) and juices (from 64.00% to 49.10%; p = 0.001).
In boys, increased consumption of milk (from 23.89% to 32.00%; p = 0.040), and fatty cheeses (from 13.50% to 20.50%; p = 0.030), while decreased the consumption of yogurt (from 17.50% to 13.50%; p = 0.132) and cottage cheese (from 14.50% to 7%; p = 0.021).
Wheat bread was often consumed both at the beginning and at the end of the study, with an increase in its daily consumption from 76.99% to 82.20% (p = 0.061). The daily consumption of wholemeal bread increased from 6.19% to 18.00% (p = 0.010). The consumption of fine-grained groats several times a week decreased from 40.71% to 28.00% (p = 0.022), and coarse-grained groats increased from 20.35% to 34.00% (p = 0.034). An increase in the daily consumption of cold cuts and sausages was observed from 32.74% to 50.00% (p = 0.001). Poultry meat was still consumed more often than red meat (55.03% vs. 34.56%; respectively; p = 0.001). After four years, a significant decrease in the consumption of poultry meat (a decrease of 12.00%) and red meat (a decrease of 20.10%) was noted. An increase in the daily consumption of fried meat or flour dishes was noted (from 15.00% to 27.20%; p = 0.001). Egg consumption decreased by 7.90% and fish by 9.00%. Both at the beginning and at the end of the study, fruits and vegetables were consumed every day, with an increase in their consumption. Daily fruit consumption was declared by 34.51% of boys at the beginning of the study and 58.00% at the end (p = 0.000), vegetables by 38.05% and 55.00%, respectively (p = 0.006). Daily butter consumption increased from 37.50% to 59.00% (p = 0.000). Daily sweets consumption increased from 34.00% to 39.20% (p = 0.002).
Figure 6 presents the average variability of children’s nutritional behaviors at the beginning and at the end of the study, without division by gender, regardless of gender. After four years, there was a significant increase in the mean consumption of fruit (from 76.27% to 90.00%; p = 0.026), whole grain bread (from 25.18% to 44.50%; p = 0.001), and milk (from 66.51% to 72.57%; p = 0.078), i.e. products that should be consumed more often in a healthy diet. In addition, there was an increase in the consumption of products that should be limited in a healthy diet, such as fried flour and meat dishes (from 61.50% to 75.50%; p = 0.450), fatty cheeses (from 49.25% to 62.87%; p = 0.021), butter (from 70.25% to 75.25%; p = 0.142), fast food (from 33.66% to %; p = 0.041), sweets (from 63.50% to 69.75%; p = 0.141), carbonated drinks (from 23.50% to 27.50%; p = 0.241). An unfavorable decrease was noted in the consumption of coarse-grained groats (from 28.49% to 27.90%; p = 0.247), vegetables (81.17% to 80.25%; p = 0.278), poultry meat (from 52.80% to 44.50%; p = 0.025), fish (from 58.73% to 47.37%; p = 0.092), eggs (from 27.26% to 20.76%; p = 0.419), yoghurts (from 70.25% to 56%; p = 0.001). Also decreased the mean consumption of red meat (from 32.46% to 18.11%; p = 0.047), cold cuts (from 72.75% to 63.64%; p = 0.097) and fruit juices (from 56.75% to 45.75%; p = 0.741), i.e. products whose consumption should be limited in a healthy diet.
3.7. Cluster Analysis
The influence of gender on favorable nutritional behaviors (average consumption of products such as vegetables, fruits, whole grains, coarse-grained groats, cottage cheese, yogurts, milk, poultry meat, eggs and water, which are recommended in a healthy diet) and unfavorable nutritional behaviors (average consumption of wheat bread, fine-grained groats and wheat pasta, rice, fried meat and flour dishes, red meat, cold cuts, canned meat, fatty cheeses, sweets, fast food and carbonated drinks and juices), BMI and FM at the beginning and end of the study were additionally evaluated by multivariate cluster analysis (Figure 7 and 8).
Figure 7 presents the analyzed parameters and nutritional behavior at the beginning of the study. The PCA graph demonstrated that nutritional behaviors of girls and boys were positively correlated, while the BMI and FM of girls and boys were negatively correlated. In girls, a significant increase in BMI and FM was noted, which was associated with an increase in unfavorable nutritional behaviors. In boys, an increase in favorable nutritional behaviors influenced a decrease in BMI and FM.
Figure 8 shows the analyzed parameters and nutritional behavior at the final measurements. At the end of the study, the nutritional behavior of girls and boys were similar, but an increase in BMI and FM was observed in girls. An increase in BMI was associated with higher FM values and unfavorable nutritional behaviors in girls and boys. At the end of the study, significant differences were noted in nutritional behaviors, BMI and FM. A positive correlation was demonstrated for nutritional behaviors, while a negative correlation was demonstrated for BMI and FM. In girls, an increase in unfavorable nutritional behaviors correlated more strongly with an increase in BMI and FM than at the beginning of the study. In boys, an increase in unfavorable nutritional behaviors correlated more strongly with an increase in BMI than FM. More favorable nutritional behaviors in boys resulted in a lower FM.
Discussion
These study showed an increase in overweight and obesity with age, regardless of gender. Girls were on average more overweight and obese than boys throughout the study period. Nutritional behaviors were similar in both girls and boys. After four years, the frequency of unfavorable nutritional behaviors increased significantly in the whole group. This is consistent with previous studies, which also showed that nutritional behaviors, BMI and FM changed with the age of children [10,16,44,45]
The BMI was similar between girls and boys, at the beginning of the study it was on average 18.34 kg/m2 and at the end of the study it was 21.29 kg/m2. Lower BMI values were observed in the study by Deren et al. (2020) [46]. They showed that the average BMI of children aged 10 was 17.40 kg/m2 (girls 17.10kg/m2 ; boys 17.70kg/m2) and at the age of 14, it was higher compared to our observations and amounted to 19.25 kg/m2 (girls 19.50; boys 19.50) [46]. However, higher BMI values of children aged 14 were noted in the study by Vehrs et al. (2022) [47]. The prevalence of overweight and obesity in school-age children is high. [48]. Our results also support these observations. During the entire study period, 11.52% of children were obese (girls 12.53%; boys 10.50%), 14.45% were overweight (girls 15.76%; boys 13.12%), 10.67% were underweight (girls 10.74%; boys 10.61%) and 63.36% were normal weight (girls 60.96%; boys 65.76%). On average, about 25.00% of children were overweight. Our values are higher than the global data showing that 22.20% of children and adolescents under 18 years of age are overweight [44]. We found that girls were more overweight than boys (girls 28.29%; boys 23.63%). A different observation was made by Deren et al. (2020), where the incidence of overweight was significantly higher in boys than in girls [46]. Furthermore, in the cited work, it was observed that, regardless of gender, the percentage of children with normal body weight increased with age [46]. After four years, we observed an increase in BMI in both boys and girls. We observed that, in girls, an increase in BMI was associated with an increase in FM, and in boys, an increase in BMI was not associated with an increase in FM. Our results are consistent with the results of Stierman et al. (2021) [45]. These results confirmed that the increase in BMI with age in boys is mainly attributed to an increase in lean mass, while in girls it is mainly due to an increase in body fat mass [45]. Our study used data collected before and after the COVID-19 pandemic ended. Recent studies demonstrated the impact of the pandemic on the increase in obesity share in school-age children, mainly due to remote learning, increased screen time, and reduced PA and other sedentary behaviors [49]. In our study, between the initial measurement (before the pandemic) and the final measurement (just after ending), an increase in the percentage of children with excess body weight (overweight and obesity) was observed in girls from 27.09% to 29.50%, in boys from 21.26% to 26.00%. Similar results were obtained by Larteya et al. (2023), who showed a significant increase in the percentage of children who were obese [50]. Woolford et al. (2021) also reported an significant increase in excess body weight during the COVID-19 pandemic [51].
Body fat content changes with age, and also depends on gender. During puberty, boys experience a decrease in body fat due to a faster increase in lean mass, whereas in girls, an increase in body fat is observed. The higher and increasing amount of adipose tissue in school-age girls is physiological and results from puberty in this period. Our study also noted a higher fat mass content in girls (girls 23.17%; boys 16.20%). The above findings are consistent with other studies [30,52].
According to the recommendations, the body fat mass should be lower than 30.00% in girls and lower than 22.50% in boys [30]. In our study, the mean body fat mass was 23.17% in girls and 16.20% in boys. The body fat mass expressed in kg in girls was 8.73 kg at the beginning of the study and 14.88 kg at the end, and in boys 7.49 kg and 9.87 kg, respectively. Girls had on average a higher body fat mass expressed in kilograms than boys (11.80 kg and 8.68 kg, respectively; p= 0.001). In the study by Shypailo et al. (2020), the average values of body fat mass for children aged 10-12 were similar and amounted to 11.40 kg in girls and 10.00 kg in boys, while for children aged 13-15, 15.60 kg and 14.50 kg, respectively [53]. At the end of the study, the percentage of body fat mass was 24.57% in girls and 14.60% in boys. Similar results were obtained in the study by Vehrs et al. (2022), where the percentage of body fat mass in 14-year-old boys was 14.10%, and in girls it was higher compared to our observations and amounted to 29.40% [47]. During the study, an increase in body fat mass was noted in girls and a decrease in boys. In girls, there was a mean increase in FN from 21.77% to 24.57%, and in boys, a decrease from 17.80% to 14.60%, and in the group of girls. Similarly, Stiermana et al. (2021) reported a decrease in the percentage of body fat mass in boys around the age of 11 years, while in girls there was an increase [45]. Zhao et al. [2023] showed that the percentage of body fat mass in girls increased significantly between the ages of 11 and 15 years, and in boys aged 11–14 years it tended to decrease [54]. Our data are consistent with previous reports that, although BMI and FM values were similar in boys and girls, there were clear gender differences in the percentage of children with excess body weight [55,56].
It was shown that with age, the percentage of children with unfavorable nutritional behaviors increased in both girls and boys. Many studies confirm that following a Mediterranean diet can help maintain a healthy body weight and prevent obesity early in life [16]. Only a small number of the children showed daily intake of whole grain products, vegetables, fruits, yogurts and cottage cheeses. An even smaller percentage of the study participants consumed fish, legumes, coarse-grained groats, oatmeal and whole grain bread, which could have contributed to higher BMI and FM. The unfavorable nutritional behaviors shown in this study were also noted in the works of other authors [7,58,59]. As in this work, Lytle et al. (2020) showed that the consumption of breakfast, fruit, vegetables and milk decreased with age [7].
Throughout the study period, we observed a high consumption of fried meat and flour dishes, fatty cheeses, butter, sweets, and fruit juices. The consumption of the above products increased with the age of the children, which likely had a significant impact on body mass and body fat content. With age, the consumption of fast food and sweets increased significantly in both boys and girls. The frequent consumption of sweets, fast food, and carbonated drinks is one of the most harmful nutritional behaviors among children and adolescents. Our study showed that participants most often consumed fast food once a week (girls 35.62%; boys 48.05%), while sweets every day (girls 42.25%; boys 36.25%). Similar results were observed in the work of Scaglioni et al. (2018), where 41.00% of teenagers consumed fast food once a week [60]. Our study showed a moderate consumption of carbonated drinks, to our surprise, the consumption of carbonated drinks decreased at the age of 14. Jakobsen et al. (2023) showed that high consumption of sweetened carbonated drinks and fast food was the main risk factor for overweight [57]. It is also suggested that school-age children who eat a lot of processed foods are more likely to become overweight and obese [23,24,25]. Contrary to dietary recommendations, fruits were more often consumed than vegetables, and wheat bread was more often consumed than whole grains. Additionally, fine-grained groats, white rice, and wheat pasta were more often eaten compared to oatmeal, whole grain pasta, and coarse-grained groat. Similarly, Hurr et al. (2012) found that children and adolescents do not consume enough whole grain products [61]. Jakobsen et al. (2023) demonstrated that higher consumption of meat and wheat bread was associated with an increased risk of overweight and obesity, while higher consumption of whole grain products was associated with a reduced risk [57].
Our study demonstrated that girls consumed milk, yogurt, whole grain bread, fruit and vegetables more often than boys. This was consistent with the findings of Hamuka et al. (2018), who showed that girls had greater nutritional knowledge than boys [58]. Boys were more likely to consume poultry meat, red meat, cold cuts and sausages, and eggs than girls. It is worth mentioning that girls were more likely to consume sweet and salty snacks than boys.
Banfield et al. (2016) and Winpenny et al. (2018) demonstrated that the quality of the diet of adolescents is less favorable than that of younger children [62,63]. Our observations are in agreement with the above. After four years, we observed a decrease in the consumption of coarse-grained groats, eggs, poultry and red meat, fish, and cottage cheese. However, consumption of fast food, fried meat, flour dishes, butter, and fatty cheeses increased. The deterioration in nutritional behaviors in the study group probably influenced the increase in BMI and body fat.
Although our study yielded many observations, it also has some limitations. First, the study was limited to a relatively small group of participants. The study could be further extended to include teenagers of a different age and from a wider geographical area. The questionnaire only included a question about the frequency of consumption of various food products, without taking into consideration the quantity. Another limitation was the anonymity of the study, which made it impossible to compare changes in nutritional behaviors of individual children and correlates with BMI and FM. The influence of the economic situation on the formation of lifestyle and nutritional behaviors is often suggested, but this aspect was not included in this study.
Conclusions
In the studied group of children, there were significant differences in BMI, FM and nutritional behaviors between girls and boys, as well as between the ages of 10 and 14. With age, an increase in the frequency of excessive body weight was observed, particularly in girls. Body fat mass was significantly higher at the end of the study, especially in girls, while body fat mass decreased in boys. Girls were characterized by a higher percentage of overweight and obesity interpreted based on percentile charts of body fat content and BMI. Children showed moderate nutritional behaviors, but with age, unfavorable nutritional behaviors intensified, especially in boys. Despite this, girls were more willing to eat sweets and salty snacks than boys. During the study, an increase in the body fat mass was noted in girls and a decrease in boys. On average, in the studied group an increase in BMI was associated with an increase in body fat mass in girls, but not in boys.
With age, in the evaluated group unfavorable nutritional behaviors and excessive body weight share increased. A higher overweight and obesity share and a higher body fat content were more often in girls than boys. Although girls’ nutritional behaviors were more healthy, they were at a higher risk of excessive body weight. Increasing the promotion of healthy nutritional behaviors and elevated physical activity to decrease overweight and obesity in children and adolescents is highly recommended.
Author Contributions
Conceptualization, W.K.; methodology, K.Ł. and W.K.; software, J.T.; validation, K.Ł. and E.K.-N.; formal analysis, E.K.-N.; investigation, K.Ł. and W.K.; resources, E.K.-N.; data curation, J.T.; writing—original draft preparation, K.Ł.; writing—review and editing, W.K.; visualization, J.T.; supervision, W.K. All authors have read and agreed to the published version of the manuscript.
Funding
This research received no external funding.
Institutional Review Board Statement
The study was conducted in accordance with the Declaration of Helsinki, and approved by the University of Siedlce Ethics Committee (protocol code 2/2016, dated 28.12.2016).
Informed Consent Statement
Informed consent was obtained from all subjects involved in the study.
Data Availability Statement
The data supporting reported results are available on request from corresponding author.
Acknowledgments
We expressed our thanks to the adolescents taking part in the study, as well as their parents and educators, for their time and engagement in the study.
Conflicts of Interest
The authors declare no conflicts of interest.
Abbreviations
The following abbreviations are used in this manuscript:
| BIA | Bioelectrical Ampenance Analysis |
| BMI | Body Mass Index |
| FM | Fat Mass |
| PCA | Principal Component Analysis |
References
- World Obesity Federation. World Obesity Atlas 2024. Available online: https://data.worldobesity.org/publications/WOF-Obesity-Atlas-v7.pdf (accessed on 20 January 2025).
- World Health Organization. Obesity and overweight. Available online: https://www.who.int/news-room/fact-sheets/detail/obesity-and-overweight. (accessed on 14 February 2025).
- Iacopetta, D.; Catalano, A.; Ceramella, J.; Pellegrino, M.; Marra, M.; Scali, E. ; Sinicropi.; M.S.; Aquaro, S. The Ongoing Impact of COVID-19 on Pediatric Obesity. Pediatr Rep, 16.
- World Obesity Federation. World Obesity Atlas 2023. Available online: https://data.worldobesity.org/publications/?cat=19 (accessed on 12 January 2025).
- Mazur, J.; Małkowska-Szkutnik, A. , editors. Zdrowie Uczniów w 2018 Roku na tle Nowego Modelu Badań HBSC. Mother and Child Institute; Warsaw, Poland. . Available online: https://imid.med.pl/files/imid/Aktualnosci/Aktualnosci/raport%20HBSC%202018.pdf. (accessed on 22 February 2025).
- Fijałkowska, A.; Oblacińska, A.; Stalmach, M. Nadwaga i Otyłość u Polskich 8-Latków w Świetle Uwarunkowań Biologicznych, Behawioralnych i Społecznyboys Raport z Międzynarodowych Badań WHO European Childhood Obesity Surveillance Initiative (COSI). Warszawa. 2017. Available online: https://imid.med.pl/files/imid/Do%20pobrania/Raport%20COSI_kwiecie%C5%84.pdf (accessed on 11 Februare 2025).
- Lytle, L.; Seifert, S.; Greenstein, J.; Mcgovern, P. How do children’s eating patterns and food choices change over time? results from a Ccohort study. Am J Heal Promot 2000, 14, 222–228. [Google Scholar]
- Lillico, H.G.; Hammond, D.; Manske, S.; Murnaghan, D. The prevalence of eating behaviors among Canadian youth using cross-sectional school-based surveys. BMC Public Health. 2014, 14, 323–235. [Google Scholar]
- Kolanowski, W.; Ługowska, K.; Trafialek, J. The Impact of Physical Activity at School on Eating Behaviour and Leisure Time of Early Adolescents. Int J Environ Res Public Health. 2022, 19, 16490. [Google Scholar] [PubMed]
- Lombardo, M.; Amoah, I.; Feraco, A.; Guseva, E.; Gorini, S.; Camajani, E.; Armani, A.; Padua, E.; Caprio, M. Gender Differences in Taste and Food Habits: Implications for Personalized Nutrition. Biol. Life Sci. Forum 2023, 29, 1. [Google Scholar] [CrossRef]
- Deslippe, A.L.; Tugault-Lafleur, C.N.; McGaughey, T.; Naylor, P.P.J.; Le Mare, L.; Masse, L.C. Gender plays a role in adolescents’ dietary behaviors as they transition to secondary school. Appetite 2021, 167, 105642. [Google Scholar]
- Food and Agriculture Organization of the United Nations. Influencing Food Environments for Healthy Diets; FAO: Rome, Italy, 2016; Available online: https://openknowledge.fao.org/server/api/core/bitstreams/1c4161e0-8858-4183-b39f-4c76cba27304/content (accessed on 10 December 2024).
- National Center of Nutrition Education. Healthy Eating Plate. Available online: https://ncez.pzh.gov.pl/abc zywienia/talerz-zdrowego-zywienia/ (accessed on 2 November 2024).
- Kozioł-Kozakowska, A. Adequate Nutrition in Early Childhood. Children (Basel). 2023, 10, 1155. [Google Scholar]
- Naczelna Izba Kontroli. Wdrażanie zasad zdrowego żywienia w szkołach publicznych 2015–2016. Available online: https://www.nik.gov.pl/plik/ id,14601,vp,17066.pdf (accessed on 15 December 2024).
- Lopez-Gil, J.F.; Garcia-Hermoso, A.; Sotos-Prieto, M.; Cavero-Redondo, I.; Martinez-Vizcaino, V.; Kales, S.N. Mediterranean Diet-Based Interventions to Improve Anthropometric and Obesity Indicators in Children and Adolescents: A Systematic Review with Meta-Analysis of Randomized Controlled Trials. Adv Nutr. 2023, 14, 858–869. [Google Scholar]
- Martínez-Lacoba, R.; Pardo-Garcia, I.; Amo-Saus, E.; Escribano-Sotos, F. Mediterranean diet and health outcomes: a systematic meta-review. Eur. J. Public Health. 2018, 28, 955–961. [Google Scholar]
- Cabrera, S.G.; Herrera Fernández, N.; Rodríguez Hernández, C.; Nissensohn, M.; Román-Viñas, B.; Serra-Majem, L. KIDMED test; prevalence of low adherence to the Mediterranean diet in children and young; a systematic review. Nutr. Hosp 2015, 32, 2390–2399. [Google Scholar]
- World Health Organization. WHO European Regional Obesity Report 2022. World Health Organization; Geneva, Switzerland: Available online:. Available online: https://apps.who.int/iris/bitstream/handle/10665/353747/9789289057738-eng.pdf]. (accessed on 20 January 2025).
- Dettlaff-Dunowska, M.; Brzeziński, M.; Zagierska, A.; Borkowska, A.; Zagierski, M.; Szlagatys-Sidorkiewicz, A. Changes in Body Composition and Physical Performance in Children with Excessive Body Weight Participating in an Integrated Weight-Loss Programme. Nutrients 2022, 14, 3647. [Google Scholar] [CrossRef]
- Ługowska, K.; Kolanowski, W.; Trafialek, J. The Impact of Physical Activity at School on Children’s Body Mass during 2 Years of Observation. Int. J. Environ. Res. Public Health. 2022, 19, 3287. [Google Scholar] [CrossRef] [PubMed]
- Kolanowski, W.; Ługowska, K. The Effectiveness of Physical Activity Intervention at School on BMI and Body Composition in Overweight Children: A Pilot Study. Appl. Sci. 2024, 14, 7705. [Google Scholar] [CrossRef]
- Ng, A.K.; Hairi, N.N.; Jalaludin, M.Y.; Majid, H.A. Dietary intake, physical activity and muscle strength among adolescents: The Malaysian Health and Adolescents Longitudinal Research Team (MyHeART) study. BMJ Open. 2019, 9, 026275. [Google Scholar] [CrossRef] [PubMed]
- Dortch, K.S.; Gay, J.; Springer, A.; Kohl, H.W.; Sharma, S.; Saxton, D.; Wilson, K.; Hoelscher, D. The Association between Sport Participation and Dietary Behaviors among Fourth Graders in the School Physical Activity and Nutrition Survey, 2009–2010. Am. J. Health Promot. 2014, 29, 99–106. [Google Scholar]
- Borga, M.; West, J.; Bell, J.D.; Harvey, N.C.; Romu, T.; Heymsfield, S.B. Advanced body composition assessment: From body mass index to body composition profiling. J. Investig. Med. 2018, 66, 1–9. [Google Scholar] [CrossRef]
- Kułaga, Z.; Różdżyńska, A.; Palczewska, I. Percentile charts of height, body mass and body mass index in children and adolescents in Poland—Results of the OLAF study. Stand. Med. Pediatr. 2010, 7, 690–700. [Google Scholar]
- Laskey, M.A. Dual-energy X-ray absorptiometry and body composition. Nutrition 1996, 12, 45–51. [Google Scholar] [CrossRef]
- Verney, J.; Metz, L.; Chaplais, E.; Cardenoux, C.; Pereira, B.; Thivel, D. Bioelectrical impedance is an accurate method to assess body composition in obese but not severely obese adolescents. Nutr. Res. 2016, 36, 663–670. [Google Scholar] [CrossRef]
- Seo, Y.G.; Kim, J.H.; Kim, Y.; Lim, H.; Ju, Y.S.; Kang, M.J.; Lee, K.; Lee, H.J.; Jang, H.B.; Park, S.I.; et al. Validation of body composition using bioelectrical impedance analysis in children according to the degree of obesity. Scand. J. Med. Sci. Sports. 2018, 28, 2207–2215. [Google Scholar] [CrossRef]
- McCarthy, H.D.; Cole, T.J.; Fry, T.; Jebb, S.A.; Prentice, A.M. Body fat reference curves for children. Int. J. Obes. 2006, 30, 598–602. [Google Scholar] [CrossRef]
- McCarthy, H.D.; Samani–Radia, D.; Jebb, S.A.; Prentice, A.M. Skeletal muscle mass reference curves for children and adolescents. Pediatr. Obes. 2014, 9, 249–259. [Google Scholar] [PubMed]
- Ługowska, K.; Kolanowski, W. The Impact of Physical Activity at School on Body Fat Content in School-Aged Children. Int J Environ Res Public Health 2022, 19, 12514. [Google Scholar] [PubMed]
- Faul, F.; Erdfelder, E.; Lang, A.G.; Buchner, A. G*Power 3: A flexible statistical power analysis program for the social, behavioral, and biomedical sciences. Behav. Res. Methods 2007, 39, 175–191. [Google Scholar] [CrossRef]
- Lisinskiene, A.; Lochbaum, M. The Coach-Athlete-Parent Relationship: The Importance of the Sex, Sport Type, and Family Composition. Int. J. Environ. Res. Public Health 2022, 19, 4821. [Google Scholar] [CrossRef] [PubMed]
- Kułaga, Z.; Grajda, A.; Gurzkowska, B.; Góźdź, M.; Wojtyło, M.; Świąder, A.; Różdżyńska-Świątkowska, A.; Litwin, M. Polish 2012 growth references for preschool children. Eur. J. Pediatr. 2013, 172, 753–761. [Google Scholar]
- Ługowska, K.; Krzęcio-Nieczyporuk, E.; Trafiałek, J.; Kolanowski, W. The Impact of Increased Physical Activity at School on the Nutritional Behavior and BMI of 13-Year-Olds. Nutrients. 2024, 16, 4329. [Google Scholar]
- Jeżewska-Zychowicz, M.; Gawęcki, J.; Wądołowska, L.; Czarnocińska, J.; Galiński, G.; Kołłajtis-Dołowy, A.; Roszkowski, W.; Wawrzyniak, A.; Przybyłowicz, K.; Stasiewicz, B. Kwestionariusz do Badania Poglądów i Zwyczajów Żywieniowych dla Osób w Wieku od 16 do 65 lat. Polish Academy of Nciences; Warsaw, Poland: 2020. pp. 22–34.
- World Medical Association. World Medical Association Declaration of Helsinki. Bull World Health Organ. 2013, 79, 373–374. [Google Scholar]
- Farbo, D.J.; Rhea, D.J. A Pilot Study Examining Body Composition Classification Differences between Body Mass Index and Bioelectrical Impedance Analysis in Children With High Levels of Physical Activity. Front. Pediatr. 2021, 9, 724053. [Google Scholar]
- Marfell-Jones, M.; Old, T.; Steward, A.; Carter, J.E.L. International Standards for Anthropometric Assessment; ISAK: Palmerston North, New Zeland, 2012. [Google Scholar]
- Orsso, C.E.; Gonzalez, M.C.; Maisch, M.J.; Haqq, A.M.; Prado, C.M. Using bioelectrical impedance analysis in children and adolescents: Pressing issues. Eur. J. Clin. Nutr. 2022, 76, 659–665. [Google Scholar]
- Tanita SC-240MA Instruction Manual. Tanita User Manual SC 240 MA. Available online: https://www.manualslib.com/manual/1065295/Tanita-Sc-240ma.html (accessed on 12 October 2020).
- Sullivan, G.M.; Feinn, R. Using Effect Size—Or Why the P Value Is Not Enough. J. Grad. Med. Educ. 2012, 4, 279–282. [Google Scholar]
- Zhang, X.; Liu, J.; Ni, Y.; Yi, C.; Fang, Y.; Ning, Q.; Shen, B.; Zhang, K.; Liu, Y.; Yang, L.; Li, K.; Liu, Y.; Huang, R.; Li, Z. Global Prevalence of Overweight and Obesity in Children and Adolescents: A Systematic Review and Meta-Analysis. JAMA Pediatr. 2024, 178, 800–813. [Google Scholar] [PubMed]
- Stierman, B.; Ogden, C.L.; Yanowski, J.A.; Martin, C.B.; Sarafrazi, N.; Hales, C.M. Changes in adiposity among children and adolescents in the United States, 1999–2006 to 2011–2018. Am. J. Clin. Nutr. 2021, 114, 1495–1504. [Google Scholar]
- Deren, K.; Wyszynska, J.; Nyankovsky, S.; Nyankovska, O.; Yatsula, M.; Łuszczki, E.; Sobolewski, M.; Mazur, A. Assessment of body mass index in a pediatric population aged 7-17 from Ukraine according to various international criteria-A cross-sectional study. PLoS One. 2020, 15, e0244300. [Google Scholar]
- Vehrs, P.R.; Fellingham, G.W.; McAferty, A.; Kelsey, L. Trends in BMI Percentile and Body Fat Percentage in Children 12 to 17 Years of Age. Children (Basel). 2022, 9, 744. [Google Scholar]
- Kułaga, Z.; Grajda, A.; Gurzkowska, B.; Wojtyło, M.A.; Góźdź, M.; Litwin, M.S. The Prevalence of Overweight and Obesity among Polish School-Aged Children and Adolescents. Przegl. Epidemiol. 2016, 70, 641–651. [Google Scholar] [PubMed]
- Browne, N.T.; Snethen, J.A.; Greenberg, C.S.; Frenn, M.; Kilanowski, J.F.; Gance-Cleveland, B.; Burke, P.J.; Lewandowski, L. When Pandemics Collide: The Impact of COVID-19 on Childhood Obesity. J. Pediatr. Nurs. 2020, 56, 90. [Google Scholar]
- Lartey, S.T.; Jayawardene, W.P.; Dickinson, S.L.; Chen, X.; Gletsu-Miller, N.; Lohrmann, D.K. Evaluation of Unintended Consequences of COVID-19 Pandemic Restrictions and Obesity Prevalence Among Youths. JAMA Netw. Open. 2023, 6, e2323596. [Google Scholar]
- Woolford, S.J.; Sidell, M.; Li, X.; Else, V.; Young, D.R.; Resnicow, K.; Koebnick, C. Changes in Body Mass Index Among Children and Adolescents During the COVID-19 Pandemic. JAMA. 2021, 326, 1434–1436. [Google Scholar]
- Santos, L.P.; Santos, I.S.; Matijasevich, A.; Barros, A.J.D. Changes in overall and regional body fatness from childhood to early adolescence. Sci. Rep. 2019, 9, 1888. [Google Scholar]
- Shypailo, R.J.; Wong, W.W. Fat and fat-free mass index references in children and young adults: assessments along racial and ethnic lines. Am J Clin Nutr. 2020, 112, 566–575. [Google Scholar]
- Zhao, Y.; Gong, J.X.; Ji, Y.T.; Zhao, X.Y.; He, L.; Cai, SZ.; Yan, X.M. Cross-sectional study of characteristics of body composition of 24,845 children and adolescents aged 3-17 years in Suzhou. BMC Pediatr. 2023, 23, 358. [Google Scholar]
- Nevill, A.M.; Reuter, C.P.; Brand, C.; Gaya, A.R.; Mota, J.; Renner, J.D.P.; Duncan, M.J. BMI fails to reflect the developmental changes in body fatness between boys and girls during adolescence. Int. J. Environ. Res. Public Health. 2021, 18, 7833. [Google Scholar] [PubMed]
- Freedman, D.S.; Wang, J.; Maynard, L.M.; Thorton, J.C.; Mei, Z.; Pierson, R.N.; Dietz, W.H.; Horlick, M. Relation of BMI to fat and fat-free mass amoung children and adolescents. Int. J. Obes. 2005, 29, 1–8. [Google Scholar]
- Jakobsen, D.D.; Brader, L.; Bruun, J.M. Association between Food, Beverages and Overweight/Obesity in Children and Adolescents-A Systematic Review and Meta-Analysis of Observational Studies. Nutrients 2023, 15, 764. [Google Scholar] [CrossRef] [PubMed]
- Hamulka, J.; Wadolowska, L.; Hoffmann, M.; Kowalkowska, J.; Gutkowska, K. Effect of an Education Program on Nutrition Knowledge, Attitudes toward Nutrition, Diet Quality, Lifestyle, and Body Composition in Polish Teenagers. The ABC of Healthy Eating Project: Design, Protocol, and Methodology. Nutrients 2018, 10, 1439. [Google Scholar] [CrossRef]
- Lima, N.M.D.S.; Leal, V.S.; Oliveira, J.S.; Andrade, M.I.S.; Santos, N.F.D.; Pessoa, J.T.; Aquino, N.B.; Lira, P.I.C. Excess weight in adolescents and associated factors: Data from the ERICA study. J. Pediatr. 2021, 97, 676–684. [Google Scholar]
- Scaglioni, S.; De Cosmi, V.; Ciappolino, V.; Parazzini, F.; Brambilla, P.; Agostoni, C. Factors Influencing Children’s Eating Behaviours. Nutrients 2018, 10, 706. [Google Scholar] [CrossRef]
- Hur, I.Y.; Reicks, M. Relationship between whole-grain intake, chronic disease risk indicators, and weight status among adolescents in the National Health and Nutrition Examination Survey, 1999–2004. J. Acad. Nutr. Diet. 2012, 112, 46–55. [Google Scholar]
- Banfield, E.C.; Liu, Y.; Davis, J.S.; Chang, S.; Frazier-Wood, A.C. Poor adherence to US dietary guidelines for children and adolescents in the National Health and Nutrition Examination Survey population. J. Acad. Nutr. Diet. 2016, 116, 21–7. [Google Scholar]
- Winpenny, E.M.; van Sluijs, E.M.F.; White, M.; Klepp, K.I.; Wold, B.; Lien, N. Changes in diet through adolescence and early adulthood: longitudinal trajectories and association with key life transitions. Int J Behav Nutr Phys Act. 2018, 15, 86. [Google Scholar]
Figure 1.
BMI categories of studied children in the initial (2017) and final (2021) measurement session.
Figure 1.
BMI categories of studied children in the initial (2017) and final (2021) measurement session.
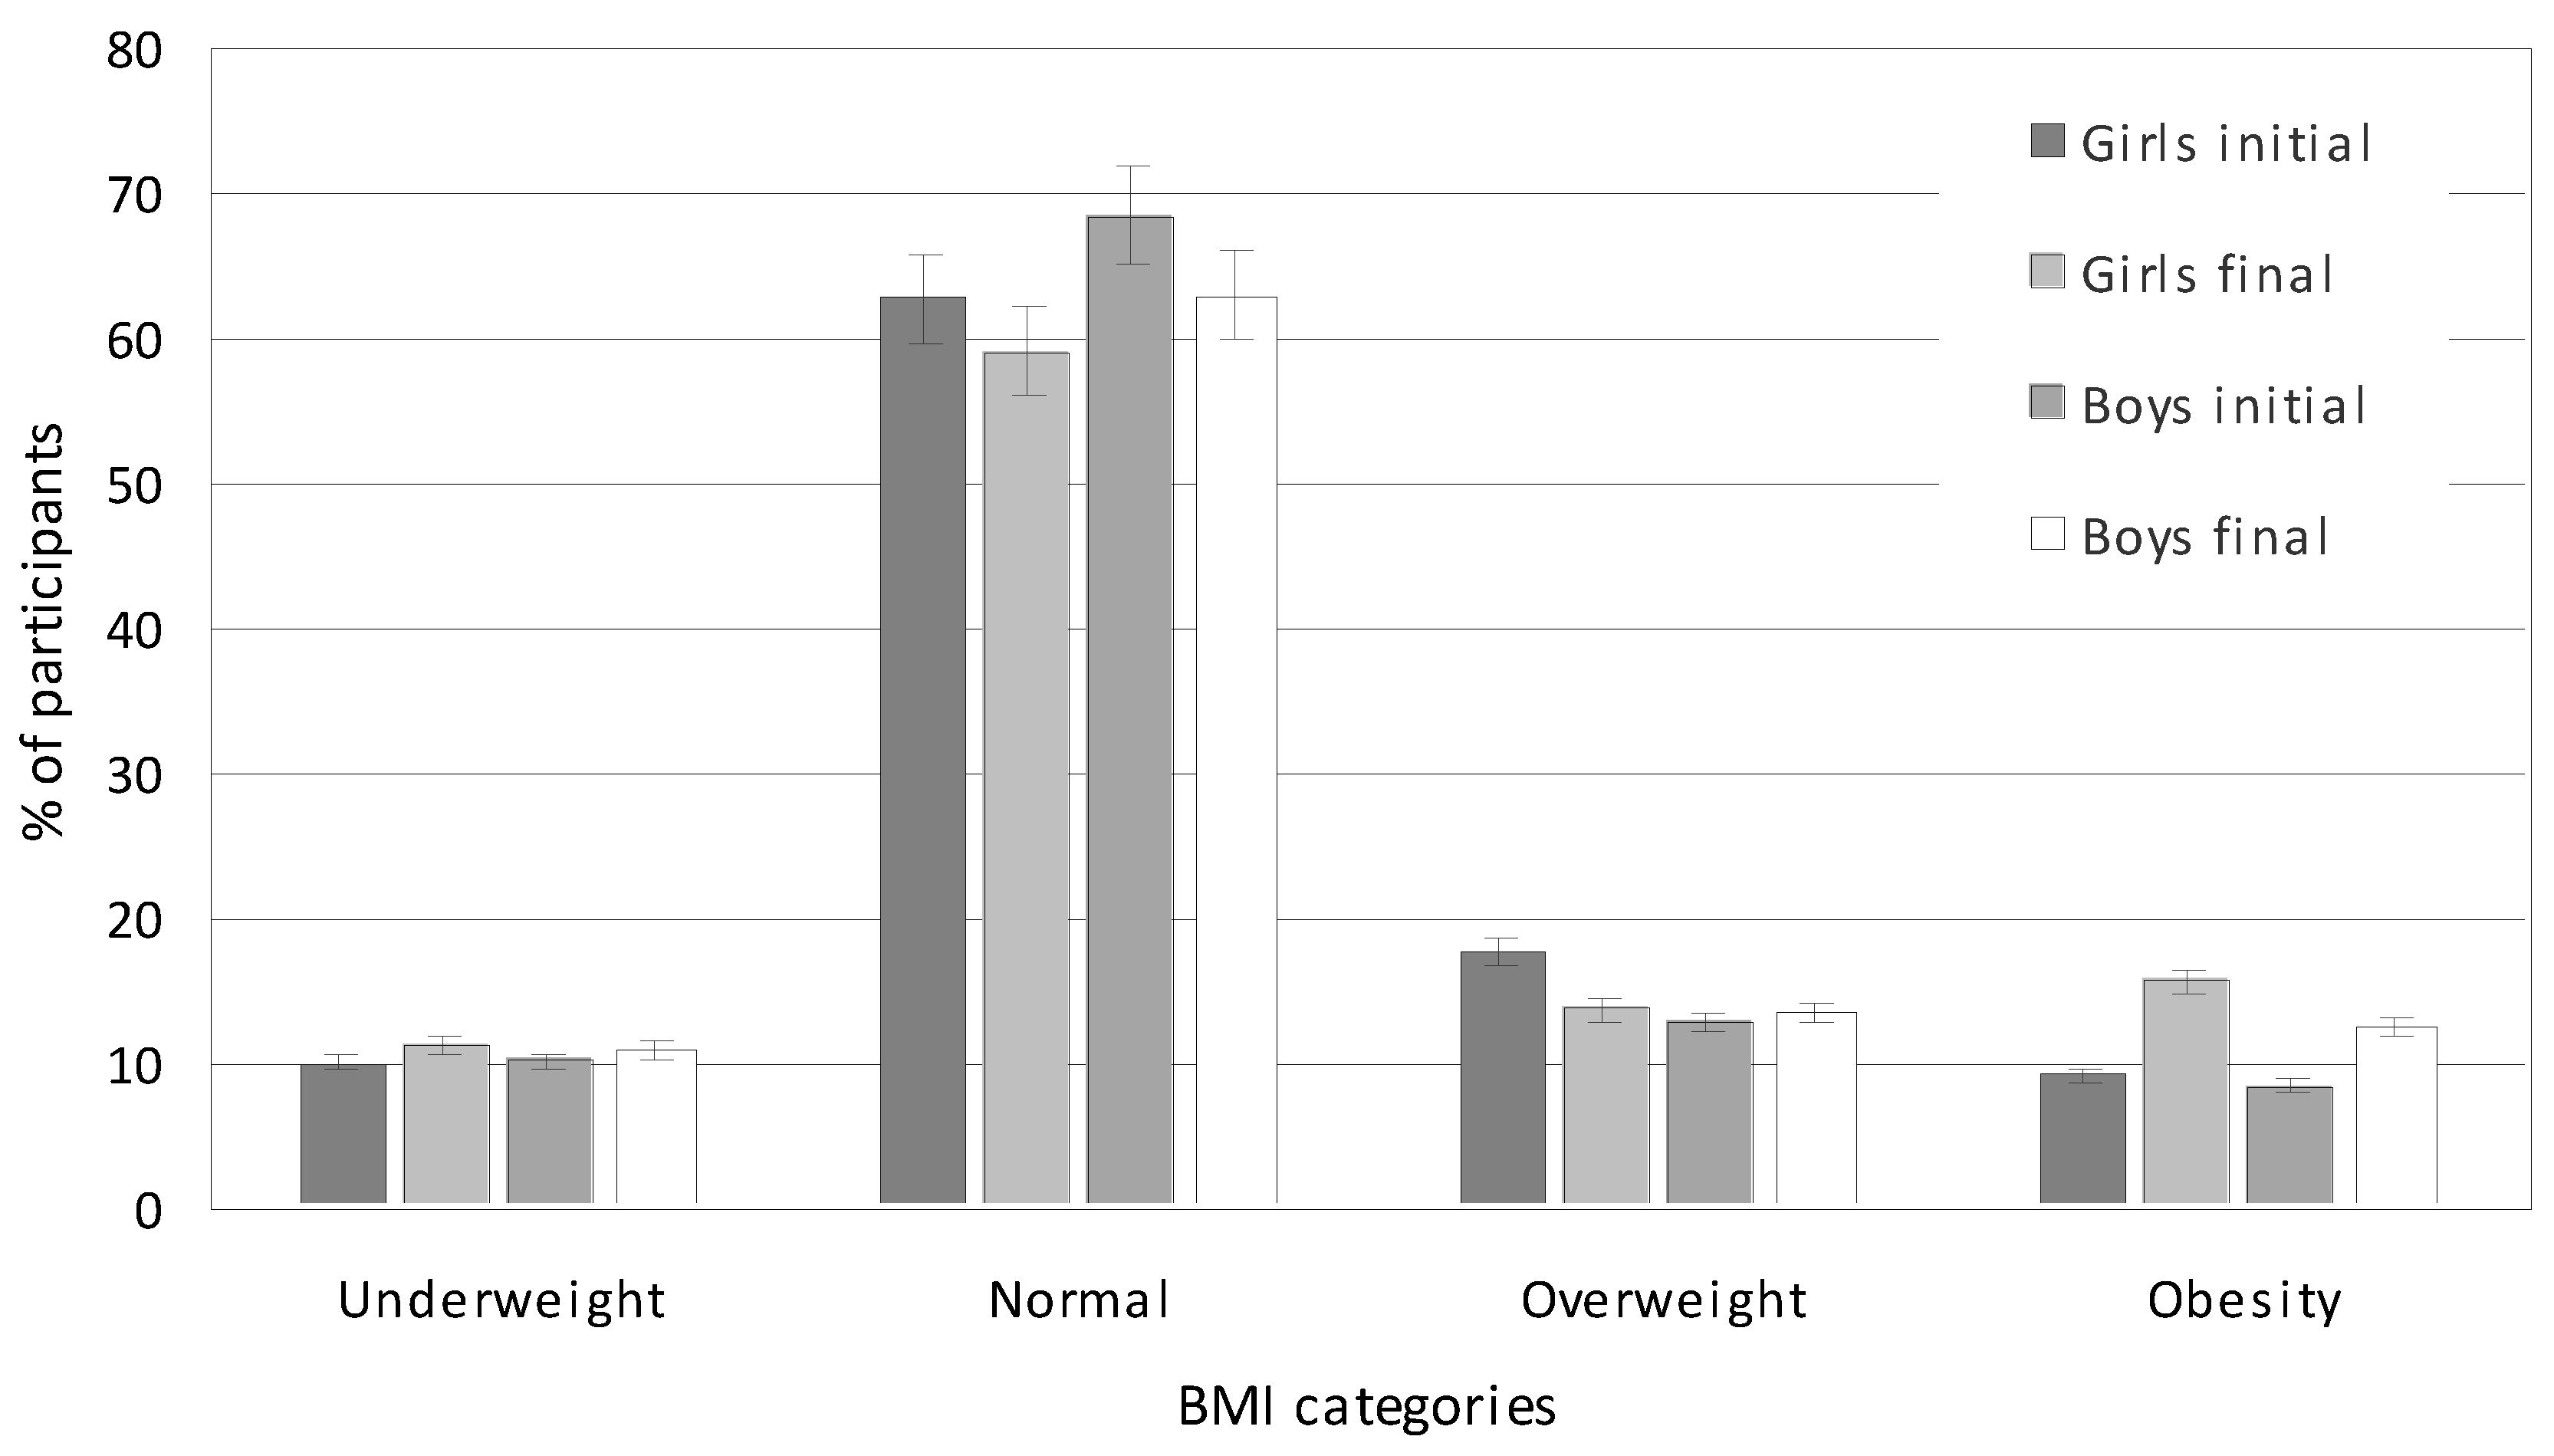
Figure 2.
FM categories of studied children in the initial (2017) and final (2021) measurement session.
Figure 2.
FM categories of studied children in the initial (2017) and final (2021) measurement session.
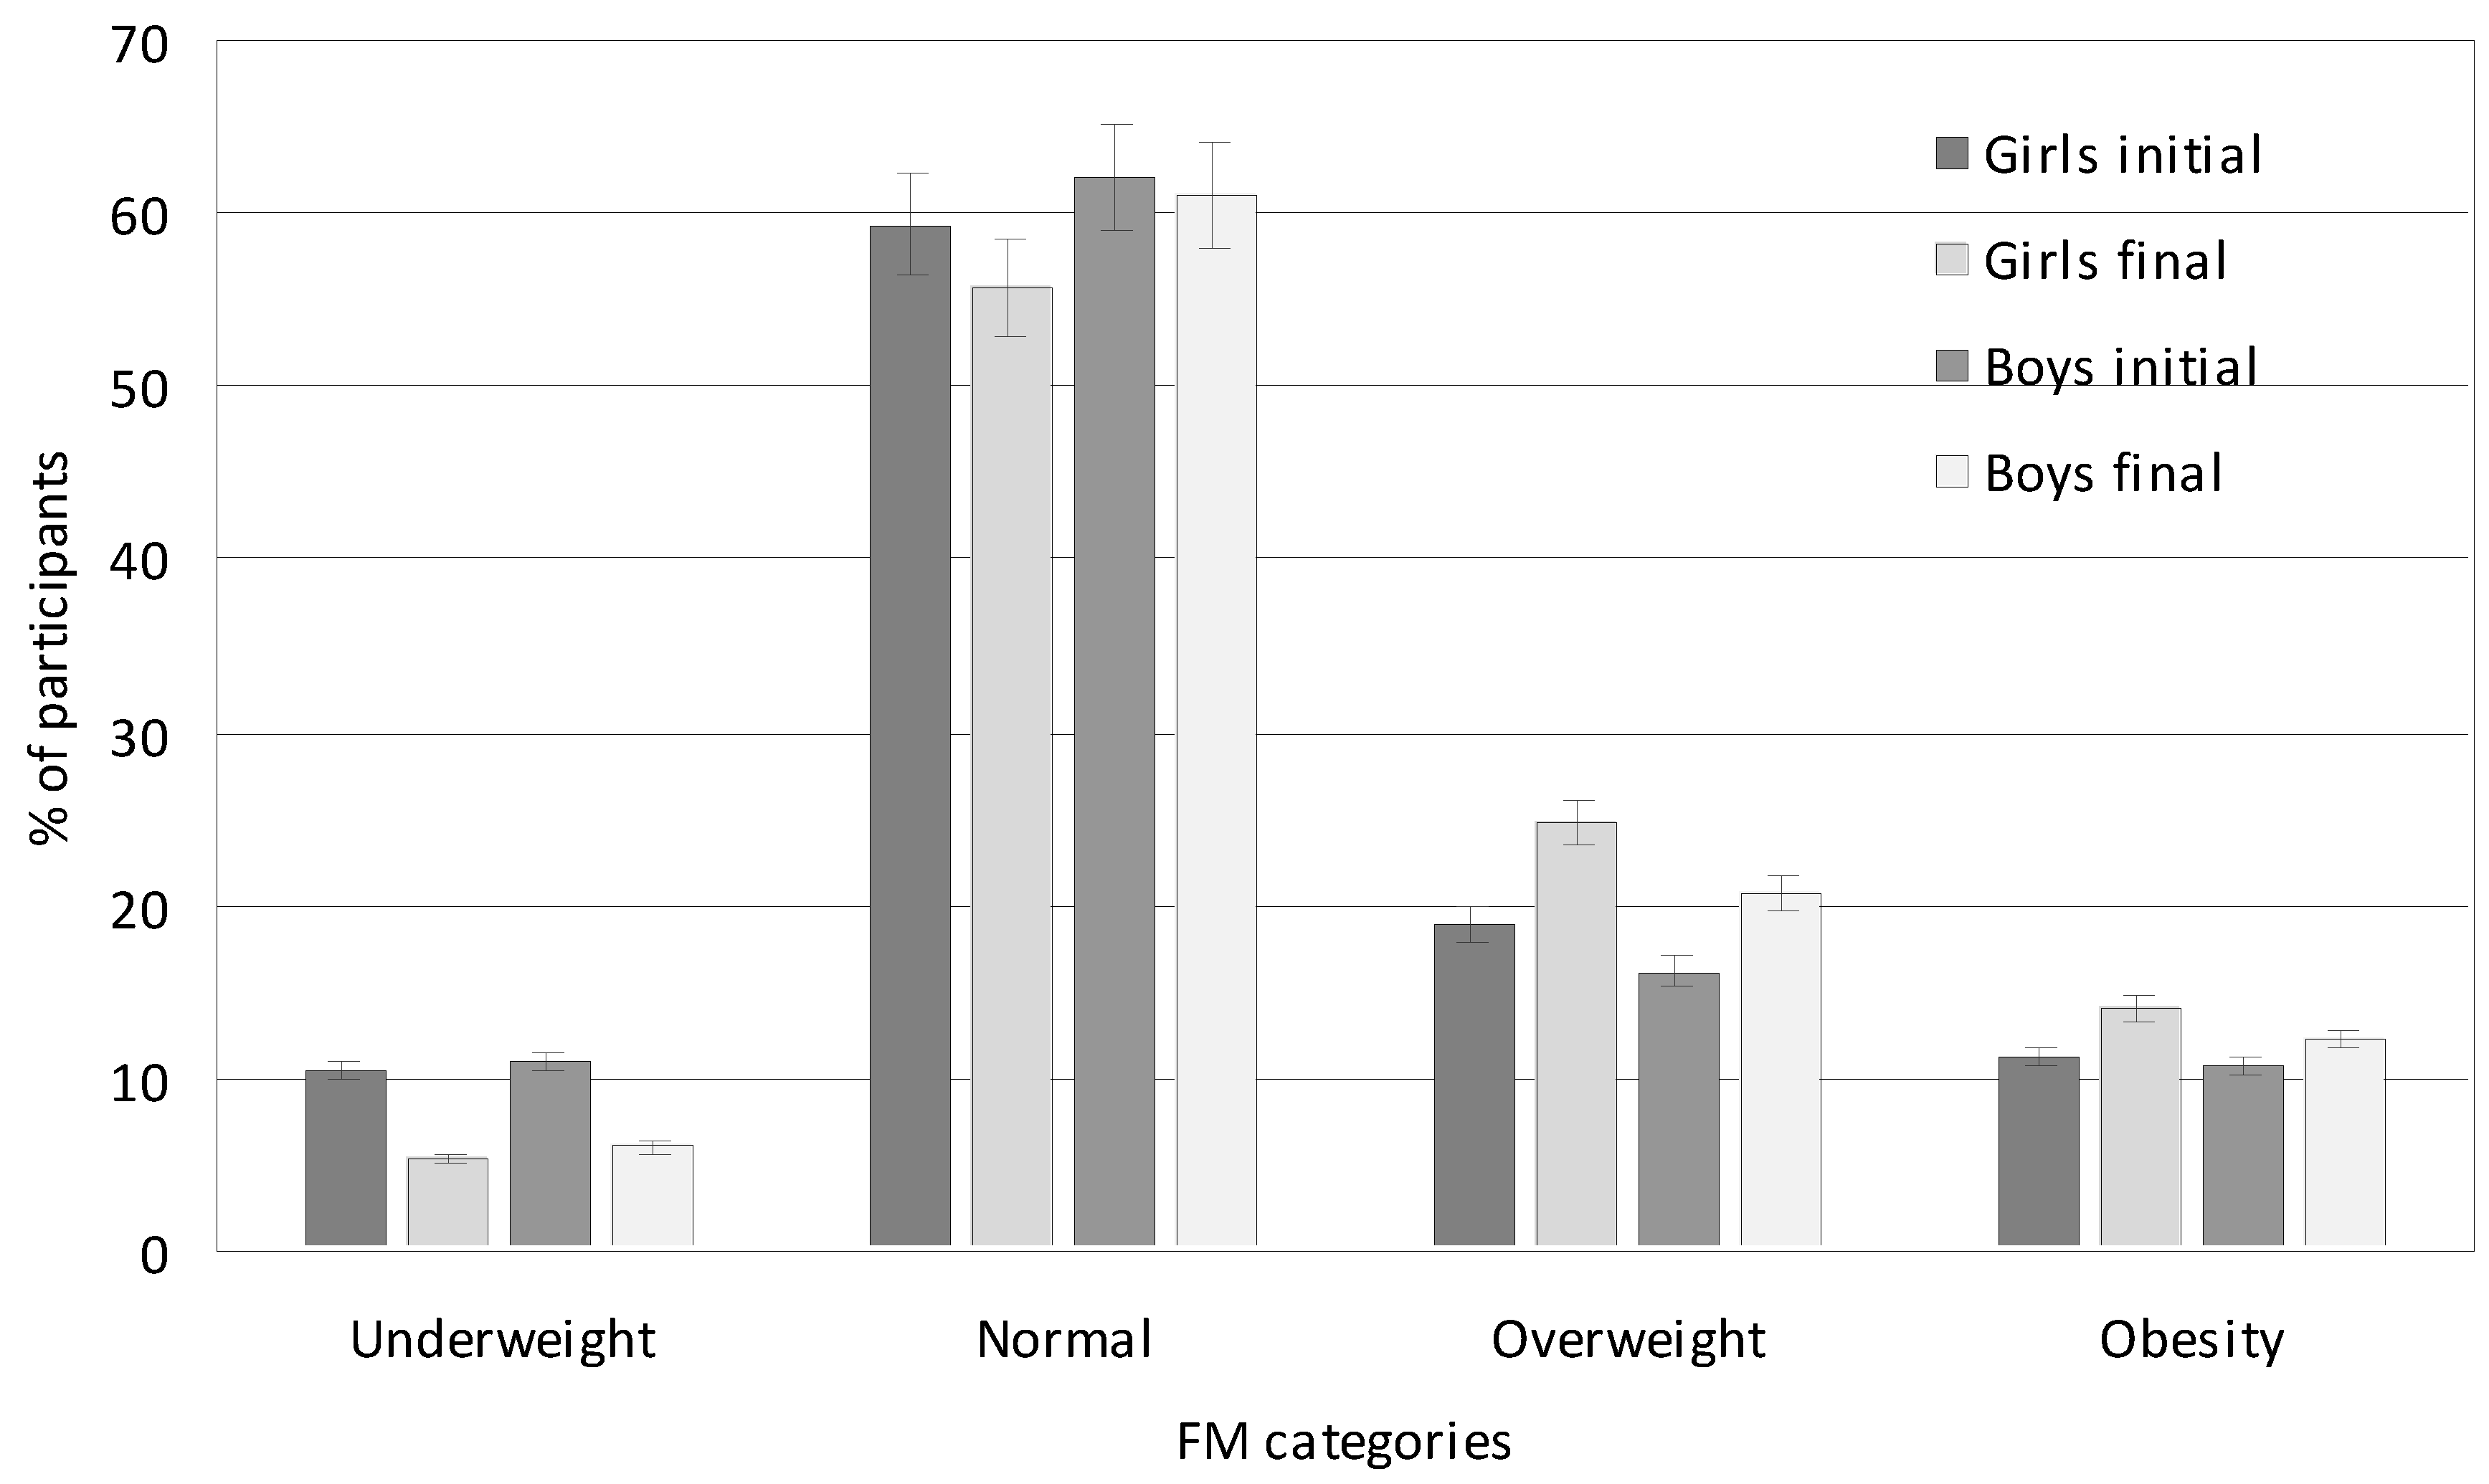
Figure 3.
Average consumption of products and beverages among girls and boys. The values from the indications of several times a week and every day were summed, and for less frequently consumed foods, such as fish, fruit juices, fast food, and carbonated drinks, the data from the indication of once a week was adopted.
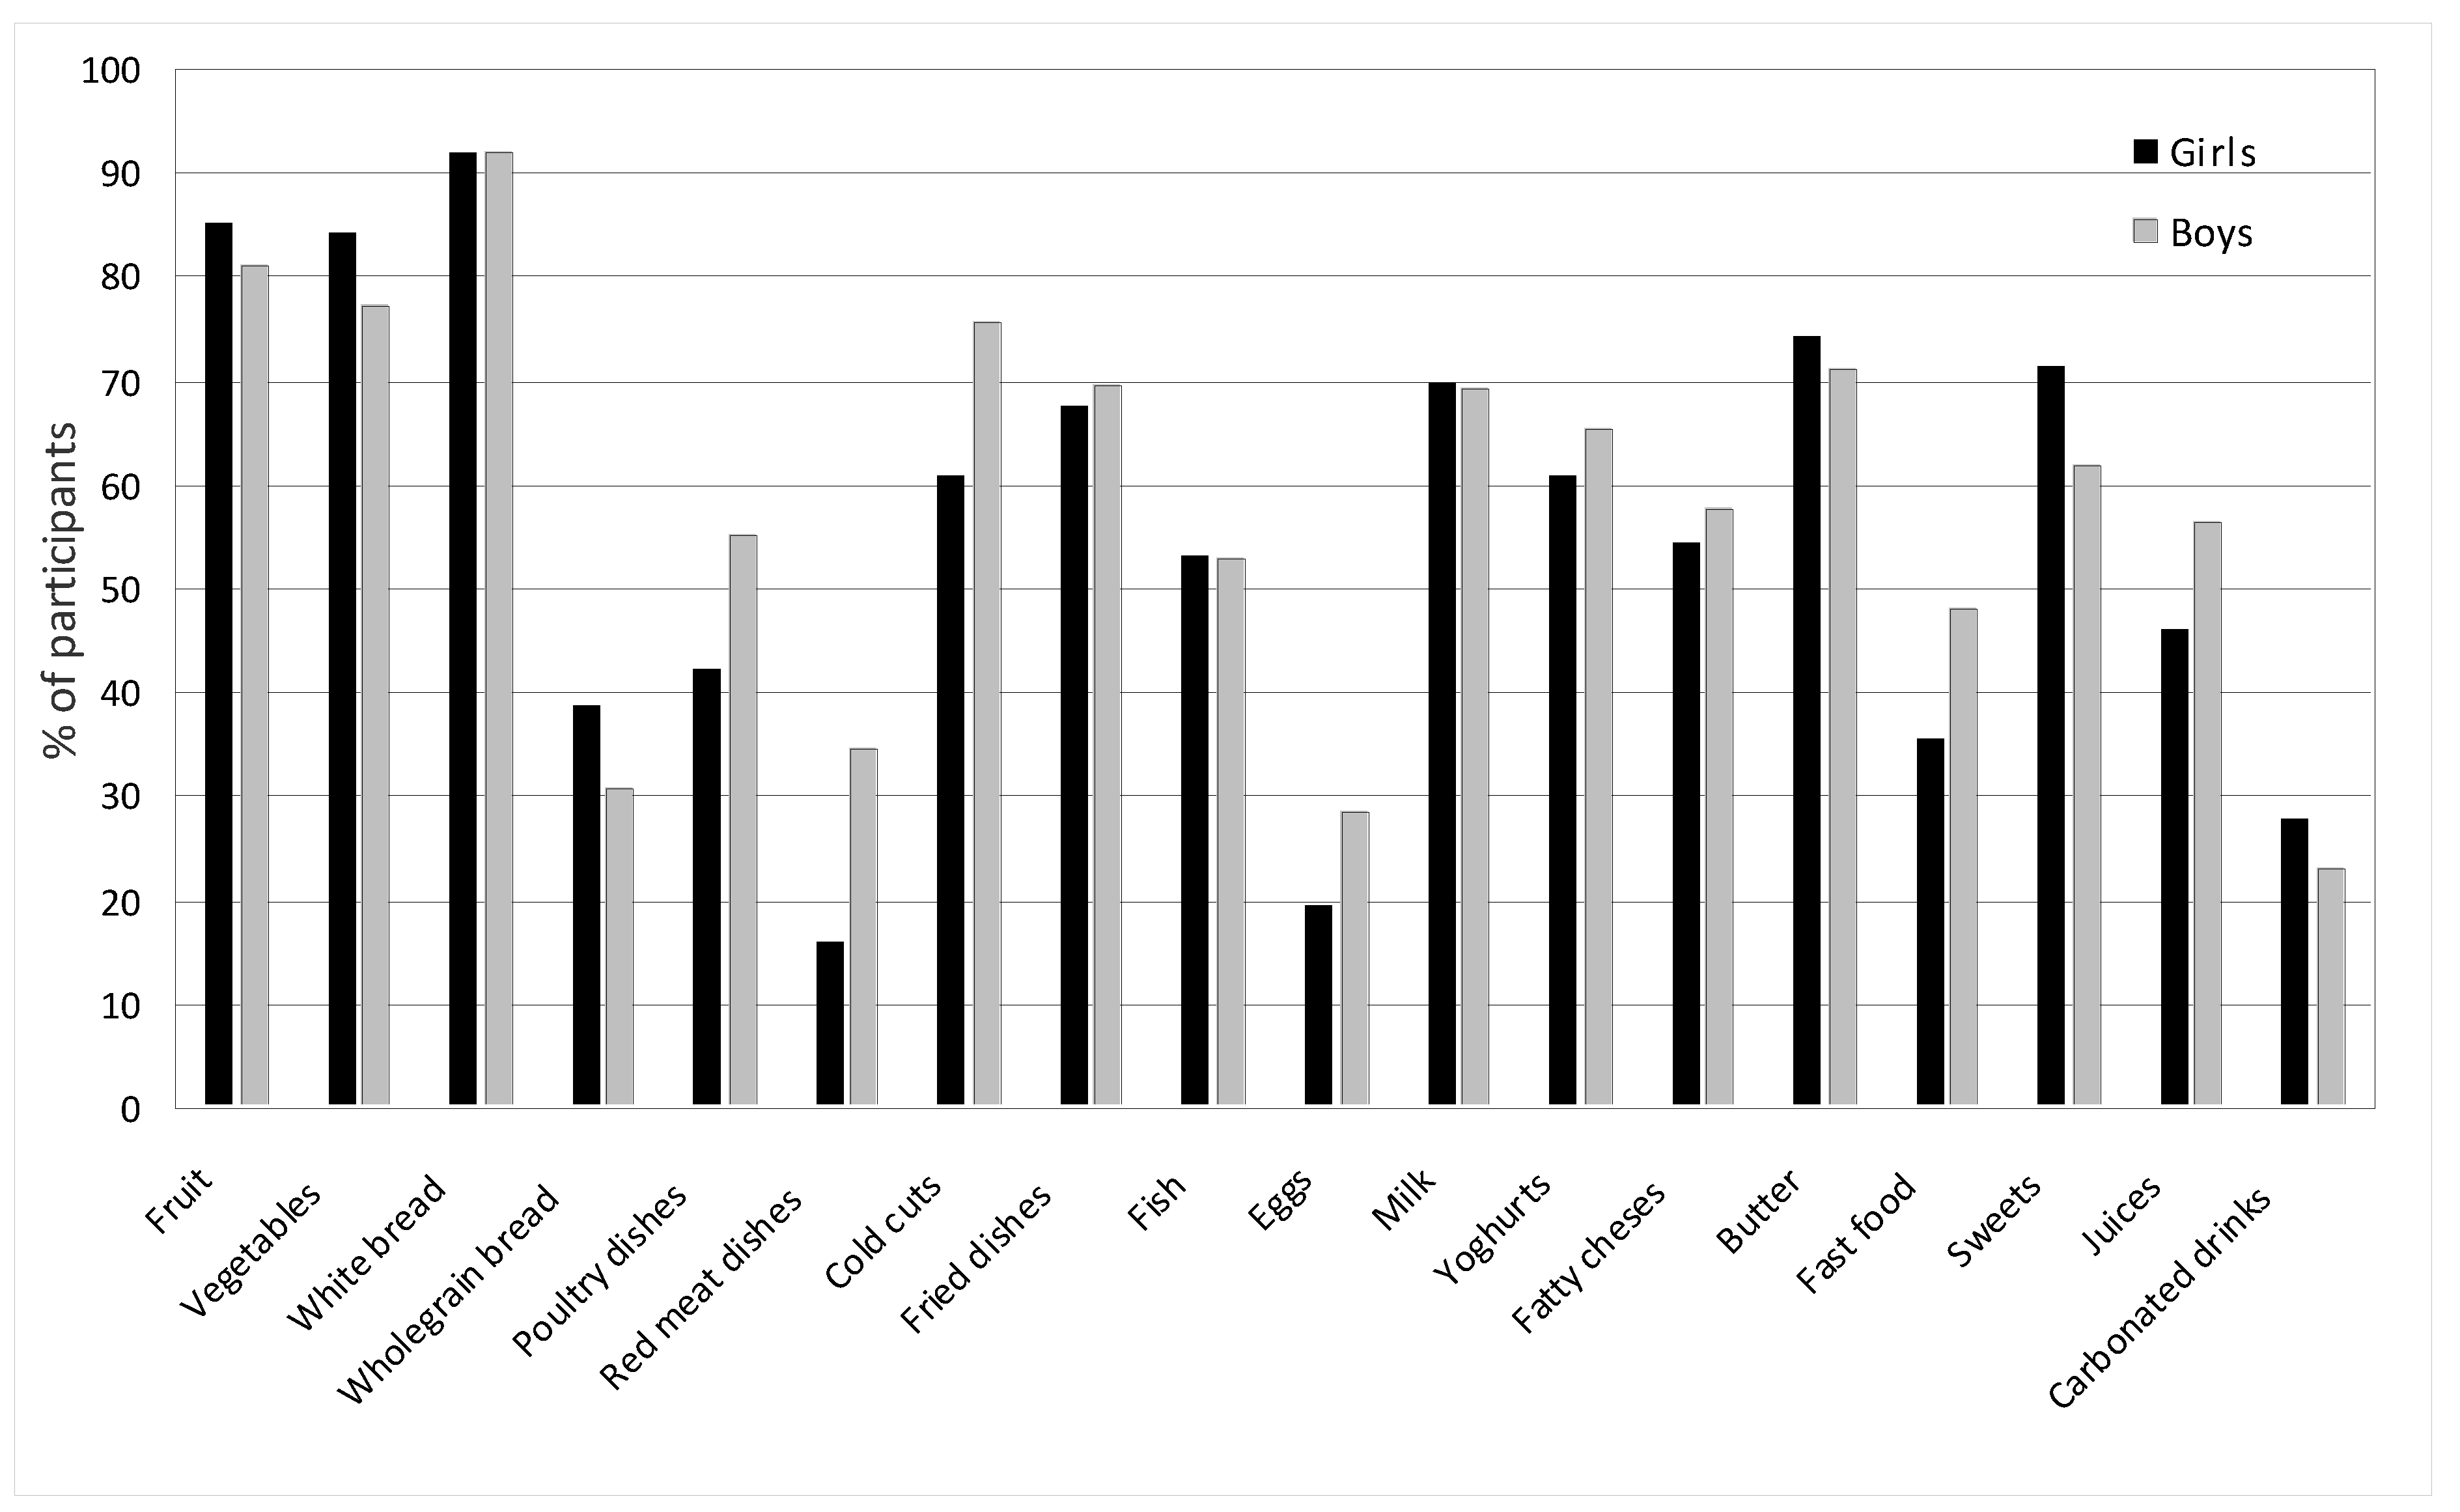
Figure 4.
Average consumption of selected food products, dishes and beverages among girls at the beginning and end of the study. The values from the indications of several times a week and every day were summed, and for less frequently consumed foods, such as fish, fruit juices, fast food, and carbonated drinks, the data from the indication of once a week was adopted.
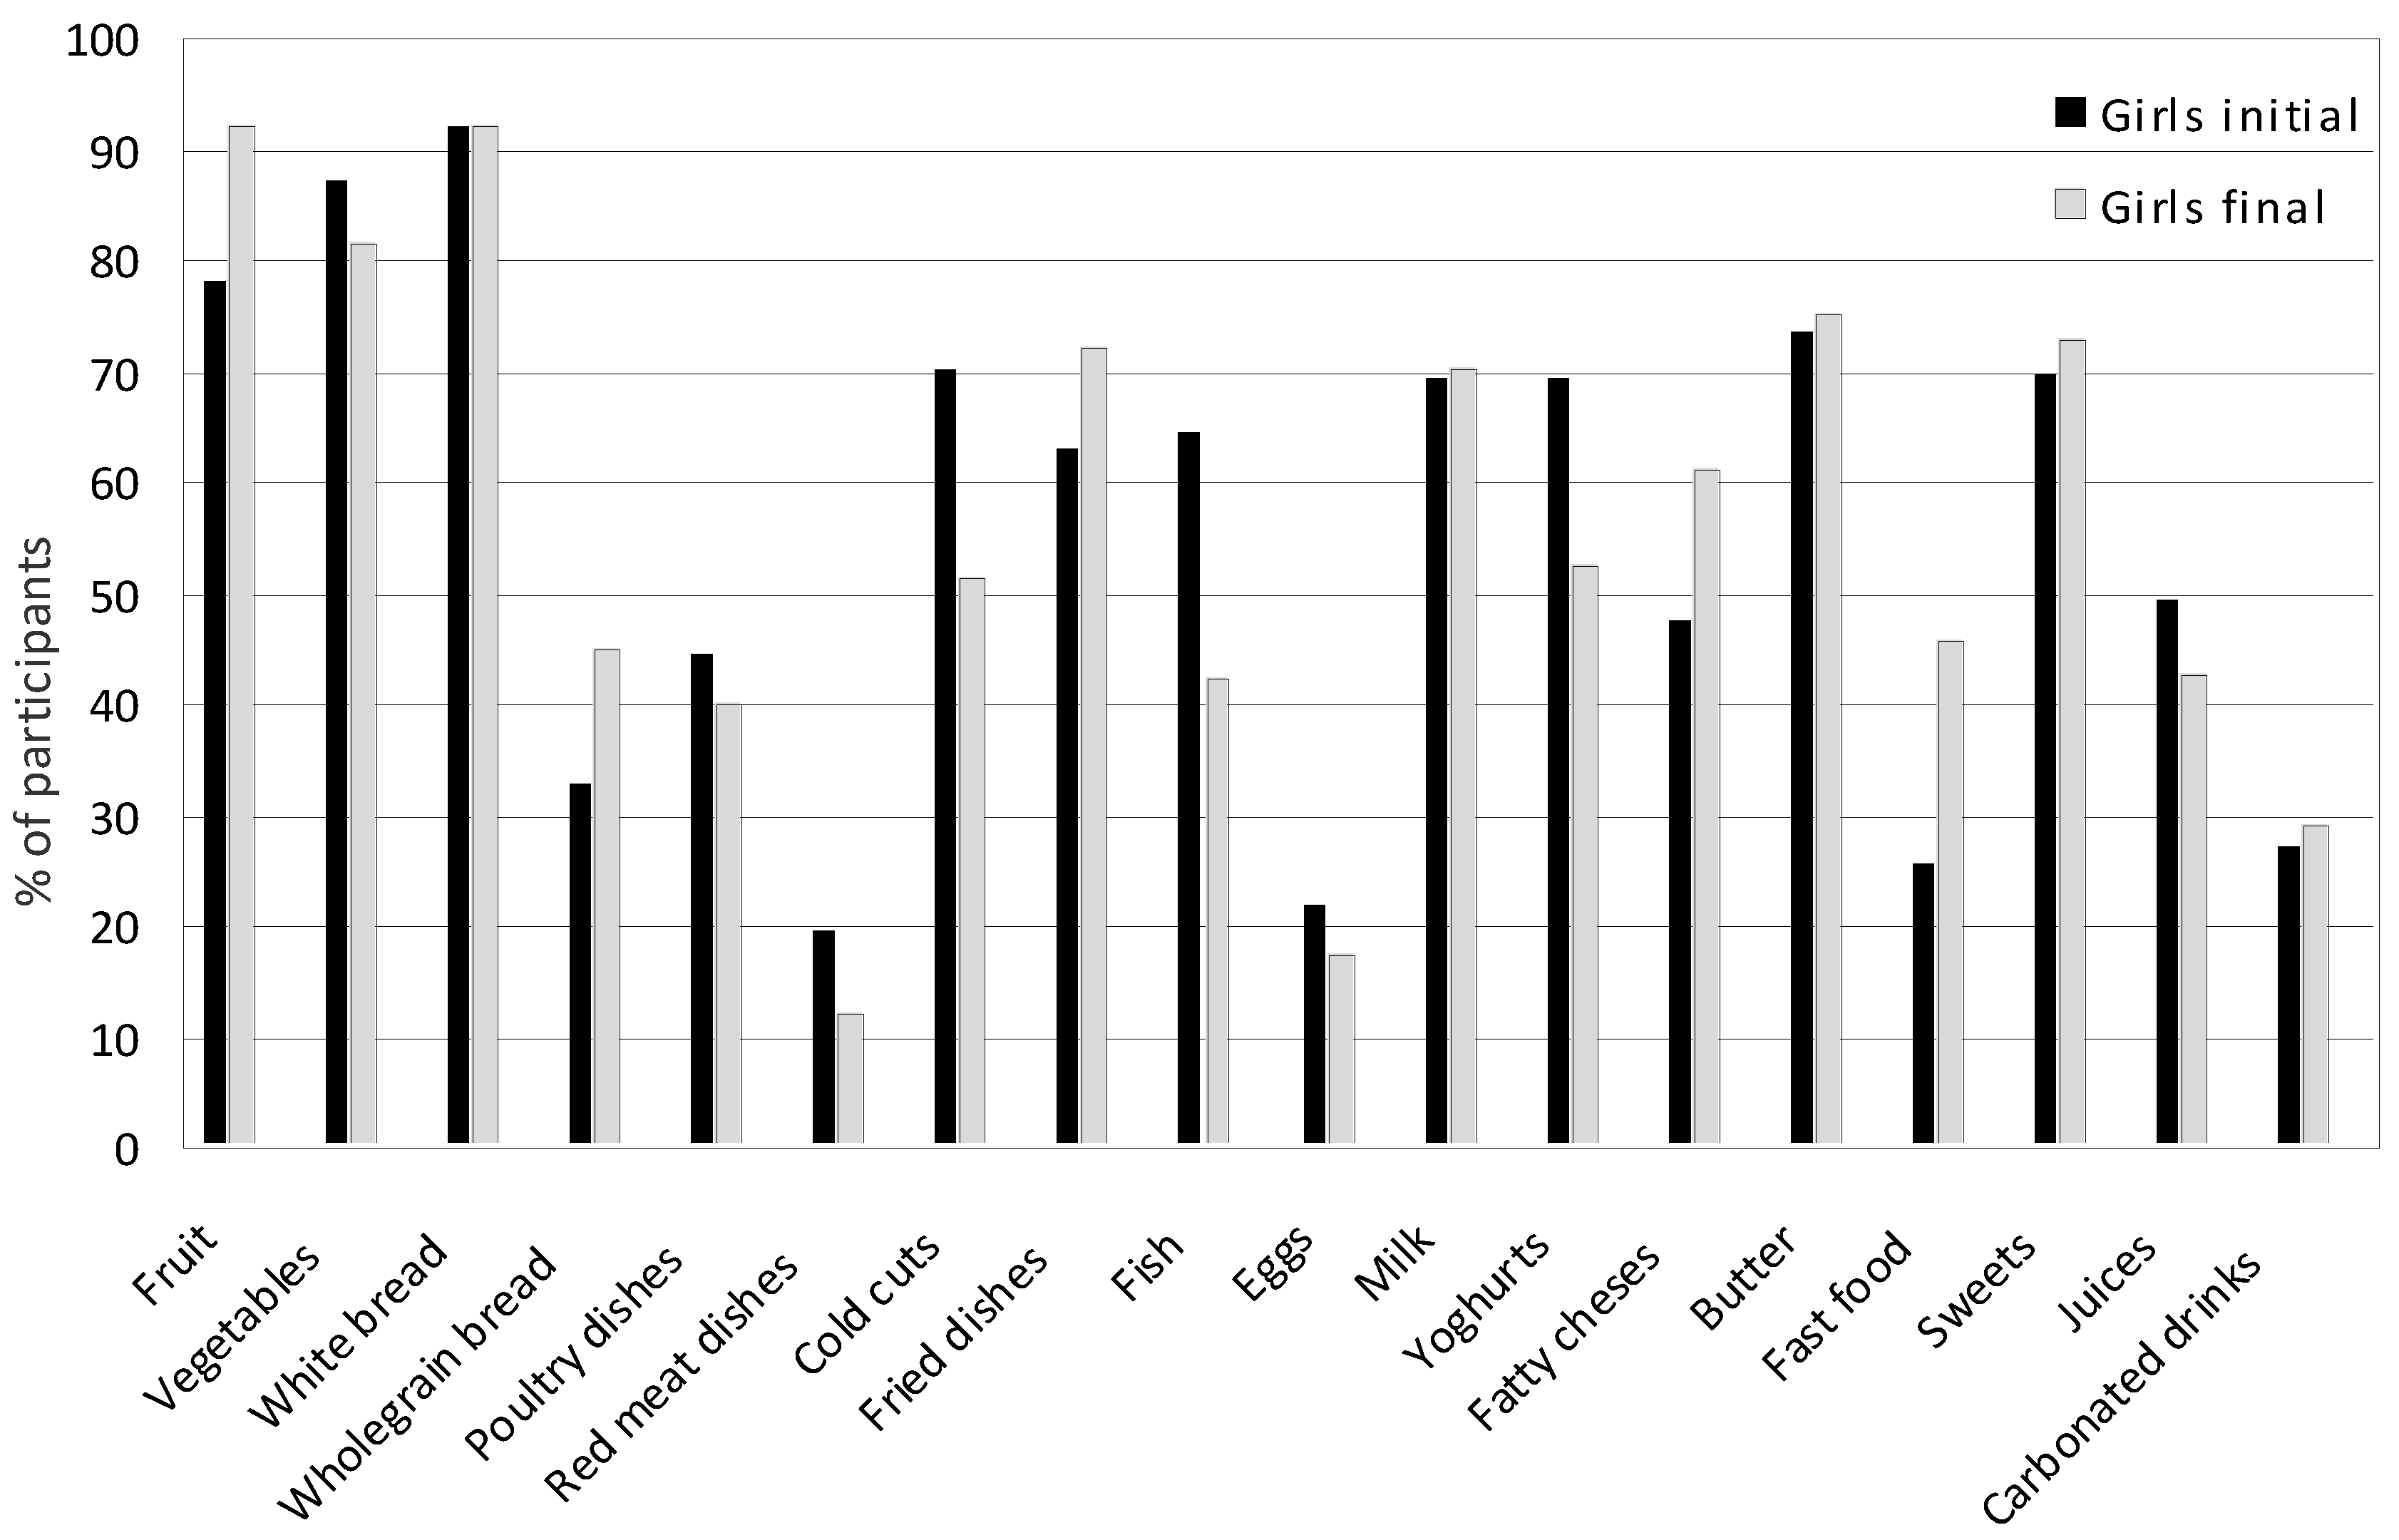
Figure 5.
Average consumption of selected food products, dishes and beverages among boys at the beginning and end of the study. The values from the indications of several times a week and every day were summed, and for less frequently consumed foods, such as fish, fruit juices, fast food, and carbonated drinks, the data from the indication of once a week was adopted.
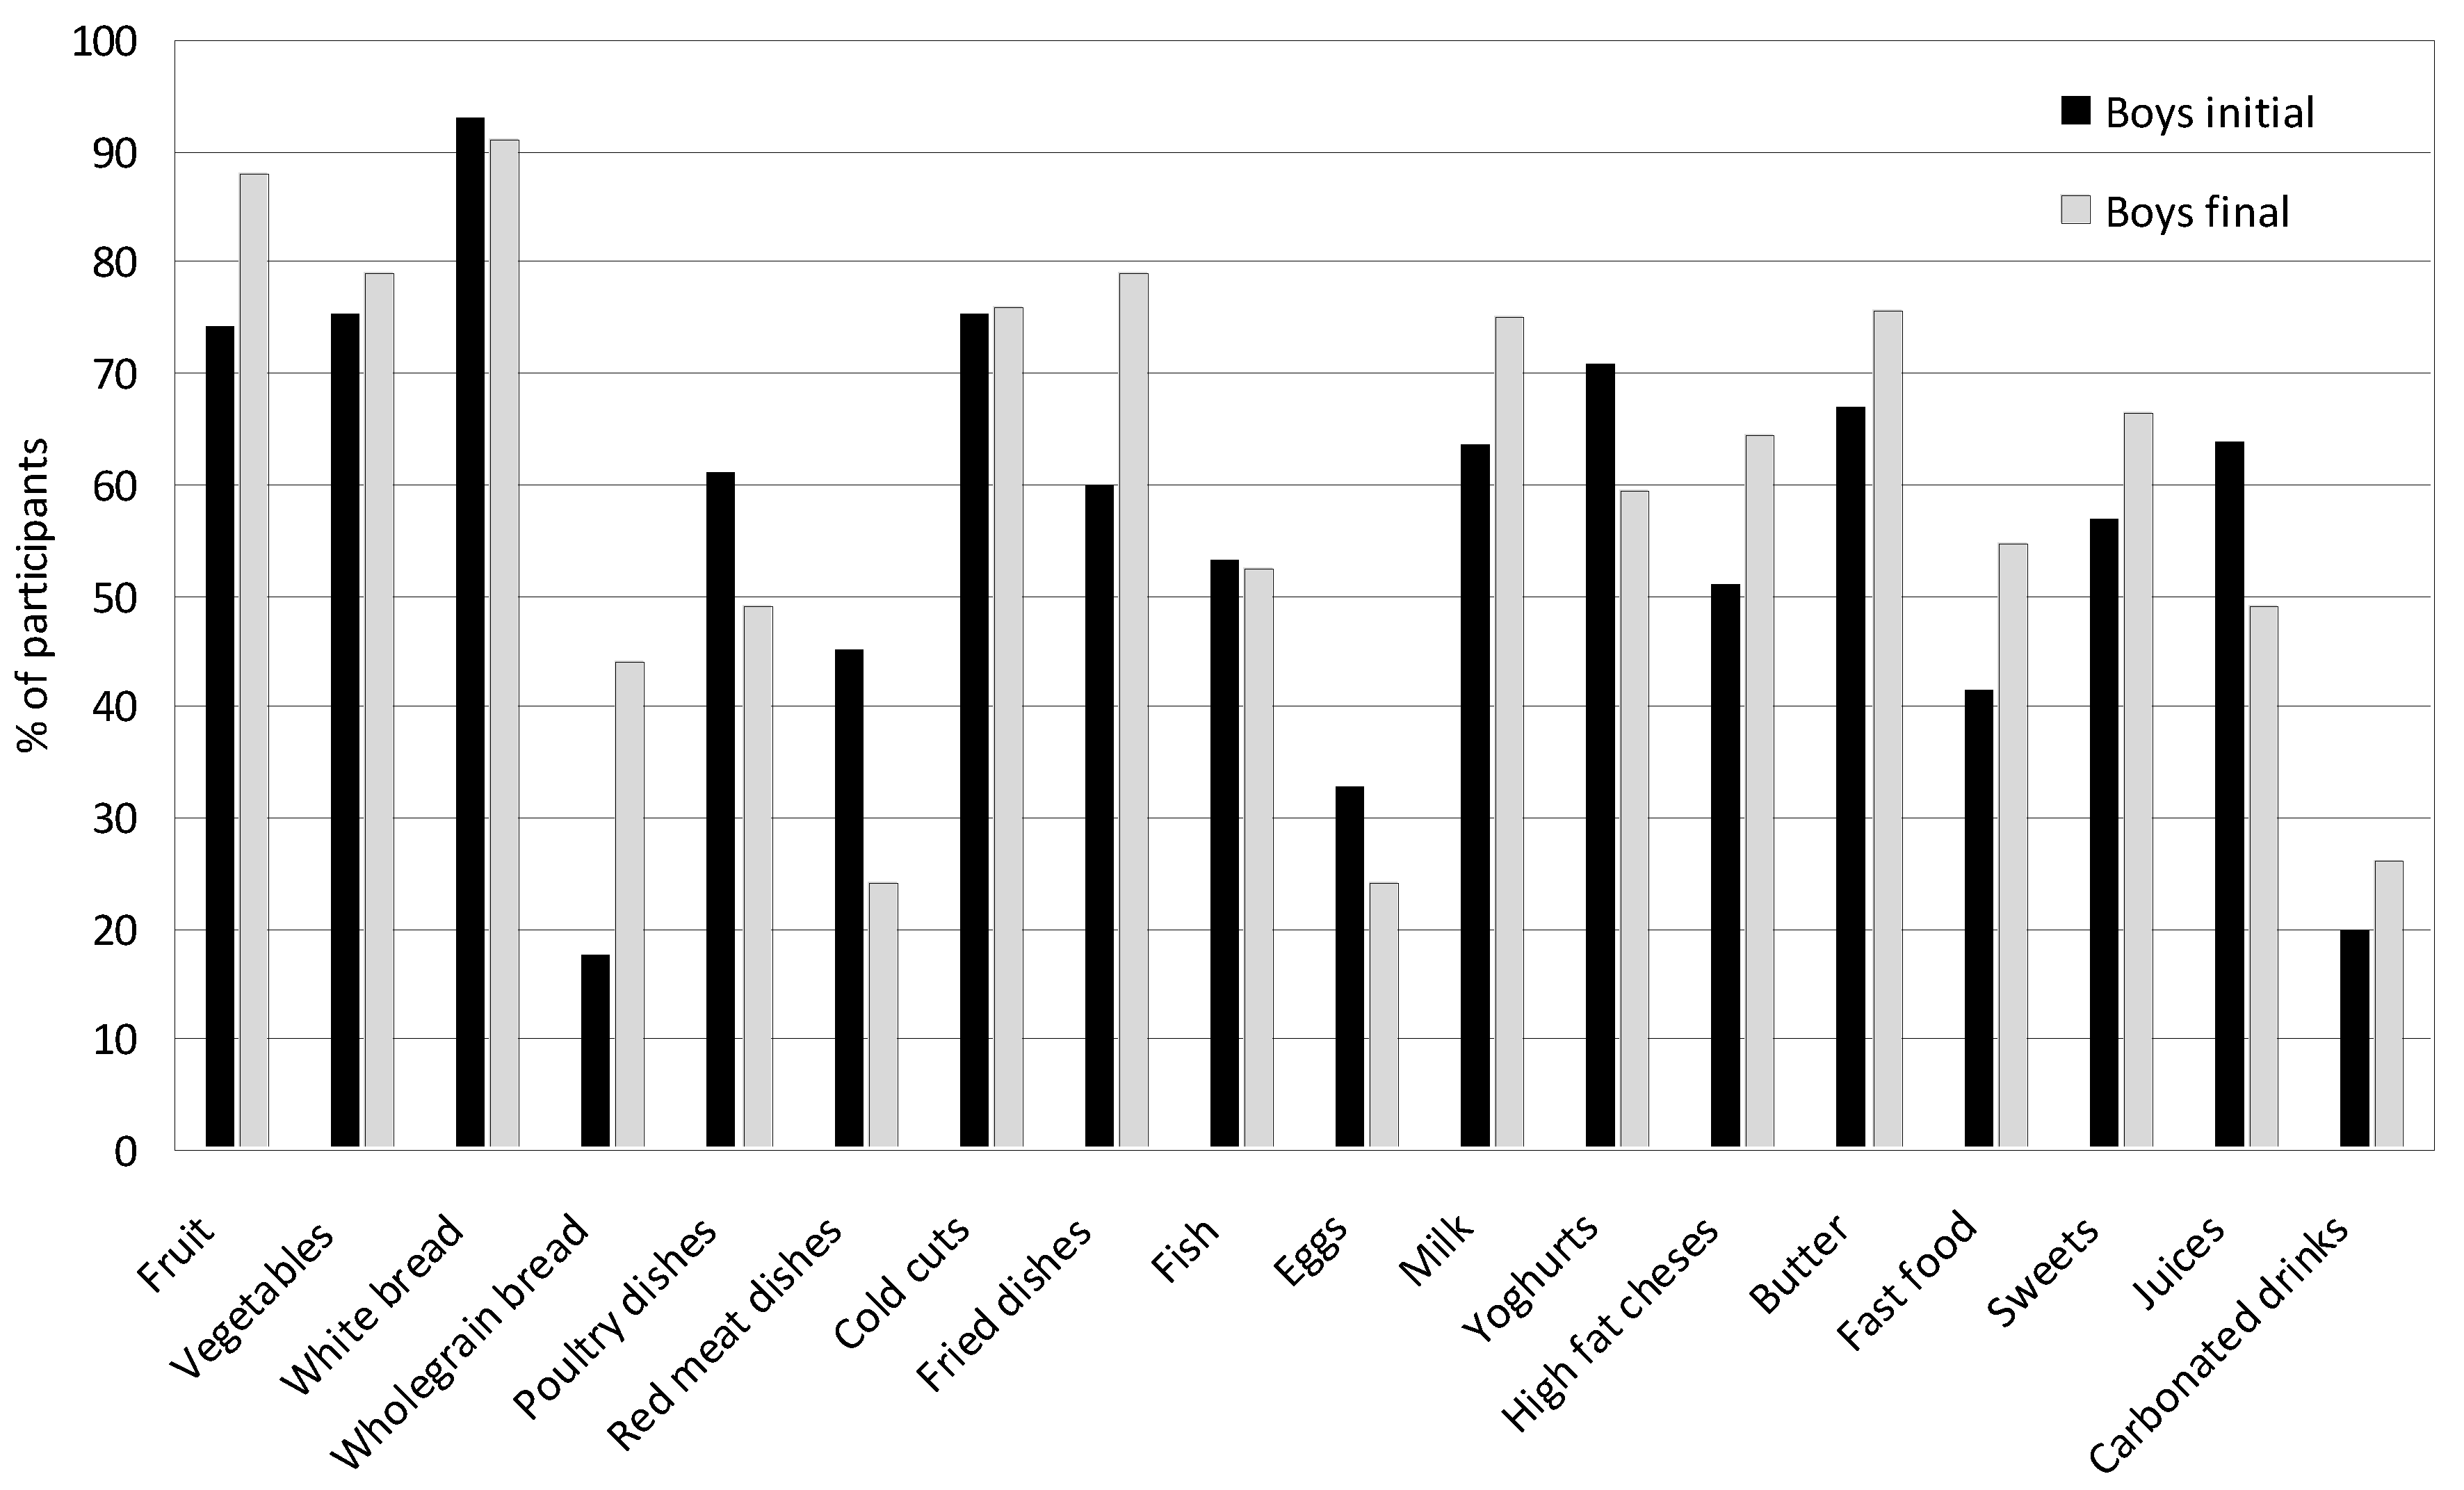
Figure 6.
Average consumption of selected food products, dishes and beverages in the entire group at the beginning and end of the study. The values from the indications of several times a week and every day were summed, and for less frequently consumed foods, such as fish, fruit juices, fast food, and carbonated drinks, the data from the indication of once a week was adopted.
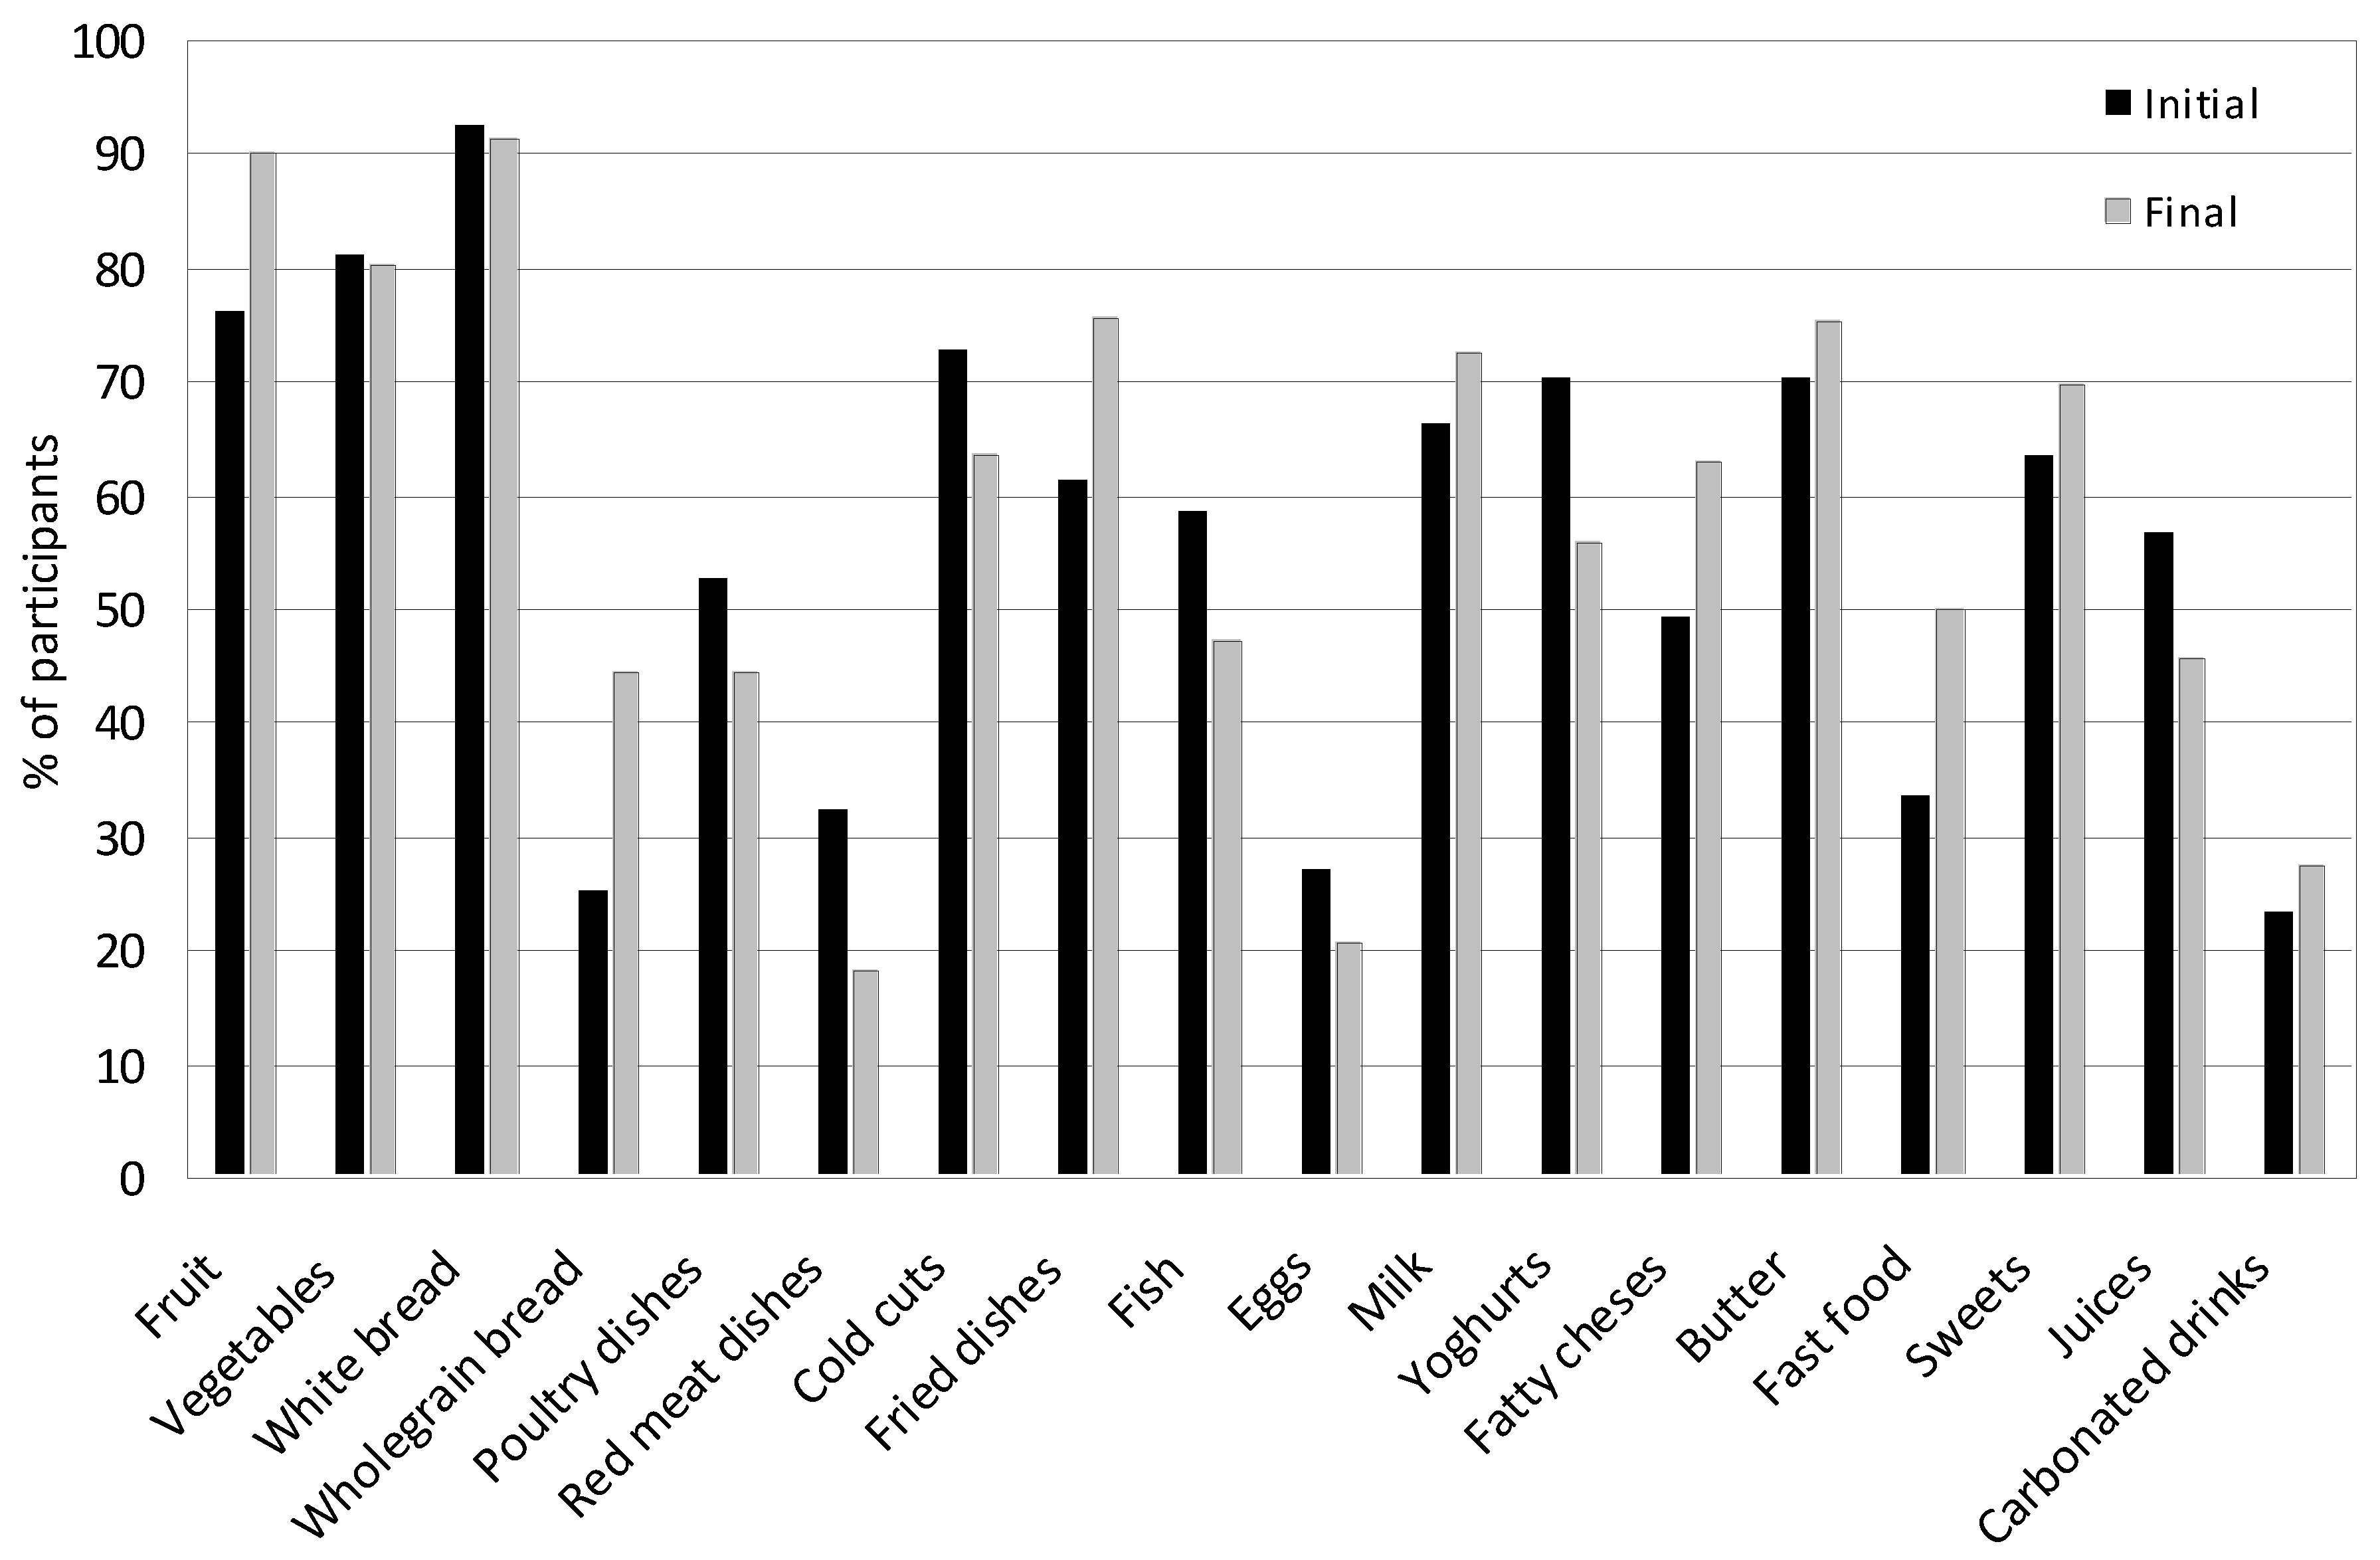
Figure 7.
PCA for nutritional behaviors, BMI and FM of girls and boys at the beginning of the study. A Girls - favorable nutritional behaviors of girls; B Girls - unfavorable nutritional behaviors of girls; C Girls - BMI of girls; D Girls – FM of girls; A Boys - favorable nutritional behaviors of boys; B Boys - unfavorable nutritional behaviors of boys; C Boys - BMI of boys; D Boys - FM of boys.
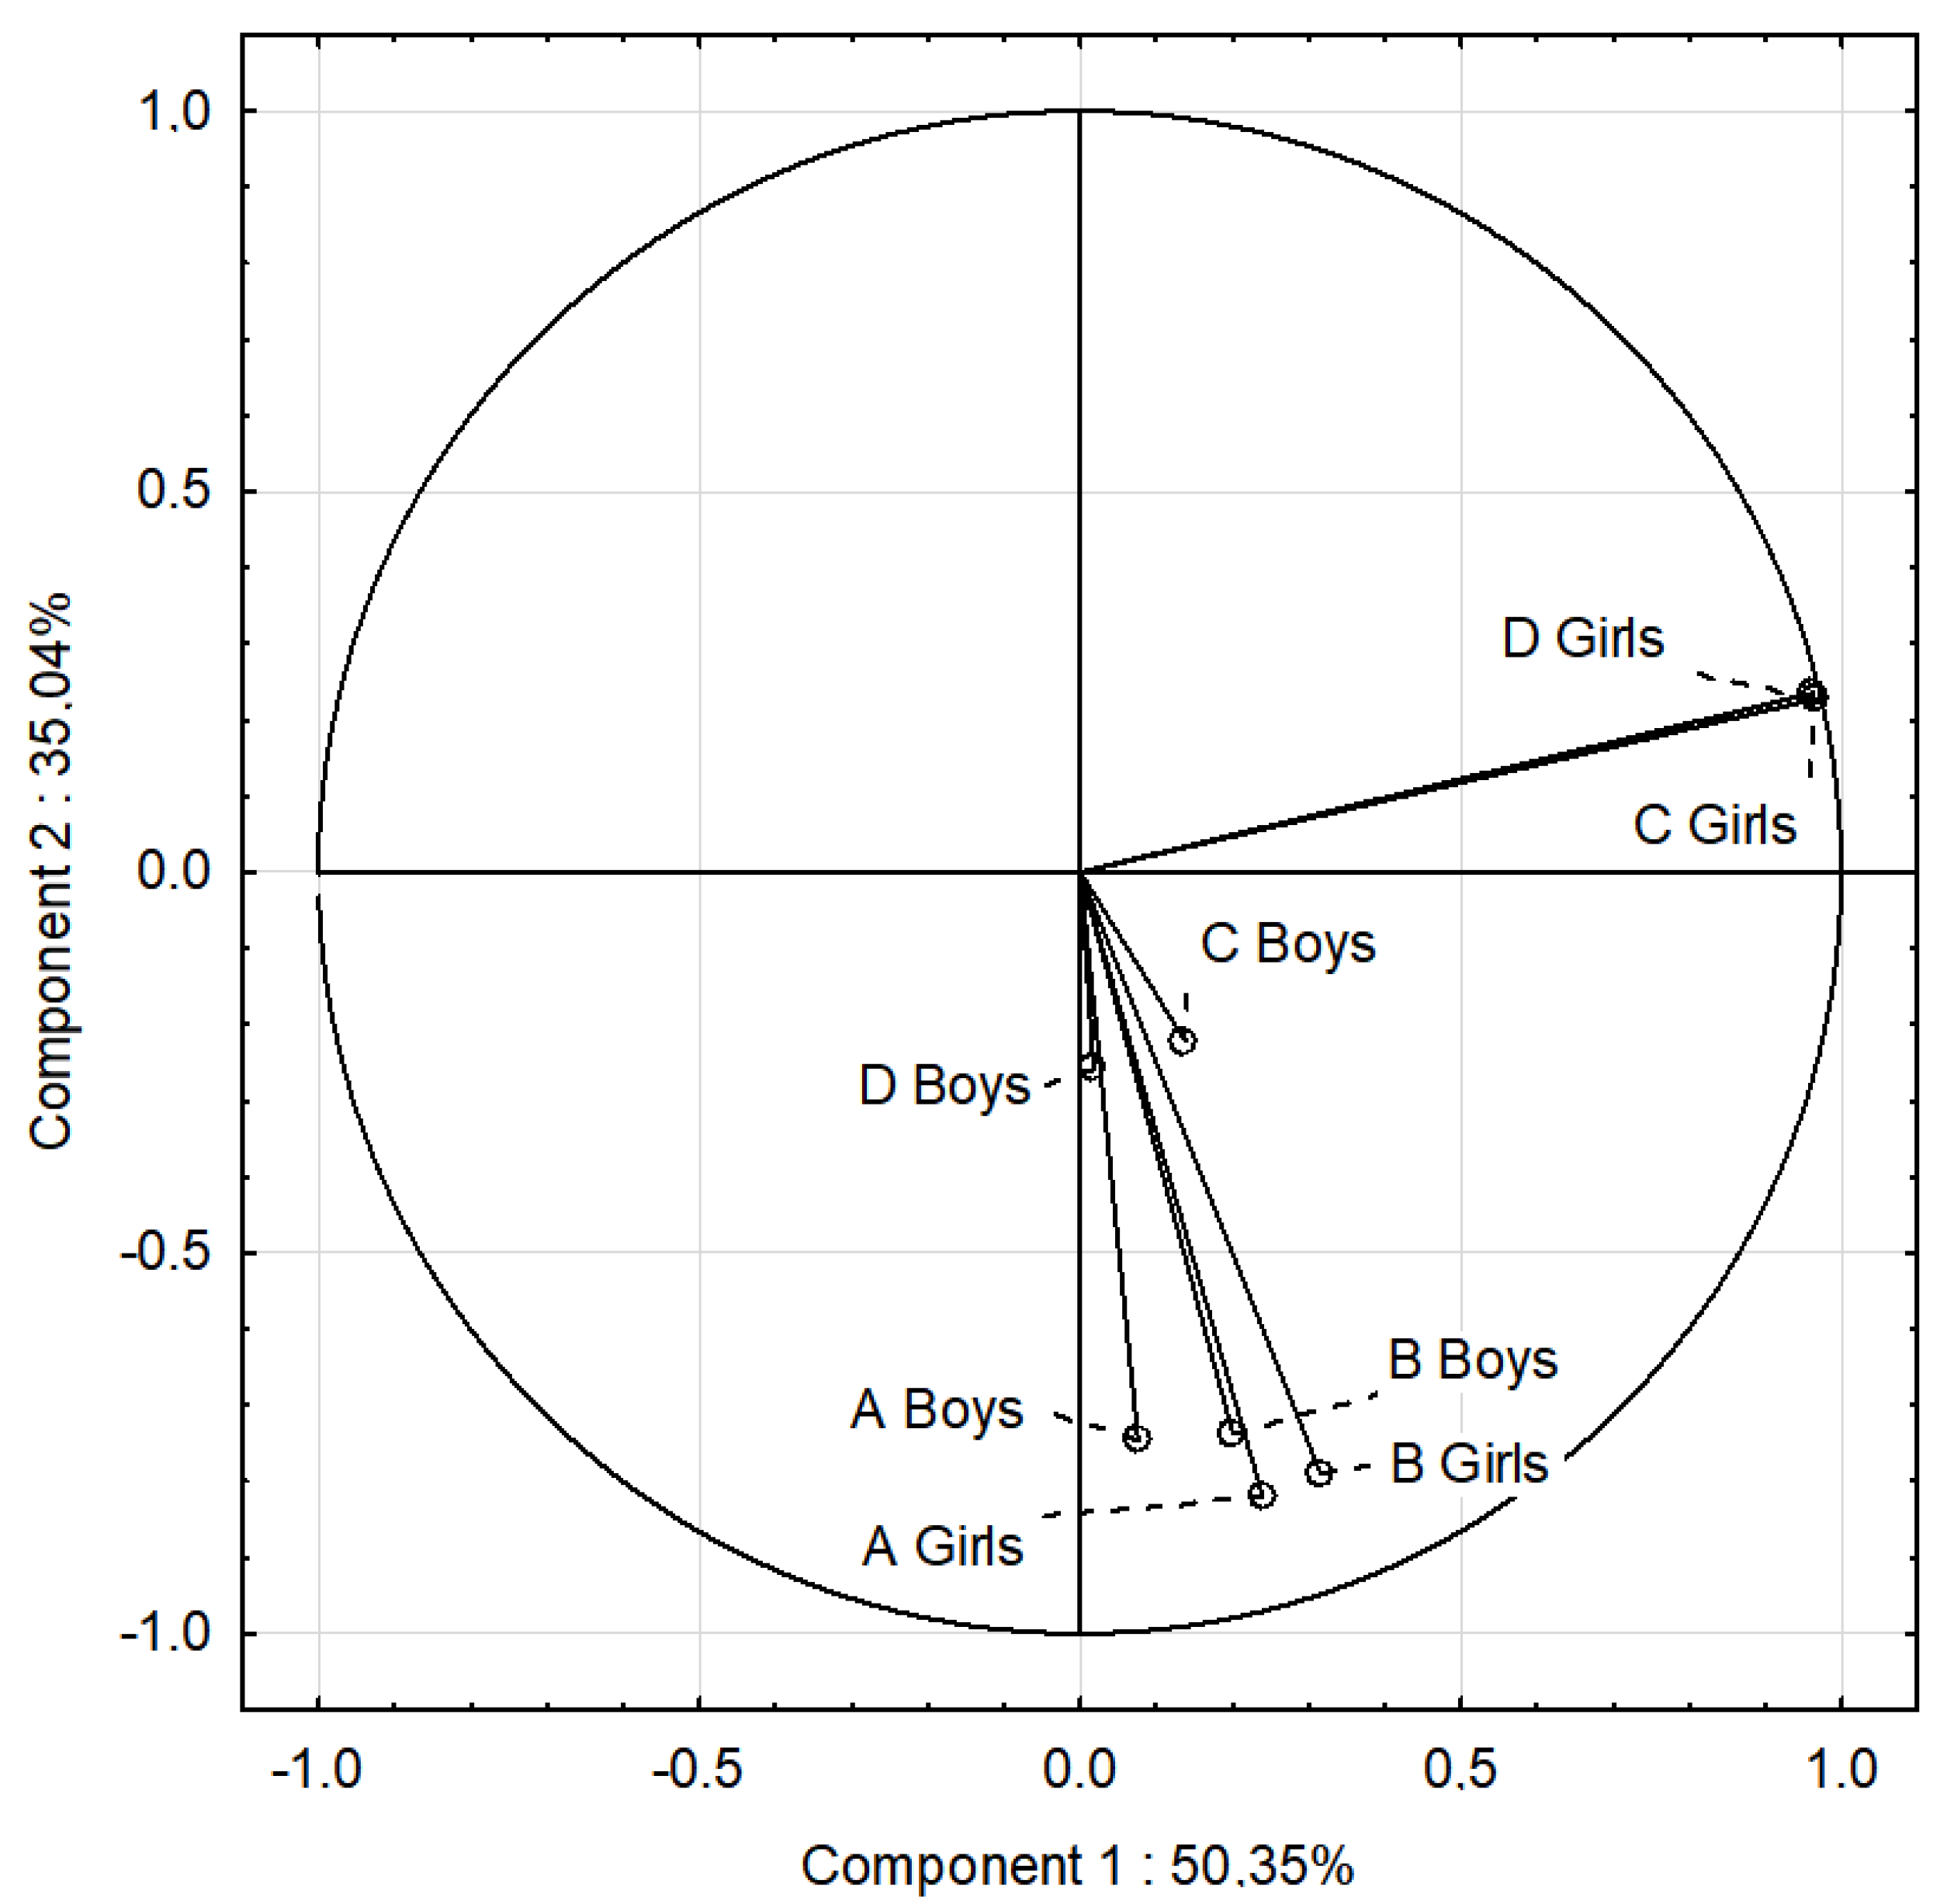
Figure 8.
PCA for nutritional behavior, BMI and FM of girls and boys at the end of the study. A Girls - favorable nutritional behaviors of girls; B Girls - unfavorable nutritional behaviors of girls; C Girls - BMI of girls; D Girls – FM of girls; A Boys - favorable nutritional behaviorsof boys; B Boys - unfavorable nutritional behaviorsof boys; C Boys - BMI of boys; D Boys - FM of boys.
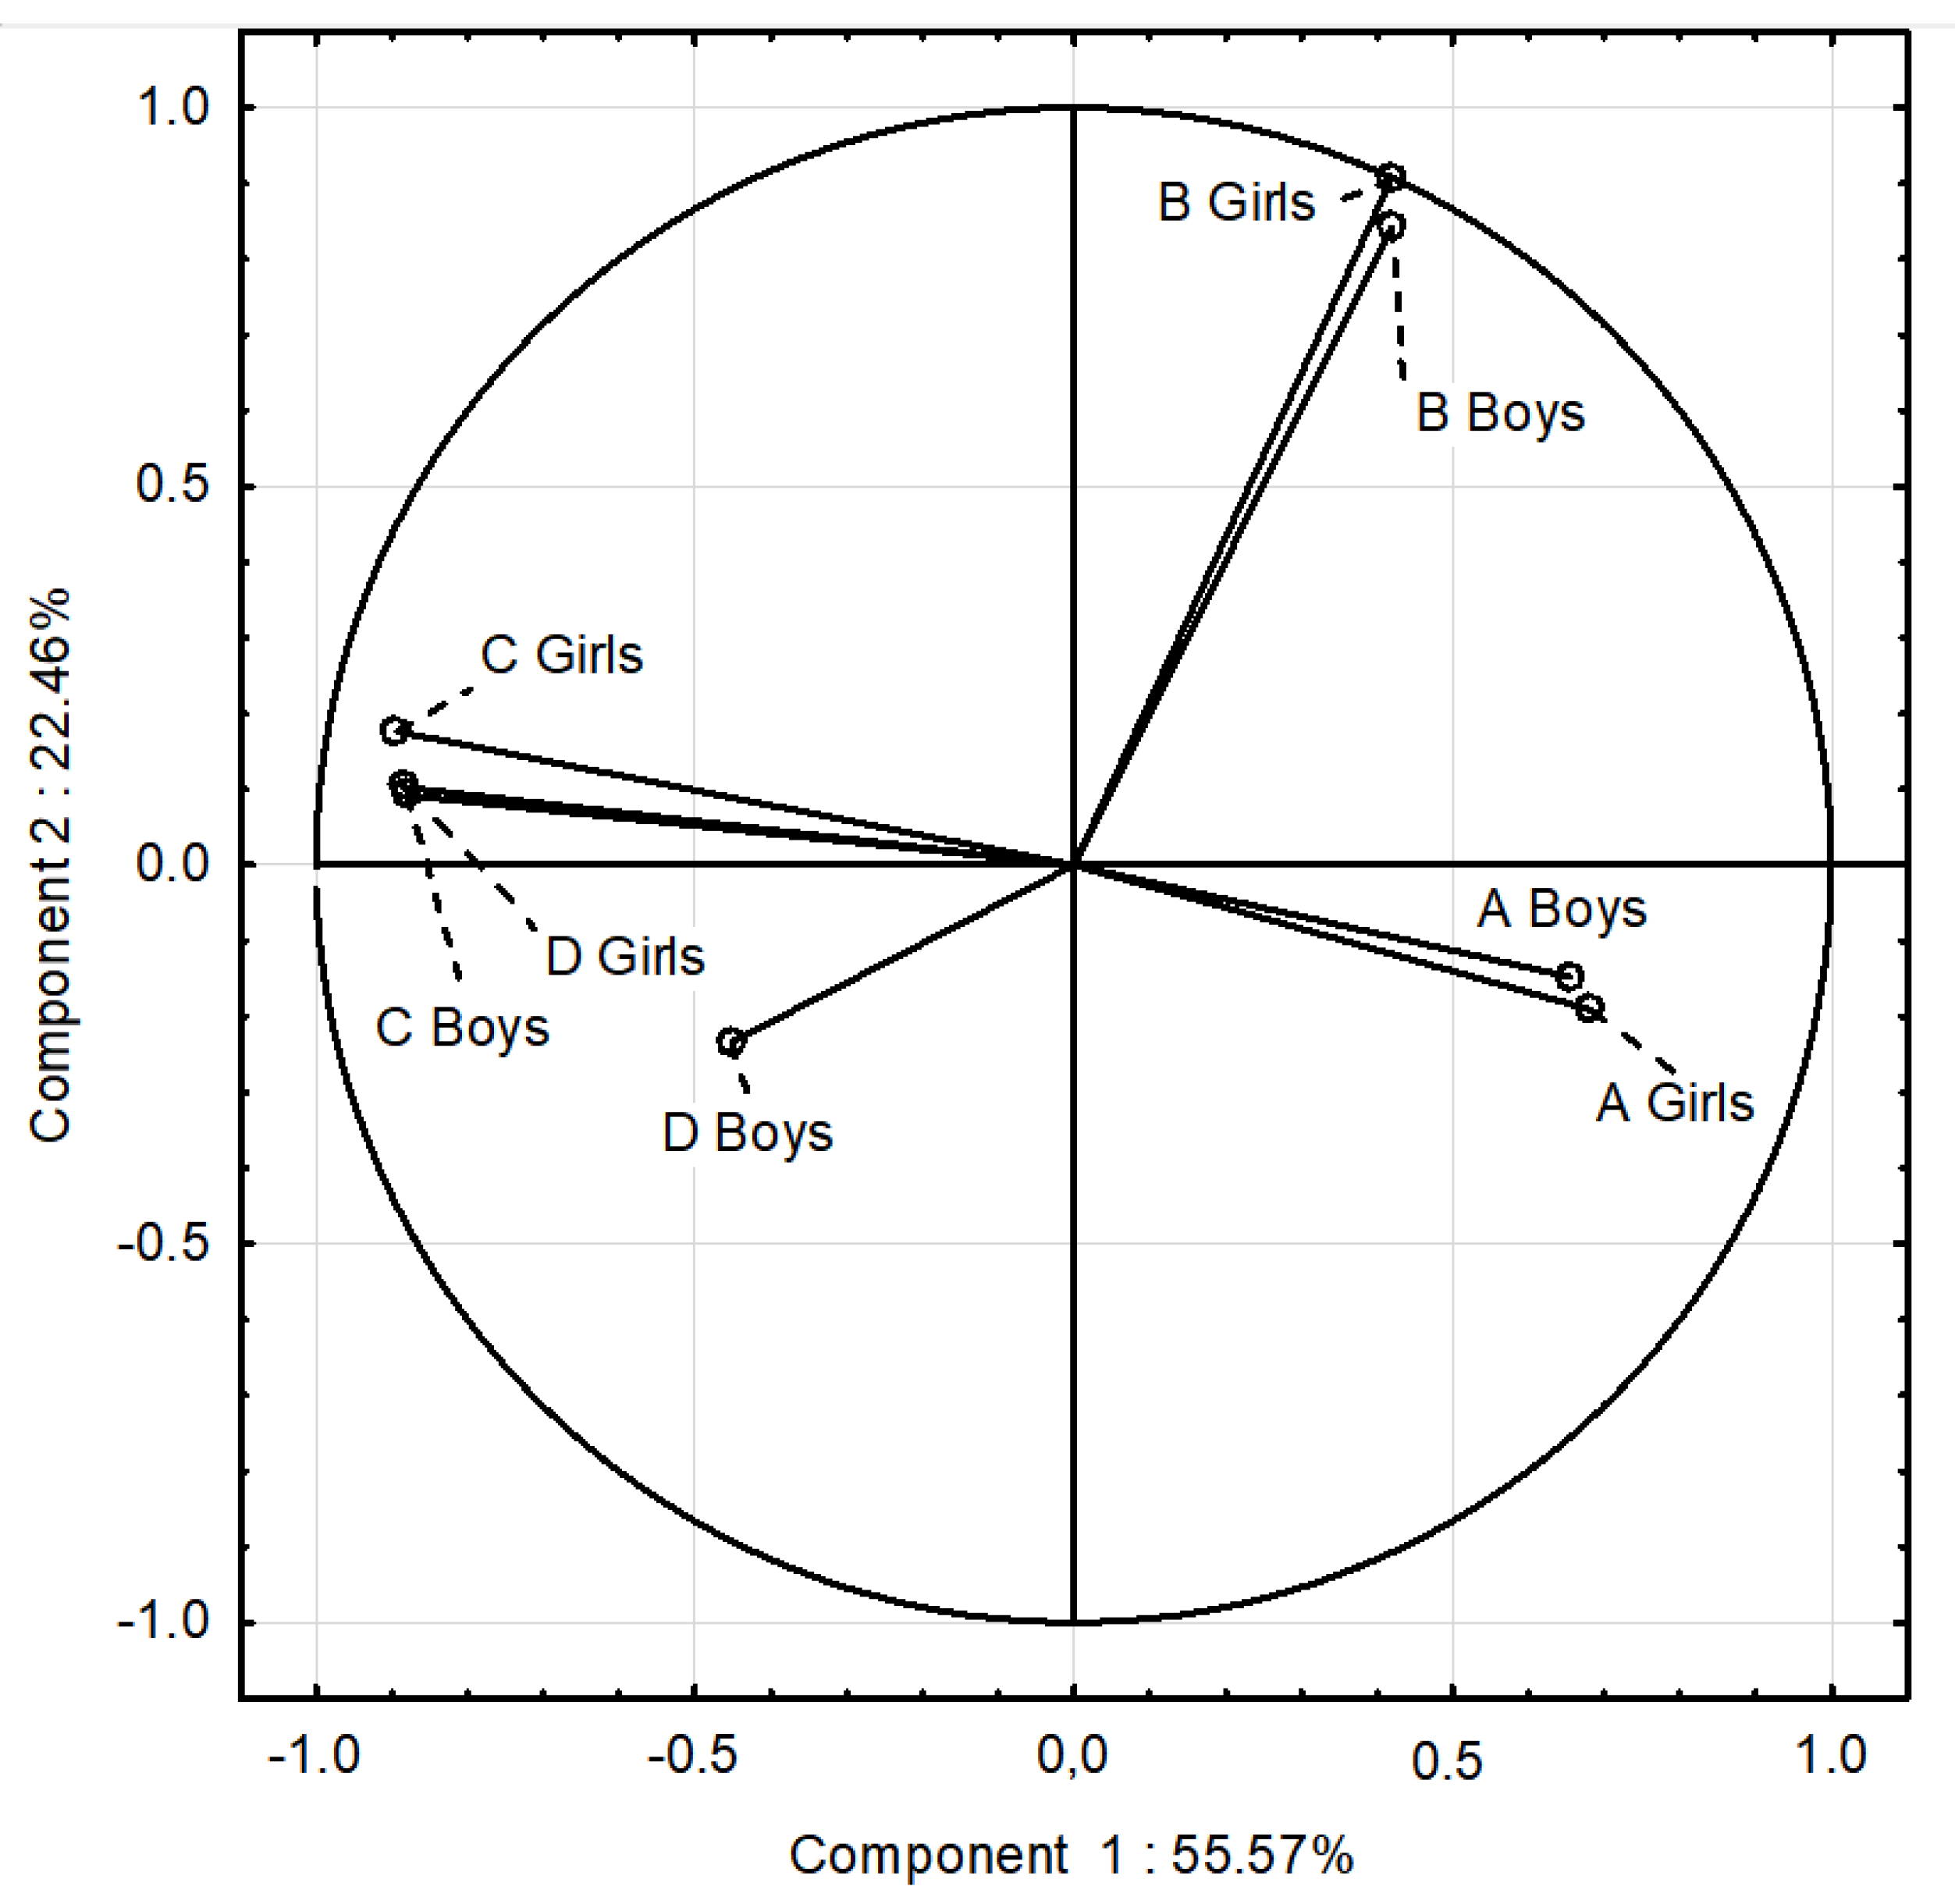

Table 1.
Comparison of children’s anthropometric indicators between initial and final measurements.
| Indicator | Initial | Final |
Total p |
||||||
| Total | Boys | Girls | p | Total | Boys | Girls | p | ||
| Height (cm) | 142.96 | 143.28 | 142.68 | 0.041 | 167.23 | 169.76 | 164.67 | 0.021 | 0.001 |
| Weight (kg) | 37.80 | 38.15 | 37.46 | 0.070 | 59.90 | 62.58 | 57.19 | 0.041 | 0.000 |
| BMI (kg/m2) | 18.34 | 18.38 | 18.28 | 0.120 | 21.29 | 21.53 | 21.06 | 0.060 | 0.025 |
| BMI (percentile) | 50th | 50th | 50th | 0.830 | 75th | 75th | 75th | 0.937 | 0.120 |
BMI—body mass index (kg/m2); percentile corresponding to BMI percentile charts; p—ANOVA; p ≤ 0.05.
Table 2.
BMI categories during the study period.
| Indicator | Initial | Final |
Total p |
||||||
| Mean | Boys | Girls | p | Mean | Boys | Girls | p | ||
| Underweight | 10.17 | 10.22 | 10.13 | 0.100 | 11.17 | 11.00 | 11.35 | 0.240 | 0.091 |
| Normal | 65.65 | 68.52 | 62.78 | 0.001 | 61.07 | 63.00 | 59.15 | 0.001 | 0.001 |
| Overweight | 15.27 | 12.75 | 17.78 | 0.031 | 13.62 | 13.50 | 13.75 | 0.170 | 0.047 |
| Obesity | 8.91 | 8.51 | 9.31 | 0.640 | 14.12 | 12.50 | 15.75 | 0.001 | 0.000 |
p—ANOVA; p ≤ 0.05.
Table 3.
Body fat (FM), % and kg.
| Fat Mass, % (kg) | |||||||||
|
Measurement Session |
Average Age (Years) |
Mean |
Median | Min. | Max. | SD |
95% CI |
p** | ESs |
| Average | |||||||||
| Initial | 10.27 | 19.77 (8.09) |
18.15 (6.70) |
6.50 (1.70) |
47.40 (40.60) |
7.62 | 7.00-8.36 |
0.620 |
0.460 |
| Final | 13.90 | 19.59 (12.38) |
18.65 (10.70) |
3.00 (1.30) |
46.20 (46.00) |
8.73 | 7.97-9.65 | ||
| Mean from both sessions | 19.68 (10.23) |
||||||||
| Girls | |||||||||
| Initial | 10.27 | 21.77 (8.73) |
21.15 (7.75) |
6.50 (1.70) |
37.30 (21.10) |
7.56 | 7.50-6.65 |
0.040 |
0.510 |
| Final | 13.90 | 24.57 (14.88) |
23.65 (12.85) |
6.40 (2.80) |
46.20 (46.00) |
7.82 | 6.89-9.04 | ||
| Mean from both sessions | 23.17 (11.80) |
||||||||
| Boys | |||||||||
| Initial | 10.27 |
17.80 (7.49) |
15.60 (5.70) |
8.40 (2.20) |
47.40 (40.60) |
7.23 | 6.44-8.25 |
0.032 |
0.468 |
| Final | 13.90 | 14.60 (9.87) |
14.65 (8.90) |
3.00 (1.30) |
34.30 (35.70) |
6.46 | 5.69-7.47 | ||
| Mean from both sessions | 16.20 (8.68) |
||||||||
SD—standard deviation; 95% CI - Confidence Interval; p—t-test; ESs— Effect sizes; Min.—minimum; Max.—maximum; measurement sessions: Initial— 2017; Final—2021.
Table 4.
FM categories in the study group.
| Indicator | Initial | Final | ||||||
| Total | Boys | Girls | p | Total | Boys | Girls | p | |
| Underweight | 10.75 | 10.99 | 10.52 | 0.079 | 5.73 | 6.03 | 5.45 | 0.087 |
| Normal | 60.73 | 62.13 | 59.33 | 0.065 | 58.37 | 60.95 | 55.80 | 0.025 |
| Overweight | 17.59 | 16.22 | 18.95 | 0.018 | 22.76 | 20.77 | 24.75 | 0.057 |
| Obesity | 10.93 | 10.66 | 11.20 | 0.095 | 13.12 | 12.25 | 14.00 | 0.061 |
p—ANOVA; p ≤ 0.05.
Table 5.
Average frequency of consumption of food products, dishes and beverages, %.
| No | Foods | Sex | Częstotliwość spożywania danych produktów [%] |
Statistical measures* |
||||
| Never | 1–3 times a month | Once a week | Several times a week | Every day | ||||
| 1. | Milk | Girls | 4.50 | 5.76 | 20.03 | 30.41 | 39.30 | χ2= 6.812, df-4, p=0.146, VC= 0.178 |
| Boys | 1.83 | 6.92 | 21.89 | 41.41 | 27.95 | |||
| 2. | Yoghurts (natural and flavoured) | Girls | 5.00 | 11.75 | 22.25 | 40.25 | 20.75 | χ2= 10.469, df-4, p=0.033, VC= 0.221 |
| Boys | 7.75 | 11.25 | 15.75 | 49.75 | 15.50 | |||
| 3. | Cottage chesses | Girls | 18.25 | 20.50 | 29.25 | 20.00 | 12.00 | χ2= 11.693, df-4, p=0.019, VC= 0.233 |
| Boys | 11.75 | 22.00 | 22.00 | 33.50 | 10.75 | |||
| 4. | High fat chesses (including processed and blue chesses) | Girls | 4.13 | 13.75 | 27.75 | 37.25 | 17.13 | χ2= 1.241, df-4, p=0.871, VC= 0.076 |
| Boys | 4.50 | 16.00 | 21.75 | 40.75 | 17.00 | |||
| 5. | White bread and rolls | Girls | 0.61 | 1.75 | 5.71 | 22.62 | 69.31 | χ2= 3.389, df-4, p=0.044, VC= 0.125 |
| Boys | 0.50 | 1.25 | 6.25 | 12.46 | 79.50 | |||
| 6. | Whole grain bread and rolls | Girls | 13.20 | 14.21 | 33.76 | 20.16 | 18.68 | χ2= 13.284, df-4, p=0.010, VC= 0.249 |
| Boys | 13.46 | 22.06 | 33.62 | 18.75 | 12.10 | |||
| 7. | White rice, white pasta, fine-grained groats | Girls | 2.75 | 9.41 | 54.04 | 25.10 | 8.71 | χ2= 4.956, df-4, p=0.291, VC= 0.152 |
| Boys | 2.77 | 8.65 | 54.22 | 24.27 | 10.08 | |||
| 8. | Coarse-grained groats, buckwheat groats, oatmeal | Girls | 4.53 | 13.54 | 52.71 | 22.52 | 6.70 | χ2= 8.087, df-4, p=0.008, VC= 0.194 |
| Boys | 5.15 | 11.92 | 55.74 | 21.35 | 5.83 | |||
| 9. | Poultry meat | Girls | 2.79 | 14.41 | 40.50 | 19.92 | 22.38 | χ2= 8.734, df-4, p=0.048, VC=0.202 |
| Boys | 1.00 | 8.98 | 34.99 | 28.23 | 26.80 | |||
| 10. | Red meat | Girls | 6.76 | 27.71 | 49.52 | 9.08 | 6.93 | χ2= 19.835, df-4, p=0.000, VC = 0.304 |
| Boys | 6.21 | 14.25 | 44.97 | 17.96 | 16.60 | |||
| 11. | Cold cuts, sausages, frankfurters | Girls | 9.27 | 9.43 | 20.53 | 33.44 | 27.33 | χ2= 1.141, df-4, p=0.887, VC = 0.703 |
| Boys | 4.50 | 5.10 | 14.79 | 34.24 | 41.37 | |||
| 12 | Canned meats | Girls | 65.00 | 25.75 | 9.25 | 0.00 | 0.00 | χ2= 12.467, df-4, p=0.614, VC = 0.241 |
| Boys | 64.25 | 22.25 | 8.25 | 5.25 | 0.00 | |||
| 13. | Fried flour or mest meals | Girls | 0.00 | 7.00 | 26.25 | 43.75 | 23.00 | χ2= 2.295, df-4, p=0.681, VC = 0.103 |
| Boys | 0.00 | 3.75 | 27.00 | 48.25 | 21.00 | |||
| 14. | Eggs | Girls | 5.72 | 15.98 | 58.65 | 19.04 | 0.61 | χ2= 10.796, df-4, p=0.028, VC = 0.224 |
| Boys | 3.50 | 9.15 | 58.97 | 24.99 | 3.38 | |||
| 15. | Fish | Girls | 20.09 | 23.45 | 53.36 | 2.61 | 0.50 | χ2= 7.496, df-4, p=0.111, VC = 0.187 |
| Boys | 14.07 | 29.21 | 52.74 | 3.10 | 0.88 | |||
| 16. | Legumes | Girls | 35.25 | 43.75 | 12.00 | 8.50 | 0.50 | χ2= 12.628, df-4, p=0.621, VC = 0.110 |
| Boys | 35.00 | 46.50 | 12.50 | 5.25 | 0.75 | |||
| 17. | Fruit | Girls | 0.00 | 2.48 | 12.42 | 30.56 | 54.00 | χ2= 1.357, df-4, p=0.035, VC = 0.079 |
| Boys | 1.25 | 5.73 | 11.85 | 34.91 | 46.26 | |||
| 18. | Vegetables | Girls | 2.24 | 0.00 | 13.45 | 26.83 | 57.48 | χ2= 6.933, df-4, p=0.021, VC = 0.180 |
| Boys | 2.25 | 2.25 | 18.12 | 30.58 | 46.53 | |||
| 19. | Butter as an addition to bread, dishes, for frying, baking, etc. | Girls | 6.25 | 9.75 | 9.75 | 27.75 | 46.50 | χ2= 9.075, df-4, p=0.049, VC = 0.205 |
| Boys | 3.75 | 4.50 | 20.50 | 23.00 | 48.25 | |||
| 20. | Lard as an addition to bread, dishes, for frying, baking, etc. | Girls | 93.75 | 6.25 | 0.00 | 0.00 | 0.00 | χ2= 7.824, df-4, p=0.098, VC = 0.191 |
| Boys | 90.25 | 6.00 | 2.75 | 1.00 | 0.00 | |||
| 21. | Fast food, different types | Girls | 5.23 | 52.43 | 35.62 | 5.74 | 0.99 | χ2= 6.322, df-4, p=0.016, VC = 0.171 |
| Boys | 2.77 | 44.36 | 48.05 | 4.38 | 0.44 | |||
| 22. | Sweets, candies, chocolate, bars | Girls | 0.75 | 6.50 | 20.75 | 29.75 | 42.25 | χ2= 6.256, df-4, p=0.040, VC = 0.172 |
| Boys | 1.75 | 9.50 | 27.00 | 25.50 | 36.25 | |||
| 23. | Juices | Girls | 12.00 | 19.50 | 46.00 | 14.00 | 8.50 | χ2= 7.614, df-4, p=0.106, VC = 0.188 |
| Boys | 6.25 | 16.25 | 56.50 | 13.50 | 7.50 | |||
| 24. | Sweetened carbonated or non-carbonated drinks | Girls | 21.25 | 39.75 | 28.00 | 7.25 | 3.75 | χ2= 5.997, df-4, p=0.147, VC = 0.167 |
| Boys | 16.50 | 37.25 | 23.00 | 14.50 | 8.75 | |||
| 25. | Energy drinks | Girls | 81.75 | 15.50 | 1.75 | 1.00 | 0.00 | χ2= 4.409, df-4, p=0.353, VC = 0.143 |
| Boys | 73.75 | 17.00 | 6.75 | 2.50 | 0.00 | |||
* Chi squared test (χ 2 ); p-value ≤ 0.05; df - degrees of freedom; VC - V Cramera relationship strength.
Disclaimer/Publisher’s Note: The statements, opinions and data contained in all publications are solely those of the individual author(s) and contributor(s) and not of MDPI and/or the editor(s). MDPI and/or the editor(s) disclaim responsibility for any injury to people or property resulting from any ideas, methods, instructions or products referred to in the content. |
© 2025 by the authors. Licensee MDPI, Basel, Switzerland. This article is an open access article distributed under the terms and conditions of the Creative Commons Attribution (CC BY) license (http://creativecommons.org/licenses/by/4.0/).
Copyright: This open access article is published under a Creative Commons CC BY 4.0 license, which permit the free download, distribution, and reuse, provided that the author and preprint are cited in any reuse.


