Submitted:
19 March 2025
Posted:
19 March 2025
You are already at the latest version
Abstract
Background: The Satyrinae subfamily represents a taxonomically critical group within Nymphalidae, characterized by its remarkable species diversity. Despite its evolutionary significance, the phylogenetic relationships among tribal and subtribal lineages remain poorly resolved. Although mitochondrial genomes have become crucial molecular markers in Lepidoptera phylogenetics, their potential remains underutilized in the systematics of Satyrinae. Notably, Amathusiini exhibits a particular paucity, with only two congeneric representatives having been comprehensively sequenced to date. Methods: To address this gap, we employed high-throughput sequencing to assemble the complete mitochondrial genomes of two Amathusiini species, Discophora sondaica and Aemona amathusia. Our study revealed novel evolutionary insights through comparative genomics, which encompassed all available Satyrinae mitochondrial genomes. Additionally, we conducted phylogenetic reconstruction using maximum likelihood and Bayesian inference approaches, utilizing the most extensive dataset to date. Results: The closed circular mitochondrial genomes measure 15,333 bp for D. sondaica and 15,423 bp for A. amathusia, maintaining the ancestral lepidopteran architecture: 13 protein-coding genes (PCGs), 22 tRNAs, 2 rRNAs, and an AT-rich control region. Comparative analyses of 71 mitochondrial genomes revealed strong evolutionary conservation across multiple parameters: nucleotide composition (AT content range: 77.9% - 81.8%), codon usage bias (ENC = 30.83 - 37.55), tRNA secondary structures, and control region organization. All PCGs showed purifying selection signals (Ka/Ks < 1.0), with atp8 exhibiting the highest evolutionary rate (Ka/Ks = 0.277). Phylogenetic reconstructions yielded congruent tribal-level topologies with strong nodal support: (((Satyrini + Melanitini) + (Amathusiini + Elymniini) + Zetherini), confirming a sister relationship between Amathusiini and Elymniini. Within Satyrini, five subtribes formed monophyletic groups: Ypthimina, Erebiina, Maniolina, Satyrina, and Melanargiina, arranged as (((Ypthimina + (Erebiina + Maniolina)) + (Satyrina + Melanargiina)). Mycalesina, Lethina, and Parargina comprised a well-supported clade (BS = 100%; PP = 1.0), though internal relationships required further resolution due to Lethina's polyphyly. Conclusions: This study provides novel insights into mitochondrial genomic evolution within the Satyrinae subfamily, while elucidating the efficacy of mitogenomic data for resolving deep phylogenetic relationships within this ecologically significant subfamily. Our findings establish critical genome baselines for further systematic research and underscore essential pathways for refining subtribal-level taxonomy through integrative molecular approaches.
Keywords:
Satyrinae
; Discophora sondaica
; Aemona amathusia
; mitochondrial genome
; phylogeny
; comparative analysis
1. Introduction
Mitochondria, an indispensable organelles in eukaryotic cells, serve as central hubs for cellular processes such as ATP production via oxidative phosphorylation, maintenance of redox balance, regulation of calcium signaling cascades, and integration of key metabolic pathways. Unlike nuclear DNA, the mitochondrial genome (mitogenome) represents a semi-autonomous genetic system with unique inheritance patterns and distinct evolutionary dynamics [1]. The insect mitogenomes typically exist as a circular DNA molecule (14 to 20 kb) containing 37 canonical genes: 13 protein-coding genes (PCGs) encoding core subunits of respiratory chain complexes, 22 transfer RNA genes (tRNAs), 2 ribosomal RNA genes (rRNAs), and an AT-rich non-coding control region (CR) [2]. Due to their structural simplicity, accelerated mutation rates, predominantly maternal inheritance pattern, and limited recombination, mitogenomes have become powerful molecular tools for evolutionary reconstruction [2,3,4].
Satyrinae, formerly known as Satyridae, is the most diversity subfamily of the Nymphalidae family (Lepidoptera: Papilionoidea), comprising over 2,500 species found on all continents except Antarctica [5,6]. In China, there are 364 species across 57 genera, primarily inhabiting southeastern regions such as Yunnan, Guangdong, Hainan, and Taiwan [7]. Adult satyrids are typically small to medium-sized, characterized by their slender body and small head. Their coloration predominantly features gray-brown or dark brown, accentuated with black and white markings. Most individuals exhibit prominent spots or circular stripes on their wings, while a few species demonstrate reduced or entirely absent wing ornamentation [7]. The larvae primarily feed on Poaceae species, with several taxa attaining pest status in rice agroecosystems. Notably, some lineages have evolved to exploit alternative hosts including ferns and monocotyledonous plants like palms and bamboos as hosts. These butterflies have emerged as valuable model organisms for addressing fundamental questions in ecological adaptation [8], developmental biological patterning [9], and conservation biology [10], owing to their interspecific diversity and habital specialization. Consequently, precise taxonomic delineation and robust phylogenetic reconstruction of satyrid butterflies are crucial for advancing researches across these disciplines.
The systematic classification of Satyrinae continues to pose significant challenges, driven by extraordinary diversity, limited diagnostic morphological synapomorphies, and incomplete molecular marker across taxa. Historically, taxonomic delineations and infra-subfamilial classifications have been subject to frequent revision, resulting in competing classification systematic frameworks [5,7,11,12]. The advent of high-throughput sequencing technologies has revolutionized phylogenetic approaches, enabling molecular systematics to complement traditional morphological analysis. A growing evidence from integrative taxonomic studies strongly supports Satyrinae as a monophyletic subfamily within Nymphalidae [13,14,15,16,17,18,19]. Phylogenetic reconstructions consistently recover close evolutionary relationship between Satyrinae and three nymphalid subfamilies: Charaxinae, Calinaginae, and Morphinae [13,14,15,16,19]. Notably, some classifications propose the conclusion of Morphini, Amathusiini, and Brassolini tribes within Satyrinae [17,18]. Current taxonomy recognizes nine tribes and sixteen subtribes in Satyrinae [20], with Satyrini accounting for approximately 88% of subfamilial diversity through its thirteen constituent subgroups. Twelve of these subtribes (excluding Pronophilina) exhibit predominant distributions in China [20]. Despite increasing support for Satyrinae’s subfamily validity, critical uncertainties persist regarding 1) taxonomic boundaries of major clades, 2) inter-clade phylogenetic relationships, and 3) analytical challenges arise from long-branch attraction artifacts associated with rapid radiative evolution [6,17,18,20,21,22,23]. Marín et al. (2011) established four strongly supported clades under current systematic schemes [6,17,18,23]: (I). Brassolini + Morphini, (II). Elymniini + Amathusiini + Zetherini + (Dirini + Melanitini), (III). Haeterini, and (IV). Satyrini. Notably, evolutionary relationships among these clades remain unresolved phylogenetic challenges [20]. Subsequently, Yang and Zhang (2015) conducted phylogenetic reconstruction of five Chinese Satyrinae tribes (Satyrini, Amathusiini, Zetherini, Elymniini, and Melanitini) through combined analysis of two ribosomal genes and four PCGs [21]. These findings confirmed the inclusion of Amathusiini within Satyrinae, reinforcing previous systematic conclusions. Of particular significance, Satyrini was positioned as a long-branched lineage occupying at the basal phylogenetic position, thereby corroborating earlier findings [6,17]. Their phylogenetic analysis revealed tribal relationships as (Amathusiini + (Zetherini + (Elymniini + Melanitini))) [21], though this topology conflicts with alternative hypothesis proposed in other studies, including (Melanitini + (Zetherini + (Elymniini + Amathusiini))) [6] and ((Elymniini + Melanitini) + (Zetherini + Amathusiini)) [18], underscoring the ongoing controversies in Satyrinae phylogenetics. It should be noted that existing phylogenetic frameworks have predominantly relied on morphological characteristics combined partial mitochondrial sequence data, highlighting the necessity for genome-scale datasets to enhance phylogenetic resolution.
The emergence of high-throughput sequencing technologies has revolutionized insect mitochondrial genome sequencing. Nevertheless, mitogenomic coverage within Satyrinae remains exceptionally sparse, with Amathusiini exhibiting particular paucity, to date merely two congeneric representatives have been comprehensively sequenced. Recently, several investigations in this subfamily predominantly relied on mitogenomic fragments combined with limited taxonomic representation [24,25,26,27,28,29,30,31,32,33,34]. This current paucity of complete mitogenomes fundamentally impedes elucidation of evolutionary dynamics governing mitogenomic architecture and phylogenetic framework within this ecologically significant group. These critical knowledge gaps necessitate large-scale phylogenetic reconstruction using comprehensive mitogenomic datasets with enhanced taxonomic sampling to elucidate both phylogenetic relationships and evolutionary trajectories in Satyrinae.
This study presents the complete mitogenome characterization and comparative analysis of two Amathusiini species, Discophora sondaica and Aemona amathusia. Furthermore, we performed structural reannotation of eight published satyrid mitogenomes originally assembled from publicly available genome resources. To advance phylogenetic resolution, we established the most comprehensive mitochondrial phylogenomic framework for Satyrinae to date, integrating curated datasets from 71 species spanning all 30 recognized genera within this subfamily for which mitogenome data are currently available. Through this integrated approach combining novel genome characterization, data quality refinement, and expanded taxonomic sampling, our findings reveal unprecedented details of mitogenomic organization patterns, resolved long-standing phylogenetic ambiguities, and establish a robust molecular foundation for reconstructing phylogenetic relationships across major Satyrinae lineages.
2. Materials and Methods
2.1. Sample Collection and Genomic DNA Extraction
Adult specimens of D. sondaica and A. amathusia were field-collected from JiuFu Mount, Sanming City, Fujian Province, China (118.093 E, 26.103 N) in 2024. Following standard entomological protocol, fresh specimens were immediately preserved in absolute ethanol and stored at -80℃ prior to DNA extraction. Morphological identification was performed using diagnostic characters from established taxonomic keys. All specimens were archived in the Fujian Provincial Key Laboratory of Resources and Environment Monitoring & Sustainable Management and Utilization at Sanming University. Total genomic DNA was extracted from thorax musculature of individually processed specimens using the DNeasy tissue kit following the manufacturer’s protocols (Qiagen, Beijing, China).
2.2. Library Preparation and Sequencing
High-molecular-weight DNA (1 μg) was mechanically sheared to approximately 500 bp fragments using a Covaris M220 disruptor and then was used to construct short-insert libraries according to the manufacturer’s instructions (TruSeq™ Nano DNA Sample Prep Kit, Illumina). Subsequently, high-throughput sequencing was performed on an Illumina NovaSeq 6000 platform (BIOZERON Co., Ltd, Shanghai, China) with a reads length of 150 bp paired-end.
2.3. Pre-Processing, Read Filtering, Mitogenome Assembly, and Annotation
Raw reads were filtered using Trimmomatic v0.39 [35] to remove reads with adaptors, low quality (Q<20), ambiguous bases (>10% N-content) and duplicated sequences. Mitogenome reconstruction employed a combined assembly strategy integrating de novo assembly with reference-based scaffolding. The workflow comprised three iterative steps: 1) Primary assembly using MitoZ v2.3 [36], followed by BLASTn verification against the NCBI Refseq mitogenome database, 2) Contig refinement via BLAST v2.8.1+ alignment to curate reference mitogenomes (>80% query coverage) with manually correction based on conserved gene order in Lepidoptera mitochondrial architectures, 3) Topological validation through MUMmer 3.23 whole-genome allignment to confirm circular chromosome continuity and absence of assembly breaks [37]. Annotation procedures were performed as follows: Structural elements (PCGs, tRNAs, and rRNAs) were identified via the MITOS websever (http://mitos.bioinf.uni-leipzig.de/index.py) [38] under standard metazoan mitogenome parameters. Gene boundary determination involved Inter reciprocal BLASTp search against the Lepidoptera mitochondrial protein database. Start/stop codon adjustments were performed in SnapGene View through multiple alignment with the reference mitogenome (Stichophthalma louisa, KP247523). Final visualization was generated using the Proksee server (https://proksee.ca/) [39]. The tRNA secondary structure validation employed tRNAscan-SE 2.0.9 [40] under mitochondrial/chloroplast matrix settings, with structural diagrams renders in Adobe Illustrator 2021 using conserved tRNA cloverleaf schematics. Control region analysis incorporated Tandem Repeats Finder (http://tandem.bu.edu/trf/trf.html) using the default parameters [41]. The complete circular mitogenomes of D. sondaica (PQ845452) and A. amathusia (PQ846667) have been deposited in GenBank.
2.4. Nucleotide Sequence Composition Analysis
Genome-wide nucleotide distribution and codon usage were systematically analyzed using MEGA 11.0 with invertebrate mitochondrial genetic code software [42]. Relative synonymous codon usage (RSCU) values were computed via Phylosuite 1.2.3 [43]. Strand asymmetry was quantified through AT-skew and GC-skew indices calculated as AT-skew = (A−T)/(A+T) and GC-skew = (G−C)/(G+C) [44]. Nucleotide diversity (Pi) across 13 PCGs was calculated using DNASP 6.0 [45] with a 100-bp sliding window. Nonsynonymous substitution and/synonymous substitution ratios (Ka/Ks) were determined using DNASP 6.0. Effective number of codons (ENC) was computed via CodonW 1.4.2 [46] using mitochondrial codon frequency tables.
2.5. Phylogenetic Analysis
Phylogenetic reconstruction was performed using a comprehensive dataset comprising mitogenomes from 71 Satyrinae species representing 30 recognized genera, incorporating two novel sequences generated in this study and 69 publicly available records (Table S1). Three Charaxinae species (Polyura arja, Polyura eudamippus, and Charaxes kahruba) served as outgroups for rooting purposes. Mitogenomic features (PCG and RNAs) were systematically extracted using Phylosuitev1.2.3 [43]. Initial nucleotide alignment of 13 PCGs and RNA components was conducted using MAFFT 7.313 [47]. Nucleotide sequence alignment results for these 13 PCGs were optimized with MACSE 2.03 [48], and ambiguously aligned fragments were removed in batches with Gblocks 0.91b [49] under relax parameters. Gaps in RNA sequences were removed with TrimAl 1.4. rev15 [50]. Following manual verification in MEGA 11.0, a concatenated matrix (13 PCGs + 2 tRNAs + 22 tRNAs) was conducted using Phylosuitev1.2.3. For Bayesian inference (BI) analysis, the optimal partitioning model was determined using PartitionFinder2 2.1.1 [51] with a greedy algorithm under the Akaike information criterion (AIC). Bayesian phylogenetic reconstruction was then conducted in MrBayes 3.2.6 [52]. Two parallel runs with four independent Markov chains were executed for 3,000,000 generations, sampling trees every 100 generations. Convergence was confirmed when the average standard deviation of split frequencies fell below 0.01. Following a 25% burn-in removal, the remaining trees from each run were combined to calculate posterior probability (PP) through majority-rule consensus. For maximum likelihood (ML) analysis, model selection was implemented in ModelFinder 2.2.0 [53] using the Bayesian information criterion (BIC) under a distribution-free rate model. ML tree was subsequently constructed using IQ-TREE 1.6.8 [54] with an edge-linked partition model. Nodal bootstrap support (BS) was assessed through 5000 ultrafast bootstrap replicates generated during tree search [55]. All phylogenetic trees were visualized using FigTree v1.4.4 [56].
3. Results and Discussion
3.1. Mitogenome Organization and Base Composition
Whole-genome sequencing of D. sondaica (6254.9 Mb raw data ) and A. amathusia (5128.9 Mb raw data ) was performed using 150 bp pair-end Illumina sequencing. After quality filtering, 6.11 Gb and 4.99 Gb of high-quality reads were obtained for subsequent assembly. De novo assembly generated the complete circular mitogenomes of D. sondaica (15,333 bp) and A. amathusia (15,423 bp), both exhibiting the characteristic double-stranded structure of insect mitogenomes (Figure 1). Gene content analysis revealed the conserved repertoire of 37 mitochondrial genes in both species: 13 PCGs, 22 tRNAs, and 2 rRNAs (rrnL and rrnS), and a single non-coding control region. Strand-specific distribution showed 23 genes (9 PCGs and 14 tRNAs) transcribed from the majority strand (J-strand), with the remaining 14 genes (4 PCGs, 2 rRNAs, and 8 tRNAs) located on the minority strand (N-strand) (Table 1). Additionally, the mitogenomic organization of eight previously sequenced satyrid species has been reannotated, and the results are presented in Table S2. Comparative analysis with other reported Satyrid mitogenomes revealed remarkable size across the subfamily, with the total lengths ranging from 15,054 bp (Coenonympha glycerion) to 16,129 bp (Bicyclus anynana) (Figure S1). Obviously, all analyzed mitogemomes maintain identical gene order and transcriptional polarity, previously reported architectures [24,25,26,27,28,29,30,31,32,33,34,57,58,59,60,61,62,63,64,65,66,67,68,69,70,71]. While the 13 PCGs exhibit conserved size, length polymorphisms primarily occur in non-coding regions, particularly the control region (Figure S1).
The mitogenomes of D. sondaica and A. amathusia exhibit a strong AT nucleotide bias with total A T content of 80.9% and 79.6%, respectively. This composition bias was observed across all functional elements (13 PCGs, 22 tRNAs, 2 rRNAs) within these newly sequences mitogenomes (Table S3), mirroring the compositional patterns of other satyrid mitogenomes (Figure 2A). Hierarchical analysis revealed the control region as the most AT-rich element (93.3% and 91.9%), followed by rRNA genes (85.3% and 84.9%), tRNA clusters (81.7% and 80.2%), and 13 PCGs (79.3% and 77.8%). This hierarchical AT distribution aligns with most reported satyrid mitogenomes except Paroeneis palaearcticus, which displays an anomalously low AT content of the control region (61.8%) [26]. At the codon level, the third position in PCGs maintain significantly higher AT content (85.3% - 95.4%) compared to first (71.7% - 75.3%) and second positions (70.1% - 71.3%) across all analyzed species (Figure 2a). Comparative analysis of five Satyriane tribes revealed limited compositional variation, with whole-mitogenome AT contents ranging narrowly from 79.7% in Satyrini to 81.1% in Zetherini (Figure S2). Nucleotide skew analysis revealed conserved patterns: AT-skew values range from -0.055 (Neope muirheadii) to -0.015 (A. amathusia), while GC-skew values vary between -0.273 (Lethe sidonis) and -0.179 (P. palaearcticus) (Table S2, Figure 2b). These results corroborate the proposed standard insect mitogenome skewness profiles [44,72], suggesting evolutionary conservation of replication-strand mutation biases in Lepidoptera.
3.2. Protein-Coding Genes and Codon Usage
In both newly sequenced satyrid mitogenomes, most PCGs exhibited canonical ATN (N= A/T/G/C) initiation codons. A notable exception was observed in cox1, which uniquely employed CGA as its start codon (Table 1). This unconventional use of CGA as an initiation codon for cox1 represents a conserved feature consistently documented across Satyrinae mitogenomes [24-34,57-71]. Regarding termination signals, complete TAA stop codons predominated among PCGs in both mitogenomes. However, six genes (cox1, cox2, nad1, nad4, nad5, and cob) displayed incomplete termination signals consisting of a single T residue (Table 1). Such truncated stop codons are commonly observed in insect mitogenomes and are hypothesized to be completed through post-transcriptional polyadenylation during mRNA maturation process [73].
The codon family composition and RSCU patterns of the 13 PCGs were analyzed for the two newly sequenced mitogenomes. To minimize potential biases arising from incomplete stop codons, all stop codons were excluded from the analysis. The combined length of the 13 PCGs was 11,202 bp in D. sondaica and 11,196 bp in A. amathusia, encoding 3727 and 3722 amino acids (AAs). These values align with those reported for other Satyrinae mitogenomes, which range from 3682 AAs in Mycalesis intermedia [62] to 3755 AAs in Tatinga tibeta[24–34,57–71na (Figure S3). Among the encoded amino acids, Leu2, Ile, Phe, Met, and Asn were the most abundant in both species, whereas Cys exhibited the lowest frequency (Figure S4). This distribution mirrors trends observed across all available Satyrinae mitogenomes (Figure 3a). RSCU analysis showed a pronounced bias toward codons ending with A/U at the third position values in both newly sequenced species (Figure S5). The eight most prevalent codons shared by both mitogenomes were UUA, UCU, CGA, GCU, CCU, GGA, GUU, and ACU. Notably, this codon preference pattern is conserved in the PCGs of most other Satyrinae species (Figure 3b). Distinct absences were observed in specific codons: three codons (CUG, CCG, and AGG) were entirely absent in D. sondaica, while two (CUG and AGG) were missing in A. amathusia. Furthermore, GC-rich codons showed markedly reduced usage across most satyrid species (Figure 3b). For instance, Neope goschkevitschii lacks only one codon (CCG) [65], whereas six codons (AGG, CUG, GCG, ACG, CCG, and AGC) are absent in Ypthima motschulskyi [24] (Figure 3b). These findings are consistent with broader lepidopteran codon usage trends [19,74], reinforcing the strong correlation between genomic GC content and codon preference evolution [75,76].
The ENC shows an inverse relationship with codon usage bias intensity, typically ranging between 20 and 61 in biological systems. Using an established critical threshold (ENC= 35) for assessing codon selection patterns [77], our analysis revealed distinct preferences across studied species. As shown in Figure 4a, D. sondaica (ENC = 32.23) and A. amathusia (ENC = 34.34) exhibited relatively stronger codon preference, falling below this benchmark. Comparative analysis of available satyrid mitogenomes identified a continuum of ENC values from 30.83 in Elymnias malelas and Y. motschulskyi to 37.55 in S. louisa. Tribal-level comparisons within Satyrinae showed significant variation: Amathusiini exhibited the highest average ENC (35.01), followed sequentially by Satyrini (34.01), Melanitini (32.86), and Elymniini (32.15), while Zetherini recorded the lowest average (31.99) (Figure 4b). These systematic evaluation confirms universal but variable codon usage bias across all examined satyrid mitogenomes.
3.3. Transfer RNA, Ribosomal RNA Genes and Control Region
Comparative analysis of the two mitogenomes revealed 22 typical tRNAs in both D. sondaica and A. amathusia, exhibiting size variation from 61 bp (trnS1) to 71 bp (trnK) (Table 1). Strand distribution analysis showed eight tRNAs (trnQ, trnC, trnY, trnH, trnP, trnL1, trnV, and trnF) encoded on the N-strand, with the remaining 14 positioned on the J-strand. Secondary structural predictions demonstrated that all tRNAs adopted the typical clover-leaf conformation except trnS1, which displayed a reduced dihydrouridine (DHU) arm forming a simple loop structure (Figures S6 and S7). The DHU stem truncation in trnS1 represents a conserved architectural feature observed across in insect mitogenomes, including all available satyrid species sequences [3]. Notably, G-U wobble pairs and U-U mismatches were detected at frequencies of 24 and 27 instances in D. sondaica and A. amathusia, respectively (Figure S6 and S7). Quantitative analysis revealed a predominance of G-U mismatches over the noncanonical pair types in both species, a distribution pattern consistent with previous reports of tRNA structural features in insect mitogenomes [78,79,80,81].
Consistent with other Satyrinae mitogenomes, both rRNA genes (rrnL and rrnS) in D. sondaica and A. amathusia exhibit N-strand encoding. These rRNA genes maintain conserved spatial organization within the mitogenome, flanking trnV while occupying their characteristic position between trnL1 and the control region [24,25,26,27,28,29,30,31,32,33,34]. Comparative analysis reveals distinct size variations: D. sondaica possesses rrnL (1331 bp) and rrnS (770 bp), while A. amathusia demonstrates large dimensions with rrnL (1399 bp) and slightly reduced rrnS (767 bp). Notably, A. amathusia’s rrnL represents the longest recorded among sequenced satyrid species, exceeding Mycalesis mineus minimum length (1011 bp) by 388 base pairs [61] (Figure S1). The small subunit rRNA (rrnS) measurement in both novel mitogenomes align with subfamily standards, falling within established parameters for this subfamily ranging from 546 bp in Ypthima akragas [30] to 852 bp in P. palaearcticus [26] (Figure S1).
Characterized as both the largest intergenic spacer and primary replication initiation site in insect mitogenomes, the control region has been successfully identified in our two newly sequenced mitogenomes. This non-coding segment is consistently located between the rrnS and trnM genes (Figure 1 and Table 2). Comparative analysis reveals size variations ranging from 181 bp (C. glycerion) to 1322 bp (B. anynana), with significant AT content fluctuations from 61.8% (P. palaearcticus) to 95.6% (Stichophthalma camadeva). Our findings demonstrate that these length polymorphisms account for most of observed mitogenome size variation among species (Figure S1). Additionally, the control regions of the two newly sequences mitogenomes exhibited an absence of tandem repeat elements (>50 bp), a genome feature commonly observed in lepidopteran insects [82]. However, comparative analysis revealed the preservation of three hallmark structural elements characteristic of lepidopterans across all three mitogenomes: (1) a conserved “ATAGA” motif adjacent to rrnS followed by a poly-T stretch, corresponding to the minority strand replication origin; (2) microsatellite-like elements (TA)n or (AT)n initiated by an “ATTTA” signature sequence; and (3) a distinct Ploy(A) tract preceding trnM (Figure S8).
3.4. Nucleotide Diversity and Evolutionary Rate Among Satyrinae Mitogenomes
Nucleotide diversity analysis serves as a critical tool for detecting genome regions with elevated sequence divergence, providing a valuable guideline for developing species- or group-specific molecular markers. This approach proves particularly advantageous in evolutionary studies of morphological conserved taxa [83,84]. Through sliding window analysis of aligned PCGs, we quantified nucleotide variation patterns across all Satyrinae mitogenomes using Pi values. Our results revealed considerable variation in nucleotide diversity among the 13 PCGs, with average Pi values spanning from 0.111 (cox2) to 0.163 (nad3) (Figure 5a). Furthermore, nad3 emerged as the most variable gene (Pi = 0.163), closely following by nad6 (Pi = 0.155) and atp8 (Pi = 0.141). In contrast, cox2 (Pi = 0.111) and cox1 (Pi = 0.112) displayed relatively conserved evolutionary patterns, indicating the lowest nucleotide diversity among examined PCGs. These findings aligns with our previous report on satyrid mitogenome evolution [29], yet present an intriguing contrast to divergence patterns observed in other butterfly groups. Specially, nad6 was identified as the fast evolving gene in Papilionidae [85] and Limenitidinae [86]. Our findings highlight that genes exhibiting accelerated divergence rate may serve as reliable DNA barcodes for both population genetics investigations and species identification in Satyrinae.
The Ka/Ks ratio (ω) serves as a crucial metric for assessing selective pressures on protein- coding genes, distinguishing between positive selection (ω ˃ 1), neutral evolution (ω = 1), and purifying selection (0 < ω < 1) [87]. To evaluate evolutionary rate variation among mitochondrial genes, we calculated ω values for all 13 PCGs across all available Satyrinae mitogenomes (Figure 5b). Our analysis demonstrated that all 13 PCGs exhibited ω values significantly below unity (ω < 1), which is consistent with previous reports in satyrid butterflies [24,29], thereby confirming their predominant evolution under purifying selection. This evolutionary conservation supports the utility of these PCGs for phylogenetic reconstruction within Satyrinae. Notable variation emerged in selected intensity across individual genes, atp8 gene exhibited the highest evolutionary rate (ω = 0.277), follow by nad6 (ω = 0.193), and nad4l (ω = 0.189). In contrast, cox1 gene displayed exceptional conservation with the lowest ω value (0.042). These findings indicate that atp8 experiences relatively relax selective constrains compared to other mitochondrial genes, while cox1 undergoes the strongest purifying selection within Satyrinae mitogenomes. The observed hierarchy of evolutionary rates align with documented patterns in other Lepidoptera lineages, including Papilionidae [85] and Limenitidinae [86], implying conserved mechanisms of mitochondrial genome evolution across butterfly taxa.
3.5. Phylogenetic Analysis
The Satyrinae subfamily represents a remarkably diverse lineage of exceptional species richness, serving as model organisms in evolutionary studies [8,9,10]. Despite its biological significance, current phylogenetic understanding of tribal and subtribal relationships remains constrained by inadequate sampling and insufficient molecular data. To address these limitations, we conducted an extensive phylogenetic analysis incorporating expanded mitochondrial genomic data (13 PCGs + 2 rRNAs + 22 tRNAs) and enhanced taxonomic representation across 71 species. Our dataset includes two newly sequenced Satyrinae species, collectively representing all 30 mitogenome-available genera within the subfamily. Phylogenetic reconstruction using ML and BI approaches yielded congruent topologies at the tribal levels. Both analyses strongly supported the monophyly of Satyriane (BS = 100%; PP = 1.0) (Figure 6), with five distinct tribal lineages resolved: Satyrini, Amathusiini, Zetherini, Melanitini, and Elymniini. The reconstructed relationships followed a (((Satyrini + Melanitini) + (Amathusiini + Elymniini) + Zetherini) configuration across both analytical methods. Notably, Zetherini occupied a basal position relative to other tribes, a finding consistent with our previous investigations [29], though conflicting with alternative topologies derived from different datasets that position Satyrini as the basal lineage [2,13,17]. Within this framework, D. sondaica and A. amathusia clustered securely within Amathusiini (BS = 100%; PP = 1.0), forming a sister group with Elymniini. This configuration aligns with previous mitogenomic analyses [24,27,28,29] and the BI results from Peña and Wahlberg [6], contrasting with earlier morphological assessments suggesting closer affinity between Elymniini and Melanitini [18,21]. This persistent discrepancies highlight the need for expanded mitogenomic sampling to resolve deep phylogenetic relationships within Satyrinae.
Despite the limited taxon sampling within Satyrini, both ML and BI analyses consistently supported the monophyly of all analyzed subtribes except for Lethina. Within Lethina, the genus Lethe emerges as phylogenetically distinct. Moreover, the phylogenetic placement of Ninguta exhibited incongruence between ML and BI topologies. Our results strongly support Melanargiina as sister to Satyrina (BS = 100%; PP = 1.0), corroborating previous findings [24,26,29,88]. The analyses revealed Ypthimina as sister to the Erebiina + Maniolina clade with moderate to strong support (BS = 69%; PP = 0.94), consistent with our previous mitogenomic study [29]. A notable discordance emerged regarding Coenonymphina’s placement: while BI analysis robustly positioned it as sister to remaining Satyrini subtribes (PP = 1.0), ML analysis indicated an alternative affiliation with the Mycalesina + Lethin + Parargina clade, albeit with weak nodal support (BS = 55%), mirroring previous study [23]. We confirmed the closed evolutionary relationships among Mycalesina, Lethin, and Parargina subtribes, aligning with both prior mitogenomic [24,26,27,29,88] and multlocus studies [6,18,22,23]. However, these inter-subtribal nodes generally received weakly statistical supported across analyses. This uncertainty likely reflects insufficient taxonomic representations - only 9 of 13 recognized subtribes were included, omitting critical group like Eritina, Euptychiina, Ragadiina, and Pronophilin. Our findings underscore the necessity for expanded global sampling to resolve basal relationships within Satyrini. Further studies should prioritize inclusion of underrepresented subtribes to strengthen phylogenetic inferences and clarify systematic uncertainties.
4. Conclusions
In this study, we successfully sequenced and annotated the complete mitogenomes of D. sondaica and A. amathusia. The two novel mitogenomes exhibited the canonical Lepidoptera gene architecture, maintaining conserved gene orientation and organization patterns observed across the Satyrinae. Estimation of evolutionary rates indicated that universal purifying selection pressures are acting on 13 PCGs. Phylogenetic reconstruction clarified tribal relationships within Satyrinae, yielding a topology of (((Satyrini + Melanitini) + (Amathusiini + Elymniini) + Zetherini), with strong nodal support confirming the sister relationship between Amathusiini and Elymniini. At the subtribe level within Satyrini, we resolved the hierarchy as (((Ypthimina + (Erebiina + Maniolina)) + (Satyrina + Melanargiina)), while identifying a potential clade comprising Mycalesina, Lethin, and Parargina. However, these relationships require further validation due to moderate bootstrap support. Our findings provide critical mitogenomic resources and a phylogenetic framework for Satyrinae, establishing an essential groundwork for future studies on the evolutionary dynamics and phylogenetic resolution of this ecologically significant butterfly subfamily.
Supplementary Materials
The following supporting information can be downloaded at: www.mdpi.com/xxx/s1, Figure S1: Comparison of gene lengths for 71 selected Satyrinae mitochondrial genomes. Species with mitochondrial genomes sequenced in this study are marked in red; Figure S2: The averaged A + T content of the mitochondrial genomes of five satyrid tribes; Figure S3: Comparison of the number of amino acids for 71 selected Satyrinae mitochondrial genomes. Species with mitochondrial genomes sequenced in this study are marked in red; Figure S4: Composition of protein coding gene amino acids in two newly sequenced mitochondrial genomes; Figure S5: Relative synonymous codon usage (RSCU) patterns in two newly sequenced mitochondrial genomes; Figure S6: Predicted secondary cloverleaf structures for the tRNAs of the Discophora sondaica; Figure S7: Predicted secondary cloverleaf structures for the tRNAs of the Aemona amathusia; Figure S8: The features of control region in two newly sequenced mitochondrial genomes; Table S1: List of taxon used for the phylogenetic analyses in this study; Table S2: Reannotation and comparison of mitochondrial genome organizations of 8 previous sequenced satyrid species; Table S3: Nucleotide composition of the Discophora sondaica (DS) and Aemona amathusia (AA) mitogenome.
Author Contributions
Conceptualization, Q.S., G.S. and J.Z.; methodology, formal analysis and data curation, Q.S., X.W., X.X. and J.Z.; investigation, J.X. and G.S.; writing—original draft preparation, Q.S., X.W. and J.Z.; writing—review and editing, Q.S., J.X., G.S. and J.Z.; visualization, Q.S., X.W., X.X. and J.X.; supervision, G.S. and J.Z.; project administration, Q.S. and J.Z; funding acquisition, Q.S. and J.Z. All authors have read and agreed to the published version of the manuscript.
Funding
This research was funded by the Natural Science Foundation of Fujian Province, China, grant number 2021J011121 and 2022J011173.
Institutional Review Board Statement
Not applicable.
Informed Consent Statement
Not applicable.
Data Availability Statement
The genome sequence data that support the findings of this study are openly available in GenBank of NCBI at (https://www.ncbi.nlm.nih.gov/) under the accession no. PQ845452 (Discophora sondaica) and PQ846667 (Aemona amathusia). The associated BioProject, SRA, and Bio-Sample numbers for D. sondaica and A. amathusia are PRJNA1231788 and PRJNA1231789, SRR32627473 and SRR32581916, and SAMN47222378 and SAMN47221793, respectively.
Acknowledgments
We are grateful to Chengyong Su (College of life sciences, Anhui Normal University, Wuhu, China) and Shengchung Chen (Sanming University, Sanming, Fujian) for revising the manuscript.
Conflicts of Interest
The authors declare no conflicts of interest.
References
- Kim, K.Y.; Lee, S.Y.; Bang, I.C.; Nam, Y.K. Complete mitogenome sequence of an endangered freshwater fish, Iksookimia choii (Teleostei; Cypriniformes; Cobitidae). Mitochondrial DNA 2008, 19, 438–445. [Google Scholar] [PubMed]
- Cameron, S.L. Insect mitochondrial genomics: Implications for evolution and phylogeny. Annu. Rev. Entomol. 2014, 59, 95–117. [Google Scholar]
- Wolstenholme, D.R. Animal Mitochondrial DNA: Structure and Evolution. Int. Rev. Cytol. 1992, 141, 173–216. [Google Scholar] [PubMed]
- Zhang, D.X.; Hewitt, G.M. Insect mitochondrial control region: A review of its structure, evolution and usefulness in evolutionarystudies. Biochem. Syst. Ecol. Evol. 1997, 25, 99–120. [Google Scholar]
- Ackery, P.R.; de Jong, R.; Vane-Wright, R.I. The Butterflies: Hedyloidea, Hesperioidea and Papilionoidea. In Handbook of Zoology; Vol. IV Arthropoda: Insecta. Lepidoptera, Moths and Butterflies, vol. 1: Evolution, Kristensen, N.P., Eds.; Walter de Gruyter: Berlin, Germany, 1999; Volume 4, pp. 263–300. [Google Scholar]
- Peña, C.; Wahlberg, N. Prehistorical climate change increased diversification of a group of butterflies. Biol. Letters 2008, 4, 274–278. [Google Scholar]
- Chou, I. Classification and Identification of Chinese Butterflies. Henan Scientific and Technological Publishing House: Zhengzhou, China, 1998.
- Schmitt, T.; Haubrich, K. The genetic structure of the mountain forest butterfly Erebia euryale unravels the late Pleistocene and postglacial history of the mountain coniferous forest biome in Europe. Mol. Ecol. 2008, 17, 2194–2207. [Google Scholar]
- Oliver, J.C.; Tong, X.L.; Gall, L.F.; Piel, W.H.; Monteiro, A. A single origin for nymphalid butterfly eyespots followed by wide spread loss of associated gene expression. PLoS Genet. 2012, 8, e1002893. [Google Scholar]
- Slamova, I.; Klecka, J.; Konvicka, M. Woodland and grassland mosaic from a butterfly perspective: Habitat use by Erebia aethiops (Lepidoptera: Satyridae). Insect Conserv. Diver. 2013, 6, 243–254. [Google Scholar]
- Miller, L.D. The higher classification, phylogeny and zoogeography of the Satyridae (Lepidoptera). Memoirs Am. Entomol. Soc. 1968, 24, 1–174. [Google Scholar]
- Harvey, D.J. Higher classification of the Nymphalidae, Appendix B. In The Development and Evolution of B. In The Development and Evolution of Butterfly Wing Patterns; Nijhout, H.F., Ed.; Smithsonian Institution Press: Washington, DC, USA, 1991; pp. 255–273. [Google Scholar]
- Brower, A.V.Z. Phylogenetic relationships among the Nymphalidae (Lepidoptera) inferred from partial sequences of the wingless gene. P. Roy. Soc. B: Biol. Sci. 2000, 267, 1201–1211. [Google Scholar]
- Freitas, A.; Brown, K. Phylogeny of the Nymphalidae (Lepidoptera). Syst. Biol. 2004, 53, 363–383. [Google Scholar] [CrossRef] [PubMed]
- Wahlberg, N.; Weingartner, E.; Nylin, S. Towards a better understanding of the higher systematics of Nymphalidae (Lepidoptera: Papilionoidea). Mol. Phylogenet. Evol. 2003, 28, 473–484. [Google Scholar] [CrossRef]
- Wahlberg, N.; Braby, M.F.; Brower, A.V.Z. , de Jong, R.; Lee, M.M.; Nylin, S.; Pierce, N.E.; Sperling, F.A.H.; Vila, R.; Warren, A.D.; et al. Synergistic effects of combining morphological and molecular data in resolving the phylogeny of butterflies and skippers. Proc. R. Soc. B. 2005, 272, 1577–1586. [Google Scholar] [CrossRef]
- Peña, C.; Wahlberg, N.; Weingartner, E.; Kodandaramaiah, U.; Brower, A.V.Z. Higher level phylogeny of Satyrinae butterflies (Lepidoptera: Nymphalidae) based on DNA sequence data. Mol. Phylogenet. Evol. 2006, 40, 29–49. [Google Scholar] [CrossRef]
- Wahlberg, N.; Leneveu, J.; Kodandaramaiah, U.; Peña, C.; Nylin, S.; Freitas, A.V.; Brower, A.V. Nymphalid butterflies diversify following near demise at the Cretaceous/Tertiary boundary. Proc. Biol. Sci. 2009, 276, 4295–4302. [Google Scholar] [CrossRef] [PubMed]
- Shi, Q.H.; Sun, X.Y.; Wang, Y.L.; Hao, J.S.; Yang, Q. Morphological characters are compatible with mitogenomic data in resolving the phylogeny of nymphalid butterflies (Lepidoptera: Papilionoidea: Nymphalidae). PLoS ONE 2015, 10, e0124349. [Google Scholar] [CrossRef] [PubMed]
- Marín, M.A.; Peña, C.; Freitas, A.V.; Wahlberg, N.; Uribe, S.I. From the phylogeny of the Satyrinae butterflies to the systematics of Euptychiina (Lepidoptera: Nymphalidae): history, progress and prospects. Neotrop. Entomol. 2011, 40, 1–13. [Google Scholar] [CrossRef]
- Yang, M.S.; Zhang, Y.L. Phylogenetic utility of ribosomal genes for reconstructing the phylogeny of five Chinese satyrine tribes (Lepidoptera, Nymphalidae). ZooKeys 2015, 488, 105–120. [Google Scholar]
- Yang, M.S.; Zhang, Y.L. Molecular phylogeny of the butterfly tribe Satyrini (Nymphalidae: Satyrinae) with emphasis on the utility of ribosomal genes mitochondrial 16s rDNA and nuclear 28s rDNA. Zootaxa 2015, 3985, 125–141. [Google Scholar] [CrossRef]
- Peña, C.; Nylin, S.; Wahlberg, N. The radiation of Satyrini butterflies (Nymphalidae: Satyrinae): a challenge for phylogenetic methods. Zool. J. Linn. Soc-lond. 2011, 161, 64–87. [Google Scholar] [CrossRef]
- Yang, M.S.; Song, L.; Zhou, L.; Shi, Y.X.; Song, N.; Zhang, Y.L. Mitochondrial genomes of four satyrine butterflies and phylogenetic relationships of the family Nymphalidae (Lepidoptera: Papilionoidea). Int. J. Biol. Macromol. 2020, 145, 272–281. [Google Scholar] [CrossRef] [PubMed]
- Chen, L.; Wahlberg, N.; Liao, C.Q.; Wang, C.B.; Ma, F.Z.; Huang, G.H. Fourteen complete mitochondrial genomes of butterflies from the genus Lethe (Lepidoptera, Nymphalidae, Satyrinae) with mitogenome-based phylogenetic analysis. Genomics 2020, 112, 4435–4441. [Google Scholar] [CrossRef]
- Dan, Z.C.; Duan, L.; Chen, Z.N.; Guan, D.L.; Xu, S.Q. Mitogenomes of three satyrid butterfly species (Nymphalidae: Lepidoptera) and reconstructed phylogeny of Satyrinae. Diversity 2021, 13, 468. [Google Scholar] [CrossRef]
- Wu, J.L.; Bao, T.T.; Sun, G.; Xiao, Y.; Fang, Y.; Shi, Q.H. Complete mitochondrial genome of the Woodland Brown, Lopinga achine Scopoli, 1763 (Nymphalidae: Satyrinae) and its phylogenetic analysis. Mitochondrial DNA B 2022, 7, 747–749. [Google Scholar]
- Hu, W.Q.; Mao, K.S.; Dou, L. Complete mitochondrial genome of the Minois paupera Alpheraky, 1888 (Nymphalidae: Satyrinae) and its phylogenetic analysis. Mitochondrial DNA B 2024, 9, 738–742. [Google Scholar]
- Shi, Q.H.; Xie, J.L.; Wu, J.L.; Chen, S.C.; Sun, G.; Zhang, J.C. Characterization of the complete mitochondrial genome of an endemic species in China, Aulocera merlina (Lepidoptera: Nymphalidae: Satyrinae) and phylogenetic analysis within Satyrinae. Ecol. Evol. 2024, 14, e11355. [Google Scholar]
- Wu, L.W.; Lin, L.H.; Lees, D.C.; Hsu, Y.F. Mitogenomic sequences effectively recover relationships within brush-footed butterflies (Lepidoptera: Nymphalidae). BMC Genomics 2014, 15, 468. [Google Scholar]
- Li, X.D.; Hu, H.W.; Zhang, S.L.; Wang, J.W.; Li, R. Characterization of the complete mitochondrial genome of Ypthima baldus (Lepidoptera: Satyrinae) with phylogenetic analysis. Mitochondrial DNA B 2020, 5, 1019–1020. [Google Scholar]
- Shi, Q.H.; Lin, X.Q.; Ye, X.; Xing, J.H.; Dong, G.W. Characterization of the complete mitochondrial genome of Minois dryas (Lepidoptera: Nymphalidae: Satyrinae) with phylogenetic analysis. Mitochondrial DNA B 2019, 4, 1447–1449. [Google Scholar]
- Zhou, Y.; Liang, Z.Y.; Wang, S.Q.; Zhong, H.H.; Wang, N.; Liang, B. A mitogenomic phylogeny of satyrid butterflies and complete mitochondrial genome of Oeneis urda (Lepidoptera: Nymphalidae: Satyrinae). Mitochondrial DNA B 2020, 5, 1344–1345. [Google Scholar]
- Sun, Y.X.; Chen, C. , Geng, X.X.; Li, J. Complete mitochondrial genome of Lasiommata deidamia and its phylogenetic implication to subfamily Satyrinae (Lepidoptera: Nymphalidae). Mitochondrial DNA B 2021, 6, 2943–2945. [Google Scholar] [CrossRef]
- Bolger, A.M.; Lohse, M.; Usadel, B. Trimmomatic: A flexible trimmer for Illumina sequence data. Bioinformatics 2014, btu170. [Google Scholar]
- Meng, G.L.; Li, Y.Y.; Yang, C.T.; Liu, S.L. MitoZ: a toolkit for animal mitochondrial genome assembly, annotation and visualization. Nucleic Acids Res. 2019, 47, e63. [Google Scholar]
- Kurtz, S.; Phillippy, A.; Delcher, A.L.; Smoot, M.; Shumway, M.; Antonescu, C.; Salzberg, S.L. Versatile and open software for comparing large genomes. Genome Biol. 2004, 5, R12. [Google Scholar] [CrossRef]
- Bernt, M.; Donath, A.; Jühling, F.; Externbrink, F.; Florentz, C.; Fritzsch, G.; Pütz, J.; Middendorf, M.; Stadler, P.F. MITOS: Improvedde novo metazoan mitochondrial genome annotation. Mol. Phylogenet. Evol. 2013, 69, 313–319. [Google Scholar]
- Grant, J.R.; Enns, E.; Marinier, E.; Mandal, A.; Herman, E.K.; Chen, C.; Graham, M.; Van Domselaar, G.; Stothard, P. Proksee: in-depth characterization and visualization of bacterial genomes. Nucleic Acids Res. 2023, gkad326. [Google Scholar]
- Chan, P.P.; Lin, B.Y.; Mak, A.J.; Lowe, T.M. tRNAscan-SE 2.0: Improved detection and functional classification of transfer RNA genes. Nucleic Acids Res. 2021, 49, 9077–9096. [Google Scholar] [CrossRef]
- Benson, G. Tandem repeats finder: A program to analyze DNA sequences. Nucleic Acids Res. 1999, 27, 573–580. [Google Scholar] [CrossRef]
- Tamura, K.; Stecher, G.; Kumar, S. MEGA11: Molecular evolutionary genetics analysis version 11. Mol. Biol. Evol. 2021, 38, 3022–3027. [Google Scholar] [CrossRef]
- Zhang, D.; Gao, F.; Jakovlic´, I.; Zou, H.; Zhang, J.; Li, W.X.; Wang, G.T. PhyloSuite: an integrated and scalable desktop platformfor streamlined molecular sequence data management and evolutionary phylogenetics studies. Mol. Ecol. Resour. 2020, 20, 348–355. [Google Scholar] [CrossRef]
- Perna, N.T.; Kocher, T.D. Patterns of nucleotide composition at fourfold degenerate sites of animal mitochondrial genomes. J. Mol. Evol. 1995, 41, 353–358. [Google Scholar] [CrossRef]
- Julio, R.; Albert, F.M.; Juan, C.S.D.; Sara, G.R.; Pablo, L.; Sebastián, E.R.O.; Alejandro, S.G. DnaSP v6: DNA sequence polymor-phism analysis of large datasets. Mol. Biol. Evol. 2017, 34, 3299–3302. [Google Scholar]
- Peden, J.F. Analysis of codon usage. Univ Nottingham. 2000, 90, 73–74. [Google Scholar]
- Katoh, K.; Standley, D.M. MAFFT multiple sequence alignment software version 7: Improvements in performance and usability. Mol. Phylogenet. Evol. 2013, 30, 772–780. [Google Scholar] [CrossRef]
- Ranwez, V.; Douzery, E.J.P.; Cambon, C.; Chantret, N.; Delsuc, F. MACSE v2: Toolkit for the alignment of coding sequences accounting for frame shifts and stop codons. Mol. Biol. Evol. 2018, 35, 2582–2584. [Google Scholar] [CrossRef]
- Talavera, G.; Castresana, J. Improvement of phylogenies after removing divergent and ambiguously aligned blocks from protein sequence alignments. Syst. Biol. 2007, 56, 564–577. [Google Scholar] [CrossRef]
- Capella-Gutierrez, S.; Silla-Martinez, J.M.; Gabaldon, T. TrimAl: A tool for automated alignment trimming in large-scale phylogenetic analyses. Bioinformatics, 2009, 25, 1972–1973. [Google Scholar] [CrossRef]
- Lanfear, R.; Frandsen, P.B.; Wright, A.M.; Senfeld, T.; Calcott, B. PartitionFinder 2: New methods for selecting partitioned models of evolution for molecular and morphological phylogenetic analyses. Mol. Biol. Evol. 2017, 34, 772–773. [Google Scholar] [CrossRef]
- Ronquist, F.; Teslenko, M.; van der Mark, P.; Ayres, D.L.; Darling, A.; Höhna, S.; Larget, B.; Liu, L.; Suchard, M.A.; Huelsenbeck, J.P. MrBayes 3.2: Efficient Bayesian phylogenetic inference and model choice across a large model space. Syst. Biol. 2012, 61, 539–542. [Google Scholar] [CrossRef]
- Kalyaanamoorthy, S.; Minh, B.Q.; Wong, T.K.F.; von Haeseler, A.; Jermiin, L.S. ModelFinder: Fast model selection for accurate phylogenetic estimates. Nat. Methods 2017, 14, 587–589. [Google Scholar] [CrossRef]
- Nguyen, L.T.; Schmidt, H.A.; von Haeseler, A.; Minh, B.Q. IQ-TREE: A fast and effective stochastic algorithm for estimating maximum-likelihood phylogenies. Mol. Biol. Evol. 2015, 32, 268–274. [Google Scholar] [CrossRef]
- Minh, B.Q.; Nguyen, M.A.; von Haeseler, A. Ultrafast approximation for phylogenetic bootstrap. Mol. Biol. Evol. 2013, 30, 1188–1195. [Google Scholar]
- Rambaut, FigTree (Version 1.4.4). Available online: http://tree.bio.ed.ac.uk/software/figtree/ (accessed on 28 December 2024).
- Shi, Q.H.; Zhang, W.; Hao, J.S. The complete mitochondrial genome of Callerebia suroia (Lepidoptera: Nymphalidae: Satyrinae). Mitochondrial DNA Part A DNA Mapp. Seq. Anal. 2016, 27, 1463–1465. [Google Scholar] [CrossRef]
- Kim, M.J.; Wan, X.L.; Kim, K.G.; Hwang, J.S.; Kim, I. Complete nucleotide sequence and organization of the mitogenome of endangered Eumenis autonoe (Lepidoptera: Nymphalidae). Afr. J. Biotechnol. 2010, 9, 735–754. [Google Scholar]
- Teixeira da Costa, L.F. The complete mitochondrial genome of Parage aegeria (Insecta: Lepidoptera: Papilionidae). Mitochondrial DNA Part A DNA Mapp. Seq. Anal. 2016, 27, 551–552. [Google Scholar]
- Liu, G.C.; Chang, Z.; Chen, L.; He, J.W.; Dong, Z.W.; Yang, J.; Lu, S.H.; Zhao, R.P.; Wan, W.T.; Ma, G.L.; et al. Genome size variation in butterflies (Insecta, Lepidoptera, Papilionoidea): a thorough phylogenetic comparison. Syst. Entomol. 2020, 45, 571–582. [Google Scholar]
- Tang, M.; Tan, M.H.; Meng, G.L.; Yang, S.Z.; Su, X.; Liu, S.L.; Song, W.H.; Li, Y.Y.; Wu, Q.; Zhang, A.B.; et al. Multiplex sequencing of pooled mitochondrial genomes—a crucial step toward biodiversity analysis using mito-metagenomics. Nucleic Acids Res. 2014, 42, e166. [Google Scholar]
- Wu, Y.P.; Lu, J.J.; Yang, J.; Wang, J.P.; Cao, T.W.; Fan, R.J. Complete mitochondrial genome of Mycalesis intermedia (Lepidoptera: Nymphalidae). Mitochondrial DNA B 2020, 5, 703–704. [Google Scholar]
- Huang, D.Y.; Hao, J.S.; Zhang, W.; Su, T. J.; Wang, Y.; Xu, X. F. The complete mitochondrial genome of Melanargia asiatica (Lepidoptera: Nymphalidae: Satyrinae). Mitochondrial DNA Part A DNA Mapp. Seq. Anal. 2016, 27, 806–808. [Google Scholar]
- Lohse, K.; Weir, J. The genome sequence of the meadow brown, Maniola jurtina (Linnaeus, 1758). Wellcome Open Res. 2021, 6, 296. [Google Scholar]
- Nagata, N.; Tsujimura, I.; Sato, A. The complete mitochondrial genomes of two Japanese endemic Satyrinae butterflies, Neope goschkevitschii and Lethe sicelis (Lepidoptera, Nymphalidae). Mitochondrial DNA B 2020, 5, 2243–2245. [Google Scholar] [CrossRef]
- Fan, C.; Xu, C.; Li, J.L.; Lei, Y.; Gao, Y.; Xu, C.R.; Wang, R.J. Complete mitochondrial genome of a satyrid butterfly, Ninguta schrenkii (Lepidoptera: Nymphalidae). Mitochondrial DNA Part A DNA Mapp. Seq. Anal. 2016, 27, 80–81. [Google Scholar]
- Li, J.L.; Xu, C.; Lei, Y.; Fan, C.; Gao, Y.; Xu, C.R.; Wang, R.J. Complete mitochondrial genome of a satyrid butterfly, Lethe albolineata (Lepidoptera: Nymphalidae). Mitochondrial DNA Part A DNA Mapp. Seq. Anal. 2016, 27, 4195–4196. [Google Scholar]
- Zhou, L.; Yang, C.; Zhai, Q.; Zhang, Y.L. The complete mitochondrial genome sequence of Coenonympha amaryllis and monophyly of Satyrinae (Lepidoptera: Nymphalidae). Mitochondrial DNA B 2020, 5, 1223–1224. [Google Scholar]
- Zhang, W.; Gan, S.S.; Zuo, N.; Chen, C.H.; Wang, Y.; Hao, J.S. The complete mitochondrial genome of Triphysa phryne (Lepidoptera: Nymphalidae: Satyrinae). Mitochondrial DNA Part A DNA Mapp. Seq. Anal. 2016, 27, 474–475. [Google Scholar]
- Lohse, O.; Lohse, K. The genome sequence of the scotch argus butterfly, Erebia aethiops (Esper, 1777). Wellcome Open Res. 2022, 7, 217. [Google Scholar]
- Shi, Q.H.; Zhao, F.; Hao, J.S.; Yang, Q. Complete mitochondrial genome of the Common Evening Brown, Melanitis leda Linnaeus (Lepidoptera: Nymphalidae: Satyrinae). Mitochondrial DNA, 2013, 24, 492–494. [Google Scholar]
- Wei, S.J.; Shi, M.; Chen, X.X.; Sharkey, M.J.; van Achterberg, C.; Ye, G.Y.; He, J.H. New views on strand asymmetry in insect mitochondrial genomes. PLoS One 2010, 5, e12708. [Google Scholar]
- Ojala, D.; Montoya, J.; Attardi, G. tRNA punctuation model of RNA processing in human mitochondria. Nature 1981, 290, 470–474. [Google Scholar]
- Lu, H.F.; Su, T.J.; Luo, A.R.; Zhu, C.D.; Wu, C.S. Characterization of the complete mitochondrion genome of Diurnal moth Amata emma (Butler) (Lepidoptera: Erebidae) its phylogenetic implications. PLoS ONE 2013, 8, e72410. [Google Scholar]
- Hershberg, R.; Petrov, D.A. Selection on codon bias. Annu. Rev. Genet. 2008, 42, 287–299. [Google Scholar] [PubMed]
- Plotkin, J.B.; Kudla, G. Synonymous but not the same: The causes consequences of codon bias. Nat. Rev. Genet. 2011, 12, 32–42. [Google Scholar]
- Wright, D. The ‘effective number of codons’ used in a gene. Gene 1990, 87, 23–29. [Google Scholar]
- Salvato, P.; Simonato, M.; Battisti, A.; Negrisolo, E. The complete mitochondrial genome of the bag-shelter moth Ochrogaster lunifer (Lepidoptera, Notodontidae). BMC Genomics 2008, 9, 331. [Google Scholar]
- Chen, S.; Li, F.H.; Lan, X.E.; You, P. The complete mitochondrial genome of Pycnarmon lactiferalis (Lepidoptera: Crambidae). Mitochondrial DNA B 2016, 1, 638–639. [Google Scholar]
- Chen, Z.T.; Du, Y.Z. The first two mitochondrial genomes from Taeniopterygidae (Insecta: Plecoptera): structural features and phylogenetic implications. Int. J. Biol. Macromol. 2017, 111, 70–76. [Google Scholar]
- Yang, M.S.; Song, L.; Shi, Y.X.; Li, J.H.; Zhang, Y.L.; Song, N. The first mitochondrial genome of the family Epicopeiidae and higher-level phylogeny of Macroheterocera (Lepidoptera: Ditrysia). Int. J. Biol. Macromol. 2019, 136, 123–132. [Google Scholar]
- Vila, M.; Björklund, M. The utility of the neglected mitochondrial control region for evolutionary studies in Lepidoptera (Insecta). J. Mol. Evol. 2004, 58, 280–290. [Google Scholar] [CrossRef]
- Jia, W.Z.; Yan, H.B.; Guo, A.J.; Zhu, X.Q.; Wang, Y.C.; Shi, W.G.; Chen, H.T.; Zhan, F.; Zhang, S.H.; Fu, B.Q.; Littlewood, D.T.J.; Cai, X.P. Complete mitochondrial genomes of Taenia multiceps, T. hydatigena and T. pisiformis: Additional molecular markers for a tapeworm genus of human and animal health significance. BMC Genomics, 2010, 11, 447. [Google Scholar]
- Ma, L.Y.; Liu, F.F.; Chiba, H.; Yuan, X.Q. The mitochondrial genomes of three skippers: insights into the evolution of the family Hesperiidae (lepidoptera). Genomics 2020, 112, 432–441. [Google Scholar]
- Yan, Z.T.; Tang, X.Y.; Yang, D.; Fan, Z.H.; Luo, S.T.; Chen, B. Phylogenetic and comparative genomics study of Papilionidae based on mitochondrial genomes. Genes 2024, 15, 964. [Google Scholar] [CrossRef] [PubMed]
- Liu, N.; Fang, L.; Zhang, Y. The complete mitochondrial genomes of four species in the subfamily Limenitidinae (Lepidoptera, Nymphalidae) and a phylogenetic analysis. Insects 2022, 13, 16. [Google Scholar]
- Meiklejohn, C.D.; Montooth, K.L.; Rand, D.M. Positive and negative selection on the mitochondrial genome. Trends Genet. 2007, 23, 259–263. [Google Scholar] [PubMed]
- Sun, Y.X.; Chen, C.; Geng, X.X.; Li, J. Complete mitochondrial genome of Lasiommata deidamia and its phylogenetic implication to subfamily Satyrinae (Lepidoptera: Nymphalidae). Mitochondrial DNA B 2021, 6, 2943–2945. [Google Scholar]
Figure 1.
Gene maps for the Discophora sondaica and Aemona amathusia mitochondrial genomes. Protein-coding, ribosomal RNA genes, and transfer RNA genes are showed with standard abbreviations, and are marked in green, yellow, and purple, respectively. Arrows indicate the orientation of gene transcription. Pictures of the D. sondaica and A. amathusia are hand-drawn by Xinyue Wang.
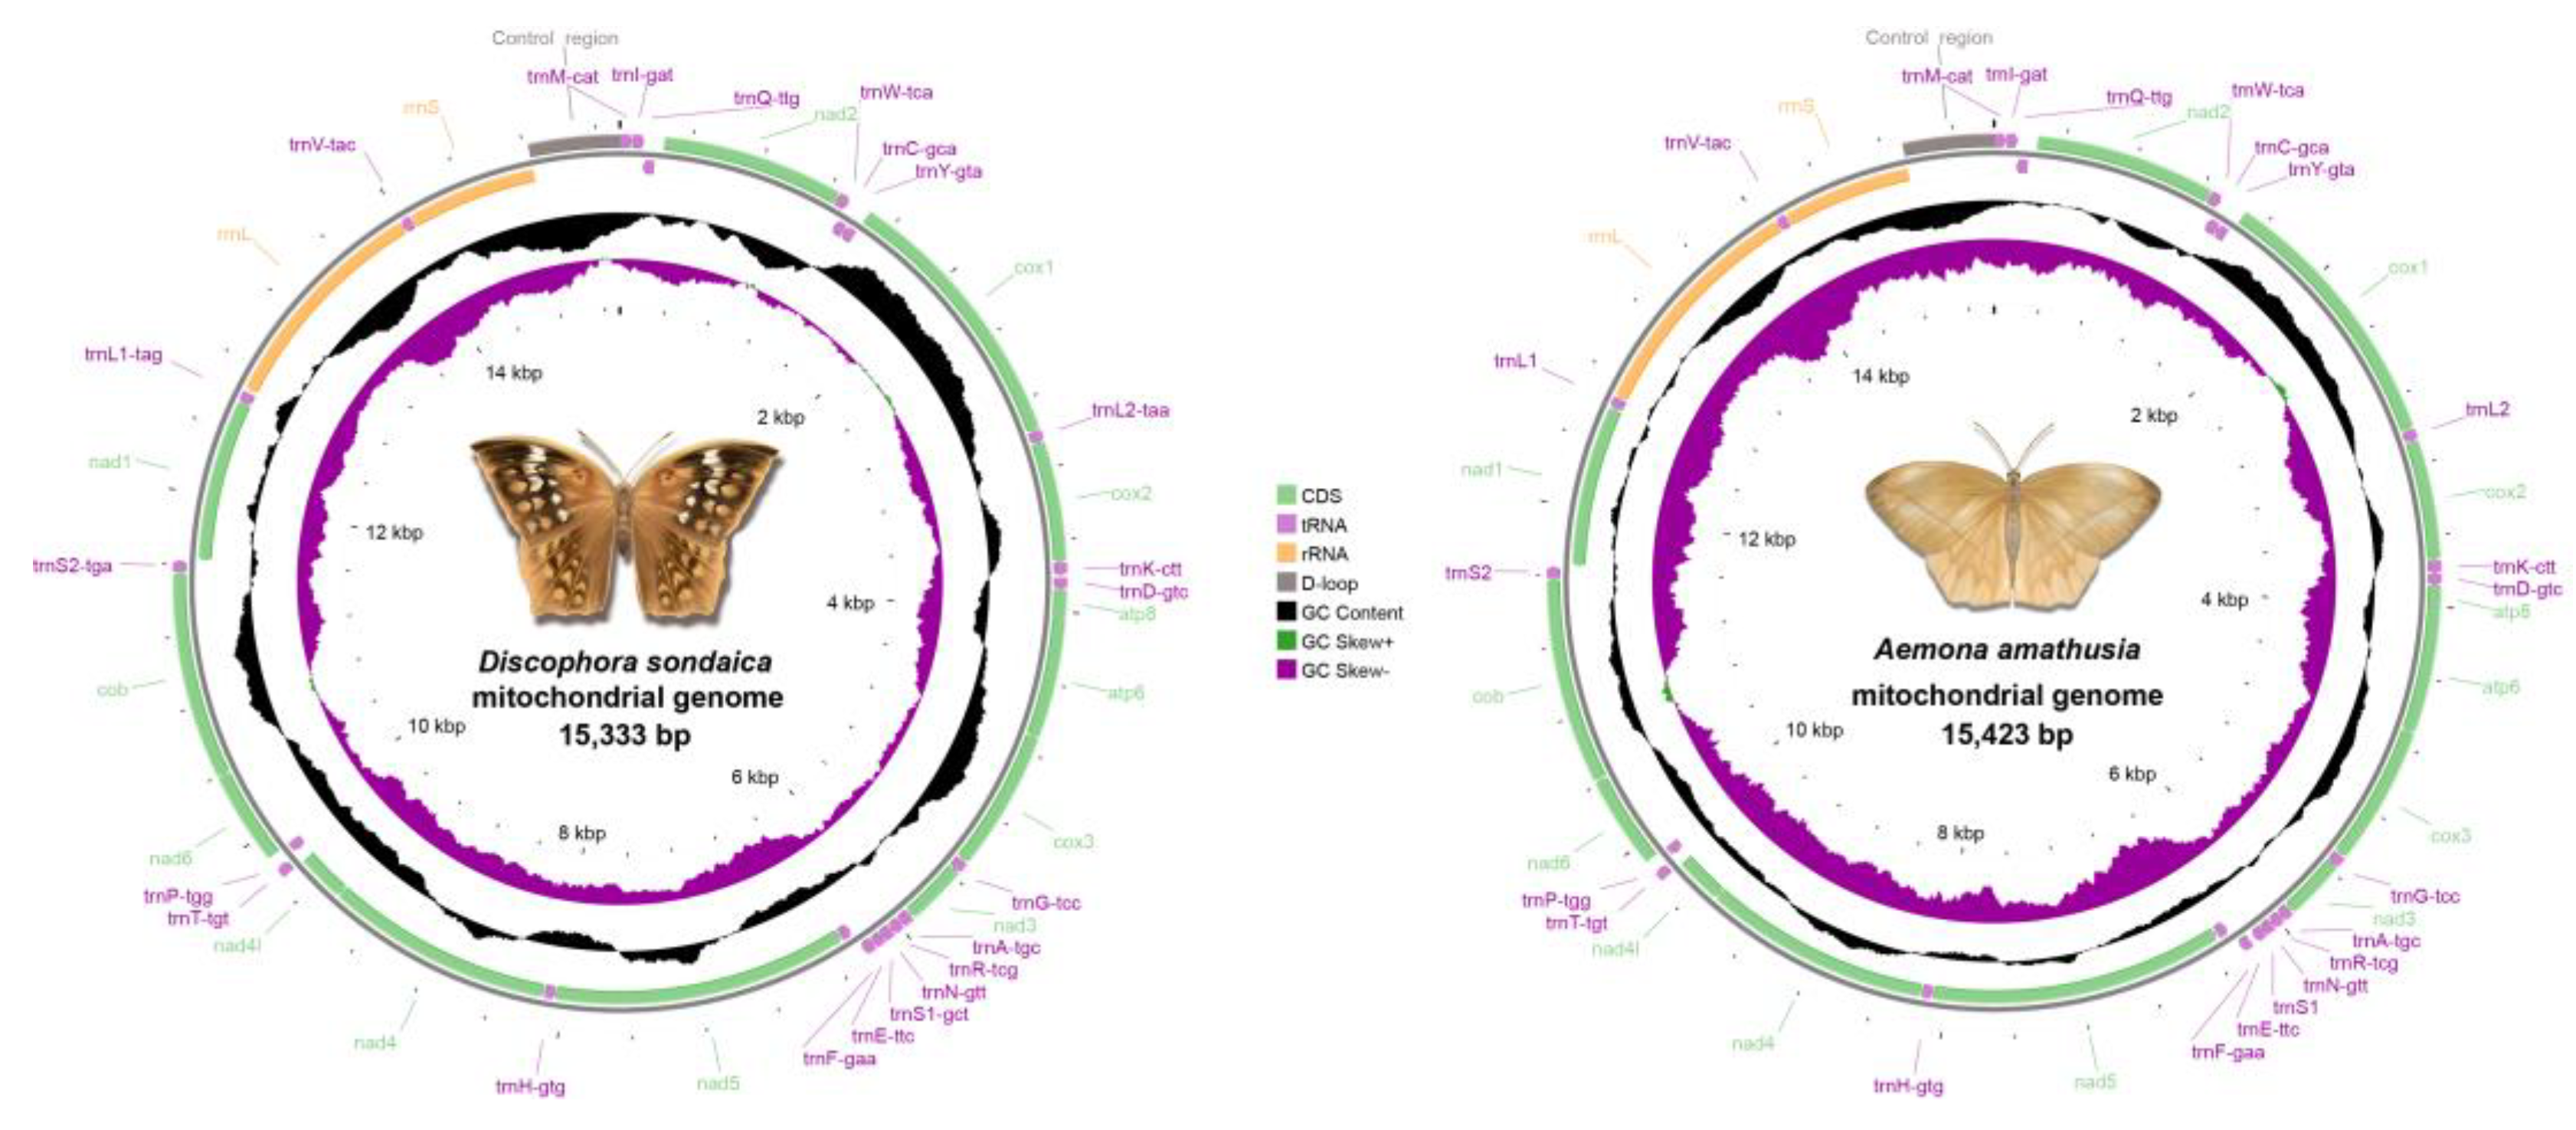
Figure 2.
Nucleotide compositions of the satyrid mitochondrial genomes. (a) A + T content of whole genome, protein-coding genes (PCGs), first codon position of the PCGs (P_1st), second codon position of the PCGs (P_2nd), third codon position of the PCGs (P_3rd), ribosomal RNA genes (rRNAs), transfer RNA genes (tRNAs), and control region; (b) AT and GC skew of whole genome. Species with mitochondrial genomes sequenced in this study are marked in red.
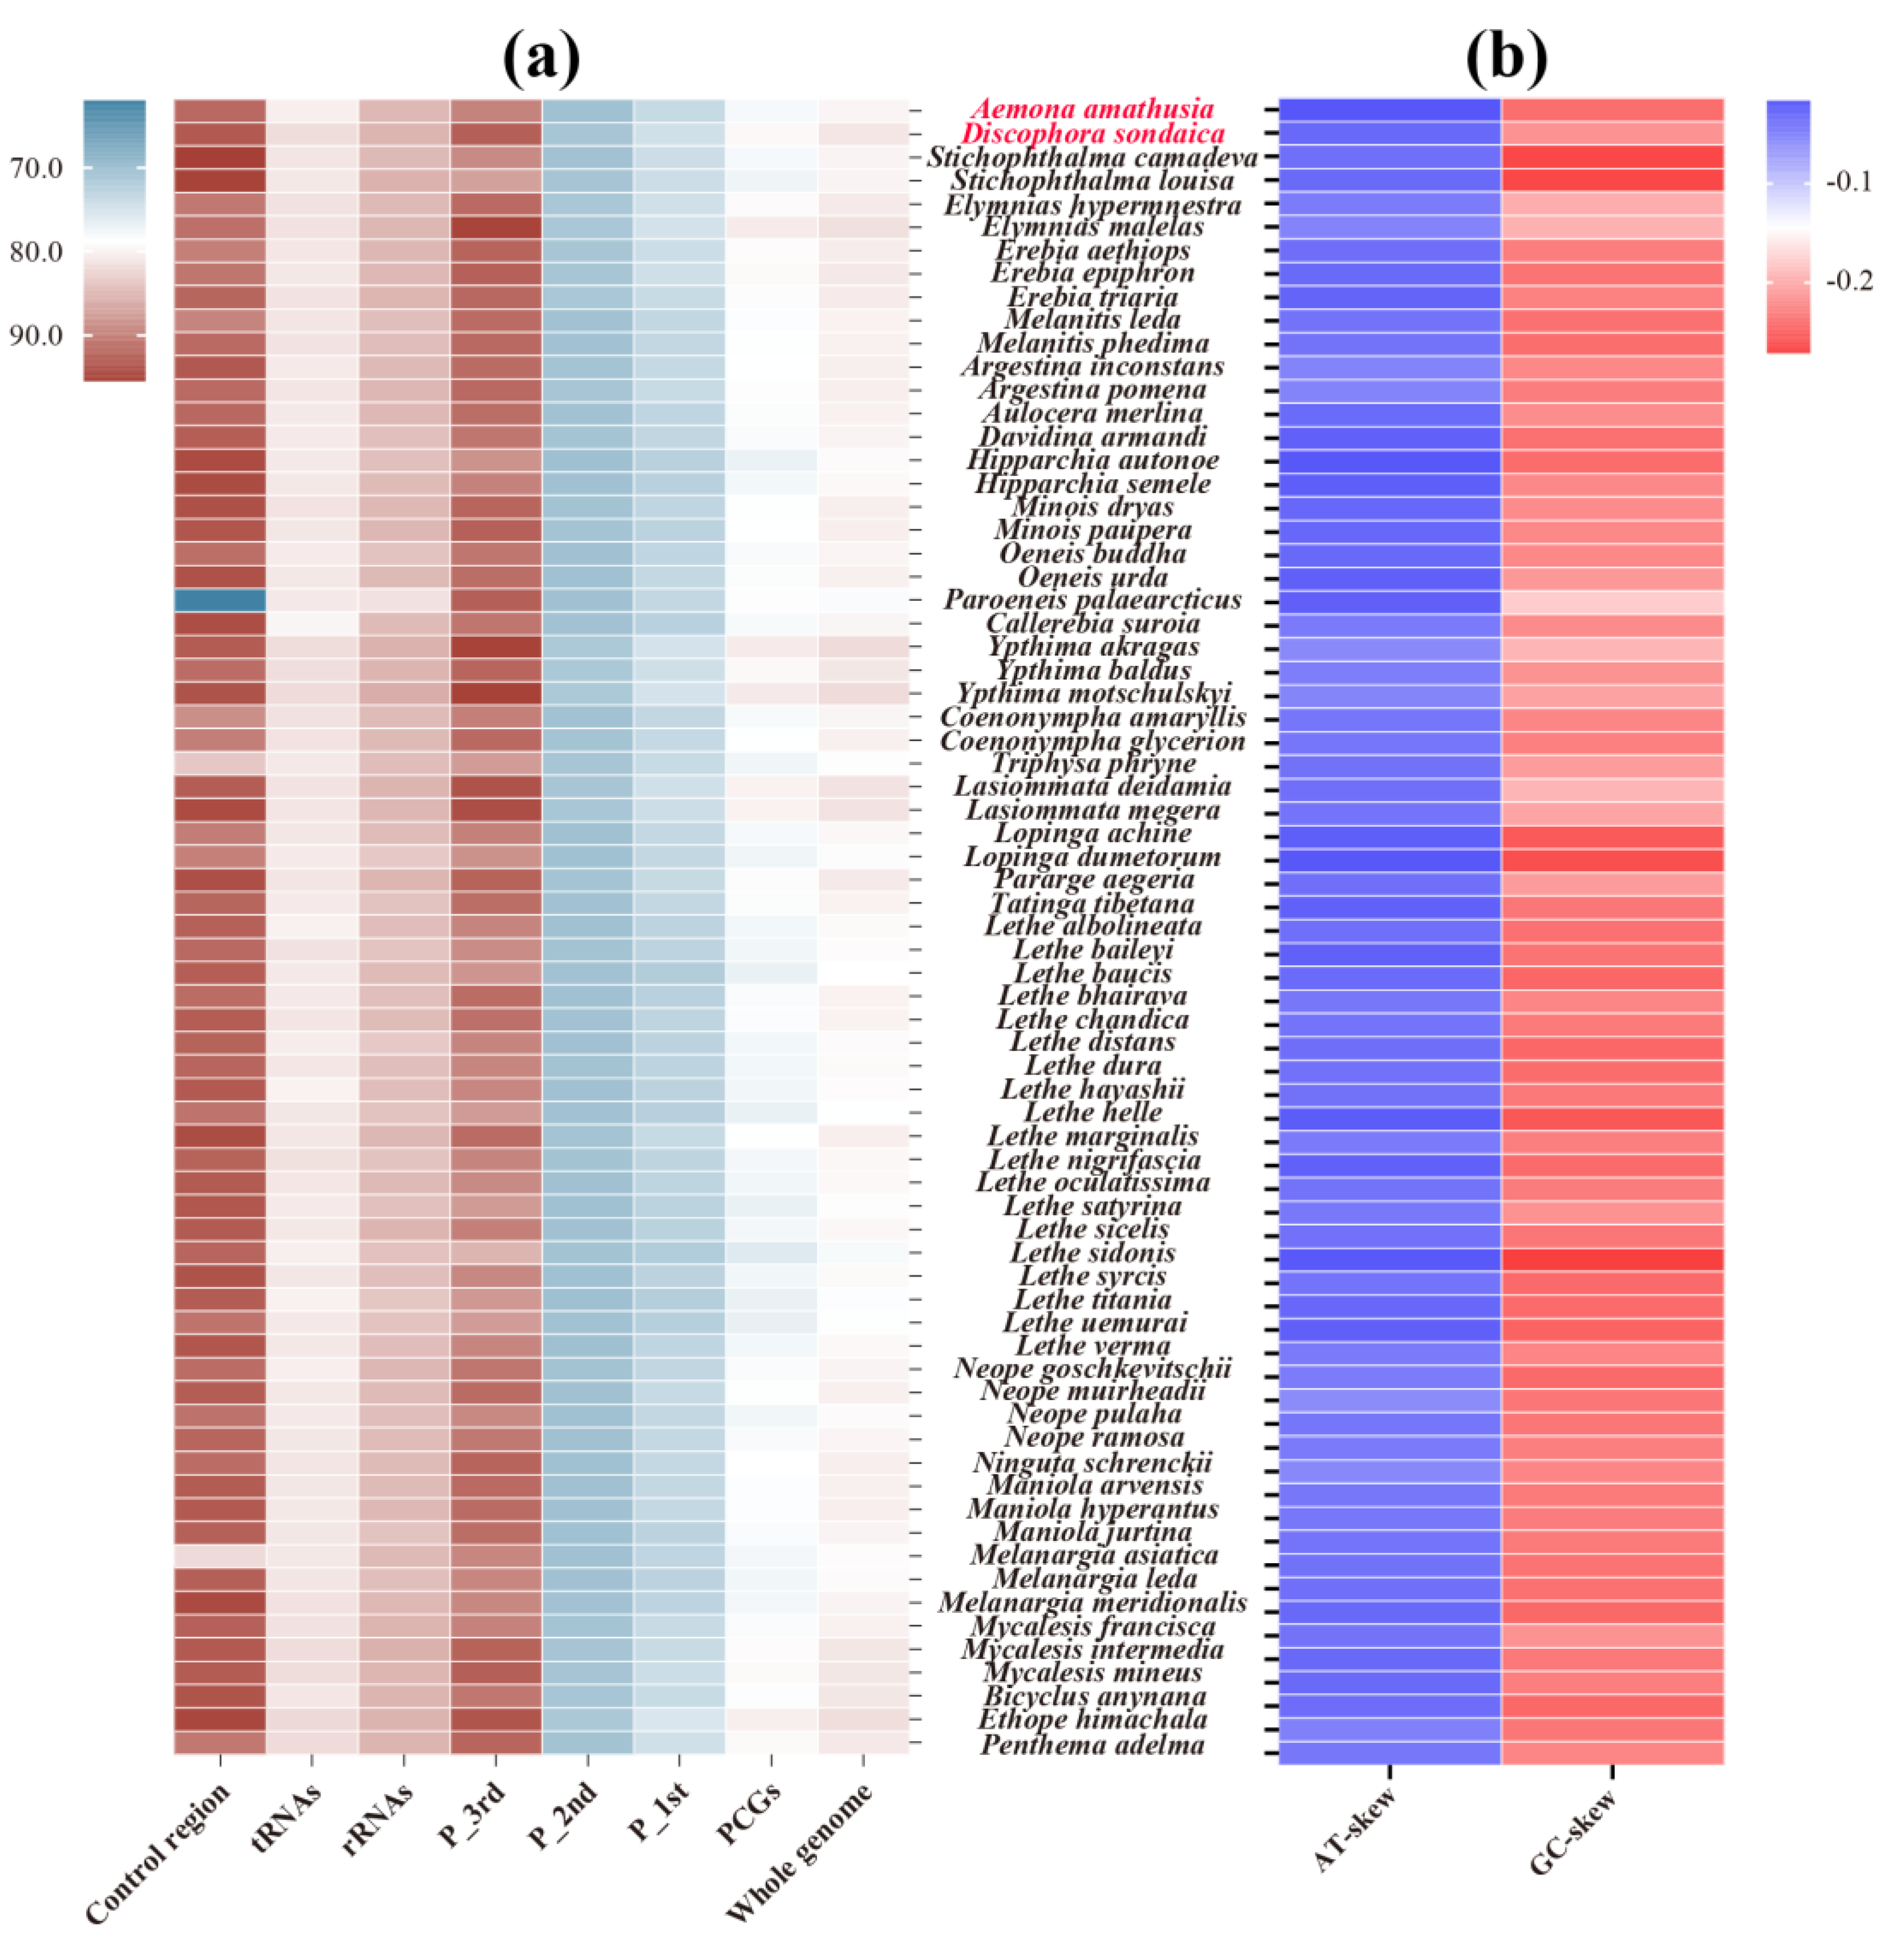
Figure 3.
Comparison of codon usage of the 71 selected Satyrinae mitochondrial genomes. (a) Composition of amino acids; (b) Relative synonymous codon usage (RSCU). Species with mitochondrial genomes sequenced in this study are marked in red. Codon families were provided on the x-axis.
Figure 3.
Comparison of codon usage of the 71 selected Satyrinae mitochondrial genomes. (a) Composition of amino acids; (b) Relative synonymous codon usage (RSCU). Species with mitochondrial genomes sequenced in this study are marked in red. Codon families were provided on the x-axis.
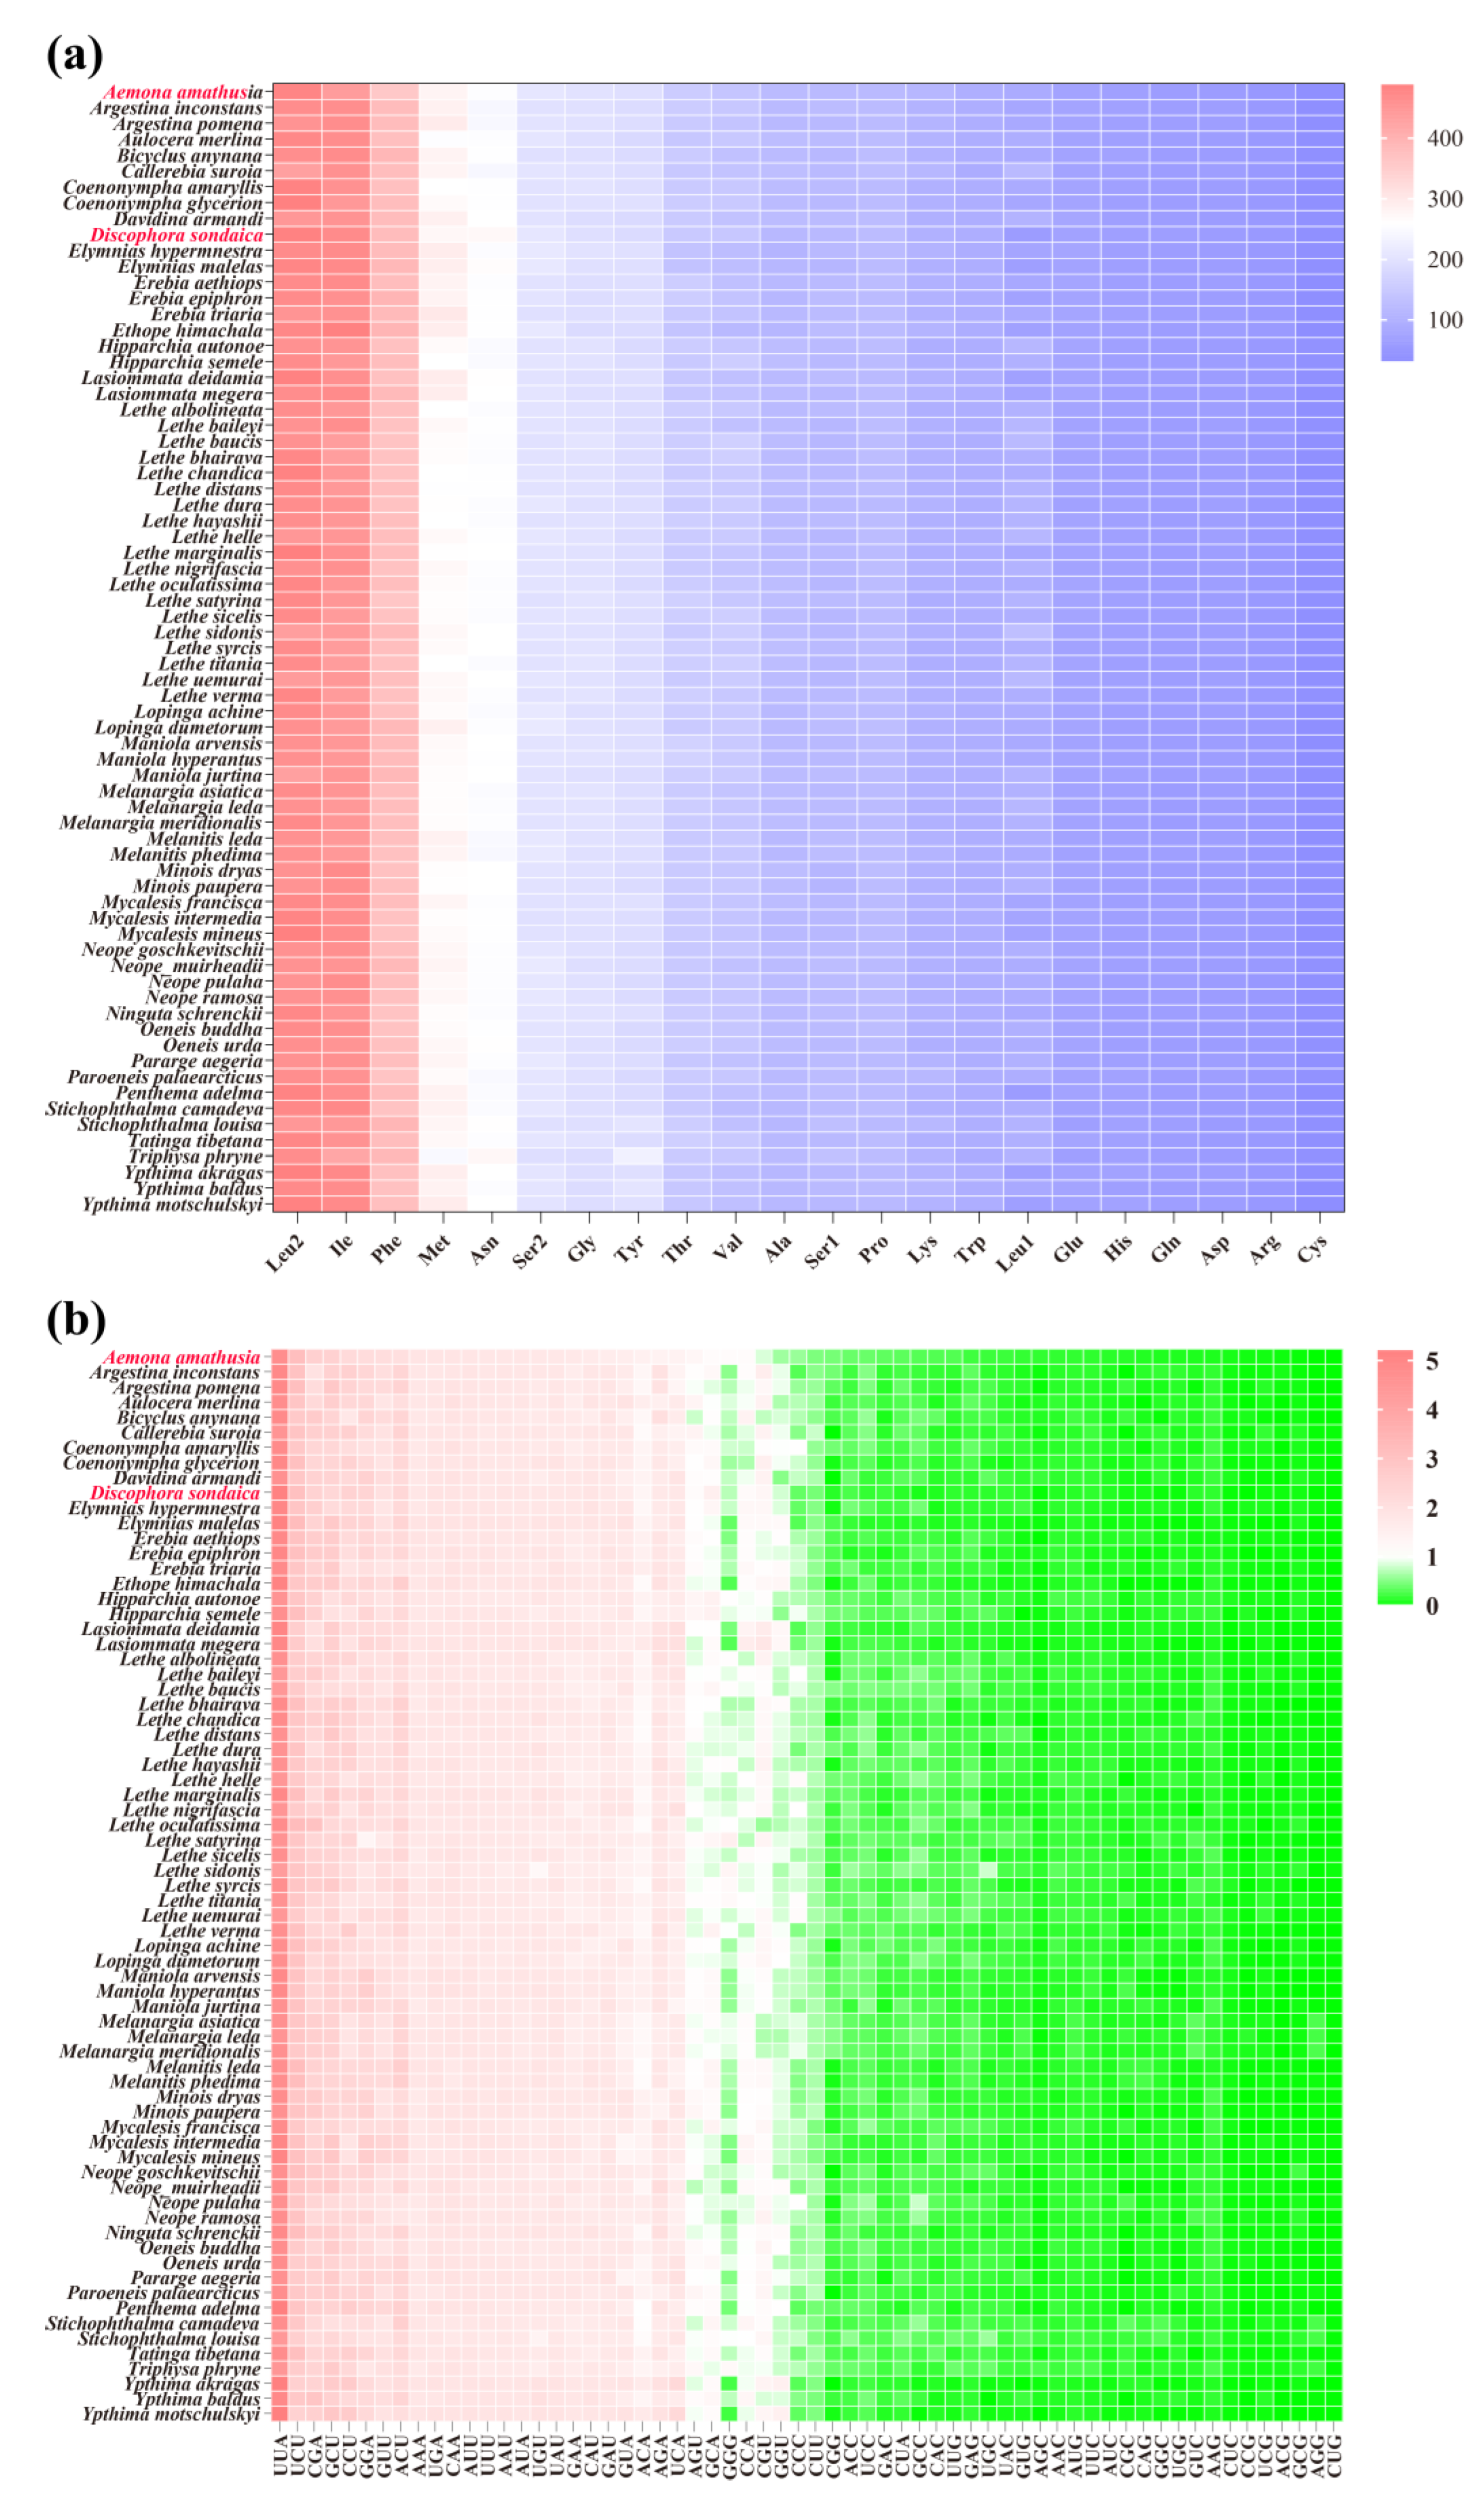
Figure 4.
The effective number of codons (ENC) of Satyrinae mitochondrial genomes. (a) The ENC of 71 selected Satyrinae species; (b) The average ENC of five satyrid tribes. Species with mitochondrial genomes sequenced in this study are marked in red.
Figure 4.
The effective number of codons (ENC) of Satyrinae mitochondrial genomes. (a) The ENC of 71 selected Satyrinae species; (b) The average ENC of five satyrid tribes. Species with mitochondrial genomes sequenced in this study are marked in red.
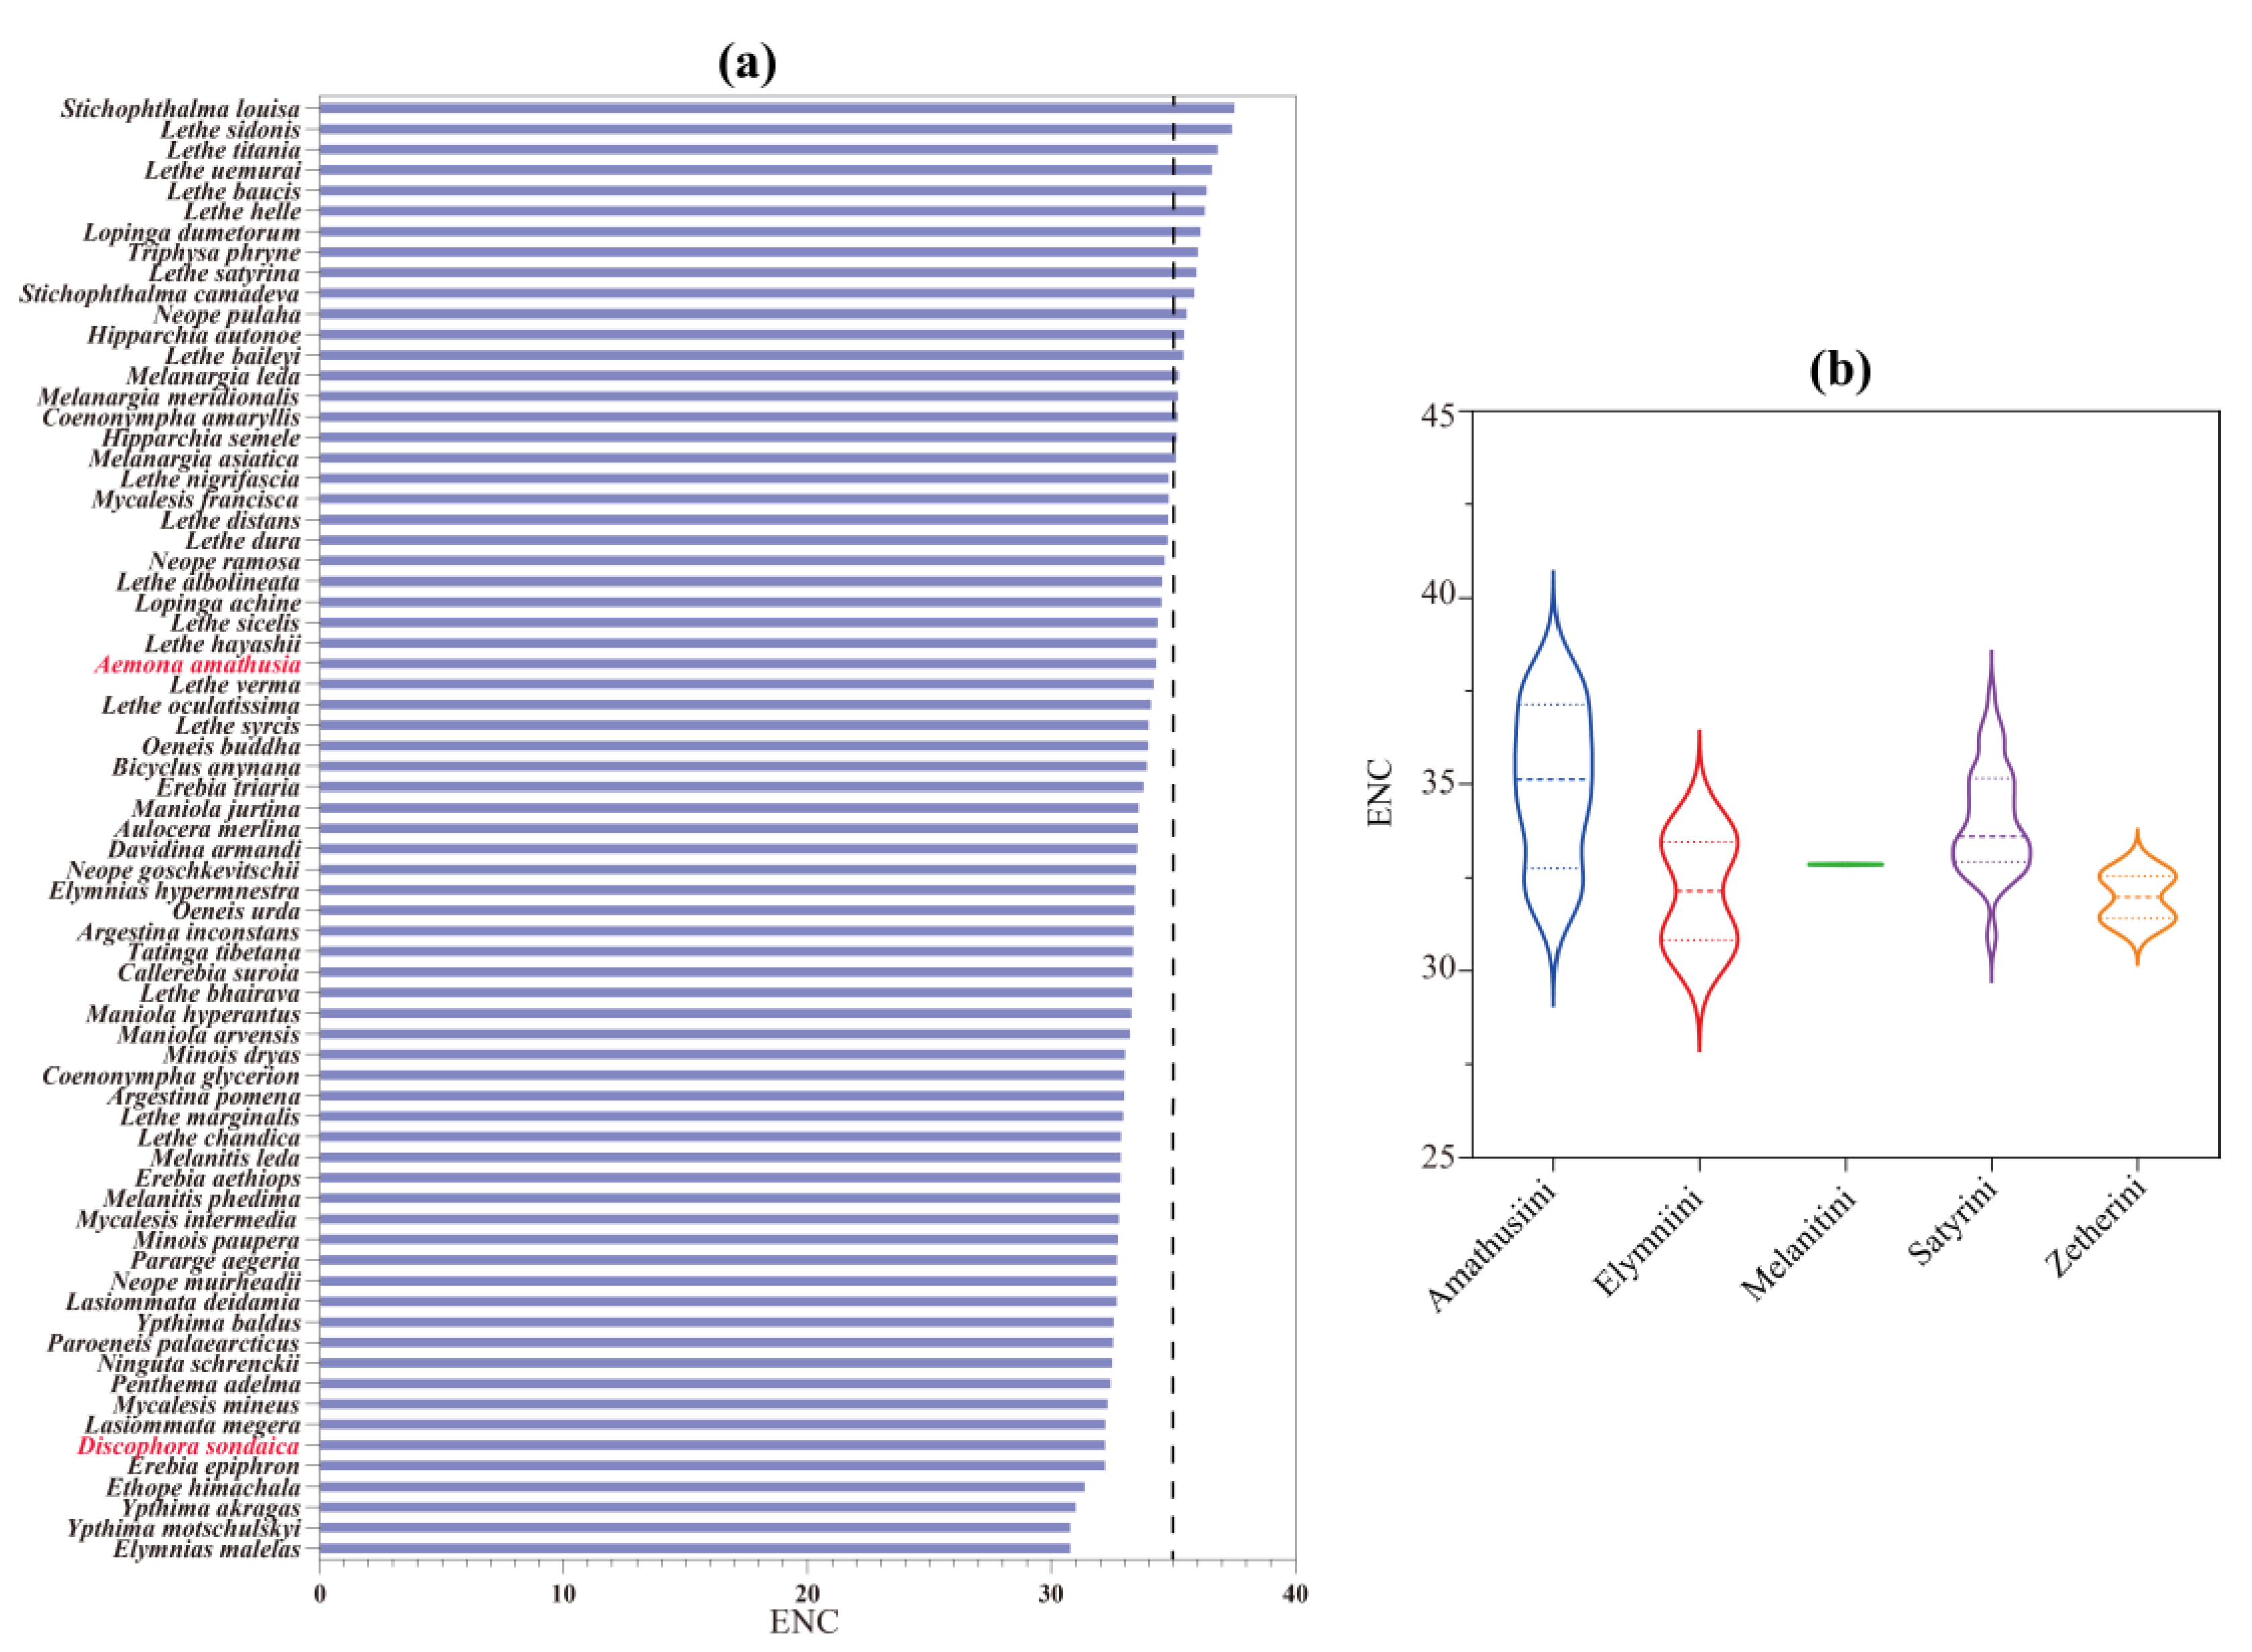
Figure 5.
Gene variation of 13 PCGs based on 71 satyrid species. (a) The sliding window analysis shows the value of nucleotide diversity; (b) The Ka, Ks, and Ka/Ks of each PCG among Satyrinae representatives. Ka, the number of nonsynonymous substitutions per nonsynonymous site; Ks, the number of synonymous substitutions per synonymous site.
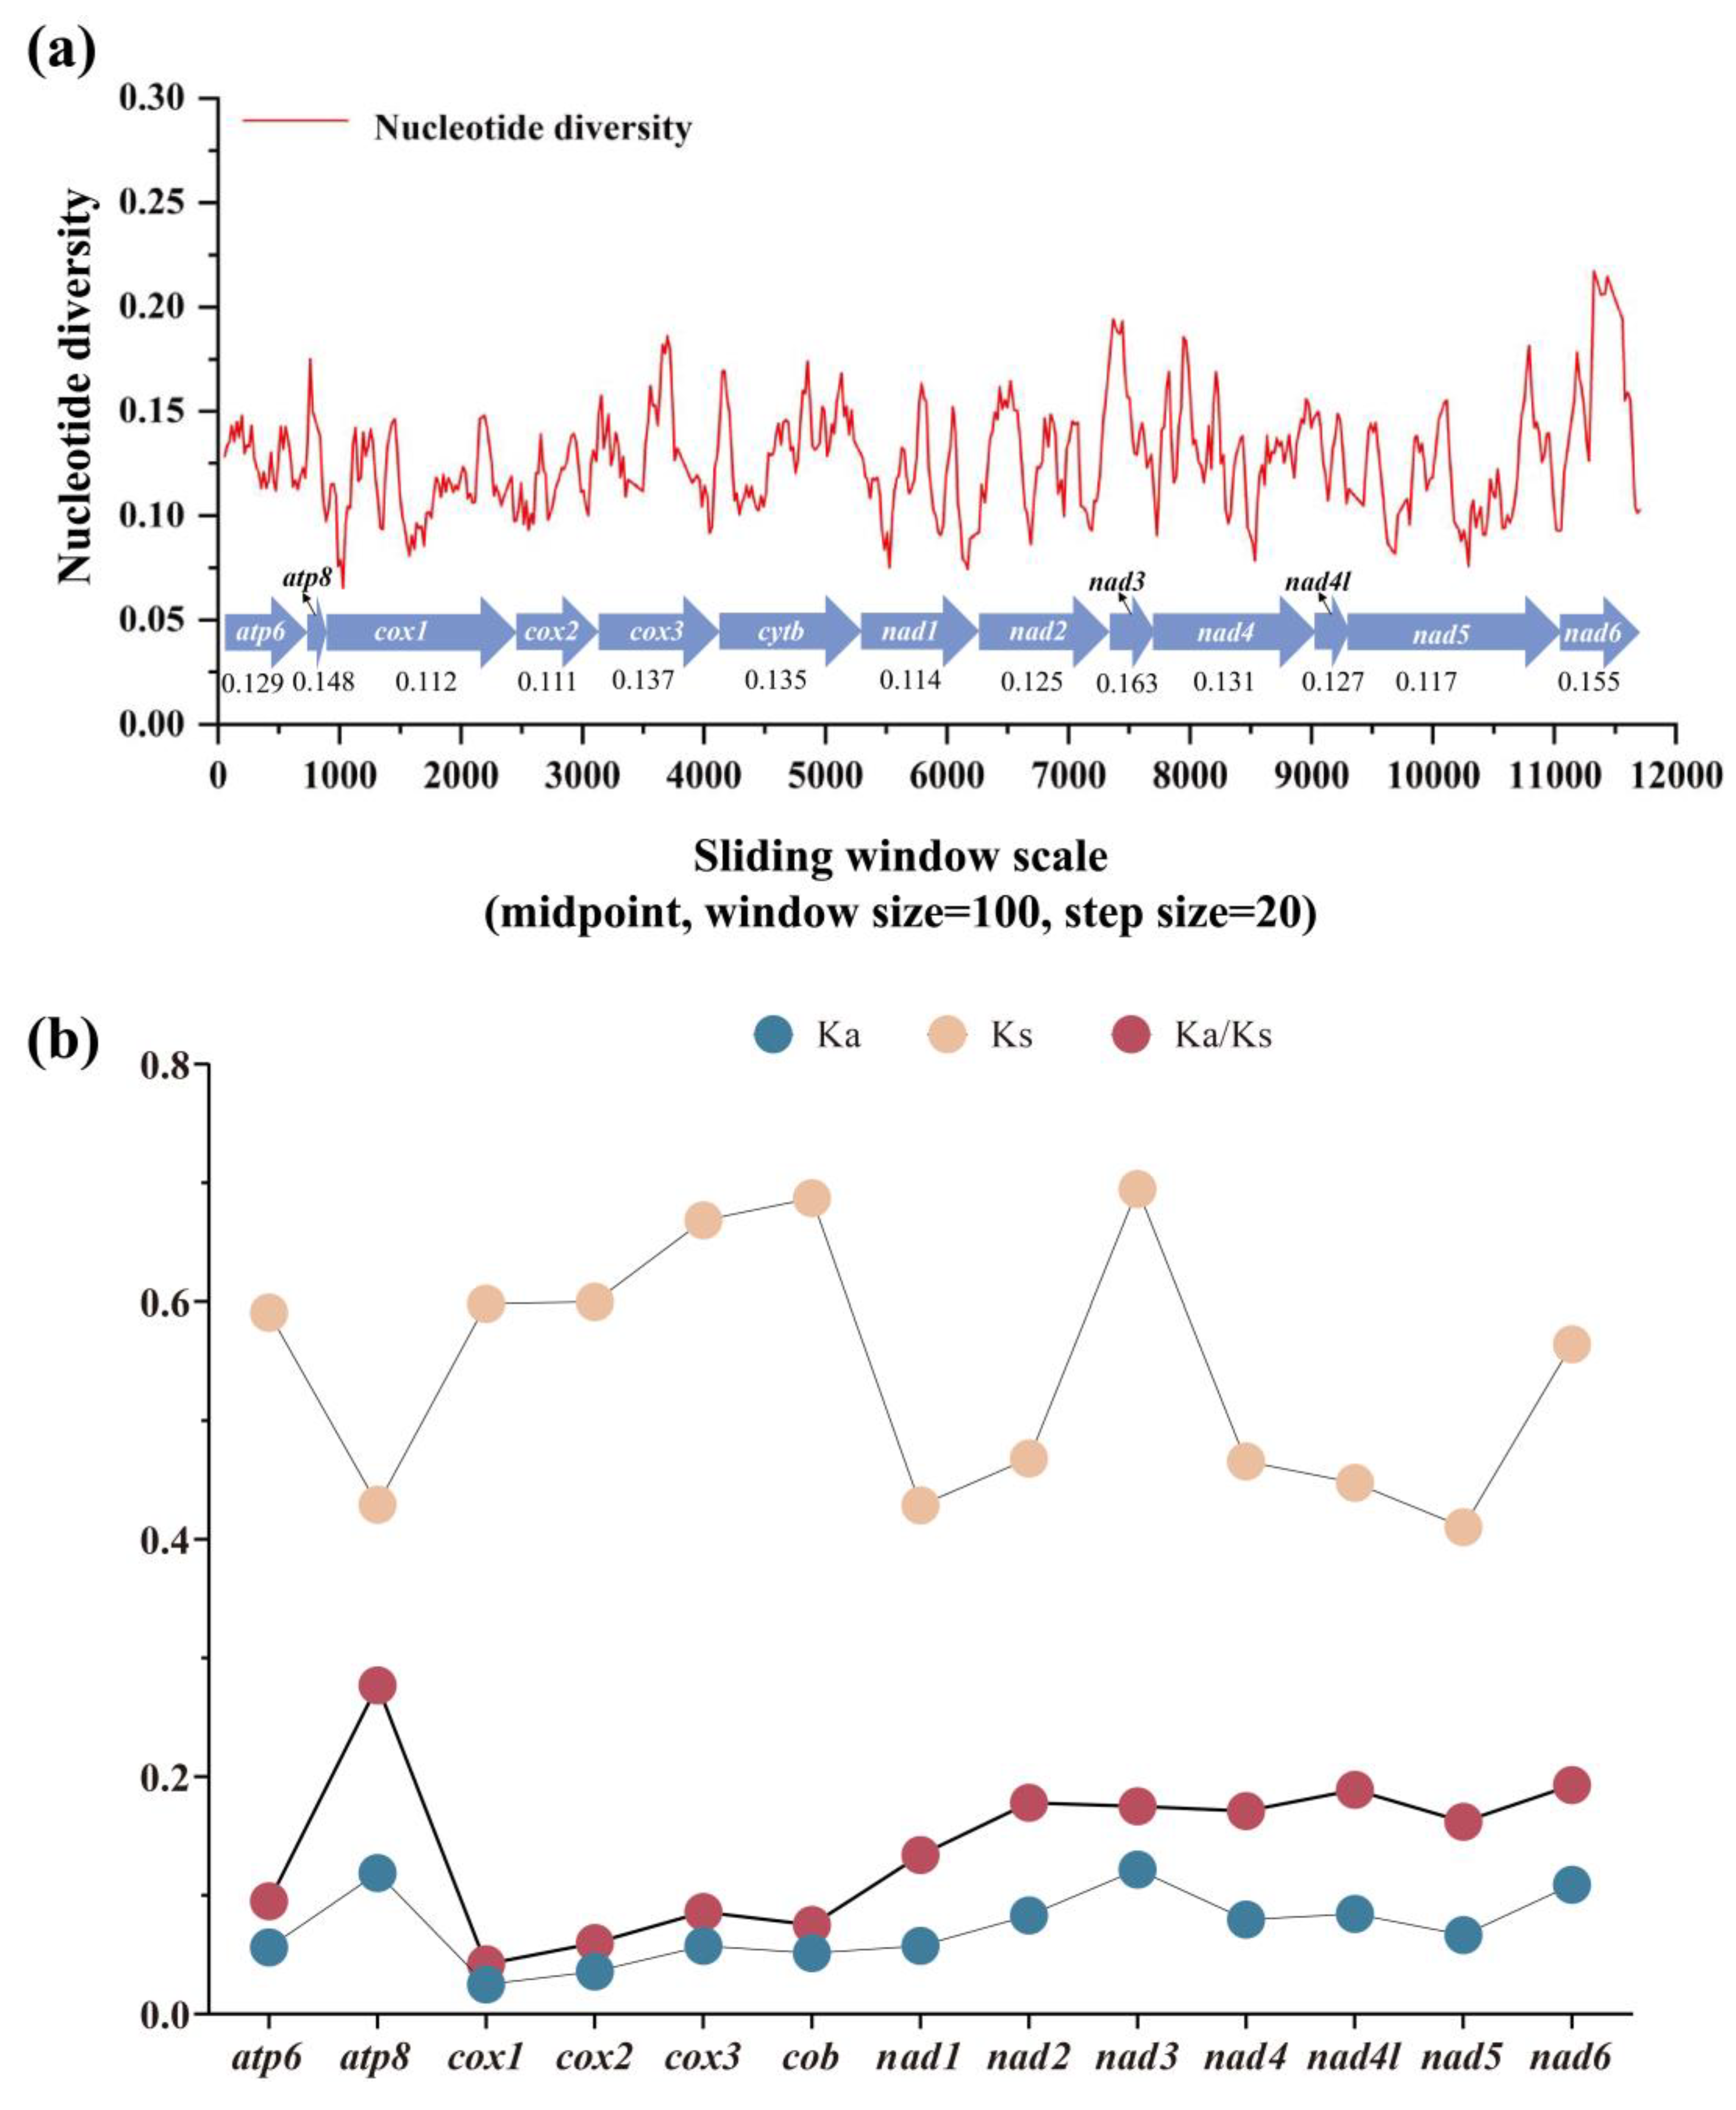
Figure 6.
Phylogenetic trees inferred from maximum likelihood (a) and Bayesian inference (b) method based on the dataset (13 PCGs + 2 tRNAs + 22 tRNAs). Numbers on a node represent the bootstrap support and posterior probability. The species with mitogenomes sequenced in this study are marked in bold. The satyrid butterfly pictures on the middle are hand-drawn by Xinyue Wang.
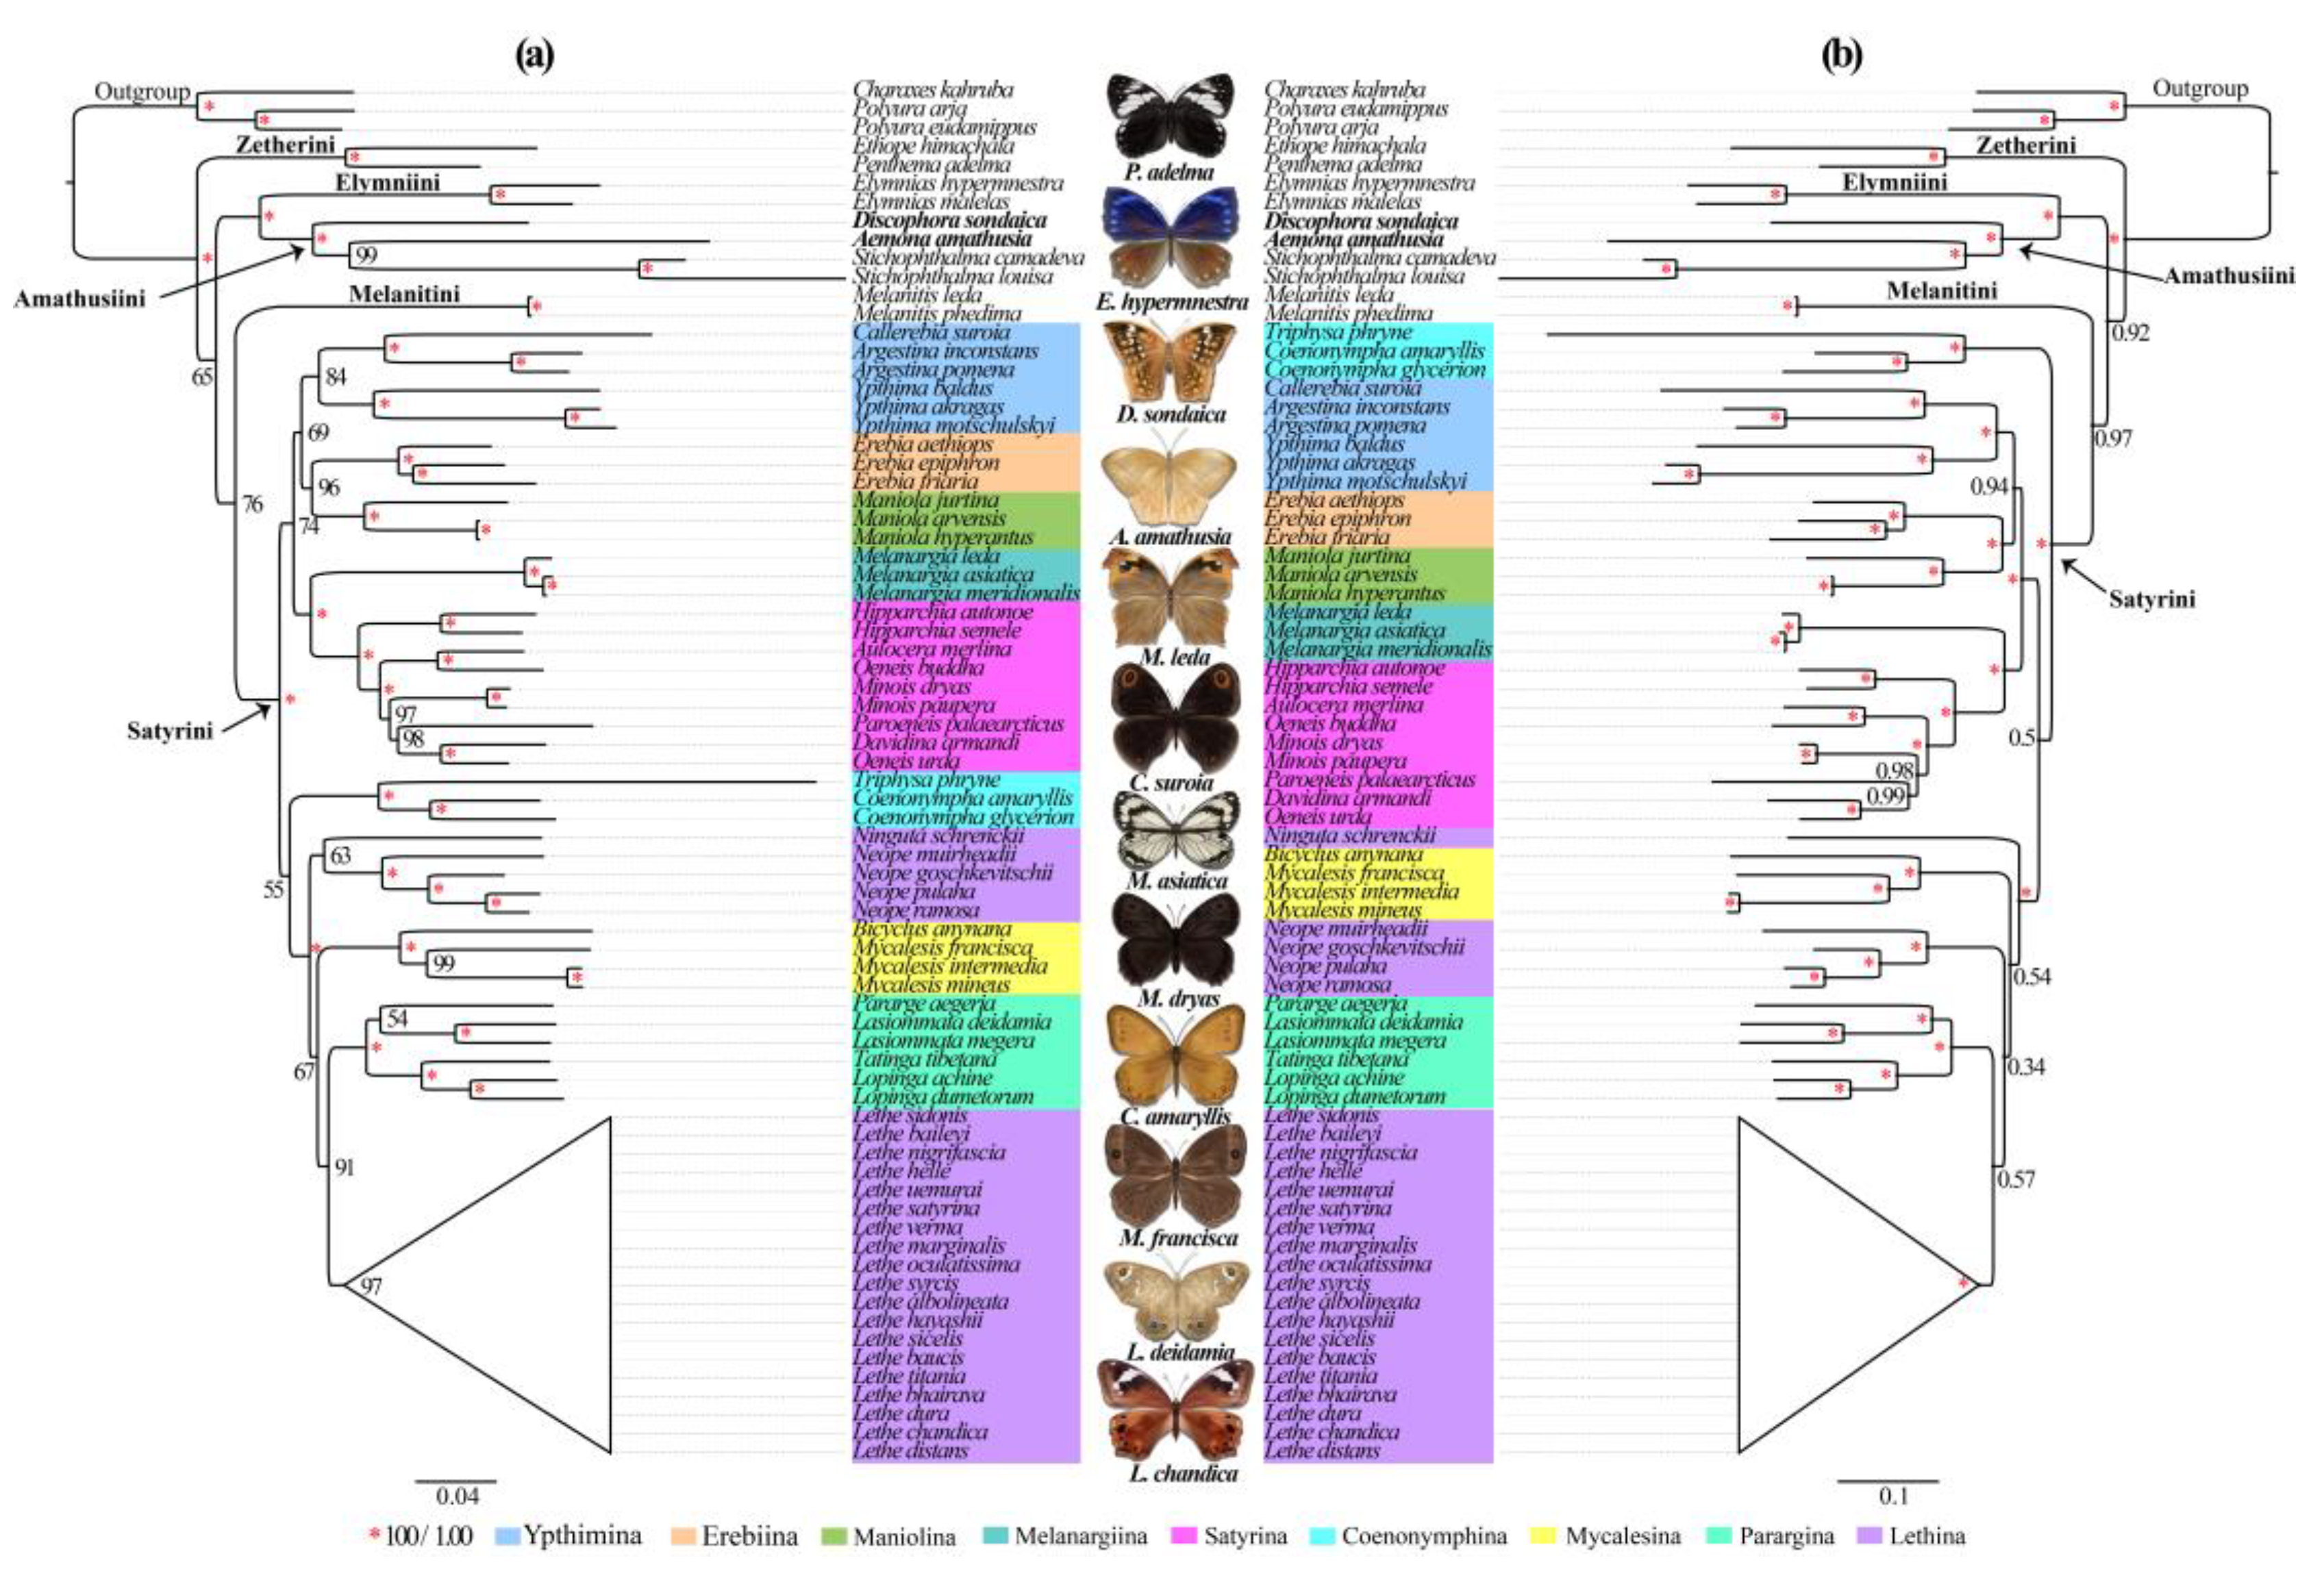

Table 1.
The mitogenomic organization of Discophora sondaica (DS) and Aemona amathusia (AA).
| Gene | Coding strand | Position | Size (bp) | IGN | Start codon | Stop codon | |||||
| DS | AA | DS | AA | DS | AA | DS | AA | DS | AA | ||
| trnM | J | 1-69 | 1-66 | 69 | 66 | 0 | 0 | ||||
| trnI | J | 70-136 | 69-133 | 67 | 65 | 0 | 2 | ||||
| trnQ | N | 134-201 | 131-199 | 68 | 69 | -3 | -3 | ||||
| nad2 | J | 248-1261 | 245-1258 | 1014 | 1014 | 46 | 45 | ATT | ATC | TAA | TAA |
| trnW | J | 1260-1327 | 1257-1323 | 68 | 67 | -2 | -2 | ||||
| trnC | N | 1320-1383 | 1316-1383 | 64 | 68 | -8 | -8 | ||||
| trnY | N | 1384-1450 | 1384-1449 | 67 | 66 | 0 | 0 | ||||
| cox1 | J | 1453-2983 | 1471-3001 | 1531 | 1531 | 2 | 21 | CGA | CGA | T | T |
| trnL2 | J | 2984-3051 | 3002-3068 | 68 | 67 | 0 | 0 | ||||
| cox2 | J | 3052-3727 | 3070-3742 | 676 | 673 | 0 | 1 | ATG | ATG | T | T |
| trnK | J | 3728-3798 | 3743-3813 | 71 | 71 | 0 | 0 | ||||
| trnD | J | 3810-3874 | 3816-3880 | 65 | 65 | 11 | 2 | ||||
| atp8 | J | 3875-4039 | 3881-4039 | 165 | 159 | 0 | 0 | ATC | ATG | TAA | TAA |
| atp6 | J | 4033-4710 | 4033-4710 | 678 | 678 | -7 | -7 | ATG | ATG | TAA | TAA |
| cox3 | J | 4710-5498 | 4710-5498 | 789 | 789 | -1 | -1 | ATG | ATG | TAA | TAA |
| trnG | J | 5501-5567 | 5501-5566 | 67 | 66 | 2 | 2 | ||||
| nad3 | J | 5568-5915 | 5564-5914 | 348 | 351 | 0 | -3 | ATT | ATA | TAA | TAA |
| trnA | J | 5919-5988 | 5916-5979 | 70 | 64 | 3 | 1 | ||||
| trnR | J | 5988-6049 | 5979-6040 | 62 | 62 | -1 | -1 | ||||
| trnN | J | 6051-6119 | 6041-6106 | 69 | 66 | 1 | 0 | ||||
| trnS1 | J | 6117-6177 | 6104-6164 | 61 | 61 | -3 | -3 | ||||
| trnE | J | 6178-6242 | 6194-6257 | 65 | 64 | 0 | 29 | ||||
| trnF | N | 6241-6306 | 6262-6327 | 66 | 66 | -2 | 4 | ||||
| nad5 | N | 6307-8044 | 6333-8072 | 1738 | 1740 | 0 | 5 | ATT | ATT | T | TAA |
| trnH | N | 8045-8108 | 8073-8137 | 64 | 65 | 0 | 0 | ||||
| nad4 | N | 8109-9447 | 8138-9476 | 1339 | 1339 | 0 | 0 | ATG | ATG | T | T |
| nad4l | N | 9449-9739 | 9477-9764 | 291 | 288 | 1 | 0 | ATG | ATG | TAA | TAA |
| trnT | J | 9742-9806 | 9767-9830 | 65 | 64 | 2 | 2 | ||||
| trnP | N | 9807-9871 | 9831-9895 | 65 | 65 | 0 | 0 | ||||
| nad6 | J | 9874-10404 | 9901-10428 | 531 | 528 | 2 | 5 | ATT | ATA | TAA | TAA |
| cob | J | 10404-11556 | 10432-11586 | 1153 | 1155 | -1 | 3 | ATG | ATG | T | TAA |
| trnS2 | J | 11557-11622 | 11586-11650 | 66 | 65 | 0 | -1 | ||||
| nad1 | N | 11625-12579 | 11656-12609 | 955 | 954 | 2 | 5 | ATG | ATA | T | TAA |
| trnL1 | N | 12580-12648 | 12613-12681 | 69 | 69 | 0 | 3 | ||||
| rrnL | N | 12663-13993 | 12684-14082 | 1331 | 1399 | 14 | 2 | ||||
| trnV | N | 13994-14057 | 14083-14148 | 64 | 66 | 0 | 0 | ||||
| rrnS | N | 14058-14827 | 14149-14915 | 770 | 767 | 0 | 0 | ||||
| Control region | 14828-15333 | 14916-15423 | 506 | 508 | 0 | 0 | |||||
Note: J and N indicate the majority coding strand and the minority strand, respectively; IGN values represent intergenic nucleotides and overlapping nucleotides (−); T indicates the incomplete stop codon.
Disclaimer/Publisher’s Note: The statements, opinions and data contained in all publications are solely those of the individual author(s) and contributor(s) and not of MDPI and/or the editor(s). MDPI and/or the editor(s) disclaim responsibility for any injury to people or property resulting from any ideas, methods, instructions or products referred to in the content. |
© 2025 by the authors. Licensee MDPI, Basel, Switzerland. This article is an open access article distributed under the terms and conditions of the Creative Commons Attribution (CC BY) license (http://creativecommons.org/licenses/by/4.0/).
Copyright: This open access article is published under a Creative Commons CC BY 4.0 license, which permit the free download, distribution, and reuse, provided that the author and preprint are cited in any reuse.


