
Submitted:
19 March 2025
Posted:
20 March 2025
You are already at the latest version
Abstract
Background/objective: We examined the prevalence of daily SSB intake, identifying its sociodemographic determinants, and exploring its potential association with undiagnosed non-communicable diseases (NCDs) among Malaysian adults. Methods: This cross-sectional study analyzed data from 6,596 Malaysian adults participating in the 2019 National Health and Morbidity Survey (NHMS). Multiple logistic regression was used to examine the association between daily SSB intake and the risk of undiagnosed diabetes, hypertension, hypercholesterolemia, and obesity, while adjusting for potential confounders. Results: The prevalence of daily SSB intake was 53.6%, with higher intake observed among females, older adults, Indians, and unemployed individuals. After adjusting for confounders, daily SSB intake was not significantly associated with undiagnosed diabetes (adjusted OR:1.01, 95% CI:0.80-1.29), undiagnosed hypertension (adjusted OR:0.99, 95% CI:0.81-1.22), undiagnosed hypercholesterolemia (adjusted OR:0.99, 95% CI:0.83-1.18), or obesity (adjusted OR:1.08, 95% CI:0.91-1.27). Conclusions: This study highlights the high prevalence of daily SSB intake among Malaysian adults, driven by sociodemographic factors. While lack of direct associations with undiagnosed NCDs was observed, the high prevalence of SSB intake raises concerns about long-term health impacts. Targeted public health interventions are essential to address cultural and economic determinants of SSB intake, and future research adopting longitudinal designs to explore how sustained reductions in SSB intake influence the risk of developing NCDs.
Keywords:
Sugar-sweetened beverages
; adults
; hypertension
; diabetes
; hypercholesterolemia
; obesity
Introduction
Non-communicable diseases (NCDs), such as diabetes mellitus, hypertension, and hypercholesterolemia, are leading causes of morbidity and mortality globally. According to the World Health Organization (WHO), NCDs account for over 70% of deaths worldwide, with low- and middle-income countries bearing a disproportionate burden due to limited healthcare access [1]. In Malaysia, the prevalence of NCDs has increased alarmingly in recent years, driven by lifestyle changes, rapid urbanization, and dietary shifts [2].
Despite various public health initiatives, a substantial proportion of Malaysians with NCDs remain unaware of their status, hindering early intervention and effective management. The 2023 National Health and Mobility Survey (NHMS) revealed that approximately two in five adults with diabetes, one in two adults with hypercholesterolemia, and 11.9% of adults with hypertension were unaware of their conditions [2]. This undiagnosed burden is particularly concerning, as these diseases may silently progress to severe complications such as cardiovascular disease, kidney failure, or stroke, and be detected only at these advanced stages [3].
Dietary factors play a pivotal role in the development and progression of NCDs, with sugar-sweetened beverages (SSB) emerging as a critical risk factor. SSB, defined as beverages sweetened with added sugars, include sodas, energy drinks, flavoured milk, pre-mixed beverages, and sugar-enhanced traditional drinks [4]. These beverages are one of the major contributors of free sugars in the modern diet, contributing to excessive caloric intake without providing essential nutrients. In Malaysia, prevalence of SSB consumption is high with the mean daily sugar intake from SSB was 59.14 ± 51.28 g/day, which is equal to 12 teaspoons of sugar [5].
Rising SSB intake is a major public health concern due to its strong links with obesity and non-communicable diseases (NCDs). For instance, high SSB intake has been linked to obesity, insulin resistance, increased blood pressure, and dyslipidaemia, all of which are precursors to NCDs [6]. However, limited nationally representative data exist to contextualize these associations within Malaysia’s diverse dietary patterns and socioeconomic landscape. Addressing this knowledge gap is crucial to understanding the hidden burden of undiagnosed NCDs and their link to SSB intake. Therefore, this study aimed to investigate the association between daily SSB intake and the prevalence of undiagnosed NCDs using data from the NHMS 2019. By focusing on undiagnosed cases, this study seeks to uncover critical insights into the hidden burden of NCDs, which may undermine Malaysia’s public health system. The findings will provide essential evidence to inform policy development and enhance public health strategies tailored to the Malaysian context.
Materials and Methodology
Study Population
The present study utilised data from the 2019 National Health and Morbidity Survey (NHMS 2019). NHMS 2019 was a nation-wide survey conducted by the Institutes for Public Health, National Institutes of Health, Ministry Health of Malaysia (MOH) between July 14 and October 2, 2019. The survey aimed to assess the prevalence of non-communicable diseases, risk factors for non-communicable diseases, healthcare demand and health literacy in Malaysia. The survey covered both the rural and urban areas across Malaysia. The detailed methodology of NHMS 2019, including the sampling design, survey materials, data collection form and code book are available in a technical report [7]. In this paper, only the key aspects of the NHMS 2019 survey methodology salient to this study are described.
Sampling Frame
The sampling frame was provided and sampling for NHMS 2019 was performed by the Department of Statistics Malaysia (DOSM). Briefly, geographical areas in Malaysia were divided into enumeration blocks (EBs) and further classified as urban and / or rural, areas by DOSM based on the population of the gazetted areas. The gazetted areas with populations of 10,000 individuals or more was classified as urban EBs, whereas gazetted areas with populations of less than 10,000 was classified as rural EBs. Meanwhile, each EB contains between 80 to 120 living quarters (LQs), and each LQ between 500 to 600 individuals. The survey excluded institutional living quarters (LQs), i.e., institutional buildings such as hotel, hospitals, care homes, nursing homes, holiday and recreation homes.
Sampling Design
The NHMS 2019 employed a two-stage stratified random sampling design, consisting of a primary stratum and secondary stratum, to select respondents that representative of the Malaysian population. The primary stratum included all the thirteen states and three federal territories in Malaysia, whereas the secondary stratum consists of the urban and rural strata within the primary stratum. In the first stage, the primary sampling units i.e., EBs were randomly selected from each sub-stratum. Secondary Sampling Unit, which were the living quarters (LQs) were identified within the selected EBs. Based on the 2010 Population and Housing Census conducted by the Department of Statistics Malaysia, there more than 75,000 EBs that were identified and a total of 475 EBs were selected (362 urban EBs and 113 rural EBs) for the NHMS 2019 study. A total of 5,676 LQs were selected from the identified 475 EBs. The second stage involved random sampling of an average of 12 living quarters (LQs) within each the selected EB. All occupants of the selected LQ who have resided there at least two weeks prior to data collection, were eligible to participate in the survey.
Survey Respondents
Our criteria for eligibility this study was Malaysian citizen, aged 18 years old, with no previous clinical diagnosis of diabetes mellitus, hypertension and/or hypercholesterolemia. A total of 14,965 NHMS 2019 survey participants completed the NCD component of the survey. Prior to statistical analysis, the obtained dataset of the 14,965 respondents was screened with the following criteria. First, individuals who were non-Malaysians/citizenship unknown (n = 901) and aged below 18 years old (n = 4,304) were excluded, leaving 9,760 respondents in the dataset. Next, respondents who had been clinically diagnosed clinically diagnosed with diabetes mellitus, hypertension and/or hypercholesterolemia (n = 3,164) were removed. The final dataset, comprising data from 6,596 respondents were used for further analyses.
Ethical Consideration
The NHMS 2019 was officially registered with the National Medical Research Register (NMRR), MOH and bore the registration number of NMRR-18-3085-44207. The study obtained ethical clearance from the Medical Research and Ethics Committee (MREC) of MOH prior to the commencement of the survey. All identified eligible participants were informed about the survey via the participant’s information sheet, and informed written consent were obtained from individuals who agreed to participate before conducting the survey interview and related assessments.
Survey Materials and Data Collection
A structured questionnaire was used to collect the data based on the survey scopes. The questionnaire was available in two formats, i.e., programmed into an application or paper-form. The participants were allowed to choose the mode of data collection, i.e., face-to-face interviews or self-administered interviews. Should a participant choose face-to-face interviews, a trained data collection enumerator would use the bilingual questionnaire (in Malay and English languages) and accompanied by questionnaire manual as a guide to collect data. Otherwise, a multi-lingual, self-administered questionnaire in (i.e., Malay, English, Chinese and Tamil) was provided to those who chose to complete the survey independently. Alternatively, respondents completed the questionnaire either using the programmed questionnaire or in paper form.
Trained nurses conducted clinical assessment of each respondent’s anthropometric measurements including weight, height, and waist circumference [8]. Calibrated scales (Tanita personal scale HD 319 and SECA stadiometer 213) were used for measuring weight and height. And weighing scales were calibrated with standard weights prior to use in the survey.
Study Variables
Independent Variable
Daily SSB intake was defined as taking at least one of the following different types of sugar added beverages daily: (i) sugar added self-prepared drinks (SASD), (ii) commercially packed ready-to-drink (CPRD) (i.e., carbonated and non-carbonated) and/or (iii) pre-mixed (PM) beverages. SASD was defined as preparations of coffee, tea, chocolate, and/or malted beverages that were added with sugar, sweetened condensed milk and/or sweetened creamer. CPRD beverages were defined as carbonated drinks (e.g., cola, soda) and non-carbonated drinks (e.g., soy milk, chrysanthemum tea, lemon tea, and chocolate drink). Meanwhile, PM was defined as instant drink products containing sugar and/or creamer (e.g., premix coffee, tea, chocolate, soy, and cereal). Respondents were asked to quantify the frequency and quantity of intake of each type of SSB. Two questions were developed to assess the intake of SASD (frequency per week, and quantity per intake), and three questions each for CPRD, and PM beverages (frequency per week, quantity per intake, and quantity of sweetener (sugar/honey/sweetened milk or creamer)).
Dependent Variables
Respondents were subjected to blood sugar, cholesterol and blood pressure measurements, and asked whether they had been clinically diagnosed with diabetes mellitus, hypertension or hypercholesterolemia by a registered healthcare professional within the past twelve months. Respondents with fasting capillary blood glucose level of 6.1 mmol/L or more (or non-fasting blood glucose of more than 11.1 mmol/L) and had not been clinically diagnosed with diabetes mellitus in the past twelve months was classified as undiagnosed diabetes mellitus [9]. Respondents without a known history of hypertension, but with a systolic blood pressure of 140 mmHg or higher and/or diastolic blood pressure of 90 mmHg or higher at enrolment, were classified as having undiagnosed hypertension [10]. Respondents not previously clinically diagnosed with hypercholesterolemia but having blood cholesterol levels of 5.2 mmol/L or higher were classified as undiagnosed hypercholesterolemia [11]. All respondents with undiagnosed diabetes, undiagnosed hypertension and/or undiagnosed hypercholesterolemia self-reported never having received treatment for diabetes, hypertension and/or hypercholesterolemia in the past twelve months.
Covariates
Several covariates were identified as potential confounders i.e., gender, age, ethnicity, residential area, marital status, educational levels, occupation status, monthly household income, and smoking status and were included in the regression model. The age of the respondents was classified into five groups as follows: (i) 18–29 years, (ii) 30 -39 years, (iii) 40–49 years, (iv) 50-59 years and (v) 60 years and above. The respondents self-reported their ethnicity and were classified as follows: (i) Malay, (ii) Chinese, (iii) Indian, (iv) Bumiputera and (v) Others. Residential areas were classified as urban or rural based on the EB in which it was located. Marital statuses were categorised as follows: (i) single, (ii) married, and (iii) widow/widower/divorcee. Education level was categorized based on the local Malaysian education system into (i) no formal education, (ii) primary education, (iii) secondary education, and (iv) tertiary education (all formal education received beyond secondary school).
Respondents’ total monthly household income was further categorized based on the Malaysian household income classification published by the Department of Statistics Malaysia, which is bottom 40% (B40) for monthly household income below RM 4850 (below USD 1035), middle 40% (M40) if between RM 4850 - RM10,959 (USD 1035–2338) and top 20% (T20) if RM 10,960 and above (above USD 2338). Smoking status of respondents consisted of never, current or past smoker. To categorize the status of adequate daily fruit and vegetable (FV) intake, we referred to the Malaysian Dietitian Guidelines 2020 [12]. Based on the guidelines, an individual is classified as having adequate daily FV intake when ≥5 servings fruit and vegetables (i.e., ≥2 servings of fruit and ≥3 servings of vegetables) were consumed daily; otherwise, it is inadequate. The short version of the International Physical Activity Questionnaire was used to assess the level of physical activity of the respondents, where the physical activity was categorized as (i) inactive and (ii) active. The anthropometric measurements of the respondents were used to calculate the body mass index (BMI) by dividing the body weight (kg) with square of height (m2). Respondents with a BMI of 25 and above were classified as overweight/obese, whereas the classification of abdominal obesity was having a waist circumference of 102 cm and above for men, and 88 cm and above for women [13].
Statistical Analyses
All statistical analyses in the present study were performed using the R programming language. The R packages “tidyverse”, “labelled”, “summarytools”, “tibble”, “survey”, “gtsummary” and “flextable” were utilized in RStudio software to perform the descriptive statistics and multivariable logistic regression analyses for complex samples [14]. Additionally, classification tables and receiver operating characteristics (ROC) analyses were performed to assess the predictive ability of the final model.
Prior to analysis, a structured representation of the survey data, i.e., a survey design object, was designed by incorporating the sampling weights, stratification and clustering. The survey design object was used henceforth in all the analyses for complex samples. Descriptive analysis was performed to examine the proportion of respondents by sociodemographic characteristics such as gender, age, ethnicity, residential area, marital status, education level, occupational status, monthly household income, as well as the lifestyle risk factors (i.e., smoking, adequate daily FV intake, physical activity). Following that, Pearson’s Chi-Square was used to test associations between sociodemographic characteristics, lifestyle factor, and daily SSB intake. Prevalence and 95% confidence intervals (CI) of general obesity, abdominal obesity, undiagnosed diabetes mellitus, undiagnosed hypertension, undiagnosed hypercholesterolemia and daily SSB intake were presented in graphical charts. Complex-sample multivariable logistic regression was performed to investigate the association between daily SSB intake and NCDs, and results are presented as adjusted odds ratios (aORs) with their respective 95% CIs, with p-values less than 0.05 considered indicative of statistically significant associations. The R statistical packages “”ggplot2”, and “forestplot” were employed to generate the charts.
Results
The sociodemographic characteristics and lifestyle factors of the respondents are described in Table 1. Our data showed a slightly higher proportion of male respondents (51.0%). Majority of the respondents were in the age group between 18 and 29 years old (38.5%), of Malay origins (57.1%), living in urban area (78.7%), and married (59.5%). Around 52.8% of the respondents completed their education at secondary level, 68.1% were working (employed/self-employed), and 62.2% earned monthly household incomes below USD1,035. Approximately 23% of the respondents were current smokers and 4% of them were past smokers. An alarming low prevalence of daily adequate FV) intake was observed, i.e., 2.3% (95% CI: 1.81-2.90). One-third of the Malaysian adults were physically active (75.7%, 95% CI:74.1-77.3). More than half of the respondents (53.6%) reported having at least one SSB intake daily. Estimation of the prevalence of NCDs in the study population demonstrated general obesity had the highest prevalence (63.1%, 95% CI: 8.1-10.40), followed by abdominal obesity (48.0%, 95% CI: 46.0-50.1), undiagnosed hypercholesterolemia (29.5%, 95% CI: 27.5-31.7), undiagnosed hypertension (16.9%, 95% CI:15.6-18.2), and undiagnosed diabetes mellitus (9.2%, 95% CI:8.1-10.4) (Figure 1).
Further analysis demonstrated that daily SSB intake was significantly higher among females (50.2%) compared to males (42.7%) (p<0.001) (Table 2). Prevalence of daily SBB intake increased significantly with age, with the oldest age group (above 60 years old) having the highest prevalence (62.6%) (p<0.001). Respondents of Indian origin had the highest prevalence of daily SSB intake (51.9%) compared to Bumiputera (28.3%) and other race groups (28.5%) (p<0.001), which was statistically significant. Respondents who were single had the lowest prevalence of SSB intake (35.4%) when compared to those who were married (52.5%) or widowed(er)/divorced (54.0%) (p<0.001). The majority of the unemployed and non-smokers had daily SSB intake, with prevalences of 51.3% and 49.1%, respectively.
We observed higher prevalence of daily SSB intake among undiagnosed diabetes mellitus (51%), undiagnosed hypercholesterolemia (50.4%), undiagnosed hypertension (49.8%), and abdominal obesity (47.6%) when compared to those who are non-diagnosed (Figure 2). The daily SSB intake prevalence was comparable between those who are overweight/obese (46.9%) and the non-obese (46.1%).
We observed higher prevalence of daily SSB intake among undiagnosed diabetes mellitus (51%), undiagnosed hypercholesterolemia (50.4%), undiagnosed hypertension (49.8%), and abdominal obesity (47.6%) when compared to those who are non-diagnosed (Figure 2). The daily SSB intake prevalence was comparable between those who are overweight/obese (46.9%) and the non-obese (46.1%).
The association analyses revealed no significant association between daily SSB intake with undiagnosed diabetes mellitus (aOR: 1.04, 95% CI: 0.82-1.32), undiagnosed hypertension (aOR: 1.03, 95% CI: 0.85-1.25), undiagnosed hypercholesterolemia (aOR: 1.01, 95% CI: 0.85-1.20), general obesity (aOR: 0.82, 95% CI: 0.61-1.10) and abdominal obesity (aOR: 1.08, 95% CI: 0.92-1.28) when sociodemographic characteristics and lifestyle factors were held constant (Figure 3).
Discussion
The study demonstrates the high prevalence of daily SSB intake among Malaysian adults, and its significant public health implications. No significant relationship was observed between SSB intake and risk of undiagnosed diabetes, undiagnosed hypertension, undiagnosed hypercholesterolemia and obesity among Malaysian adults.
This high SSB intake trend observed in the present study is consistent with previous data from the Malaysian Adults Nutrition Survey, which reported that 55.9% of Malaysian adults consumed SSB daily [15]. The persistent high intake of SSB over the years suggests that existing public health interventions may not have been sufficiently effective in curbing intake. Due to the burden of health-related consequences, these findings underscore the pressing need for targeted public health strategies.
Notably, this study revealed a higher prevalence of daily SSB consumption among females and older adults. Given that SSB are a major source of empty calories, the higher intake among females may contribute to the greater prevalence of overweight and obesity observed in Malaysian women compared to men, according to NHMS 2019 [16]. This aligns with previous research indicating an increase in sugar intake among Malaysian older adults, with an average total sugar consumption of approximately eight teaspoons per day [17]. Furthermore, older adults often prefer sweetened tea and coffee, which are commonly consumed in Malaysian culture and contribute significantly to their overall sugar intake [17].
The finding that daily SSB intake was more prevalent among individuals of Indian origin highlights the significant role of cultural factors in shaping dietary behaviours. This is in line with findings from studies in multicultural societies, where dietary patterns are strongly related to cultural identity and access to affordable food and beverages [18]. Traditional Indian foods, such as roti canai (a type of flatbread), and sweetened beverages like teh tarik (frothy milk tea) are not only culturally significant, but also widely available and inexpensive, making them more accessible within this group. Economic accessibility plays a crucial role in influencing dietary choices [18]. In Malaysia, street food vendors and food courts offer SSB at reasonable prices. This affordability, coupled with the culture integration of these food and beverages into daily routines, contribute to increased SSB consumption among Indians. Previous research has shown that Indians have the highest median HbA1c levels (8.3%), followed by Malays (7.7%) and Chinese (7.2%) [19], indicating a greater risk of diabetes and other metabolic disorders. This elevated risk may, in part, be attributed to the increased consumption of SSB among the Indian population [20].
Our findings also indicate that single individuals had a lower likelihood of daily SSB intake (35.4%) compared to married (52.5%) and widowed/divorced individuals (54.0%). Married individuals have been found to consume fast food more frequently (more than three times a week), which is typically served with soft drinks, leading to a higher intake of sugar-sweetened beverages (SSBs) [21]. Additionally, marriage has been linked to an increased probability of overweight and obesity [22], likely due to changes in eating habits, and parenting stresses [23]. Parents may find meal preparation at home particularly difficult due to time constraints and a hectic home environment [23]. As a result, married individuals with children visit fast-food restaurants more frequently, where SSBs are often included as standard menu items. This dining pattern could result in higher SSB consumption for both parents and children, further contributing to the family’s overall sugar intake.
Unemployed individuals exhibited a higher prevalence of daily SSB consumption, consistent with previous studies that associate higher SSB intake with lower income levels [24,25]. Financial constraints often limit access to healthier food options, making fast food and SSB more attractive as affordable and convenient meal choices [24]. However, these low-cost dietary patterns are typically high in calories and low in essential nutrients, increasing the risk of nutritional deficiencies and non-communicable diseases such as diabetes, obesity, and cardiovascular conditions [26]. High SSB consumption among lower-income and unemployed populations necessitates targeted interventions focused on accessibility and affordability. Empowering these groups to prepare more home-cooked meals is a key strategy, as home-cooked meals are often more affordable compared to fast foods and sugary drinks and are also associated with better dietary quality [27]. To complement this, strategic subsidies on healthy beverage options, such as fresh fruit juices or milk, alongside a progressive sugar tax on SSBs, could further reduce excessive sugar consumption [28]. Additionally, initiatives that enhance nutritional literacy among low-income populations could foster long-term behavioral changes and improve dietary quality among the low-income populations [29].
Despite the well-established global association between SSB consumption and NCDs (6), this study found no significant associations between daily SSB intake and undiagnosed NCDs, after adjusting for sociodemographic and lifestyle factors. This finding diverges from previous research where excessive SSB intake has been consistently linked to obesity [30] and NCDs [6]. A possible explanation lies in the confounding effects of other factors such as dietary patterns, physical activity levels, and genetic predisposition, may play a crucial role in the development of NCDs. This aligns with previous research indicating that multiple dietary habits, physical activity, and lifestyle factors contribute to NCDs [31]. Secondly, the cross-sectional nature of this study restricts the ability to draw conclusions about causality. The absence of an association does not imply that SSB have no impact on undiagnosed NCDs but rather suggests that within this dataset, a direct link was not observed. Longitudinal studies with detailed dietary assessments such as food frequency questionnaires and 24-hour dietary recall may be better suited to capturing the long-term effects of habitual SSB consumption on disease development.
Nevertheless, the high prevalence of SSB intake among individuals with undiagnosed NCDs in this study raises concerns about its potential role in exacerbating existing health conditions. SSB are known to contribute to increased caloric intake, insulin resistance, and inflammation, which can worsen the metabolic profiles of individuals with undiagnosed NCDs [32]. This underscores the importance of early detection of NCDs and concurrent reduction of SSB consumption as part of integrated public health strategies.
One of the key strengths of this study is its large, nationally representative sample, which enhances the generalizability of the findings to the broader population. Another strength lies in the study’s focus on undiagnosed metabolic conditions, providing valuable insights into the hidden burden of diseases that could otherwise go undetected in routine health screenings. Moreover, the study contributes valuable insights into sociodemographic disparities in SSB consumption, providing an evidence base for tailored public health interventions. By identifying at-risk groups such as females, Indians, older adults, and those from lower socioeconomic backgrounds, this research offers practical recommendations for policymakers and public health professionals.
However, several limitations should be acknowledged. The cross-sectional design hinders the establishment of causal relationships between daily SSB consumption and undiagnosed NCDs, as it only captures associations at a single point in time. Additionally, residual confounding may still exist even after confounding variables have been adjusted for, particularly from unmeasured factors such as total energy intake, overall dietary patterns, and levels of physical activity. Another limitation is the use of self-reported dietary intake, which may be subject to recall bias and underestimation of actual SSB consumption. Future research should incorporate longitudinal study designs and overall dietary intake patterns to obtain a better understanding of these associations.
Conclusion
This study highlights the high prevalence of daily SSB intake among Malaysian adults and its associations with gender, ethnicity, employment status, and marital status. While no direct association was found between daily SSB intake and undiagnosed NCDs, the high prevalence of SSB intake among individuals with these conditions raises concerns about its potential role in exacerbating health outcomes. These findings emphasize the urgent need for multifaceted public health interventions that not only target SSB reduction but also address the broader lifestyle and sociodemographic determinants of NCDs risk. Future research should focus on longitudinal studies to better understand the long-term impact of dietary and lifestyle modifications in mitigating NCDs prevalence and improving public health outcomes in Malaysia.
Author Contributions
Conceptualization: Tan L.K., Kee C.C. Data curation: Tan L.K. Formal analysis: Tan L.K. Investigation: Tan L.K., Methodology: Tan L.K., Project administration: Tan L.K. Software: Tan L.K. Supervision: Tan L.K. Validation: Tan L.K., Kee C.C., Sumarni M.G. Visualization: Tan L.K. Writing – original draft: Cheng S.H., Tan L.K. Writing – review & editing: Cheng S.H., Sumarni M.G., Kee C.C., Tan L.K.
Funding
The NHMS 2019 survey (NMRR-18-3085-44207) was fully supported by the Ministry of Health Malaysia Research Grant (MRG).
Institutional Review Board Statement
This survey was reviewed and approved by the Medical Research and Ethics Committee (MREC), Ministry of Health Malaysia (NMRR-18-3085-44207). All research methods were conducted in accordance with the relevant guidelines and regulations of the Declaration of Helsinki. Data was fully anonymized, and respondents’ identifiers were removed before performing statistical analyses.
Informed Consent Statement
Informed consent was obtained from all respondents prior to data collection. For participants who were illiterate, the information sheet and consent form were read to proxy respondents, and thumbprints were collected in place of signatures on the consent form, as approved by the Medical Research and Ethics Committee (MREC), Ministry of Health Malaysia.
Data Availability Statement
All data generated during this study are included in the published article and its Supplementary Information files. However, to ensure data protection, the data used in this study is not publicly accessible. They can be obtained from the Sector for Biostatistics and Data Repository, Office of the NIH Manager, National Institutes of Health Malaysia, upon reasonable request and with approval from the Director General of the Ministry of Health Malaysia.
Acknowledgement
The authors express their sincere gratitude to the Director General of Health Malaysia for granting permission to publish this research article. We also extend our heartfelt thanks to all research team members and data collectors for their invaluable contributions and dedication during the implementation of the National Health and Morbidity Survey (NHMS) 2019. Finally, we are deeply thankful to all participants for their involvement and cooperation.
Conflicts of Interest
The authors declare that they have no competing interests.
References
- Abbafati, C.; Abbas, K.M.; Abbasi, M.; Abbasifard, M.; Abbasi-Kangevari, M.; Abbastabar, H.; et al. Global burden of 369 diseases and injuries in 204 countries and territories, 1990–2019: a systematic analysis for the Global Burden of Disease Study 2019. Lancet 2020, 396, 1204–1222. [Google Scholar]
- Institute for Public Health (IPH). National Health and Morbidity Survey (NHMS) 2023: Non-communicable Diseases and Healthcare Demand - Key Findings [Internet]. National Institutes of Health (NIH) Ministry of Health Malaysia. 2024. Available online: http://scioteca.caf.com/bitstream/handle/123456789/1091/RED2017-Eng-8ene.pdf?sequence=12&isAllowed=y%0Ahttp://dx.doi.org/10.1016/j.regsciurbeco.2008.06.005%0Ahttps://www.researchgate.net/publication/305320484_SISTEM_PEMBETUNGAN_TERPUSAT_STRATEGI_MELESTARI.
- Addisu, B.; Bekele, S.; Wube, T.B.; Hirigo, A.T.; Cheneke, W. Dyslipidemia and its associated factors among adult cardiac patients at Ambo university referral hospital, Oromia region, west Ethiopia. BMC Cardiovasc Disord [Internet] 2023, 23, 1–12. [Google Scholar] [CrossRef]
- Bowman, S.A. Added sugars: Definition and estimation in the USDA Food Patterns Equivalents Databases. J Food Compos Anal. 2017, 64, 64–67. [Google Scholar] [CrossRef]
- Cheng, S.-H.; Lau, M.Y. Increased Consumption of Sugar-Sweetened Beverages Among Malaysian University Students During the Covid-19. Malaysian J Soc Sci Humanit. 2022, 7, e001599. [Google Scholar] [CrossRef]
- Malik, V.S.; Hu, F.B. The role of sugar-sweetened beverages in the global epidemics of obesity and chronic diseases. Nat Rev Endocrinol [Internet] 2022, 18, 205–18. [Google Scholar] [CrossRef] [PubMed]
- Institute for Public Health. National Health and Morbidity Survey (NHMS) 2019: Vol. I: NCDs—Non-Communicable Diseases: Risk Factors and Other Health Problems [Internet]. 2020. Available online: https://iku.moh.gov.my/images/IKU/Document/REPORT/NHMS2019/Report_NHMS2019-NCD_v2.pdf.
- World Health Organization. The Asia Pacific perspective: Redefining obesity and its treatment; World Health Organization: Geneva, Switzerland, 2000. [Google Scholar]
- Zhang, Y.; Guo, S.; Ma, W.; Wang, J.; Bai, G.; Yang, Q. , et al. Cut-off points of fasting fingertip capillary blood glucose for detecting both undiagnosed diabetes and pre-diabetes. Zhonghua Liu Xing Bing Xue Za Zhi 2010, 31, 1174–1178. [Google Scholar]
- Whelton, P.K.; Carey, R.M.; Aronow, W.S.; Casey, D.E.; Collins, K.J.; Himmelfarb, C.D. , et al. 2017 ACC/AHA/AAPA/ABC/ACPM/AGS/APhA/ASH/ ASPC/NMA/PCNA guideline for the prevention, detection, evaluation, and management of high blood pressure in adults: Executive summary: A report of the American college of cardiology/American Heart Association task. Hypertension 2018, 71, 1269–1324. [Google Scholar]
- Ministry of Health Malaysia. Clinical Practice Guidelines: Management of Dyslipidaemia 2017, 5th ed.; Minist Heal Malaysia [Internet]; 2017; Volume 17, pp. 1–107. Available online: http://www.pubmedcentral.nih.gov/articlerender.fcgi?artid=1768388&tool=pmcentrez&rendertype=abstract.
- National Coordinating Committee on Food and Nutrition Ministry of Health Malaysia. Malaysian Dietary Guidelines; Technical Working Group on Nutrition Guidelines For National Coordinating Committee on Food and Nutrition: Putrajaya, Malaysia, 2020. [Google Scholar]
- WHO Expert Consultation. Appropriate body-mass index for Asian populations and its implications for policy and intervention strategies. Lancet 2004, 363, 157–163. [Google Scholar] [CrossRef]
- Team R development, C. R: A Language and Environment for Statistical Computing. 2009. [Google Scholar]
- Institute for Public Health. National health and morbidity survey 2014: Malaysian adult nutrition survey (MANS) volume I: Methodology and general findings [Internet]. Ministry of Health Malaysia. 2014. Available online: http://www.iku.gov.my/images/IKU/Document/REPORT/NHMS2014-MANS-VOLUME-1-MethodologyandGeneralFind.pdf.
- Chong, C.T.; Lai, W.K.; Sallehuddin, S.M.; Ganapathy, S.S. Prevalence of overweight and its associated factors among Malaysian adults: Findings from a nationally representative survey. PLoS One [Internet] 2023, 18, 1–12. [Google Scholar] [CrossRef]
- Zainuddin, N.Z.S.; Shahar, S.; Safii, N.S.; Haron, H.; Omar, M.A. Sugar intake and metabolic syndrome among older adults in Peninsular Malaysia. Malays J Nutr. 2018, 24, 163–174. [Google Scholar]
- Reddy, G.; van Dam, R.M. Food, culture, and identity in multicultural societies: Insights from Singapore. Appetite [Internet] 2020, 149, 104633. [Google Scholar] [CrossRef] [PubMed]
- Arifin, A.; Thambiah, S.C.; Abdullah, H.; Samsuddin, I.N.; Zahari Sham, S.Y. Glycated Haemoglobin as an Index of Glycaemic Control: Ethnic Variation among Patients with Type 2 Diabetes Mellitus in a Malaysian Tertiary Hospital. Malaysian J Med Heal Sci. 2022, 18, 16–22. [Google Scholar] [CrossRef]
- Tseng, T.-S.; Lin, W.-T.; Gonzalez, G.V.; Kao, Y.-H.; Chen, L.-S.; Lin, H.-Y. Sugar intake from sweetened beverages and diabetes: A narrative review. World J Diabetes 2021, 12, 1530–1538. [Google Scholar] [CrossRef] [PubMed]
- Khalifa, A.; Alanazi, M.; Alotaibi, A.; Aldaham, D.; Alshalan, A.; Qabaja, A.; et al. Obesity and associating factors: a cross-sectional study in Riyadh, Saudi Arabia. Int J Med Dev Ctries 2020, 417–422. [Google Scholar] [CrossRef]
- Tang, F.; Pan, Y.; Deng, H. Effect of marriage on overweight and obesity: evidence from China. BMC Public Health 2024, 24, 3–9. [Google Scholar] [CrossRef]
- Bautista, T.; Fogelman, N.; Lartigue, S.; Silverman, W.K.; Jastreboff, A.M.; Sinha, R. Association between specific types of parent stressors and fast-food consumption among parents and children. Eat Behav. 2023, 49. [Google Scholar] [CrossRef]
- Fontes, A.S.; Pallottini, A.C.; Vieira, D.A.D.S.; Fontanelli M de, M.; Marchioni, D.M.; Cesar, C.L.G. , et al. Demographic, socioeconomic and lifestyle factors associated with sugar-sweetened beverage intake: A population-based study. Rev Bras Epidemiol. 2020, 23. [Google Scholar] [CrossRef]
- Ferretti, F.; Mariani, M. Sugar-sweetened beverage affordability and the prevalence of overweight and obesity in a cross section of countries. Global Health [Internet] 2019, 15, 1–14. Available from: https://www.researchgate.net/publication/332513001_Sugar-sweetened_beverage_affordability_and_the_prevalence_of_overweight_and_obesity_in_a_cross_section_of_countries. [CrossRef]
- Alamnia, T.T.; Sargent, G.M.; Kelly, M. Dietary patterns and associations with metabolic risk factors for non-communicable disease. Sci Rep [Internet] 2023, 13, 1–10. [Google Scholar] [CrossRef]
- Clifford Astbury, C.; Penney, T.L.; Adams, J. Home-prepared food, dietary quality and socio-demographic factors: A cross-sectional analysis of the UK National Diet and nutrition survey 2008-16. Int J Behav Nutr Phys Act. 2019, 16, 1–11. [Google Scholar] [CrossRef]
- Valizadeh, P.; Popkin, B.M.; Ng, S.W. Linking a sugar-sweetened beverage tax with fruit and vegetable subsidies: A simulation analysis of the impact on the poor. Am J Clin Nutr. 2022, 115, 244–255. [Google Scholar] [CrossRef] [PubMed]
- Silva, P.; Araújo, R.; Lopes, F.; Ray, S. Nutrition and Food Literacy: Framing the Challenges to Health Communication. Nutrients 2023, 15, 1–25. [Google Scholar] [CrossRef] [PubMed]
- Tran, Q.D.; Nguyen, T.H.H.; Le, C.L.; Hoang LVan Vu, T.Q.C.; Phan, N.Q. , et al. Sugar-sweetened beverages consumption increases the risk of metabolic syndrome and its components in adults: Consistent and robust evidence from an umbrella review. Clin Nutr ESPEN [Internet] 2023, 57, 655–664. [Google Scholar] [CrossRef] [PubMed]
- Lordan, R.; Grant, W.B. Dietary Patterns, Physical Activity, and Lifestyle in the Onset, Prevention, and Management of Noncommunicable Diseases. Nutrients 2023, 15, 10–13. [Google Scholar] [CrossRef]
- Rivera-Paredez, B.; Torres-Ibarra, L.; González-Morales, R.; Barrientos-Gutiérrez, T.; Hernández-López, R.; Ramírez, P. , et al. Cumulative soft drink consumption is associated with insulin resistance in Mexican adults. Am J Clin Nutr [Internet] 2020, 112, 661–668. [Google Scholar] [CrossRef]
Figure 1.
Prevalence of abdominal obesity, general obesity, undiagnosed diabetes mellitus, undiagnosed hypertension, and undiagnosed hypercholesterolemia among Malaysian adults aged 18 years and above (n = 6,596).
Figure 1.
Prevalence of abdominal obesity, general obesity, undiagnosed diabetes mellitus, undiagnosed hypertension, and undiagnosed hypercholesterolemia among Malaysian adults aged 18 years and above (n = 6,596).
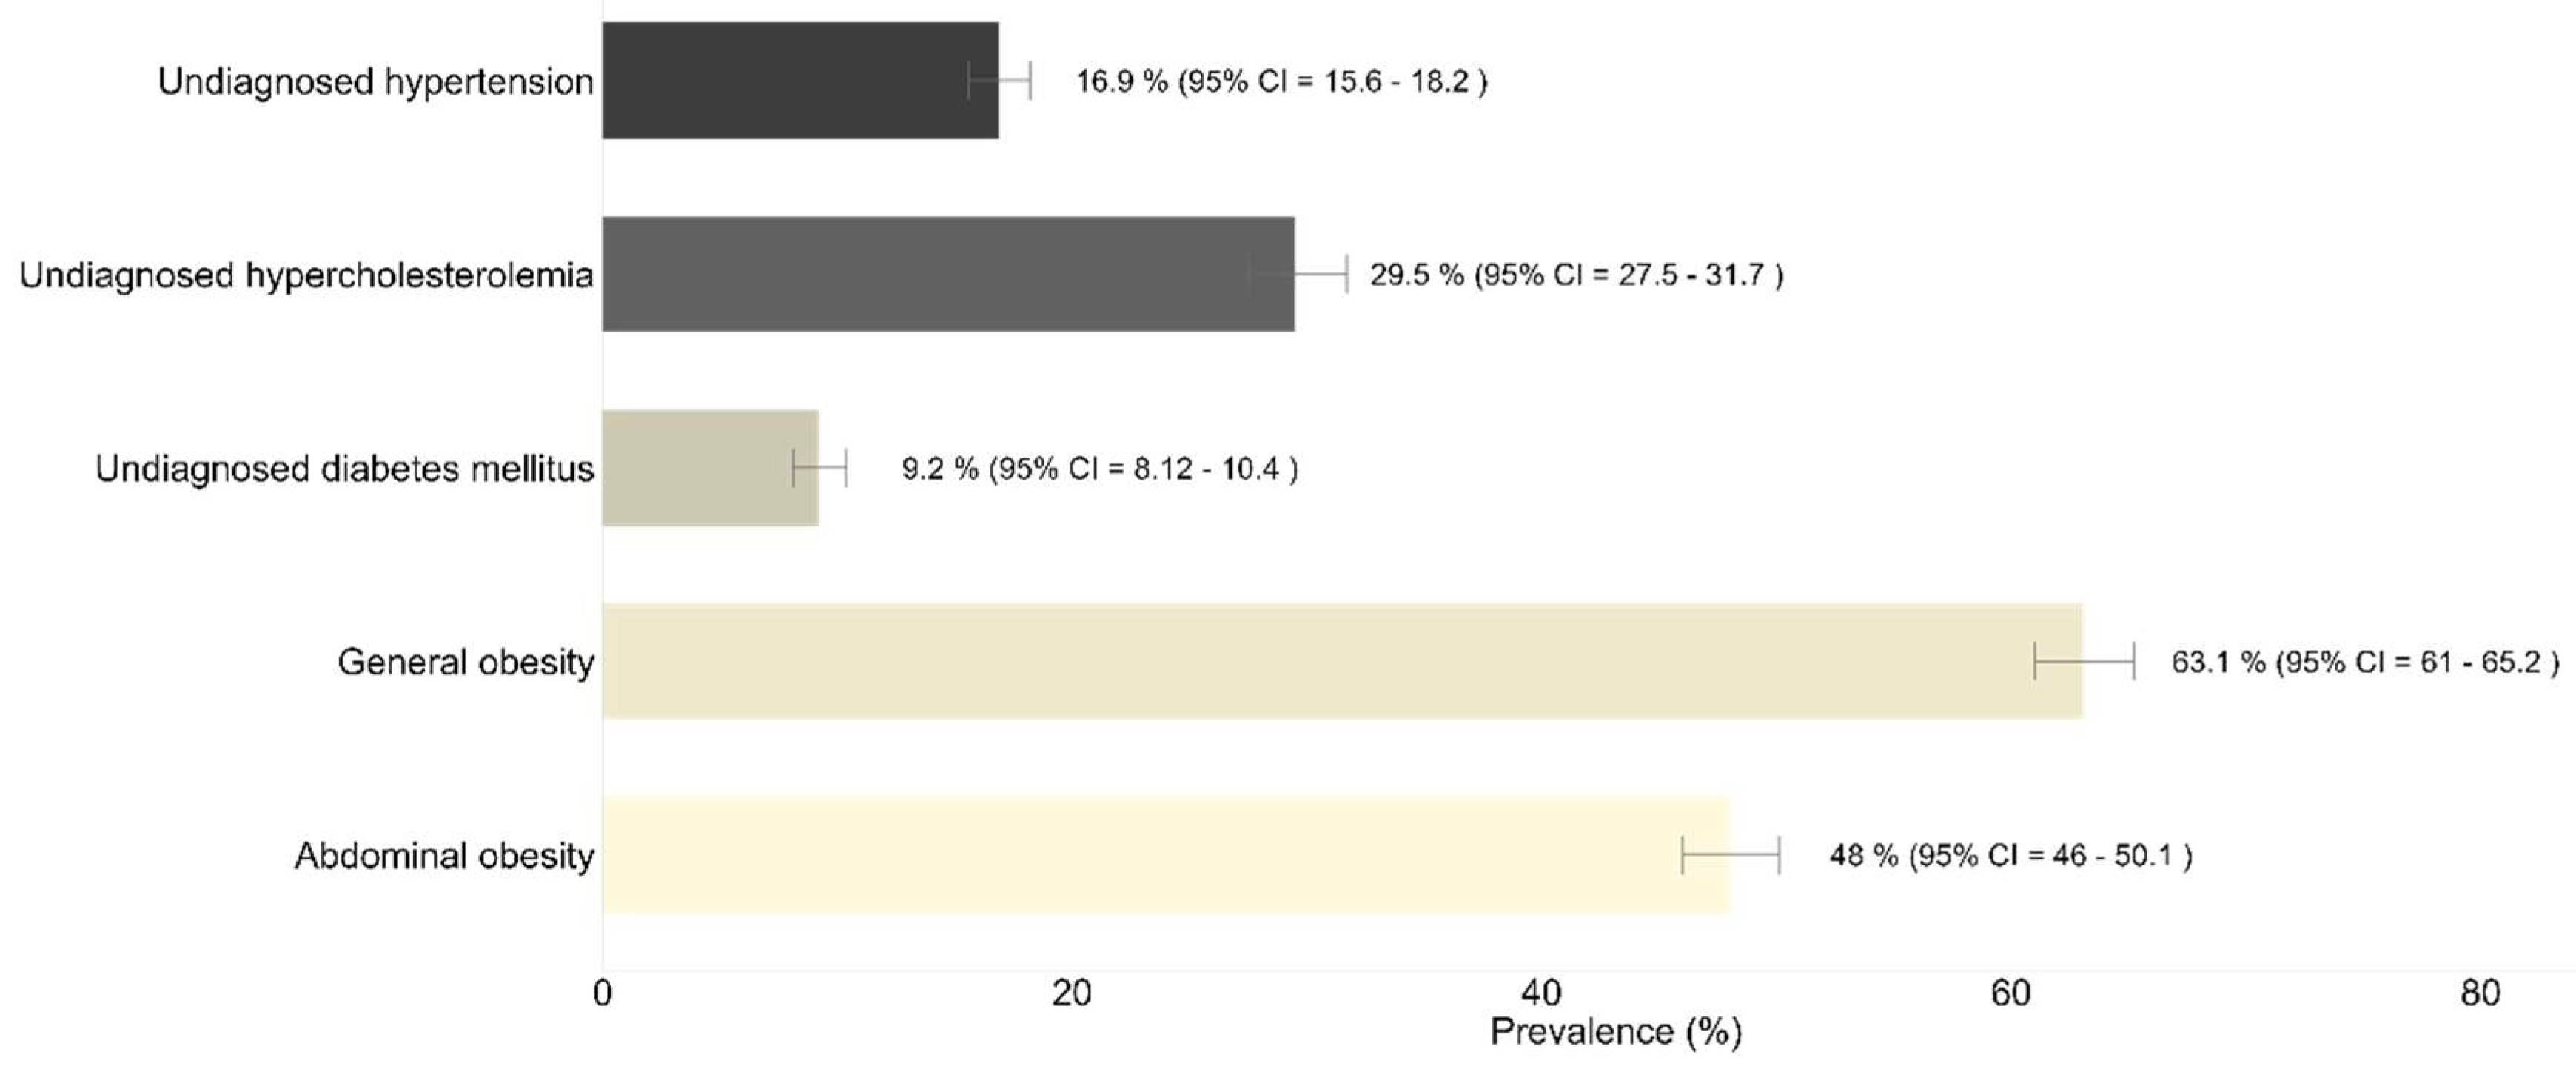
Figure 2.
Prevalence of daily SSB intake among Malaysian adults aged 18 years and above with abdominal obesity, general obesity, undiagnosed diabetes mellitus, undiagnosed hypertension, and undiagnosed hypercholesterolemia (n = 6,596).
Figure 2.
Prevalence of daily SSB intake among Malaysian adults aged 18 years and above with abdominal obesity, general obesity, undiagnosed diabetes mellitus, undiagnosed hypertension, and undiagnosed hypercholesterolemia (n = 6,596).
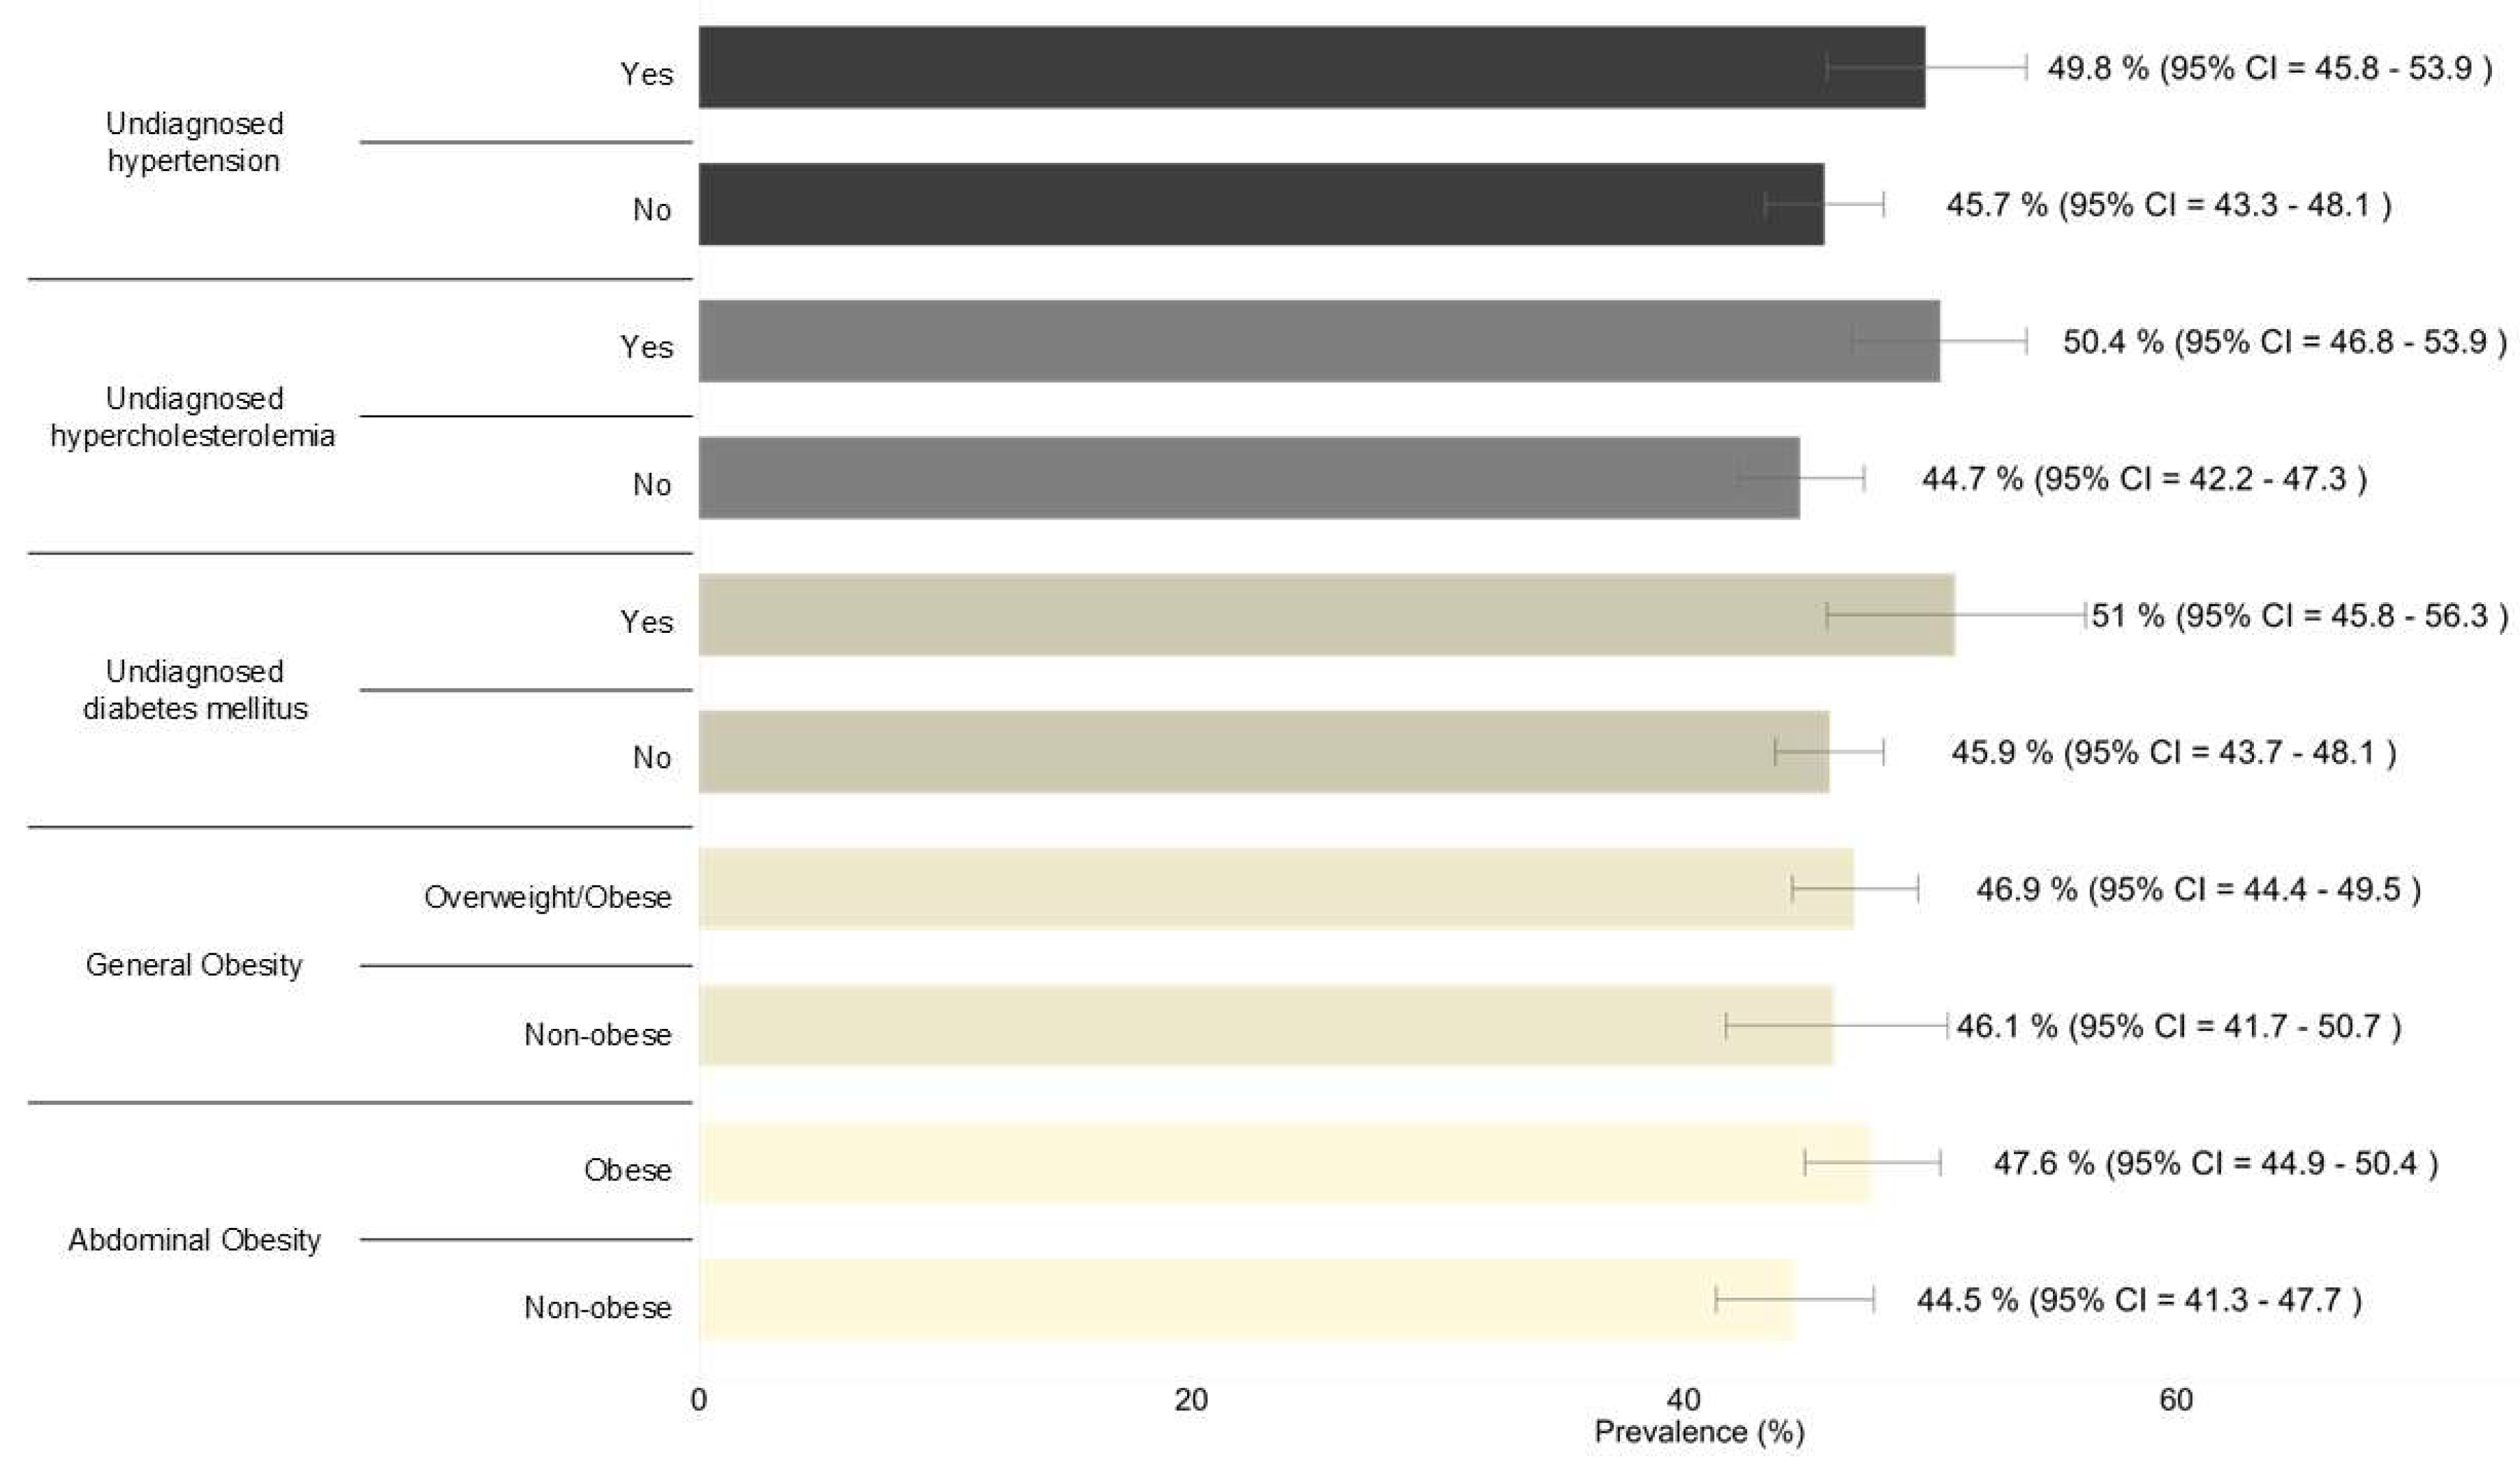
Figure 3.
Associations between daily SSB intake with general obesity, abdominal obesity, diabetes mellitus, hypertension, and hypercholesterolemia among Malaysian adults aged 18 years and above. Multiple logistic regression was performed and adjusted for sociodemographic (i.e., gender, age, ethnicity, residential area, marital status, education, occupational status, and monthly household income) and lifestyle risk factors (i.e., smoking status, adequate daily FV intake, physical activity). There were no significant interactions among the independent variables. The model prediction values of the final model for undiagnosed diabetes mellitus, undiagnosed hypertension, undiagnosed hypercholesterolemia, general obesity and abdominal obesity were the respective 90.6% (area under curve (AUC) : 0.69, 95% CI : 0.67–0.71, p < 0.0001), 83.7% (AUC : 0.73, 95% CI : 0.71–0.74, p < 0.0001), 72.3% (AUC : 0.69, 95% CI : 0.67–0.70, p < 0.0001), 63.3% (AUC : 0.59, 95% CI : 0.57–0.61, p < 0.0001) and 56.8% (AUC : 0.68, 95% CI : 0.67–0.70, p < 0.0001), respectively. aOR: adjusted odds ratio; 95% CI: 95% confidence interval.
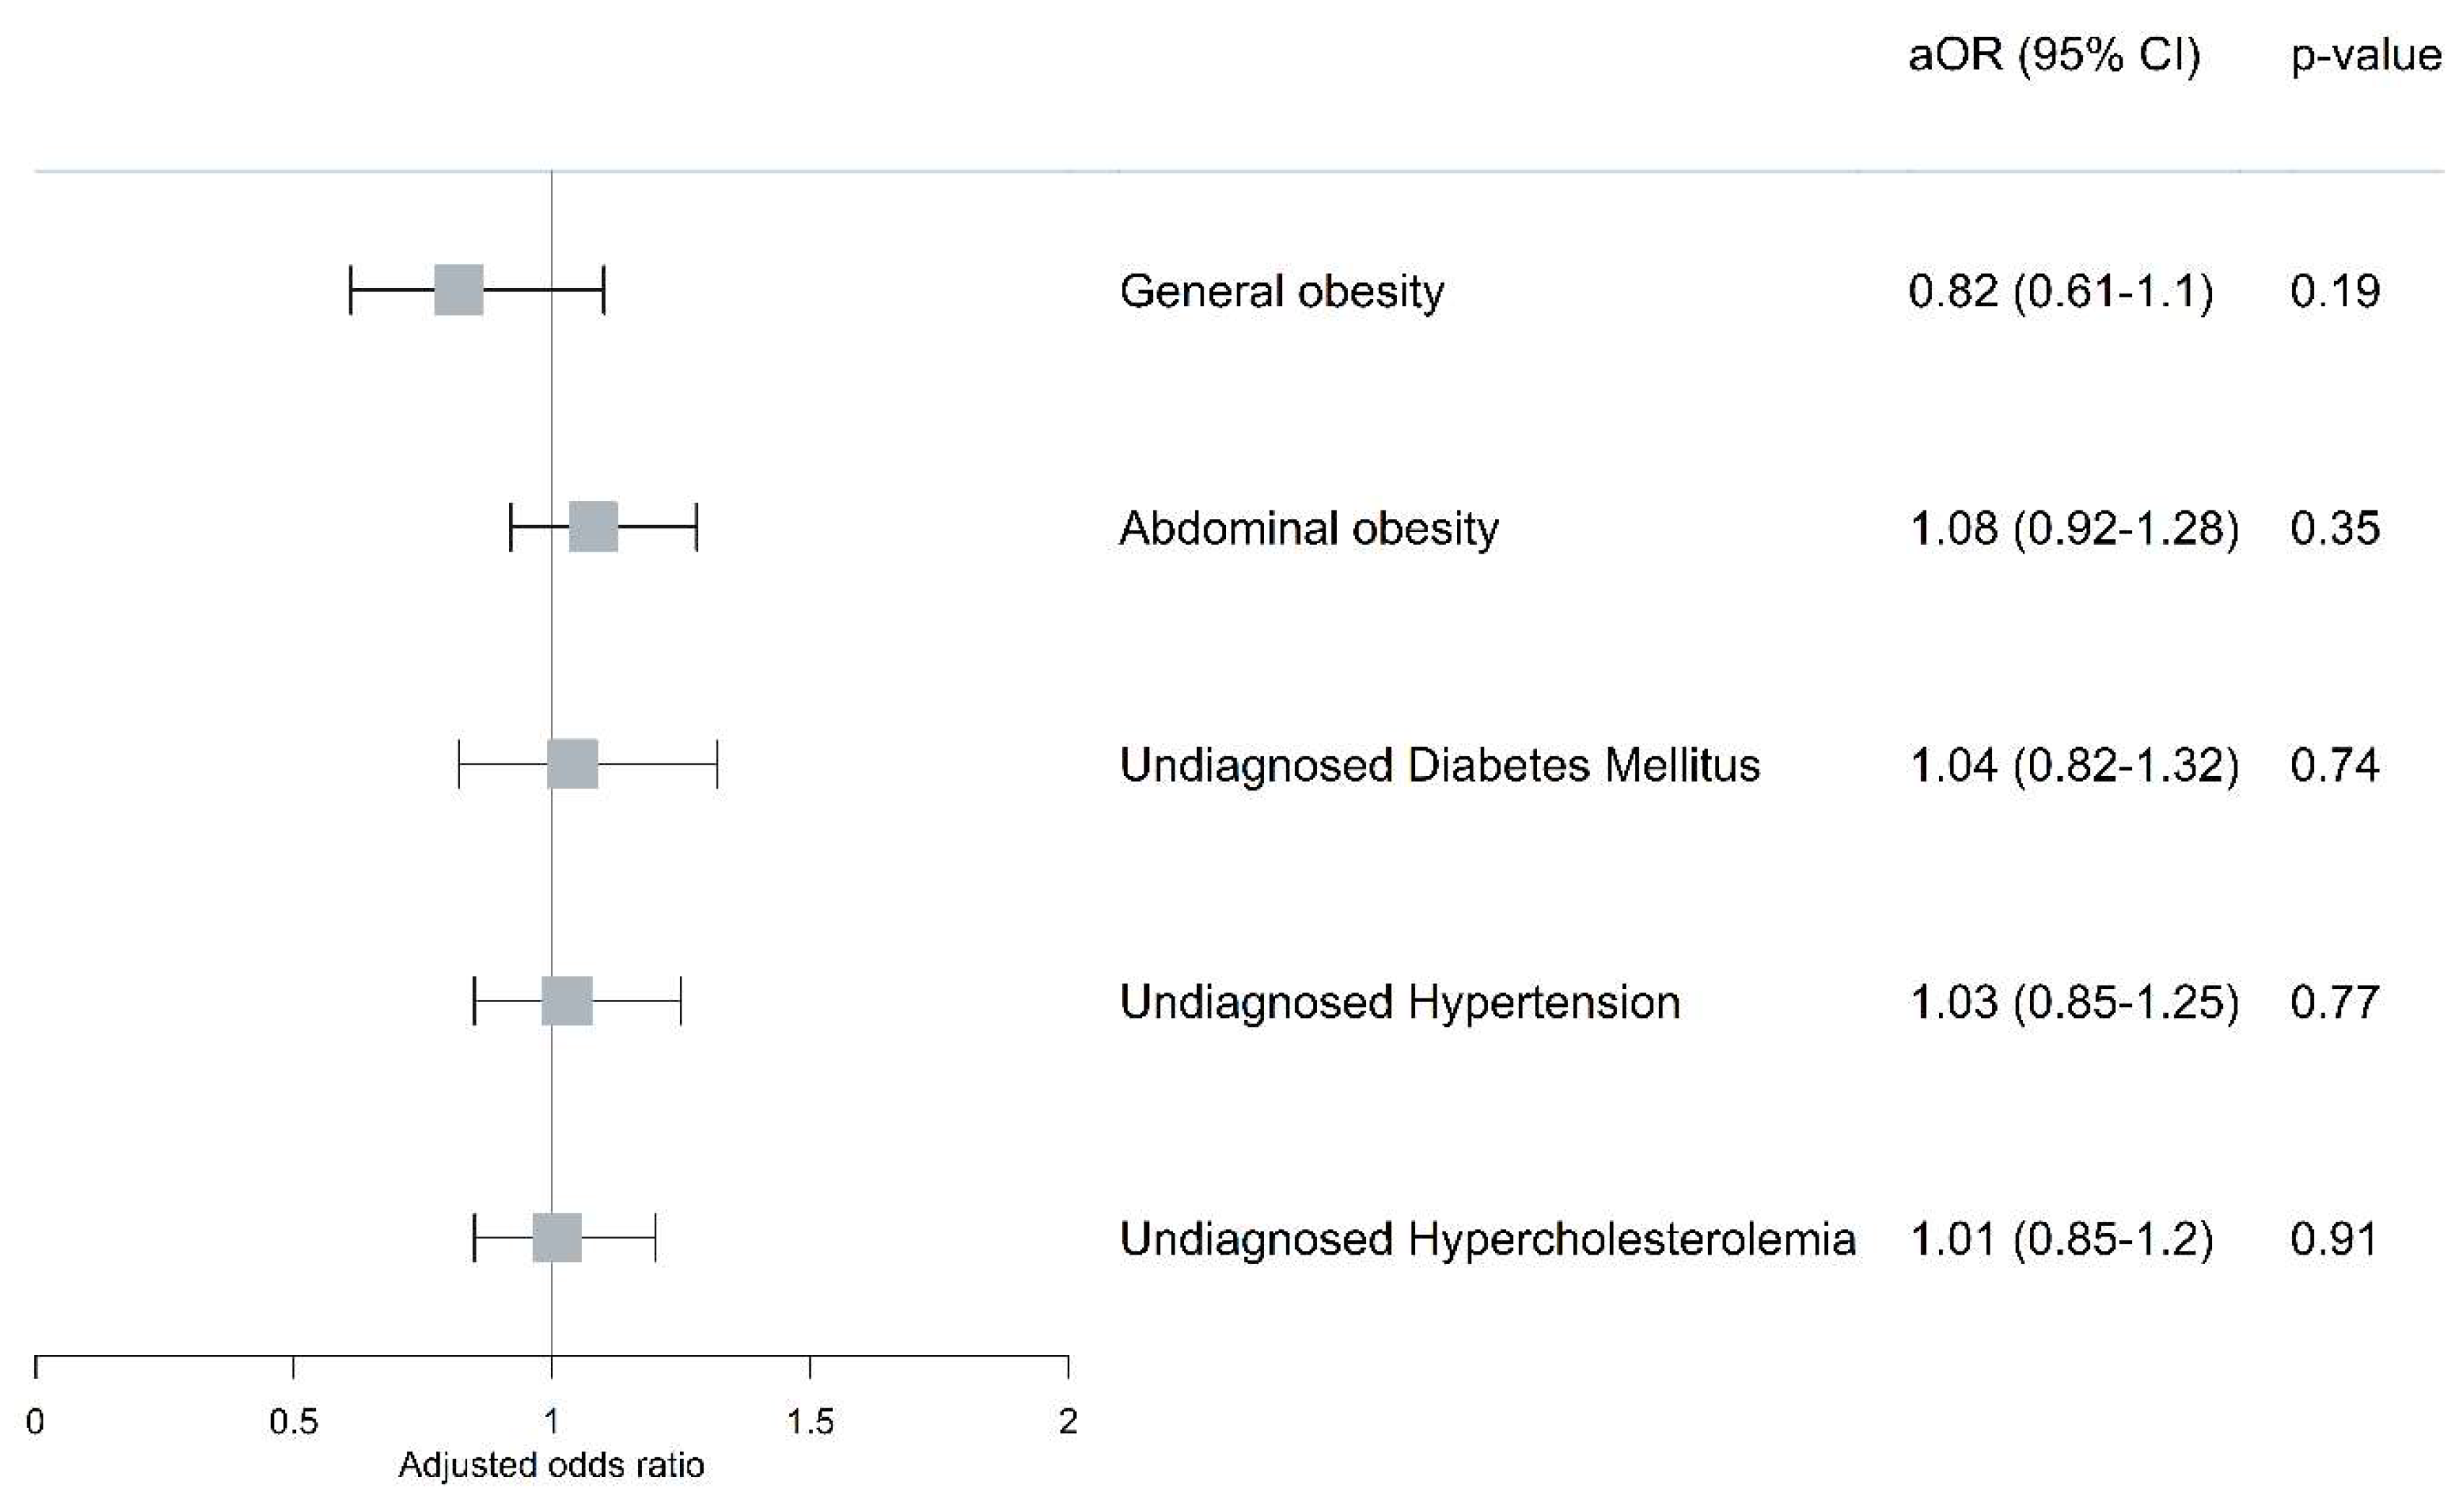

Table 1.
Characteristics of NHMS 2019 respondents, Malaysian adults aged 18 years and above with morbidities (n = 6,596).
Table 1.
Characteristics of NHMS 2019 respondents, Malaysian adults aged 18 years and above with morbidities (n = 6,596).
| Characteristic | Estimated Population | Count (n) | Prevalence (%) | 95% CI1 |
| Gender | ||||
| Male | 7,236,316 | 3,083 | 51.0 | 49.6-52.5 |
| Female | 6,942,798 | 3,513 | 49.0 | 47.5-50.4 |
| Age group (years old) | ||||
| 18-29 | 5,460,514 | 2,008 | 38.5 | 36.3-40.8 |
| 30-39 | 3,799,665 | 1,627 | 26.8 | 24.8-28.9 |
| 40-49 | 2,312,903 | 1,167 | 16.3 | 15.0-17.7 |
| 50-59 | 1,558,223 | 971 | 11.0 | 9.97-12.1 |
| > 60 | 1,047,808 | 823 | 7.4 | 6.58-8.30 |
| Ethnicity | ||||
| Malay | 8,090,716 | 4,547 | 57.1 | 52.6-61.4 |
| Chinese | 3,390,926 | 850 | 23.9 | 19.8-28.6 |
| Indian | 816,321 | 390 | 5.8 | 4.48-7.38 |
| Bumiputera | 1,766,091 | 765 | 12.5 | 10.4-14.8 |
| Others | 115,059 | 44 | 0.8 | 0.44-1.48 |
| Residential area | ||||
| Urban | 11,156,093 | 4,062 | 78.7 | 77.0-80.3 |
| Rural | 3,023,021 | 2,534 | 21.3 | 19.7-23.0 |
| Marital status | ||||
| Single | 5,129,538 | 1,914 | 36.2 | 33.9-38.6 |
| Married | 8,430,747 | 4,239 | 59.5 | 57.0-61.9 |
| Widow(er)/Divorcee | 618,829 | 443 | 4.4 | 3.78-5.04 |
| Education level | ||||
| No formal education | 302,693 | 214 | 2.1 | 1.72-2.66 |
| Primary education | 1,800,633 | 1,070 | 12.7 | 11.6-14.0 |
| Secondary education | 7,463,394 | 3,386 | 52.8 | 50.6-55.0 |
| Tertiary education | 4,561,585 | 1,903 | 32.3 | 30.0-34.7 |
| Occupation status | ||||
| Yes | 9,659,412 | 4,252 | 68.1 | 66.2-70.0 |
| No | 4,518,571 | 2,343 | 31.9 | 30.0-33.8 |
| Monthly household income | ||||
| Bottom 40% | 8,401,239 | 4,110 | 62.2 | 59.1-65.2 |
| Middle 40% | 3,820,170 | 1,647 | 28.3 | 25.6-31.1 |
| Top 20% | 1,287,802 | 537 | 9.5 | 7.61-11.9 |
| Smoking | ||||
| Never | 10,383,579 | 4,878 | 73.2 | 71.4-75.0 |
| Current | 3,226,601 | 1,422 | 22.8 | 21.1-24.5 |
| Past | 568,933 | 296 | 4.0 | 3.40-4.73 |
| Adequate daily FV intake | ||||
| Adequate | 324,986 | 130 | 2.3 | 1.81-2.90 |
| Inadequate | 13,843,103 | 6,458 | 97.7 | 97.1-98.2 |
| Physical activity | ||||
| Inactive | 3,399,399 | 1,587 | 24.3 | 22.7-25.9 |
| Active | 10,588,833 | 4,929 | 75.7 | 74.1-77.3 |
| Daily SSB intake | ||||
| No | 6,572,784 | 3,180 | 46.4 | 44.3-48.5 |
| Yes | 7,595,306 | 3,408 | 53.6 | 51.5-55.7 |
195% CI: 95% confidence interval.
Table 2.
Daily sugar-sweetened beverages (SSB) intake by sociodemographic factors among NHMS 2019 respondents, Malaysian adults aged 18 years and above with morbidities (n = 6596).
Table 2.
Daily sugar-sweetened beverages (SSB) intake by sociodemographic factors among NHMS 2019 respondents, Malaysian adults aged 18 years and above with morbidities (n = 6596).
| Daily SSB intake (n = 3408) | No SSB intake (n = 3180) | ||||||
| Characteristic | Estimated Population | Count (n) | Prevalence (%) | 95% CI1 | Prevalence (%) | 95% CI1 | p-value |
| Gender | <0.001 | ||||||
| Male | 7,236,316 | 3,083 | 42.7 | 39.8-45.7 | 57.3 | 54.3-60.2 | |
| Female | 6,942,798 | 3,513 | 50.2 | 47.6-52.9 | 49.8 | 47.1-52.4 | |
| Age group (years old) | <0.001 | ||||||
| 18-29 | 5,460,514 | 2,008 | 36.5 | 33.4-39.6 | 63.5 | 60.4-66.6 | |
| 30-39 | 3,799,665 | 1,627 | 46.8 | 42.6-51.0 | 53.2 | 49.0-57.4 | |
| 40-49 | 2,312,903 | 1,167 | 53.7 | 49.2-58.1 | 46.3 | 41.9-50.8 | |
| 50-59 | 1,558,223 | 971 | 58.6 | 54.2-62.9 | 41.4 | 37.1-45.8 | |
| > 60 | 1,047,808 | 823 | 62.6 | 57.3-67.5 | 37.4 | 32.5-42.7 | |
| Ethnicity | <0.001 | ||||||
| Malay | 8,090,716 | 4,547 | 49.3 | 46.9-51.6 | 50.7 | 48.4-53.1 | |
| Chinese | 3,390,926 | 850 | 48.3 | 42.5-54.0 | 51.7 | 46.0-57.5 | |
| Indian | 816,321 | 390 | 51.9 | 43.9-59.8 | 48.1 | 40.2-56.1 | |
| Bumiputera | 1,766,091 | 765 | 28.3 | 23.6-33.6 | 71.7 | 66.4-76.4 | |
| Others | 115,059 | 44 | 28.5 | 18.3-41.4 | 71.5 | 58.6-81.7 | |
| Residential area | 0.46 | ||||||
| Urban | 11,156,093 | 4,062 | 46.1 | 43.5-48.6 | 53.9 | 51.4-56.5 | |
| Rural | 3,023,021 | 2,534 | 47.6 | 44.5-50.7 | 52.4 | 49.3-55.5 | |
| Marital status | <0.001 | ||||||
| Single | 5,129,538 | 1,914 | 35.4 | 31.9-39.2 | 64.6 | 60.8-68.1 | |
| Married | 8,430,747 | 4,239 | 52.5 | 49.8-55.1 | 47.5 | 44.9-50.2 | |
| Widow(er)/Divorcee | 618,829 | 443 | 54.0 | 46.5-61.3 | 46.0 | 38.7-53.5 | |
| Education level | 0.16 | ||||||
| No formal education | 302,693 | 214 | 53.3 | 43.8-62.6 | 46.7 | 37.4-56.2 | |
| Primary education | 1,800,633 | 1,070 | 51.2 | 46.7-55.7 | 48.8 | 44.3-53.3 | |
| Secondary education | 7,463,394 | 3,386 | 45.5 | 42.7-48.3 | 54.5 | 51.7-57.3 | |
| Tertiary education | 4,561,585 | 1,903 | 45.6 | 41.4-49.9 | 54.4 | 50.1-58.6 | |
| Occupation status | <0.001 | ||||||
| Yes | 9,659,412 | 4,252 | 44.1 | 41.7-46.6 | 55.9 | 53.4-58.3 | |
| No | 4,518,571 | 2,343 | 51.3 | 48.2-54.4 | 48.7 | 45.6-51.8 | |
| Monthly household income | 0.12 | ||||||
| Bottom 40% | 8,401,239 | 4,110 | 47.2 | 44.6-49.8 | 52.8 | 50.2-55.4 | |
| Middle 40% | 3,820,170 | 1,647 | 42.8 | 38.9-46.7 | 57.2 | 53.3-61.1 | |
| Top 20% | 1,287,802 | 537 | 43.7 | 37.5-50.1 | 56.3 | 49.9-62.5 | |
| Smoking | <0.001 | ||||||
| Never | 10,383,579 | 4,878 | 49.1 | 46.6-51.6 | 50.9 | 48.4-53.4 | |
| Current | 3,226,601 | 1,422 | 39.1 | 34.9-43.4 | 60.9 | 56.6-65.1 | |
| Past | 568,933 | 296 | 37.8 | 30.0-46.2 | 62.2 | 53.8-70.0 | |
| Adequate daily FV intake | 0.24 | ||||||
| Adequate | 324,986 | 130 | 52.9 | 41.7-63.8 | 47.1 | 36.2-58.3 | |
| Inadequate | 13,843,103 | 6,458 | 46.2 | 44.1-48.3 | 53.8 | 51.7-55.9 | |
| Physical activity | 0.98 | ||||||
| Inactive | 3,399,399 | 1,587 | 46.6 | 43.0-50.2 | 53.4 | 49.8-57.0 | |
| Active | 10,588,833 | 4,929 | 46.5 | 44.1-48.9 | 53.5 | 51.1-55.9 | |
| 195% CI: 95% confidence interval | |||||||
Disclaimer/Publisher’s Note: The statements, opinions and data contained in all publications are solely those of the individual author(s) and contributor(s) and not of MDPI and/or the editor(s). MDPI and/or the editor(s) disclaim responsibility for any injury to people or property resulting from any ideas, methods, instructions or products referred to in the content. |
© 2025 by the authors. Licensee MDPI, Basel, Switzerland. This article is an open access article distributed under the terms and conditions of the Creative Commons Attribution (CC BY) license (http://creativecommons.org/licenses/by/4.0/).
Copyright: This open access article is published under a Creative Commons CC BY 4.0 license, which permit the free download, distribution, and reuse, provided that the author and preprint are cited in any reuse.


