
Submitted:
22 March 2025
Posted:
24 March 2025
You are already at the latest version
Abstract
Aviation operations are increasingly impacted by Clear Air Turbulence (CAT) encounters, a growing concern in both media and academic circles. Research into CAT focuses on generation, prediction, detection and monitoring of the occurring events (thanks to weather related methodologies and instruments) along with technologies and operational aspects to mitigate their effects, from the perspective of both the flight segment (aircraft and pilot and related onboard systems) and the ground segment (ATM and ATC and related tools). Climate changes have led to more frequent and severe CAT events, highlighting the need for sustainable aviation solutions, aiming to achieve improved theoretical knowledge and technological and operational management advancements. This paper addresses the CAT topic under two main perspectives: the one of scientific understanding of the phenomena and the one of the technological management of such occurrence in aviation operations. With reference to the first addressed domain, the paper provides a comprehensive review of the currently used and perspective proposed methodologies and tools for understanding, detecting and predicting CAT phenomena. With reference to the second addressed domain, then, the paper aims analyzing the state-of-the-art and trends in the technological and operational management and mitigation of the CAT occurrences at tactical level (i.e., while in flight) by the aviation, covering the technologies and procedures implemented onboard and in the ground segment. Overall, therefore, the paper assesses the state-of-the-art and identifies the most promising innovations that promote safer, more sustainable future aviation operations, by bridging weather and climate science with aviation engineering, in presence of CAT events.
Keywords:
Clear Air Turbulence (CAT)
; Air Traffic Management (ATM)
; Air Traffic Control (ATC)
; Air Transport
; Aircraft Operations
; Weather Avoidance
; Aviation Sustainability
; CAT detection
; CAT mitigation
; Passenger Experience
1. Introduction
Aviation operations typically occur in a hostile environment for aircraft, where they are requested to face several challenges. Such challenges are related to meteorological conditions as well as unpredictable events in the operational environment. Examples of the wheatear related challenges are turbulence, wind, snow, icing, fog and low visibility, thunderstorms and lightning, volcanic ash, heavy precipitations and tornadoes. Such events may lead to consequences that can be of different severity and can lead to operational impacts of various types, ranging from needed modification of the working conditions at tactical level to perturbations of the nominal traffic flow to operational disruptions or even to airspace temporary closure [1,2].
Turbulences can be of various types: Clear Air Turbulence (CAT), thermal, mountain wave, wake turbulence. The first type (CAT) is recently attracting attention not only from the aviation community but also from the general public, due to some occurred events that caused severe consequences for passengers and raised understandable concerns in the aviation common users. For instance, generalist media given relevant attention to the recent event of CAT occurred on May 21st 2024, over Birman, to the Singapore Airlines flight from London (United Kingdom) to Singapore, leading to emergency landing in Bangkok (Thailand) airport with one person died and several injured people onboard. Additional recent events that captured the attention of public included the one occurred, over Tennessee (United States of America), to Lufthansa flight from Austin (Texas, United States of America) to Frankfurt (Germany) in March 2023, leading to emergency landing in Washington Dulles (United States of America) airport and several injured people onboard, and the one occurred, over Mexico, to United Airlines flight from Santiago (Chile) to Houston (Texas, United States of America) once again in March 2023, leading to several injured people onboard but without requiring alternate emergency airport landing. Other cases that captured the interest of public and media can be found in [3].
Such events increased the feeling that CAT occurrence is growing in recent period, due for instance to climate change multiple effects, and that additional mitigations, at multiple levels (scientific understanding, prediction, detection, as well as technological mitigation and procedural management), will be needed in the near future to accommodate for such increased challenge to comfortable and safe flights.
From the operational point of view, CAT events refer to the bumpy experience during flight occurring when aircraft is flying through a cloudless sky, which is the main meaning of “clear air turbulence”. This refers to about 75% of CAT cases, which are experienced in clear weather. Indeed, studies about aviation reports indicate that the remaining 25% of cases may be experienced also in cirrus clouds and haze layers; in any case, the common element is that the occurrence of the event cannot be predicted by pilots by referring to visual signs able to allow detecting airspace volumes in front of the aircraft where the event is or is going to occur. Typically, in the aviation operations it is experienced that CAT occur above 15000 feet, when there are drastic changes in wind speed (horizontal or vertical wind shears), often in the vicinity of jet stream and in patches that on average are about 2000 feet deep, 20 nautical miles wide and 50 nautical miles long. Given the typically wide frontal and lateral extensions of CAT and its limited vertical deep, the practical management of CATs’ by pilots is usually based on immediate search for smoother air volumes by climbing or descending. Nevertheless, in absence of detailed situational awareness, it is obvious that the decision to climb or descend may result delayed or sub-optimal. Practical suggestions are provided in terms of: opting for climb, when external temperature is detected to rise in the last minutes; opting for descend, if the temperature is falling; if the temperature is stable, both the options are equivalent [4].
Such considerations clearly indicate that the operational management of CAT needs to be addressed from a scientific point of view first of all, and then, based on improved understanding, more appropriate technological tools need to be designed and implemented, in order to allow pilots as well as Air Traffic Controllers (ATCOs) to predict, detect, characterize and properly manage the CAT occurrence.
From the scientific point of view, Clear Air Turbulence (CAT) refers to turbulence that occurs in clear skies, away from visible clouds or storm systems. Unlike other types of turbulence, CAT is invisible and difficult to predict, making it a significant hazard for aviation operations [5]. CAT typically occurs in regions where there is a significant wind shear, particularly at high altitudes near jet streams, in areas of thermal instability and strong wind gradients between air masses, often due to the interaction between jet streams and lower-altitude air [6], and is often associated with jet streams, frontal systems, or mountain waves.
The occurrence of CAT has been perceived as more frequent in the last years and this motivated further research to investigate if the climate change can be deemed as responsible for such occurrence increase. It is noteworthy that climate system is changing due to anthropogenic forcing [7], leading to an increase in frequency and strength of turbulence [7,8] and, more specifically, a strengthening of the vertical wind shear within jet streams, which causes the clear-air turbulence [9]. Indeed, several studies point out that CAT will increase in the future due to the climate change. For example, Williams 2017 [9], which extends the analysis of Williams and Joshi 2013 [10], investigated an ensemble of 21 clear-air turbulence diagnostics, considering pre-industrial and doubled-CO2 climate model simulations, highlighting an increase of transatlantic wintertime clear-air turbulence in five strength categories, from light to severe.
Storer et al., 2017 [11] assessed the future changes of CAT phenomena in eight geographic regions, considering five strength categories and two flight levels, by comparing the results of a climate model simulation performed over the period 2050-2080, under RCP8.5 scenario, with 30 years of a preindustrial simulation. They found a general increase of CAT phenomena, especially in midlatitudes, in all the seasons and for all the flight levels and strength categories investigated. It is noteworthy that some uncertainties still remain, that could be managed by using different forcing scenarios and different climate models.
The increase of CAT phenomena has been already observed in the last decades, as investigated by Prosser et al., 2023 [12], which analyze global trends over the period 1979-2020 in the ERA5 Reanalysis dataset [13]. The authors found a large increase of CAT around the midlatitudes at 197hPa, especially over the North Atlantic and continental United States.
These future variations have to be taken into account by aircraft manufactures and forecasters, in order to prevent an increase in damage to the aircraft and injuries to people on board [7]. In this view, enhancing turbulence forecasting is essential in order to improve safety and comfort of passengers and reduce the costs required for compensation [8]. Indeed, the increase of CAT will lead to bumpier flights; furthermore, flight paths will become more convoluted to avoid more frequent and stronger turbulence, increasing length of journey, fuel consumption and emissions [10].
The importance of studying CATs was already recognized several decades ago. For instance, in the mid 1960s, the Air Force Flight Dynamics Laboratory conducted the HICAT (High Altitude Clear Air Turbulence) project [14], with the aim to better understand the statistical characteristics of air turbulence and improve aircraft structural design criteria. Upper air wind turbulence was recorded and combined with meteorological forecasts and observations. The data were collected during flights performed with an Air Force U-2 aircraft.
Nowadays, based on the considerations above expressed, it is clear that CAT investigation and operational mitigation by aviation is an even more important and urgent topic. This motivated the present work, which is aimed to assess the state-of-the-art and trends of the current scientific knowledge of the phenomenon, of the technological means for its prediction, detection, and characterization and of the existing strategies for CAT effects mitigation in aviation operations. The paper is organized in two investigation areas: the first one addresses the scientific comprehension and characterization of the phenomenon, whereas the second one focuses on the technological and operational related aspects. Based on that, the first area is organized as follows: propaedeutic analysis of the CAT causes is first reported (section 2), followed by detailed analysis of detection and forecast methods (section 3), encompassing both the Numerical Weather Prediction ones and the satellite-based ones. Then, the paper addresses the second investigation area (section 4), considering the aviation-related technological and operational aspects, encompassing in detailed and specific way both the flight and the ground segments.
2. Clear Air Turbulence Causes
Aircraft turbulence is irregular motion of an aircraft in flight, especially when characterized by rapid up-and-down motion caused by a rapid variation of atmospheric wind velocities. Turbulence intensities is related to the size of the aircraft and varies from light to extreme, passing from annoying bumpiness to severe jolts [15].
Turbulence can be classified into two types, depending on its underlying causes [16]:
- -
- Convective: due to convective currents that cause vertical motions of rising and sinking air, associated with cumuliform cloud and thunderstorm;
- -
- Mechanical: due to obstructions in the wind flow such as buildings or mountains, but also pressure gradient differences, associated with horizontal and vertical wind shear, i.e., a strong and sudden change in wind speed and/or direction over a small area.
Clear Air Turbulence is a form of mechanical turbulence that includes all turbulence without any associated visible phenomena. It is an insidious aviation hazard, because it is often encountered unexpectedly and without visual indicators that could warn the pilots. The term CAT is used to indicate medium or high-level turbulence (normally above 15000 ft) in regions with significant wind shear; generally, these areas are mostly free of clouds, however, sometimes, cirrus cloud formations could occur.
The main mechanism responsible for CAT formation is the Kelvin-Helmholtz instability (KHI) [17,18], which occurs in stable layers with strong vertical wind shear. When wind shear increases strongly, frictional forces within the stable stratified air increase and lead to small vertical disturbances forming a wave-like pattern. Due to the different velocities of the air between wave crest and wave trough, wave tops will overrun the wave base and the waves start to break, leading to CAT. Figure 1 shows an example of cloud formations originated from the Kelvin-Helmholtz instability.
One of the main causes of vertical wind shear is the jet stream, therefore the risk for CAT is especially high in its vicinity. Jet streams are relatively narrow bands of strong wind in the upper levels of the atmosphere that follow the boundaries between warm and cold air. Within jet streams, the winds blow mainly from west to east, but the flow often shifts north and south in response to the complex interaction between many variables, such as the location of high- and low-pressure systems and seasonal changes. In the troposphere there are two types of jet streams: the polar one, located in the 50°–60° N/S latitude range, and the subtropical one, situated near 30° N/S latitude. These jet streams are typically found at or near the tropopause and are characterized by wind speeds ranging from at least 60 knots to over 240 knots. A schematic illustration of polar and subtropical jet streams is shown in Figure 2. Jet streams are regions characterized by a strong discontinuity in wind speed that varies rapidly over short distances, increasing toward a central core of greatest strength. The vertical and horizontal wind shear of jet streams is the primary cause of CAT, with the more severe turbulence occurring in regions where the wind velocity gradient is strongest. Jet streams with core wind speeds exceeding 110 knots have the potential to generate significant turbulence. The likelihood of encountering CAT increases proportionally with the rate at which wind speed decreases moving away from the jet core [19]. Specifically, CAT is frequently found in the vicinity of the tropopause, on the cold side of the jet stream, above and underneath the jet core, as shown in Figure 3.
Another typical meteorological condition leading to CAT is the presence of a curving jet streams with upper troughs and ridges that tend to have an enhanced wind shear coming from horizontal gradients of wind direction and velocity. Furthermore, CAT in jet streams is greatly intensified in mountain wave conditions. Significant CAT was also found in regions of horizontal deformation, convergence, upper-level frontogenesis and strong horizontal thermal gradients [17]. Often aircrafts experience CAT when flying in the proximity of a tropopause fold, i.e., the downward intrusion of stratospheric air into the troposphere, occurring near an upper-level frontal zone under the polar and subtropical jet streams and marking the change in the height of the tropopause [20]. The confluence of two jet streams is also a noteworthy cause of CAT. On occasion, the polar jet stream will dip south and pass under the subtropical jet stream: the wind shear effect between the two jet streams in the region of confluence is often highly turbulent [16].
Common dimensions of a turbulent area associated with a jet stream are on the order of 100 to 300 miles long, elongated in the direction of the wind, 50 to 100 miles wide, and 5,000 feet deep. These areas may persist from 30 minutes to 1 day [19].
3. Clear Air Turbulences Detection and Forecast Methods
Detection and forecast of CAT currently rely on two main resources: the Numerical Weather Prediction (NWP) models and the satellite-based detection. The following sections will examine in more details these resources.
3.1. CAT Forecast from NWP
The effects of turbulence depend on the size of the aircraft, since they are more pronounced when the dimensions of the aircraft are comparable to the size of the turbulent eddies encountered; e.g., for commercial aircraft, this corresponds to eddy dimensions of ~100 m [21]. It is therefore evident that CAT is a small-scale meteorological hazard and hence it is hardly resolvable at the grid spacing of Numerical Weather Prediction (NWP) models. One of the approaches adopted to forecast CAT is to analyze the synoptic or mesoscale meteorological conditions that are conductive to CAT, e.g., jet streams, and to empirically relate them to the occurrence of CAT [17]. Indeed, CAT indices based on NWP data were designed with the aim of capturing grid-scale processes that produce the mesoscale (10–100 km) meteorological conditions conducive to subgrid-scale turbulence that affects aircraft [22].
One of the earliest systematic forecasting techniques for CAT was developed by Harrison, 1959 [23], who simply used, as reference parameter, the horizontal wind shear combined with several categories of jet stream orientations. Then George, 1960 [24] hypothesized that both strong horizontal and vertical shear were necessary to identify CAT [25]. Reiter, 1969 [26] published a review on the Nature of Clear Air Turbulence, highlighting the complexity of the processes that govern the atmospheric meso- and micro-scale.
Currently, one of the most widely used indicators of CAT is the Turbulence Index (TI) of Ellrod and Knapp [17]. TI is popular because of its good performance, familiarity among forecasters, computational speed, and easy implementation [22]. Two versions of TI exist: the first index version, TI1, is calculated from the product of horizontal deformation and vertical wind shear derived from NWP forecast winds; the second one, TI2, includes a convergence term to account for cases of streamline confluences and/or air parcel decelerations, as in the case of the exit region of a jet stream. The resulting values describe a potential of encountering turbulence and provide an objective technique for CAT forecasting. However, it is difficult to establish universal thresholds applicable to all aircraft types, as aircraft response and pilot perceptions differ greatly. Furthermore, Ellrod and Knapp [17] found that significant differences in TI threshold values become evident when the NWP model is changed. Successively, Ellrod and Knox, 2010 [22] introduced an improved version of the TI, adding a proxy term for the divergence tendency, a simplified “divergence trend”, to account for CAT in situations of rapidly changing divergent flows. This new Divergence-Modified Turbulence Index is called DTI.
Another indicator often used as measure of possible turbulent conditions is the nondimensional Richardson number (Ri), defined as the ratio of the vertical stability (density gradient) and vertical wind shear. Endlich, 1964 [27] investigated the structure of atmosphere in regions of CAT by means of aircraft observations and found empirical evidence that the Richardson number usually assumes values less than unity in turbulent regions. However, the usage of Ri in operational forecast is limited, since small values of Ri are also observed in non-turbulent regions [17].
Today, forecasters at aviation centres have access to numerous turbulence diagnostic indices. However, a significant limitation of many of these indices is that they consider only certain CAT-producing mechanisms and only under specific conditions [22]. The turbulence forecast system named as “Graphical Turbulence Guidance (GTG)” is a statistical approach that uses a continually updated, weighted regression of several diagnostics [21]. It was developed at the US National Center for Atmospheric Research (NCAR) and is used by the US National Oceanic and Atmospheric Administration (NOAA) weather service. The essence of the GTG forecasting method is to integrate a combination of many separate turbulence diagnostics, being each diagnostic weighted to get the best agreement with available observations (i.e., the Pilot Reports of actual in-flight weather conditions (PIREPs)). The selected suite of diagnostics depends on the overall performance of each individual one. Some of the diagnostics included in GTG are the above-mentioned Richardson number [27] and TI of Ellrod and Knapp [17], but also the North Carolina State University index (NCSU1; [28]), an index based on a formulation of turbulence kinetic energy [29] and another one based on structure function–derived eddy dissipation rate [30]. The idea is to select the set of diagnostics ensuring that the indices appropriately represent the variety of atmospheric processes that may be contributing to turbulence conditions (i.e., the idea is to consider diagnostics uncorrelated with each other). Sharman and Pearson, 2017 [31] introduced an extension of the GTG product described in [Error! Reference source not found.], introducing the forecasts at all flight altitudes and providing the output in terms of Eddy Dissipation Rate (EDR) instead of a likelihood metric. The use of EDR is motivated by the fact that it is the ICAO standard and it is simple to be used, providing values in the range from near 0 (typically smooth) to 1 (typically ‘‘extreme’’ for most aircraft) in units of meters to the two-thirds power per second (m2/3 s-1). Furthermore, EDR may be related to aircraft-specific loads, allowing users interested in specific aircrafts to calibrate EDR in terms of their specific aircraft response [31]. Sharman and Pearson, 2017 [31] found that the usage of the ensemble-weighted mean of several diagnostics (GTG) provides better performance than any individual diagnostic; nevertheless, they concluded that the development of new diagnostics is limited by the current understanding of turbulence processes, especially in the stably stratified shear flow characteristic of the free atmosphere above the Planetary Boundary Layer (PBL). A fairly high horizontal resolution (<3 km, or even <1 km) was required to capture these events, indicating the need for higher-resolution operational NWP models to ultimately be able to produce acceptably accurate turbulence forecasts. With the introduction of such models, it is likely that the subgrid- and resolved-scale Turbulent Kinetic Energy (TKE) may start to become a more reliable predictor. This version of GTG is used as base for the new World Area Forecast System (WAFS) hazard gridded data sets (Kim et al.,2018) [32].
The importance of adopting high-resolution in numerical weather forecasts was also assessed by Yang et at., 2024 [33], which analyze four severe CAT events occurred over North China on 6 June 2017 by using the Weather Research and Forecasting (WRF)–Advanced Research WRF (WRF-ARW) mesoscale model [34]. The study highlights how, in some cases, it is necessary to use high-resolution simulations (3 km) to compute accurate CAT indices, such as for example Richardson number (Ri).
Following the method presented in Sharman and Pearson (2017), the European Centre for Medium-Range Weather Forecasts (ECMWF) developed, in collaboration with the German Aerospace Center (DLR), a calibrated CAT parameter for its numerical weather prediction model, i.e., the Integrated Forecasting System (IFS). A specific number of turbulence predictors was considered and projected onto the observed climatological distribution of the EDR, in order to define a suitable CAT parameter [35]. Currently, this parameter is computed from both the high resolution (9 km) IFS deterministic forecasts and the IFS ensemble, allowing the evaluation of the ensemble mean and probabilistic skill of turbulence forecasts. Considering the highly transient and localized nature of the turbulence, a probabilistic approach can help to judge the significance and to obtain reasonably smooth fields [31].
Muñoz-Esparza at al. 2020 [36] investigated the applicability of Machine Learning (ML) techniques to forecast upper levels turbulence for aviation purposes and implemented a ML-based GTG-like algorithm with the aim to enhance the current GTG method. They demonstrated that ML models can simplify the current GTG framework and also improve its predictive skill, in particular in terms of reduction of false alarms frequency in null or very light turbulence conditions [36].
3.2. CAT Detection from Satellite
Since CAT occurrence typically does not involve the presence of clouds, it cannot be avoided through visual observation. Unlike convectively-induced turbulence, which benefits from higher temporal and spatial resolution cloud data provided by satellite and ground-based weather radar, CAT forecasts have traditionally relied heavily on outputs of NWP models [37]. However, as CAT involves physical processes with scales usually smaller than the resolution of NWP models, forecasts of CAT with NWP also have some limitations. Therefore, it could be of interest to identify the occurrence of CAT taking into account information provided by satellite sensors. Anyhow, the detection of CAT is very difficult even with remote sensing and, although some products exist, it is not performed operationally [38].
In some cases, satellite images may give useful clues to the presence of CAT, as occasionally some cirrus formations occur in the prone areas for CAT. The signatures which are considerable as common in infrared and visible imagery are transverse cirrus cloud banding and billows, oriented perpendicularly to the wind direction, that may indicate the presence of a Kelvin-Helmholtz instability [39].
Moreover, as early as the late 1980s, Ellrod [40,41] demonstrated that water vapor imagery from geostationary satellites could be highly valuable for analysing upper tropospheric flow features critical to aviation meteorologists: he found that, in areas characterized by a decrease in time of water vapour (WV) image brightness (darkening), there was a rather high probability of high-altitude CAT. However, the relationship between WV darkening and the production of CAT was not yet well understood at that time. Currently, it is known that dark striped areas in water vapor satellite channels are the signature of tropopause folding events, characterized by strong gradient in the upper-level moisture due to the downward intrusion into the troposphere of dry stratospheric air. A typical example is shown in Figure 4 (from [42]) illustrating a folding “F” in which a CAT event (circled red dot) is recorded. Gerogiannis and Feidas, 2023 [42] analysed several turbulence events during November 2009 and found that the frequency encounter of the tropopause folding in clear-air environment accounted for 57.1% of the total CAT events, indicating its potential use as a nowcasting indicator of possible turbulence in clear-air weather.
The gradient of upper-level humidity is used as an input in tropopause folding turbulence product developed by NOAA NESDIS (National Environmental Satellite, Data, and Information Service), using Ch08 (6.15 µm) of the Geostationary Operational Environmental Satellites (GOES)-R Advanced Baseline Imager (ABI) in combination with some NWP parameters, to provide a prediction of turbulence associated with tropopause folding (Tropopause Folding Turbulence Prediction, TFTP) [43]. Another algorithm that uses satellite data was developed by NWC SAF (Nowcasting Satellite Application Facilities) [44]. It relies on three MSG (Meteosat Second Generation) Spinning Enhanced Visible and Infrared Imager (SEVIRI) channels along with some NWP data to individuate the areas in which turbulence might be experienced: the WV channel at 6.2 µm, which is sensitive to upper tropospheric water vapor, and the channel difference IR 9.7 µm - IR 10.8 µm, providing useful information about ozone concentration (it is a good indicator for the presence of tropopause fold, since the descending stratospheric air is more ozone-rich).
4. CAT Impact on Aviation Operations, Technological and Operational Aspects
As outlined above, there are significant problems with clear air turbulence in aviation, including discomfort, injuries, and operational interruptions. As also already indicated, pilots cannot count on visual individuation of CAT, as well as they cannot count on support for CAT detection by conventional onboard weather radars. Therefore, improvements in technologies and operational strategies are crucial to manage CAT occurrences in aviation and reduce their impact on flight operations. In this second part of the paper, CAT’s related operational and technological aspects are addressed, in terms of their state-of-the-art and perspectives with specific emphasis on both the flight and the ground segments.
4.1. Flight Segment: Technological Systems and Pilot Operations
Despite technological advances, pilots continue to receive meteorological data that, in many cases, is already out of date at take-off time. This raises significant concerns for the safety and efficiency of air transport. An European Cockpit Association (ECA) paper [45] highlights the need for minimum standards for access to meteorological information, proposing an improvement in the quality and timeliness of data provided to pilots. Among the most relevant proposals, there is the integration of advanced technologies for the collection and analysis of weather data in real time, thus enabling more informed decisions and optimal flight management. A key point highlighted is the need for greater collaboration between regulators, airlines and meteorological service providers to ensure a more efficient information infrastructure. Implementing advanced solutions could not only increase flight safety, but also reduce delays and optimize flight operations globally. This approach represents a fundamental step to bridge the gap between available technological capabilities and the actual accessibility of meteorological information to pilots, promoting a safer and more efficient system for modern aviation.
The flight segment, which focuses on aircraft technologies and processes to assist pilots at tactical level during operations, is essential in identifying and reacting to Clear Air Turbulence, therefore improvements in onboard systems are now crucial to provide pilots with real-time data and tools for early identification, avoidance, and mitigation of such phenomena. Pilots’ capacity to react proactively to CAT is being improved by contemporary technology advancements such as LIDAR equipment, tropospheric profilers, and sophisticated alert systems. These technological solutions will be examined in the following subsections.
4.1.1. LIDAR Systems for CAT Detection
An effective remote detection of CAT onboard would be desirable, allowing pilots and personnel sufficient time to take protective measures. However, CAT occurs in clear skies at high altitudes without significant hydrometeors, making it extremely difficult to be detected using traditional methods such as weather radars. One of the most promising technology for detecting CAT for an aircraft during flight is LIDAR (Light Detection and Ranging). LIDAR uses laser light to analyse atmospheric changes in order to identify clear air turbulence, in contrast to classical radar, which depends on moisture or particulates to detect disturbances. Where radar-based systems would fail in clear conditions, LIDAR’s ability to detect turbulent gusts and air eddies makes it possible. Currently, the most promising methods for active CAT detection are: coherent doppler LIDAR technology, based on interaction of laser pulses with aerosols within the atmosphere, and incoherent Rayleigh LIDAR technology, measuring atmospheric molecular density fluctuations.
About the first technological alternative (coherent LIDAR), of particular importance is the NASA Airborne Coherent LIDAR for Advanced In-Flight Measurements (ACLAIM) project (Figure 5) [46]. Pilots in ACLAIM receive real-time information on possible turbulence encounters thanks to LIDAR devices installed on aircraft that can detect turbulence up to several miles ahead [47]. By using this early notice, pilots can alter their direction or speed to mitigate the impact of turbulence on the aircraft, improving passenger safety and comfort.
An example of the second technological alternative (incoherent LIDAR) is the one proposed in the framework of the DELICAT (Demonstration of LIDAR based CAT Detection) project [48], where a high-power ultraviolet LIDAR system has been developed. DELICAT flight test results, in 2013, showed that the system could detect local subtle variations in the molecular backscatter coefficient indicating turbulence up to 10/15 km ahead of the aircraft [49,50].
Furthermore, because LIDAR systems enable proactive reactions to identified turbulence, they are also promising for reduction of gust loads. Indeed, early detection of gusts allows for the modification of aircraft control surfaces prior to the aircraft actually experiencing the disturbance. This preventative measure lessens the strain on the aircraft’s structure, improving operational effectiveness and safety.
In conclusion, therefore, combining LIDAR-based detection and advanced control response systems improves CAT management by enabling real-time adaptive tactics. Given the current limitations of CAT predictability, LIDAR technology represents a significant step forward in enhancing flight safety and operational reliability, particularly as its integration into commercial aviation progresses.
4.1.2. Tropospheric Profilers for Real-Time Monitoring
Tropospheric profilers are useful tools for real-time monitoring of Clear Air Turbulence, particularly at high altitudes where CAT occurs often. These profilers typically use wind speed and atmospheric pressure changes to calculate the Eddy Dissipation Rate (EDR), which is a major indicator of turbulence. The capacity of these profilers to detect tiny turbulence patterns aids in the prediction of CAT zones, allowing for real-time notifications and mitigation measures.
A study demonstrates how tropospheric profilers have been utilized to identify turbulence related to weather events and interactions with the jet stream, boosting safety through their accurate detection capabilities [51]. Another solution uses a solid-state LASER within a profiler to analyse atmospheric turbulence intensity profiles. This configuration provides high resolution and real-time data, making it ideal for CAT monitoring [52].
Also ground-based tropospheric profilers are relevant, such as the one employed at the Côte d’Azur Observatory in France (Figure 6), which provides turbulence monitoring statistics, using the Generalised Differential Image Motion Monitor (GDIMM). This instrument is fully automatic and measures integrated atmospheric turbulence parameters, namely: seeing, isoplanatic angle, coherence time and outer scale, with a temporal resolution of 2 minutes. A large dataset has been collected by this system, leading to the first turbulence statistics over the Plateau de Calern, allowing for a more detailed understanding of atmospheric conditions in the troposphere. This device has shown to be a useful part of real-time CAT monitoring operations, providing data critical for anticipating turbulence [53].
Furthermore, studies utilizing RADAR observations have demonstrated that turbulence near the tropopause, which is frequently linked with CAT, may be successfully tracked using RADAR-based tropospheric profilers. Such observations contribute greatly to real-time CAT monitoring and can warn ground control and pilots about oncoming turbulence [54].
In conclusion, tropospheric profilers, whether airborne or ground-based, provide precise, real-time insights into atmospheric turbulence, making them an essential component of the technical armory against CAT. Their ability to early identify turbulence helps to prevent unexpected turbulence encounters and assures safer flight operations.
4.1.3. Onboard Alert Systems
As a first protection layer for pilots encountering Clear Air Turbulence, onboard alarm systems have evolved into essential parts of contemporary aircraft. By gathering, processing, and transmitting crucial data on the atmospheric conditions surrounding the aircraft, these technologies are meant to help pilots make prompt, well-informed decisions that will lessen the impact of CAT. Onboard alert systems offer response actions that improve situational awareness and increase crew and passenger safety, even though they cannot foresee CAT on their own.
There are several technologies for this application, as described in the following.
Sensor Integration for Real-Time Feedback - A variety of sensors installed within the aircraft are used by onboard alarm systems to identify variations in air pressure, wind speed, and vertical acceleration. The technology can identify the beginning of turbulence and notify the flight crew instantly. This feedback loop enables the autopilot or flight control system to make tiny modifications to maintain stability, which is particularly helpful during unforeseen turbulence encounters. Newer systems now incorporate data from Inertial Reference Systems (IRS) and Global Positioning Systems (GPS), enabling more precise turbulence detection.
Enhanced Warning Systems with Eddy Dissipation Rate (EDR) Calculations - Modern onboard systems use the Eddy Dissipation Rate (EDR) [55], a crucial statistic that measures the rate of energy dissipation per unit mass of air, to estimate the intensity of turbulence. Certain sophisticated onboard systems, such as IATA’s Turbulence Aware system [56], continually compute EDR values and notify pilots of the results, by differentiating between turbulence levels. This statistic enables the crew members to make informed decisions regarding changes to the flight path or altitude. By computing EDR, these technologies allow for a more precise assessment of turbulence intensity rather than relying exclusively on qualitative “light,” “moderate,” or “severe” turbulence reports.
Data-Driven Alerts through Pilot-Airline Communication Links - Onboard alert systems are increasingly using data uplinks and downlinks to send real-time CAT data to Air Traffic Control (ATC) and other aircraft in the area. This communication is critical, because it allows pilots to receive real-time updates from other aircraft suffering CAT. Systems like the Aircraft Communication Addressing and Reporting System (ACARS) and Automatic Dependent Surveillance-Broadcast (ADS-B) [57] can automatically communicate turbulence data. Through these linkages, onboard alarm systems can send turbulence data to ground stations and other aircraft, increasing collective situational awareness and flight safety.
Predictive Warning with LIDAR and Atmospheric Probes - While classic onboard alert systems are reactive, ongoing development seeks to incorporate predictive technologies. For example, combining LIDAR equipment with onboard alarm mechanisms enables the detection of turbulence many miles ahead of the aircraft, providing extra lead time. This forecasting skill is especially useful for CAT, as regular weather radar is inadequate. Some research efforts, including as NASA’s Airborne Coherent LIDAR for Advanced In-Flight Measurements (ACLAIM), seek to bring these capabilities closer to operational readiness.
Pilot Interface and Decision Support Tools - Modern onboard alert systems are becoming more user-friendly, with streamlined cockpit interfaces intended to reduce pilot workload. These systems employ obvious visual and aural alerts, as well as decision support algorithms that recommend appropriate responses. For example, the cockpit display might indicate the intensity and duration of identified turbulence, letting pilots to immediately evaluate data and adjust the flight profile. Some systems also include navigation systems that propose speed or altitude changes to decrease turbulence impact.
Overall, onboard alarm systems provide an important layer of protection against the unexpected nature of CAT. While these systems are mostly reactive, ongoing developments in sensor integration, data sharing, and predictive capabilities are increasing their overall effectiveness.
4.2. Ground Segment: ATM and ATC Tools for CAT Management
The ground segment plays a central role in the CAT management, through advanced ATM and ATC tools to increase flight safety and efficiency. Differently from onboard systems, which supply real-time alerts during flight, the ground segment focuses on wide, strategic measures such as turbulence forecasting, airspace coordination, and communication. With the integration of predictive weather models, real-time data-sharing platforms, and collaborative decision-making processes, ATM and ATC systems have the possibility to identify potential turbulence zones, enabling the mitigation of their effects on the affected aircraft by suggesting proper modification of the flight profile.
There are several technologies used by these tools, like satellite-based observations, tropospheric profiling, and aircraft-sourced turbulence data, to create an image of atmospheric conditions. Moreover, ATC’s role in communicating turbulence advisories and coordinating route definition highlights the importance of relying on robust communication networks. The synergy between ATM systems, pilots, and meteorological services is fundamental for CAT management, facilitating safer, more efficient airspace utilization and minimizing turbulence impact on passengers and operations.
4.2.1. ATM and ATC Coordination
ATM and ATC coordination is primary in the risk mitigation of CAT. These systems can guarantee safe and efficient aircraft operations by integrating modern forecasting tools, real-time turbulence reports, and routing protocols.
Predictive Tools and Real-Time Data Integration - ATM systems use Numerical Weather Prediction (NWP) [58] models to forecast turbulence zones, integrating data from satellites, ground-based systems, and aircraft. Combining these inputs, ATM could create dynamic turbulence maps shared with ATC and pilots. This coordination could allow a proactive adjustment to flight plans, reducing turbulence exposure.
Collaborative Decision Making (CDM) - The CDM platforms could enable seamless communication between ATC and pilots, guaranteeing that updated turbulence data are quickly disseminated, so allowing stakeholders to make knowledgeable decisions. For instance, pilots can receive rerouting suggestions based on the most recent ATM models, while ATC could coordinate airspace adaptation to avert potential turbulent area congestion.
Tactical Rerouting and Altitude Adjustments - ATC plays a central role in turbulence mitigation strategies during flights: in coordination with ATM and pilots, ATC can instruct aircraft to move to safer altitudes or reroute aircraft to avoid, by surrounding, the turbulent zones.
These mitigation strategies need to be supported by ADS-B and ACARS systems, providing real-time updates on intensity and location of turbulence. In addition, important information about CAT, along with other atmospheric hazards, are traditionally disseminated through in-flight weather advisories, e.g., PIREP (Pilot Reports), which are messages reporting the actual weather conditions existing in the air as observed by pilots, or SIGMET (Significant Meteorological Information) and AIRMET (Airmen’s Meteorological Information), which provide forecasts of potentially hazardous weather conditions during the flight. Furthermore, automated turbulence reporting systems are common on many commercial aircraft using the Aircraft Meteorological Data Relay (AMDAR) system [19]. The AMDAR programme was initiated by the World Meteorological Organization (WMO) with the objective to automatically derive and transmit meteorological data from the aircraft platform to support improved weather forecasts and applications for aviation and the wider community.
4.2.2. Advanced Weather Models for CAT Prediction
ATM tools are increasingly incorporating advanced weather models to forecast the presence of CAT. As considered in details above, these models use data from atmospheric sensors, satellites, and tropospheric profilers to generate real-time turbulence maps. These maps are fundamental for ATC to timely provide pilots with the proper instructions, guaranteeing routes are modified before being faced with turbulence [59].
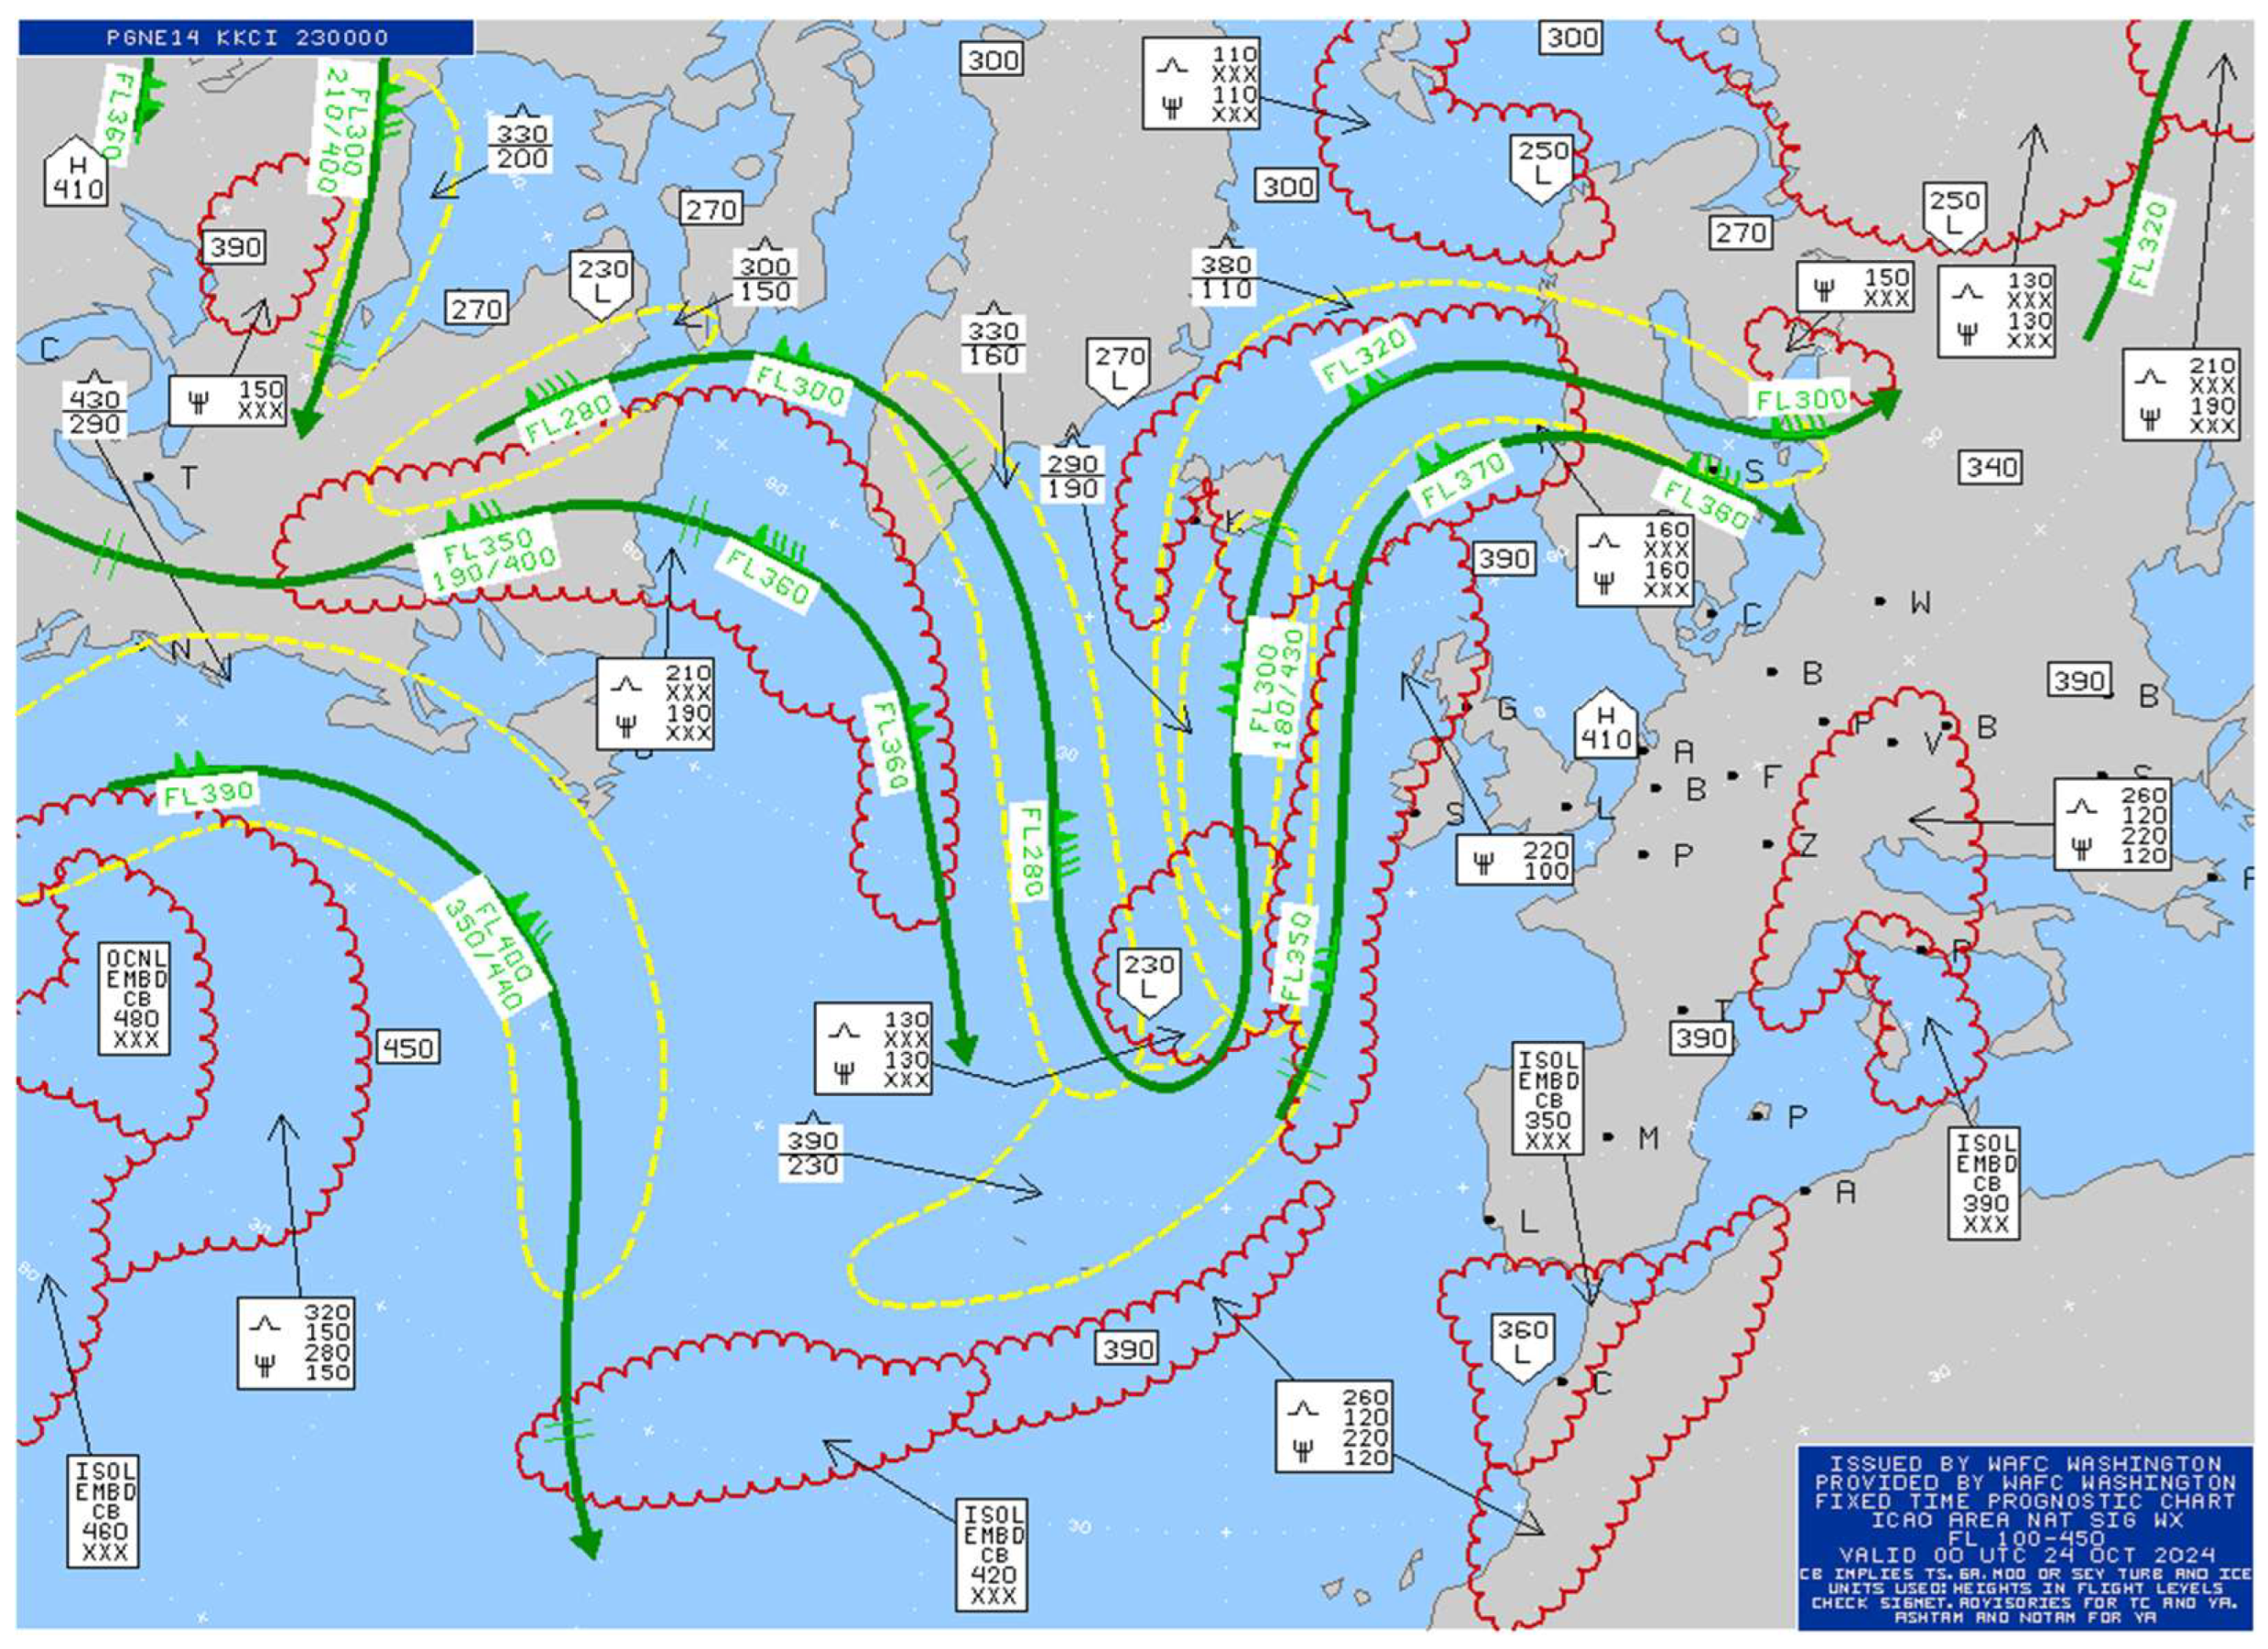
Another tool used to distribute information about turbulence is available worldwide through the World Area Forecast System (WAFS), which has the aim of providing forecasting of significant weather hazards. To provide meteorological information to the aviation community, two World Area Forecast Centres (WAFCs) exist: one is operated by the National Oceanic and Atmospheric Administration (NOAA) in the USA and the other one is operated by the UK Met Office in Europe. The traditional Significant Weather (SIGWX) forecasts issued by WAFC, usually seen in chart form and produced for a single timestamp every 6 hours (example shown in Figure 7), are currently flanked by the new gridded high-resolution forecasts, available at 3-hour timesteps from 6 to 36 hours ahead, and updated every 6 hours [60]. Gill 2014 [61] performed an objective verification of WAFCs products using in situ aircraft observations and found that the skill of the new automated gridded forecasts is better than the skill of the SIGWX forecasts. These gridded forecasts are sanctioned by International Civil Aviation Organization (ICAO) for use in flight planning. The ICAO standard dimension for automated turbulence reporting is the cube root of the Eddy Dissipation Rate (EDR), that is the rate at which turbulent kinetic energy is transformed into heat (dissipated). It is a particularly useful metric of turbulence intensity, since it is a state-of-the-atmosphere measure and is independent of aircraft type [62].
4.2.3. Collaborative Decision Making (CDM)
In general, CDM aspires to improve the efficiency and resilience of airport operations by optimizing resource use and improving air traffic predictability. This is a systematic approach where stakeholders airlines, ATC, meteorological services, and airport operators work in cooperation to make informed, consensus-based decisions. In CAT management, as outlined above, CDM guarantees efficient communication and coordination between these entities, resulting in enterprising measures to mitigate the impact of turbulences. The main opportunities for CDM exploitation in CAT management are outlined in the following.
Real-Time Information Sharing - In CDM, shared platforms are leveraged to share real-time turbulence data across stakeholders. For instance, aircraft equipped with turbulence detection systems could provide localized information reports, which are integrated into turbulence maps. These maps, dynamically updated, allow ATC and airlines to timely identify and react to newest CAT zones at tactical level.
Proactive Flight Planning - By exploiting predictive weather models, collaborative tools enable pre-flight and in-flight route adjustments. Airlines and ATC could collaborate in replanning aircraft route away from areas predicted having critical CAT, in this way benefitting safety, operational efficiency, and airspace congestion.
Enhanced Communication Channels - The System Wide Information Management (SWIM) framework can facilitate seamless data exchange among all the addressed different stakeholders. Thanks to SWIM, stakeholders can share turbulence forecasts, real-time radar observations and pilot reports (PIREPs), guaranteeing alignment of decision-making processes.
Improved Passenger Safety and Comfort - By integrating data from diverse sources, CDM can minimize the risk of unexpected turbulence, in this way inherently supporting the increase of passengers’ comfort and minimizing the risks of injuries caused by these turbulences.
Overall, the technological and operational strategies to manage CAT have evolved considerably, with LIDAR systems, tropospheric profilers, and advanced ATM tools at the forefront. The combination of real-time data from onboard systems and predictive models from ground-based tools ensures better detection, avoidance, and management of CAT. Enhanced coordination between the flight and ground segments remains essential in mitigating the risks associated with CAT, ensuring safer and more efficient aviation operations.
5. Conclusions
Clear Air Turbulence poses serious issues for aviation, causing discomfort, injuries, and problems that may have serious effects at operational level and may negatively impact safety and efficiency of aviation operations. Such issues emerged as important aspects in the news flow in the recent years, based on increased CATs’ occurrence and severity, due to climate change effects. Because CAT is hard to see with the naked eye or standard weather radar, progress in both scientific understanding and applicable technologies and strategies for mitigation are essential for handling it during flights. In this review paper, the state-of-the-art and most recent progresses in this domain have been addressed and examined, by first indicating the CAT causes and formation process and, then, analysing two macro areas: the scientific one, encompassing the methodologies for CAT detection and forecast, and the technological and operational one, encompassing the onboard and ground technologies for CAT detection and the mitigation strategies that can be put in place to prevent the aircraft to fly into turbulent areas.
The main challenge related to CAT occurrence is that it is not possible to visually or instrumentally detect during flight by pilots. Therefore, CAT forecasts have traditionally relied on Numerical Weather Prediction models, which, nevertheless, suffer from issues in terms of scales, because CAT involves physical processes with scales usually smaller than the resolution of NWP models. This on one hand indicates the need for further research in NWP and on the other hand motivated the push for exploitation of real-time satellite data as further means to identify the occurrence of CAT. Nevertheless, CAT detection results to be very difficult even with remote sensing, motivating further research and development needs also in this domain.
About the onboard available technologies supporting pilots in detecting and managing CATs, available alarm systems provide an important layer of protection against the unexpected nature of CAT. Nevertheless, up to date, such systems are designed as reactive ones, motivating the need for further developments in sensor integration, data sharing, and predictive capabilities in order to provide such systems with also proactive features. LIDAR systems, tropospheric profilers, and advanced ATM tools are the core of the ongoing technological enhancements and are promising to this aim, also thanks to the possibility of combining real-time data from onboard systems and predictive models from ground-based tools to ensure better detection, avoidance, and management of CAT. In addition, the possibility of using flying aircraft as real-time sensors of occurring CAT events and of sharing such information in broadcast to enable creation of a tactical picture of CATs to prevent other aircraft to cross the affected airspace volumes is very important and promising. It emphasizes the importance of reliable and well dimensioned communication network for air- air and air-ground communication.
In terms of CATs management strategies, finally, enhanced coordination between the flight and ground segments remains essential in mitigating the risks associated with CAT, ensuring safer and more efficient aviation operations. In this framework, the ever-increasing importance of the paradigm of Collaborative Decision Making (CDM) supported by SWIM infrastructure is evident.
Overall, it is clear from the analysis carried out in the paper that the consideration of CATs started several decades ago and progressed over time, making available up to date different methodological and technological tools for understanding, predicting and detecting such phenomena. Nevertheless, still these tools need to be improved to allow better results and more appropriate anticipation of the phenomena at tactical level.
References
- Di Vito V, Bucchignani E, Montaquila R V, Cerasuolo G, Montesarchio M, Zollo A L, Cinquegrana D, Analysis of vulnerability of ATM to weather phenomena. Journal of Physics, Conference Series: Materials Science and Engineering journal, 2022 IOP Conf. Ser.: Mater. Sci. Eng. 1226 012020. DOI 10.1088/1757-899X/1226/1/012020.
- Van den Dungen N, Sutopo K, Prats X, Di Vito V, Riccio A, Multi-Aircraft Environmentally-scored Weather-Resilient Optimised 4D Trajectories. FABEC Research Workshop on Climate change and the role of ATC, Vilnius, Lithuania, 22-23 September 2021.
- Turbli, The Most Recent Plane Accidents Caused by Turbulence, Dec. 21, 2024, Available online: https://turbli.com/blog/the-most-recent-plane-accidents-caused-by-turbulence/.
- Krause S S, Aircraft Safety: Accident Investigations, Analyses and Applications. McGraw Hill, 2014.
- Foudad M, Sanchez-Gomez E, Jaravel T, Rochoux MC, Terray L, Past and future trends in clear-air turbulence over the northern hemisphere. J Geophys Res Atmos, 2024, Vol. 129 No. 13. https://doi.org/10.1029/2023JD040261.
- Knox J, McCann D, Williams P. Application of the Lighthill-Ford Theory of Spontaneous Imbalance to Clear-Air Turbulence Forecasting, Journal of the Atmospheric Sciences, 2008, Vol. 65, No. 10, pp. 3292-3304. doi:10.1175/2008JAS2477.1.
- Storer, L.N.; Williams, P.D.; Gill, P.G. Aviation turbulence: dynamics, forecasting, and response to climate change. Pure and Applied Geophysics 2019, 176, 2081-2095. https://doi.org/10.1007/s00024-018-1822-0.
- Storer, L.N.; Gill, P.G.; Williams, P.D. Multi-model ensemble predictions of aviation turbulence. Meteorological Applications 2019, 26, 416-428. https://doi.org/10.1002/met.1772.
- Williams, P.D. Increased light, moderate, and severe clear-air turbulence in response to climate change. Advances in atmospheric sciences 2017, 34, 576-586. https://doi.org/10.1007/s00376-017-6268-2.
- Williams, P.D.; Joshi, M.M. Intensification of winter transatlantic aviation turbulence in response to climate change. Nature Climate Change 2013, 3, 644-648. https://doi.org/10.1038/nclimate1866.
- Storer, L.N.; Williams, P.D.; Joshi, M.M. Global response of clear-air turbulence to climate change. Geophysical Research Letters 2017, 44, 9976-9984. https://doi.org/10.1002/2017GL074618.
- Prosser, M.C.; Williams, P.D.; Marlton, G.J.; Harrison, R.G. Evidence for large increases in clear-air turbulence over the past four decades. Geophysical Research Letters 2023, 50. https://doi.org/10.1029/2023GL103814.
- Hersbach, H.; Bell, B.; Berrisford, P.; Hirahara, S.; Horányi, A.; Muñoz-Sabater, J., et al. The ERA5 global reanalysis. Quarterly Journal of the Royal Meteorological Society 2020, 146, 1999–2049. https://doi.org/10.1002/qj.3803.
- NCEI Physical Archive Collection: HICAT, gov.noaa.ncdc:C01203.
- U.S. Air Force. Meteorological Techniques, Air Force Handbook AFH15-101, 2019.
- Federal Aviation Administration. Aviation Weather Handbook, FAA-H-8083-28, 2022.
- Ellrod, G.P.; Knapp, D.I. An objective clear-air turbulence forecasting technique: Verification and operational use. Weather and Forecasting 1992, 7, 150-165.
- Lee, L. A climatological study of clear air turbulence over the North Atlantic. 2013.
- Federal Aviation Administration. Clear Air Turbulence Avoidance, Advisory Circular AC 00-30C, 2016.
- Ștefan, S.; Antonescu, B.; Urlea, A.D.; Buzdugan, L.; Andrei, M.D.; Necula, C.; Voinea, S. Study of clear air turbulence related to tropopause folding over the Romanian airspace. Atmosphere 2020, 11, 1099. https://doi.org/10.3390/atmos11101099.
- Sharman, R.; Tebaldi, C.; Wiener, G.; Wolff, J. An integrated approach to mid-and upper-level turbulence forecasting. Weather and Forecasting 2006, 21, 268–287.
- Ellrod, G.P.; Knox, J.A. Improvements to an operational clear-air turbulence diagnostic index by addition of a divergence trend term. Weather and Forecasting 2010, 25, 789-798.
- Harrison, H.T. The use of horizontal wind shear in forecasting high level clear air turbulence, United Air Lines, 1959.
- George, J.J. A method for the prediction of clear air turbulence. Eastern Air Lines, Atlanta, Ga., August, 1960.
- Kronebach, G.W. An automated procedure for forecasting clear-air turbulence. Journal of Applied Meteorology and Climatology 1964, 3, 119–125.
- Reiter, E.R. The Nature of Clear Air Turbulence: A Review. In Pao, YH., Goldburg, A. (eds) Clear Air Turbulence and Its Detection. Springer, Boston, MA, 1969. https://doi.org/10.1007/978-1-4899-5615-6_2.
- Endlich, R.M. The mesoscale structure of some regions of clear-air turbulence. Journal of Applied Meteorology and Climatology 1964, 3, 261–276.
- Kaplan, M.L.; Charney, J.J.; Waight, K.T.; Lux, K.M.; Cetola, J.D.; Huffman, A.W.; Riordan, A.J.; Slusser, S.D.; Kiefer, M.T.; Suffern, P.S.; Lin, Y.L. Characterizing the severe turbulence environments associated with commercial aviation accidents. A real-time turbulence model (RTTM) designed for the operational prediction of hazardous aviation turbulence environments. Meteorology and Atmospheric Physics 2006, 94, 235–270. https://doi.org/10.1007/s00703-005-0181-4.
- Marroquin, A. An advanced algorithm to diagnose atmospheric turbulence using numerical model output. In Conference on Weather Analysis and Forecasting, American Meteorological Society, 1998, 16, 79-81.
- Frehlich, R.; Sharman, R. Estimates of turbulence from numerical weather prediction model output with applications to turbulence diagnosis and data assimilation. Monthly Weather Review 2004, 132, 2308–2324.
- Sharman, R.D.; Pearson, J.M. Prediction of energy dissipation rates for aviation turbulence. Part I: Forecasting nonconvective turbulence. Journal of Applied Meteorology and Climatology 2017, 56, 317–337. https://doi.org/10.1175/JAMC-D-16-0205.1.
- Kim, J.H.; Sharman, R.; Strahan, M.; Scheck, J.W.; Bartholomew, C.; Cheung, J.C.H.; Buchanan, P.; Gait, N. Improvements in nonconvective aviation turbulence prediction for the World Area Forecast System. Bulletin of the American Meteorological Society 2018, 99, 2295–2311. https://doi.org/10.1175/bams-d-17-0117.1.
- Yang, R.; Liu, H.; Li, K.; Yuan, S. A Numerical Study of Clear-Air Turbulence over North China on 6 June 2017. Atmosphere 2024 15, 407. https://doi.org/10.3390/atmos15040407.
- Skamarock, W.C.; Klemp, J.B.; Dudhia, J.; Gill, D.O.; Liu, Z.; Berner, J.; Wang, W.; Powers, J.G.; Duda, M.G.; Barker, D.M.; Huang, X.Y. A Description of the Advanced Research WRF Model Version 4. National Center for Atmospheric Research: Boulder, CO, USA 2019, 145, 550.
- Bechtold, P.; Bramberger, M.; Dörnbrack, A.; Isaksen, L.; Leutbecher, M. Experimenting with a Clear Air Turbulence (CAT) index from the IFS. ECMWF Technical Memoranda, 2021, 874. https://doi.org/10.21957/4l34tqljm.
- Muñoz-Esparza, D.; Sharman, R.D.; Deierling, W. Aviation turbulence forecasting at upper levels with machine learning techniques based on regression trees. Journal of Applied Meteorology and Climatology 2020, 59, 1883–1899. https://doi.org/10.1175/JAMC-D-20-0116.1.
- Bedka, K.M.; Feltz, W.F.; Mecikalski J.R.; Sharman, R.D; Lenz, A.; Gerth, J. Satellite signatures associated with significant convectively-induced turbulence events. Proceedings of Joint 2007 EUMETSAT Meteorological Satellite Conference and the 15th AMS Satellite Meteorology & Oceanography Conference, Amsterdam, The Netherlands, 24-28 September 2007.
- Overeem, A. Verification of clear-air turbulence forecasts. Technical report TR 244, KNMI, De Bilt, 2002.
- Knox, J.A.; Bachmeier, A.S.; Carter, W.M.; Tarantino, J.E.; Paulik, L.C.; Wilson, E.N.; Bechdol, G.S.; Mays, M.J. Transverse cirrus bands in weather systems: A grand tour of an enduring enigma. Weather 2010 65, 35-41.
- Ellrod, G.P. Detection of high level turbulence using satellite imagery and upper air data. NOAA Technical Memorandum NESDIS 10, 1985.
- Ellrod, G.P. The Use of Water Vapor Imagery to Identify Clear Air Turbulence. Satellite Applications Information Note 90/8, 1990.
- Gerogiannis, V.T.; Feidas, H. A Satellite-Based Evaluation of Upper-Level Aviation Turbulence Events over Europe during November 2009: A Case Study. Environmental Sciences Proceedings 2023, 26, 61. https://doi.org/10.3390/environsciproc2023026061.
- Wimmers, A.; Feltz, W. Tropopause Folding Turbulence Product. Algorithm Theoretical Basis Document v2.0. NOAA NESDIS, Center for Satellite Application and Research, 2010 Available online: https://www.nwcsaf.org/documents/20182/30813/Aviation_Turbulence_v1.0_no_color.pdf/52fb7ca4-b8c3-4b8e-a124-6534e2e329b0 (accessed on 21 October 2024).
- Jann, A.; Wirth, A.; Zeiner, B. Algorithm Theoretical Basis Document for the “Automatic Satellite Image Interpretation—Next Generation” Processor of the NWC/GEO, issue 1.0.1, Feb 2022. Available online: https://www.nwcsaf.org/documents/27295/0/NWC-CDOP3-GEO-ZAMG-SCI-ATBD-ASII-NG_v1.0.1.pdf/943aa920-0c5c-4095-afbf-5adda711e9f9 (accessed on 21 October 2024).
- European Cockpit Association. Pilots’ vision on weather, sesar programme provision of weather data and charts. 2014. Available from: https://www.eurocockpit.eu/sites/default/files/eca_pilots_vision_on_weather_14_0225_f.pdf.
- NASA, ACLAIM Airborne Coherent Lidar for Advanced In-flight Measurements, April 2020. Available online: https://airbornescience.nasa.gov/category/instrument/ACLAIM.
- Soreide D.C.; Bogue R.K.; Ehernberger L.J.; Bagley H.R. Coherent lidar turbulence measurement for gust load alleviation, Proc. SPIE 2832, Optical Instruments for Weather Forecasting, (21 November 1996). https://doi.org/10.1117/12.258887.
- European Commission. Demonstration of LIDAR-based Clear Air Turbulence detection (DELICAT). Seventh Framework Programme (FP7), Project no. 233801; 2009-2014. Available from: https://cordis.europa.eu/project/id/233801.
- Audrey C, Christine L, Yves B, Francois B. Aeronautical diagnostics for Clear-Air Turbulence forecast at Meteofrance in the context of DELICAT European project. J Phys Conf Ser. 2011 Dec;318(7):072007. doi: 10.1088/1742-6596/318/7/072007.
- Vrancken, P.; Wirth, M.; Ehret, G.; Witschas, B.; Veermann, H.; Tump, R.; Barny, H.; Rondeau, P.; Dolfi-Bouteyre, A.; Lombard, L. Flight Tests of the DELICAT Airborne LIDAR System for Remote Clear Air Turbulence Detection. In EPJ Web of Conferences, Proceedings of 27th International Laser Radar Conference, New York, 05-10 July 2015. https://doi.org/10.1051/epjconf/201611914003.
- Yang H.; Chan P.W.; Li L., Mao X.; Monitoring of aviation turbulence using a tropospheric profiler - case studies. MAUSAM. 69, 2 (Apr. 2018), 219–226. https://doi.org/10.54302/mausam.v69i2.275.
- Azouit M.; Vernin J.; Barletti R.; Ceppatelli G.; Righini A.; Speroni N. Remote Sensing of Atmospheric Turbulence by Means of a Fast Optical Method: A Comparison with Simultaneous In Situ Measurements, Journal of Applied Meteorology and Climatology, pp: 834–838, 01 Jul 1980. https://doi.org/10.1175/1520-0450(1980)019<0834:RSOATB>2.0.CO;2.
- Aristidi E.; Fantei-Caujolle Y.; Chabé J; Renaud C.; Ziad A.; Ben Rahhal M.; Turbulence monitoring at the Plateau de Calern with the GDIMM instrument, Proc. SPIE 10703, Adaptive Optics Systems VI, 107036U (18 July 2018). https://doi.org/10.1117/12.2313352.
- Crane R.K.; A review of radar observations of turbulence in the lower stratosphere, Radio Science, Volume 15, Issue 2, pp: 147-457, March-April 1980. https://doi.org/10.1029/RS015i002p00177.
- ICAO, Improvements to the World Area Forecast System, Nov. 2020. Available on line: https://www.icao.int/WACAF/Documents/Meetings/2021/WAFS/WAFS%20New%20Gridded%20Data%20-%20Nov%202020%20upgrade.pdf.
- Robeck V. IATA Turbulence Aware, IATA-AACO Technical Forum, October 2019. Available on line: https://www.aaco.org/Library/Assets/Turbulence%20Data%20by%20Victor%20Robeck%20-%20IATA.pdf.
- ICAO, ADS-B Implementation and Operations Guidance Document, Edition 15.0 - September 2022. Available on line: https://www.icao.int/APAC/Documents/edocs/cns/AIGD%20Edition%2015.0.pdf.
- Pu, Z.; Kalnay, E.; Numerical Weather Prediction Basics: Models, Numerical Methods, and Data Assimilation. In: Duan, Q., Pappenberger, F.; Thielen, J.; Wood, A.; Cloke, H.; Schaake, J. (eds) Handbook of Hydrometeorological Ensemble Forecasting. Springer, Berlin, Heidelberg, 2018. https://doi.org/10.1007/978-3-642-40457-3_11-1.
- Fujii M.; Hoshiya Y.; Fujimori Y.; Sato T.; Hashimoto A.; Takahashi T.; Taguchi H.; Effect of the turbulence model on the buzz characteristics occurring on the air intake for high-mach integrated control experiment (Himico), ASCEND 2021. https://doi.org/10.2514/6.2021-4164.
- Aviation Weather Center; World Area Forecast System (Wafs); available online https://aviationweather.gov/wafs/.
- Gill, P.G.; Objective verification of World Area Forecast Centre clear air turbulence forecasts. Meteorological Applications 2014, 21, 3-11. https://doi.org/10.1002/met.1288.
- ICAO. Meteorological Service for International Air Navigation. Annex 3 to the Convention on International Civil Aviation, 2010.
Figure 1.
Kelvin-Helmholtz instability visible by clouds. Source: Brooks Martner, NOAA/ETL.
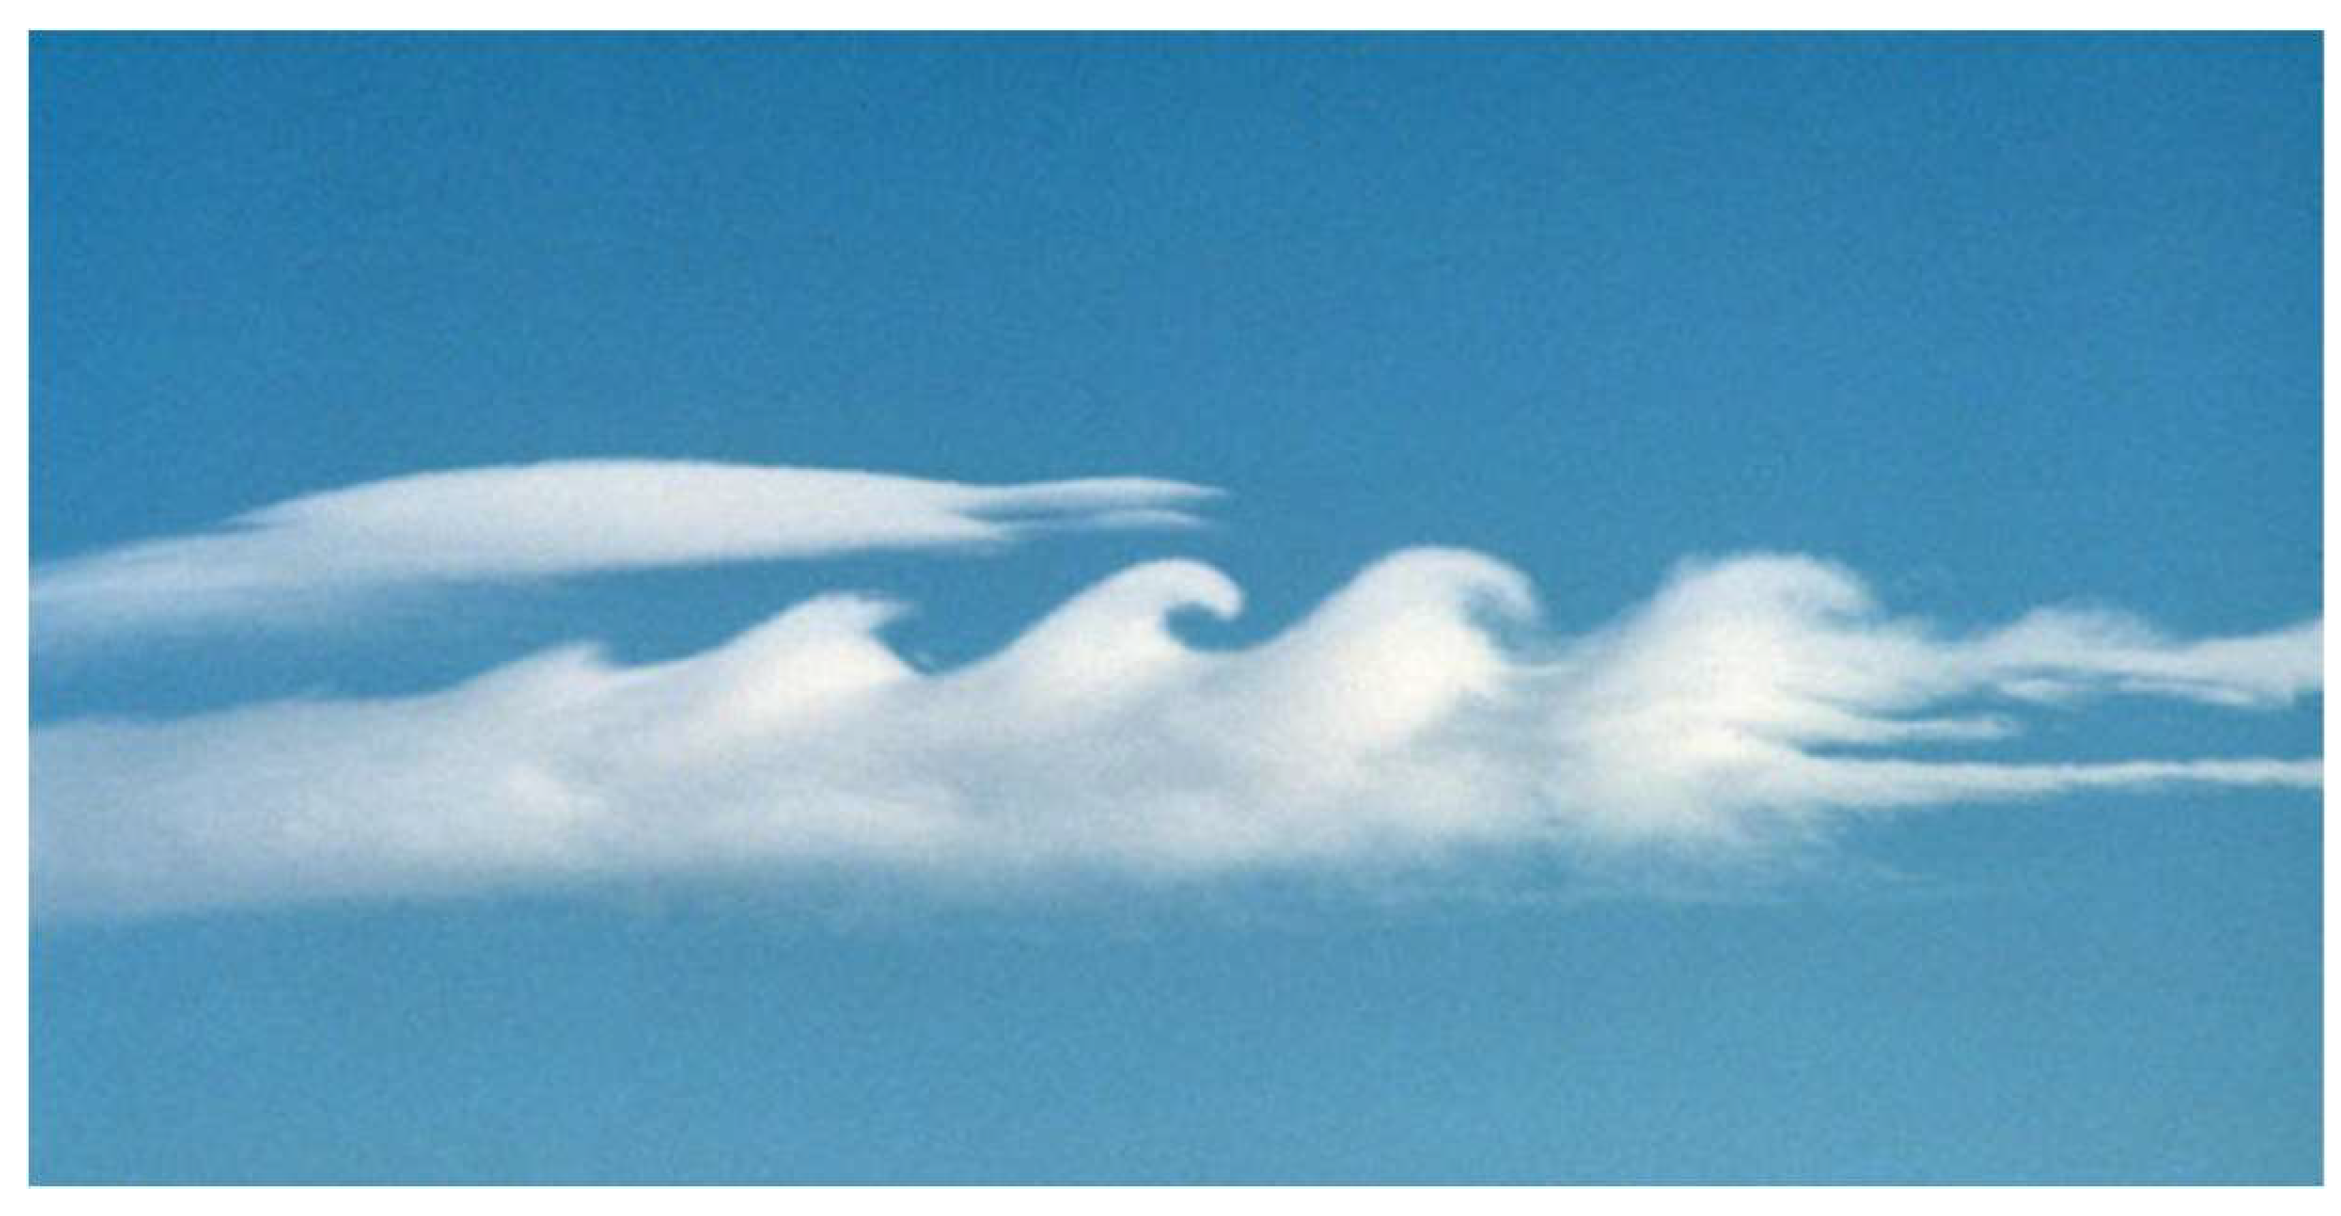
Figure 2.
Illustration of polar and subtropical jet streams: (a) their location around the globe and (b) their cross section in the Northern Hemisphere. © NOAA.
Figure 2.
Illustration of polar and subtropical jet streams: (a) their location around the globe and (b) their cross section in the Northern Hemisphere. © NOAA.
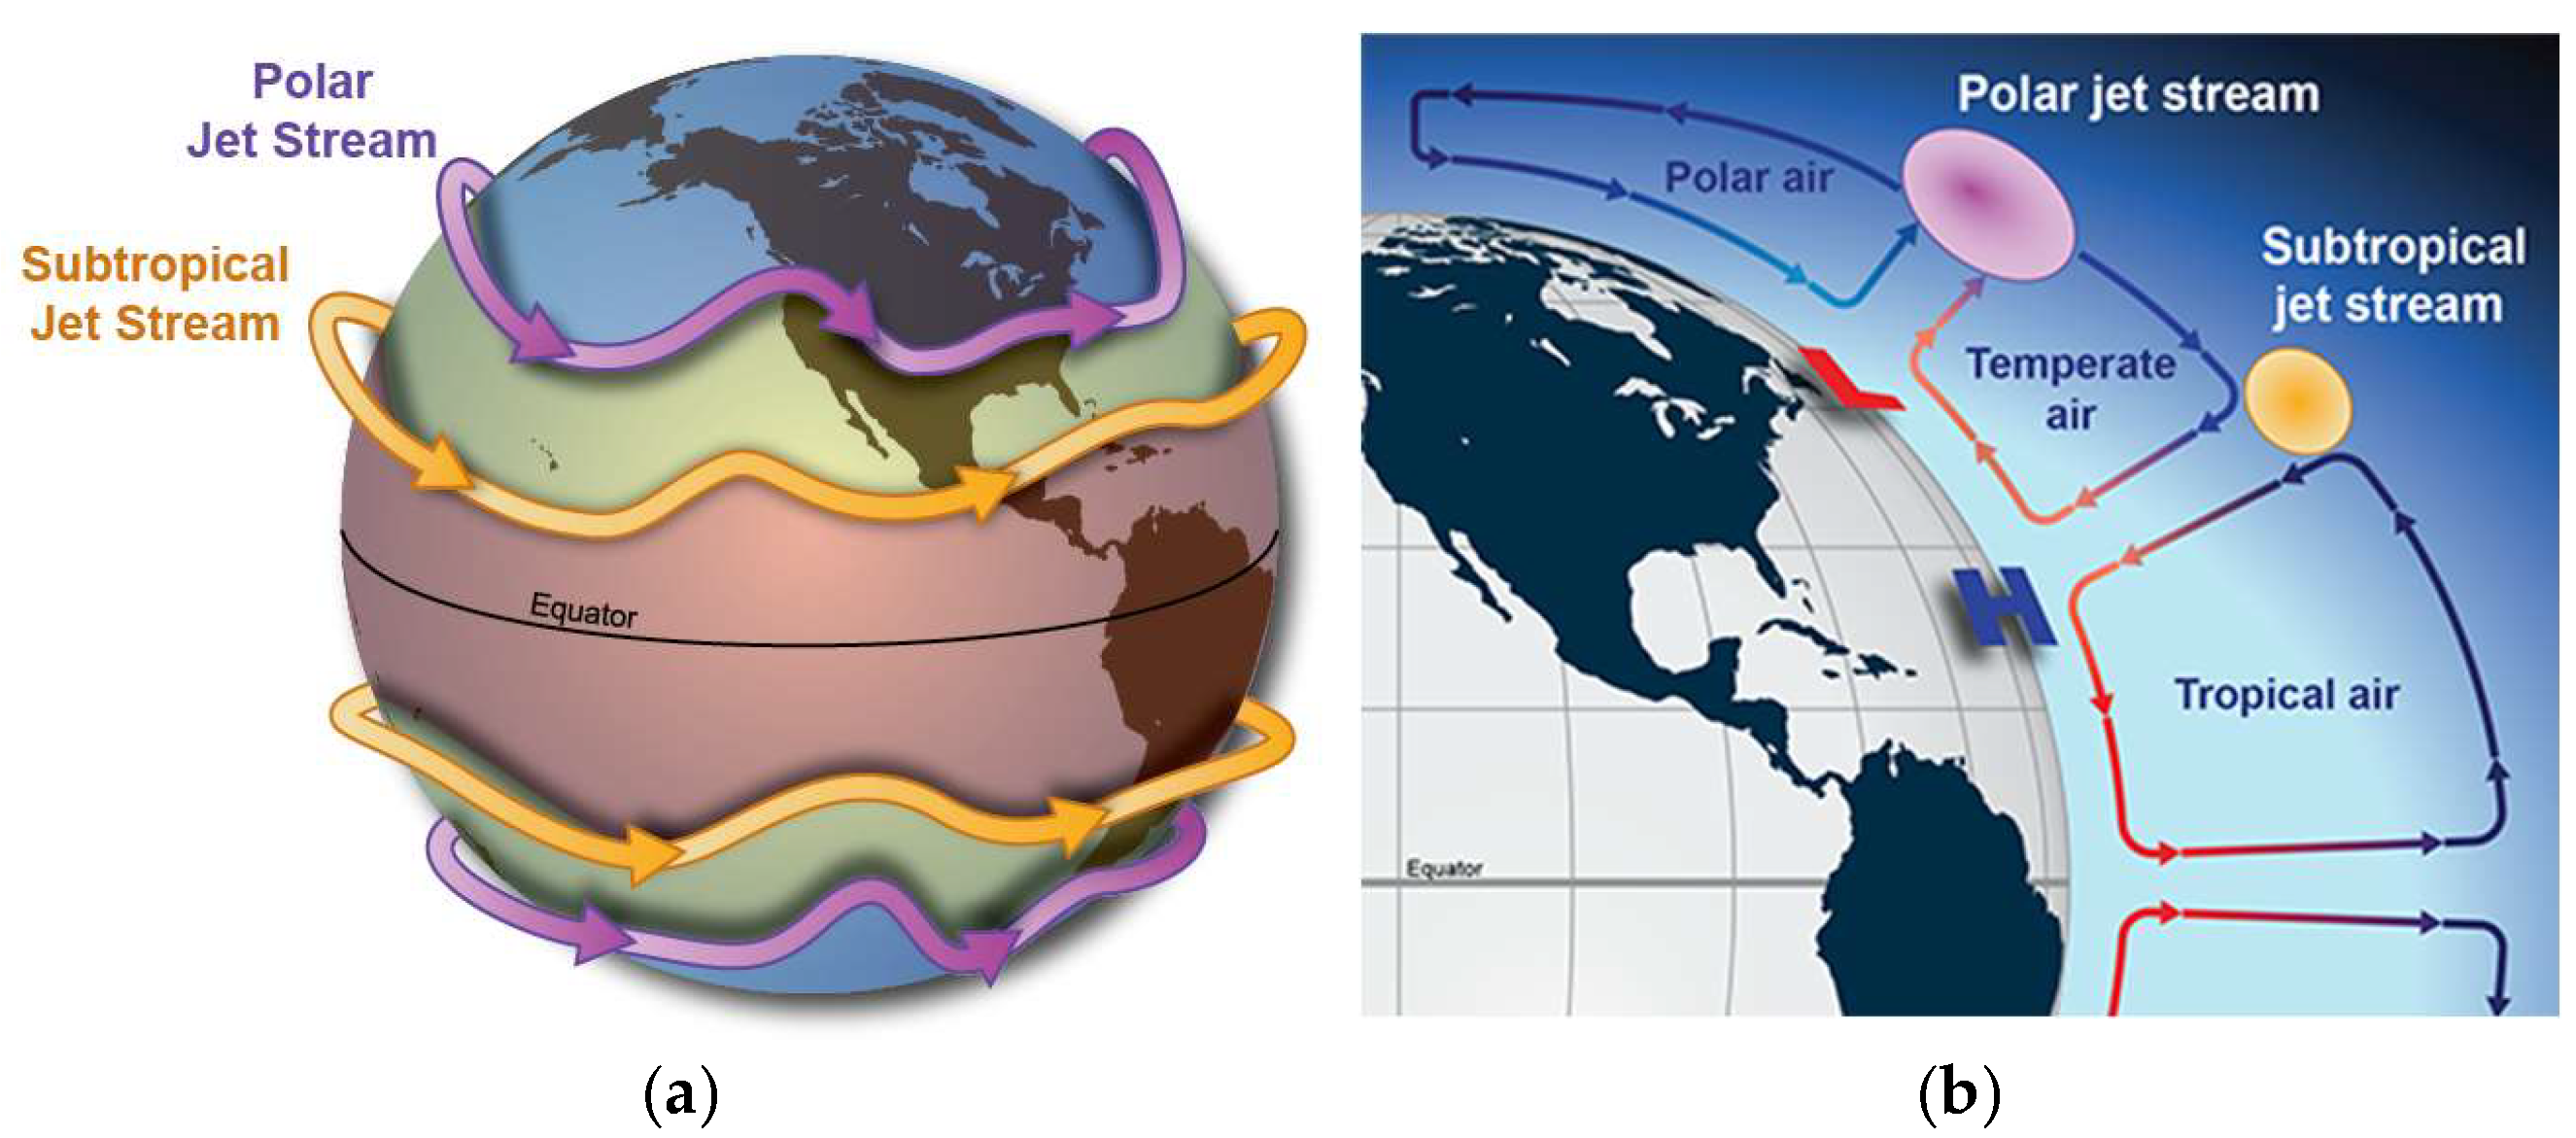
Figure 3.
Vertical cross section of a polar jet stream, showing the mid-latitude/sub-tropical and polar air, tropopause, isotachs (solid line, in m/s), isotherms (dashed line, in degrees Celsius) and the region with highest turbulence (blue areas). © The COMET Program.
Figure 3.
Vertical cross section of a polar jet stream, showing the mid-latitude/sub-tropical and polar air, tropopause, isotachs (solid line, in m/s), isotherms (dashed line, in degrees Celsius) and the region with highest turbulence (blue areas). © The COMET Program.
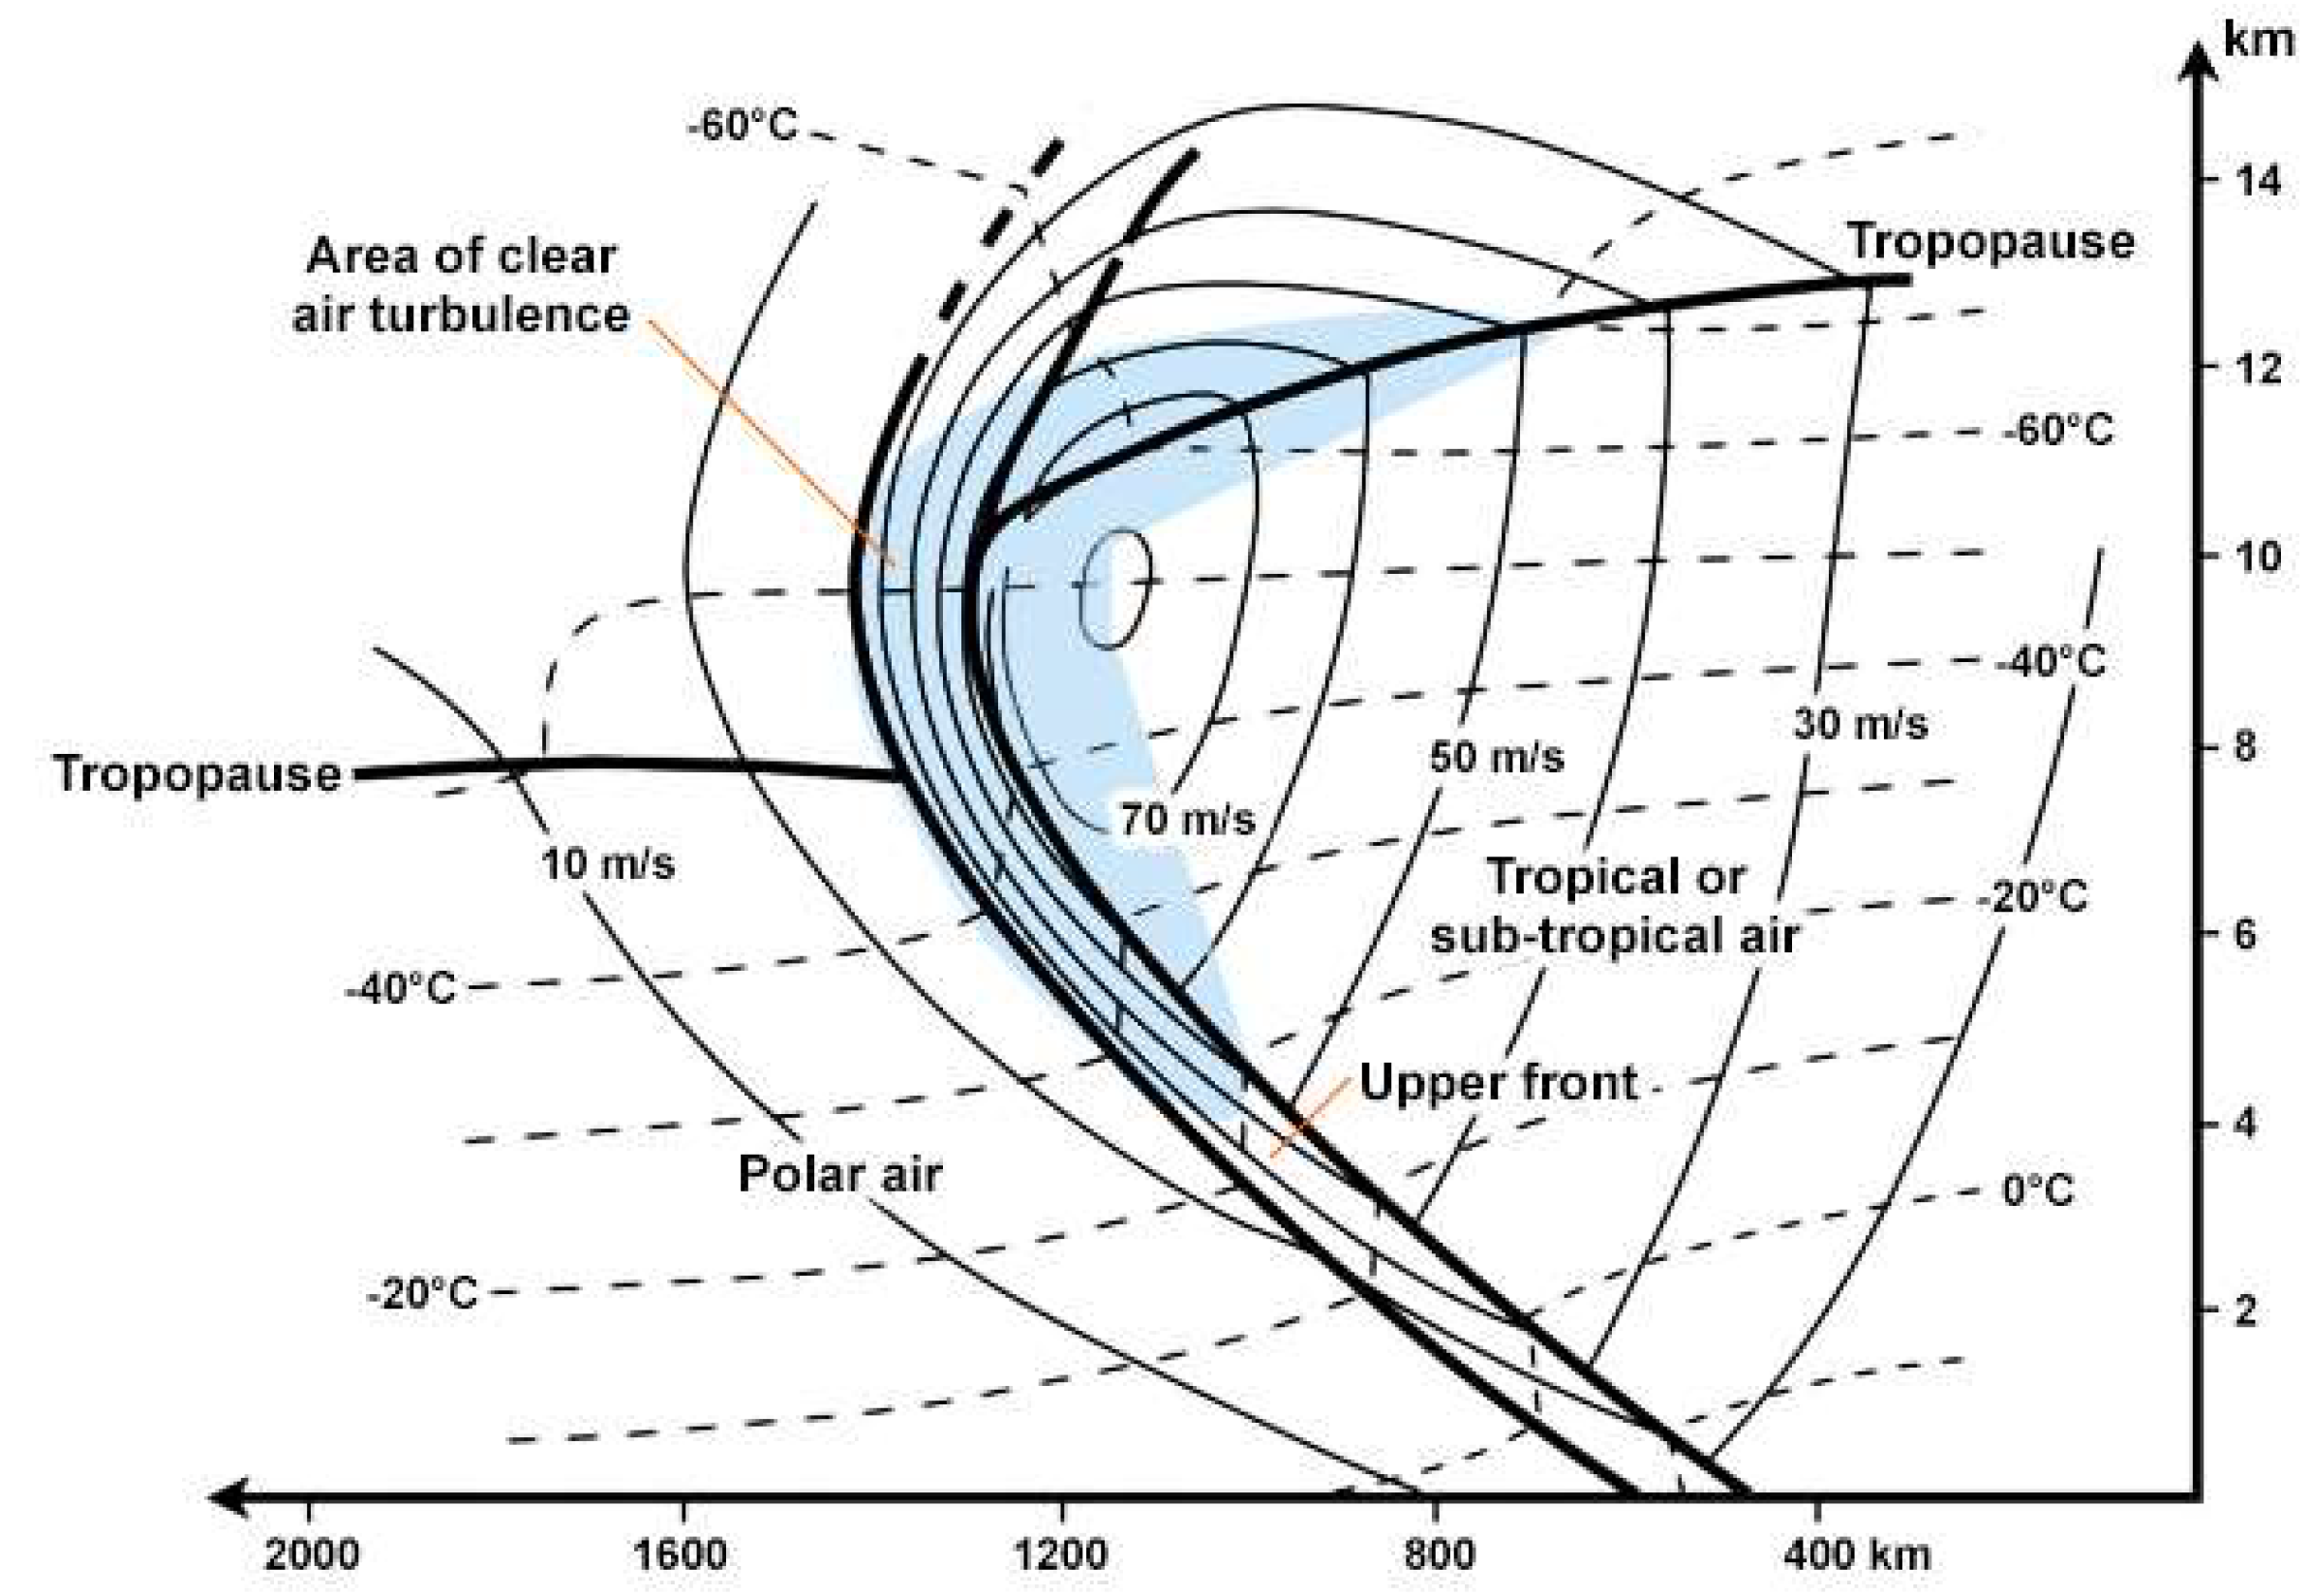
Figure 4.
Meteosat Second Generation (MSG) water vapor image (WV6.2), at 2015 UTC on 24 November 2009. The severe upper-level CAT event (circled red dot) was recorded over the Balkans, at FL232, in the tropopause folding “F” at the outflow of a comma cloud. From Gerogiannis and Feidas, 2023 [42].
Figure 4.
Meteosat Second Generation (MSG) water vapor image (WV6.2), at 2015 UTC on 24 November 2009. The severe upper-level CAT event (circled red dot) was recorded over the Balkans, at FL232, in the tropopause folding “F” at the outflow of a comma cloud. From Gerogiannis and Feidas, 2023 [42].
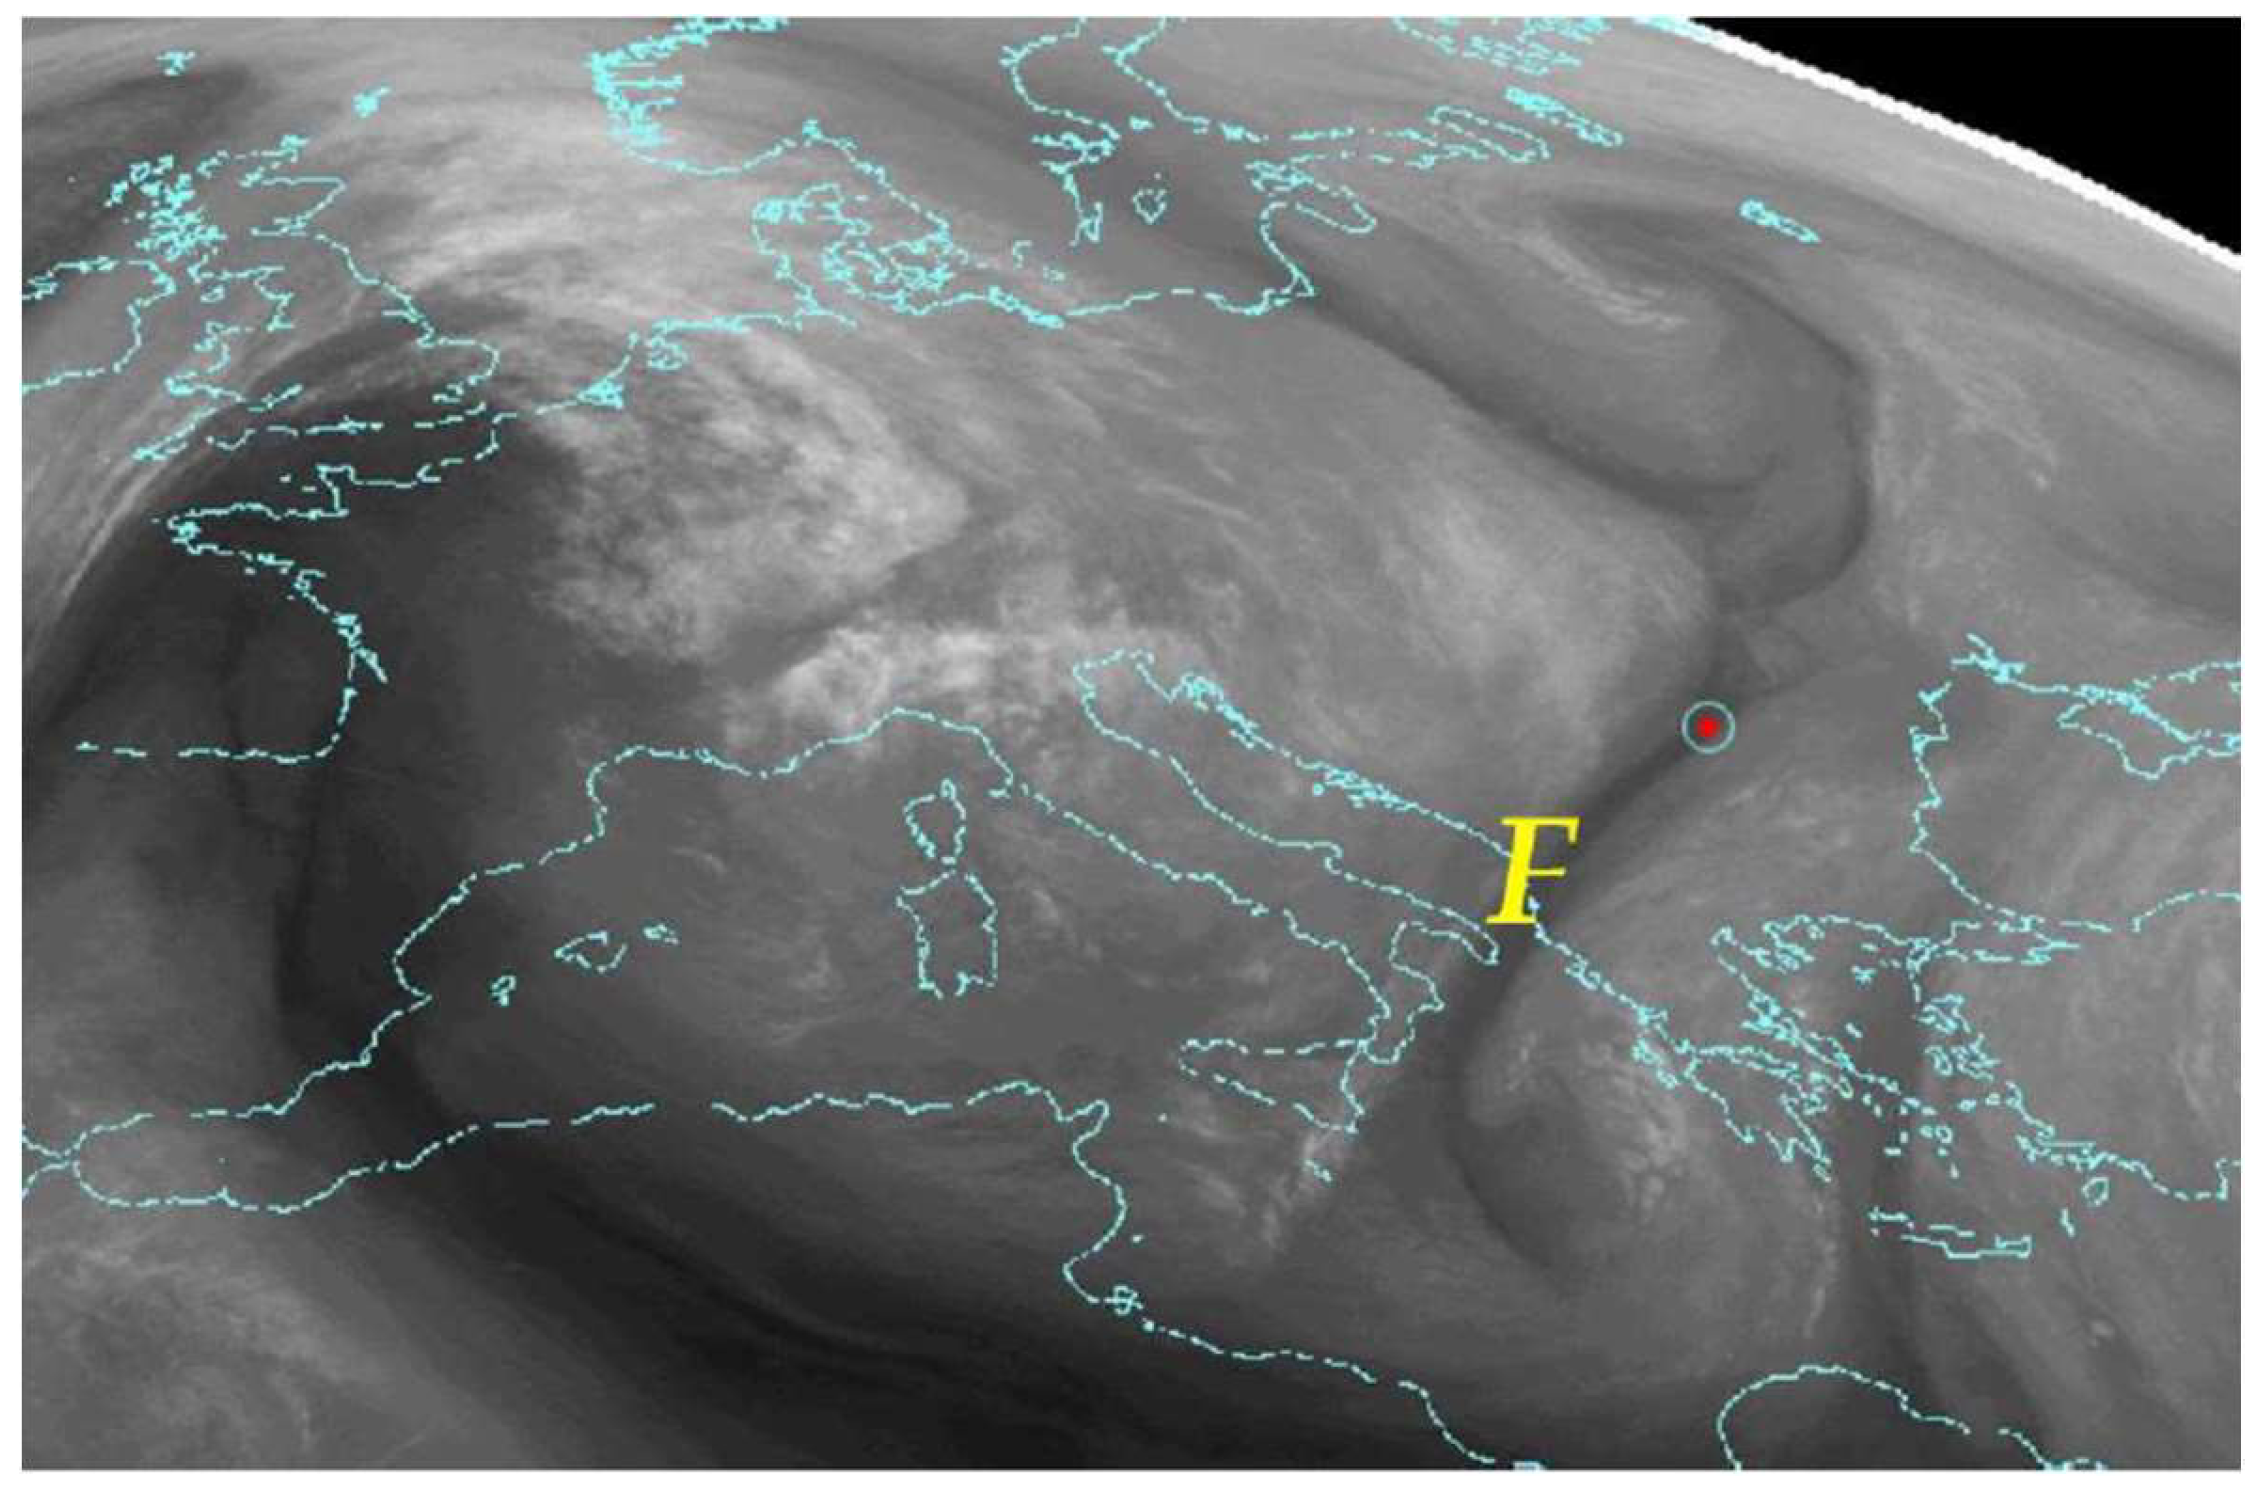
Figure 5.
NASA Airborne Coherent LIDAR for Advanced In-Flight Measurements [46].
Figure 5.
NASA Airborne Coherent LIDAR for Advanced In-Flight Measurements [46].
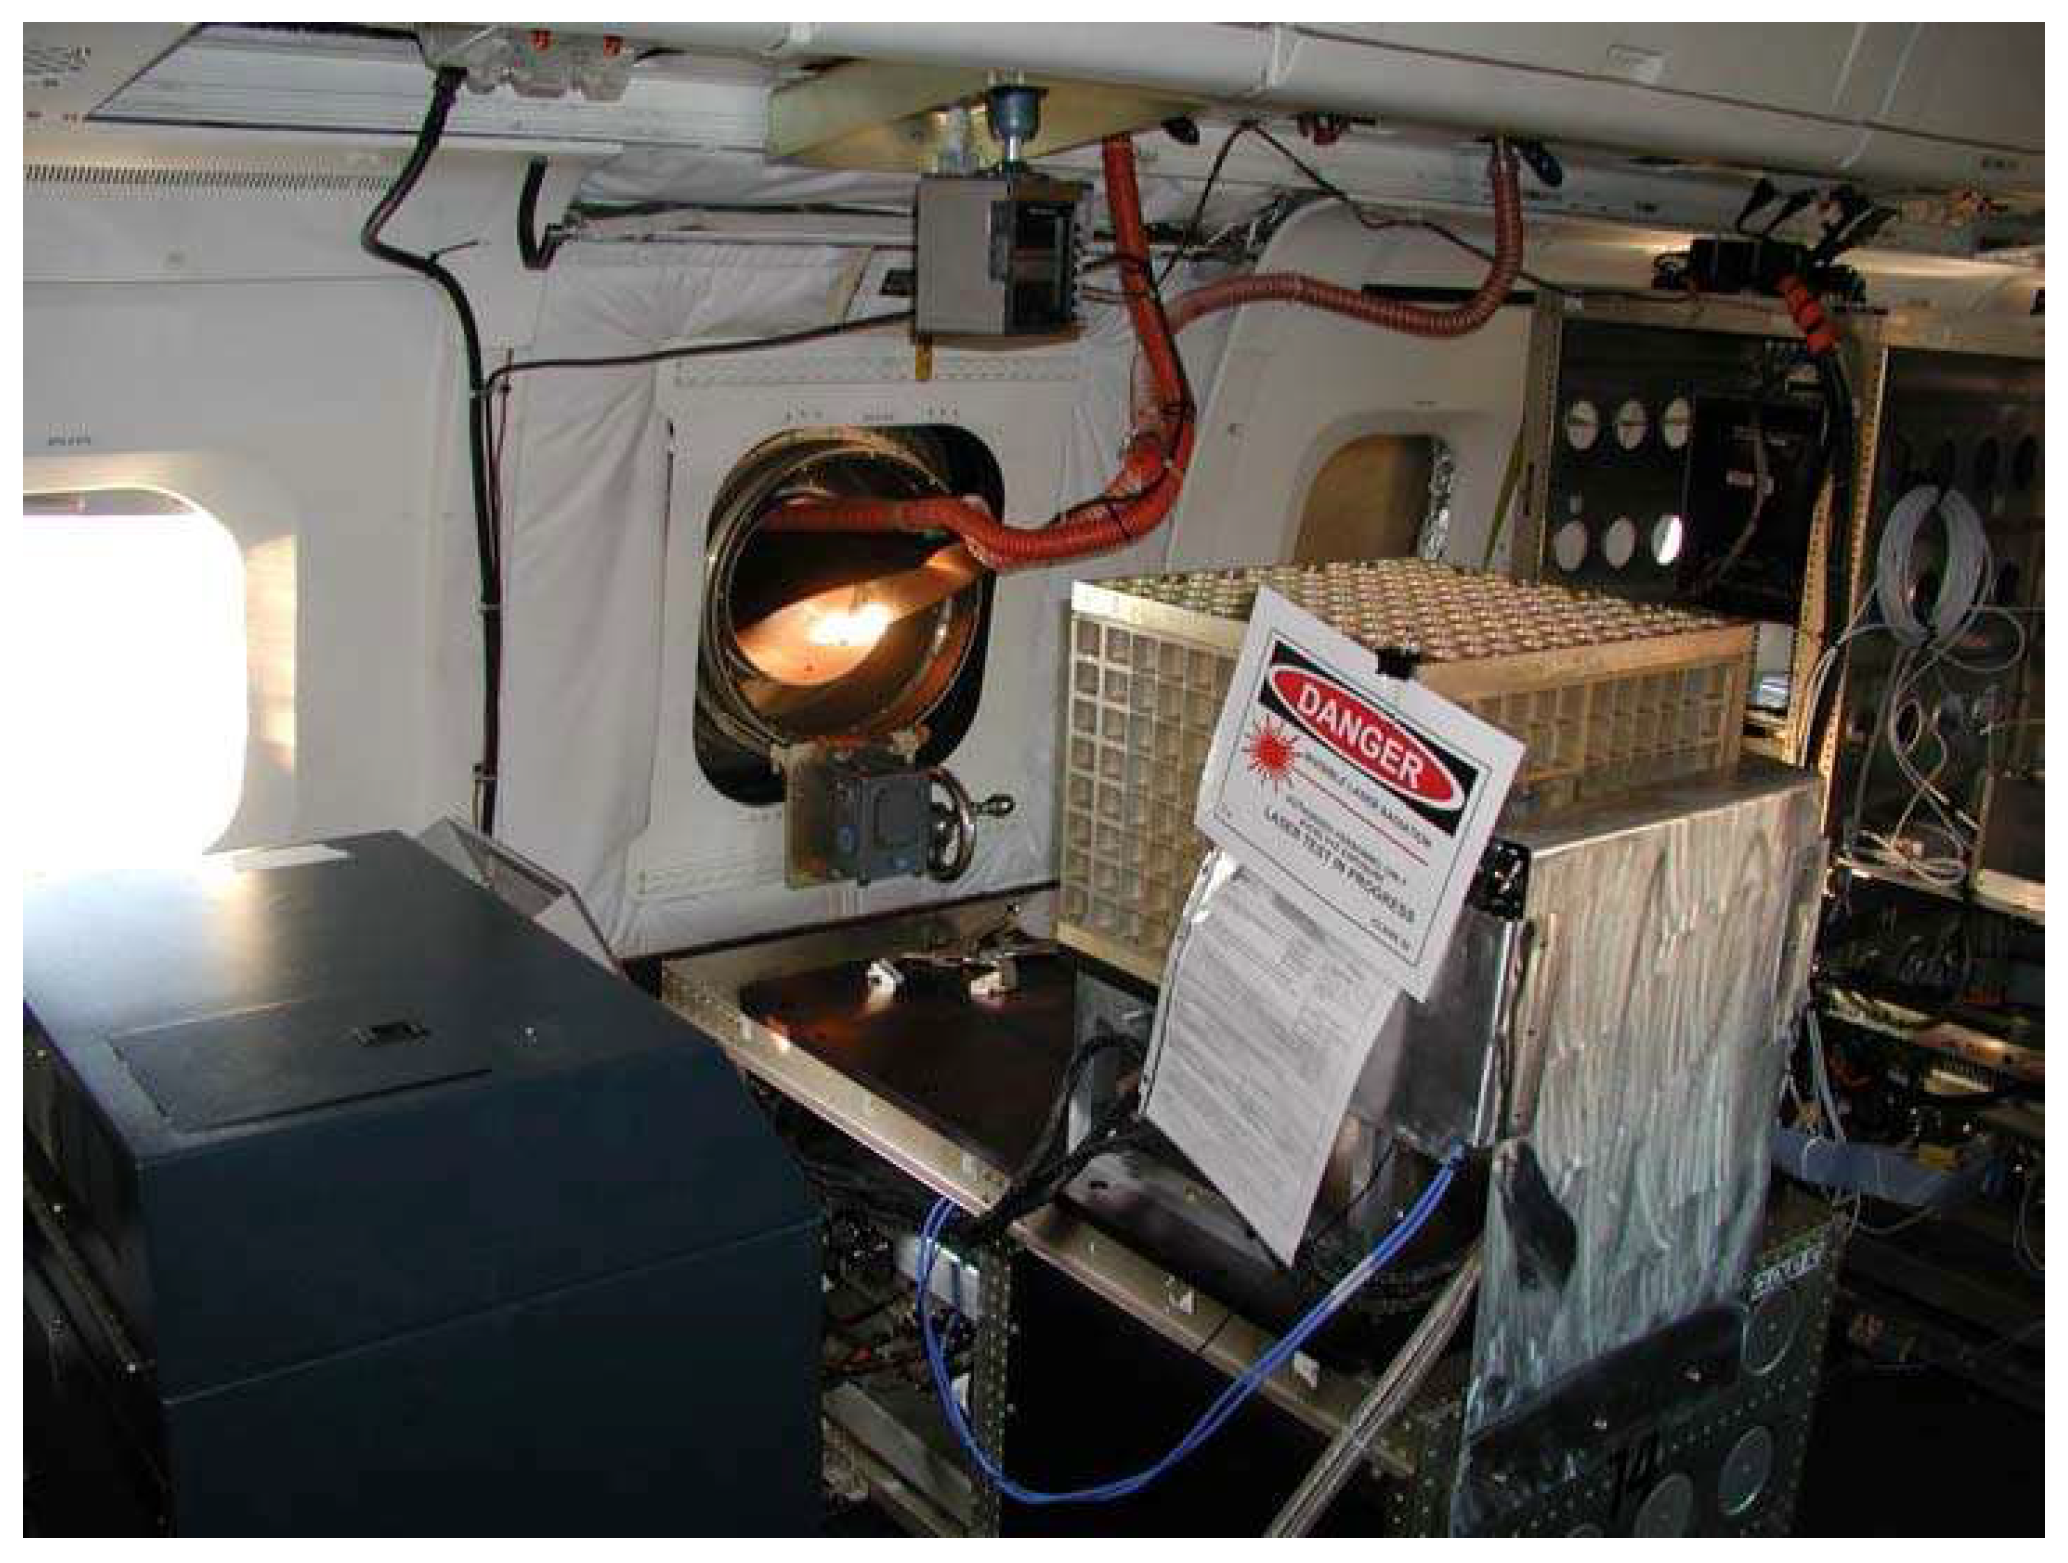
Figure 6.
GDIMM instrument at Calern Observatory [53].
Figure 6.
GDIMM instrument at Calern Observatory [53].
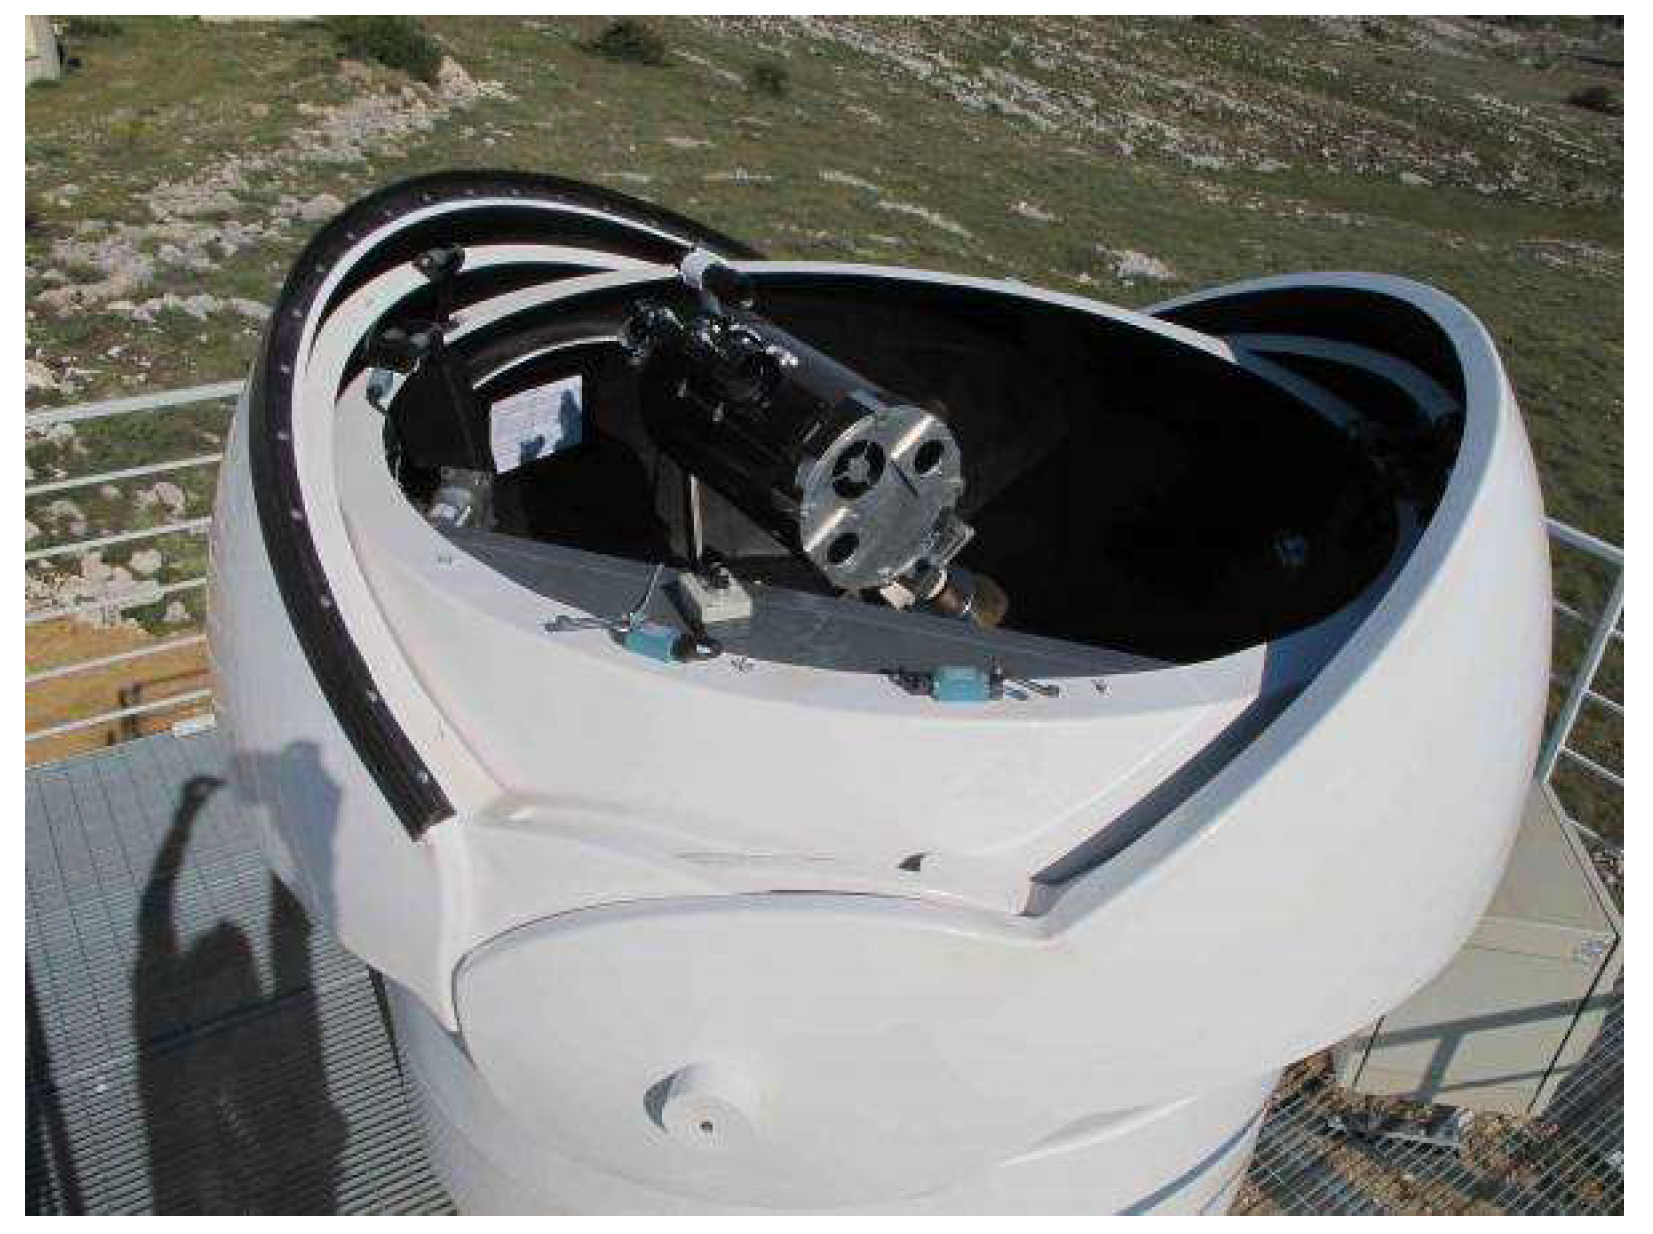
Figure 7.
Example of WAFC SIGWX chart.
Disclaimer/Publisher’s Note: The statements, opinions and data contained in all publications are solely those of the individual author(s) and contributor(s) and not of MDPI and/or the editor(s). MDPI and/or the editor(s) disclaim responsibility for any injury to people or property resulting from any ideas, methods, instructions or products referred to in the content. |
© 2025 by the authors. Licensee MDPI, Basel, Switzerland. This article is an open access article distributed under the terms and conditions of the Creative Commons Attribution (CC BY) license (http://creativecommons.org/licenses/by/4.0/).
Copyright: This open access article is published under a Creative Commons CC BY 4.0 license, which permit the free download, distribution, and reuse, provided that the author and preprint are cited in any reuse.


