
Submitted:
23 March 2025
Posted:
24 March 2025
You are already at the latest version
Abstract
Ports serve as logistical hubs through which approximately 80% of the world's goods are transported annually. New regulations from the International Maritime Organization (IMO) and the European Union require both ships and ports to implement measures designed to reduce the environmental, global, and local impact of port activities and mitigate climate change. These measures involve investing in renewable energy generation systems to transition from fossil fuel-based energy to renewable electricity. Consequently, constructing new power generation plants is necessary to meet ports' energy demands. However, ports are primarily logistics-focused platforms with limited space for other activities. Therefore, the use of port service areas, inner docks, and exterior/adjacent water zones for installing marine renewable energy generation plants is under consideration. This study employs high-resolution meteorological and oceanographic modelling, including wave agitation models validated with real-world data, to assess the feasibility of integrating marine renewable energy within port service areas.
Keywords:
Green energy
; Wave agitation
; Energy potential
; Spatial assessment
1. Introduction
Maritime transport remains the backbone of global trade, facilitating the movement of approximately 80% of goods worldwide [1]. However, the sector is also a major contributor to greenhouse gas (GHG) emissions, accounting for around 3% of global CO₂ emissions [2]. Addressing this environmental challenge has become a priority for international and regional bodies, leading to a series of innovative approaches aimed at reducing emissions. Current trends in maritime transport include adopting cleaner propulsion technologies, such as liquefied natural gas (LNG), hydrogen, and ammonia, alongside operational measures like slow steaming and optimised routing [3]. These advancements signal a paradigm shift in the sector, with a strong focus on sustainability.
As key logistical nodes at the intersection of maritime and terrestrial transport intersect, ports are pivotal in driving this transition. They facilitate cargo movement and serve as centres of innovation for decarbonization. For instance, major European ports like Rotterdam and Antwerp have implemented shore-side electricity (SSE) systems, enabling vessels to connect to renewable energy sources while at berth, reducing emissions from auxiliary engines [4]. The European Union has further reinforced this shift through the Fit for 55 legislative packages, which mandates using alternative fuels and zero-emission technologies in ports by 2030 [5].
Another transformative aspect of port sustainability is the integration of marine renewable energy. Offshore wind farms, such as those near the Port of Esbjerg in Denmark, provide a blueprint for how ports can harness renewable resources to achieve energy sovereignty [6]. Additionally, wave and tidal energy technologies are also being explored to complement wind and solar installations, creating diversified and resilient energy portfolios [7]. These initiatives not only reduce reliance on fossil fuels but also ensure a stable energy supply for port operations, supporting both economic and environmental objectives [8].
Crucially, implementing these measures depends on accurate and localized meteorological information. For example, the successful deployment of offshore wind farms requires precise wind resource assessments grounded on historical data and advanced numerical models [9]. Similarly, optimizing vessel traffic and cargo handling operations relies on real-time weather predictions to minimize delays and enhance safety. Advances in computational modelling, such as mesoscale meteorological simulations, are now enabling ports to statistically understand, forecast and mitigate the impacts of extreme weather events, further strengthening their operational resilience [10].
This article explores these interlinked trends, examining how regulatory frameworks, technological innovations, and meteorological tools are reshaping maritime transport and port operations. Through case studies and global best practices, this study highlights the critical role of ports in the energy transition and their alignment with international decarbonization goals. Additionally, the study underscores the necessity of decarbonizing port activities as a key driver of sustainability, emphasizing how energy sovereignty is becoming an essential consideration for port authorities. Given the existing infrastructure and the availability of marine renewable resources, the article also explores the need to assess the feasibility and potential of harnessing these resources. By integrating renewable energy solutions into port operations, ports can reduce reliance on external energy sources, enhance self-sufficiency, and contribute more effectively to the broader goals of carbon neutrality and sustainable maritime development.
Section 2 of this article contextualizes the problem, highlighting the existing problems related to decarbonization in maritime transport.
Section 3 describes ports that require a transition to an emission-free model and outlines the prospects for future growth.
Section 4 presents the main methodology and the implementation of a met-ocean system to assess climatic conditions near the ports, applied to the ports of Valencia, Sagunto, and Gandía. (Spain).
Finally, Section 5 presents the general results yielded by the system’s implementation, as well as a discussion of its future and the direct application of this knowledge to marine energy generation systems in ports.
2. Role of Ports in the Decarbonization of Maritime Transport
As mentioned, ports and maritime transport account for approximately 3% of global CO₂ emissions [1]. Consequently, the sector is under growing regulatory and societal pressure to decarbonize its operations and mitigate environmental impacts.
Ports host several energy-intensive activities. For instance, the 2016 “GHG Emissions Report of the Port of Valencia” delineates the port’s carbon footprint and identifies the sources of emissions generated by these activities. The report indicates that electricity consumption at the Port of Valencia was 65 Gigawatts-hour (GWh) per year, whereas fossil fuel consumption reached 360 GWh yearly. Additionally, energy demand from berthed ships accounted for 156 GWh per year—equivalent to half of the port’s total fuel consumption [19].
These results reveal a fossil fuel-to-electricity consumption ratio of 1:5.5. Thus, reducing this ratio is essential to substantially increase the share of energy consumed from electricity generated by renewable energy sources and alternative fuels.
2.1. Key Regulations Driving Change
The maritime industry is undergoing a major transformation, propelled by regulatory frameworks designed to reduce greenhouse gas emissions and promote sustainable fuels. These policies set ambitious targets to enhance energy efficiency, implement stricter emissions standards, and develop infrastructure for alternative fuels. By expediting the adoption of cleaner technologies and ensuring compliance with evolving environmental requirements, these regulations are reshaping the future of maritime transport.
- International Maritime Organization (IMO): The IMO’s Initial Strategy for reducing GHG Emissions from Ships aims to cut emissions by at least 50% by 2050 compared to 2008 levels. The introduction of the Energy Efficiency Existing Ship Index (EEXI) and Carbon Intensity Indicator (CII) regulations in 2023 enforces compliance with stricter efficiency standards [1].
- European Green Deal: The European Union (EU) has adopted the Fit for 55 legislative packages, including the FuelEU Maritime Initiative. This initiative mandates a gradual shift towards alternative fuels and sets specific reduction targets for GHG emissions from shipping by 2030 and 2050 [5].
- Alternative Fuels Infrastructure Regulation (AFIR): The EU has proposed new infrastructure requirements for alternative fuel supply, ensuring ports are equipped with refuelling facilities for sustainable fuels like hydrogen, methanol, ammonia, and bio-LNG [13], among others.
2.2. Role of Ports in the Energy Transition and Technological Developments
Ports play a crucial role in the transition towards sustainable maritime operations, acting as enablers of alternative fuel adoption and technological advancements aimed at reducing emissions. Alternative fuels, including liquefied natural gas (LNG), biofuels, methanol, hydrogen, and ammonia, are being tested and adopted to replace conventional heavy fuel oil (HFO). For example, major ports such as Rotterdam and Antwerp are developing bunkering facilities for LNG and hydrogen [14]. Additionally, hybrid and fully electric vessels are becoming increasingly common in short-sea shipping and port operations, reflecting the rapid electrification of the sector [11]. The trials carried out in the port of Valencia with a reach-stacker and a terminal tractor powered by fuel cells illustrate the potential of hydrogen in port applications.
A key strategy for reducing emissions in ports is the implementation of shore-side electricity (SSE) systems, allowing ships to connect to the grid while berthed, eliminating the need for auxiliary engines running on fossil fuels. In Spain, the port of Barcelona is pioneering the construction of SSE installations to supply electrical power to container ships, cruise ships, and ro-ro/ro-pax vessels. Similarly, the ports of Valencia, Bilbao, Cádiz, Tenerife, and Las Palmas are developing their first SSE facilities to align with EU regulations [15].
Beyond alternative fuels and SSE, technological advancements drive further decarbonization in the maritime sector. The deployment of zero-emission vessels (ZEVs) powered by hydrogen, ammonia, and electric batteries is expected to dominate by 2050. According to [11], by mid-century, hydrogen and ammonia could account for over 30% of marine fuel consumption. Simultaneously, advanced digital technologies, including autonomous vessels and smart port systems, enhance energy efficiency by optimizing logistics and operations, reducing unnecessary fuel consumption, and supporting real-time decision-making.
By integrating sustainable fuels, electrification measures, and cutting-edge digital solutions, ports are evolving into key hubs of maritime decarbonization. This ensures compliance with international regulations while fostering innovation in the shipping industry.
2.3. Policy and Market Evolution
The IMO is anticipated to adopt a revised strategy in 2023, potentially targeting full decarbonization by 2050. Meanwhile, the EU’s Emissions Trading System (ETS) will extend to maritime transport, creating financial incentives for emissions reductions [9]. Furthermore, collaboration between public and private sectors will accelerate the development of green corridors — specific trade routes with low-carbon infrastructure and regulatory support [16].
2.4. Integration of Renewable Energy in Ports
Ports are key enablers of the energy transition by integrating renewable energy systems such as offshore wind and solar power. These initiatives are designed to reduce operational emissions and ensure a stable, sustainable energy supply for maritime operations. By 2050, most major ports are expected to operate as energy hubs, integrating offshore renewable energy systems to supply clean energy to vessels and local grids. The development of floating offshore wind farms near ports - such as those planned in the North Sea, exemplifies this trend [17, 18].
In conclusion, the maritime transport sector and ports are shifting towards decarbonization. Regulatory mandates and advancements in alternative fuels and renewable energy drive this transformation. By 2050, ports are expected to operate as self-sufficient, sustainable hubs, supporting a fleet of zero-emission vessels and contributing to global climate goals. However, achieving these ambitions will require continued investment, international cooperation, and a commitment to innovation.
3. Maritime-Port Operations That Are Likely to Be Carried Out with a More Sustainable Energy Model
Ports host numerous facilities that serve both the cargo they handle and the ships transporting it. These facilities are becoming increasingly specialized to enhance efficiency in cargo operations. This specialization shapes the energy consumption model of each facility or terminal, as some require more internal movements than others. For instance, container terminals rely on more dock machinery than bulk terminals, leading to higher energy consumption. This means that achieving a more sustainable energy model requires focusing heavily on optimizing energy consumption patterns within port terminals, which account for 43% of the port’s total energy use. Given their significant impact, enhancing efficiency and integrating low-carbon energy solutions in these terminals is essential to driving the overall decarbonization of port operations.
To illustrate the above, we can analyse the results from one of the four most relevant ports of general interest in the Spanish state. The 2016 “GHG emissions report of the port of Valencia” [19] shows that scope 31 of the GHG inventory includes activities that occur in the port and are managed either by concessionaire companies or by the port authority, road transport and maritime transport. Among these, the activities that take place within the port and are managed either by concessionaire companies or directly by the port authority are those over which the port authority has the greatest management capacity. This distinction is important, as Scope 3 emissions also encompass road and maritime transport, which fall beyond the direct control of the port authority.
According to the activities classification given by the Climeport project and included in the 2016 “GHG emissions report of the port of Valencia” the port’s activities under Scope 3 can be classified as follows:
| Level | Name of Activity |
| 1 | Business Oriented Activities (Managed by Concessionaires) |
| 1.1. | Passenger Terminals: |
| 1.2. | Cargo Terminals: |
| 1.2.1 | Ro-Ro and Vehicle Terminals |
| 1.2.2. | Container Terminals |
| 1.2.3. | Multipurpose Terminals |
| 1.2.4. | Bulk Terminals: |
| 1.2.5. | Petroleum and Chemical Terminals (Dangerous cargo) |
| 1.3. | Private Services: |
| 1.3.1. | Storage of Cargo |
| 1.3.2. | Repair of Ships and Shipyards |
| 1.3.3 | Supply to Ships |
| 1.3.4. | Nautical Services |
| 1.3.5. | Hospitality Services |
| 2. | Services Oriented Activities (Managed by the Port Authority): |
| 2.1. | Infrastructure |
| 2.1.1. | Maintenance and Construction / Road Lighting |
| 2.2. | Port Services: |
| 2.2.1. | Pilots |
| 2.2.2. | Tugs |
| 2.2.3. | Mooring services |
| 2.3. | Administrative and Community Services: |
| 3. | Other activities. |
These activities have an annual energy consumption of 186 GWh, which corresponds to 43% of the total energy consumption of the port. In addition, the Port Authority’s own consumption—an extra 2%—should be added. Therefore, the managing body’s direct capacity for action accounts for 45% of the total energy consumption [18]
In addition to these activities, other possible sources for the reduction of greenhouse gases in ports are road transport and maritime transport, whose regulation goes beyond the direct management of port authorities but which they can facilitate by incorporating technology such as shore-side electricity or by using alternative fuels for trucks entering and leaving the port.
Integrating renewable energy generation plants in ports offers several opportunities to support the decarbonization of port activities. On the one hand, it allows increasing the energy independence of ports, in addition, in the case of surpluses, they can be used to produce alternative fuels (hydrogen, methanol, biofuels, etc.), as well as contribute to the capacity to supply clean energy to ships when they are at the berth. This clean energy can then be utilised in port terminals to facilitate the transition from fossil fuels to clean fuels or electricity during dockside cargo handling operations.
For all the above reasons, the need to dedicate resources to studying the marine environment to expand the capacities of ports to produce clean energy for use in ports is justified.
4. Met-Ocean Strategy for Assessing the Feasibility of Marine Renewable Energy Near Ports
4.1. Introduction
Feasibility studies for installing marine renewable energy systems near ports depend heavily on reliable meteorological and oceanographic (met-ocean) data. This data is essential for assessing energy potential, designing robust infrastructure, optimizing operations and maintenance, ensuring economic viability, and complying with environmental regulations. The availability and accuracy of met-ocean information directly affect the success of renewable energy projects in marine environments.
Marine renewable energy sources, such as wind, wave, and tidal energy, require precise data on the availability and variability of natural resources, including wind speeds, wave heights, and ocean currents [20]. Accurately characterizing these parameters enables the evaluation of a site’s energy potential and supports the optimization of infrastructure design. For example, offshore wind turbine projects need detailed information on wind direction and speed patterns, while wave energy systems rely on data about wave height, period and even direction. Without this foundational data, designing efficient and reliable energy infrastructure becomes infeasible.
Equally important is the role of met-ocean data in ensuring the safety and durability of infrastructure. Marine structures like platforms, buoys, and turbines are subjected to harsh conditions, including storms, high waves, and strong currents. To maintain the structural integrity and operational safety of these installations, engineers need precise information on extreme / mean weather events and environmental forces. Failure to account for these factors can result in significant damage, costly repairs, and even operational failures.
Operational efficiency and maintenance scheduling are also critically influenced by the availability of reliable data. Marine energy system maintenance is costly and hazardous, mainly when undertaken in adverse weather conditions. Predictive models based on accurate met-ocean data allow maintenance activities to be scheduled during favourable conditions, reducing operational risks and minimizing disruptions caused by unexpected breakdowns. This approach helps improve the overall cost-efficiency and reliability of renewable energy operations.
From an economic and regulatory standpoint, data reliability is crucial for assessing project feasibility and ensuring compliance with environmental standards. In the European Union, renewable energy initiatives must adhere to decarbonization goals outlined in the European Green Deal, imposes strict environmental impact regulations. A thorough understanding of the environmental conditions in the project area allows developers to design installations that minimize ecological disruption and align with regulatory requirements.
Moreover, ports require a stable and continuous energy supply to support their extensive operations. Integrating marine renewable energy into port service areas requires a deep understanding of natural resource variability and compatibility with the port’s energy demands. Seasonal and daily fluctuations in wind, wave, and tidal energy sources must be considered to ensure reliable power generation without compromising port activities. Additionally, it is crucial to calculate the energy potential, particularly for wave energy systems, as this variable is derived from fundamental wave parameters such as wave height, period, and direction. Accurate data supports renewable energy initiatives and other maritime activities, such as operational planning and environmental impact assessments. Given these requirements, obtaining high-quality met-ocean data is critical. Accurate data supports not only renewable energy initiatives but also other maritime activities, such as operations planning and environmental impact assessments. There are various options for acquiring such data, each with advantages and limitations regarding reliability, precision, and coverage. One approach is direct measurement in specific coastal areas, which involves installing specialized equipment such as weather stations, current meters, tide gauges, and water quality sensors [21]. These instruments collect real-time data on key variables, including wind speed and direction, wave height, water temperature, salinity, and ocean currents. The major advantage of this method is its high precision and local relevance, as data is obtained directly from the area of interest, eliminating the need for extrapolation. Additionally, these instruments can be customized to measure variables tailored to specific project requirements, providing immediate real-time updates that allow for rapid adjustments to maritime operations. However, the high costs associated with installation and maintenance—especially in remote or difficult-to-access areas—pose a significant challenge. Furthermore, direct measurement is geographically limited, as each sensor only captures data from its immediate surroundings, necessitating multiple installations to cover larger areas. These sensors are also vulnerable to harsh environmental conditions, which may compromise their functionality over time.
Alternatively, the use of virtual buoys generated using a numerical strategy could be considered. For example, SIMAR points managed by Puertos del Estado (Spanish Seaports Authority) offer a broader and more cost-effective solution in Spain. Additionally, met-ocean data is provided by various global and regional providers, such as the Copernicus Marine Environment Monitoring Service (CMEMS), the National Oceanic and Atmospheric Administration (NOAA), and the German Weather Service’s ICON (Icosahedral Nonhydrostatic) model. These systems provide access to extensive datasets on wave height, wind speed, currents, and other critical parameters. Their integration into numerical models enables regional and even global forecasting capabilities, supporting short-term operational planning and long-term feasibility studies for marine renewable energy projects.
These systems provide extensive meteorological and oceanographic data, including key parameters such as wave height, wind speed, ocean currents, and water temperature. This data is obtained through direct measurements and calibrated numerical models, which offer broad regional coverage without requiring additional equipment deployment. The data is further integrated into forecasting systems that enhance operational planning by combining real-time observations with predictive simulations. However, while these databases are valuable for large-scale analyses, their reliability depends heavily on validation and calibration with in situ instrumental data. Without such validation, discrepancies can arise due to the inherent limitations of general-purpose numerical models.
In particular, numerical databases for wave conditions are typically based on large-scale oceanic or global models. These models often rely on generalized numerical approximations that do not account for critical nearshore processes. For example, they overlook essential phenomena such as wave diffraction, shoaling, breaking, wave penetration / agitation, and reflection caused by interactions with the coastline or artificial structures such as breakwaters. These processes can significantly alter wave behaviour in coastal and port areas, leading to a mismatch between modelled predictions and actual local conditions. As a result, the direct application of these databases for site-specific assessments, such as those required in the present study, is limited without significant refinement and calibration.
This physical disconnection between the large-scale numerical models and the fine-scale coastal dynamics relevant to port and nearshore areas reduces the direct usability of these databases for project-specific objectives. Addressing this issue often requires supplementary local measurements and advanced numerical modelling tailored to the specific characteristics of the area under investigation. By integrating both large-scale data sources and localized models, the accuracy of wave condition predictions in coastal environments can be substantially improved, thereby enhancing the reliability of renewable energy feasibility studies and other maritime applications.
Comparing these two approaches highlights the trade-offs between precision and coverage. A hybrid approach that combines both methods could leverage their respective strengths, maximizing precision while ensuring broad geographical coverage for comprehensive monitoring and analysis. This integrated strategy would better support the development and sustainability of marine renewable energy infrastructure, as well as other critical maritime activities.
In the methodology of this study, a system was developed to assess wave-induced agitation conditions at various locations within the docks and piers of the ports of Valencia, Gandía, and Sagunto. This system is also designed to estimate the wave power and energy potential, utilizing both external and internal wave conditions. By accurately characterizing these parameters, the system provides essential data to support the design and optimization of wave energy generation systems, ensuring compatibility with the specific hydrodynamic conditions present in port service areas. This approach contributes to assessing the feasibility of integrating marine renewable energy infrastructure in these environments. Next, a general description of the individual tasks is provided.
4.1. Selection of the Most Suitable Agitation Model
Currently, numerical models based on elliptic mild-slope equations are the most commonly used for this type of study. These models offer a practical and effective way to accurately evaluate port agitation, considering real bathymetric contours and complex bathymetries for irregular waves. These models are capable of solving linear processes such as refraction, diffraction, shoaling, and reflection (total and partial), as well as energy dissipation processes due to friction and wave breaking in a two-dimensional numerical domain. This project proposes the MSP port agitation model developed by IHCantabria. The MSP model solves the aforementioned elliptic mild slope equations using a finite element numerical scheme. The MSP model [22] has been successfully employed in various research projects, consulting engagements, and technical support tasks from 2001 to the present, delivering excellent results and highly competitive performance.
4.2. Bathymetric, Port Contour / Typologies, Instrumental Data and Forcing Used
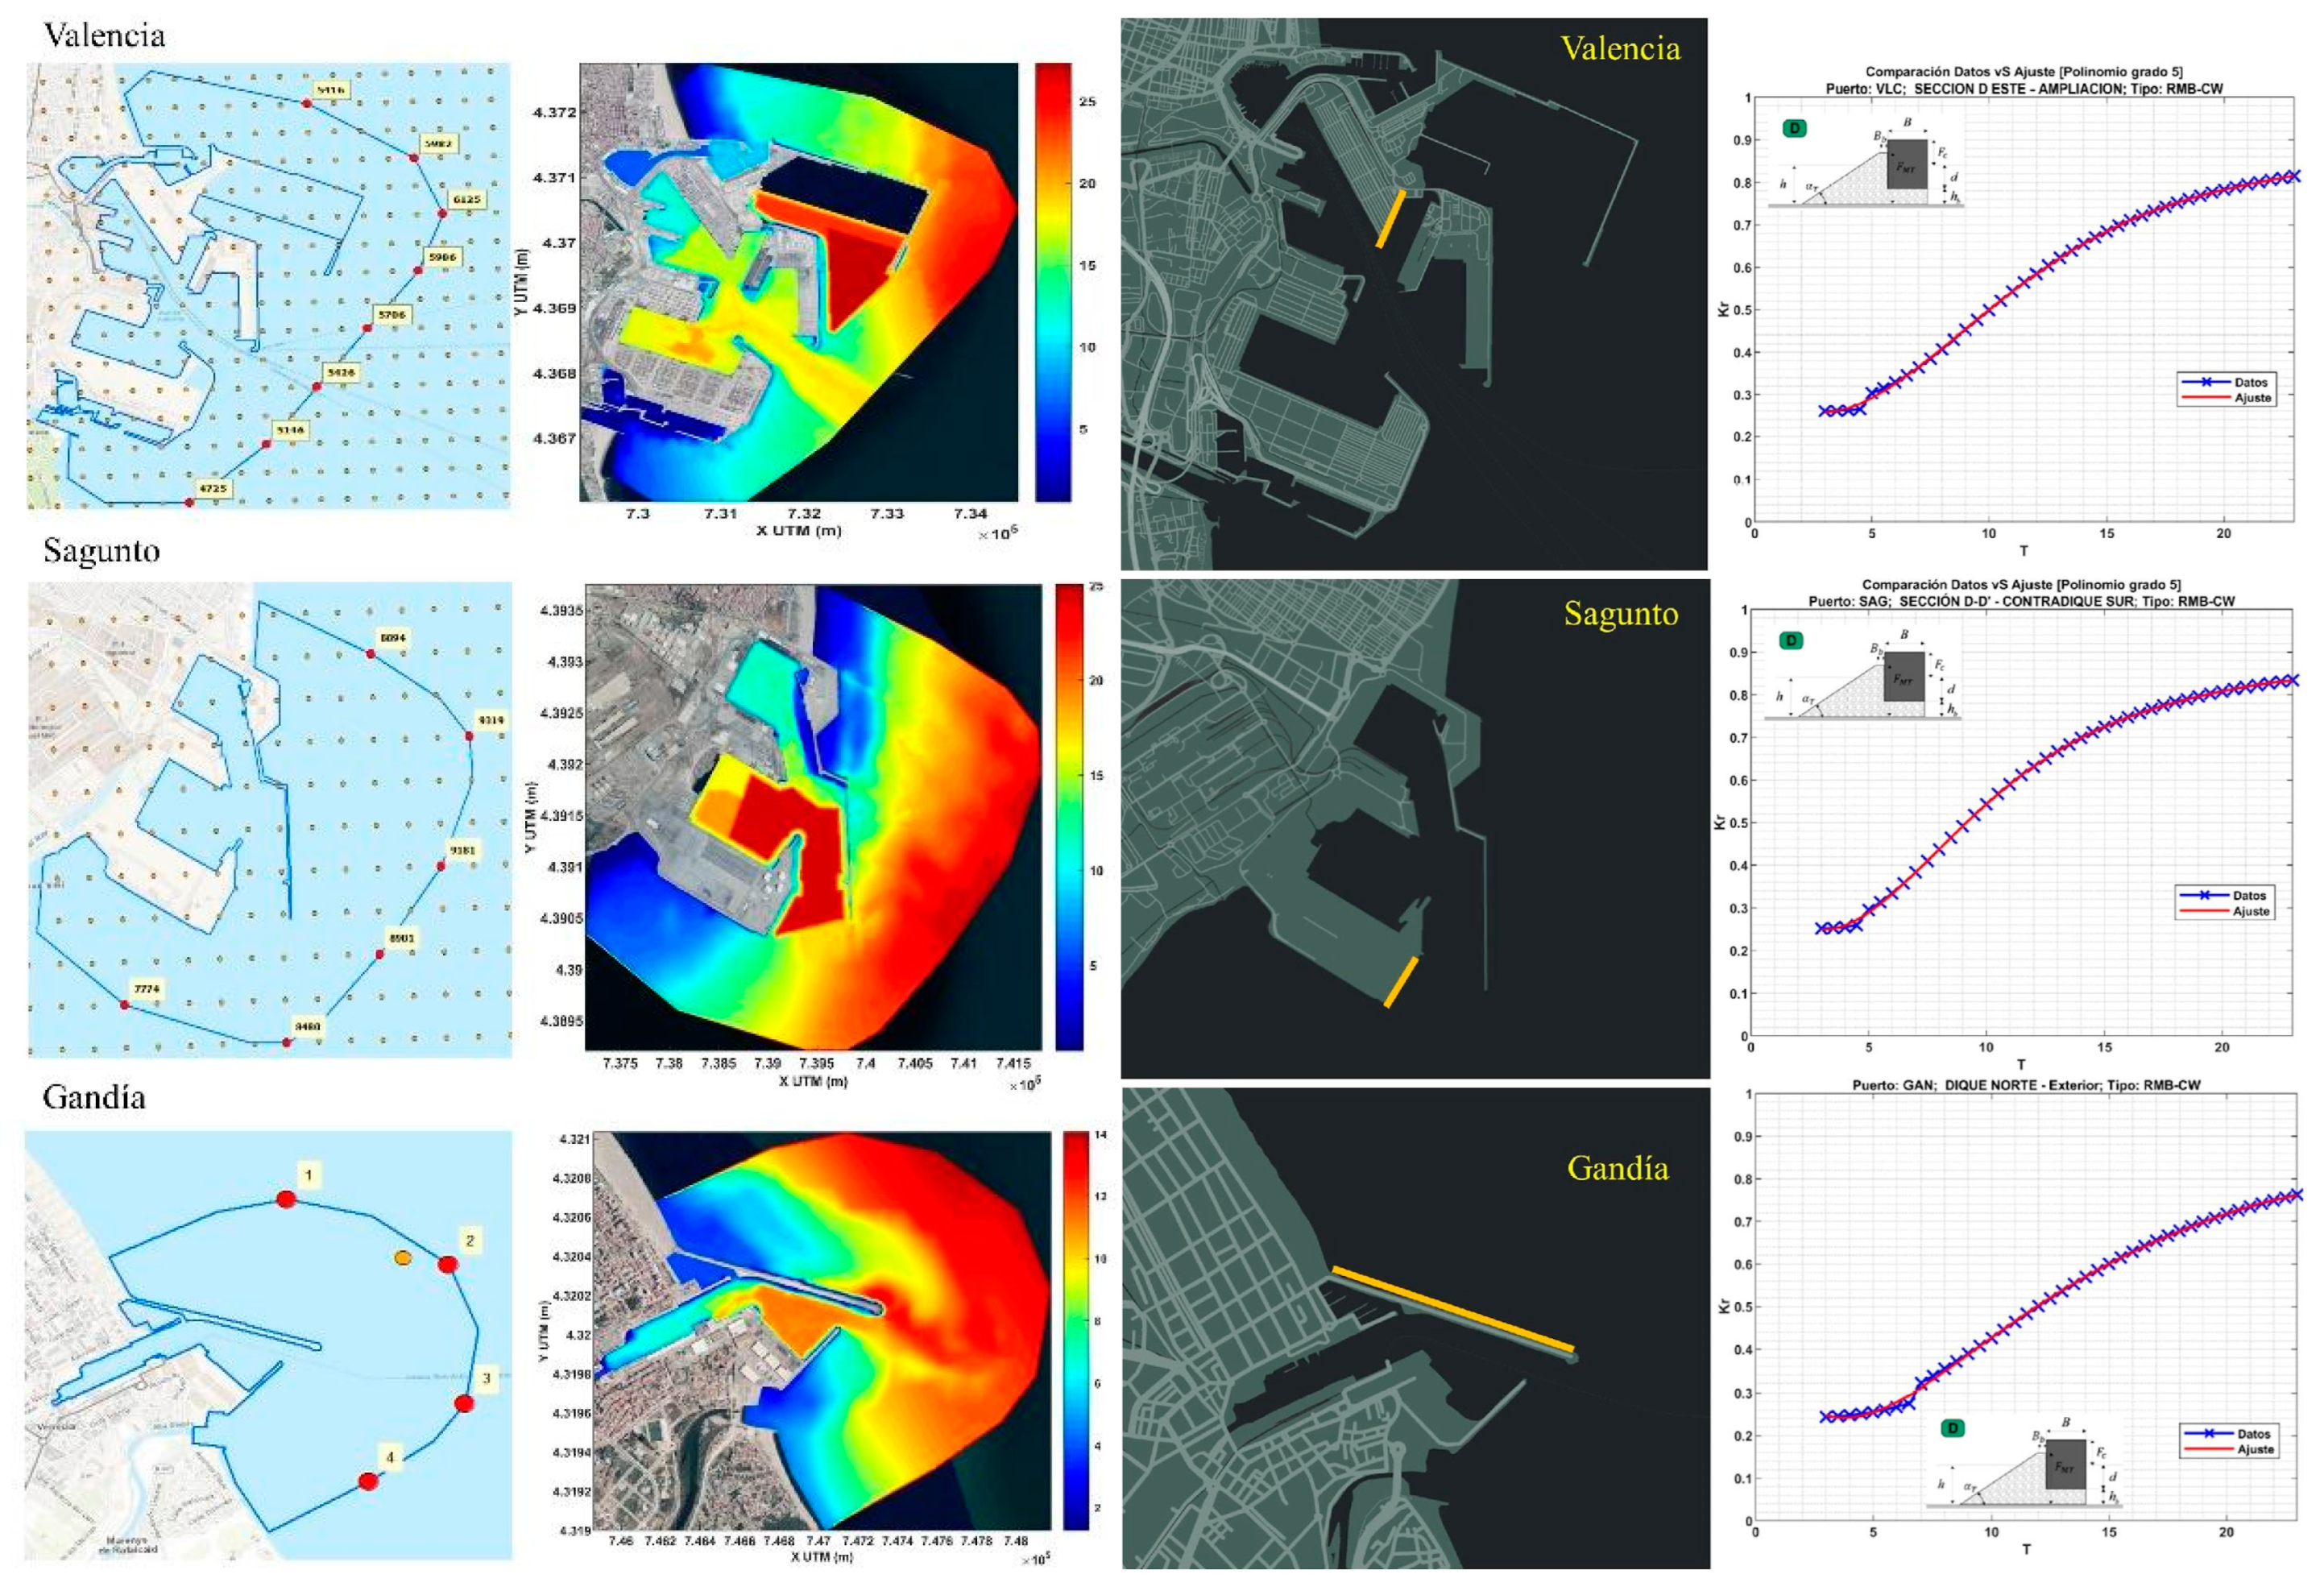
One of the fundamental and crucial tasks in developing the operational agitation system, which paves the way for a proper setup of the numerical strategy, is related to the concept of data normalization. Instrumental data from field campaigns or permanent measurement networks of Puertos del Estado, initially provided in a free format (ASCII). Data regarding port section typologies includes vital information about the various typologies that comprise each port’s perimeters, structures, docks, and protective elements. Spectral forcing data, obtained from previous numerical executions under the coverage of the regional SAPO system of the Puertos del Estado, provide spectral wave files in the predefined format of the SWAN wave propagation model. Data about the general port geometry were aligned with the updated reality of each port facility. Bathymetric data standardized within a Geographic Information System (GIS) platform in native ArcGIS® formats defining the final port geometry (port perimeter) considered for each study port (Sagunto, Valencia, and Gandía), see Figure 1.
4.3. Selection of Coastal/Port Contour Reflection Coefficients
To provide the most accurate and realistic response of port energy concerning the incoming and penetrating waves into the docks. This is why part of the work developed by IHCantabria in recent years has focused on understanding how classical agitation numerical models handle the reflection response of waves from inner and outer port contours. The MSP model assesses an appropriate and more realistic application of dynamic partial reflection coefficients. These coefficients are based on frequency variations of the incident waves that reach each contour-based on [23, 24] classification for 6 dike-family typologies to obtain a polynomial fit that ultimately defines the reflection coefficients as a function of the incident wave period. Thus, a unique function will be obtained for each typology (see Figure 1).
Figure 1.
Valencia, Sagunto and Gandía ports. First row panels: numerical domain and forcing locations; second row panels: numerical mesh and bathymetry definition. Third and fourth row panels: Wave-Reflection coefficients (Kr) vs. Individual / incident wave period (T), for Valencia, Sagunto and Gandía Ports and for different breakwater / quay sections.
4.4. Design of the MSP Numerical Grid
The numerical domain must adhere to the constraints of the MSP model, the spatial dimensions of the study area, and the waves that will propagate within it, as discussed in previous sections. The topographic file provided by the APV will be used to define the MSP port contour. On the other hand, to delimit the marine side of the execution domain, the MSP contour is completed with the line or polygon of wave generation, traditionally known as the “generation perimeter”, where the tool introduces the irregular waves, taking into account the directional range of waves in the study area so that the contour accommodates all of them. Furthermore, the criterium of numerical efficiency is acquired using an adaptive mesh in triangular and unstructured finite elements. The mesh allows optimization of the resources required by the MSP model (CPU memory) since the nodes and elements of the finite element mesh adapt to the geometric contours of the port and corresponding bathymetric depths. This concentrates a higher number of elements in shallower areas of the domain (smaller wave periods) and relaxes the mesh for deeper areas (see Figure 2). It is crucial to ensure that the generated mesh adequately evaluates the minimum wave period.
4.5. Model Runs and General Results
The MSP model is run on the Linux system, allowing simulations to be conducted at the IHCantabria Supercomputing and Information Technologies Laboratory. This significantly alleviates the computational burden of the project. Specifically, the NEPTUNO node within the ALTAMIRA node of the University of Cantabria is employed, part of the Spanish Supercomputing Network. This node features 1,296 cores, 100 TB of storage, and 5 TB of RAM. Thanks to this supercomputing infrastructure, a monochromatic wave strategy can be expedited significantly, as they can be divided among different processors, thereby parallelizing the executions. For example, for a large port such as the Port of Valencia, with 528 monochromatic waves to be executed (with 3 repetitions based on tidal levels, reaching 1,584 monochromatic waves), the overall execution time can be reduced to a maximum of 3 days. This capability provided by the IHCantabria infrastructure is advantageous for any repetition of catalogues (geometry changes, validation and calibration work, etc.) typically carried out in the pre-numerical assembly phase of each port (see Figure 3). Iterations (repetitions) are crucial during this phase to provide ultimate reliability to the operational agitation system. The results of each propagated case for each tidal level are stored in a general Hypermatrix for each port, containing significant wave height (Hm0), peak wave period (Tp) and wave energy potential (Pw) at every location within the entire numerical domain, for all the monochromatic runs and water levels. These catalogues of monochromatic waves will be used to reconstruct the spectra predicted by SAPO and obtain the spectral map of Hs across the entire domain. These pre-run agitation catalogues were provided to the client in Python 3.5 format for direct implementation into their operations and Environmental Management Dashboard (CMA). Additionally, analogous matrices are generated for the free surface and phase, which will be used for the directional wave decomposition of each variable related to waves and energy potential.
4.6. Pre-Operational Validation and System Calibration
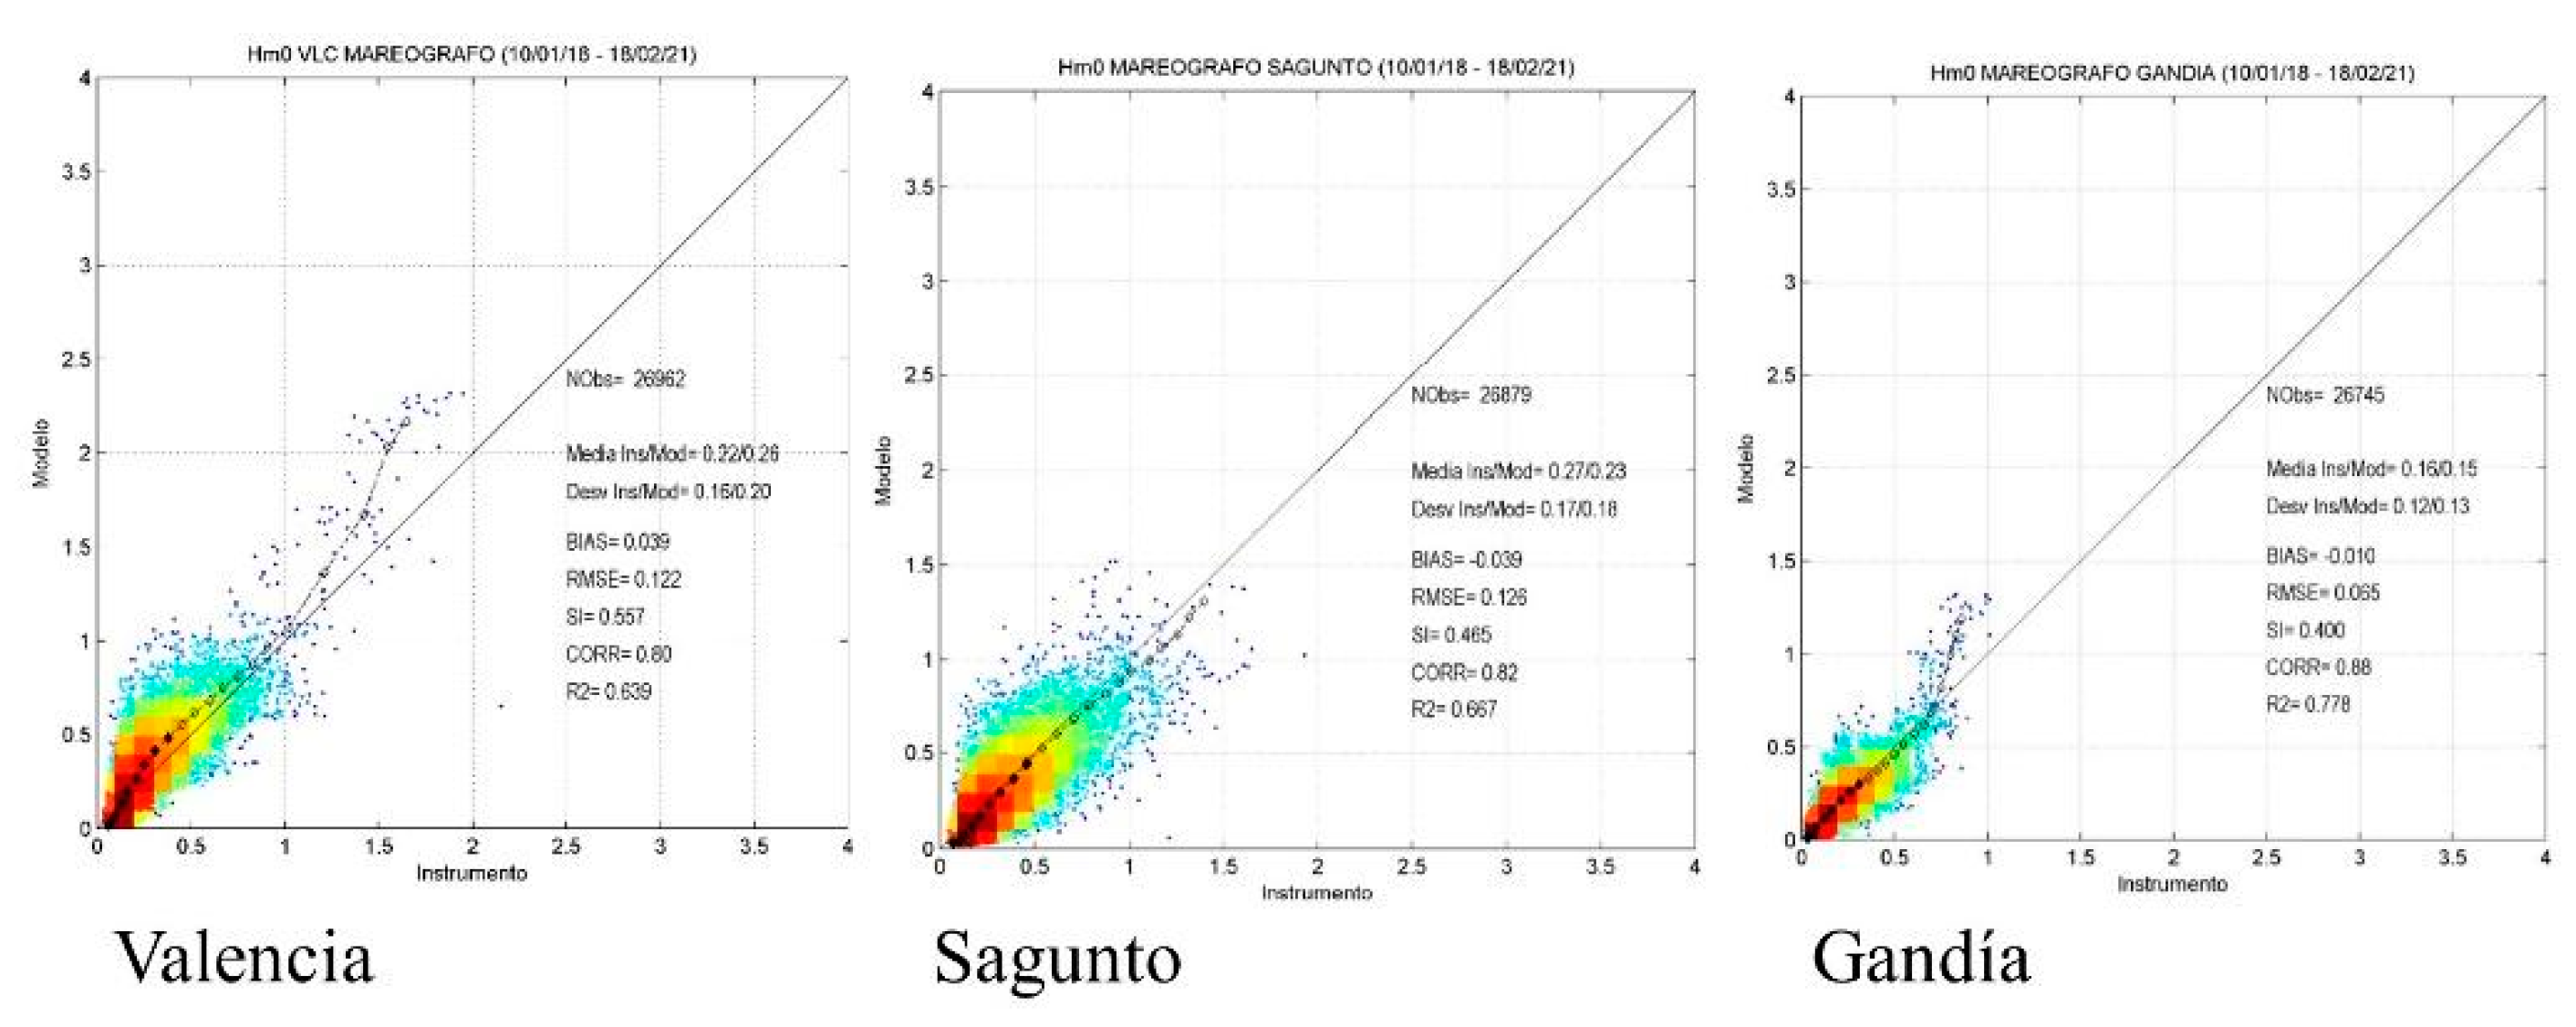
Using the spectral reconstruction codes, the system underwent pre-operational validation and, if necessary, calibration The purpose is to assess the quality of the results produced by the developed wave and agitation operational system at each port before its implementation by Puertos del Estado. To accomplish this, the developed codes were executed on dates when coincident wave data are available at the study port (SAPO system input for the MSP model, to be provided by Puertos del Estado), along with in-situ instrumental data from coastal buoys and radar tide gauges operated by Puertos del Estado. The goals of this validation process are twofold: a) to understand the functionality of the numerical wave propagation and port agitation system, the discrepancies it introduces compared to reality, and potential errors that might arise, and b) to recalibrate the results within the generated MSP numerical grids. If necessary, this recalibration aims to refine the initially considered reflection coefficients (an iterative process). The validation of the numerical system was performed using classic statistical parameters (BIAS, RMSE, SI, CORR, and R2) generated by comparing two similar datasets from different sources (scatter plots illustrating the comparison between instrumental data and numerical predictions, see Figure 4). This task quantified the predictive capability of the agitation model and concurrently identify weaknesses that contribute to divergent predictions, potential errors in the numerical setup, or disparities in the bathymetric and geometric information of each port compared to the physical reality of the problem.
4.7. Post-Processing
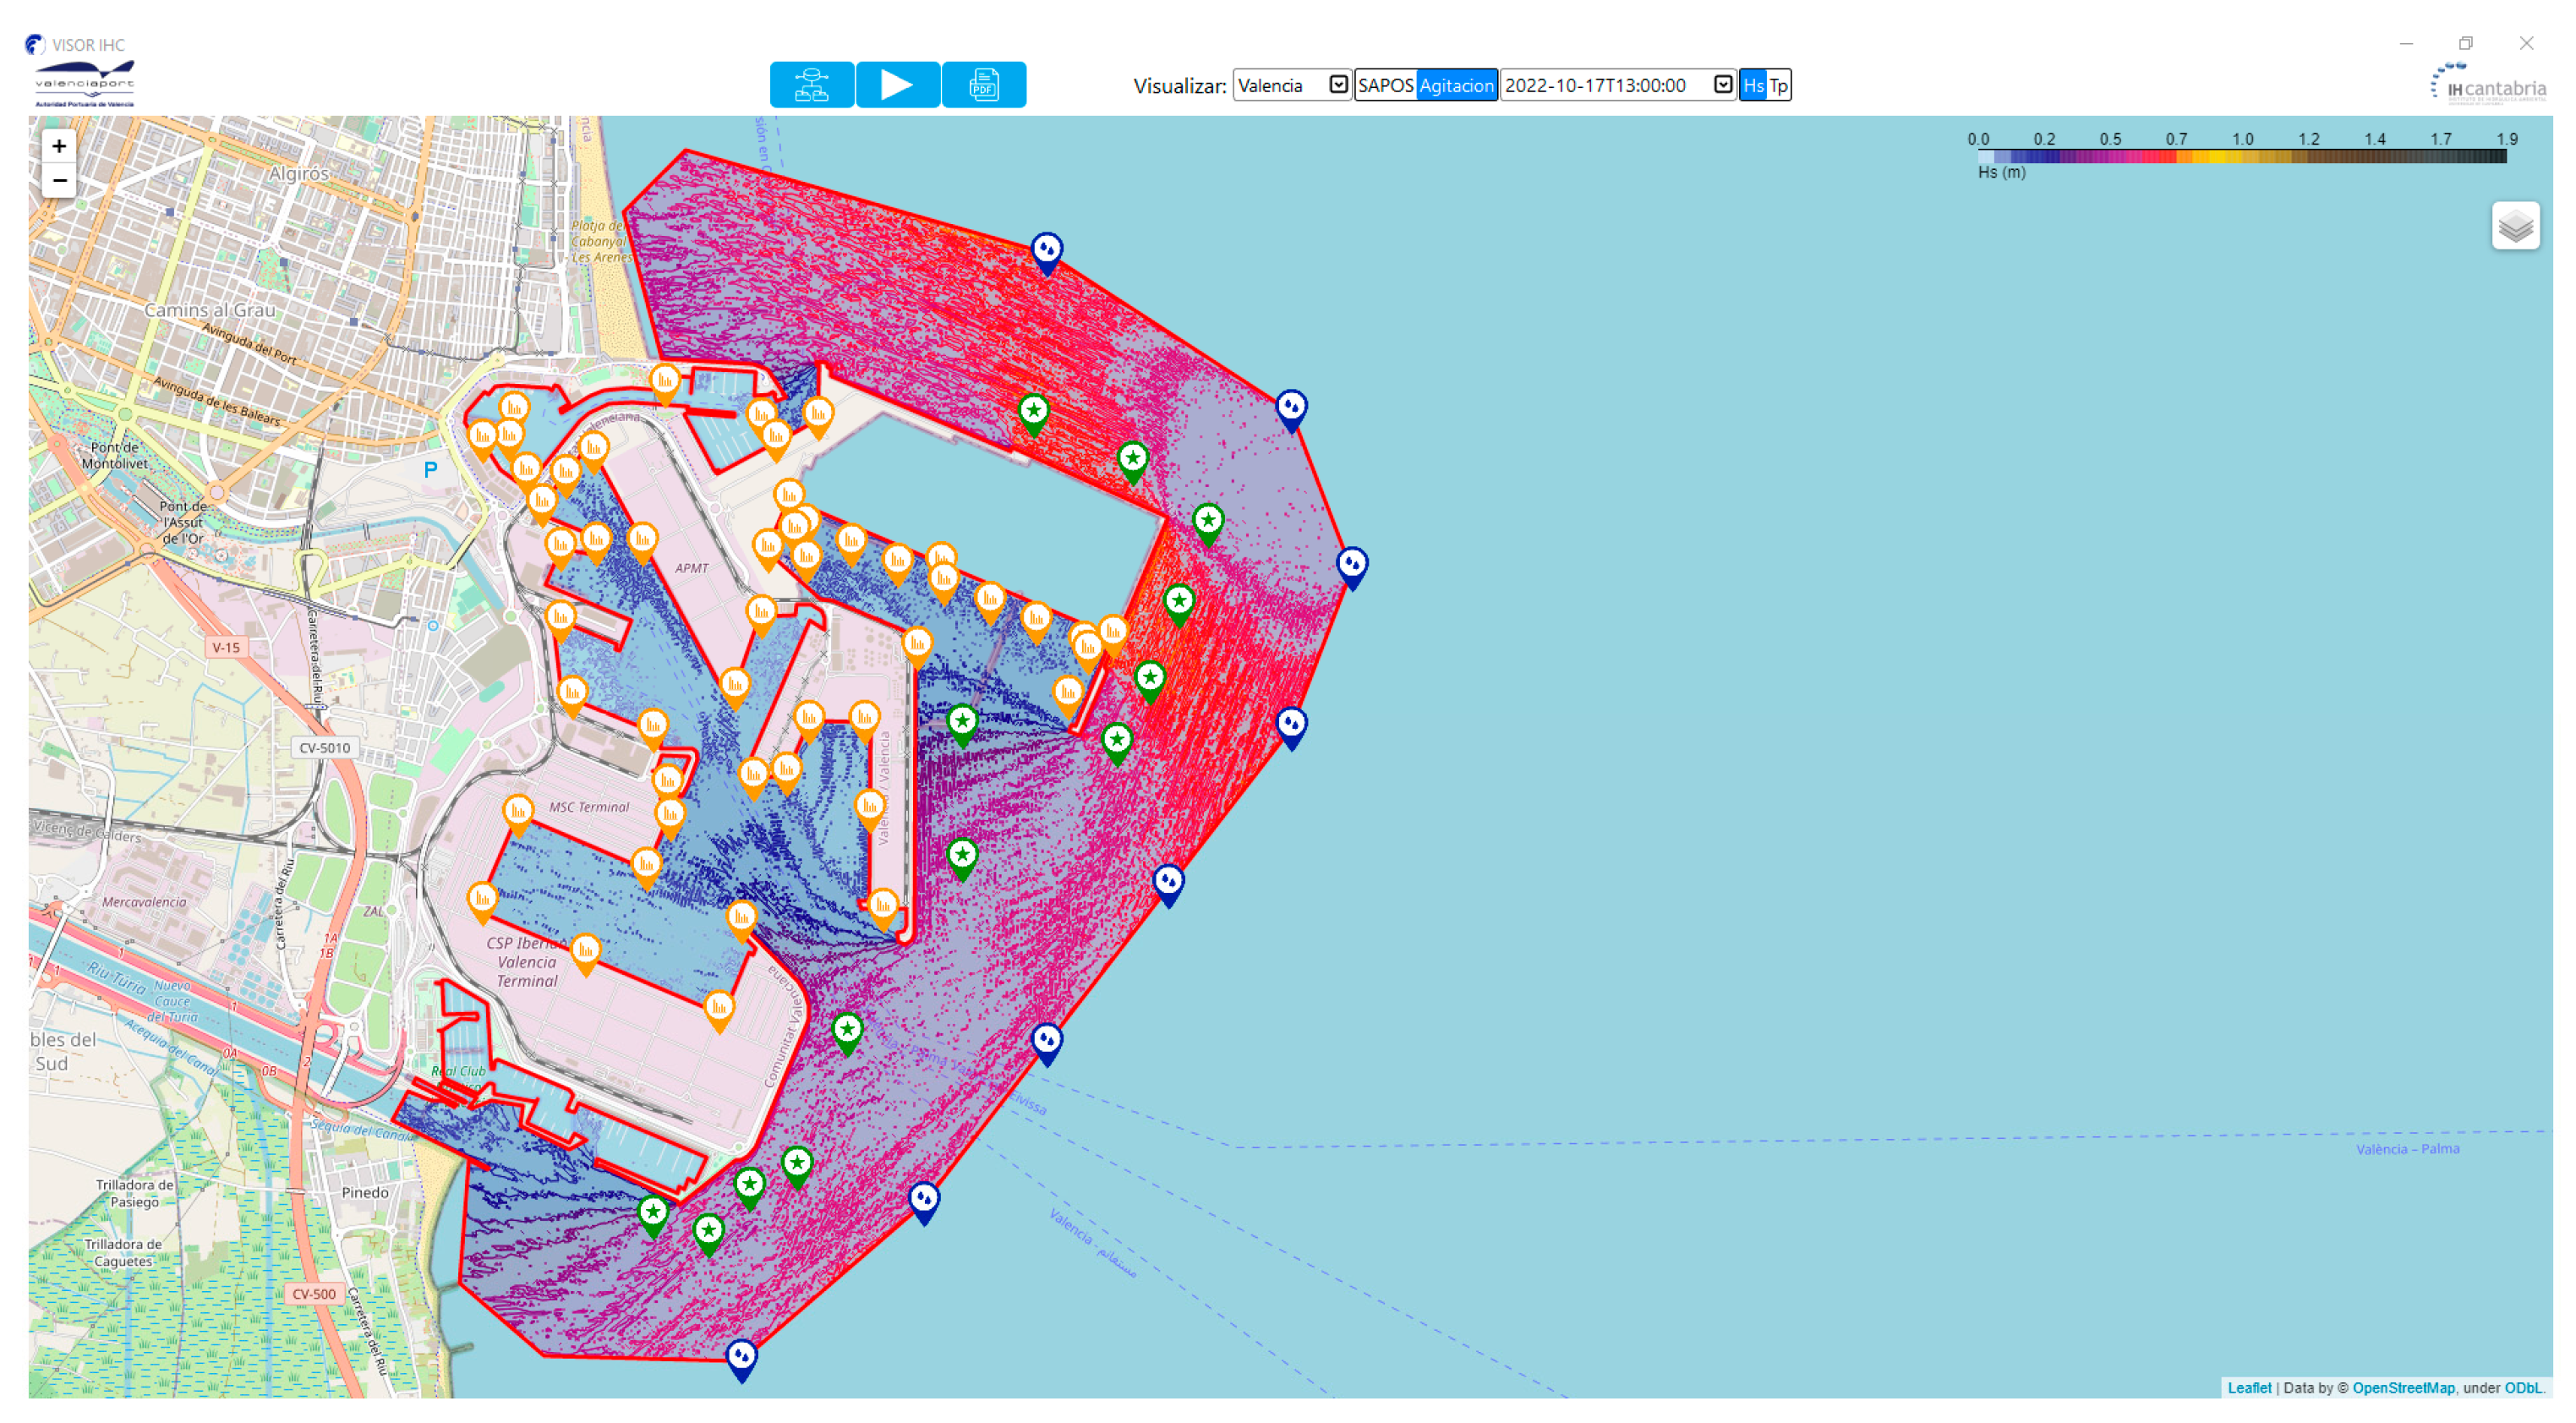
The system was included within a web-based Graphical User Interface (GUI), capable of providing the following visualizations: i. Hourly agitation prediction maps for the next 72 hours for Hs. ii. Hourly time series of Hs, Tp, and Pw at specific points of interest (pre-selected and agreed upon with APV for each study port). iii. Ocean-meteorological prediction reports featuring agitation maps across the port domain and time series of Hs, Tp, Pw at points of interest, iv. Directional wave disaggregation. And v. Generation of hourly energy potential maps covering a minimum one year.
For the calculation of directional energy potential (Pw), the method employs a sea state represented hourly by its directional energy spectrum S(ω,θ), which represents the temporal energy flux given by the following expression, integrating the energy fluxes from all components of the spectrum:
where:
- ρ is the density of seawater, ρ = 1,025 kg/m³
- is the acceleration due to gravity, g = 9.81 m/s²
- S(ω,θ) is the directional energy spectrum representing the energy density (energy per unit area) assigned to each frequency ω and direction θ of the sea state.
- Cg(ω,z) is the group celerity representing the propagation velocity of wave energy, calculated by:
- is the wave celerity, c = L/T = ω/k
- ω is the angular frequency of the wave, ω = 2π/T
- is the wave number, k = 2π/L
- is the wave period
- is the wavelength
- is the water depth (positive distance from the surface to the seabed)
Angular frequency, wave number, and depth are related by the dispersion relation:
In cases where the directional spectrum of the sea state is unavailable, wave power can be determined using spectral parameters representative of the sea state (obtained directly through the spectral reconstruction method developed by IHCantabria and implemented in Puertos del Estado’s operations), as follows:
where the moment of order n of the energy spectrum is:
Figure 5.
GUI main screen for wave agitation and wave potential energy forecast, example for Valencia Port.
Figure 5.
GUI main screen for wave agitation and wave potential energy forecast, example for Valencia Port.
5. Conclusions and Future Perspectives
The growing imperative to decarbonize maritime transport and port operations necessitates innovative solutions integrating renewable energy sources with predictive meteorological modelling. This study presents a model-based approach to assessing marine energy potential within and around port service areas, offering a pathway for sustainable energy integration. The conclusions drawn from this research highlight the relevance of advanced computational modelling and data-driven methodologies in evaluating the feasibility of marine renewable energy infrastructure.
5.1. Integration of Marine Renewable Energy in Port Operations
The findings underscore ports’ need to diversify their energy sources by incorporating offshore renewable energy systems such as wave and wind power. Implementing such systems within port service areas provides a dual advantage: reducing dependency on fossil fuels and ensuring a stable, sustainable energy supply tailored to port operational demands. By leveraging meteorological and oceanographic modelling, ports can optimize the placement and efficiency of renewable energy installations, mitigating the inherent variability of marine energy sources.
The use of weather and ocean forecasting models will enable the activation of the necessary investments to guarantee the energy supply that ports will need in order to achieve the objective of decarbonisation.
5.2. The Role of Predictive Modeling in Enhancing Energy Feasibility Assessments
The methodology employed in this study illustrates how numerical modelling enhances the accuracy and reliability of marine energy assessments and ensures robust feasibility studies. Met-ocean forecasting tools, such as the MSP port agitation model, allow for a detailed evaluation of wave-induced energy potential while considering real-time climatic conditions. This approach bridges the gap between theoretical energy estimates and practical implementation, ensuring that renewable energy projects are both technically and economically viable.
Additionally, integrating high-resolution bathymetric data, port contour configurations, and instrumental observations into the numerical modelling framework significantly enhances the predictive capabilities of wave energy assessments. The validation process using real-world data ensures that the model outputs align closely with actual wave dynamics, strengthening the decision-making process for renewable energy deployment.
5.3. Implications for Port Sustainability and Energy Sovereignty
The transition towards sustainable port operations aligns with global climate objectives and regulatory mandates, such as those set forth by the International Maritime Organization (IMO) and the European Union’s Fit for 55 initiatives. By adopting marine renewable energy solutions, ports can play a pivotal role in reducing maritime sector emissions and advancing the broader energy transition.
Applying wave and tidal energy converters, as well as floating photovoltaic and floating wind power generation systems, among other renewable energy technologies, in port service areas represents a tangible opportunity for ports to achieve energy sovereignty. As energy demand in ports continues to increase due to electrification initiatives and the growing adoption of shore-side electricity (SSE) power systems, marine renewables can serve as a complementary and decentralised energy source. This not only reduces dependence on external power grids, but it also improves the resilience of port energy infrastructures to market fluctuations and supply chain disruptions.
5.4. Future Directions and Research Opportunities
Several avenues for future research emerge from this study. Firstly, further refinement of numerical modelling techniques, particularly in representing small-scale hydrodynamic processes, can enhance the precision of marine energy assessments. Secondly, developing hybrid renewable energy systems, integrating waves, wind, and solar power within port environments, warrants further exploration to maximize energy yield and reliability.
Additionally, the socio-economic implications of marine renewable energy deployment in ports should be examined in greater depth. Future research should investigate the economic feasibility of different marine energy technologies, considering installation costs, maintenance requirements, and long-term operational benefits. Furthermore, policy frameworks and financial incentives tailored to promote renewable energy adoption in ports must be analysed to support the large-scale implementation of sustainable energy solutions. In particular, the regulations governing the consenting processes for the installation of renewable energy generation systems in port service waters should be faster and more efficient.
As an example of direct application of the methodology described in this article, it is worth noting that it has been applied in the preliminary feasibility studies for the implementation of two pilot actions in the ports of Sagunto and Valencia. These pilot projects, funded by IDAE (Institute for Diversification and Energy Saving) under the Next generation Programme (Renmarinas Demos Initiative), aim to demonstrate the feasibility of integrating marine renewable energy into port infrastructure. The initiatives include a 270 kW Wave Energy Converter (WEC) installed on the existing breakwater of the port of Sagunto and a 1 MW floating photovoltaic platform (PV-bos) deployed in the service waters of the port of Valencia under the management of the Port Authority of Valencia.
5.5. Final Considerations
This study demonstrates that ports possess significant potential for integrating marine renewable energy into their operations. Advanced numerical modelling and predictive weather forecasting systems enable precise evaluations of energy potential, facilitating informed decision-making. As ports worldwide seek to align with sustainability targets and enhance energy security, the methodologies presented in this research offer a valuable framework for guiding future developments in marine renewable energy deployment.
Achieving a sustainable maritime sector requires a holistic approach combining technological innovation, regulatory compliance, and collaborative industry efforts. By promoting interdisciplinary research and engaging stakeholders across the maritime and energy sectors, the vision of self-sufficient, decarbonized ports can become a reality.
Author Contributions
R. Cascajo: Conceptualization, Methodology, Investigation, Data curation, Resources, Formal analysis, Funding acquisition, Writing - Original draft preparation; G. Diaz-Hernandez: Conceptualization, Methodology, Investigation, Resources, Supervision, Writing – Critical review; R. Molina: Conceptualization, Methodology, Investigation, Resources, Writing – Critical.
Acknowledgments
The authors would like to express their sincere gratitude to the Port Authority of Valencia for their valuable support, for providing key initial data, and for sharing their vision and interest in this research. Their collaboration and commitment have been instrumental in the development of this study.
Funding information. The “Model-Based Weather Forecasting Systems for Validation of Areas for Marine Energy Deployment in Port Service Areas” project has been co-financed by the European Union through the Interreg Sudoe program, under grant number SOE/P4/E0960.
Conflicts of Interest
The authors declare no conflicts of interest.
| 1 | The calculation of greenhouse gas emissions is divided into three scopes: Scope 1: direct emissions, Scope 2: energy-related indirect emissions, and Scope 3: indirect emissions from other activities. |
References
- United Nations Conference on Trade and Development (UNCTAD). (2022). Review of Maritime Transport 2022. https://unctad.org, accessed on 26th January 2025.
- International Maritime Organization (IMO). (2020). Fourth IMO GHG Study 2020. https://www.imo.org, accessed on 26th January 2025.
- European Community Shipowners’ Associations (ECSA). (2021). Decarbonization Pathways for Maritime Transport. https://www.ecsa.eu, accessed on 26th January 2025.
- Port of Rotterdam. (2023). Shore Power Projects for Sustainable Shipping. https://www.portofrotterdam.com, accessed on 26th January 2025.
- European Commission. (2021). Fit for 55: Delivering the EU’s 2030 Climate Target on the Way to Climate Neutrality. https://ec.europa.eu, accessed on 26th January 2025.
- https://www.offshorewind.biz/2023/07/07/port-of-esbjerg-lines-up-eur-780-million-investment-in-offshore-wind-turbine-production-facilities. Accessed on 17th March 2025.
- Pérez-Collazo, C., Greaves, D., Iglesias, G. (2015). A review of combined wave and off-shore wind energy, Renewable and Sustainable Energy Reviews, Volume 42, Pages 141-153, ISSN 1364-0321. [CrossRef]
- Linfeng, L. et al. (2024), Optimal planning of renewable energy infrastructure for ports under multiple design scenarios considering system constraints and growing transport demand, Journal of Cleaner Production, Volume 477, ISSN 0959-6526. [CrossRef]
- Hassan, G. (2020). Offshore Wind Resource Assessment Techniques. https://www.dnv.com, accessed on 26th January 2025.
- World Meteorological Organization (WMO). (2022). Advances in Numerical Weather Prediction for Ports. https://public.wmo.int. Accessed on 26th January 2025.
- DNV. (2022). Maritime Forecast to 2050: Energy Transition Outlook. https://www.dnv.com, accessed on 28th January 2025.
- European Commission. (2022). Extension of the EU Emissions Trading System to Maritime Transport. https://ec.europa.eu. Accessed on 28th January 2025.
- European Parliament. (2023). Alternative Fuels Infrastructure Regulation (AFIR). https://www.europarl.europa.eu. Accessed on 28th January 2025.
- Port of Rotterdam. (2023). Hydrogen and LNG Bunkering Facilities. https://www.portofrotterdam.com. Accessed on 28th January 2025.
- European Sea Ports Organisation. (2022). Sustainable Ports in Europe: Shore-Side Electricity. https://www.espo.be. Accessed on 28th January 2025.
- Global Maritime Forum. (2022). The Development of Green Shipping Corridors. https://www.globalmaritimeforum.org. Accessed on 28th January 2025.
- WindEurope. (2023). Floating Offshore Wind Farms: Opportunities for Ports. https://windeurope.org. Accessed on 28th January 2025.
- Cascajo, R.; García, E.; Quiles, E.; Correcher, A.; Morant, F. (2019). Integration of Marine Wave Energy Converters into Seaports: A Case Study in the Port of Valencia. Energies, 12, 787. [CrossRef]
- Informe de emisiones de gases de efecto invernadero del puerto de valencia. Año 2016. https://www.valenciaport.com/wp-content/uploads/Memoria-Verificaci%C3%B3n-GEI-2016.pdf. Accessed on 3rd March 2025.
- Cascajo, R. Cascajo, R., Molina, R., & Pérez-Rojas, L. (2022). Sectoral Analysis of the Fundamental Criteria for the Evaluation of the Viability of Wave Energy Generation Facilities in Ports—Application of the Delphi Methodology. Energies, 15(7), 2667. [CrossRef]
- Puertos del Estado. (n.d.). Red de boyas: Información meteorológica y oceanográfica. https://www.puertos.es, accessed on 28th January 2025.
- G. Diaz-Hernandez, B. Rodríguez Fernández, E. Romano-Moreno et al., An improved model for fast and reliable harbour wave agitation assessment. Coastal Engineering, Volume 170, 2021, 104011, ISSN 0378-3839. [CrossRef]
- Vílchez, M., Clavero, M., &Losada, M. A. (2015). “Operational behaviour of a 2D breakwater: Synthesis and design performance curves”. Report EM 200. Instituto Interuniversitario de Investigación del Sistema Tierra en Andalucía. Sede CEAMA. Universidad de Granada.
- Vílchez, M., Clavero, M., & Losada, M. A. (2016). “Hydraulic performance of different non-overtopped breakwaters types under 2D wave attack”, Coastal Engineering, Volume 107, January 2016, Pages 34-52.
Figure 2.
Example (zoom) of the triangular and depth-adaptive mesh used for the MSP runs at Valencia Port.
Figure 2.
Example (zoom) of the triangular and depth-adaptive mesh used for the MSP runs at Valencia Port.
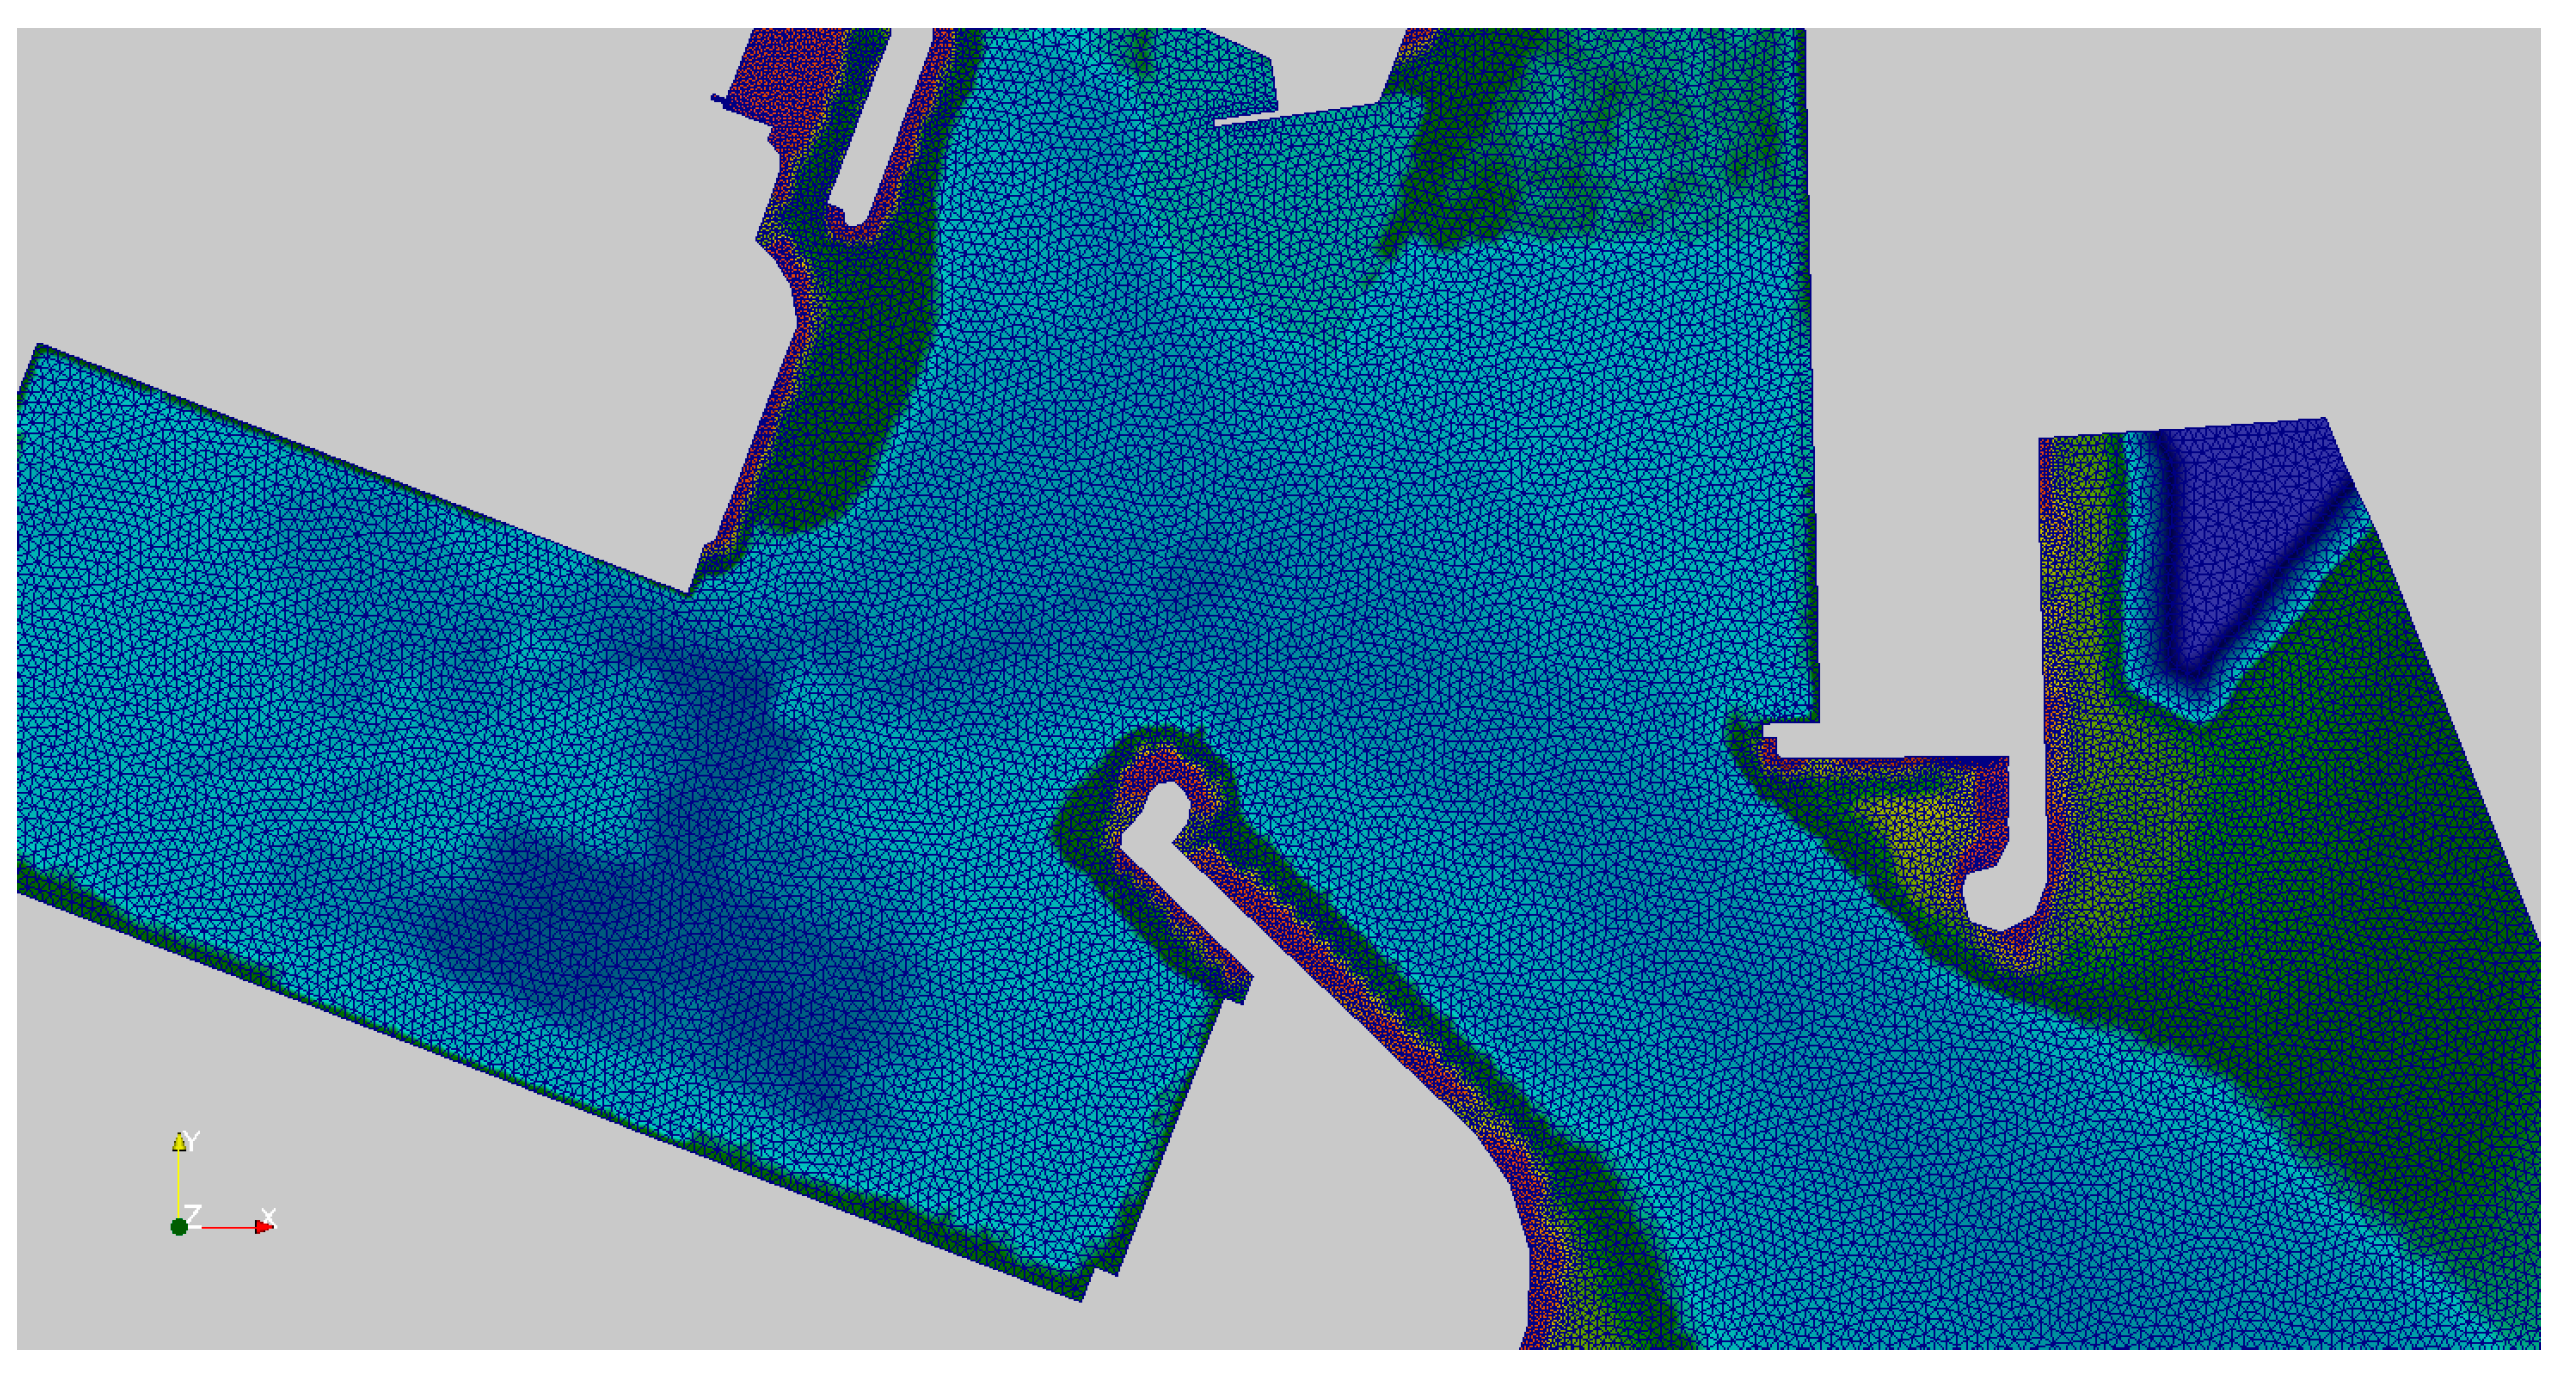
Figure 3.
An example of one monochromatic wave run at Valencia Port. Free surface (left panel) and Wave height (right panel), for a H=0.25 m, T=11 s and Dir=150ºN.
Figure 3.
An example of one monochromatic wave run at Valencia Port. Free surface (left panel) and Wave height (right panel), for a H=0.25 m, T=11 s and Dir=150ºN.
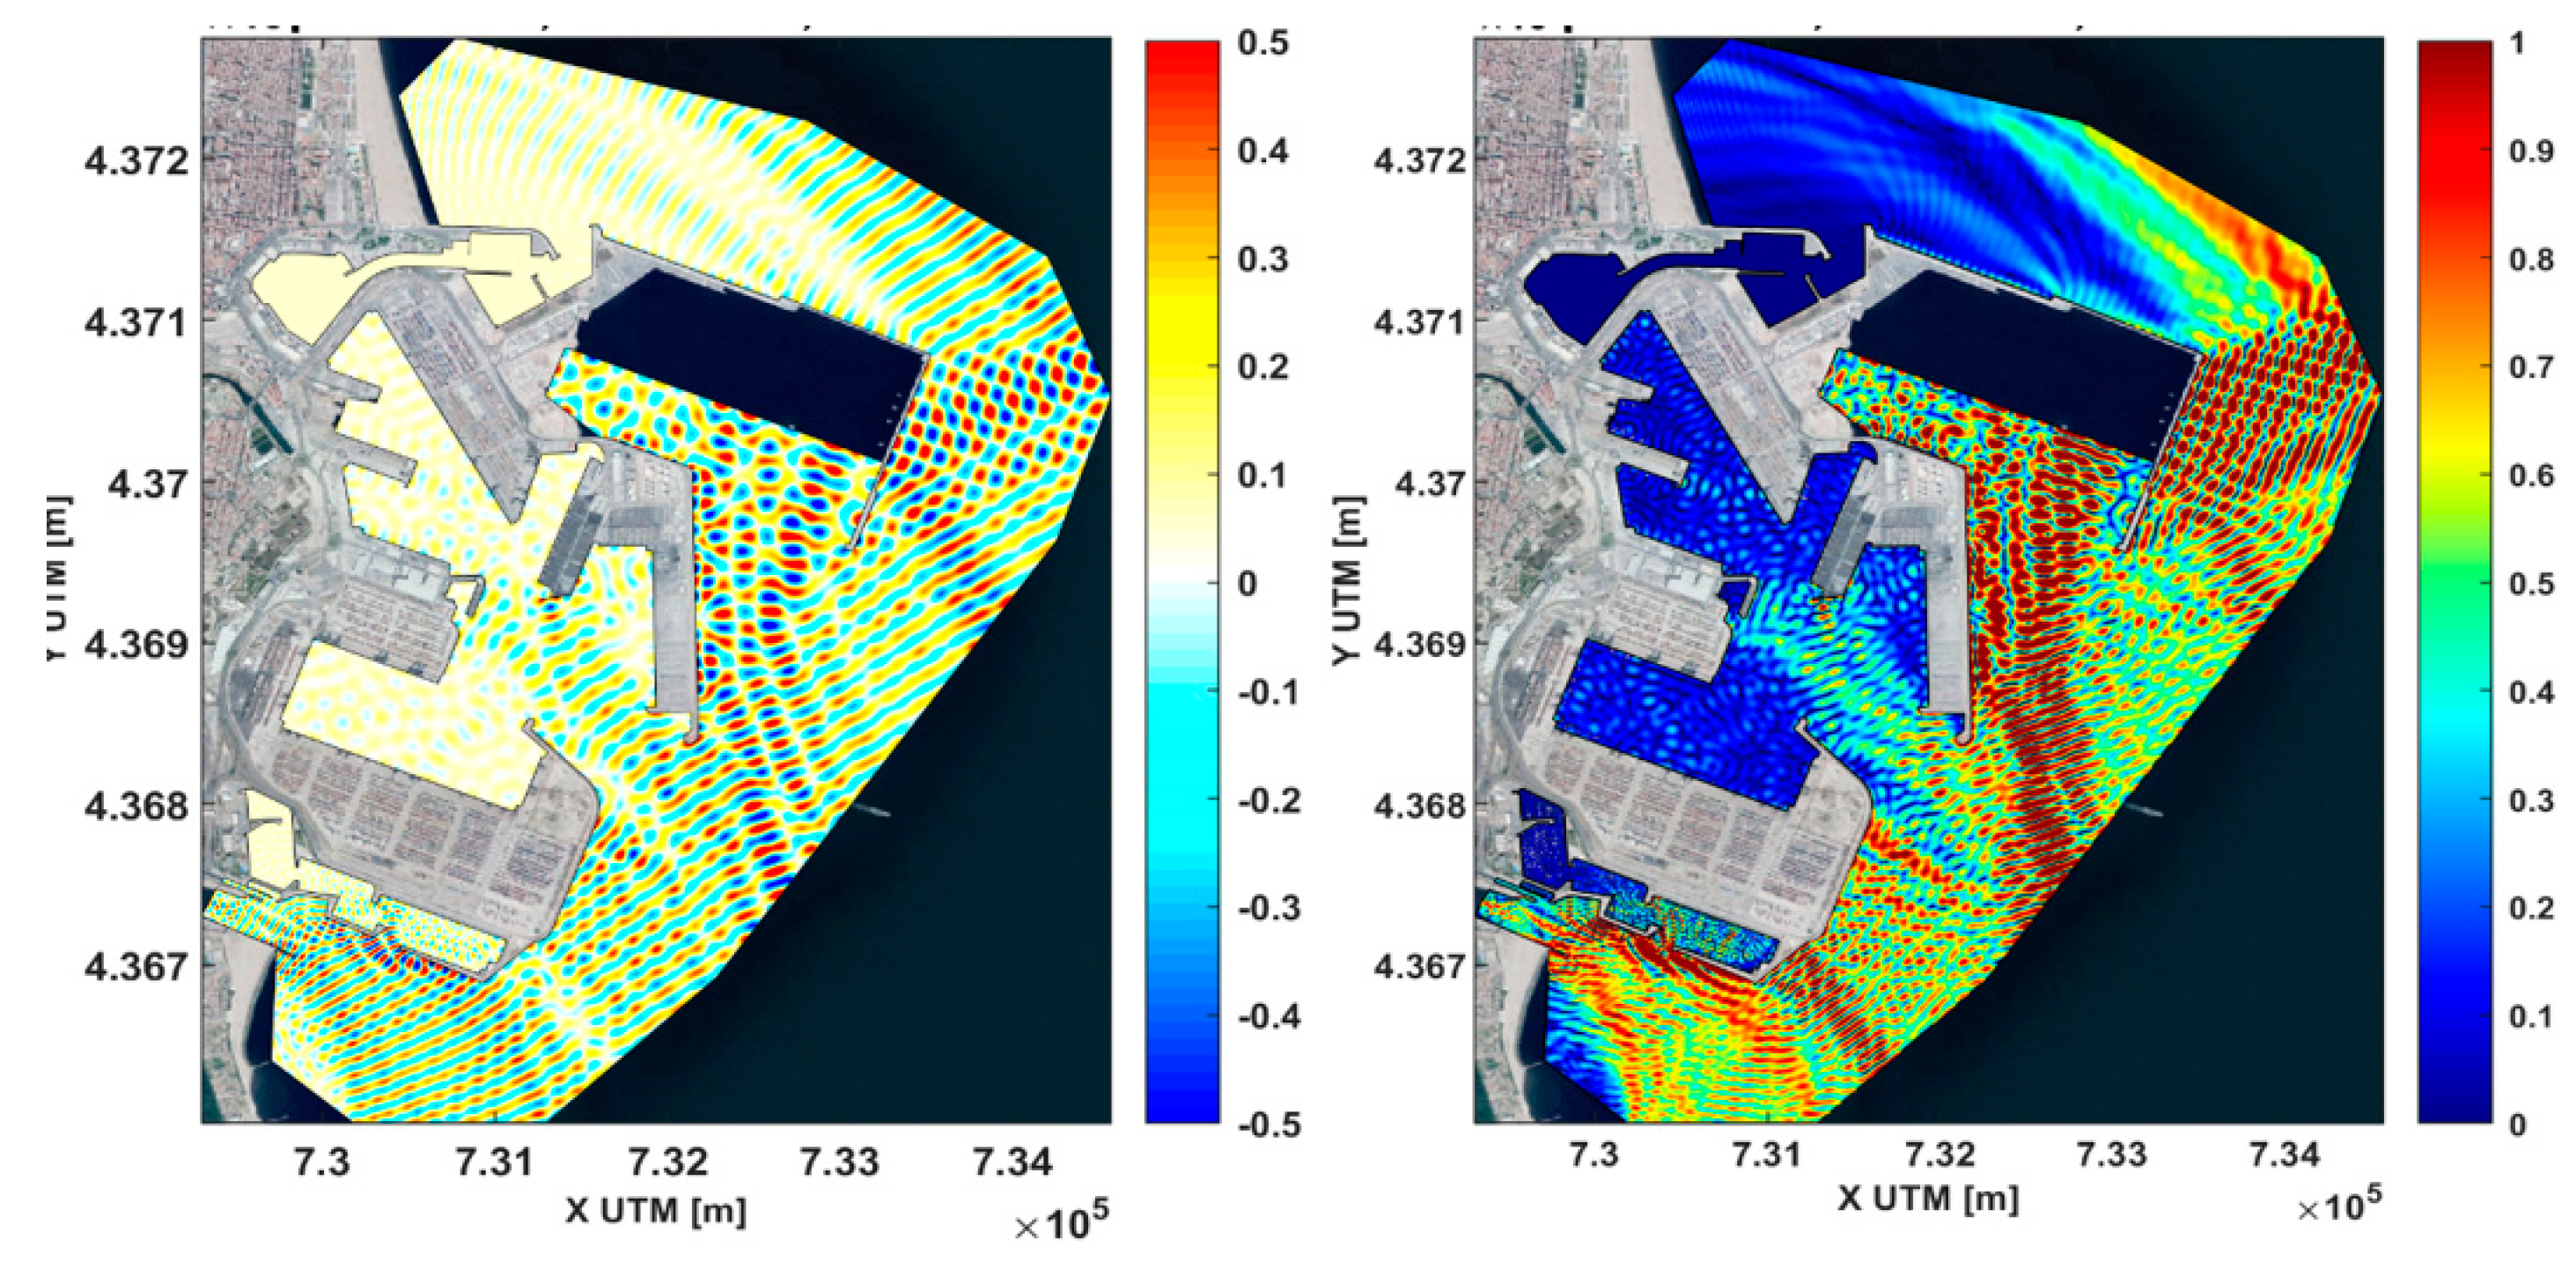
Figure 4.
Final validation of Hm0 values at Valencia, Sagunto and Gandía Ports.
Disclaimer/Publisher’s Note: The statements, opinions and data contained in all publications are solely those of the individual author(s) and contributor(s) and not of MDPI and/or the editor(s). MDPI and/or the editor(s) disclaim responsibility for any injury to people or property resulting from any ideas, methods, instructions or products referred to in the content. |
© 2025 by the authors. Licensee MDPI, Basel, Switzerland. This article is an open access article distributed under the terms and conditions of the Creative Commons Attribution (CC BY) license (https://creativecommons.org/licenses/by/4.0/).
Copyright: This open access article is published under a Creative Commons CC BY 4.0 license, which permit the free download, distribution, and reuse, provided that the author and preprint are cited in any reuse.


