
Submitted:
22 March 2025
Posted:
24 March 2025
You are already at the latest version
Abstract
Understanding the population genetic connectivity is crucial for the sustainability and persistence of marine biodiversity. As fundamental reef-building macroalga in the coastal ecosystem, Halimeda macroloba is one of dominant intertidal seaweed in the Indo-Pacific region. However, the genetic structure and population connectivity haven’t been recog-nized yet. Here, we explored the population genetic structure and genetic connectivity of H. macroloba using chloroplast tufA, rps3-rpl14 and rbcL. Our results indicated low genetic diversity and shallow population genetic structure at the intraspecific level, uncovering 3 genetic groups with 5 subdivided lineages in tufA and 2 genetic clusters in rps3-rpl14. We detected demographic expansion in the last glacial period of Pleistocene and significantly asymmetric gene flow among different geographical units. We suggested that the south-westward ocean currents under the influence of northeast monsoon in the Indo-Pacific re-gion was the main reason for shaping the present genetic structure; and the asexual re-production of H. macroloba also played an important role of the low genetic diversity pat-tern; as well, the divergence between genetic clusters might be related to the historical iso-lation led by the paleoclimate oscillation in Pleistocene. The Xisha islands in southern China might serve as a potential refugium of H. macroloba, which needs extra attention to the conservation management. Given the limitation of sample size, we’ll conduct more field work and carry out further research at larger scale in the future. Our study shed light into the theory of population connectivity in the Indo-Pacific region, and provided scien-tific basis for the tropical costal seaweed conservation.
Keywords:
population genetic structure
; gene flow
; ocean currents
; calcified algae
; seaweed conservation
1. Introduction
The introduction should briefly place the study in a broad context and highlight why it is.
Connectivity conservation is essential for maintaining biodiversity and adapting to climate change across all biomes and spatial scales [1,2]. Increasing connectivity can increase ecosystem resilience and facilitate population recovery [3]. Compared with terrestrial ecosystems, the marine ecosystems have higher dynamic and spatial heterogeneity, and it is difficult to distinguish habitat patches between different ecosystems, which undoubtedly increases the difficulty of biological connectivity research and application [4]. In recent years, the intensive anthropogenic activities and climate changes led to the loss and fragmentation of coastal ecosystems [5], which has forced us to accelerate the researches on coastal connectivity to develop better conservation strategies.
As crucial producer of the coastal ecosystem, the seaweeds possess substantial economic, ecological, and social value, which provide essential resources such as food, medicine, oxygen, shelter, and habitat for both humans and marine organisms [6]. As highly calcareous green algae, Halimeda serves as one of the most important reef-building macroalgae in the global coastal coral reef ecosystem [7,8,9]. Recent studies have pointed that the Halimeda species underwent intricate evolutionary history related to the paleoclimate oscillation in the Indo-Pacific region [10,11], which is a well-known hotspot of marine biodiversity around the world with complex geological history, coastal topography, hydrological conditions and marine environment [12]. However, the research on intraspecific genetic connectivity of Halimeda species in the tropical coastal waters is still lacking. Consequently, studying the genetic connectivity of Halimeda species can provide insight into the conservation of calcified algae resources in the Indo-Pacific region, and provide scientific evidence for the protection of tropical coral reef ecosystems.
Among them, the Halimeda macroloba Decaisne acts as an important carbonate contributer in the tropical intertidal ecosystem [13]. Halimeda macroloba is widely distributed in the Indo-Pacific region, and functions as the dominant species in the Thai-Malay peninsula, with the distribution pattern affected by the water depth, sea surface temperature and phosphate concentration [14]. Previous studies have demonstrated that it seemed to harbor low genetic variation in the Indo-Pacific region [15,16], but the genetic connectivity at intraspecific level remain poor acknowledged.
In this study, we investigated the genetic diversity and population structure of H. macroloba in the Indo-Pacific region using the chloroplast tufA, rps3-rpl14, and rbcL genes, and estimated mechanism of the genetic connectivity maintaining present distribution patterns at the intraspecific level. Our results could enrich the tropical seaweed genetic theory, and aid the understanding for the biodiversity conservation of reef-building macroalgae.
2. Results
2.1. Genetic Diversity and Population Genetic Structure
We obtained 191 tufA sequences and 175 rps3-rpl14 sequences, with 12 and 6 haplotypes, respectively (Table 1). Unexpectedly, the amplification of rbcL was challenging and we eventually obtained 25 sequences and 2 haplotypes (Table 1). Apart from two Chinese populations (YX and TP) that displayed moderate haplotype diversity in tufA, all other populations exhibited the pattern of low haplotype diversity and low nucleotide diversity. (Table 1).

Table 1.
Molecular diversity inferred from chloroplast tufA, rps3-rpl14 and rbcL of Halimeda macroloba in the Indo-Pacific region.
Table 1.
Molecular diversity inferred from chloroplast tufA, rps3-rpl14 and rbcL of Halimeda macroloba in the Indo-Pacific region.
| Country | ID | Sample sites | Coordinates | Source | tufA | rps3-rpl14 | rbcL | |||||||||
| n | Nh | Hd | π (×10-2) | n | Nh | Hd | π (×10-2) | n | Nh | Hd | π (×10-2) | |||||
| China | YX | Yongxing Island, Xisha Islands, Sansha, Hainan | 16.83°N, 112.33°E | This study | 9 | 4 | 0.694±0.147 | 0.104±0.090 | 9 | 2 | 0.500±0.129 | 0.170±0.120 | - | - | - | - |
| China | TP | Taiping Island, Gaoxiong, Taiwan | 10.38°N, 114.37°E | GenBank | 3 | 2 | 0.667±0.314 | 0.078±0.097 | - | - | - | - | - | - | - | - |
| Viet Nam | CD | Con Dao, Ba Ria-Vung Tau | 8.69°N, 106.62°E | GenBank | 1 | 1 | 0 | 0 | - | - | - | - | - | - | - | - |
| Viet Nam | NTH | Ninh Thuan | 15.66°N, 109.18°E | GenBank | 1 | 1 | 0 | 0 | - | - | - | - | - | - | - | - |
| Viet Nam | PQ | Phy Quy | 10.55°N, 108.96°E | GenBank | 1 | 1 | 0 | 0 | - | - | - | - | - | - | - | - |
| Viet Nam | NTR | Nha Trang | 12.22°N, 109.2°E | GenBank | 1 | 1 | 0 | 0 | - | - | - | - | - | - | - | |
| Thailand | CB | SamaeSan village, Chon Buri | 12.60°N, 100.95°E | This study | 21 | 1 | 0 | 0 | 9 | 1 | 0 | 0 | - | - | - | - |
| Thailand | KSN | Big Buddha, Koh Samui (North coast) | 9.57°N, 100.06°E | This study | 25 | 1 | 0 | 0 | 24 | 1 | 0 | 0 | 1 | 1 | 0 | 0 |
| Thailand | KSE | Koh Tean (East), Koh Samui, Suratthani | 9.38°N, 99.95°E | This study | 20 | 4 | 0.363±0.131 | 0.046±0.050 | 17 | 2 | 0.118±0.101 | 0.010±0.019 | 1 | 1 | 0 | 0 |
| Thailand | PK | Tangkhen Bay, Phuket | 7.81°N, 98.41°E | This study | 30 | 1 | 0 | 0 | 30 | 1 | 0 | 0 | 11 | 1 | 0 | 0 |
| Thailand | ST | Koh LiDi, Satun | 6.79°N, 99.77°E | This study | 24 | 1 | 0 | 0 | 18 | 3 | 0.216±0.124 | 0.019±0.026 | 4 | 1 | 0 | 0 |
| Malaysia | ML | Pulau Besar, Malacca | 2.11°N, 102.34°E | This study | 30 | 2 | 0.067±0.061 | 0.008±0.018 | 29 | 1 | 0 | 0 | 8 | 2 | 0.250±0.180 | 0.084±0.072 |
| the Philippines | MPH | Sablayan, Mindoro | 12.86°N, 120.75°E | This study | 25 | 4 | 0.230±0.110 | 0.037±0.043 | 20 | 2 | 0.269±0.113 | 0.023±0.029 | - | - | - | - |
n, sample size; Nh, number of haplotypes; Hd, haplotype diversity; π, nucleotide diversity; -, null.
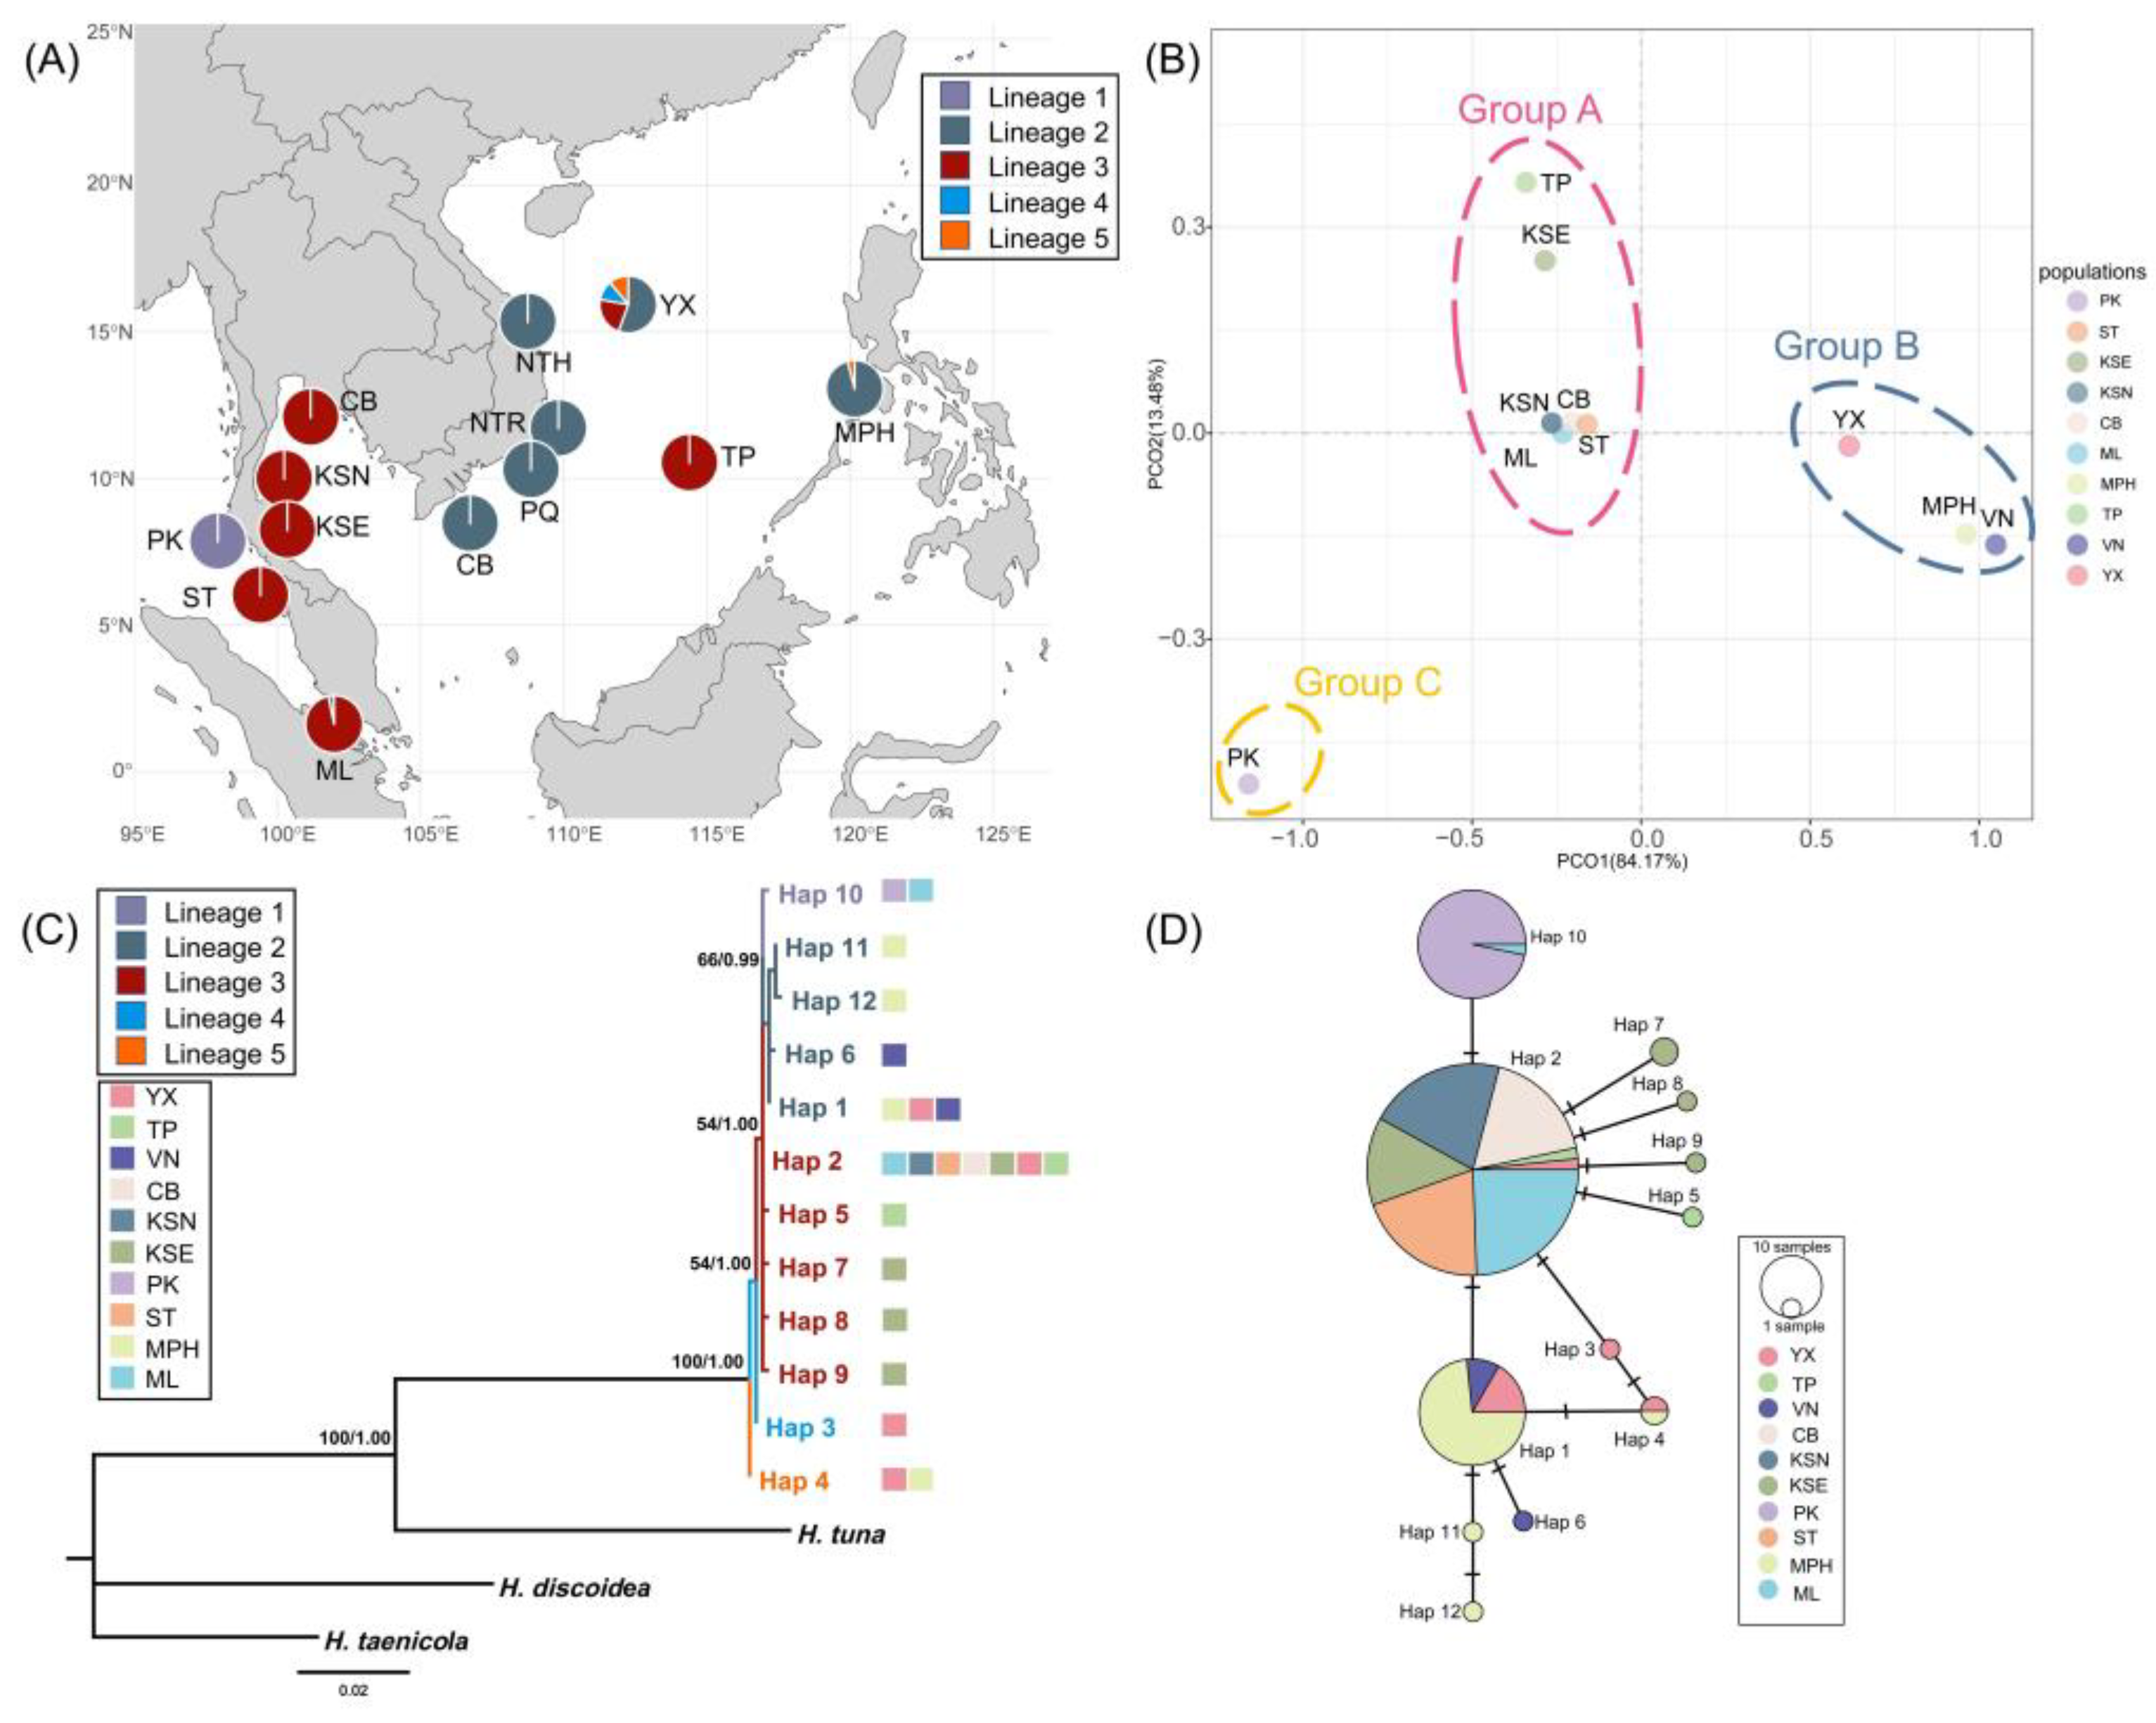
Due to the limited number of rbcL sequences available for population analysis, we utilized the tufA and rps3-rpl14 datasets to investigate the population genetic structure. In tufA, the congruent results of the haplotype network and PCoA analysis indicated the presence of three genetic groups in the Indo-Pacific region (Figure 1). Group A contained the populations including China, Vietnam, and the Philippines (Figure 1). Group B included the populations along the coast of Thailand and Malaysia, with the exception of Phuket (PK) in Thailand, which was the only population in Group C corresponding to lineage 5 (Figure 1). Moreover, while a monophyletic origin was identified, the intraspecific phylogenetic relationship exhibited limited divergence, with five sub-lineages detected (Figure 1C). The YX population consisted of haplotypes from four lineages, acting as the place with richest genetic diversity in the studying area, which was located in Xisha islands of China (Figure 1A; Table 1).
Figure 1.
The phylogeographical structure of H. macroloba in tufA. (A) The geographical distribution of 5 lineages in the Indo-Pacific region. (B) Population genetic structure based on PCoA analysis. (C) Phylogenetic relationship of H. macroloba based on tufA haplotypes. Numbers above or near branches are ML bootstrap values (left) / BI posterior probabilities (right). Values <50% or <0.50 were not shown. (D) Median-joining network based on tufA haplotypes. The circle size represented the sample sizes. The number of bars on the connecting lines represented the genetic steps.
In rps3-rpl14, concordant patterns were observed across the population genetic structure, phylogenetic relationship, and the haplotype network, which indicated two genetic clusters at the intraspecific level (Figure S1). The group A occurred in Chinese and Philippine populations (YX and MPH), and the group B covered the entire Thai-Malay peninsula and central South China Sea (Figure S2).
In order to examine the genetic differentiation of H. macroloba, we complemented the AMOVA and pairwise Fst analyses both on tufA and rps3-rpl14. The AMOVA results showed that the genetic differentiation mainly occurred among genetic groups and within populations (Table S2). The pairwise Fst of tufA suggested that most populations had obvious genetic differentiation, and in particular, the differentiations between populations belonging to different genetic groups were more significant (Figure 2A). The pairwise Fst of rps3-rpl14 showed consistency with the genetic structure that significant genetic differentiation was observed between populations from different groups, whereas no considerable differentiation was detected among populations within the same group (Figure 2B).
Figure 2.
Pairwise genetic differentiation (Fst) between populations based on tufA (A) and rps3-rpl14 (B).
Figure 2.
Pairwise genetic differentiation (Fst) between populations based on tufA (A) and rps3-rpl14 (B).

2.2. Demographical Population History
With the timeframe proposed by Verbruggen et al. (2009) [63], the Halimeda genus was diverged at about 144 Myr before present. Therefore, we calibrated that the molecular clock of tufA and rps3-rpl14 as 0.078%/Myr and 0.043%/Myr respectively. Mismatch analysis showed unimodal distribution patterns based on tufA and rps3-rpl14, which supported the recent demographical expansion model (Figure 3A & B). Furthermore, in Bayesian skyline plots (BSP) analyses, the intraspecific dynamics initiated approximately 0.223 Myr ago both in tufA and rps3-rpl14 (Figure 3C & D). Corresponding to the results of mismatch analysis, demographic expansions were detected in both markers. In tufA, we found persistent expansion from 0.223 Myr ago (Figure 3C); in rps3-rpl14, we found that H. macroloba remained stable during a long period and then expanded rapidly from about 0.05 Myr ago (Figure 3D).
Figure 3.
Demographic dynamics of H. macroloba in tufA and rps3-rpl14. (A) Mismatch distribution of tufA. (B) Mismatch distribution of rps3-rpl14. (C) BSP results of tufA. The horizontal axis represented the past time in the unit of per million years (Myr), and the vertical axis represented the effective population size. The blue intervals represented the 95% highest posterior density (HPD). The blue curve represented the median value. (D) BSP results of rps3-rpl14. The horizontal axis represented the past time in the unit of per million years (Myr), and the vertical axis represented the effective population size. The blue intervals represented the 95% highest posterior density (HPD). The blue curve represented the median value.

2.2. Population Gene Flow
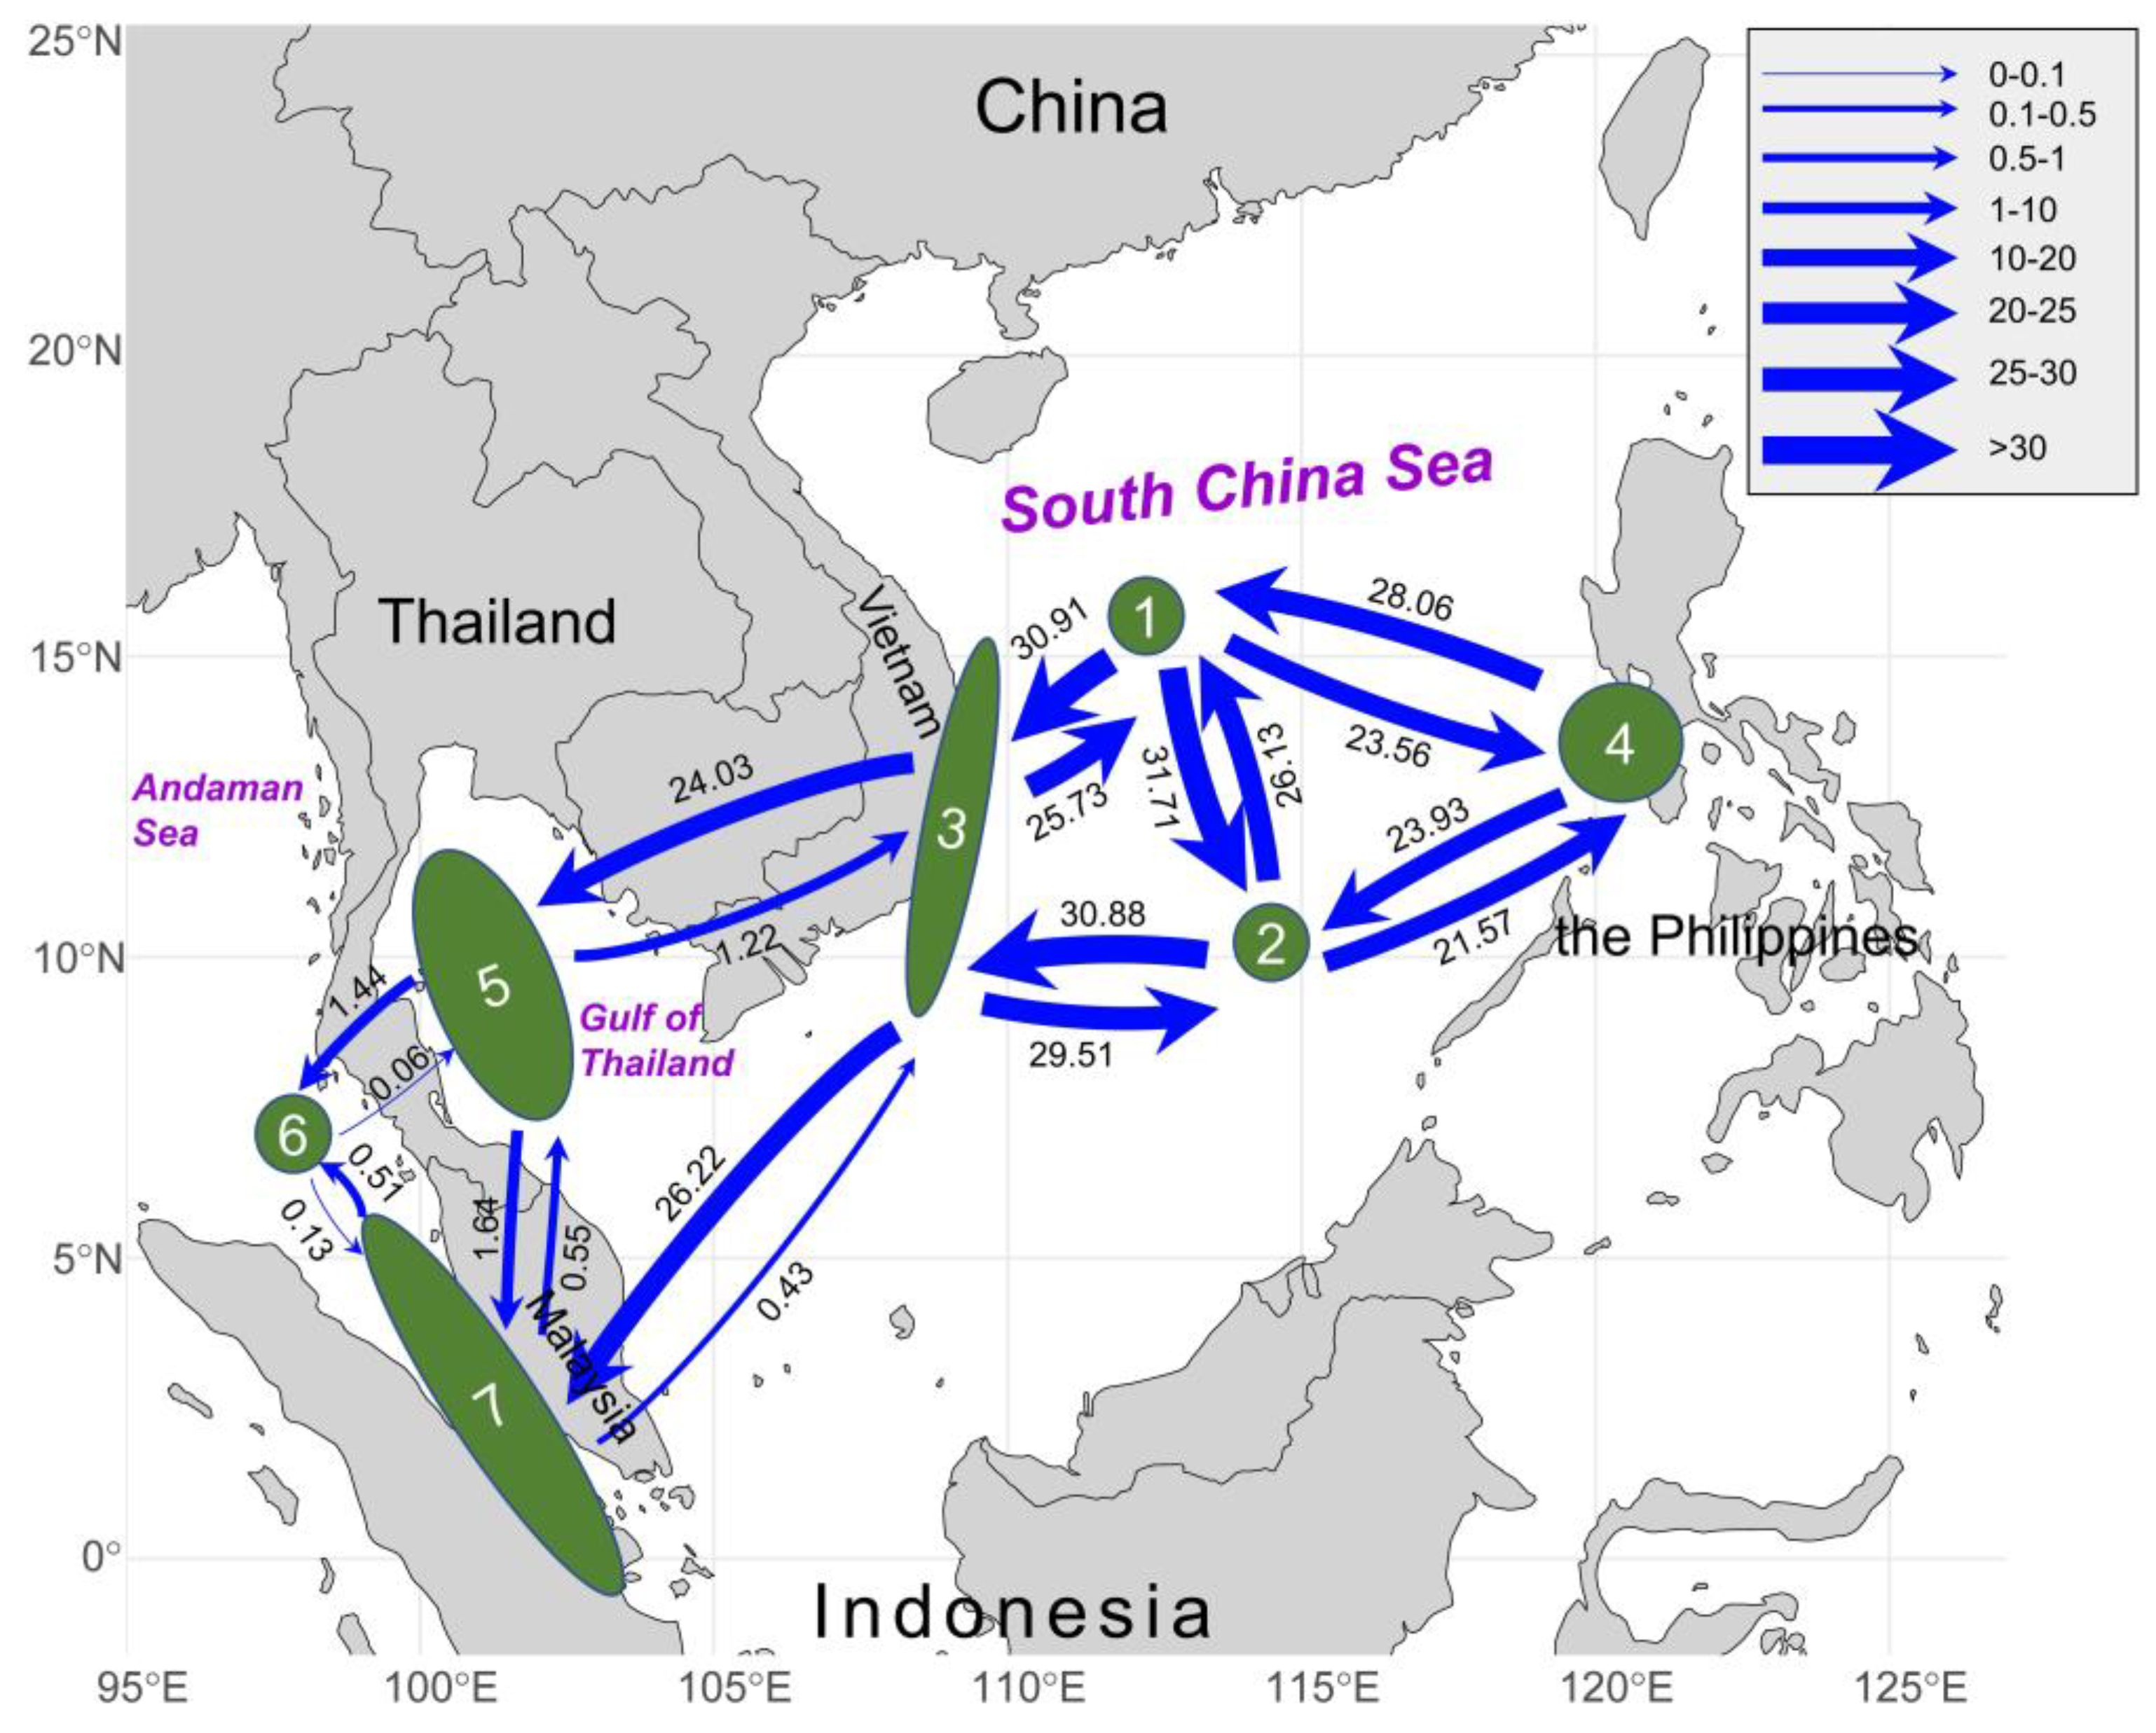
We used the tufA dataset to infer the population gene flow (Nm) due to more extensive geographical populations than rps3-rpl14 dataset. The Bayesian migration analysis inferred from tufA revealed asymmetric gene flow among the sub-units in the Indo-Pacific region (Figure 4). On the one hand, we found high level of genetic exchange in the vast South China Sea region, including two Chinese populations (1, 2), Vietnamese populations (3) and Philippine population (4). Strong bidirectional gene flow was detected among these four units, with migration rates exceeding 20 in all units and even above 30; besides, it indicated that the westward and southward gene flow between all the units was greater than the opposite direction. On the other hand, asymmetric gene flow occurred between the populations in the South China Sea region and the populations in the Gulf of Thailand and the Malacca Strait. Gene flow from Vietnam (3) to the Gulf of Thailand (5) was significantly higher than that in the opposite direction (3→5: Nm = 24.03; 5→3: Nm = 1.22) (Figure 4). Meanwhile, gene flow from Vietnam (3) to the Malacca Strait (7) was also significantly higher than that in the opposite direction (3→7: Nm = 26.22; 7→3: Nm = 0.43) (Figure 4). In addition, we found limited genetic exchange between the units of the Gulf of Thailand and the Malacca Strait; notably, the genetic exchange between these units was still mainly from east to west (5→6: Nm = 1.44; 6→5: Nm = 0.06; 5→7: Nm = 1.64; 7→5: Nm = 0.55) (Figure 4).
Figure 4.
Gene flow (Nm) between 7 sub-units based on tufA. Numbers above/below the arrows represented migration rates in the direction of the arrow. Arrow thickness was scaled according to the value.
Figure 4.
Gene flow (Nm) between 7 sub-units based on tufA. Numbers above/below the arrows represented migration rates in the direction of the arrow. Arrow thickness was scaled according to the value.
3. Discussion
3.1. Genetic Connectivity Derived by Ocean Currents
Genetic diversity serves as a fundamental pillar for ecosystem resilience, facilitating species adaptation to environmental changes, and underpinning nature’s essential contributions to human [17,18]. Among marine organisms, the population connectivity has a significant impact on the differentiation and population genetic structure [19]. The ocean currents can facilitate gene flow between populations to promote genetic homogeneity; conversely, they can also lead to increased genetic differentiation among populations as physical barriers [20,21,22]. Based on the 3 chloroplast molecular datasets, the molecular diversity within H. macroloba displayed a pattern of low genetic diversity (Table 1). Meanwhile, we discovered shallow population genetic structure and strong gene flow at intraspecific level (Figure 1, Figure 4 and Figure S1). The species exhibiting high fecundity and dispersal capabilities usually lack significant spatial genetic structure [23]. Therefore, the phylogeographical pattern of H. macroloba was likely caused by the influence of ocean currents in the Indo-Pacific region.
Our integrated results suggested that the gene flow directionality was corresponding to the ocean currents of the northeast monsoon in the Indo-Pacific region. In the northern and central parts of South China Sea, the bidirectional gene flow was strong between populations (1, 2, 3 and 4) (Figure 4). We speculated that the genetic exchange was frequent due to the lack of a dispersal barrier in the vast South China Sea. Meanwhile, the gene flow from the populations of South China Sea to populations of Gulf of Thailand and Andaman Sea exhibited a significant southwestward pattern (Figure 4). Such genetic connectivity pattern might be mediated by the southwest surface circulations in this region. Affected by the seasonal monsoon climate in the Indo-Pacific region, the ocean current system was complicated and intense, characterized by opposite flow directions in winter and summer; the surface circulation in winter flows mainly from northeast to southwest, which could facilitate the genetic exchange at the intraspecific level [24]. Particularly, in winter, the coastal Vietnam are among the regions with the strongest currents at the scale of the South China Sea basin, where the southwestward drift velocities could exceed 1 m/s [25,26]. It might explain the formation of the strong gene flow observed from unit 3 to 5 and 7. On the western coast of Thai-Malay peninsula, the limited gene flow between units 6 and 7 might be related to the hydrological conditions along the Malacca Strait during winter monsoon. Located within the equatorial doldrums, the current of the Malacca Strait is influenced by the equatorial low-pressure zone and the topography of coastline, resulting in generally weak surface flows. It likely accounted for the limited genetic exchange between units in this region. Under the impact of the winter monsoon, the surface current in the Malacca Strait generally moves from the southeast to the northwest towards the Andaman Sea (flowing from areas of higher to lower water volume), which corresponds to the stronger northward gene flow from units 7 to 6 [27]. Similar conditions were documented in other seaweed species and adjacent seas. For Sargassum species with high capability of dispersal (air vesicles providing positive buoyancy), the ocean currents also played a dominant role in their genetic structure [28,29]; furthermore, the southwestern current in the Indo-Pacific region might act as a critical factor affecting their dispersal and colonization [30,31]. Our results demonstrated the importance of ocean currents in shaping the genetic connectivity of marine plants. Nevertheless, many researches illustrated that the seaweed in the Indo-Pacific region hold rich genetic diversity and highly divergent structure, implying limited genetic exchange between different populations [32,33]; some researches indicated that genetic differentiation might arise from the topographical isolation and hydrological barrier of Thai-Malay peninsula [34,35,36]. Therefore, extensive sample collection and further integrated study are needed to shed light into the theory of seaweed genetic connectivity here.
On the other hand, we discovered that while the genetic homogeneity was high along the Thai-Malay peninsula, the gene flow was limited here, and in the tufA dataset, there was only 1 haplotype in Phuket population (PK) in Thailand, which was divergent from other populations as an independent genetic cluster (Figure 1B and Figure 4). We assumed that the notably low genetic diversity may be associated with the asexual reproduction of H. macroloba. Previous study revealed that Halimeda species primarily reproduce asexually in natural environment, and the abundant biomass on coral reefs is partially due to the ability of this genus to propagate asexually via vegetative fragmentation [37]. Thus, we suggested that the separate genetic cluster in Phuket might be the consequence of a local enrichment of one unique haplotype by vegetative fragmentation.
3.2. Intraspecific Phylogeographical Pattern of H. macroloba
Based on the 3 chloroplast molecular datasets, the molecular diversity within H. macroloba displayed a pattern of low haplotype diversity and low nucleotide diversity (Table 1). However, we discovered more genetic variations in tufA dataset than rps3-rpl14. Therefore, the tufA gene marker might have a higher resolution in population genetic research and retained more historical relics in the evolutionary process. Three genetic groups and five subdivided genetic lineages were found in tufA, and four lineages were located in the Xisha islands (YX) in southern China (Figure 1A). Additionally, the YX population displayed highest haplotype diversity in this study (Table 1). The populations in glacial refugia usually retained higher genetic diversity and particular haplotypes than recolonized populations [38]. Hence, we hypothesized that for H. macroloba, the Xisha Islands might serve as a potential historical refugium, which highlighted the value of extra conservation and management here. But, due to the limited sample size of this population, the reliability of the hypothesis couldn’t be guaranteed. In previous researches of other marine organisms, the Xisha islands was regarded as a transfer station for genetic exchange rather than a diversity center [39]. It’s necessary to enlarge the collection range and quantity to ensure the accuracy of research results.
Besides, the low genetic diversity and simple phylogeographical pattern could be correlated with historical expansion. Recent rapid expansion might lead to the simplification of genetic structure. The star-like haplotype network and unimodel distribution in mismatch together supported the population expansion, and the BSP directly showed obvious expansion occurred during the Pleistocene. Despite the lack of high divergence, we still found genetic structures in different datasets (Figure 1 and Figure S1). So the present genetic structure may also be related to the historical isolation caused by sea level fluctuation in Pleistocene. Based on the BSP results, the divergence of this species in the Indo-Pacific region originated from 0.223 Myr ago (Figure 3C,D), which roughly coincided with the emergence of Sundaland (0.15-0.25 Myr ago) [40,41]. The Sundaland acted as a geographical barrier for marine organisms on both sides, which might result in the genetic differentiation of the populations between South China Sea basin and Thai-Malay peninsula. Continuous expansion was detected in tufA dataset while intraspecific expansion sharply increased from 0.05 Myr ago in the rps3-rpl14 (Figure 4C,D). It suggested that the species underwent a complex historical process during the last glacial period during the Pleistocene, and the current genetic structure may be the consequence of historical isolation and genetic mixture through sea level fluctuation [42,43,44].
3.3. Conservation and Management
The low genetic diversity and simple population genetic structure underscored the importance of genetic diversity protection of H. macroloba. We proposed to divide two management units (MU) of South China Sea basin and Thai-Malay peninsula for separate conservation [45]. Moreover, due to the higher haplotype diversity of Xisha population in China and distinct genetic cluster of Phuket population in Thailand, we suggested more attention should be paid based on current marine conservation strategies.
4. Materials and Methods
4.1. Sample Collection, DNA Extraction and Amplification
From 2019 to 2024, we collected H. macroloba samples in the Indo-Pacific convergence region along the coast of China, Thailand and the Philippines (Figure 1A). Total genomic DNA was extracted using the Hi-DNAsecure Plant Kit (TIANGEN, DP350-03) following the manufacturer’s instruction, and the quality was checked using 0.7% agarose gel electrophoresis and OD260/OD280 ratio.
The chloroplast-encoded tufA, rps3-rpl14, and rbcL were amplified as molecular markers. For tufA, the amplification was carried out using the primer pairs tufA-F (5’-TGAAACAGAAMAWCGTCATTATGC-3’) and tufA-R (5’-CCTTCNCGAATMGCRAAWCGC-3’) [46] and the PCR procedures in Cremen et al. (2016) [47]. For rps3-rpl14, the amplification was carried out with the primers rps3F (5’-ACACAACCGCATTTATCACA-3’) and rpl14R (5’-CAGCAACATTWACAYAACTTTCAG-3’) and the PCR procedures in Rindi et al. (2020) [48]. For rbcL, the amplification was carried out with the primers U1-1 and U3-2 [49], and the PCR procedures was performed according to the procedures by Curtis et al. (2008) [50]. The PCR products were checked in 1% agarose gel electrophoresis. Purification and sequencing of PCR products were performed using a BigDye Terminator Cycle sequencing kit and an ABI3730 automated sequencer (Applied Bio-systems, Foster City, CA, USA).
4.2. Molecular Diversity and Phylogenetic Relationship
The obtained sequence datasets were aligned with MUSCLE model in MEGA X respectively [51]. After manual adjusting for false or missing gaps, we computed the haplotype diversity, nucleotide diversity, variable sites and parsimony informative sites for all populations in Arlequin 3.5.2.2 [52].
After testing the optimal substitution model of each dataset based on Corrected Akaike Information Criterion (AICc) in JModelTest 2.1.7 [53], we reconstructed the phylogenetic relationships of each dataset based on with Maximum Likelihood (ML) and Bayesian Inference (BI). Phylogenetic ML trees were constructed based on 1000 bootstrap replicates using a Nearest-Neighbor-Interchange heuristic method in PhyML 3.1 [54]. The BI trees were constructed based on 10,000,000 MCMC iteration chains with the first 2,500,000 chains discarded as ‘burn-in’ in Beast 2.7.5 [55]. The convergence of output trees dataset was checked in Tracer 1.7.1 [56] when the effective sample sizes (ESS) >200. The condensed tree was summarized in TreeAnnotator in Beast 2.7.5 with a 25% “burn-in”. The sequences of congeneric species H. discoidea Decaisne and H. taenicola W.R.Taylor were selected as outgroups (accession number in GenBank: AY826362 and AY826365). All trees were visualized using FigTree 1.4.4 (http://tree.bio.ed.ac.uk/software/Figtree/).
4.3. Population Genetic Structure and Differentiation
We estimated the population pairwise differentiation (Fst) with 1000 permutations in Arlequin. The genealogic network diagrams based on the haplotypes of each dataset were drawn using Median-Joining algorithm in POPART [57].
The population genetic structure of each dataset was detected based on the admixture model in STRUCTURE 2.3.4 [58]. The optimal number of clusters was tested using putative K value from 1 to 8. The analysis carried out 10 repetitive iterations per K with a burn-in of 100,000 MCMC chains followed by 500,000 chains using a correlated allele frequencies model [59]. The log-likelihood LnP(K) and statistic ΔK [60] was estimated to determine the most probable K value by online Structure Harvester (http://taylor0.biology.ucla.edu/struct_harvest/).
To further check the hierarchical structure and distinctiveness, a principal component analysis (PCoA) was operated in GenAlex 6.5.2.2 based on the population pairwise genetic distances both in tufA and rps3-rpl14 [61]. And the analysis of molecular variance (AMOVA) was conducted to explore the genetic differentiation of subdivisions based on the result of population genetic structure.
4.4. Divergence Time and Demographic History
We conducted the mismatch analysis using tufA and rps3-rpl14 datasets in DnaSP v5.0 [62] to assess the historical population dynamics. We calibrated the molecular clock of H. macroloba using the timeframe proposed by Verbruggen et al. (2009) [63]. The divergence time of Halimeda genus was estimated as 144 Myr ago, so we calculated the substitution rates of tufA and rps3-rpl14 based on the genetic divergence between haplotypes of Halimeda species (H. macroloba and H. discoidea).
Aiming to study the population demographic history, the coalescent Bayesian skyline plots (BSPs) analysis was proceeded in Beast v2.6.6 based on tufA and rps3-rpl14. Molecular clocks of the two genes were chosen as relaxed clock log normal with calculated substitution rates. MCMC chains were set as 8×10⁸ iterations, followed by 2×10⁸ iterations discarded as burn-in, with sampling every 80,000 iterations.
4.5. Intraspecific Genetic Connectivity
In order to investigate the gene flow between populations, we estimated the migration rates and effective population size based on tufA datasets in Migrate-n 4.4.3 [64]. We delineated 7 sub-units corresponding to the geographical distributions and population genetic structure (shown in Figure 4 of Results section). The analysis was conducted based on four long chains and ten replicates with a 10,000 ‘burn-in’ and a total of 50,000 steps along with sampling per 100 steps. Heating was set with four temperatures (1.0, 1.5, 3.0, and 1.0) with a static scheme.
Supplementary Materials
The following supporting information can be downloaded at the website of this paper posted on Preprints.org. Figure S1: The phylogeographical structure of H. macroloba in rps3-rpl14. (A) The geographical distribution of 5 lineages in the Indo-Pacific region. (B) Phylogenetic relationship of H. macroloba based on rps3-rpl14 haplotypes. Numbers above or near branches are ML bootstrap values (left) / BI posterior probabilities (right). Values <50% or <0.50 were not shown. (C) Median-joining network based on tufA haplotypes. The circle size represented the sample sizes. The number of bars on the connecting lines represented the genetic steps. (D) Population genetic structure based on PCoA analysis. Table S1: Analysis of molecular variance (AMOVA) based on tufA and rps3-rpl14.
Author Contributions
DDL, YJT and SXH conceived the research. YJT, RMY and LYD collected specimens. SXH, LYS and DYQ conducted molecular experiments. SXH adjusted and analyzed the data. SXH performed the phylogeographical analysis. SXH and DDL wrote and revised the manuscript. All authors have read and agreed to the published version of the manuscript.
Funding
This research was supported by the Strategic Priority Research Program of Chinese Academy of Sciences (XDB42030203), the Thailand Research Fund (RDG6130002) and the Qingdao Postdoc Project (QDBSH20240102101).
Data Availability Statement
The newly discovered tufA haplotypes of H. macroloba in this study could be found in GenBank with the accession numbers: PQ824573-PQ824582. The rps3-rpl14 haplotypes has been submitted to GenBank with a submission ID 2939450. The rbcL haplotypes has been submitted to GenBank with a submission ID 2939478. The newly discovered tufA sequences of H. discoidea in this study has been submitted to GenBank with a submission number 2917045.
Acknowledgments
We thanked the members of the Seagrass & Seaweed Research Unit of the Prince of Songkla University (Hat Yai, Thailand) for their help with sampling. We thanked Dr. Eka S. Prasedya in University of Mataram (Indonesia) for the help with H. discoidea collection. And we thanked Dr. Stefano G. A. Draisma in the Prince of Songkla University for the revision and polish of English writing of this manuscript.
Conflicts of Interest
The authors declare no conflicts of interest.
Abbreviations
The following abbreviations are used in this manuscript:
| AICc | Akaike Information Criterion |
| ML | Maximum Likelihood |
| BI | Bayesian Inference |
| ESS | effective sample sizes |
| PCoA | Principal component analysis |
| AMOVA | analysis of molecular variance |
| BSP | Bayesian skyline plots |
| Nm | Migration rates |
| Myr | million years |
| MU | management unit |
References
- Jones, G. P.; Srinivasan, M.; Almany, G. R. Population connectivity and conservation of marine biodiversity. Oceanography 2007, 20, 100–111. [Google Scholar] [CrossRef]
- IUCN-WCPA. Guidelines for conserving connectivity through ecological networks and corridors. 2020. https://iucn.org/resources/publication/guidelines-conserving-connectivity-through-ecological-networks-and-corridors.
- Krosby, M.; Tewksbury, J.; Haddad, N. M.; et al. Ecological connectivity for a changing climate. Conserv Biol 2010, 24, 1686–1689. [Google Scholar] [CrossRef] [PubMed]
- Steele, J. H.; Brink, K. H.; Scott, B. E. Comparison of marine and terrestrial ecosystems: suggestions of an evolutionary perspective influenced by environmental variation. ICES J Mar Sci 2019, 76, 355–355. [Google Scholar] [CrossRef]
- Hughes, T. P.; Baird, A. H.; Bellwood, D. R.; et al. Climate change, human impacts, and the resilience of coral reefs. Science 2003, 301, 929–933. [Google Scholar] [CrossRef]
- Kemppainen, P.; van Nes, S.; Ceder, C.; et al. Refuge function of marine algae complicates selection in an intertidal snail. Oecologia 2005, 143, 402–411. [Google Scholar] [CrossRef]
- Wefer, G. Carbonate production by algae Halimeda, Penicillus and Padina. Nature 1980, 285, 323–324. [Google Scholar] [CrossRef]
- Rees, S. A.; Opdyke, B. N.; Wilson, P. A.; et al. Significance of Halimeda bioherms to the global carbonate budget based on a geological sediment budget for the Northern Great Barrier Reef, Australia. Coral Reefs 2007, 26, 177–188. [Google Scholar] [CrossRef]
- Nelson, W. A. Calcified macroalgae - critical to coastal ecosystems and vulnerable to change: a review. Mar Freshwater Res 2009, 60, 787–801. [Google Scholar] [CrossRef]
- Verbruggen, H.; Tyberghein, L.; Pauly, K.; et al. Macroecology meets macroevolution: evolutionary niche dynamics in the seaweed. Global Ecol Biogeogr 2009, 18, 393–405. [Google Scholar] [CrossRef]
- Zhang, H.; Wang, X.; Qu, M.; et al. Genome of Halimeda opuntia reveals differentiation of subgenomes and molecular bases of multinucleation and calcification in algae. P Natl Acad Sci USA 2024, 121. [Google Scholar] [CrossRef]
- Du, Y.; Wang, F.; Wang, T. Y.; et al. Multi-scale ocean dynamical processes in the Indo-Pacific Convergence Zone and their climatic and ecological effects. Earth-Sci Rev 2023, 237. [Google Scholar] [CrossRef]
- Mayakun, J.; Prathep, A. Calcium carbonate productivity by Halimeda macroloba in the tropical intertidal ecosystem: The significant contributor to global carbonate budgets. Phycol Res 2019, 67, 94–101. [Google Scholar] [CrossRef]
- Stankovic, M.; Draisma, S. G. A.; Pongparadon, S.; et al. Predicting macroalgal species distributions along the Thai-Malay Peninsula. Estuar Coast Shelf S 2022, 267. [Google Scholar] [CrossRef]
- Pongparadon, S.; Zuccarello, G. C.; Phang, S. M.; et al. Diversity of Halimeda (Chlorophyta) from the Thai-Malay Peninsula. Phycologia 2015, 54, 349–366. [Google Scholar] [CrossRef]
- Nguyen, T. H.; Nguyen N. N., T.; Nguyen X., T.; et al. Morphological variation and haplotype diversity of Halimeda macroloba and H. opuntia (Chlorophyta: Halimedaceae) from southern Vietnam. Viet Acad Sci Tech 2022, 22, 165–176. [Google Scholar]
- Des Roches, S.; Pendleton, L. H.; Shapiro, B.; et al. Conserving intraspecific variation for nature’s contributions to people. Nat Ecol Evol 2021, 5, 574–582. [Google Scholar] [CrossRef]
- Legrand, T.; Fragkopoulou, E.; Vapillon, L.; et al. Unravelling the role of oceanographic connectivity in the distribution of genetic diversity of marine forests at the global scale. Global Ecol Biogeogr, 2024; 33. [Google Scholar] [CrossRef]
- White, C.; Selkoe, K. A.; Watson, J.; et al. Ocean currents help explain population genetic structure. P Roy Soc B-Biol Sci 2010, 277, 1685–1694. [Google Scholar] [CrossRef]
- Cardona, L.; Hays, G. C. Ocean currents, individual movements and genetic structuring of populations. Mar Biol 2018, 165. [Google Scholar] [CrossRef]
- Fontana, S.; Wang, W. L.; Tseng, K. Y.; et al. Seaweed diversification driven by Taiwan’s emergence and the Kuroshio Current: insights from the cryptic diversity and phylogeography of Dichotomaria (Galaxauraceae, Rhodophyta). Front Ecol Evol 2024, 12. [Google Scholar] [CrossRef]
- Peluso, L.; Faúndez, J.; Navarrete, S. A.; et al. Oceanographical-driven dispersal and environmental variation explain genetic structure in an upwelling coastal ecosystem. Sci Rep, 2024; 14. [Google Scholar] [CrossRef]
- Gagnaire, P. A.; Broquet, T.; Aurelle, D.; et al. Using neutral, selected, and hitchhiker loci to assess connectivity of marine populations in the genomic era. Evol Appl 2015, 8, 769–786. [Google Scholar] [CrossRef]
- Hu, J.; Kawamura, H.; Hong, H; et al. A Review on the Currents in the South China Sea: Seasonal Circulation, South China Sea Warm Current and Kuroshio Intrusion. J Oceanogr 2000, 56, 607–624. [Google Scholar] [CrossRef]
- Yang, H. J.; Liu, Q. Y.; Liu, Z. Y.; et al. A general circulation model study of the dynamics of the upper ocean circulation of the South China Sea. J Geophys Res-Oceans, 2002; 107. [Google Scholar] [CrossRef]
- Vlasova, G. A.; Demenok, M. N.; Xuan, N. B.; et al. The role of atmospheric circulation in spatial and temporal variations in the structure of currents in the western South China Sea. Izv Atmos Ocean Phy 2016, 52, 317–327. [Google Scholar] [CrossRef]
- Ibrahim, Z. Z.; Yanagi, T. The influence of the Andaman Sea and the South China Sea on water mass in the Malacca Strait. La Mer 2006, 43, 33–42. [Google Scholar]
- Chan, S. W.; Cheang, C. C.; Chirapart, A.; et al. Homogeneous population of the brown alga Sargassum polycystum in Southeast Asia: possible role of recent expansion and asexual propagation. Plos One, 2013; 8. [Google Scholar] [CrossRef]
- Li, J. J.; Hu, Z. M.; Gao, X.; et al. Oceanic currents drove population genetic connectivity of the brown alga Sargassum thunbergii in the north-west Pacific. J Biogeogr 2017, 44, 230–242. [Google Scholar] [CrossRef]
- Liang, Y. S.; Zhang, S. S.; Yan, C. X.; et al. Influence of Indo-Pacific ocean currents on the distribution and demographic patterns of the brown seaweed Sargassum polycystum in tropical east Asia. Front Mar Sci 2022, 9. [Google Scholar] [CrossRef]
- Lin, Y. D.; Zhang, J.; Du, Y. Q.; et al. Marine conditions in Andaman Sea shape the unique genetic structure of Sargassum plagiophyllum C. Agardh. J Appl Phycol 2024, 36, 501–511. [Google Scholar] [CrossRef]
- Boo, G. H.; Leliaert, F.; Le Gall, L.; et al. Ancient Tethyan vicariance and long-distance dispersal drive global diversification and cryptic speciation in the red seaweed Pterocladiella. Front Plant Sci 2022, 13. [Google Scholar] [CrossRef]
- Lagourgue, L.; Leliaert, F.; Payri, C. E. Historical biogeographical analysis of the Udoteaceae (Bryopsidales, Chlorophyta) elucidates origins of high species diversity in the Central Indo-Pacific, Western Indian Ocean and Greater Caribbean regions. Mol Phylogenet Evol 2022, 169. [Google Scholar] [CrossRef]
- Wichachucherd, B.; Prathep, A.; Zuccarello, G. C. Phylogeography of Padina boryana (Dictyotales, Phaeophyceae) around the Thai-Malay Peninsula. Eur J Phycol 2014, 49, 313–323. [Google Scholar] [CrossRef]
- Pongparadon, S.; Zuccarello, G. C.; Phang, S. M.; et al. Diversity of Halimeda (Chlorophyta) from the Thai-Malay Peninsula. Phycologia 2015, 54, 349–366. [Google Scholar] [CrossRef]
- Bulan, J.; Maneekat, S.; Zuccarello, G. C.; et al. Phylogeographic patterns in cryptic species (Rhodomelaceae, Rhodophyta) across the Thai-Malay Peninsula. Algae 2022, 37, 123–133. [Google Scholar] [CrossRef]
- Walters, L. J.; Smith, C. M.; Coyer, J. A.; et al. Asexual propagation in the coral reef macroalga Halimeda (Chlorophyta, Bryopsidales): production, dispersal and attachment of small fragments. J Exp Mar Biol Ecol 2002, 278, 47–65. [Google Scholar] [CrossRef]
- Maggs, C. A.; Castilho, R.; Foltz, D.; et al. Evaluating signatures of glacial refugia for north Atlantic benthic marine taxa. Ecology 2008, 89, S108–S122. [Google Scholar] [CrossRef] [PubMed]
- Huang, W. H.; Zhang, Z. X.; Zhong, J. The genetic structure and connectivity of eight fish species in the Indo-Pacific convergence region. J Trop Oceanogr 2025, 44, 9–23, (in Chinese with English abstract). [Google Scholar]
- Molengraaff, G. Modern deep-sea research in the East Indian Archipelago. Geogr J 1921, 57, 95–11. [Google Scholar] [CrossRef]
- Bird, M. I.; Taylor, D.; Hunt, C. Palaeoenvironments of insular Southeast Asia during the Last Glacial Period: a savanna corridor in Sundaland? Quaternary Sci Rev 2005, 24, 2228–2242. [Google Scholar] [CrossRef]
- Hewitt, G. The genetic legacy of the Quaternary ice ages. Nature 2000, 405, 907–913. [Google Scholar] [CrossRef]
- Hoarau, G.; Coyer, J. A.; Veldsink, J. H.; et al. Glacial refugia and recolonization pathways in the brown seaweed. Mol Ecol 2007, 16, 3606–3616. [Google Scholar] [CrossRef]
- Hu, Z. M.; Kantachumpoo, A.; Liu, R. Y.; et al. A late Pleistocene marine glacial refugium in the south-west of Hainan Island, China: Phylogeographical insights from the brown alga. J Biogeogr 2018, 45, 355–366. [Google Scholar] [CrossRef]
- Carpenter, K. E.; Barber, P. H.; Crandall, E. D.; et al. Comparative phylogeography of the coral triangle and implications for marine management. J Mar Biol 2011, 396982. [Google Scholar] [CrossRef]
- Famà, P.; Wysor, B.; Kooistra, W. H. C. F.; et al. Molecular phylogeny of the genus Caulerpa (Caulerpales, Chlorophyta) inferred from chloroplast tufA gene. J Phycol 2002, 38, 1040–1050. [Google Scholar] [CrossRef]
- Cremen, M. C. M.; Huisman, J. M.; Marcelino, V. R.; et al. Taxonomic revision of Halimeda (Bryopsidales, Chlorophyta) in south-western Australia. Aust Syst Bot 2016, 29, 41–54. [Google Scholar] [CrossRef]
- Rindi, F.; Pasella, M. M.; Lee, M. F. E.; et al. Phylogeography of the mediterranean green seaweed Halimeda tuna (Ulvophyceae, Chlorophyta). J Phycol 2020, 56, 1109–1113. [Google Scholar] [CrossRef]
- Hanyuda, T.; Arai, S.; Ueda, K. Variability in the rbcL introns of Caulerpalean algae (Chlorophyta, Ulvophyceae). J Plant Res 2000, 113, 403–413. [Google Scholar] [CrossRef]
- Curtis, N. E.; Dawes, C. J.; Pierce, S. K. Phylogenetic analysis of the large subunit RUBISCO gene supports the exclusion of Avrainvillea and Cladocephalus from the Udoteaceae (Bryopsidales, Chlorophyta). J Phycol 2008, 44, 761–767. [Google Scholar] [CrossRef]
- Kumar, S.; Stecher, G.; Li, M.; et al. MEGA X: Molecular evolutionary genetics analysis across computing platforms. Mol Biol Evol 2018, 35, 1547–1549. [Google Scholar] [CrossRef]
- Excoffier, L.; Lischer, H. E. L. Arlequin suite ver 3.5: a new series of programs to perform population genetics analyses under Linux and Windows. Mol Ecol Resour 2010, 10, 564–567. [Google Scholar] [CrossRef]
- Darriba, D.; Taboada, G. L.; Doallo, R.; et al. jModelTest 2: more models, new heuristics and parallel computing. Nat Methods 2012, 9, 772–772. [Google Scholar] [CrossRef]
- Guindon, S.; Gascuel, O. A simple, fast, and accurate algorithm to estimate large phylogenies by maximum likelihood. Syst Biol 2003, 52, 696–704. [Google Scholar] [CrossRef]
- Bouckaert, R.; Vaughan, T. G.; Barido-Sottani, J.; et al. BEAST 2.5: An advanced software platform for Bayesian evolutionary analysis. Plos Comput Biol, 2019; 15. [Google Scholar] [CrossRef]
- Rambaut, A.; Drummond, A. J.; Xie, D.; et al. Posterior summarization in Bayesian phylogenetics using Tracer 1.7. Syst Biol 2018, 67, 901–904. [Google Scholar] [CrossRef]
- Leigh, J. W.; Bryant, D. POPART: full-feature software for haplotype network construction. Methods Ecol Evol 2015, 6, 1110–1116. [Google Scholar] [CrossRef]
- Pritchard, J. K.; Stephens, M.; Donnelly, P. Inference of population structure using multilocus genotype data. Genetics 2000, 155, 945–959. [Google Scholar] [CrossRef] [PubMed]
- Falush, D.; Stephens, M.; Pritchard, J. K. Inference of population structure using multilocus genotype data: Linked loci and correlated allele frequencies. Genetics 2003, 164, 1567–1587. [Google Scholar] [CrossRef]
- Evanno, G.; Regnaut, S.; Goudet, J. Detecting the number of clusters of individuals using the software STRUCTURE: a simulation study. Mol Ecol 2005, 14, 2611–2620. [Google Scholar] [CrossRef] [PubMed]
- Peakall, R.; Smouse, P. E. GenAlEx 6.5: genetic analysis in Excel. Population genetic software for teaching and research-an update. Bioinformatics 2012, 28, 2537–2539. [Google Scholar] [CrossRef] [PubMed]
- Librado, P.; Rozas, J. DnaSP v5: a software for comprehensive analysis of DNA polymorphism data. Bioinformatics 2009, 25, 1451–1452. [Google Scholar] [CrossRef] [PubMed]
- Verbruggen, H.; Ashworth, M.; LoDuca, S. T.; et al. A multi-locus time-calibrated phylogeny of the siphonous green algae. Mol Phylogenet Evol 2009, 50, 642–653. [Google Scholar] [CrossRef]
- Beerli, P.; Mashayekhi, S.; Sadeghi, M.; et al. Population genetic inference with MIGRATE. Curr Protoc Bioinform 2019, 68, e87. [Google Scholar] [CrossRef]
Disclaimer/Publisher’s Note: The statements, opinions and data contained in all publications are solely those of the individual author(s) and contributor(s) and not of MDPI and/or the editor(s). MDPI and/or the editor(s) disclaim responsibility for any injury to people or property resulting from any ideas, methods, instructions or products referred to in the content. |
© 2025 by the authors. Licensee MDPI, Basel, Switzerland. This article is an open access article distributed under the terms and conditions of the Creative Commons Attribution (CC BY) license (https://creativecommons.org/licenses/by/4.0/).
Copyright: This open access article is published under a Creative Commons CC BY 4.0 license, which permit the free download, distribution, and reuse, provided that the author and preprint are cited in any reuse.


