
Submitted:
24 March 2025
Posted:
25 March 2025
You are already at the latest version
Abstract
Bacterial extracellular vesicles (BEVs) produced by members of the intestinal microbiota can contribute not only to digestion but also mediate microbe-host cell communication via the transfer of functional biomolecules to mammalian host cells. An unresolved question is what host factors and conditions influence BEV cargoes and how do they impact on host cell function? To address this question, we analysed and compared the proteome of BEVs released by the major human gastrointestinal tract (GIT) symbiont Bacteroides thetaiotaomicron (Bt) in vivo in fed versus fasted animals using nano-liquid chromatography with tandem mass spectrometry (LC-MSMS). Among the proteins whose abundance was negatively affected by fasting, nine of ten proteins of the serine protease family, including the regulatory protein dipeptidyl peptidase-4 (DPP-4), were significantly decreased in BEVs produced in the GIT of fasted animals. Strikingly, in extracellular vesicles produced by the intestinal epithelium of the same fasted mice, the proteins with the most increased abundance were serine protease inhibitors (serpins). Together, these findings suggest a dynamic interaction between GI bacteria and the host. Additionally, they indicate a regulatory role for the host in determining the balance between bacterial serine proteases and host serpins exported in bacterial and host extracellular vesicles.
Keywords:
Bacterial extracellular vesicles
; proteome
; intestine
; microbiota
; nutrition
; Bacteroides thetaiotaomicron
1. Introduction
The human gastrointestinal (GI) ecosystem harbors a complex and dynamic population of microorganisms termed the microbiota which through its role in digestion influences host nutrition and energy metabolism as well as promoting the development and functioning of the immune system [1,2,3]. The GI tract (GIT) microbiota also protects against infection by pathogenic organisms, and it can impact on the central nervous system by influencing neural development, neuronal cell signalling, brain chemistry and behaviour that comprises the gut-(microbiota)-brain axis [4,5,6,7,8].
Despite an increasing awareness of the dynamic relationship between the host and its GI microbiota, the molecular basis and pathways of cross-kingdom interactions are poorly understood. In the absence of any direct cognate interactions, it most likely occurs via soluble mediators able to penetrate the sterile mucus barrier that coats boundary intestinal epithelial cells [9,10]. These include microbial metabolites, signalling molecules, hormones, and from the host, epithelial-derived substances such as mucins, cytokines and antimicrobial peptides [9]. More recently, another pathway of host-microbe crosstalk has been identified involving bacterial extracellular vesicles (BEVs) [11]. These contain not only small molecules such as metabolites [12] but larger molecules including proteins and nucleic acids with the potential of contributing to inter- as well as cross-kingdom interactions [13,14,15].
BEVs are spherical nanoparticles ranging in size from 20 nm to 400 nm in diameter and include membrane vesicles (MVs) produced by Gram-positive bacteria, and outer membrane vesicles (OMVs), outer-inner membrane vesicles (OIMVs) and explosive outer membrane vesicles (EOMVs) [14,15] produced by Gram-negative bacteria. The GIT of animals contains a multitude of bacterial species capable of producing membrane vesicles implicated in digestion and in the development and functioning of the immune system [15,16]. The Gram-negative anaerobic bacterium Bacteroides thetaiotaomicron (Bt) is an abundant bacterial gut symbiont found in the GIT of all animals. In the human distal small intestine and colon, the BEVs it produces contribute to the degradation of complex polysaccharides and immune homeostasis [17,18,19]. Proteomic studies have shown that members of the Bacteroides genus, including Bt, use their BEVs as delivery vehicles for the distribution of hydrolases, such as proteases and glycosidases [20]. More recently, we have shown that Bt BEVs produced in the GI tract of mice are enriched in proteins and enzymes, including dipeptidyl peptidases, asparaginase and bile salt hydrolases that can influence host cell biosynthetic pathways [21].
EVs are released by host cells in the intestinal mucosa including immune and epithelial cells [22] and can be exogenously derived when associated with ingested food [23]. Three main categories of human cell derived EVs have been distinguished based on size; exosomes (30–150 nm), microvesicles (100-1000 nm), and apoptotic bodies (1000–5000 nm). Exosome production involves plasma membrane endocytosis, multivesicular endosomes trafficking, and exocytosis into the extracellular milieu. Microvesicles are produced through plasma membrane budding while apoptotic bodies derive from membrane blebbing during apoptosis [23]. Host intestinal EVs can theoretically contain all molecules present in the cell of origin, including lipids and sphingolipids, proteins, mRNAs, microRNAs and non-coding RNA [24]. EVs can protect their cargo from proteases and nucleases which enables the delivery of bioactive molecules to neighbouring cells in the GIT enabling them to act as mediators of long-distance cell–cell communication and interaction [25].
Among their protein cargo, EVs can contain serpins (serine protease inhibitors), a family of proteins that inhibit serine proteases by irreversibly changing their conformation [26]. Mammalian serpins are involved in diverse physiological processes, ranging from blood coagulation, blood pressure, fibrinolysis, insulin sensitivity, inflammatory or immune responses, and tissue remodeling [26,27]. Several serpins were identified in EVs in a study assessing their ability to promote wound closure in a mouse model of type 2 diabetes (db/db) with impaired wound healing. While wildtype EVs collected at a wound site of a WT mouse accelerated wound closure in a db/db mouse, EVs from diabetic mice were impaired in their ability to heal wounds. A comparative proteomics showed a deficit in the abundance of a family of serine protease inhibitors, specifically serpins A1 (anti-trypsin), serpin F2 (anti-plasmin), and serpin G1 (plasma protease C1 inhibitor) in EVs from diabetic mice [24]. Another example is the serpin family E member 1 (SERPINE1) enriched in EVs released by senescent tumour cells (STCs) in the context of EVs emerging as mediator of the senescence-associated secretory phenotype (SASP) tumour-promoting effect. Through the packaging in EVs, SERPINE1 is transported into recipient cancer cells, binds to NF-κB p65 and promotes its nuclear translocation which results in tumour progression [28].
Here we have assessed the impact of nutrient stress on BEV protein composition by performing a comparative proteomics analysis of BEVs produced in the intestine of Bt mono-conventionalised germ-free mice provided food ad libitum or fasted. Our results establish that the abundance of serine proteases including dipeptidyl peptidase-4 (DPP-4) is decreased under fasting conditions. These changes were mirrored by the increased abundance of serine protease inhibitors (serpins) in host cell-derived EVs.
2. Results
2.1. The Proteome of BEVs Produced In Vivo
To assess whether nutrient stress and a period of fasting affects the protein composition of BEVs produced by Bt in the GIT, germ-free mice were orally gavaged with Bt with one group of conventionalised mice allowed unrestricted access to food and water, and a second group being restricted access to food for 16 h (the maximum period allowed under UK Home Office Regulations). BEVs and EVs extracted from the caecum were equivalent in size from both fed and fasted mice with a mean size of approximately 195 (± 9.5) nm as determined by nanoparticle tracking analysis (NTA) (Figure 1a). By contrast, 1.6 times more nanoparticles were recovered from the caecum of fasted mice (1.0 x 10¹¹ particles/ml) compared to fed animals (Figure 1a). Vesicles obtained from both conditions were visualised by electron microscopy (Figure 1b).
Comparison of the proteome of caecal BEVs from fed and fasted animals (Table S1) showed differences in protein abundance (Figure 1c). Using principal component analysis (PCA), the first two PCs account for 68.6 % and 14.5%, respectively, of the total variation in the dataset allowing a clear distinction between BEV proteomes from fasted and fed mice (Figure 1c). A volcano plot analysis of the dataset showed that of the 528 proteins identified in BEVs extracted from fasted and fed mice, 263 were differentially abundant (fold change ≥ 1.3, P ≤ 0.05). Of these, 119 were more abundant in BEVs extracted from fasting animals whereas 144 proteins were more abundant in BEVs derived from fed animals (Figure 1d).
An overrepresentation analysis was performed to determine whether known biological functions or processes were enriched in BEVs compared to their parental cell’s proteome (Table S2). In general, activities related to the hydrolysis of sugar molecules were overrepresented in BEVs. For example, sucrose alpha-glucosidase activity (GO:0004575) and beta-fructofuranosidase activity (GO:0004564) were enriched in BEVs (fold-change 10.46 for both annotations). Peptidase activities were also enriched with dipeptidyl peptidase activities enriched by a factor of 7.47 in BEVs (Table S2).
Many proteins encoded by polysaccharide utilisation units (PULs) comprising neighbouring genes involved in the breakdown of specific glycans were present in BEVs (Table S3) which were classified using the Polysaccharide-Utilisation Loci DataBase (PULDB)
http://www.cazy.org/PULDB/ [29] (Table S3). The proteins originating from the starch degrading PUL66 were particularly abundant (peptide-spectrum match or PSM ranging from 5 to 41) which most likely reflects the high (~34%) starch content of mouse chow. The PUL components involved in the degradation of rhamnogalacturonan-II (PUL77), pectic galactan (PUL86) and arabinogalactan (PUL65) were also found to be abundant. Moreover, in fasted mice, there was an increased abundance of PULs capable of degrading host glycans and mucins (PULs 6, 35, 17 and 81).
On a different note, Bt-TenA (BT_3146) which belongs to a novel sub-class of TenA_C enzymes and includes members in animal genomes [30] showed a 2.2-fold increase in abundance in BEVs from fasted mice. As Bt-TenA contributes to the thiamine salvage pathway which regenerates thiamine-derived pyrimidine from degraded thiamine products [31], the increased abundance of Bt-TenA may ensure the survival of Bt in nutrient poor conditions and reduced thiamine bioavailability.
2.2. Serine proteases are less abundant in BEVs produced in fasted mice
We next performed a gene ontology analysis and pathway enrichment to investigate whether categories of proteins were affected by diet within the proteome of BEVs under each condition. Strikingly, the abundance of nine of ten proteins identified as serine proteases was reduced in BEVs produced in the intestine of fasted mice (Table 1). Amongst them were DPP-4-like proteins predicted to be secreted and encoded by BT_4193 and BT_3254. In humans DPP-4 (CD26) truncates proteins containing the amino acid proline or alanine in the second position of the N terminus, including the appetite hormones GLP-1, GIP and neuropeptide substance P. DPP-4-like activity encoded by the intestinal microbiome may therefore constitute a novel mechanism to modulate protein digestion and host metabolism [32]. To date, no defined roles have been attributed to the eight remaining serine proteases.
2.3. BT_1314 is a γ-D-glutamyl-L-diamino Acid Endopeptidase
We have previously shown the BT_1314 enzyme (annotated as a dipeptidyl-peptidase-6) to be enriched in BEVs in vivo compared to BEVs harvested from in vitro cultures [21]. Similar to DPP-4 (BT_4193) and the prolyl tripeptidyl aminopeptidase BT_3254 [33], BT_1314 decreased in abundance (0.838-fold) in BEVs produced in fasted mice (Table S1). The human DPP-6 (DPP-4-like) is a serine protease that binds specific voltage-gated potassium channels, altering their expression and biophysical properties [34] whereas BT_1314 is not a serine protease (as defined by the PANTHER classification system) and is therefore misannotated. A BLAST of the BT_1314 protein sequence against the “UniProtKB with 3D structure (PDB)” database revealed a 29.35 % identity to the protein sequence of YkfC from Bacillus cereus ATCC 10987 [35] with a shared protein domain architecture which includes an SH3_16 domain (bacterial dipeptidyl-peptidase SH3 domain) and a C-terminal NLPC_P60 endopeptidase domain, as predicted by InterPro [36] (Figure 2a). Using a recombinant version of BT_1314 we confirmed that BT_1314 is, like YkfC of Bacillus sp., a γ-D-glutamyl-L-diamino acid endopeptidase able to degrade L-Ala-γ-D-Glu-diaminolimelic acid (Tri-DAP) (Figure 2b), a substrate deriving from the peptidoglycan (PG) of a subset of Gram-negative bacilli and Gram-positive bacteria including Bacillus which is an agonist of the NOD1 pattern recognition receptor [37].
2.4. The Serine Protease BT_4193 Is a Functional DPP-4 Enzyme in BEVs
Amongst the potential DPP-4 enzymes selectively enriched in BEVs produced in vivo in the mouse GIT [21], we have established that BT_1314 is misannotated as DPP-6- or DPP-4-like (does not degrade the DPP-4 substrate Ala-Pro-pNA) and is instead a murein peptide peptidase. In addition, Keller et al. have demonstrated that BT_3254 is a prolyl tripeptidyl aminopeptidase (PTP) and that BT_4193 is a DPP-4 and a functional homolog of the human DPP-4 that can be inhibited by human DPP-4-targeted drugs [33]. A non-catalytic role for BT_4193 was also described in maintaining cell envelope integrity and establishing Bt within multispecies communities [33].
To demonstrate BEVs produced in vivo can actively degrade both DPP-4 and PTP substrates, chow fed germ-free mice were mono-conventionalised with either wild-type Bt, a DPP-4 deletion mutant or a PTP deletion mutant. To overcome any interfering activity of mouse EVs with BEV DPP-4 activity, we used sitagliptin, a DPP-4 inhibitor active against mammalian DPP-4 but with little effect on microbial DPP-4 [33,38]. Our results confirm that BEV derived BT_4193 accounted for DPP-4 activity with the BT_4193 mutant showing a significant decrease in activity (P = 0.0154) with the activity being further decreased in the presence of sitagliptin (Figure 3a). Some residual activity was detectable for DPP-4-mutant derived BEVs when compared to germ-free mice EVs treated with sitagliptin which suggests that BEVs likely contain enzymes with non-specific dipeptidase activity. As expected, the PTP deletion mutant was not affected with DPP-4 activity like that seen in the wild-type Bt conventionalised animals (Figure 3a). Sitagliptin inhibited the activity in mouse EVs decreasing it to the threshold of detection. The results also showed that BEVs produced in vivo carry active PTP (Figure 3b) with the activity significantly decreased in BEVs from mice colonised with the PTP deletion mutant. It should be noted that EVs produced in non-colonised germ-free mice degraded PTP substrates with the activity being approximately 2-fold lower than that for BEVs from mice conventionalised with wild-type Bt or the Bt DPP-4 deletion mutant. Therefore, the activity measured in the mixture of caecal BEVs and EVs includes both microbial and mouse-derived activities with each accounting for approximately half of the measured values. As expected, the PTP activity measured for BEVs originating from mice conventionalised with the Bt DDP-4 mutant was similar to the activity in BEVs from mice conventionalised with wild-type Bt (Figure 3b). In contrast, the activity in caecal BEVs and EVs from mice conventionalised with the Bt PTP mutant was lower than EVs from non-conventionalised germfree mice which may be accounted for by the reduced number of EVs produced in the Bt conventionalised animals, or less PTP activity in EVs produced in Bt conventionalised mice.
We also confirmed that BEVs produced in vitro can degrade the appetite hormone glucagon-like peptide-1 (GLP-1) and the neuropeptide substance P (data not shown) which contribute to appetite regulation and metabolism, gastric motility and digestion [39].
2.5. DPP-4 Activity in Intestinal Derived BEVs Is Decreased Under Fasting Conditions
Our proteomics studies showed that the abundance of 9/10 serine proteases was reduced in BEVs produced in the mouse intestine following 16 hours of fasting. To validate these results, we measured DPP-4 activity in EVs collected from the caecal contents of mice mono-conventionalised with wild-type Bt after fasting for 5 hours. As a comparator, we measured the activity of asparaginase BT_ 2757 the abundance of which was increased 2-fold in BEVs from fasted mice (Table S1). The activity of DPP-4 was reduced approximately 2-fold to levels comparable with those measured for EVs from non-fasted germ-free mice (Figure 4a). The increased asparaginase activity in BEVs of fasted mice was also confirmed (Figure 4b).
2.6. Proteome of Host EVs Produced in the GIT
Extracellular vesicles from the caecum of mice mono-conventionalised with Bt consisted of a combination of BEVs and host-derived EVs. The latter were composed primarily of exosomes as a consequence of the isolation procedure involving centrifugation (cell pelleting) and 2 steps of filter-sterilisation (with 0.22 µm pore size filters) which reduces the presence of microvesicles and apoptotic bodies. By running a peptide match against the UniProt mouse protein database, 967 proteins from mouse EVs were identified with high confidence (Table S4a). Using PCA, the first two PCs accounted for 28.1 % and 20.5 %, respectively, of the total variation in the dataset allowing a distinction between host EV proteomes of fasted versus fed mice (Figure 5a). A volcano plot of the dataset showed that the abundance of 64 proteins was significantly increased (>1.3-fold, P ≤ 0.05) in fasted conditions in the proteome of EVs from intestinal cells whereas the abundance of 108 proteins was significantly reduced (Figure 5b).
The protein list included 64% of the top 100 protein markers identified in EVs (http://microvesicles.org/extracellular_vesicle_markers, [40] (Table S4b). These comprised tetraspanin proteins belonging to a family of membrane proteins [41,42] including the cell surface glycoprotein CD63, CD82 and CD9 (included in the list despite a 5% FDR value), the endosomal sorting complex required for transport (ESCRT) proteins TSG101 and ALIX, integrins such as Itgb1, actin (Actb), heat shock proteins including HSP90, and six members of the 14-3-3 protein family comprising phospho-binding proteins, and nine annexins (Anxa1-7, Anxa11 and 13), all commonly found in eukaryotic vesicles [43].
An overrepresentation analysis was performed to determine whether known biological functions were enriched in mouse EVs compared to mouse genome predicted proteins (Table S5). Activities related to cellular metabolism were highly enriched, such as cyanamide hydratase activity (GO:0018820) or alkaline phosphatase activity (GO:0004035) (40- and 30-fold enrichment, respectively). Similarly, aminopeptidase and exopeptidase (7.78- and 6.6-fold enrichment, respectively) as well as metalloexopeptidase and carboxypeptidase activities (6.6- and 6.51-fold enrichment, respectively) were all significantly enriched (P = 1 x 10⁻⁴ - 8.7 x 10⁻⁸). By comparison, activities related to cell signalling and DNA transcription were essentially less enriched in the extracted host EVs.
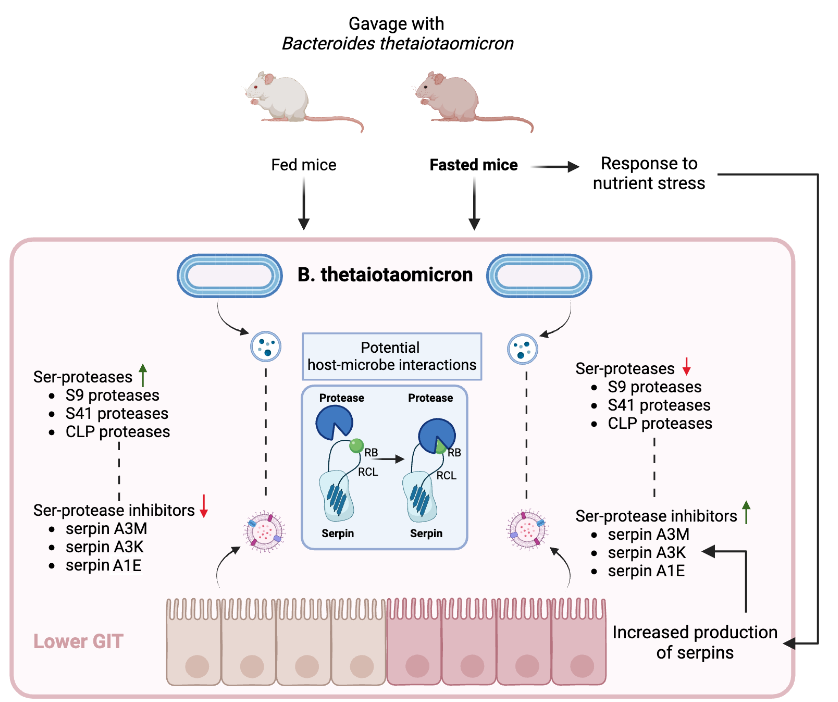
2.7. Increased Abundance of Serine Protease Inhibitors and Antimicrobial Proteins in Host EVs Produced In Vivo
In comparing the abundance ratio for each protein in caecal EV preparations derived from fasted versus fed animals (Table 2), three serine protease inhibitors (serpin A3M, A3K and A1E) were more abundant in fasted mice (5-, 2.5- and 2.1-fold, respectively). Serpins act as serine protease inhibitors representing up to 2–10% of proteins in human blood and are the third most common protein family [44]. We also observed a 3.5-fold increase in the abundance of the murine specific α-defensin CRISC-2 in EVs produced in fasted mice. α-Defensins are produced by Paneth cells of the small intestinal epithelium acting as part of the innate immune system with antimicrobial activity against a wide variety of organisms [45].
2.8. Potential Interactions Between Host Serpins and Bacterial Serine Proteases
To address the question of whether the three serpins A3M, A3K and A1e exhibiting an increased abundance in EVs of fasted mice (Table 2) could potentially inhibit the nine serine proteases showing a decreased abundance in BEVs of the same mice (Table 1), we performed structural predictions. The analysis highlighted that the nine bacterial proteases could potentially establish complexes with the serpin A3M, A3K and A1E. The 3D protein structure prediction tool AlphaFold2 assigned pLDDT (high/low/very low) and pDockQ scores to assess the confidence of the predicted protein-protein interactions, with values above 0.5 considered as high-confidence interactions. The average values for each score were calculated based on the five predicted models (Table S6).
Members of the S9 peptidase family demonstrated the most robust interactions with host serpins, which are characterised by high pDockQ scores and high pLDDT values. In contrast, the serine proteases belonging to CLP, S41, and PDZ-containing protease families generally exhibited medium to very low-confidence interactions, suggesting a lower likelihood of significant connections.
To further explore the high-confidence interactions, these host-microbe protein complexes were visualised using Mol* RCSB 3D Viewer to identify the bacterial S9 protease domain and the reactive loop and bond on the serpins (Figure 6), with these interactions typically occurring in protease-serpin complex [46]. The results confirmed that serpin A3K and A1E may interact with the four serine proteases carrying the S9 protease domain (BT_4193, BT_3254, BT_0587, BT_1838), as their reactive bonds are targeted by this domain.
3. Discussion
Our study provides novel insights into microbe-host interactions in the mammalian GIT describing how nutrient stress and a period of fasting affects the composition of bacterial and intestinal EVs. Using the model human commensal gut bacterium Bt, we have shown that the profile of BEV proteins and that of host cell derived EVs is influenced by nutrient availability, demonstrating the selective enrichment of proteins and enzymes capable of modulating host metabolism.
In the GIT of various animals including rodents, fasting leads to an increase in the relative abundance of members of the Bacteroidetes phylum irrespective of the fasting period (1-3 days) [47,48]. This increase could be attributable to the ability of some phyla members to utilise host glycans in the absence of dietary equivalents [49,50,51] indicating that the survival and growth of Bt may not be adversely affected by variations in dietary nutrient supply [47]. This may explain the small variations observed in the proteome of BEVs produced from Bt colonising the lower GIT of fasted mice when compared to fed mice. For example, we did not observe an increase in host glycan-specific and surface-exposed glycohydrolases in BEVs from fasted animals. Indeed, their abundance exhibited a downward trend of up to 2-fold compared to their levels in BEVs from fed animals. However, it is interesting to note that for the PULs identified, the abundance of the integral membrane oligosaccharide importer SusC is increased by about 50% in BEVs produced under fasting conditions whereas other proteins belonging to the same PULs, including SusD (nutrient binding accessory protein) are equally or less abundant under fasting conditions. The observed 50% increase in SusC under fasting conditions likely reflects an adaptive strategy by Bt to enhance its ability to utilise host-derived glycans as an alternative energy source when dietary nutrients are scarce.
We have previously described the substantial enrichment of three enzymes annotated as “DPP-4” encoded by BT_4193 and BT_3254, or “DPP-4-like, DPP-6” encoded by BT_1314 in BEVs produced in vivo (Stentz et al., 2022). Subsequently, BT_4193 is the only verifiable DPP-4 enzyme while BT_3254 is a PTP (Keller et al., 2023), and as shown here BT_1314 is a dipeptidyl peptidase that degrades the NOD1 agonist Tri-DAP and potentially, other PG muropeptides, as shown for YkfC, its protein homologue found in Bacillus species [35]. Our proteomics analysis shows that the abundance of BT_4393 is reduced 2-fold in BEVs produced in the GIT of fasted mice with this decrease also apparent for 9/10 serine proteases including PTP. This was confirmed by measuring the activity of DPP-4 and PTP in fasted versus fed mice. The impact of proteases released by commensal bacteria on the GIT have received increasing attention [52], playing a role in the maintenance of a complex balance between proteases and their host targets. Host protease inhibitors are necessary to preserve the functionality and integrity of the GIT as disruption of this equilibrium contributes to a diseased state. For example, in ulcerative colitis (UC) patients the elastase-like serine protease activity is positively correlated with the relative abundance of Phocaeicola vulgatus, a species of Bacteroidetes with high proteolytic activities [53,54]. In addition, transfer of the faecal microbiota from UC patients into healthy mice increased proteolytic activity in the colon and activation of host inflammatory responses [54]. Some of the correlated proteases produced by Bacteroides and Phocaeicola species include serine proteases and metalloproteases that may intensify disease activity [55]. Therefore, it can be hypothesised that the reduction of serine proteases and possibly metalloproteases secreted in BEVs produced in fasted mice is the result of a coordination mechanism aimed at preserving intestinal homeostasis against the threat of microbial protease activity in instances of nutrient stress. The control of protease activity in fasted mice is also suggested by the augmentation of protease inhibitor levels in host EVs.
BT_4193 could influence host physiology via its effect on protein and glycan (e.g., gluten) digestion, signal transduction and apoptosis [32]. Based upon their ability to cleave and inactivate various signalling molecules important in metabolism (i.e., incretins), the immune system (i.e., growth factors and cytokines), and the CNS (i.e., neuropeptides) [32], it is tempting to speculate that based upon the ability of Bt BEVs to access the systemic circulation [56,57], BEVs can impact on various aspects of host physiology and behaviour. Consistent with this interpretation is the ability of DPP-4 produced by bacteria in the GIT to affect blood glucose homeostasis by targeting and degrading active GLP-1. Also, it has been shown that microbial DPP-4 impairs host glucose homeostasis in mice with a disrupted GIT barrier and leaky gut [38]. In a healthy GIT with an intact epithelial barrier BEVs carrying DPP-4 can readily access the circulatory system to influence blood glucose homeostasis by inactivating GLP-1, a hypothesis worthy of further investigation.
We have also shown that BT_1314 shares structural and functional homologies with YkfC of Gram-positive Bacilli, a dipeptidyl peptidase involved in the cleavage of the peptide bond between the glutamate and DAP residues of murein peptides which derive from PG breakdown and recycling [35]. Using LC-MSMS, BT_1314 exhibits dipeptide hydrolase activity that can act on the murein peptide Tri-DAP. The pro-inflammatory activity of this tripeptide is known, and it is an archetypal agonist of the intracellular NOD1 receptor and more generally of the NOD1 signalling pathway [37]. The activity of BT_1314 associated to BEVs could therefore serve to counteract the potential inflammatory responses triggered by PG murein peptides continuously released by intestinal bacteria, aiding in the prevention of local inflammation within the intestinal mucosa.
The protein profile of mammalian EVs produced in the caecum of fasted mice contained three serine protease inhibitors: A3M, A3K, and A1E serpins (Figure 6), with their abundances increased by 2- to 5-fold compared to fed mice. In humans, the serpinA3 protein is produced primarily by the liver, is secreted into the plasma and contributes to anti-inflammatory and antiviral responses [58]. As the mouse A3M and A3K serpin protein sequences are only partially similar to the human serpinA3 (58% and 60% amino acid sequence identities, respectively), and due to limited functional data in mice, it is difficult to predict their role [58]. Moreover, 7 additional serpins (InterPro family IPR000215) were identified, exhibiting similar abundances in fasted and fed mice (Table S4a). High protease activity measured in the faeces of patients suffering from irritable bowel syndrome has been shown to correlate with a decrease in microbial diversity [59]. It is therefore speculated that the various serine protease inhibitors detected in EVs produced in Bt mono-colonised germ-free mice are a consequence of the lack of microbial diversity and could counteract the detrimental effect of proteases produced in high abundance by a Bacteroides species [54] in the GIT of these mice.
The structural analysis of the predicted interactions between bacterial serine proteases and host serpins provided valuable insights into the potential mechanisms by which the host may modulate microbial processes, maintain gut homeostasis, and contribute to gut health. The distinct variations in interaction confidence among different serine protease families revealed the importance of structural compatibility in mediating protease-inhibitor interactions. The high compatibility of the Peptidase S9 domain with the serpin inhibitory mechanism highlights their potential biological significance in regulating homeostatic processes. These serine proteases are generally involved in protein degradation due to their broad substrate specificity and efficiency in breaking down dietary and host proteins [60]. The interplay between these microbial and host proteins could facilitate the control of excessive bacterial protease activity, preventing potential damage to the gut lining and maintaining a homeostatic environment [52]. According to the literature, serine protease-serpin complexes are formed through a specific part of the inhibitors, called the reactive center loop (RCL) [46]. The proteases target the reactive bond within the RCL, typically involving two amino acids, leading to the formation of covalent protease-serpin suicide-inhibitory complexes [61]. Analysis of the S9 protease domain – RCL interactions at the atomic level suggests that serpin A3K and A1E are potentially capable of forming interactions that may lead to the inhibition of bacterial serine-proteases. While structural predictions using Alphafold-Multimer provide valuable insights into potential host-microbe interactions, it is essential to validate these findings experimentally.
The human and mouse small intestine share many similarities in their microbial defence strategies, including production of α-defensins which are also found in EVs [62]. Mice, however, produce a unique antimicrobial peptide and member of the CRS (cryptdin-related sequences)-peptide family, not found in human [63]. We observed a 3.5-fold increase in the abundance of a member of the CRS family, CRISC-2 α-defensin, in EVs produced in fasted mice. Whether a decrease in nutrient availability in the mouse intestine leads to increased expression of CRISC-2, or an increased number of the secretory Paneth cells and/or to CRISC-2 preferentially packaged into EVs needs to be determined.
The heterogeneity of mammalian EVs complicates the interpretation of data obtained from complex biological tissues such as the GIT samples used in the present study. Clearly, there is a need for obtaining pure preparations of different EV populations, including both mammalian and bacterial EVs. One promising approach for EV separation involves high-resolution density gradient fractionation to separate small EVs (sEVs) from non-vesicular material, followed by the separation of exosomes from other EVs using direct immunoaffinity capture [43]. This approach resulted in the isolation of vesicles carrying the tetraspanin exosomal markers CD9 and CD63, which were identified in the present study, whereas CD81 was not. Some proteins, including GAPDH, ENO1, 14-3-3, HSP90, and PARK7/DJ1, identified in our study, were present in sEVs but absent in classical exosomes [43]. Similarly, cytoskeleton proteins like actins, tubulins, and keratins, found in our EV samples, were absent in classical exosomes and present in sEVs proteomic datasets [43]. Other discriminatory markers identified in varying abundances in our EV samples included membrane-bound annexins, such as annexin A1, which is characteristic of microvesicles, while others may be associated with exosomes or sEVs [43]. Additionally, the ESCRT proteins TSG101 and ALIX were identified, with ALIX being strongly associated with classical exosomes [43].
In summary, our findings provide evidence for the influence of nutrient stress on the protein composition of BEVs and intestinal EVs in the mouse caecum, highlighting the dynamic interplay and interactions between the host and its microbiome. This manifests at the level of cross-kingdom regulated production of bacterial proteases, countered by the production of specific inhibitors by host cells in the GIT that can help maintain intestinal homeostasis and GIT health.
4. Materials and Methods
4.1. Animal Studies
All mice were maintained under 12 h light/dark cycle and received autoclaved water and RM3-(Autoclavable) (GF) diet (Special Diets Services). Animal experiments were conducted in full accordance with the Animal Scientific Procedures Act 1986 under UK Home Office approval and following approval by the local Animal Welfare and Ethical Review Body. No explicit exclusion criteria were set for animals a priori, but any animals showing signs of distress or illness would have been removed based on standard animal welfare protocols. For proteomics analysis, ten germ-free C57BL/6 (males, 14 weeks old) mice were gavaged with 108 CFU Bt in 100 μL PBS. Mice had unrestricted access to chow and water for 2 days after which a group of 5 mice were fasted for 16 hours. For the validation study, BEV enzymatic activities ex-vivo were measured after fasting of the animals. Germfree C57BL/6 mice (n=5 per group) gavaged with Bt as described above, also had unrestricted access to chow and water for 2 days, with groups of mice fasted for 5 hours. At post-mortem, caecal contents were collected, homogenised in PBS (10% w/v) and centrifuged for 2 min at 100 g and the supernatant collected. A 100 μL aliquot was removed to enumerate bacteria on BHI-haemin agar (= 12 ± 3 x 10¹⁰ CFU/g colon content). The supernatants were then centrifuged at 5500 g, 4°C for 15 min and the supernatant filtered through polyethersulfone (PES) membranes (0.22 μm pore-size) (Sartorius) to remove debris and remaining cells. Vesicle suspensions were concentrated by crossflow ultrafiltration (100 kDa MWCO, Vivaflow 200, Sartorius) to 5 mL, rinsed by addition of 500 mL of PBS, pH 7.4, concentrated again by crossflow filtration to 5 mL and the retentates were concentrated to 1 mL with a Vivaspin 20 centrifugal concentrator (100 kDa molecular weight cut-off, Sartorius). Further purification of BEVs and EVs was performed by size-exclusion chromatography (SEC) using either CL2-B Sepharose (Sigma-Aldrich) in PBS buffer for the proteomics analysis, as previously described [21], or using a qEV/35 nm series SEC column according to the manufacturer’s instructions (IZON Science, Lyon, France) with the pooled collected fractions filtered through PES membranes (0.22 μm pore-size) and stored at 4°C. For proteomics analysis, the pooled fractions were adjusted to 8.9 mL and the BEV suspension ultracentrifuged (150,000 g at 4oC or 2 h in a Ti70 rotor (Beckman Instruments)). After ultracentrifugation, the supernatant was removed using a vacuum pump and the vesicle pellets snap frozen in liquid nitrogen and stored at -80°C prior to extraction.
4.2. Nanoparticle Analysis
For BEV preparations used in proteomic studies, hydrodynamic size distribution of vesicles was performed on aliquots of BEV suspensions diluted 100-fold with PBS. Videos were generated using a Nanosight nanoparticle instrument (NanoSight Ltd., Malvern Panalytical, USA) to count BEV numbers. A 1- min AVI file was recorded and analysed using NTA (Version 2.3 Build 0011 RC, Nanosight) software to calculate size distributions and vesicle concentrations using the following settings: Calibration: 166 nm/pixel; Blur auto: Detection threshold: 10, Minimum track length: auto, Temperature: 21.9°C, Viscosity: 0.96 cP. The accuracy of the measurement was confirmed using 100 nm silver nanoparticles (Sigma-Aldrich).
For BEV preparations used in enzyme assays, the size and concentration of the isolated Bt BEVs was determined using a ZetaView PMX-220 TWIN instrument according to manufacturer’s instructions (Particle Metrix GmbH, Germany). Aliquots of BEV suspensions were diluted 1,000- to 20,000-fold in particle-free PBS or water for analysis. Size distribution video data were acquired using the following settings: temperature: 25°C; frames: 60; duration: 2 s; cycles: 2; positions: 11; camera sensitivity: 80 and shutter value: 100. Data were analysed using the ZetaView NTA software (version 8.05.12) with the following post-acquisition settings: minimum brightness: 20; max area: 2000; min area: 5 and trace length: 30.
4.3. Proteomics
Comparative proteomics was carried out on samples of BEVs and EVs isolated from the caecum of fed or fasted mice. 5 mice were used for each condition providing 10 datasets including ratios (fasted versus fed) for each protein identified with the level of confidence determined by the false discovery rate (FDR), that were then further analysed. Proteomic samples consisted of 100 ug of BEV and EV protein extracts prepared and analysed by the Bristol University Proteomics Facility using TMT reagents (10-Plex format, Isobaric Mass Tagging kit, Thermo Scientific). Labelled samples were pooled and then fractionated using High pH Reverse Phase Liquid Chromatography. The resulting fractions were subjected to nano-LC MSMS using an Orbitrap Fusion Tribrid mass spectrometer with an SPS-MS3 acquisition method. Fragmentation of the isobaric tag released the low molecular mass reporter ions which were used to quantify the peptides. Protein quantitation was based on the median values of multiple peptides identified from the same protein, resulting in highly accurate protein quantitation between samples. The data sets were analysed using the Proteome Discoverer v2.1 software and run against the Bt VPI-5482 or mouse database and filtered with a 1% FDR cut-off. The abundance values for each TMT channel were normalised so that all channels had the same total abundance.
4.4. Statistical Analysis
PCA was performed using the R-based statistical analysis tool provided by the MetaboAnalyst 5.0 platform (https://www.metaboanalyst.ca/). The normalised dataset of relative abundances obtained from Proteome Discoverer v2.1 for each protein in each condition (5 replicates) was analysed. The data were log-transformed and 2 D score plots with PC1 on x-axis and PC2 on y-axis including the 95% confidence ellipses were generated.
A volcano plot combining a fold change analysis (1.3 threshold) and an unpaired T-test (P-value threshold 0.05) was also generated.
For the enzyme assays, data were subjected to one-way ANOVA followed by Dunnett’s multiple comparison post hoc test using GraphPad Prism 5 software. Statistically significant differences between two mean values were established by adjusted P-value. Data are presented as the mean ± standard deviation.
4.5. Proteomics Data Curation
For the Bt BEV protein profile, raw results displayed a list of 572 proteins identified in BEV produced in fasted and fed mice. Using the 99% confidence level (1% FDR), 34 proteins were removed. Proteins annotated as “not found in sample” in more than 50 % of total samples for each group (fasted or fed) were removed resulting in a total of 528 identified proteins.
For the EV protein profile, raw results displayed a list of 1189 proteins identified in BEVs produced in fasted and fed mice. Using the 99% confidence level (1% FDR), 159 proteins were removed. Proteins annotated as “not found in sample” in more than 50 % of total samples for each group (fasted or fed) were removed resulting in a total of 967 identified proteins.
4.6. Gene Ontology Analysis
Protein classification according to species-specific gene ontology (GO) annotations and overrepresentation analysis was performed using PANTHER version 14.0 http://www.pantherdb.org/ [64]. For the functional analysis in Bt, the source data included Bt BEV-derived proteins which were compared to the entire Bt genome. For the mice data, the proteins identified in EVs were compared to the whole mice genome. The overrepresentation analysis was conducted using Fisher’s Exact test to determine the significance of annotation overrepresentation.
4.7. Electron Microscopy
For negative stained TEM images, BEV and EV pellets were resuspended in 100 µL of d.H2O by vortex. 10 µL of each suspension was transferred to Cu 200 Formvar/carbon grids (Agar Scientific, Stansted, UK), avoiding large aggregates of material. The suspension was left on the grid for 1 minute before wicking off excess liquid with filter paper. The grids were stained with 2% aqueous uranyl acetate solution for 1 minute followed by wicking off excess stain with filter paper and being left to dry thoroughly. The grids were examined and imaged using a Tecnai G2 20 Twin transmission electron microscope (Thermo Fisher Scientific, Eindhoven, The Netherlands) at 200 kV.
4.8. BT_3254 (PTP) and BT_4193 (DPP-4) Deletion Mutants
BT_3254 and BT_4193 deletion mutant strains were generated using the method developed by Garcia-Bayona and Comstock [65]. Briefly, BT_3254 and BT_4193 flanking DNA fragments containing an overlap sequence were generated (upstream primers: BT3254-1 and -2, and downstream primers: BT3254-3 and -4, upstream primers: BT4193-1 and -2, and downstream primers: BT4193-3 and -4, Table S7). Recombinant PCR was used to combine the fragments. BamHI and EcoRV sites were introduced during amplification flanking the fragment to allow for ligation into pLGB13 [65]. E. coli PIR1+ (ThermoFisher scientific) was used to carry out the cloning and as the donor strain. Bt VPI-5482 was conjugated using triple mating with E. coli HB101 (pRK2013) used as the helper strain [66]. Transconjugants were selected on BHIS agar (gentamicin (200 μg/ml); erythromycin (25 μg/ml)) after 48 hours. 2 colonies were grown overnight in BHIH (gentamicin (200 μg/ml); erythromycin (25 μg/ml)) and streaked out on the counter selection plate of BHIH agar (gentamicin 200 μg/ml, anhydrotetracycline 100 ng/mL). Colonies lacking the gene were selected by colony PCR. Positive colonies were grown in BHIH (gentamicin (200 μg/ml); anhydrotetracycline (100 ng/mL) and stored at 80oC in 10% glycerol in BHIH prior to use.
4.9. DPP-4, PTP and Asparaginase Assays
BEV and EV suspensions were prepared as described above. DPP-4 assays were performed as described by Beauvais et al. (32). Briefly, 75 ul of 50 mM Tris HCl buffer (pH 7.5) and 5ul of Ala-Pro-pNA substrate (Bachem, 5 mg/mL in methanol,) were added to 20 µl of BEV/EV suspensions in a 96-well microtiter plate. For the PTP assays, the same procedure as above was carried out using Ala-Phe-Pro-pNA (Bachem, 5 mg/mL in methanol) as the substrate. Increasing concentrations of p-nitroaniline (Abcam) were used to establish a standard curve. The reaction mixture was incubated at 37°C and the absorbance at 405 nm was measured at 1 min intervals for 100 min using a FLUOstar Omega (BMG Labtech) plate reader.
Asparaginase activity was measured using the Nessler reagent method. Briefly, 10 μl of asparagine 189 mM was added to 100 μl of buffer (50 mM Tris Buffer, pH 8.6) and 50 μl of water to which 40 μl of BEV/EV suspension was added. The reaction mix was incubated at 37°C and 20 μl of reaction mix was collected every 30 minutes to which 1μl of 1.5 M trichloroacetic acid was added. The mix was centrifuged for 2 minutes at 20,000 x g and the supernatant added to 430 μl of water. 50 μl of Nessler reagent (Camlab) was added to the mix and the absorbance at 436 nm was recorded for standards, tests, and blanks using a FLUOstar Omega (BMG Labtech) plate reader. To establish a standard curve, dilutions of (NH4)2SO4 from (25-100 mM) were included. The concentration of protein in BEVs/EVs was determined using the Qubit protein assay (ThermoFisher Scientific) and was consistent with the concentrations of particles determined by Zetaview.
4.10. Recombinant BT_1314 and Enzymatic Activity
The 405 amino acids product of the BT_1314 C-terminal region excluding the 21 amino acid N-terminal predicted signal peptide was purified using the His-Tag technique. A PCR fragment was generated using the primer pair BT1314_up and BT1314_down (Table S7) and the resulting fragment was cloned into the NdeI/BamHI restriction sites of the pET-15b expression vector (Novagen), which carries an N-terminal His-Tag sequence. The resulting plasmid was used to transform BL21CodonPlus(DE3)-RIL E. coli cells (Stratagene). The Ni-NTA Fast Start kit (Qiagen) was used to purify the protein according to manufacturer’s instructions. Cells were grown at 30°C for 16 hours with a concentration of 0.5 mM IPTG. The imidazole used to elute the protein was removed using a PD-10 desalting column (Amersham Biosciences) and the buffer exchanged with 50 mM Tris-HCl, 300 mM NaCl pH7.2. The protein concentration was determined by direct UV measurement at 280 nm and by using the Bradford method.
To assess the activity of the recombinant BT_1314, 50 ng of the purified enzyme was added to 50 μM of Ala-γ-D-Glu-DAP (Tri-DAP, Eurogentec) in a reaction volume of 50 μl buffered with 50 mM Tris HCl (pH 7.5) and incubated for 16 hours at 37°C. After addition of 50 μl acetonitrile, the samples were centrifuged at 17,000 x g for 5 min. The supernatant was analysed by LC-MS on a Raptor Polar X (2.7 µm, 100 x 2.1 mm (Restek), using 0.5% formic acid in 20 mM ammonium formate (A) and 0.5% formic acid, 20 mM ammonium formate in 90% acetonitrile as mobile phase using the following gradient: an isocratic elution with 5% A for 5 min, followed by a linear increase of the concentration of A to 50% over three minutes. The concentration was retained at 50% for 5 min before the column was reconditioned with 5% A for 4 min. The analytes were detected by by a Xevo TQ Absolute triple quadrupole mass spectrometer (Waters) using Selected Ion Monitoring. Mass values of 189.1, 217.2, and 389.1, corresponding to DAP-1, L-Ala-γ-D-Glu and Tri-DAP, respectively, were monitored in negative ion mode, with a Cone voltage of 25 V and a dwell time of 0.003 s.
4.11. Structural Analysis of Potential Bacterial Protease—Host Serpin Interactions
AlphaFold2 [67]), a deep learning-based software that predict 3D protein structures, was used to study potential host-microbe interactions between the nine BEV-derived serine-proteases and the three serpin proteins (serpin A3M, A3K and A1E) from mice vesicles. Sequences of the bacterial protease and host serpin were obtained from the UniProt database and served as the input for the tool. Multiple sequence alignments (MSA) were generated using the MMseqs2 algorithm within the neurosnap platform [68], identifying homologous sequences from databases. This approach enhances the quality of sequence alignments, providing a more diverse input for structural predictions. AlphaFold2-Multimer (version 3) [69] was employed to predict the three-dimensional structure of the protease-serpin complexes. The model was configured to run with the following parameters:
- MSA mode: mmseqs2_uniref_env – AlphaFold 2 suggests this mode, as in most cases mmseqs2_uniref_env tends to produce the best results;
- Paired mode: unpaired – as the bacterial and host proteins are from different organisms, the unpaired set up separates the MSA for each chain;
- Number of ensembles recycles: Default settings (five recycles) were used to balance computational time with model accuracy;
- Number of ensembles: Default settings – 1 ensemble. The trunk of the network is run multiple times with different random choices for the MSA cluster centers.
The analysis resulted in five independent multimer models, their accuracy was evaluated based on the pLDDT (evaluates the local confidence) and PAE (positional error between residue pairs within and between chains) confidence metrics provided by AlphaFold2. The generated models were ranked based on pLDDT and overall structural stability described by the pDockQ score that measures the probability of protein-protein interactions. Molecular interactions have been visualised in the RBCS 3D viewer (https://www.rcsb.org/3d-view/) [70] using the PDB output from the analysis.
Supplementary Materials
The following supporting information can be downloaded at the website of this paper posted on Preprints.org. Table S1: Filtered list of proteins identified in BEVs; Table S2: Functional overrepresentation analysis of BEV versus parental cell proteomes; Table S3: Proteins encoded by Polysaccharide Utilisation Units (PULs) identified in BEVs; Table S4: High-confidence proteins identified in mouse-derived extracellular vesicles from caecum samples (Part a) and Mouse-derived extracellular vesicle proteins: alignment with Top 100 EV markers; Table S5: Overrepresented biological functions in mouse EV proteins; Table S6: Structural predictions of serpin-serine protease interactions: confidence scores for AlphaFold2 models; Table S7: Primers used for generating BT_3254 and BT_4193 deletion mutant strains.
Author Contributions
Conceptualisation; R.S.; and S.R.C; Methodology; R.S.;.; E.J.;.; L.G.;.; D. L.; and A.P.; Validation; R.S.; L.G. and D.L; Formal analysis; R.S. Investigation; R.S.; E.J.; L.G.; D.L. A.P.;.A.B.; A.J.G. and K.G. Resources; L.G., D.L., A.B., A.J.G. and K.G.; Data curation; R.S..; Writing—original draft preparation; R.S. and L.G..; Writing—review and editing; S.R.C.; E.J.;.L.G.; and D.L. Visualisation; R.S., L.G. and D.L.; Supervision; R.S. and S.R.C; Project administration; R.S. and S.R.C.; Funding acquisition; S.R.C. All authors have read and agreed to the published version of the manuscript.
Funding
The authors gratefully acknowledge the support of the Biotechnology and Biological Sciences Research Council (BBSRC); this research was funded by the BBSRC Institute Strategic Programme Grant Food Innovation and Health BB/R012512/1 and its constituent project BBS/E/F000PR10355 (SRC).
Institutional Review Board Statement
Not applicable.
Informed Consent Statement
Not applicable.
Data Availability Statement
All data used to support the findings of this study are included within the article.
Acknowledgments
The authors gratefully acknowledge the support of the Biotechnology and Biological Sciences Research Council (BBSRC); this research was funded by the BBSRC Core Capability Grant BB/CCG1860/1. We also thank the John Innes Centre Bioimaging facility and staff for their contribution to this publication.
Conflicts of Interest
The authors declare no conflict of interest.
References
- Hou, K.; Wu, Z.X.; Chen, X.Y.; Wang, J.Q.; Zhang, D.; Xiao, C.; Zhu, D.; Koya, J.B.; Wei, L.; Li, J.; et al. Microbiota in health and diseases. Signal Transduct. Targeted Ther. 2022, 7, 135. [Google Scholar] [CrossRef] [PubMed]
- Ribaldone, D.G.; Pellicano, R.; Fagoonee, S.; Actis, G.C. Modulation of the gut microbiota: Opportunities and regulatory aspects. Minerva Gastroenterol. 2023, 69, 128–140. [Google Scholar] [CrossRef] [PubMed]
- Wang, J.; He, M.; Yang, M.; Ai, X. Gut microbiota as a key regulator of intestinal mucosal immunity. Life Sci. 2024, 345, 122612. [Google Scholar] [CrossRef] [PubMed]
- Pickard, J.M.; Zeng, M.Y.; Caruso, R.; Núñez, G. Gut microbiota: Role in pathogen colonization, immune responses, and inflammatory disease. Immunol. Rev. 2017, 279, 70–89. [Google Scholar] [CrossRef]
- Sandrini S; Aldriwesh M; Alruways M; Freestone P. Microbial endocrinology: host-bacteria communication within the gut microbiome. J. Endocrinol. 2015, 225, R21–R34. [CrossRef]
- Spragge, F.; Bakkeren, E.; Jahn, M.T.; Araujo, E.B.N.; Pearson, C.F.; Wang, X.; Pankhurst, L.; Cunrath, O.; Foster, K.R. Microbiome diversity protects against pathogens by nutrient blocking. Science 2023, 382, eadj3502. [Google Scholar] [CrossRef]
- Foster, J.A. Modulating brain function with microbiota. Science 2022, 376, 936–937. [Google Scholar] [CrossRef]
- Zhu, X.; Sakamoto, S.; Ishii, C.; Smith, M.D.; Ito, K.; Obayashi, M.; Tanaka, T.K.; Suzuki, Y.A.; Takahashi, H.K.; Nakamura, S.H; et al. Dectin-1 signaling on colonic γδ T cells promotes psychosocial stress responses. Nat. Immunol. 2023, 24, 625–636. [Google Scholar] [CrossRef]
- Keely, SJ. Decoding host–microbiota communication in the gut – now we're flying! J. Physiol. 2017, 595, 417. [Google Scholar] [CrossRef]
- Zhang, Y.; Chen, R.; Zhang, D.; Qi, S.; Liu, Y. Metabolite interactions between host and microbiota during health and disease: Which feeds the other? Biomed. Pharmacother. 2023, 160, 114295. [Google Scholar] [CrossRef]
- Tulkens, J.; De Wever, O.; Hendrix, A.; Dhondt, B.; Pinheiro, C.; Geeurickx, E.; Vergauwen, G.; Van Der Pol, E.; Nieuwland, R.; Decock, A.; et al. Analyzing bacterial extracellular vesicles in human body fluids by orthogonal biophysical separation and biochemical characterization. Nat. Protoc. 2020, 15, 40–67. [Google Scholar] [CrossRef] [PubMed]
- Bryant, W.A.; Stentz, R.; Le Gall, G.; Sternberg, M.J.E.; Carding, S.R.; Wilhelm, T. In silico analysis of the small molecule content of outer membrane vesicles produced by Bacteroides thetaiotaomicron indicates an extensive metabolic link between microbe and host. Front. Microbiol. 2017, 8, 2440. [Google Scholar] [CrossRef] [PubMed]
- Olsen, I.; Amano, A. Outer membrane vesicles - offensive weapons or good Samaritans? J. Oral Microbiol. 2015, 7, 27468. [Google Scholar] [CrossRef]
- McMillan, H.M.; Kuehn, M.J.; Zebell, S.G.; Ristaino, J.B.; Dong, X.; Rogers, N.; Wadle, A.; Wiesner, M.R.; Hendren, C.O.; Hsu-Kim, H. The extracellular vesicle generation paradox: a bacterial point of view. EMBO J. 2021, 40, e108174. [Google Scholar] [CrossRef]
- Juodeikis, R.; Carding, S.R. Outer membrane vesicles: biogenesis, functions, and issues. Microbiol. Mol. Biol. Rev. 2022, 86, e0003222. [Google Scholar] [CrossRef]
- Liang, X.; Dai, N.; Sheng, K.; Lu, H.; Wang, J.; Chen, L.; Zhang, Y.H; Zhao, Q.L; Li, F.S; Wu, Z.Y; et al. Gut bacterial extracellular vesicles: important players in regulating intestinal microenvironment. Gut Microbes 2022, 14, 2134689. [Google Scholar] [CrossRef]
- Rakoff-Nahoum S., Coyne M.J., Comstock L.E. An ecological network of polysaccharide utilization among human intestinal symbionts. Curr. Biol. 2014, 24, 40–49. [CrossRef]
- Stentz, R.; Carvalho, A.L.; Jones, E.; Carding, S.R. Fantastic voyage: the journey of intestinal microbiota-derived microvesicles through the body. Biochem. Soc. Trans. 2018, 46, 1021–1027. [Google Scholar] [CrossRef]
- Durant, L.; Stentz, R.; Noble, A.; Brooks, J.; Gicheva, N.; Reddi, D.; O'Connor, M. J.; Hoyles, L.; McCartney, A. L.; Man, R.; et al. Bacteroides thetaiotaomicron-derived outer membrane vesicles promote regulatory dendritic cell responses in health but not in inflammatory bowel disease. Microbiome, 2020, 8, 88. [Google Scholar] [CrossRef]
- Elhenawy, W.; Debelyy, M.O.; Feldman, M.F. Preferential packing of acidic glycosidases and proteases into Bacteroides outer membrane vesicles. mBio 2014, 5, e00909-14. [Google Scholar] [CrossRef]
- Stentz, R.; Jones, E.; Juodeikis, R.; Wegmann, U.; Guirro, M.; Goldson, A.; Brion, A.; Booth, C.; Sudhakar, P.; Brown, I.R.; et al. The proteome of extracellular vesicles produced by the human gut bacteria Bacteroides thetaiotaomicron in vivo is influenced by environmental and host-derived factors. Appl. Environ. Microbiol. 2022, 88, e0053322. [Google Scholar] [CrossRef] [PubMed]
- van Niel, G.; Raposo, G.; Candalh, C.; Boussac, M.; Hershberg, R.; Cerf-Bensussan, N.; Heyman, M.; Thery, C.; Chamaillard, M.; Savina, A.; et al. Intestinal epithelial cells secrete exosome-like vesicles. Gastroenterology 2001, 121, 337–349. [Google Scholar] [CrossRef] [PubMed]
- Mignini, I.; Piccirilli, G.; Termite, F.; Paratore, M.; Esposto, G.; Laterza, L.; Petito, V.; Lopetuso, L.R.; Schiavoni, E.; Scaldaferri, F.; et al. Extracellular vesicles: novel potential therapeutic agents in inflammatory bowel diseases. Cells 2023, 13, 90. [Google Scholar] [CrossRef]
- Park, E.J.; Shimaoka, M.; Kiyono, H. Functional flexibility of exosomes and microRNAs of intestinal epithelial cells in affecting inflammation. Front. Mol. Biosci. 2022, 9, 854487. [Google Scholar] [CrossRef]
- Zhang, X.; Deeke, S.A.; Ning, Z.; Starr, A.E.; Butcher, J.; Li, J.; Mayne, J.; Cheng, K.; Liao, B.; Li, L.; et al. Metaproteomics reveals associations between microbiome and intestinal extracellular vesicle proteins in pediatric inflammatory bowel disease. Nat. Commun. 2018, 9, 2873. [Google Scholar] [CrossRef]
- Chan, E.D.; King, P.T.; Bai, X.; Schoffstall, A.M.; Sandhaus, R.A.; Buckle, A.M. The inhibition of serine proteases by serpins is augmented by negatively charged heparin: A concise review of some clinically relevant interactions. Int. J. Mol. Sci. 2024, 25, 1804. [Google Scholar] [CrossRef]
- Sanchez-Navarro, A.; Gonzalez-Soria, I.; Caldino-Bohn, R.; Bobadilla, N.A. An integrative view of serpins in health and disease: the contribution of SerpinA3. Am. J. Physiol. Cell Physiol. 2021, 320, C106–C118. [Google Scholar] [CrossRef]
- Zhang, D.; Zhang, J.W.; Xu, H.; Chen, X.; Gao, Y.; Jiang, H.G.; Wang, Y.; Wu, H.; Yang, L.; Wang, W.B.; et al. Therapy-induced senescent tumor cell-derived extracellular vesicles promote colorectal cancer progression through SERPINE1-mediated NF-κB p65 nuclear translocation. Mol. Cancer 2024, 23, 70. [Google Scholar] [CrossRef]
- Terrapon, N.; Lombard, V.; Drula, É.; Lapébie, P.; Al-Masaudi, S.; Gilbert, H.J.; Henrissat, B.; Raghavan, V.; Hess, M.; Pereira, G.; et al. PULDB: the expanded database of Polysaccharide Utilization Loci. Nucleic Acids Res. 2018, 46, D677–D683. [Google Scholar] [CrossRef]
- Stentz, R.; Cheema, J.; Philo, M.; Carding, S.R. A Possible Aquatic Origin of the Thiaminase TenA of the Human Gut Symbiont Bacteroides thetaiotaomicron. J. Mol. Evol. 2023, 91, 482–491. [Google Scholar] [CrossRef]
- Jenkins, A.H.; Schyns, G.; Potot, S.; Sun, G.; Begley, T.P. A new thiamin salvage pathway. Nat. Chem. Biol. 2007, 3, 492–497. [Google Scholar] [CrossRef] [PubMed]
- Olivares, M.; Schüppel, V.; Hassan, A.M.; Beaumont, M.; Neyrinck, A.M.; Bindels, L.B.; Benítez-Páez, A.; Sanz, Y.; Haller, D.; Holzer, P.; et al. The potential role of the dipeptidyl peptidase-4-like activity from the gut microbiota on the host health. Front. Microbiol. 2018, 9, 1900. [Google Scholar] [CrossRef]
- Keller, L.J.; Nguyen, T.H.; Liu, L.J.; Hurysz, B.M.; Lakemeyer, M.; Guerra, M.; Gelsinger, D.J.; Chanin, R.; Ngo, N.; Lum, K.M.; et al. Chemoproteomic identification of a DPP4 homolog in Bacteroides thetaiotaomicron. Nat. Chem. Biol. 2023, 19, 1469–1479. [Google Scholar] [CrossRef] [PubMed]
- Malloy, C.; Ahern, M.; Lin, L.; Hoffman, D.A. Neuronal roles of the multifunctional protein dipeptidyl peptidase-like 6 (DPP6). Int. J. Mol. Sci. 2022, 23, 9184. [Google Scholar] [CrossRef]
- Xu, Q.; Abdubek, P.; Astakhova, T.; Axelrod, H.L.; Bakolitsa, C.; Cai, X.; Carlton, D.; Chen, C.; Chiu, H.J.; Chiu, M.; et al. Structure of the γ-D-glutamyl-L-diamino acid endopeptidase YkfC from Bacillus cereus in complex with L-Ala-γ-D-Glu: insights into substrate recognition by NlpC/P60 cysteine peptidases. Acta Crystallogr. Sect. F Struct. Biol. Cryst. Commun. 2010, 66, 1354–1364. [Google Scholar] [CrossRef]
- Paysan-Lafosse, T.; Blum, M.; Chuguransky, S.; Grego, T.; Pinto, B.L.; Salazar, G.A.; Bileschi, M.L.; Bork, P.; Bridge, A.; Colwell, L.; et al. InterPro in 2022. Nucleic Acids Res. 2022, 51, D418–D427. [Google Scholar] [CrossRef]
- Dalmasso, G.; Nguyen, H.T.; Charrier-Hisamuddin, L.; Yan, Y.; Laroui, H.; Demoulin, B.; Sitaraman, S.V.; Merlin, D. PepT1 mediates transport of the proinflammatory bacterial tripeptide L-Ala-γ-D-Glu-meso-DAP in intestinal epithelial cells. Am. J. Physiol. Gastrointest. Liver Physiol. 2009, 299, G687–G696. [Google Scholar] [CrossRef]
- Wang, K.; Zhang, Z.; Hang, J.; Liu, J.; Guo, F.; Ding, Y.; Li, M.; Nie, Q.; Wu, H.; Ding, Q.; et al. Microbial-host-isozyme analyses reveal microbial DPP4 as a potential antidiabetic target. Science 2023, 381, eadd5787. [Google Scholar] [CrossRef]
- Karagiannides, I.; Torres, D.; Tseng, Y.H.; Bowe, C.; Carvalho, E.; Espinoza, D.O.; Luan, Q.; Bronson, R.; Smith, S.R.; Kokkotou, E.G. Substance P as a novel anti-obesity target. Gastroenterology 2008, 134, 747–755. [Google Scholar] [CrossRef]
- Chitti, S.V.; Gummadi, S.; Kang, T.; Shahi, S.; Marzan, A.L.; Nedeva, C.; Sanwlani, R.; Mathivanan, S.; Kalra, H.; Gupta, V.; et al. Vesiclepedia 2024: an extracellular vesicles and extracellular particles repository. Nucleic Acids Res. 2024, 52, D1694–D1698. [Google Scholar] [CrossRef]
- Raposo, G.; Stoorvogel, W. Extracellular vesicles: exosomes, microvesicles, and friends. J. Cell Biol. 2013, 200, 373–383. [Google Scholar] [CrossRef] [PubMed]
- Hessvik, N.P.; Llorente, A. Current knowledge on exosome biogenesis and release. Cell. Mol. Life Sci. 2018, 75, 193–208. [Google Scholar] [CrossRef] [PubMed]
- Jeppesen, D.K.; Fenix, A.M.; Franklin, J.L.; Higginbotham, J.N.; Zhang, Q.; Zimmerman, L.J.; Liebler, D.C.; Ping, J.; Liu, Q.; Evans, R.; et al. Reassessment of Exosome Composition. Cell 2019, 177, 428–445.e18. [Google Scholar] [CrossRef] [PubMed]
- Bouton, M.C.; Geiger, M.; Sheffield, W.P.; Irving, J.A.; Lomas, D.A.; Song, S.; Gettins, P.G.W.; Rau, J.C.; Olson, S.T.; Huntington, J.A.; et al. The under-appreciated world of the serpin family of serine proteinase inhibitors. EMBO Mol. Med. 2023, 15, e17144. [Google Scholar] [CrossRef]
- Nakamura, K.; Yokoi, Y.; Fukaya, R.; Ohira, S.; Shinozaki, R.; Nishida, T.; Takaki, M.; Sano, Y.; Shibata, S.; Higashiyama, S.; et al. Expression and localization of Paneth cells and their α-defensins in the small intestine of adult mouse. Front. Immunol. 2020, 11, 570296. [Google Scholar] [CrossRef]
- Marijanovic, E.M.; Fodor, J.; Riley, B.T.; Needham, E.J.; Cabrita, L.D.; Bottomley, S.P.; Buckle, A.M. Reactive centre loop dynamics and serpin specificity. Sci. Rep. 2019, 9, 3870. [Google Scholar] [CrossRef]
- Kohl, K.D.; Amaya, J.; Passement, C.A.; Dearing, M.D.; McCue, M.D. Unique and shared responses of the gut microbiota to prolonged fasting: A comparative study across five classes of vertebrate hosts. FEMS Microbiol. Ecol. 2014, 90, 883–894. [Google Scholar] [CrossRef]
- Cignarella, F.; Cantoni, C.; Ghezzi, L.; Salter, A.; Dorsett, Y.; Chen, L.; Phillips, D.; Weinstock, G.M.; Fontana, L.; Cross, A.H.; et al. Intermittent fasting confers protection in CNS-autoimmunity by altering the gut microbiota. Cell Metab. 2018, 27, 1222–1235.e6. [Google Scholar] [CrossRef]
- Macfarlane, G.T.; Gibson, G.R. Formation of glycoprotein degrading enzymes by Bacteroides fragilis. FEMS Microbiol. Lett. 1991, 61, 289–293. [Google Scholar] [CrossRef]
- Sonnenburg, J.L.; Xu, J.; Leip, D.D.; Chen, C.H.; Westover, B.P.; Weatherford, J.; Buhler, J.D.; Gordon, J.I. Glycan foraging in vivo by an intestine-adapted bacterial symbiont. Science 2005, 307, 1955–1959. [Google Scholar] [CrossRef]
- Martens, E.C.; Chiang, H.C.; Gordon, J.I. Mucosal glycan foraging enhances fitness and transmission of a saccharolytic human gut bacterial symbiont. Cell Host Microbe 2008, 4, 447–457. [Google Scholar] [CrossRef] [PubMed]
- Caminero, A.; Guzman, M.; Libertucci, J.; Lomax, A.E. The emerging roles of bacterial proteases in intestinal diseases. Gut Microbes 2023, 15, 2181922. [Google Scholar] [CrossRef] [PubMed]
- Galipeau, H.J.; Caminero, A.; Turpin, W.; Bermudez-Brito, M.; Santiago, A.; Libertucci, J.; Constante, M.; Raygoza Garay, J.A.; Rueda, G.; Armstrong, S.; et al. Novel fecal biomarkers that precede clinical diagnosis of ulcerative colitis. Gastroenterology 2021, 160, 1532–1545. [Google Scholar] [CrossRef] [PubMed]
- Galipeau, H.J.; Caminero, A.; Verdu, E.F. Increased bacterial proteolytic activity detected before diagnosis of ulcerative colitis. Inflamm. Bowel Dis. 2021, 27, e144. [Google Scholar] [CrossRef]
- Mills, R.H.; Dulai, P.S.; Vázquez-Baeza, Y.; Sauceda, C.; Daniel, N.; Gerner, R.R.; Batachari, L.E.; Malfavon, M.; Zhu, Q.; Weldon, K.; et al. Multi-omics analyses of the ulcerative colitis gut microbiome link Bacteroides vulgatus proteases with disease severity. Nature Microbiol. 2022, 7, 262–276. [Google Scholar] [CrossRef]
- Jones, E.J.; Booth, C.; Fonseca, S.; Parker, A.; Cross, K.; Miquel-Clopés, A.; Hautefort, I.; Mayer, U.; Wileman, T.; Stentz, R.; Carding, S.R. The Uptake, Trafficking, and Biodistribution of Bacteroides thetaiotaomicron Generated Outer Membrane Vesicles. Front. Microbiol. 2020, 11, 57. [Google Scholar] [CrossRef]
- Jones, E.; Stentz, R.; Telatin, A.; Savva, G.M.; Booth, C.; Baker, D.; Rudder, S.; Knight, S.C.; Noble, A.; Carding, S.R. The Origin of Plasma-Derived Bacterial Extracellular Vesicles in Healthy Individuals and Patients with Inflammatory Bowel Disease: A Pilot Study. Genes 2021, 12, 1636. [Google Scholar] [CrossRef]
- de Mezer, M.; Rogaliński, J.; Przewoźny, S.; Chojnicki, M.; Niepolski, L.; Sobieska, M.; Żaba, R.; Adamski, Z.; Bowszyc-Dmochowska, M.; Dańczak-Pazdrowska, A. SERPINA3: Stimulator or inhibitor of pathological changes. Biomedicines 2023, 11, 156. [Google Scholar] [CrossRef]
- Edogawa, S.; Edwinson, A.L.; Peters, S.A.; Chikkamenahalli, L.L.; Sundt, W.; Graves, S.; Gurunathan, S.V.; Breen-Lyles, M.; Johnson, S.; Dyer, R.; et al. Serine proteases as luminal mediators of intestinal barrier dysfunction and symptom severity in IBS. Gut 2019, 69, 62–73. [Google Scholar] [CrossRef]
- Patra, A.K.; Yu, Z. Genomic Insights into the Distribution of Peptidases and Proteolytic Capacity among Prevotella and Parabacteroides Species. Microbiol. Spectr. 2022, 10, e0218521. [Google Scholar] [CrossRef]
- Ambadapadi, S.; Munuswamy-Ramanujam, G.; Zheng, D.; Sullivan, C.; Dai, E.; Morshed, S.; McFadden, B.; Feldman, E.; Pinard, M.; McKenna, R.; et al. Reactive center loop (RCL) peptides derived from serpins display independent coagulation and immune modulating activities. J. Biol. Chem. 2016, 291, 2874–2887. [Google Scholar] [CrossRef] [PubMed]
- Bui, T.M.; Mascarenhas, L.A.; Sumagin, R. Extracellular vesicles regulate immune responses and cellular function in intestinal inflammation and repair. Tissue Barriers 2018, 6, e1431038. [Google Scholar] [CrossRef] [PubMed]
- Andersson, M. , Karlsson-Sjöberg, J. & Pütsep, KA. CRS-peptides: unique defense peptides of mouse Paneth cells. Mucosal Immunol 2012, 5, 367–376. [Google Scholar] [CrossRef] [PubMed]
- Mi, H.; Muruganujan, A.; Huang, X.; Ebert, D.; Mills, C.; Guo, X.; Thomas, P.D. Protocol Update for large-scale genome and gene function analysis with the PANTHER classification system (v.14.0). Nat. Protoc. 2019, 14, 703–721. [Google Scholar] [CrossRef]
- García-Bayona, L.; Comstock, L.E. Streamlined genetic manipulation of diverse Bacteroides and Parabacteroides isolates from the human gut microbiota. mBio 2019, 10, e01762–19. [Google Scholar] [CrossRef]
- Stentz, R.; Horn, N.; Cross, K.; Salt, L.; Brearley, C.; Livermore, D.M.; Carding, S.R. Cephalosporinases associated with outer membrane vesicles released by Bacteroides sp. protect gut pathogens and commensals against β-lactam antibiotics. J. Antimicrob. Chemother. 2015, 70, 701–709. [Google Scholar] [CrossRef]
- Yang, Z.; Zeng, X.; Zhao, Y.; Chen, R. AlphaFold2 and its applications in the fields of biology and medicine. Signal Transduct. Target. Ther. 2023, 8, 115. [Google Scholar] [CrossRef]
- Mirdita, M.; Schütze, K.; Moriwaki, Y.; Heo, L.; Ovchinnikov, S.; Steinegger, M. ColabFold: making protein folding accessible to all. Nat. Methods 2022, 19, 679–682. [Google Scholar] [CrossRef]
- Evans, R.; O'Neill, M.; Pritzel, A.; Antropova, N.; Senior, A.; Green, T.; Žídek, A.; Bates, R.; Blackwell, S.; Yim, J.; et al. Protein complex prediction with AlphaFold-Multimer. bioRxiv 2021. [Google Scholar] [CrossRef]
- Sehnal, D.; Bittrich, S.; Deshpande, M.; Svobodová, R.; Berka, K.; Bazgier, V.; Velankar, S.; Burley, S.K.; Koča, J.; Rose, A.S. Mol* Viewer: modern web app for 3D visualization and analysis of large biomolecular structures. Nucleic Acids Res. 2021, 49, W431–W437. [Google Scholar] [CrossRef]
Figure 1.
Structure, size, concentration, and protein content of BEVs produced in vivo (a) Nanoparticle tracking analysis of BEV suspensions. Points (black) represent the mean and the error bars (gray) represent the standard deviation (SD), n = 3. (b) TEM images of vesicles extracted from cecal contents of fed and fasted germ-free mice mono-conventionalised with Bt. Scale bar = 100 nm. NF: non-fasted; F: fasted. (c) Principal Component Analysis performed on normalized abundances of each protein under each condition. X and y axis show principal component 1 and principal component 2 explaining 68.6% and 14.5% of the total variance. Prediction ellipses are such that with probability 0.95, a new observation from the same group will fall inside the ellipse. NF: non-fasted; F: fasted. (d) Volcano plots displaying ratios of protein abundances in fasted versus fed conditions. The set thresholds were 0.05 for the p-value (n = 5) and 1.3 for the fold-change (FC). Features with > 50 % missing values were removed. Blue dots indicate protein that are significantly less abundant when obtained from fasted conditions and red dots indicate proteins that are significantly more abundant.
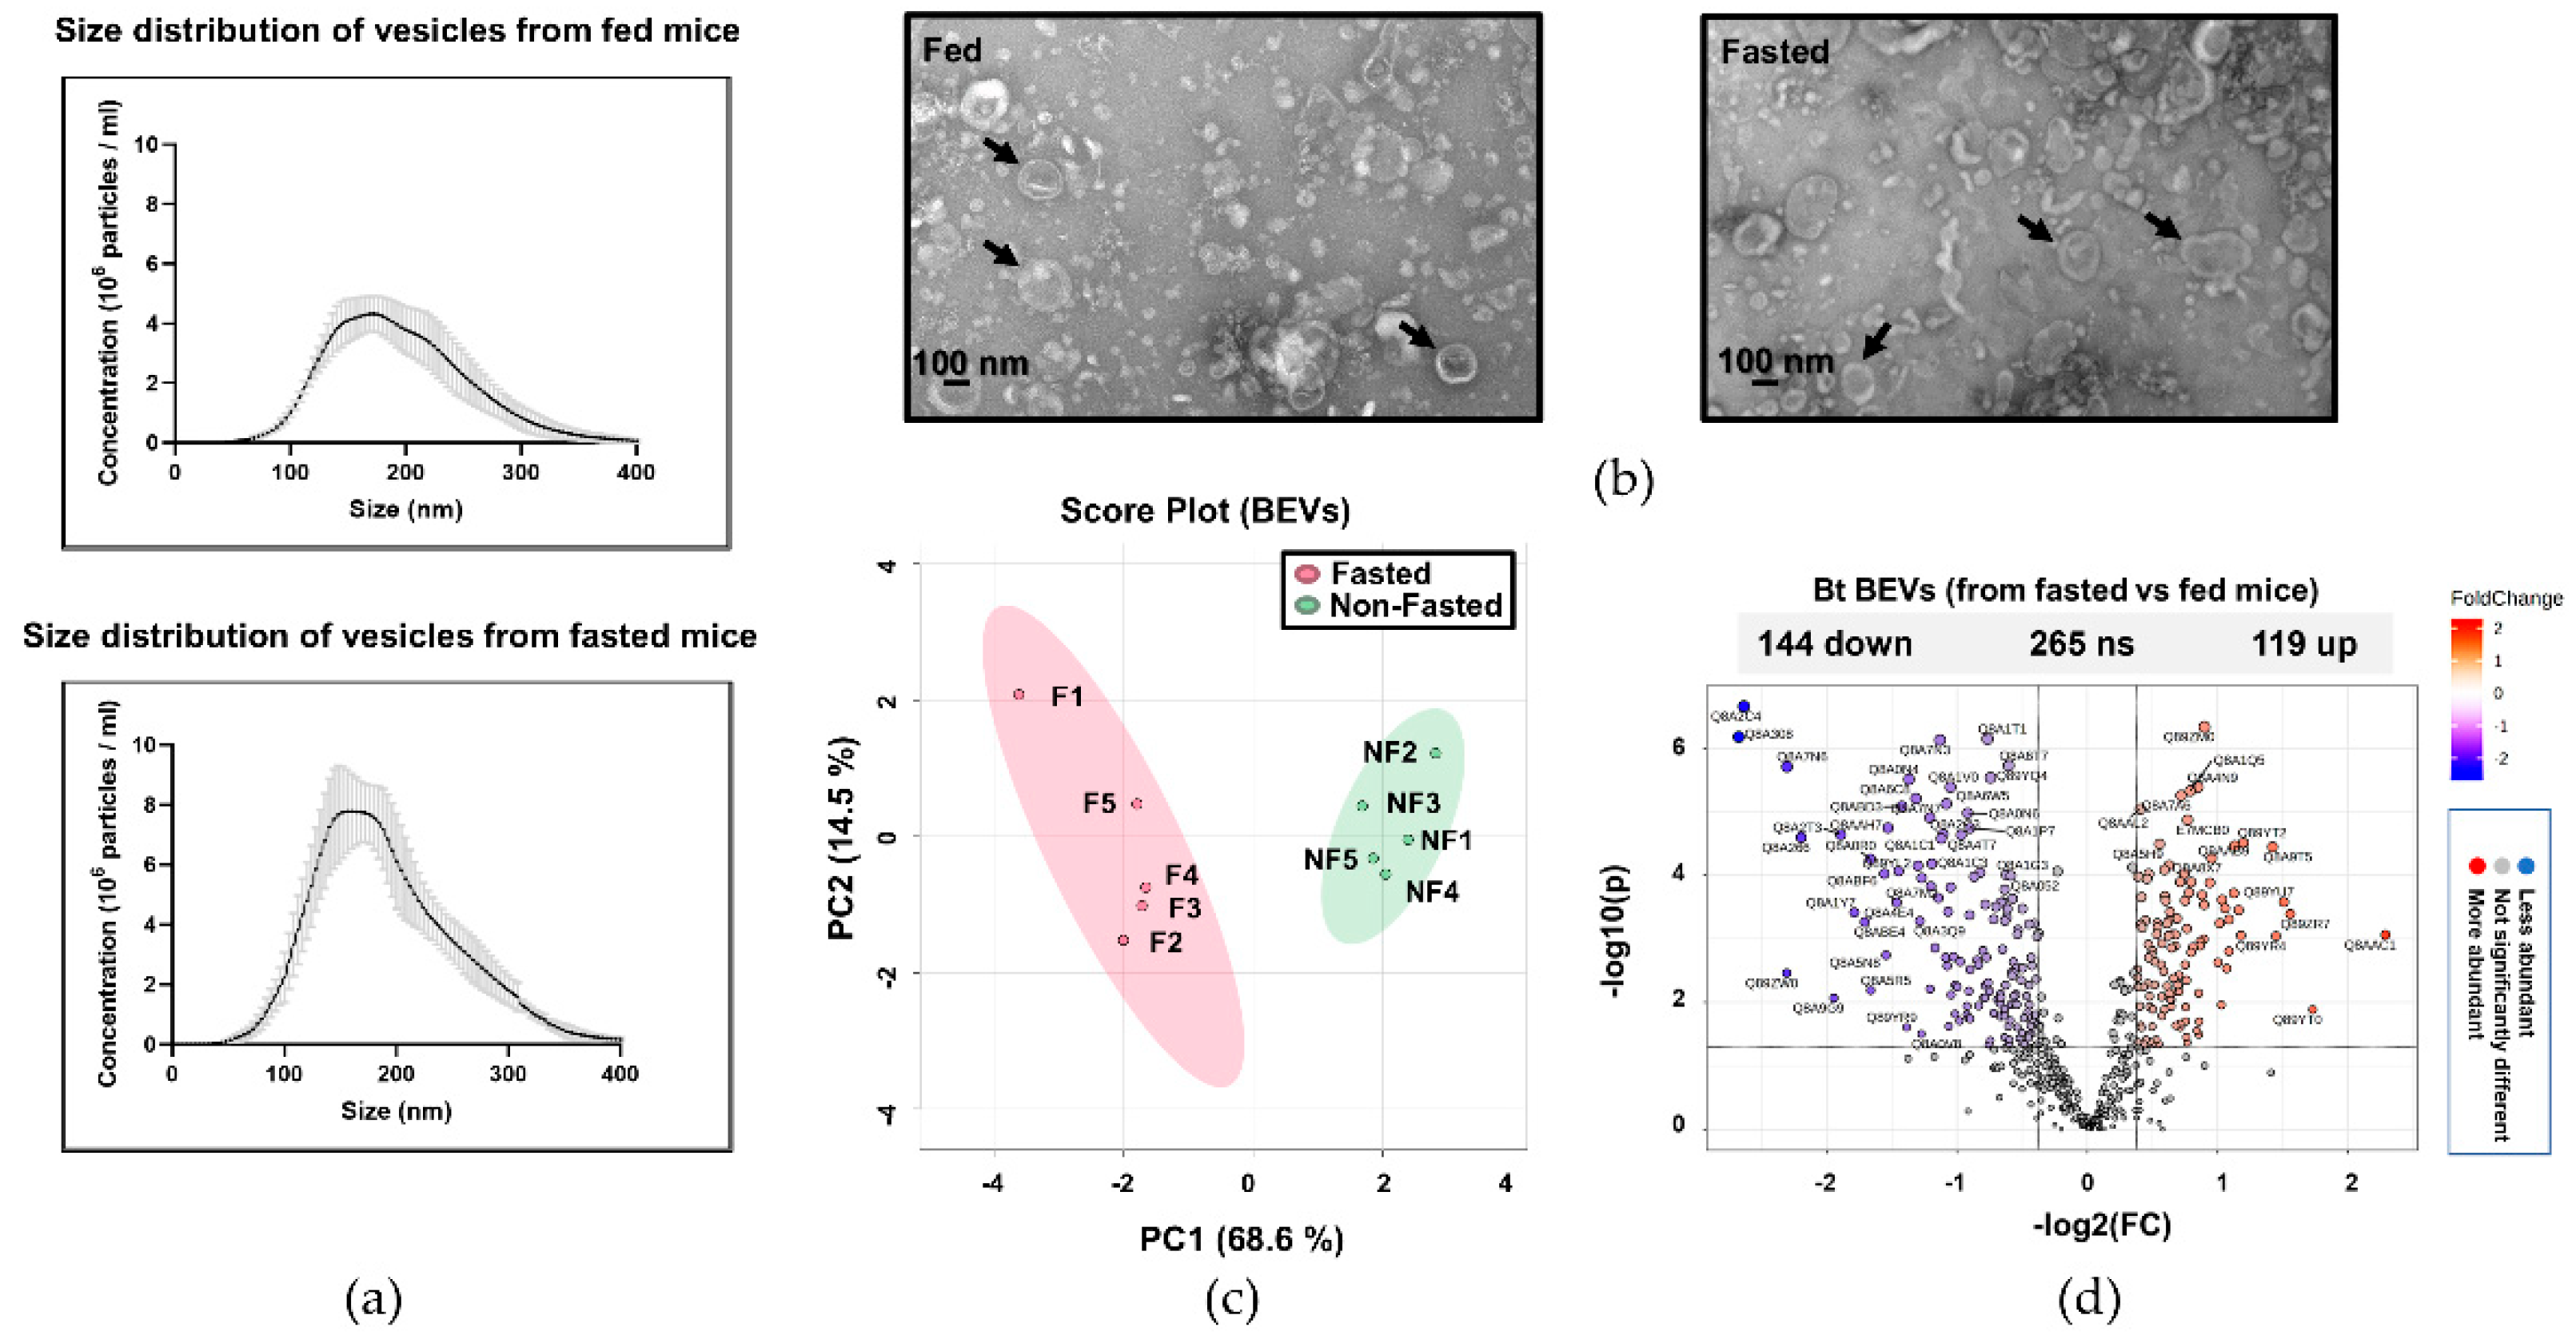
Figure 2.
BT_1314 is a murein tripeptide dipeptidase (a) Schematic alignment of BT_1314 and YkfC of B. subtilis including representative conserved domains (Pfam domains) (b) LC-MS chromatogram obtained after digestion of Tri-DAP by a recombinant BT_1314 enzyme. Upper panel: Tri-DAP control; Middle panel: DAP standard; Lower panel: reaction products obtained after incubation with BT_1314.
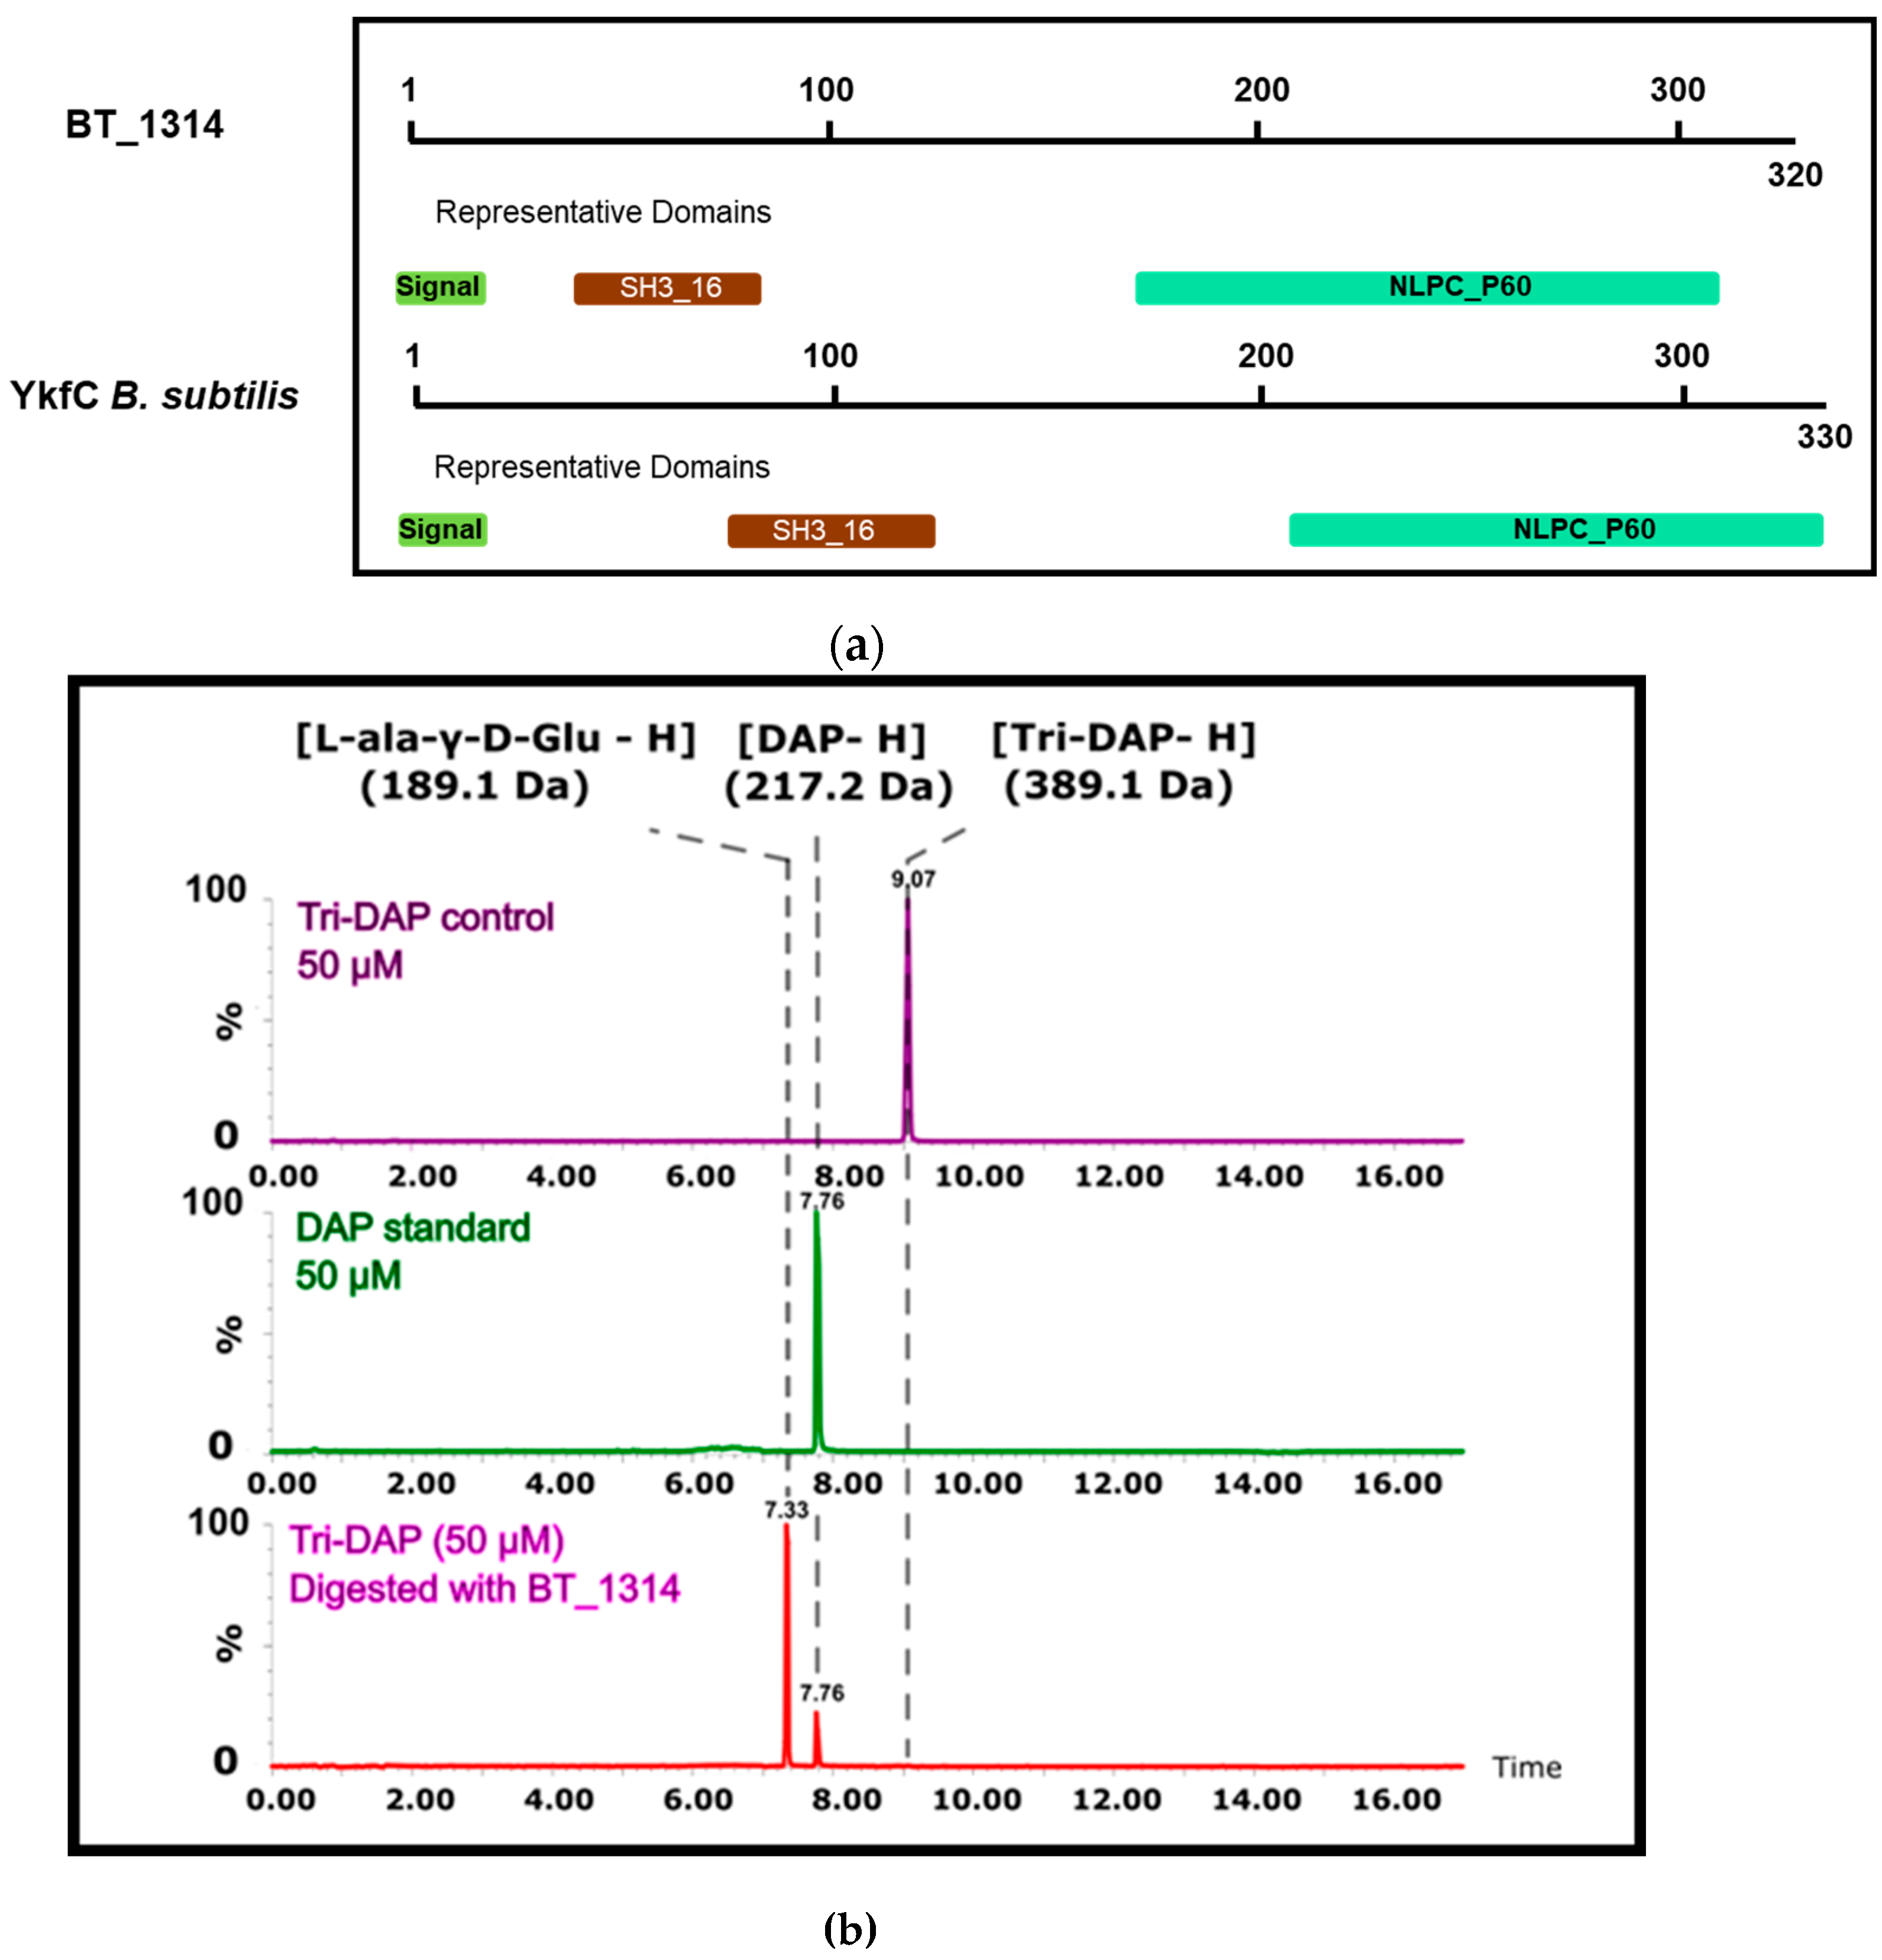
Figure 3.
DPP-4 and PTP activities measured on vesicles extracted from caecal contents of mice (a) DPP-4 activity of vesicles extracted from the caecum of germ-free mono-conventionalised mice with wild-type Bt (WT), Bt DPP-4 deletion mutant (ΔDPP-4) and Bt PTP deletion mutant (ΔPTP) (n = 5 each). (b) PTP activity of vesicles extracted from the caecum of germ-free mono-conventionalised mice with wild-type Bt (WT), Bt DPP-4 deletion mutant (ΔDPP-4) and Bt PTP deletion mutant (ΔPTP) (n = 5 each). GF = EVs from nonmanipulated germ-free mice. Statistical symbols refer to comparison of each group to the WT group. Ns = not significant, * = P ≤ 0.05; ** = P ≤ 0.01; *** = P ≤ 0.001. Sitagliptin.: particles for which 0.33 mM sitagliptin was added to the reaction mixture. Ala-Pro-pNA = DPP-4 chromogenic substrate; Ala-Phe-Pro-pNA = PTP chromogenic substrate.
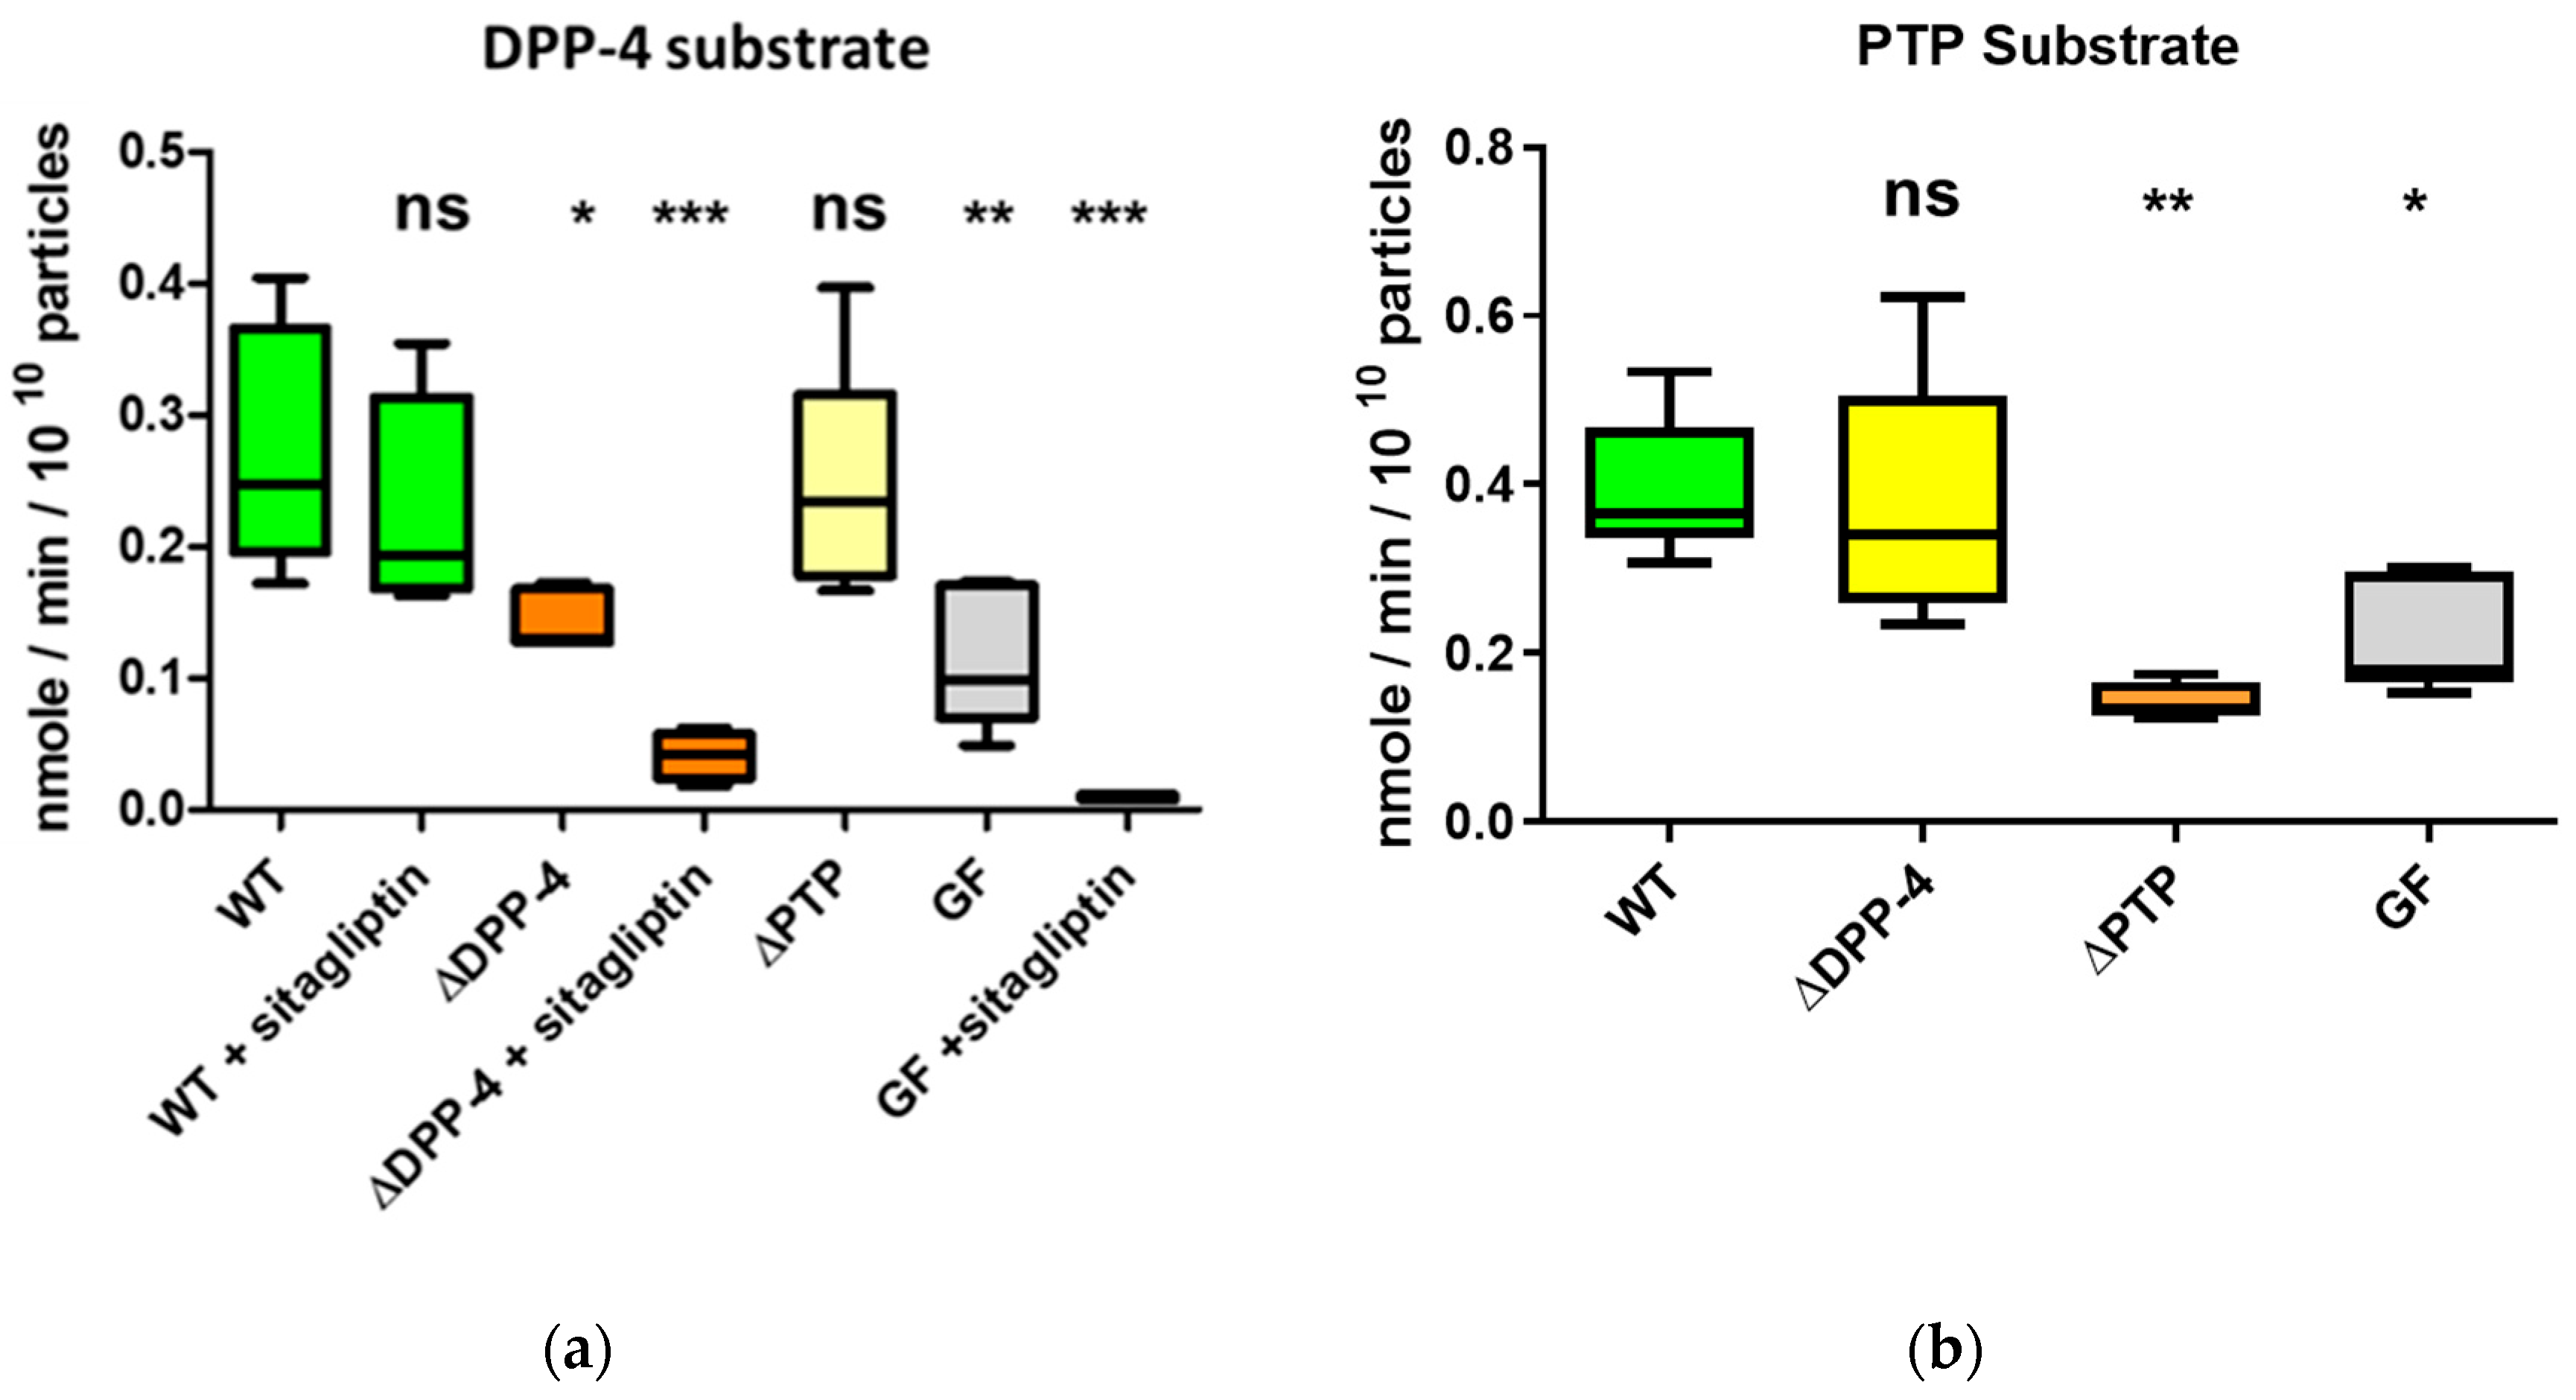
Figure 4.
DPP-4 activity is decreased in vesicles extracted from caecal contents of fasted mice mono-conventionalised with Bt WT (a) DPP-4 activity (n = 5) (b) ASNase activity (n = 5) GF = EVs from nonmanipulated germ-free mice. Statistical symbols refer to comparison of each group to the WT group.** = P ≤ 0.01; *** = P ≤ 0.001. The results in the 2 tables are derived from data presented in Table S1.
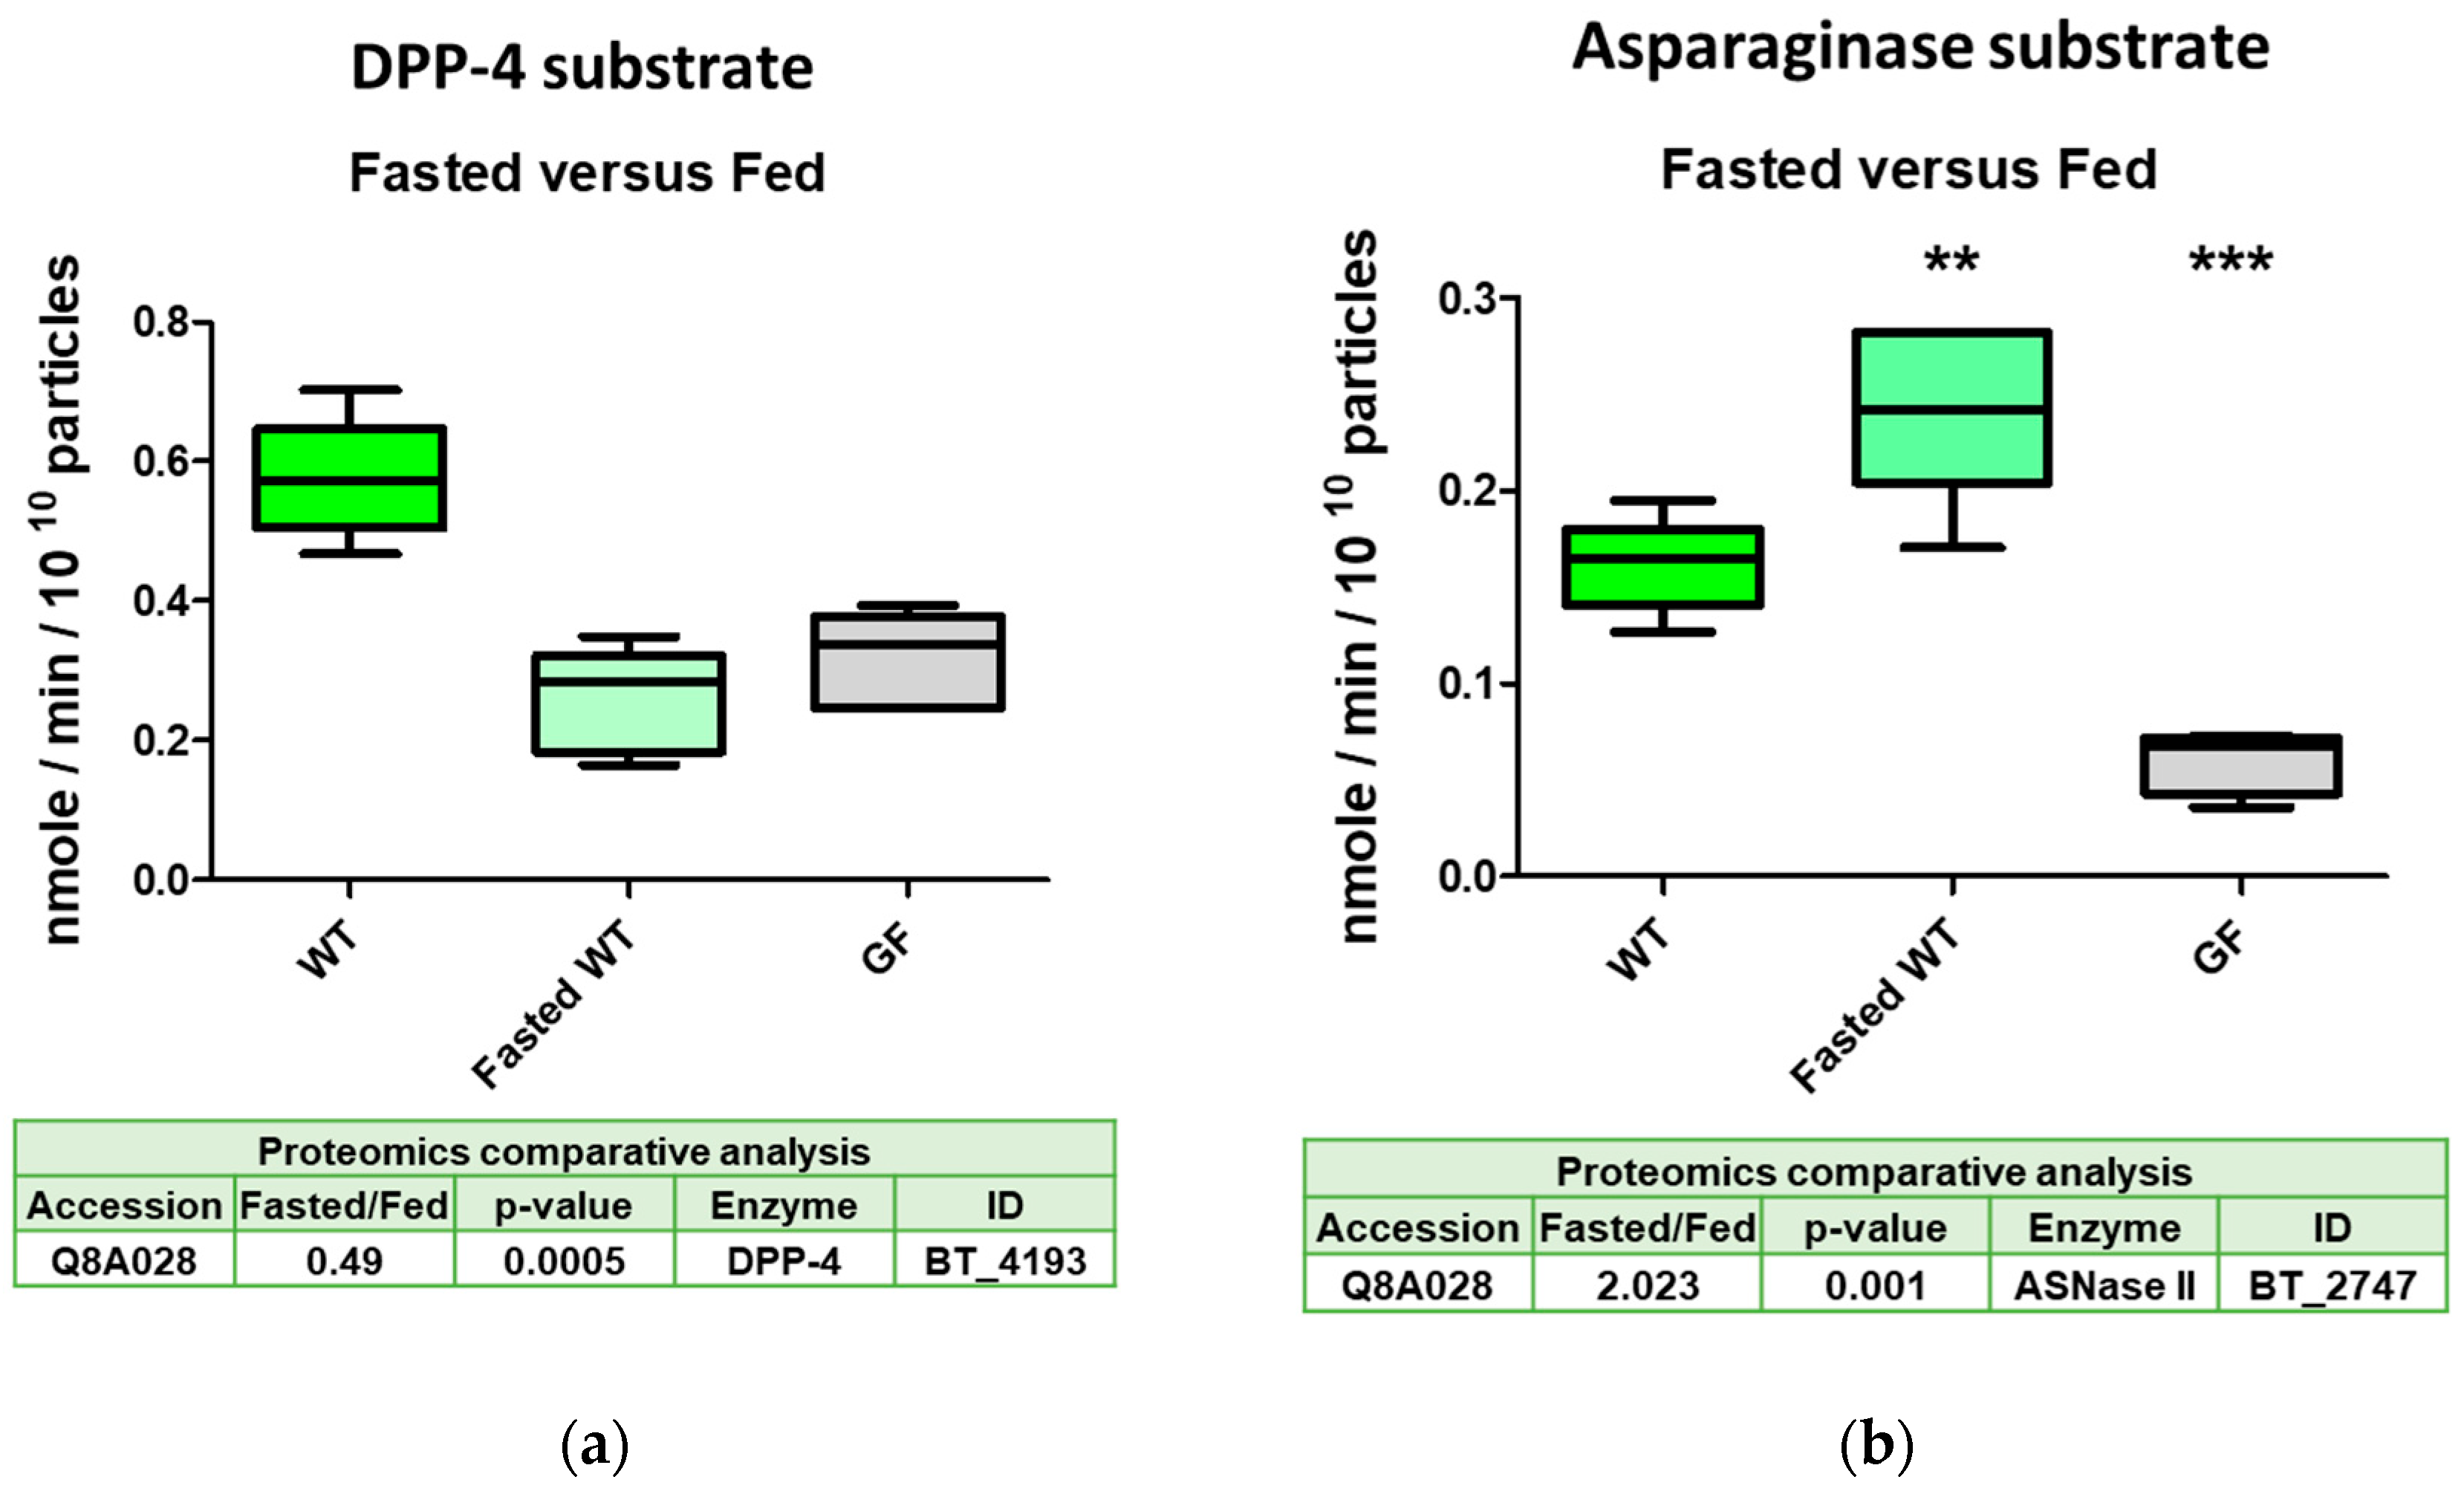
Figure 5.
Protein composition of intestinal EVs extracted and purified from the mouse caecum. (a) Principal Component Analysis performed on normalized abundances of each protein under each condition. X and y axis show principal component 1 and principal component 2 explaining 28.1% and 20.5% of the total variance. Prediction ellipses are such that with probability 0.95, a new observation from the same group will fall inside the ellipse. NF: non-fasted; F: fasted. (b) Volcano plots displaying ratios of protein abundances in vivo versus in vitro. The set thresholds were 0.05 for the P-value (n = 5) and 1.3 for the fold-change (FC). Features with > 50 % missing values were removed. Blue dots indicate protein that are significantly less abundant when obtained from in vivo conditions and red dots indicate proteins that are significantly more abundant.
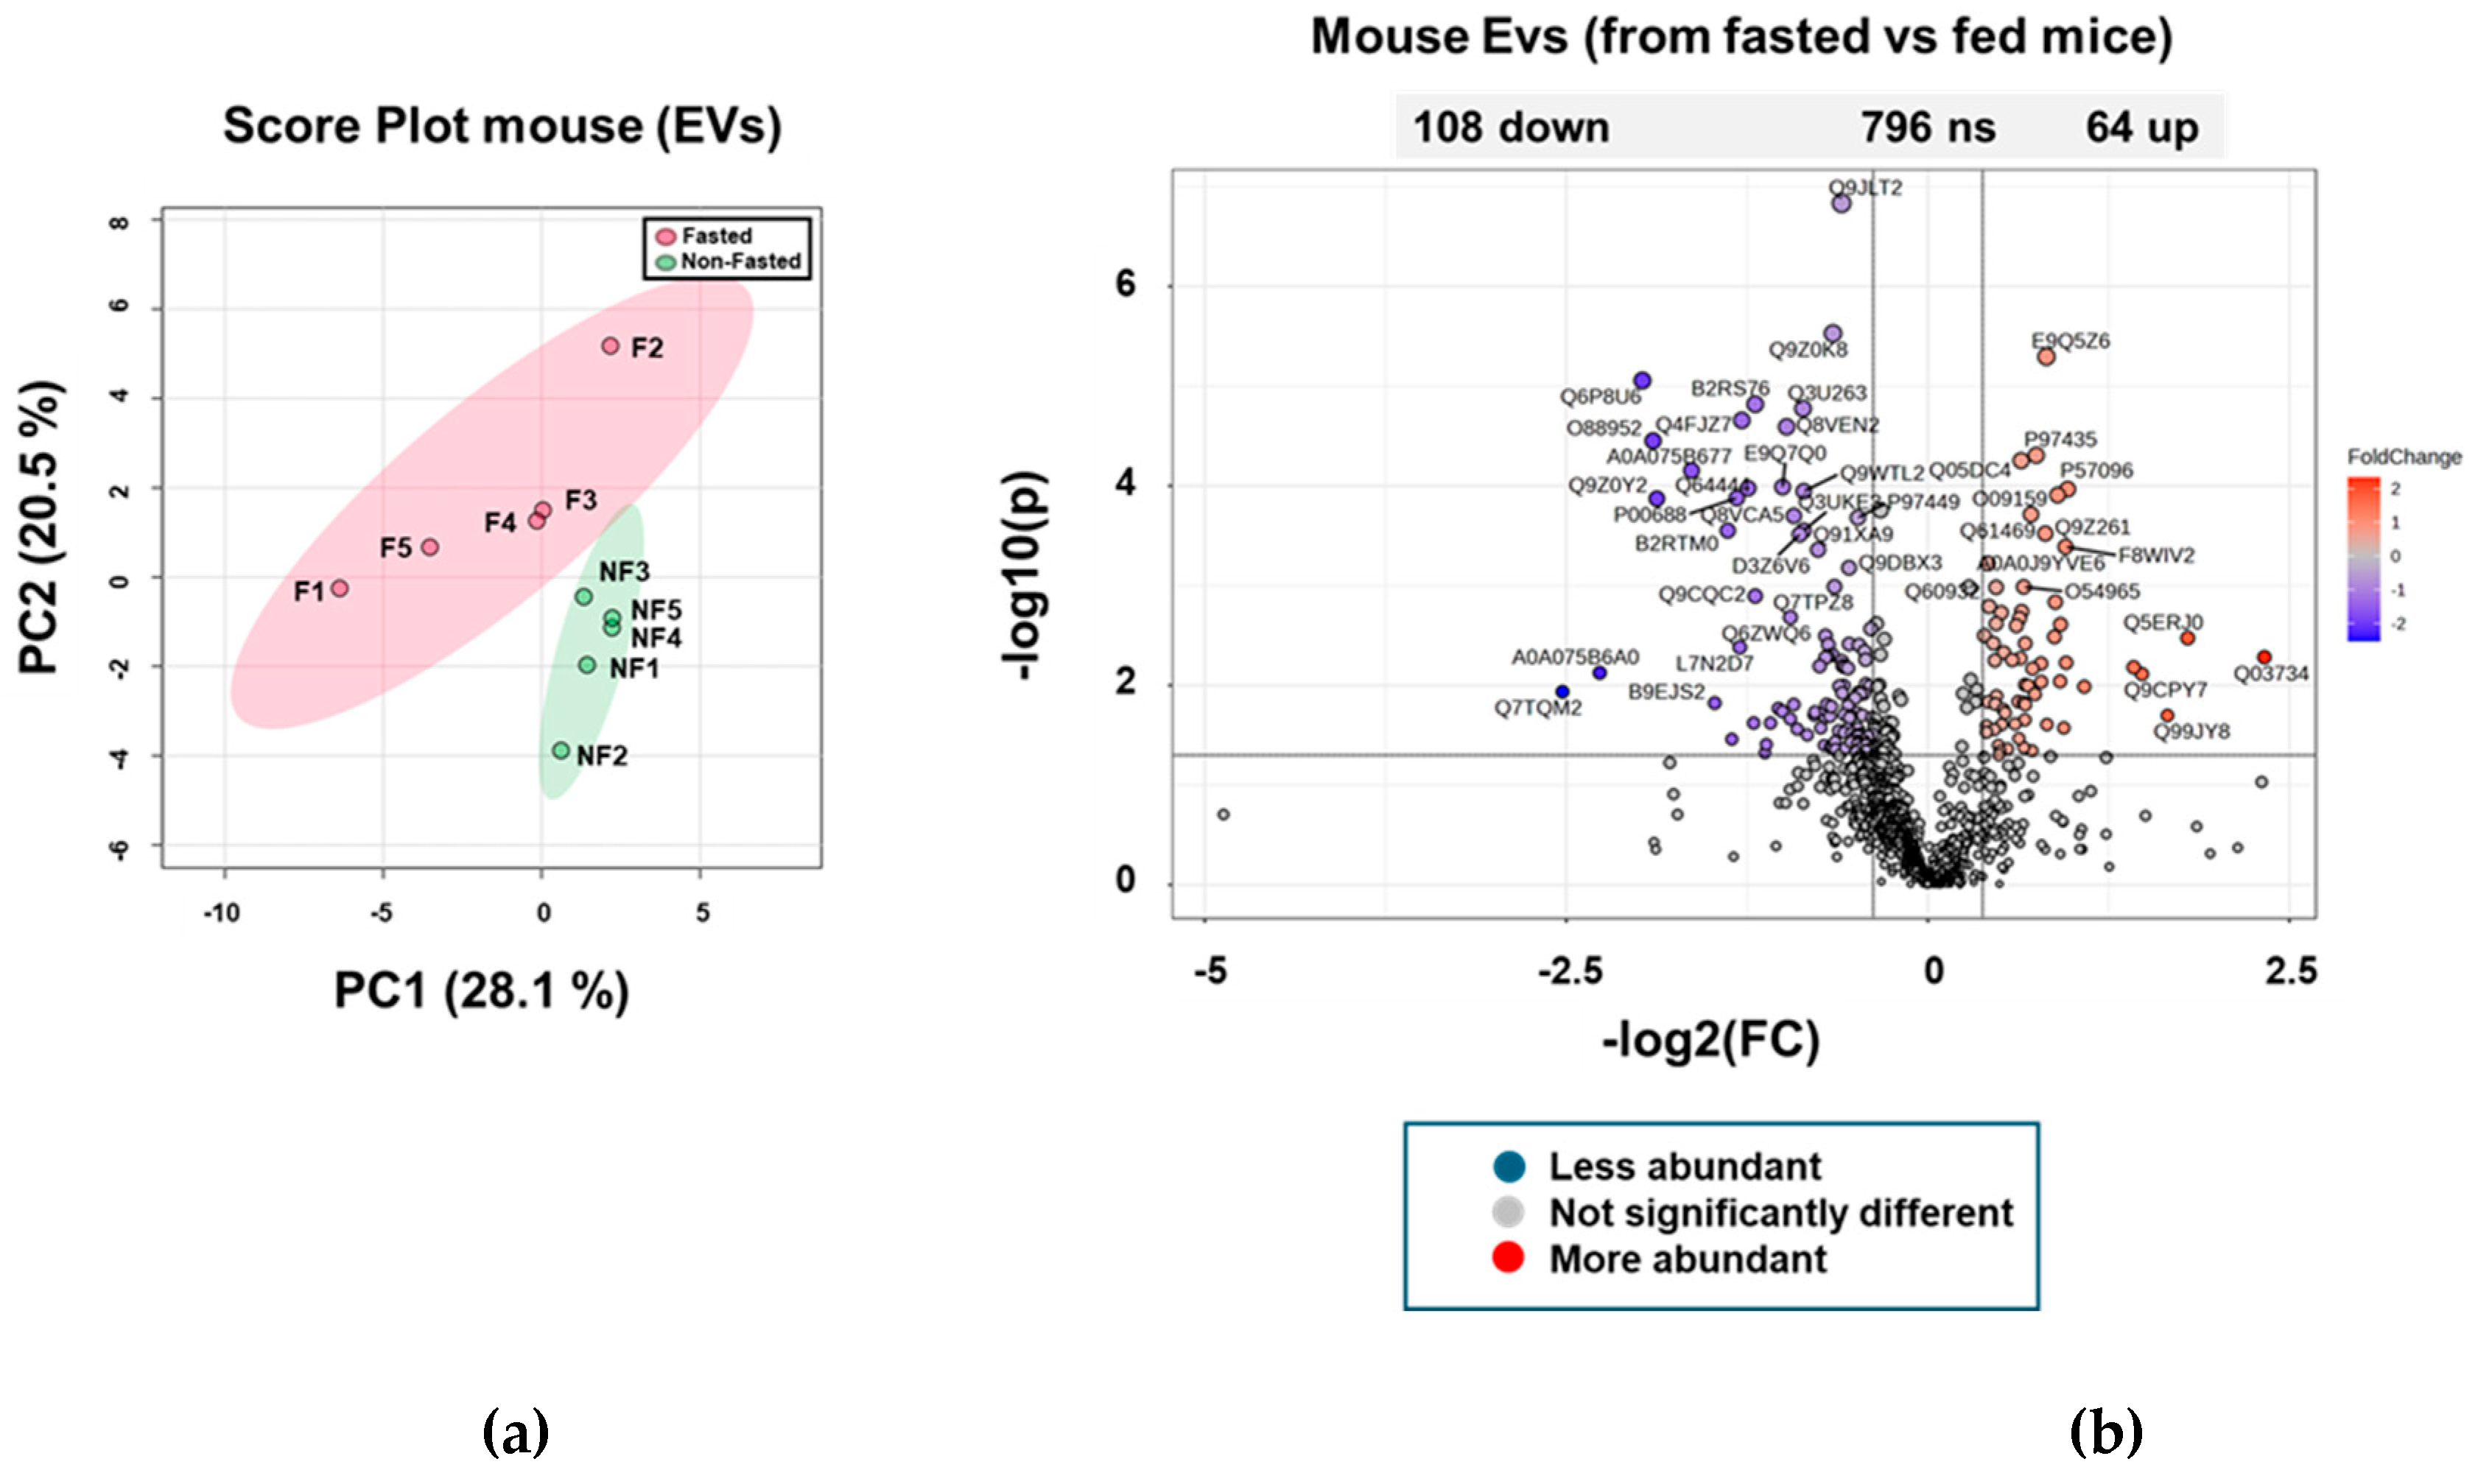
Figure 6.
Visualisation of predicted protease-serpin complexes: host-microbe protein complexes were visualized using the Mol* RCSB 3D Viewer to identify the bacterial S9 protease domain and the reactive loop and bond on the serpins. Serpins A3K and A1E are predicted to interact with high confidence (highlighted in green rectangles) with the serine proteases carrying the S9 protease domain (BT_4193, BT_3254, BT_0587, BT_1838), as their reactive sites are targeted by this domain.
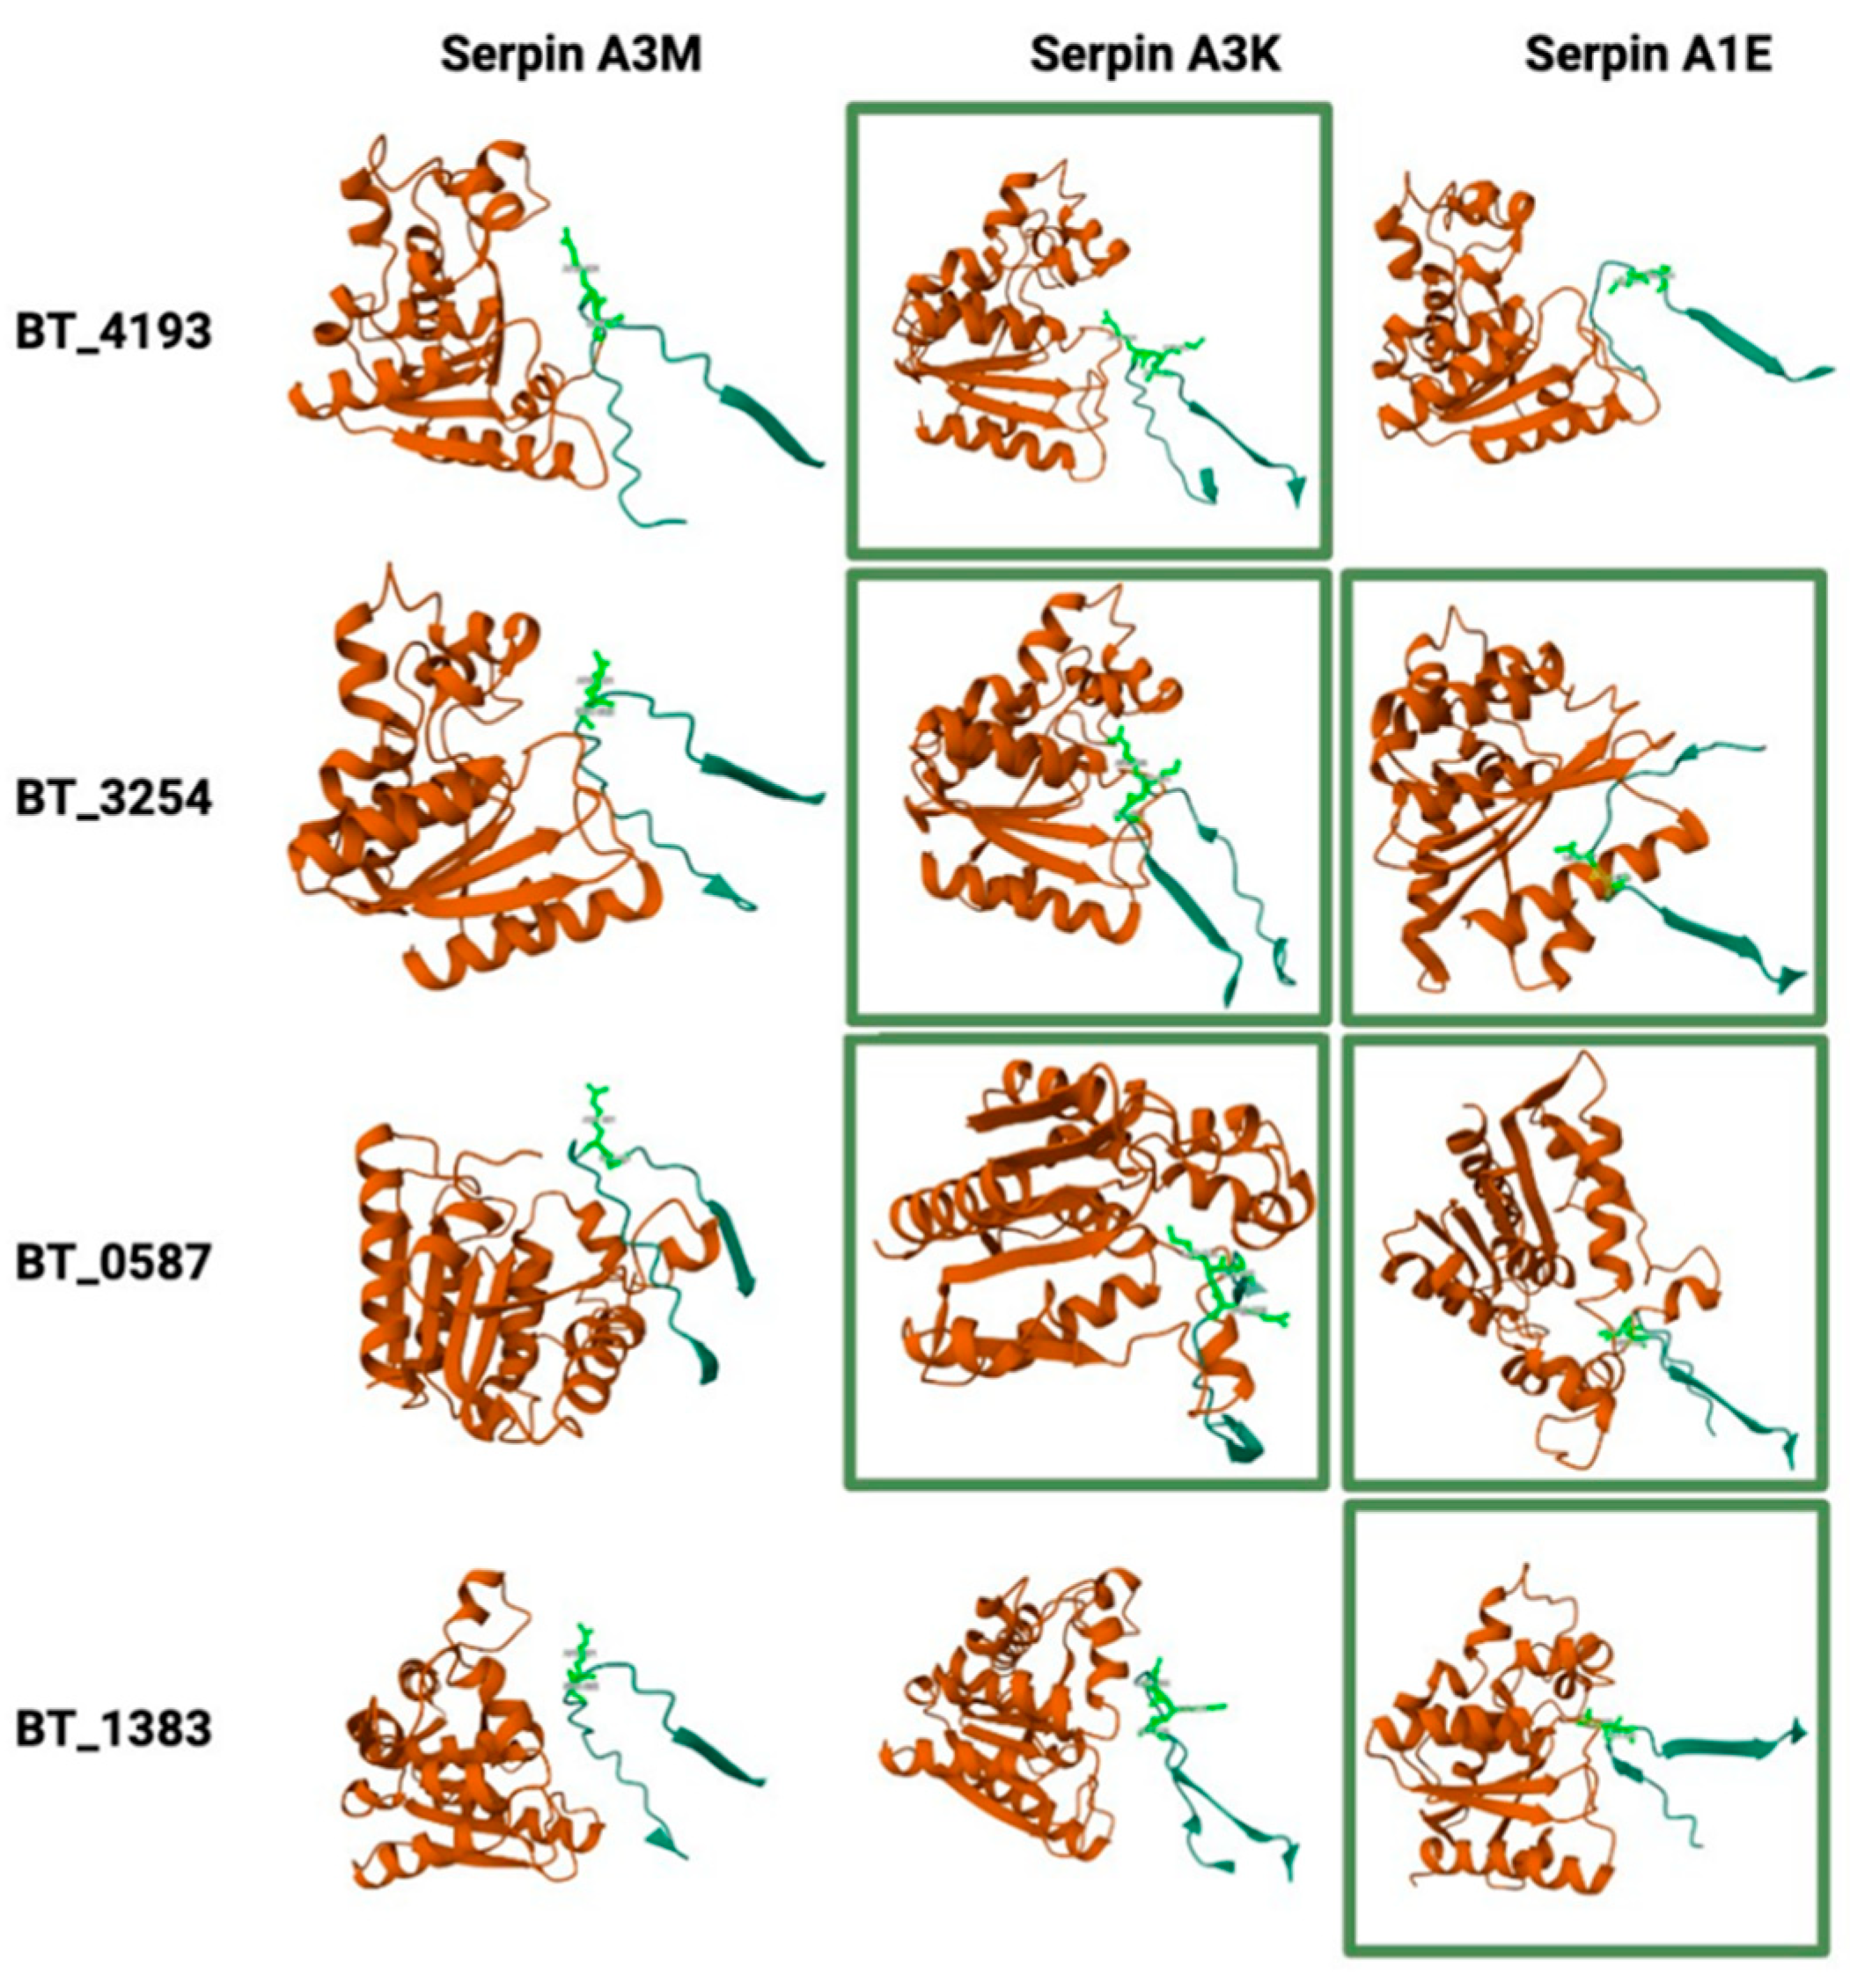

Table 1.
Class of proteins with decreased abundance in BEVs produced in fasted mice.
| Accession | Fasted/Feda | Protein classb | Accession | Fasted/Feda | Protein classb | |||
| Q8ABE4 | 0.306 | Oxidoreductase (PC00176) | Q8A739 | 0.645 | Ligase (PC00142) | |||
| Q8ABF6 | 0.34 | Serine protease (PC00203) BT_0154 | Q8A1G3 | 0.65 | Amylase (PC00048) | |||
| Q8AAH7 | 0.346 | Carbohydrate kinase (PC00065) | Q8A1H6 | 0.659 | Glycosidase (PC00110) | |||
| Q89YR9 | 0.382 | Lyase (PC00144) | Q8ABF8 | 0.664 | Esterase (PC00097) | |||
| Q8A3Q9 | 0.41 | Glycosidase (PC00110) | Q8A1Z2 | 0.671 | Glycosidase (PC00110) | |||
| Q8A2Q1 | 0.474 | Serine protease (PC00203) BT_3254 | Q8AA78 | 0.672 | Serine protease (PC00203) BT_0587 | |||
| Q8A3W3 | 0.478 | Kinase (PC00137) | Q8A9Q8 | 0.673 | Galactosidase (PC00104) | |||
| Q8AAV4 | 0.483 | Glycosidase (PC00110) | Q8A7W6 | 0.678 | Transporter (PC00258) | |||
| Q8A406 | 0.484 | Serine protease (PC00203) BT_2798 | Q8A1F8 | 0.689 | Phosphatase (PC00181) | |||
| Q8A028 | 0.49 | Serine protease (PC00203) BT_4193 | Q8A1K7 | 0.706 | Galactosidase (PC00104) | |||
| Q8A8R1 | 0.495 | Aldolase (PC00044) | Q89ZQ6 | 0.717 | Metalloprotease (PC00153) | |||
| Q8A7I6 | 0.495 | Hydrolase (PC00121) | Q8A862 | 0.728 | Serine protease (PC00203) BT_1312 | |||
| Q8A156 | 0.5 | Metalloprotease (PC00153) | Q8A4H0 | 0.739 | Hydrolase (PC00121) | |||
| Q8A7J8 | 0.507 | Isomerase (PC00135) | Q8A123 | 0.743 | Chaperone (PC00072) | |||
| Q8A4T7 | 0.511 | Dehydrogenase (PC00092) | Q8A4P9 | 0.756 | Transferase (PC00220) | |||
| Q8A1P7 | 0.536 | Chaperone (PC00072) | Q8A3A0 | 0.766 | Dehydrogenase (PC00092) | |||
| Q8A0A2 | 0.561 | Lyase (PC00144) | Q89ZX8 | 0.768 | Dehydrogenase (PC00092) | |||
| Q8A5T2 | 0.574 | Isomerase (PC00135) | P94598 | 0.771 | Dehydrogenase (PC00092) | |||
| Q8AAB5 | 0.58 | Phosphodiesterase (PC00185) | Q8A0Q9 | 0.772 | Hydrolase (PC00121) | |||
| Q8A326 | 0.581 | Structural protein (PC00211) | Q8A470 | 0.786 | DNA polymerase (PC00019) | |||
| Q8A414 | 0.584 | Kinase (PC00137) | Q8A8Z9 | 0.791 | Lyase (PC00144) | |||
| Q8A8K6 | 0.59 | Cysteine protease (PC00081) | Q8A1Y1 | 0.8 | Hydrolase (PC00121) | |||
| Q8A5K0 | 0.594 | Serine protease (PC00203) BT_2239 | Q8A0N1 | 0.801 | Hydrolase (PC00121) | |||
| Q8A1S8 | 0.61 | Dehydrogenase (PC00092) | Q8A6B2 | 0.825 | Dehydrogenase (PC00092) | |||
| Q8A1L2 | 0.632 | Protease (PC00190) | Q8A3H7 | 0.828 | Chaperone (PC00072) | |||
| Q8A3Q6 | 0.643 | Glycosidase (PC00110) | Q8A6N9 | 0.84 | Serine protease (PC00203) BT_1838 | |||
| Q89ZB2 | 0.643 | Voltage-gated ion channel (PC00241) | Q8A129 | 0.846 | Serine protease (PC00203) BT_3842 | |||
| Q8AAW1 | 0.644 | Isomerase (PC00135) | ||||||
| aProtein abundance fold-change in BEVs from fasted versus fed mice; bPanther classification (Panther Class ID) | ||||||||
Table 2.
Differently abundant proteins in EV preparations from the caecum of fasted versus fed mice.
Table 2.
Differently abundant proteins in EV preparations from the caecum of fasted versus fed mice.
| Accession | Description | (S) / (NS)a | T-test | Protein Class |
| Increased abundance in fasted mice | ||||
| Q03734 | Serine protease inhibitor A3M | 5.01 | 0.013575 | Protease inhibitor |
| Q5ERJ0 | CRS1C-2 alpha-defensin | 3.47 | 0.007428 | Defensin |
| Q9CPY7 | Cytosol aminopeptidase Lap3 | 2.79 | 0.047037 | Aminopeptidase |
| A0A0R4J0I1 | Serine protease inhibitor A3K | 2.682 | 0.03133 | Protease inhibitor |
| Q00898 | Alpha-1-antitrypsin 1-5 (Serpina1e) | 2.117 | 0.010164 | Protease inhibitor |
| Q9CYL5 | Golgi-associated plant pathogenesis-related protein 1 | 2.014 | 0.022046 | - |
| Q8R000 | Organic solute transporter subunit alpha | 2.01 | 0.017694 | Transport |
| Decreased abundance in fasted mice | ||||
| E9Q7Q0 | Mucin-4 | 0.499 | 0.001219 | Cell-matrix adhesion |
| I6L958 | Igk protein | 0.498 | 0.023509 | Immunoglobulin |
| P02816 | Prolactin-inducible protein homolog | 0.489 | 0.01436 | - |
| E9Q035 | Uncharacterized protein | 0.47 | 0.012476 | Transport/Carrier |
| B1AWC9 | Phosphodiesterase | 0.463 | 0.033889 | Phosphodiesterase |
| Q7TQD7 | Myo1b protein | 0.46 | 0.030377 | Actin-binding |
| B2RS76 | Carboxypeptidase B1 (Tissue) | 0.437 | 2.29E-05 | Peptidase |
| Q9CQC2 | Colipase | 0.437 | 0.001193 | Protein-binding activity modulator |
| Q9D2R0 | Acetoacetyl-CoA synthetase | 0.434 | 0.007679 | Ligase |
| Q64444 | Carbonic anhydrase 4 | 0.422 | 0.000349 | Lyase |
| Q4FJZ7 | Ada protein | 0.41 | 0.000154 | Deaminase |
| L7N2D7 | Uncharacterized protein | 0.408 | 0.020565 | - |
| P00688 | Pancreatic alpha-amylase | 0.4 | 0.000298 | Amylase |
| B2RTM0 | Histone H4 | 0.383 | 0.01015 | Metalloprotease |
| Q683Y7 | Immunoglobulin heavy chain variable region | 0.323 | 0.017091 | Immunoglobulin |
| A0A075B677 | Immunoglobulin kappa variable 4-53 | 0.322 | 2.75E-05 | Immunoglobulin |
| Q9Z0Y2 | Phospholipase A2 | 0.273 | 0.001599 | Phospholipase |
| O88952 | Protein lin-7 homolog C | 0.268 | 0.004373 | Cell junction |
| Q6P8U6 | Pancreatic triacylglycerol lipase | 0.255 | 0.000247 | Lipase |
| aRatios > 2 or < 0.5 | ||||
Disclaimer/Publisher’s Note: The statements, opinions and data contained in all publications are solely those of the individual author(s) and contributor(s) and not of MDPI and/or the editor(s). MDPI and/or the editor(s) disclaim responsibility for any injury to people or property resulting from any ideas, methods, instructions or products referred to in the content. |
© 2025 by the authors. Licensee MDPI, Basel, Switzerland. This article is an open access article distributed under the terms and conditions of the Creative Commons Attribution (CC BY) license (http://creativecommons.org/licenses/by/4.0/).
Copyright: This open access article is published under a Creative Commons CC BY 4.0 license, which permit the free download, distribution, and reuse, provided that the author and preprint are cited in any reuse.


