Submitted:
26 March 2025
Posted:
26 March 2025
You are already at the latest version
Abstract
Natural gas hydrates (shorted as hydrates) are expected to be a prospective alternative for traditional fossil energies in the future. The main strategy of exploring hydrates is achieved by dissociating solid hydrates into gas and water in situ with the depressurization method. Many studies have been conducted to understand the process of hydrate dissociation in porous media from perspectives of temperature, fluid flow, mechanical deformation and hydrate saturation. However, we have few deeper analyses on the evolutions of heat and energy, which are implicit essences compared with the explicit temperature. Thus this paper focuses the changes of heat and energy during depressurization-induced natural gas hydrate dissociation in porous media by fully coupled THMC modelling. Results show that the cumulative conduction heat tends to increase first and then decrease during the dissociation of hydrate, while the cumulative convection heat has the tendency of increasing monotonically in the whole process. Phase change, conduction heat, advection heat and external heat play different roles in the change of energy in the hydrate-bearing porous media. External heat source increases the energy, while phase change has a negative effect on the change of energy. The role of conduction heat is minor, but the contribution of advection heat is considerable for the change of energy. Additionally, a comprehensive analysis of changes of heat and energy is suggested to carry out more observation after hydrate dissociation due to the unceasing advection heat and external heat supply. New findings provides new insights into the mechanism of hydrate dissociation and has implications to the real-world project of hydrate exploration in terms of energy evaluation.
Keywords:
natural gas hydrates
; dissociation mechanism
; heat transfer
; change of energy
; coupled process
1. Introduction
Natural gas hydrates (shorted as hydrates) are formed by the chemical reaction between natural gas (mainly methane) and water under low temperature and high pressure [1,2,3]. They are well recognized as a promising future energy to mitigate the crisis of conventional fossil ones, because hydrates globally exist in ocean sediments and permafrost regions where the conditions for hydrate formation are easily satisfied. Currently, hydrate exploitation methods include the depressurization, thermal stimulation, chemical inhibitor injection, CO2 replacement and joint method (such as joint use of thermal stimulation and depressurization) [4], as shown in Figure 1. Depressurization is the main method at present, which reduces the pressure to promote the dissociation reaction of hydrates, and is considered to be the simplest and most economical method. Thermal stimulation method is to increase the temperature of hydrates by heating, and when the temperature is greater than the phase equilibrium temperature of hydrates, the dissociation reaction occurs. The CO2 replacement method is to replace the methane in the hydrates by injecting CO2, which is based on the principle that CO2 is more likely to generate hydrates than CH4. The chemical inhibitor injection method is to change the phase equilibrium curve of hydrates by injecting inhibitors (e.g., methanol, brine, and ethanol), which is inefficient, costly and environmentally unfriendly. At present, the joint use of two or more methods is believed to be an efficient way to recover gas from hydrates.
To date, the commercial exploitation is still not achieved, because hydrate dissociation is a complex thermal-hydraulic-mechanical-chemical (THMC) process, though researchers and engineers put numerous efforts on the properties of hydrates [5,6,7,8,9], geotechnical issues [10,11,12], environmental risks [13], and pipeline blockage [14].
As for mechanism of hydrate dissociation in porous media, present laboratory experiments, theoretical analyses and THMC numerical simulations [15,16,17,18]. Yousif et al. (1991) [19] investigated the slow dissociation behavior of hydrates in Berea sandstone through both experimental and numerical approaches, revealing that the dissociation process produced significant amounts of water in addition to gas. Masuda et al. (1999) [20] obtained the the gas production, pressure evolution and temperature change during hydrate dissociation in lab-scale Berea sandstone core. Goel et al. (2001) [21] carried out analytical investigation to predict the gas production and pressure evolution in the process of hydrate dissociation. Kwon et al. (2008) [22] analytically proposed a simple model to analyze the changes of pressure and temperature during hydrate dissociation in porous media. Sánchez et al. (2018) [23] considered the coupled thermal-hydraulic-mechanical relations to simulate the behavior of hydrate dissociation in porous media, and compared results with data of the experimental tests of the cores from one Indian Basin [24]. Song et al. (2021) [25] performed a comparative study on the dissociation of methane hydrate in core-scale sandy sediments by taking account of the mass and heat transfer, and found that The distribution of the synthetic hydrate within the core in the laboratory may not be uniform even when assuming the core is homogeneous. Li et al. (2023) [26] experimentally investigated the competitive coexistence growth of CO2 gas hydrates and ice below the quadruple point. By correlating the evolution of crystal frameworks with the thermodynamic characteristics of the process, the findings provide deeper and expanded insights into the competition between ice and hydrates. Wan et al. (2022) [27] proposed a THMC coupled model for hydrate dissociation, which consists of two subsystems: the fluid part involving non-isothermal two-phase flow with hydrate kinetics, and the solid part concerning geomechanical reponses. This model takes into account the bidirectional coupling effects between these two subsystems, namely the impact of pore pressure and hydrate dissociation on the mechanical behavior of the solid, as well as the influence of stress on the hydraulic behavior. Lin et al. (2022) [28] developed a coupled mathematical model for hydrate dissociation, with a focus on the impact of optimized depressurization strategies on enhancing gas production efficiency, as well as the influence of compaction effects on the decline of gas production rates. The results indicate that the pressure drop gradient and the duration of constant pressure are critical factors influencing stepwise depressurization. The low permeability of the hydrate-bearing layer inhibits the propagation of pressure drop and heat transfer within this sublayer, resulting in lower gas production in the later stages. Li et al. (2024) [29] presented a multi-physical coupled mathematical model to investigate wellbore stability in hydrate-bearing sediments. The results indicate that, under the same acceptable rate of wellbore enlargement, both the safe mud weight window and the temperature window expand with increasing mud salinity and hydrate saturation. Dong et al. (2023) [30] proposed a coupled thermal-water-mechanical model to characterize the geophysical field and wellbore failure. The model has advantages in characterizing the stress state and intrusion-induced deformation in the near-wellbore formation, and considers the influences of and drilling operations and the shape of borehole.
Therefore, previous investigations mainly focus on the evolutions of temperature, fluid flow, mechanical deformation and gas production. The changes of heat and energy attract few attentions though it is the link between the scientific mechanism and real-world engineering. The challenge is that heat and energy usually cannot be measured directly by sensors, though it is easy to monitor and record temperature in the laboratory. Therefore, this paper attempts to make up for this knowledge gap to find out the evolution patterns of heat and energy and contributions of influence factors governing the change of energy, by fully coupled thermal-hydraulic-mechanical-chemical modelling.
This paper is organized as follows. The THMC coupled model for hydrate dissociation is established in Section 2. Then evolutions of heat and energy are investigated by a case, after which a further discussion is conducted on the roles of factors causing the change of energy and implications for the lab-scale experiment and in-situ engineering.
2. THMC Coupled Model for Hydrate Dissociation
2.1. Problem Definition
Five phenomena are involved in the process of natural gas hydrate dissociation, that is phase change, water flow, gas flow, stress redistribution and heat transfer.
Phase change: When temperature increases or pressure decreases, the stability of hydrates is disrupted, causing the solid crystal structure to break down and release liquid water and gaseous methane. This process is similar to ice melting into water, but hydrate dissociation also involves the release of gas. The rate of phase change depends on the extent of temperature and pressure changes. The higher temperature and lower t pressure leads to the faster phase change.
Water flow: Hydrate dissociation releases a significant amount of water. This water is not static within the sediment but begins to flow. Water flows through pores of porous media. The movement of water can alter the physical properties of the porous media, such as reducing its mechanical strength. Additionally, water flow can carry away heat, affecting local temperature distribution and further influencing the rate of hydrate dissociation.
Gas flow: Similar to water, the methane gas released during hydrate dissociation does not remain in place but migrates through the pores of porous media. Also, gas flow directly affects the heat transfer.
Stress redistribution: In their solid state, hydrates act like "glue," enhancing the stiffness and strength of porous media. When hydrates dissociate, this binding effect is lost, causing stress redistribution within the porous media. This stress change leads to the deformation of porous media.
Heat transfer: Hydrate dissociation is an endothermic process, requiring heat absorption from the surrounding environment. Heat transfer occurs through conduction, advection and radiation. Radiation can be neglected for hydrate dissociation. The efficiency of heat transfer affects the rate and extent of hydrate dissociation. For example, if heat supply is insufficient, hydrate dissociation may locally stagnate; if heat supply is excessive, dissociation may accelerate, potentially leading to large-scale methane release.
2.2. Modelling Framework
Under the framework of continuum mechanics, the hydrate dissociation is governed by basic conservation laws of mass, momentum and energy. In addition, auxiliary relations from experiments should be embedded to close the coupled system. Porous media is indexed by the porosity, and parameters are calculated by the volume-average method. The modelling approaches for all involved phenomena during hydrate dissociation are listed in Table 1. Detailed equations are given in Section 2.2.1 and 2.2.2.
2.2.1. Governing Equations
Governing equations of hydrate phase change, water seepage, gas seepage and mechanical deformation. As shown in Equation 1 ~ 5.
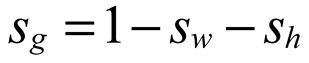
where, ρh [kg/m3] is the density of hydrate; n is the porosity of porous media; sh [-] is the hydrate saturation; Qh [kg/(m3.s)] is the hydrate dissociation rate; ρw [kg/m3] is the water density; sw [-] is the water saturation, defined as the ratio of the water volume to the sum volume of natural gas hydrate, water and gas; vw [m/s] is the water seepage velocity; Qw [kg/(m3.s)] is the mass source of water, resulting from hydrate dissociation; ρg [kg/m3] is the methane density; sg [-] is the gas saturation, defined as the ratio of the methane volume to the sum volume of hydrate, water and gas; vg [m/s] is the gas seepage velocity; Qg [kg/(m3.s)] is the mass source of methane, resulting from natural gas hydrate dissociation; σij [Pa] is the stress tensor; Fi [N/m3] is the body force due to the gravity; T [K] is the temperature; Cg [J/(kg.K)], Cw [J/(kg.K)], Ch [J/(kg.K)] and Cs [J/(kg.K)] are specific heat capacities of methane, water, natural gas hydrate and matrix respectively; ρs [kg/m3] is the matrix density; λg [W/(m.K)], λw [W/(m.K)], λh [W/(m.K)] and λs [W/(m.K)] are thermal conductivities of gas, water, natural gas hydrate and matrix respectively; ΔH [J/mol] is the latent heat of natural gas hydrate dissociation; q [J/(m3.s)] is the heat obtained from the environment.
2.2.2. Auxiliary Equations
Additionally, some experimental or empirical equations are necessary to close the governing equations, including the hydrate dissociation kinetic model [31], Darcy’s flow law, Arrhenius-type intrinsic reaction rate coefficient [32], effective reaction specific area modified from Kozeny-Carman relation [33] and three intrinsic relations, as shown in Equation 7 ~ 14 respectively.
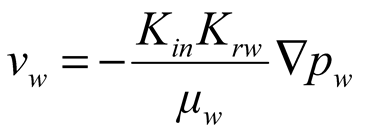
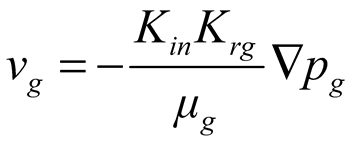
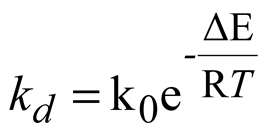
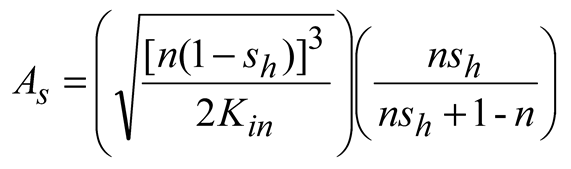
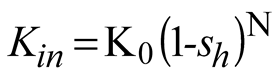
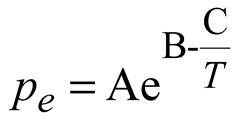
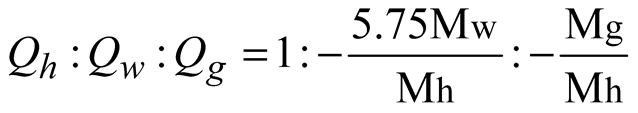
Where, Mh [kg/mol] is the molar mass of methane hydrate; kd [mol/(s.Pa.m2)] is the chemical reaction coefficient; As [1/m] is the effective specific area for natural gas hydrate dissociation; pg [Pa] is the gas pressure; pe [Pa] is the equilibrium gas pressure of natural gas hydrate; μw [Pa.s] is the dynamic viscosity of water; Krw [-] is the relative permeability of water; pg [Pa] is gas pressure; pw [Pa] is water pressure; μg [Pa.s] is the dynamic viscosity of methane; Krg [-] is the relative permeability of methane; Kin [m2] is the intrinsic(absolute) permeability; k0 [mol/(s.Pa.m2)] is the intrinsic reaction constant, 36000 mol/(s.Pa.m2); R [J/(mol.K)] is the universal gas constant, 8.31 [J/(mol.K)]; ΔE [J/mol] is the reaction activation energy, 81000 [J/mol]; K0 [m2] is the intrinsic permeability without natural gas hydrate in porous media; N [-] is the permeability reduction index due to hydrate dissociation and equals 15 in this study; A [Pa], B [-] and C [K] are fitted constants and equal 1.12 [Pa], 49.3185 and 9459 [K] respectively; Mg [kg/mol] and Mw [kg/mol] are the molar mass of gas and water respectively.
2.2.3. Physics-Based Constrained Conditions
To guarantee a stable THMC coupled computation, two constrained conditions are proposed according to the physics. Physically, hydrate dissociation can only occur when the pressure is lower than the phase equilibrium pressure; hydrate dissociation is a dynamic process during which the hydrate saturation gradually decreases from its initial value, and when the hydrate is completely dissociated, the hydrate saturation becomes zero. Mathematically, therefore one constrain is that hydrate dissociation does not occur if the gas pressure is higher than the phase equilibrium (this is already embedded in Equation 6). Another is that the hydrate saturation stops decreasing once it reaches zero to avoid negative values, which is achieved by introducing an extra variable SH.
SH = min(max(sh, 0), 1)
When performing the coupled computation of hydrate dissociation, SH replaces sh in other equations (such as Equation 10, 11 and 14) to link the coupled relations.
3. Case Study
3.1. Case Introduction
Since Masuda et al. [20] carried out an early investigation on hydrate dissociation in Berea sandstone, numerous scholars has chosen Berea sandstone as their study case [34,35,36,37]. Therefore, the laboratory test of Run 2 by Masuda et al. [20] is also used in this study, as illustrated in Figure 2. The experiment was conducted in an air-bath setting. A sample holder secured the Berea sandstone core, which was encased in a rubber sleeve and sealed at both ends. The Berea sandstone core used in the experiment measured 30.0 cm in length and had a cross-sectional area of 20.3 cm². The core, devoid of natural gas hydrates, exhibited an intrinsic permeability of 0.0967 μm² and a porosity of 0.182. By reducing the pressure at the core's right boundary, the hydrate dissociation was triggered. Three thermocouples were uniformly distributed along the core at the right quarter point (Point A), the middle quarter point (Point B) and the left quarter point (Point C). Theoretically, more thermocouples could obtain more data. However, in practice, more thermocouples also influence the data precision, because they take up more space of the core. Additionally, the beginning and end are the places easily influenced by outside uncertain factors. So 3 thermocouples are installed in the middle of the core.
3.2. Computation Parameters and Settings
Parameters for numerical simulation are shown in Table 2. The Young’s modulus of hydrate-bearing Berea sandstone is estimated by the linear relations with the Young’s moduli of Berea sandstone and natural gas hydrate. Poisson’s ratio of hydrate-bearing Berea sandstone is empirically assumed to be 0.2. The relative permeability and capillary pressure of Berea sandstone can be obtained from Yousif et al. [19]. The heat that the natural gas hydrate-bearing core obtains from the air-bath environment can be calculated with the heat exchange coefficient, 53 [W/(m2.K)].
Notes:
a Water density Data by Tanaka et al. (2001) [38] is modified by the water volumetric modulus:
, Bw= 2 [GPa], ρw0= 999.97495 [kg/m3],
a1= -3.983035 [K], a2= 301.797 [K], a3= 522528.9 [K2] and a4= 69.34881 [K].
b Sánchez et al. (2018) [23] fitted data by Younglove and Ely (1987) [39] within the range 270 K < T < 290 K and
0.1 MPa < pg < 40 MPa:
c Likhachev, (2003) [40]: , μw0= 2.405×10⁻⁵ [Pa.s], a=4.42×10⁻⁹ [1/Pa],
b=9.565×10⁻⁶ [J/(mol.Pa)], c= 1.24×10⁻⁷ [K/Pa], θ= 139.7 [K] and E=4753 [J/mol].
The initial hydrate saturation, water pressure, gas pressure and temperature are 0.42, 3.68 [MPa], 3.7 [MPa] and 275.6 [K]. At the right boundary where depressurization starts, the gas pressure, water pressure, temperature gradient and total stress are 3.14 [MPa], 3.125 [MPa], 0 and 3.7 [MPa] respectively. At the left boundary, the gas pressure gradient, water pressure gradient, the temperature gradient and the displacement are all 0.
3.3. Results
3.3.1. Hydrate Dissociation
This part intends to reveal the change of hydrate saturation in the process of hydrate dissociation. Hydrate saturation is defined as the volume fraction of hydrates in the pores of porous media. As shown in Figure 3, the dissociation of hydrates starts at the right boundary (initial pressure-reduction boundary) and spreads leftward (from Point A to B, then to C.), lasting about 400 minutes. Over this time, the gap of hydrate saturation at different points first increases before around 100 minutes and then decreases to zero gradually. This evolution pattern can be explained by the complicated competitions among influence factors including temperature, reaction specific area and pressure [18,36]. At first, pressure drop controls the hydrate dissociation rate, so the hydrate dissociation is stronger at positions close to the depressurization boundary. Then, temperature and reaction specific area dominates it, so when the hydrate saturation reaches half of the initial value, the hydrate dissociation at positions far from the depressurization boundary becomes stronger.
3.3.2. Change of Heat
This part intends to reveal the change of heat in the process of hydrate dissociation. In general, heat transfer has three ways, that is, conduction, advection and radiation. As for hydrate dissociation, radiation could be neglected. The heat change caused by conduction and advection is correspondingly called conduction heat (defined as Equation 16) and advection heat (defined as Equation 17).
where, Qcndct and Qadvct are the cumulative conduction heat and advection heat through one section, respectively; A is the section area. The sign of Qadvct is consistent with that of fluid seepage velocity. The sign of Qcndct is opposite to that of temperature gradient.
As shown in Figure 4, the cumulative conduction heat shows a trend of increasing and then decreasing during the hydrate dissociation, and the ending time of the conduction is basically the same as that of the hydrate dissociation. The increase of the cumulative conduction heat indicates that the heat is transferred from the left to the right of the core, and the decrease of the cumulative conduction heat means that the heat is transferred from the right to the left. Thus the direction of heat conduction changes at around 100 min. This is consistent with the pattern of the gap of hydrate saturation in Figure 2. Additionally, we could observe that the curves of heat conduction at three quarter points intersect each other after 250 min, much later than the time of the direction change of heat conduction. The reason is the competition between the consumption heat by hydrate dissociation and the heat supply from the external environment [34,35,36,37]. Before 100 min, the consumption heat by hydrate dissociation is bigger. After 100 min, the contribution of heat supply from the external environment is bigger. Time between 100 min and 250 min is the process of external environment gradually compensating for the absorbed heat by previous hydrate dissociation.
As shown in Figure 5, the cumulative advection heat shows a monotonically increasing trend in the process of hydrate dissociation, and the advection heat continues to increase rapidly at the end of the hydrate dissociation because the flow seepage still does not stop. The increase of the cumulative advection heat indicates that the heat is transferred from the left to the right, and the cumulative advection heat peak at the end of the hydrate dissociation is in the order of magnitude of 103 J while the order of magnitude of the peak of the cumulative conduction heat is 102 J. Comparing the conduction heat and advection heat in the process of the hydrate dissociation, it can be found that they show significant differences in the overall trends and values. The behind reason is that the conduction heat is mainly controlled by the temperature gradient, while the advection heat is mainly controlled by the flow of the fluid [36]. On one hand, the fluid flow can carry more heat than that caused by the temperature gradient, so the value of advection heat is much bigger than that of conduction heat. On the other hand, the direction of fluid flow is only from the depressurization boundary to another boundary, while the temperature gradient is firstly positive and negative, so the advection heat and conduction heat have different overall trends during hydrate dissociation.
3.3.3. Change of Energy
This part aims to discover effects of different influence factors of the change of internal energy. The internal energy herein is evaluated by the change of energy density. Definitions of the changes of energy density caused by heat conduction, heat advection, hydrate phase change and external heat source are defined as Equation 18 – 21, respectively.
where, Ecndct, Eadvct, Epc and Eex are the changes of energy density caused by heat conduction, heat advection, hydrate phase change and external heat source.
As shown in Figure 6, the heat conduction generally firstly has a negative effect on the energy density, and then has a positive effect. Comparing values at the starting and ending point, the change of the energy density of the left half part of the core (far from the depressurized right boundary) decreases, and that of the right half part of the core (close to the depressurization boundary) increases. The behind reason is that hydrate dissociation happens from the right boundary and then gradually extends to the left boundary, so the higher temperature in the left part of the core would transfer to the lower temperature in the right one. It is observed that the order of magnitude of the peak value is 105 J/m3 in this case. It is also noticeable that the three curves of change of energy density at quarter points intersect each before 100 min. The reason is that absolute value of change of energy density at the position closer to the depressurization boundary is smaller, though it increases faster before the maximum at around 100 min.
As shown in Figure 7, heat advection generally has a negative effect on the energy density, and this effect is stronger at the position closer to the depressurization boundary. The behind reason is that the fluid flow is generally stronger at positions closer to the depressurization boundary. Additionally, it is observed that the order of magnitude of the peak value is 107 J/m3 in this case, much greater than that caused by the conduction. Similar to the explanation in Section 3.3.2, fluid flow could transfer more heat, so it makes a bigger contribution to the reduction of the energy density.
As shown in Figure 8, external heat source generally has a positive effect on the energy density, and this effect is stronger at the place closer to the depressurized right boundary. The behind reason is that the external environmental temperature is always not smaller than that of the core, so the core would absorb energy from the external environment when its temperature drops due to the hydrate dissociation. The hydrate dissociation starts from the right boundary (depressurization boundary), thus the temperature at Point A decreases first, then Point B and lastly Point C. So the external heat source provides more energy to Point A. Additionally, it is observed that the order of magnitude of the peak value is also 107 J in this case, a little greater than that caused by advection heat.
As shown in Figure 9, the phase change of hydrate generally has a negative effect on the energy density, and this effect is stronger at the place closer to the depressurized boundary in the process of hydrate dissociation. However, the final change of the energy density caused by the hydrate phase change is almost the same. The reason is that phase change of hydrate is an endothermic process from solid phase to liquid and gas phases [23,37], so where hydrate dissociation happens earlier, the reduction effect of energy density occurs earlier and more obvious. Additionally, it is observed that the order of magnitude of the peak value is 107 J in this case, a little greater than that caused by advection heat but smaller than that caused by external heat source.
4. Discussion
4.1. Comparison Among Contributions of Influence Factors to the Change of Energy Density
This part intends to further discuss roles of factors causing the change of energy. As shown in Figure 10, in general, external heat source makes a main contribution to the increase of the energy, while phase change mainly governs the decrease of the energy due to the considerable latent heat of hydrate dissociation. The role of heat conduction can be almost neglected, but the contribution of heat advection should still be considered.
Figure 11 shows the change rate of energy density governed by different factors. It is found that the absolute values of the change rate by different factors generally shows an increase trend first and then a decrease one, except for the advection situation where the fluid seepage could continue for some time after the dissociation of hydrate finishes.
4.2. Implications for Lab-Scale Experiments and In-Situ Engineering
Results of this study show that the external heat source has the most significant contribution to the change of energy, but present lab-scale experiments are not well designed with the consideration of external heat. Some experiments use the air or liquid bath as the external heat source to keep the environment with constant temperature. Others do not utilize any external heat source [19,20,25,26]. These two extreme cases are not consistent with natural submarine or permafrost environment of hydrates. Therefore, future lab-scale experiments could try to refine the design in terms of the external heat source.
Temperature is an explicit variable which would be measured but sensors, but heat and energy is the implicit essence that cannot be directly measured. Linking to the real-world engineering [28], we need analyses of heat and energy to evaluate the cost for hydrate exploitation instead of temperature. Therefore, future in-situ designs should go further from the temperature to heat and energy.
5. Conclusions
This study aims to provide new insights into the process of hydrate dissociation in porous media from the perspective of heat and energy, by a fully coupled thermal-hydraulic-mechanical-chemical model. Evolution patterns of heat and energy are revealed for the first time, and implications are also provided to improve designs of lab-scale experiments and in-situ engineering. A brief summary is as follows.
(1) The trends and values of conduction heat and advection heat show different patterns during hydrate dissociation. The cumulative conduction heat shows a trend of increasing and then decreasing in the process of hydrate dissociation, while the cumulative advection heat shows a monotonically increasing tendency. Additionally, the cumulative conduction heat is much smaller than the cumulative advection heat by one order of magnitude in the investigated case, which implicates that the laboratory tests of parameters related to the advection heat transfer should be more prudent.
(2) Phase change, conduction heat, advection heat and external heat make various contributions to the change of energy. External heat source makes a main contribution to the increase of the energy, while phase change mainly governs the decrease of the energy. The role of heat conduction can be almost neglected in spite of versatile patterns during hydrate dissociation, but the contribution of heat advection should still be considered.
(3) This study has two implications for the lab-scale experiment and in-situ engineering. Future in-situ designs should go further from the temperature to heat and energy, because temperature is the explicit phenomenon which would be measured, but heat and energy is the implicit essence directly related to the cost evaluation for the real-world hydrate exploration. Additionally, refining the design of the external heat source is suggested to improve the similarity between lab-scale experiments and in-situ engineering, due to the dramatic role of external heat source on the change of energy.
Author Contributions
Conceptualization, Mengchen Zhu and Haitao Zhang; methodology, Mengchen Zhu; validation, Mengchen Zhu; formal analysis, Mengchen Zhu and Yunwei Shi; investigation, Mengchen Zhu and Yunwei Shi; resources, Jiaxing Zhou and Liang Fu; data curation, Jiaxing Zhou and Liang Fu; writing—original draft preparation, Mengchen Zhu and Haitao Zhang; writing—review and editing, Jiaxing Zhou and Liang Fu; visualization, Mengchen Zhu; supervision, Haitao Zhang; project administration, Haitao Zhang; funding acquisition, Jiaxing Zhou and Liang Fu. All authors have read and agreed to the published version of the manuscript.
Acknowledgments
This work is funded by the Opening Funding of Sinopec Research Institute of Petroleum Engineering Technology Co., Ltd. Helps from Dr. Sheng Dai (Department of Geosystems, Georgia Institute of Technology) and Dr. Praveen Linga (Department of Chemical and Biomolecular Engineering, National University of Singapore) are appreciated when Haitao Zhang studied in their research groups.
Conflicts of Interest
The authors declare no conflicts of interest.
Abbreviations
The following abbreviation used in this manuscript:
| THMC | Thermal-Hydraulic-Mechanical-Chemical |
References
- Sloan, E.D., & Koh, C.A. (2008). Clathrate Hydrates of Natural Gases, Third Edition. CRC Press.
- Linga, P.; Haligva, C.; Nam, S.C.; Ripmeester, J.A.; Englezos, P. Gas Hydrate Formation in a Variable Volume Bed of Silica Sand Particles. Energy Fuels 2009, 23, 5496–5507. [Google Scholar] [CrossRef]
- Walsh, M.R.; Hancock, S.H.; Wilson, S.J.; Patil, S.L.; Moridis, G.J.; Boswell, R.; Collett, T.S.; Koh, C.A.; Sloan, E.D. Preliminary report on the commercial viability of gas production from natural gas hydrates. Energy Econ. 2009, 31, 815–823. [Google Scholar] [CrossRef]
- Cui, Y.; Lu, C.; Wu, M.; Peng, Y.; Yao, Y.; Luo, W. Review of exploration and production technology of natural gas hydrate. Adv. Geo-Energy Res. 2018, 2, 53–62. [Google Scholar] [CrossRef]
- Liu, L.; Dai, S.; Ning, F.; Cai, J.; Liu, C.; Wu, N. Fractal characteristics of unsaturated sands − implications to relative permeability in hydrate-bearing sediments. J. Nat. Gas Sci. Eng. 2019, 66, 11–17. [Google Scholar] [CrossRef]
- Lei, L.; Gai, X.; Seol, Y. Load-bearing characteristic of methane hydrate within coarse-grained sediments – Insights from isotropic consolidation. Mar. Pet. Geol. 2020, 121. [Google Scholar] [CrossRef]
- Hyodo, M.; Wu, Y.; Nakashima, K.; Kajiyama, S.; Nakata, Y. Influence of Fines Content on the Mechanical Behavior of Methane Hydrate-Bearing Sediments. J. Geophys. Res. Solid Earth 2017, 122, 7511–7524. [Google Scholar] [CrossRef]
- Dai, S.; Cha, J.; Rosenbaum, E.J.; Zhang, W.; Seol, Y. Thermal conductivity measurements in unsaturated hydrate-bearing sediments. Geophys. Res. Lett. 2015, 42, 6295–6305. [Google Scholar] [CrossRef]
- Santamarina, J.; Dai, S.; Terzariol, M.; Jang, J.; Waite, W.; Winters, W.; Nagao, J.; Yoneda, J.; Konno, Y.; Fujii, T.; et al. Hydro-bio-geomechanical properties of hydrate-bearing sediments from Nankai Trough. Mar. Pet. Geol. 2015, 66, 434–450. [Google Scholar] [CrossRef]
- Zhang, H.; Luo, X.; Bi, J.; He, G.; Guo, Z. Submarine slope stability analysis during natural gas hydrate dissociation. Mar. Georesources Geotechnol. 2018, 37, 467–476. [Google Scholar] [CrossRef]
- Uchida, S.; Klar, A.; Yamamoto, K. Sand production model in gas hydrate-bearing sediments. Int. J. Rock Mech. Min. Sci. 2016, 86, 303–316. [Google Scholar] [CrossRef]
- Nixon, M.F.; Grozic, J.L. Submarine slope failure due to gas hydrate dissociation: a preliminary quantification. Can. Geotech. J. 2007, 44, 314–325. [Google Scholar] [CrossRef]
- Ruppel, C.D.; Kessler, J.D. The interaction of climate change and methane hydrates. Rev. Geophys. 2017, 55, 126–168. [Google Scholar] [CrossRef]
- Nicholas, J.W.; Dieker, L.E.; Sloan, E.D.; Koh, C.A. Assessing the feasibility of hydrate deposition on pipeline walls—Adhesion force measurements of clathrate hydrate particles on carbon steel. J. Colloid Interface Sci. 2009, 331, 322–328. [Google Scholar] [CrossRef] [PubMed]
- Konno, Y.; Fujii, T.; Sato, A.; Akamine, K.; Naiki, M.; Masuda, Y.; Yamamoto, K.; Nagao, J. Key Findings of the World’s First Offshore Methane Hydrate Production Test off the Coast of Japan: Toward Future Commercial Production. Energy Fuels 2017, 31, 2607–2616. [Google Scholar] [CrossRef]
- Minshull, T.A.; Marín-Moreno, H.; Betlem, P.; Bialas, J.; Bünz, S.; Burwicz, E.; Cameselle, A.L.; Cifci, G.; Giustiniani, M.; Hillman, J.I.; et al. Hydrate occurrence in Europe: A review of available evidence. Mar. Pet. Geol. 2020, 111, 735–764. [Google Scholar] [CrossRef]
- White; Kneafsey, T. ; Seol, Y.; Waite, W.; Uchida, S.; Lin, J.; Myshakin, E.; Gai, X.; Gupta, S.; Reagan, M.; et al. An international code comparison study on coupled thermal, hydrologic and geomechanical processes of natural gas hydrate-bearing sediments. Mar. Pet. Geol. 2020, 120. [Google Scholar] [CrossRef]
- Zhang, H.; Wu, B.; Luo, X.; Tang, M.; Zhang, X.; Yang, L.; Nie, Y.; Zhou, J.; Zhang, L.; Li, G. Multiphysical evolution and dynamic competition involved in natural gas hydrate dissociation in porous media and its implications for engineering. Energy 2023, 289. [Google Scholar] [CrossRef]
- Youslf, M.H.; Abass, H.H.; Selim, M.S.; Sloan, E.D. Experimental and Theoretical Investigation of Methane-Gas-Hydrate Dissociation in Porous Media. SPE Reserv. Eng. 1991, 6, 69–76. [Google Scholar] [CrossRef]
- Masuda, Y. , Fujinaga, Y. ( 7(7), 18–22.
- Goel, N.; Wiggins, M.; Shah, S. Analytical modeling of gas recovery from in situ hydrates dissociation. J. Pet. Sci. Eng. 2001, 29, 115–127. [Google Scholar] [CrossRef]
- Kwon, T.; Cho, G.; Santamarina, J.C. Gas hydrate dissociation in sediments: Pressure-temperature evolution. Geochem. Geophys. Geosystems 2008, 9. [Google Scholar] [CrossRef]
- Sánchez, M.; Santamarina, C.; Teymouri, M.; Gai, X. Coupled Numerical Modeling of Gas Hydrate-Bearing Sediments: From Laboratory to Field-Scale Analyses. J. Geophys. Res. Solid Earth 2018, 123, 10326–10348. [Google Scholar] [CrossRef]
- Yun, T.S.; Fratta, D.; Santamarina, J.C. Hydrate-Bearing Sediments from the Krishna−Godavari Basin: Physical Characterization, Pressure Core Testing, and Scaled Production Monitoring. Energy Fuels 2010, 24, 5972–5983. [Google Scholar] [CrossRef]
- Song, R.; Feng, X.; Wang, Y.; Sun, S.; Liu, J. Dissociation and transport modeling of methane hydrate in core-scale sandy sediments: A comparative study. Energy 2021, 221. [Google Scholar] [CrossRef]
- Li, Y.; Gambelli, A.M.; Chen, J.; Yin, Z.; Rossi, F.; Tronconi, E.; Mei, S. Experimental study on the competition between carbon dioxide hydrate and ice below the freezing point. Chem. Eng. Sci. 2023, 268. [Google Scholar] [CrossRef]
- Wan, Y.; Wu, N.; Chen, Q.; Li, W.; Hu, G.; Huang, L.; Ouyang, W. Coupled thermal-hydrodynamic-mechanical–chemical numerical simulation for gas production from hydrate-bearing sediments based on hybrid finite volume and finite element method. Comput. Geotech. 2022, 145. [Google Scholar] [CrossRef]
- Yin, F.; Gao, Y.; Chen, Y.; Sun, B.; Li, S.; Zhao, D. Numerical investigation on the long-term production behavior of horizontal well at the gas hydrate production site in South China Sea. Appl. Energy 2022, 311. [Google Scholar] [CrossRef]
- Li, Q.; Liu, J.; Wang, S.; Guo, Y.; Han, X.; Li, Q.; Cheng, Y.; Dong, Z.; Li, X.; Zhang, X. Numerical insights into factors affecting collapse behavior of horizontal wellbore in clayey silt hydrate-bearing sediments and the accompanying control strategy. Ocean Eng. 2024, 297. [Google Scholar] [CrossRef]
- Dong, L.; Wu, N.; Leonenko, Y.; Wan, Y.; Liao, H.; Hu, G.; Li, Y. A coupled thermal-hydraulic-mechanical model for drilling fluid invasion into hydrate-bearing sediments. Energy 2023, 278. [Google Scholar] [CrossRef]
- Kim, H.; Bishnoi, P.; Heidemann, R.; Rizvi, S. Kinetics of methane hydrate decomposition. Chem. Eng. Sci. 1987, 42, 1645–1653. [Google Scholar] [CrossRef]
- Clarke, M.; Bishnoi, P.R. Determination of the activation energy and intrinsic rate constant of methane gas hydrate decomposition. Can. J. Chem. Eng. 2001, 79, 143–147. [Google Scholar] [CrossRef]
- Carman, P.C. (1939). Permeability of saturated sands, soils and cays. The Journal of Agricultural Science, 29(2), 262–273.
- Hardwick, J.S.; Mathias, S.A. Masuda’s sandstone core hydrate dissociation experiment revisited. Chem. Eng. Sci. 2018, 175, 98–109. [Google Scholar] [CrossRef]
- Nazridoust, K.; Ahmadi, G. Computational modeling of methane hydrate dissociation in a sandstone core. Chem. Eng. Sci. 2007, 62, 6155–6177. [Google Scholar] [CrossRef]
- Sun, X., Luo, H., & Soga, K. (2018). A coupled thermal – hydraulic – mechanical – chemical (THMC) model for methane hydrate bearing sediments. Journal of Zhejiang University-SCIENCE A (Applied Physics & Engineering), 19(8), 600–623.
- Song, Y.C., & Liang, H.F. (2009). 2-D numerical simulation of natural gas hydrate dissociation through depressurization by fully implicit method. China Ocean Engineering, 23(3), 529-542.
- Tanaka, M.; Girard, G.; Davis, R.; Peuto, A.; Bignell, N. Recommended table for the density of water between 0 C and 40 C based on recent experimental reports. Metrologia 2001, 38, 301–309. [Google Scholar] [CrossRef]
- Younglove, B.A.; Ely, J.F. Thermophysical Properties of Fluids. II. Methane, Ethane, Propane, Isobutane, and Normal Butane. J. Phys. Chem. Ref. Data 1987, 16, 577–798. [Google Scholar] [CrossRef]
- Likhachev, E.R. Dependence of water viscosity on temperature and pressure. Tech. Phys. 2003, 48, 514–515. [Google Scholar] [CrossRef]
Figure 1.
Main hydrate exploitation methods [4].
Figure 1.
Main hydrate exploitation methods [4].
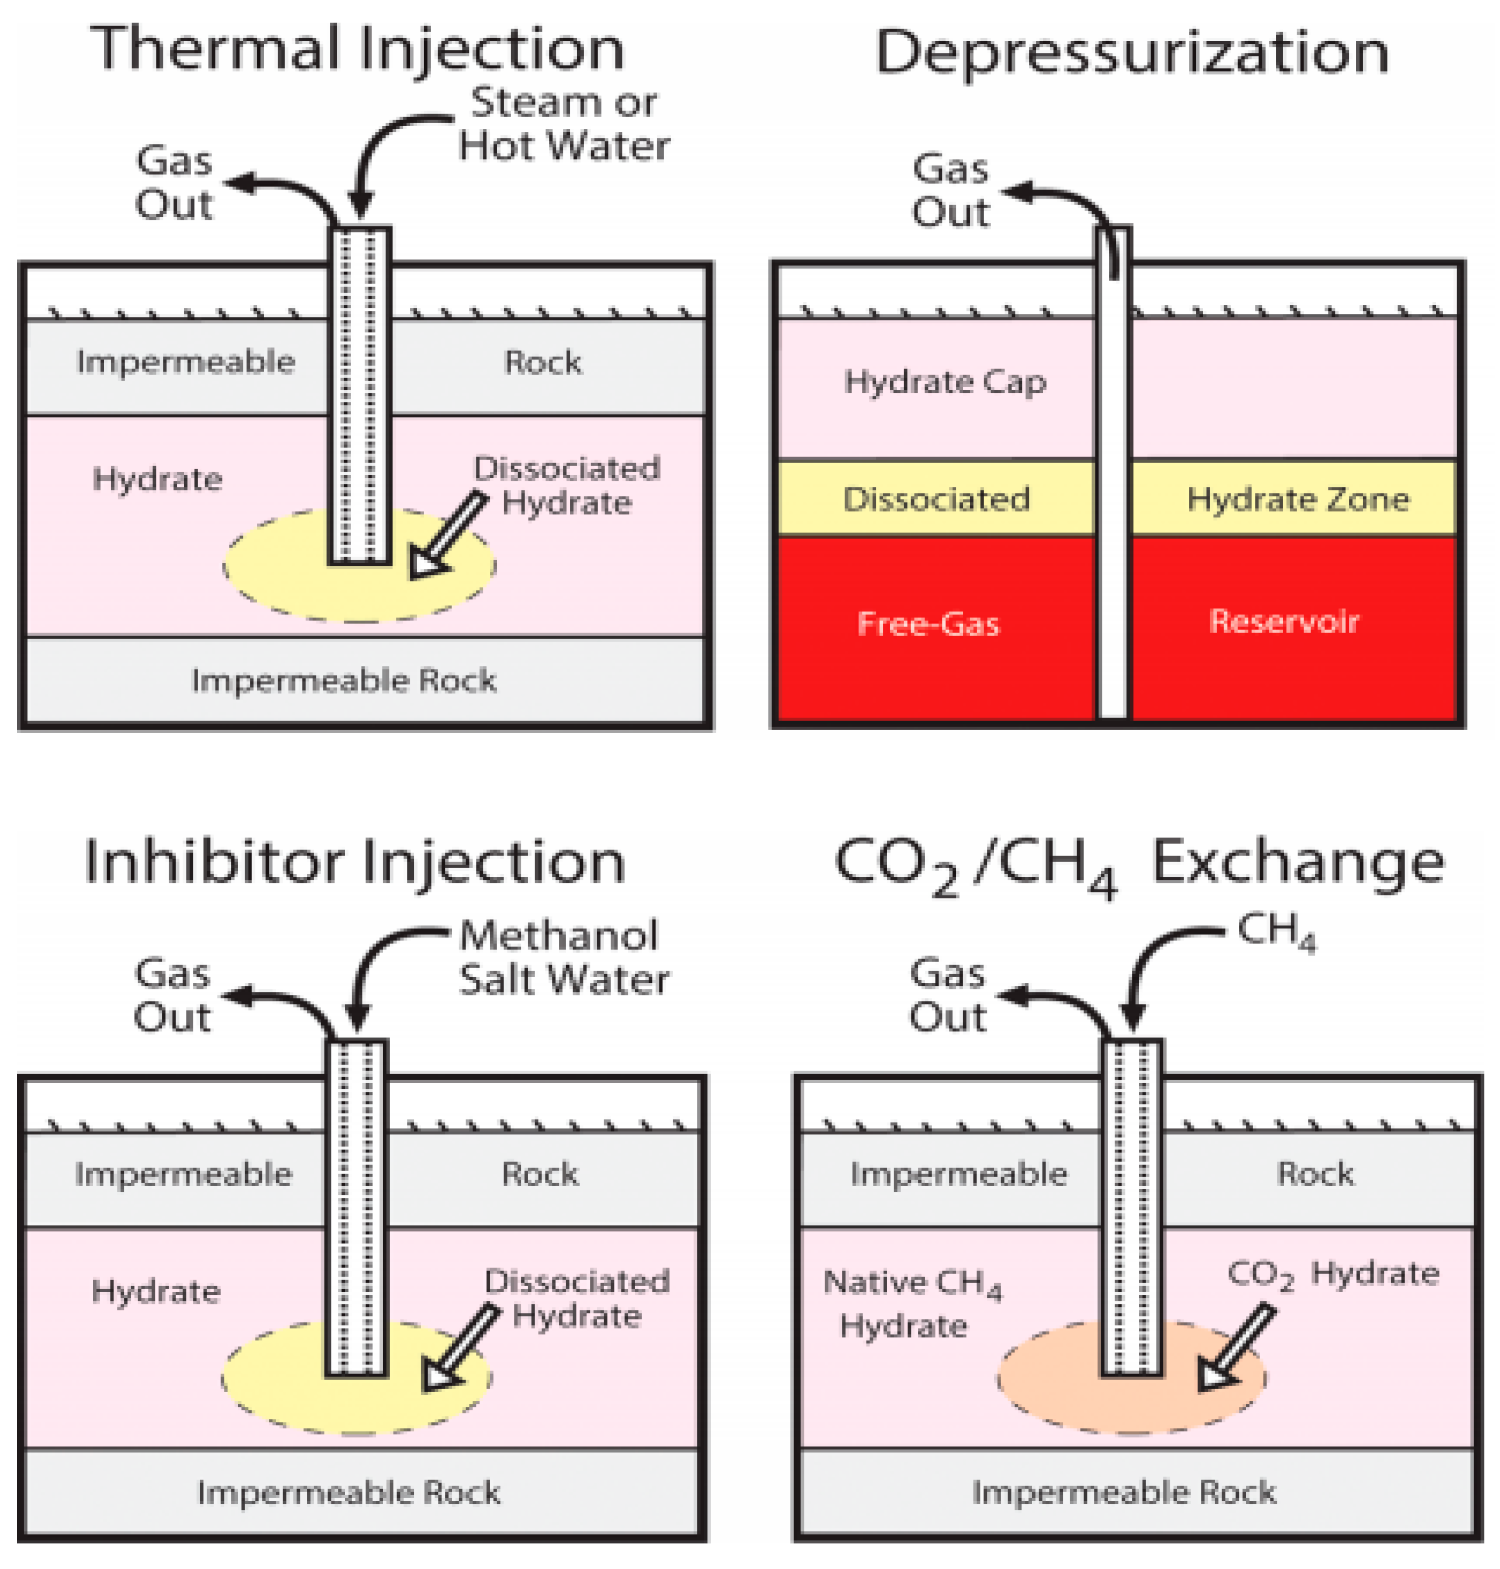
Figure 2.
Illustration of natural gas hydrate-bearing Berea sandstone.
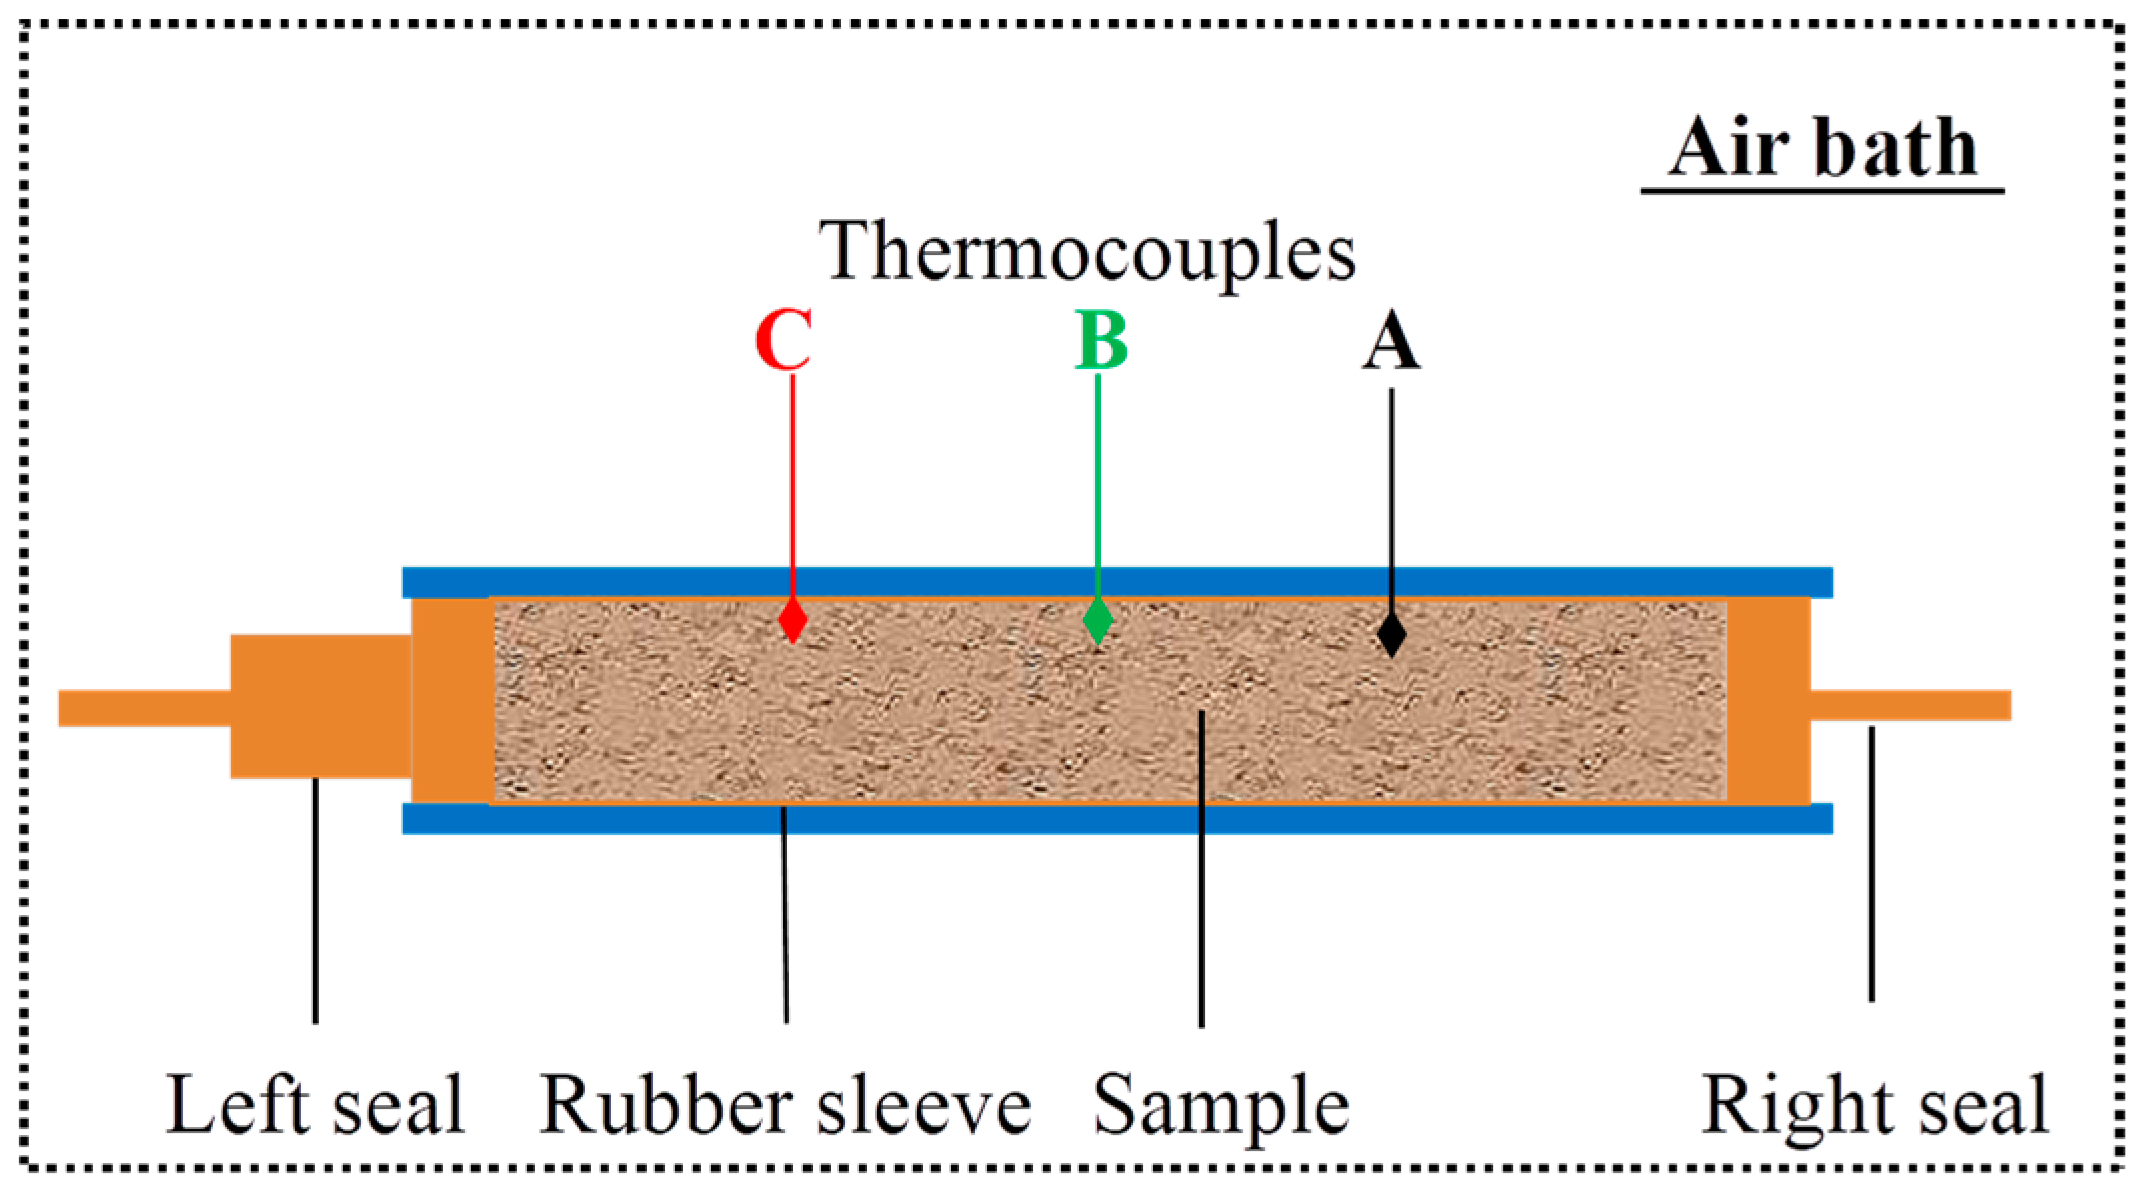
Figure 3.
Change of hydrate saturation in the process of hydrate dissociation.
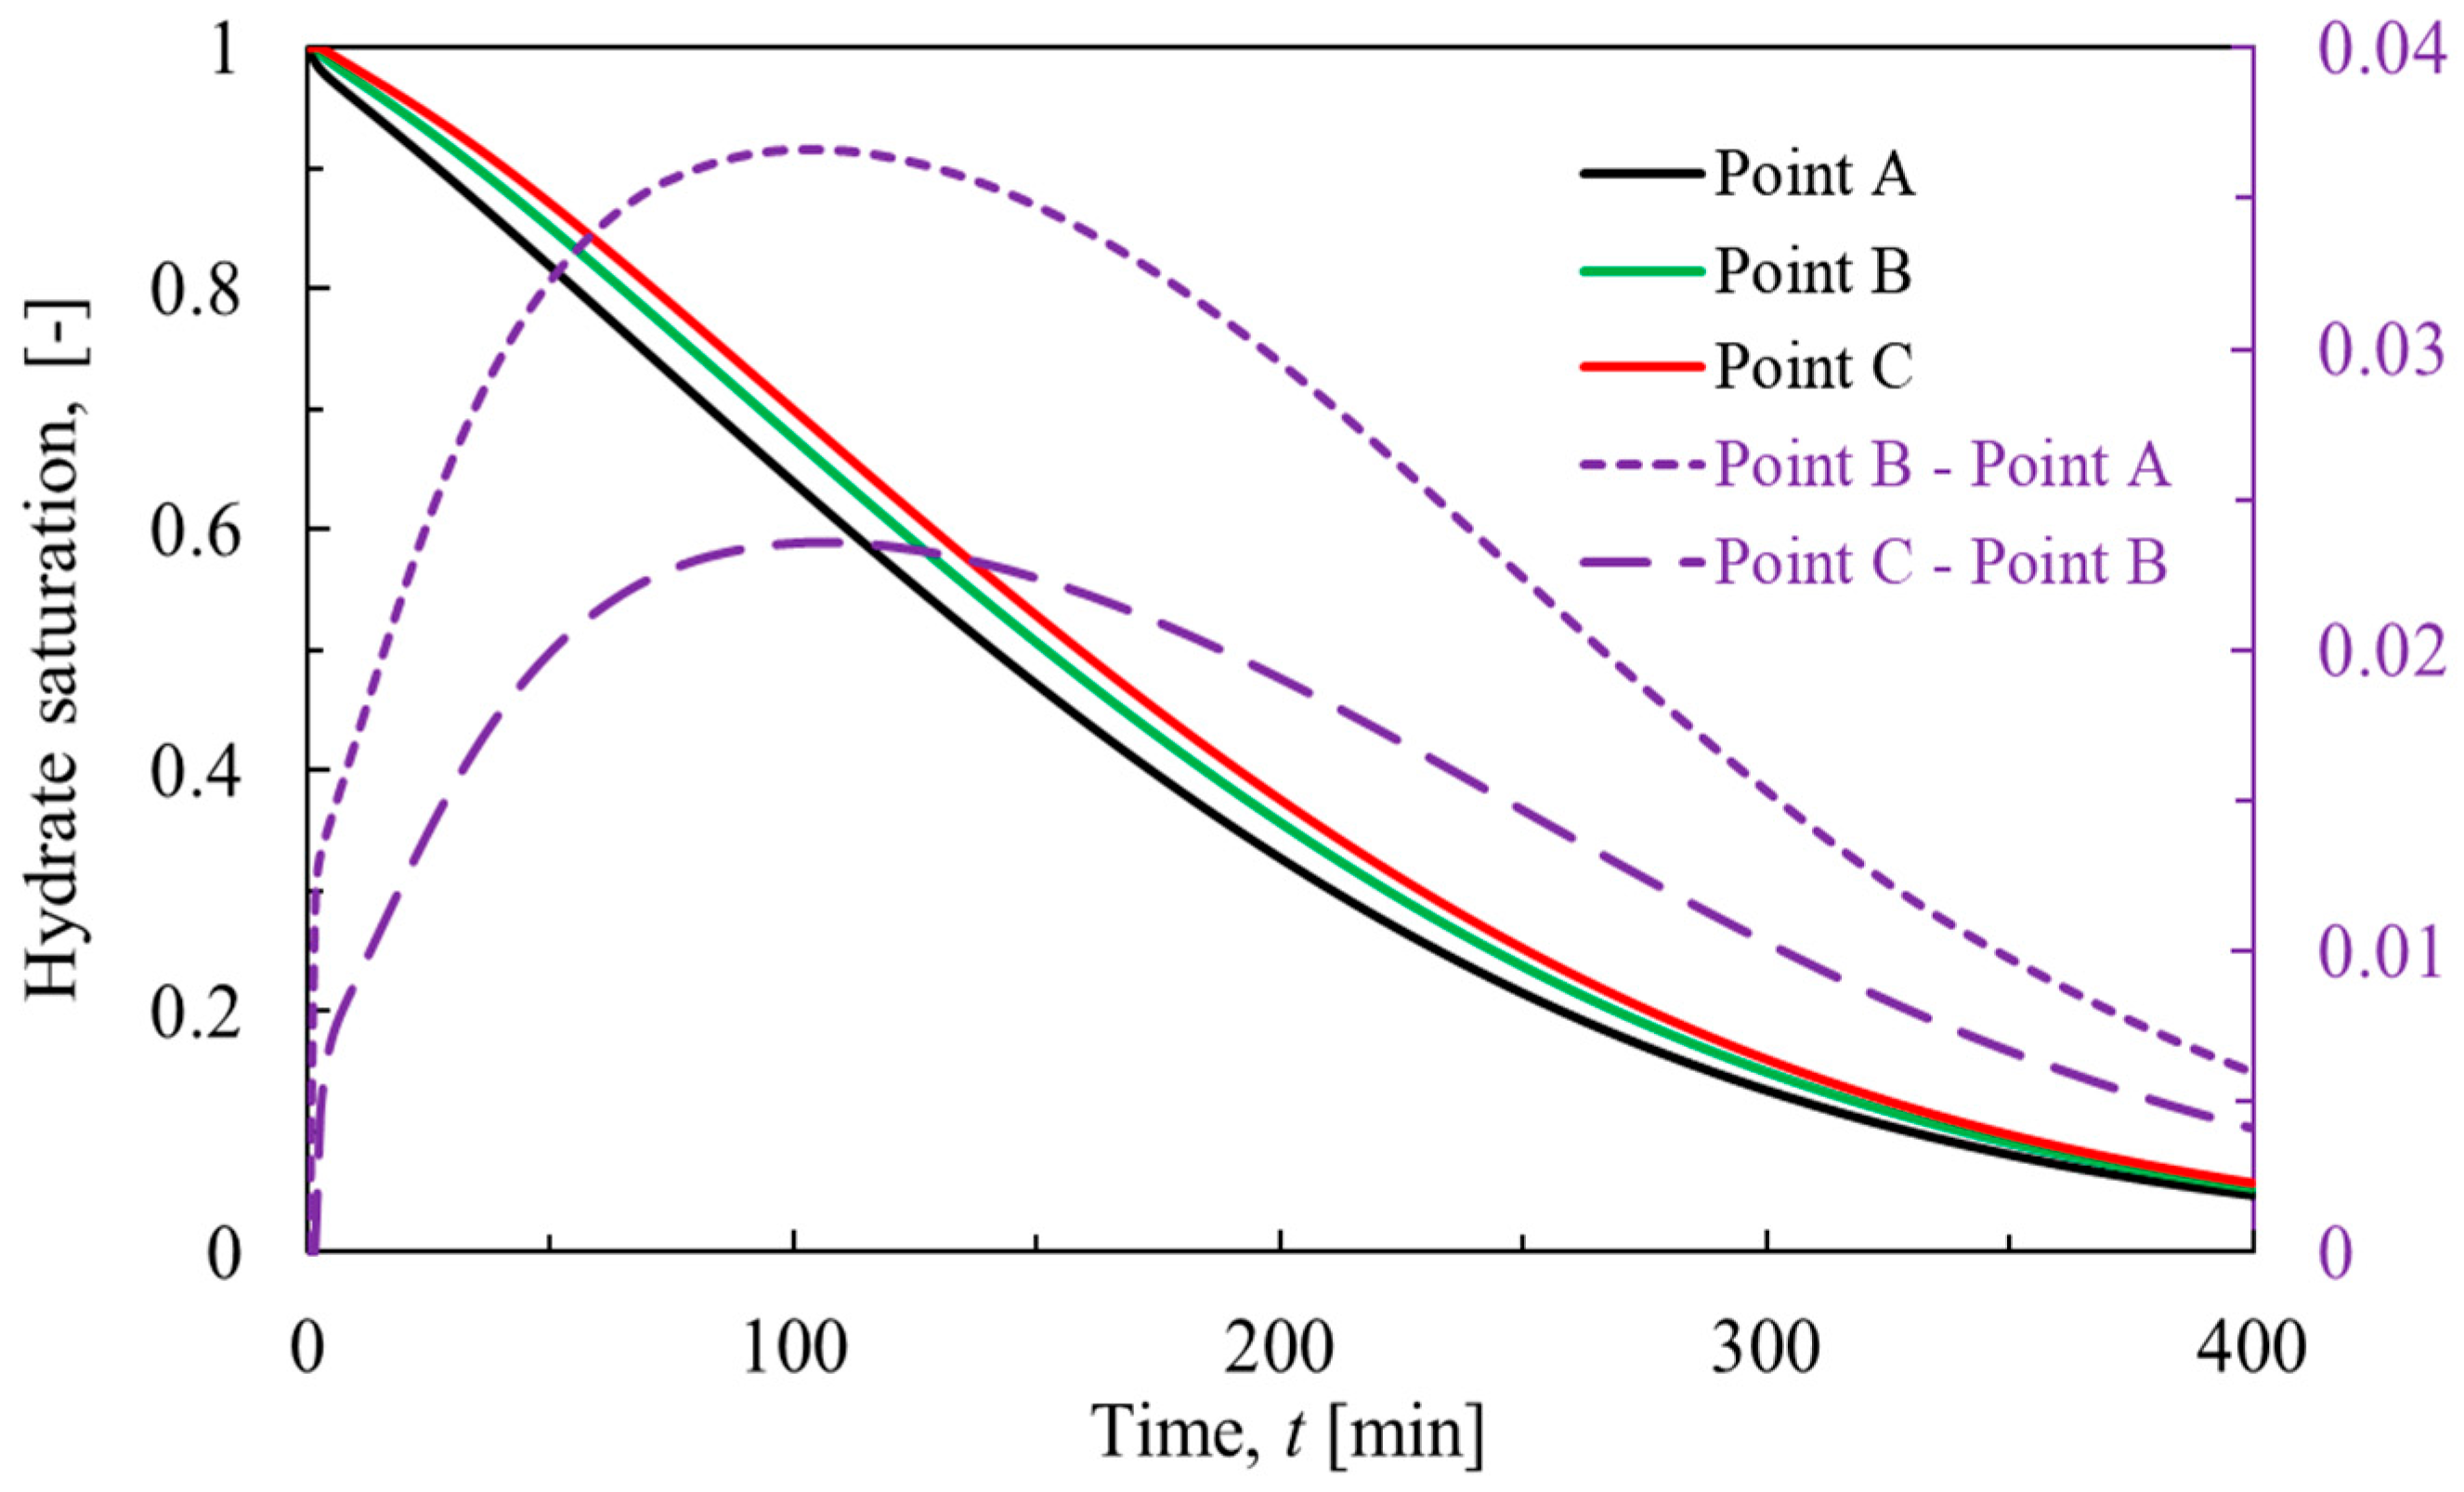
Figure 4.
Change of cumulative conduction heat in the process of hydrate dissociation.
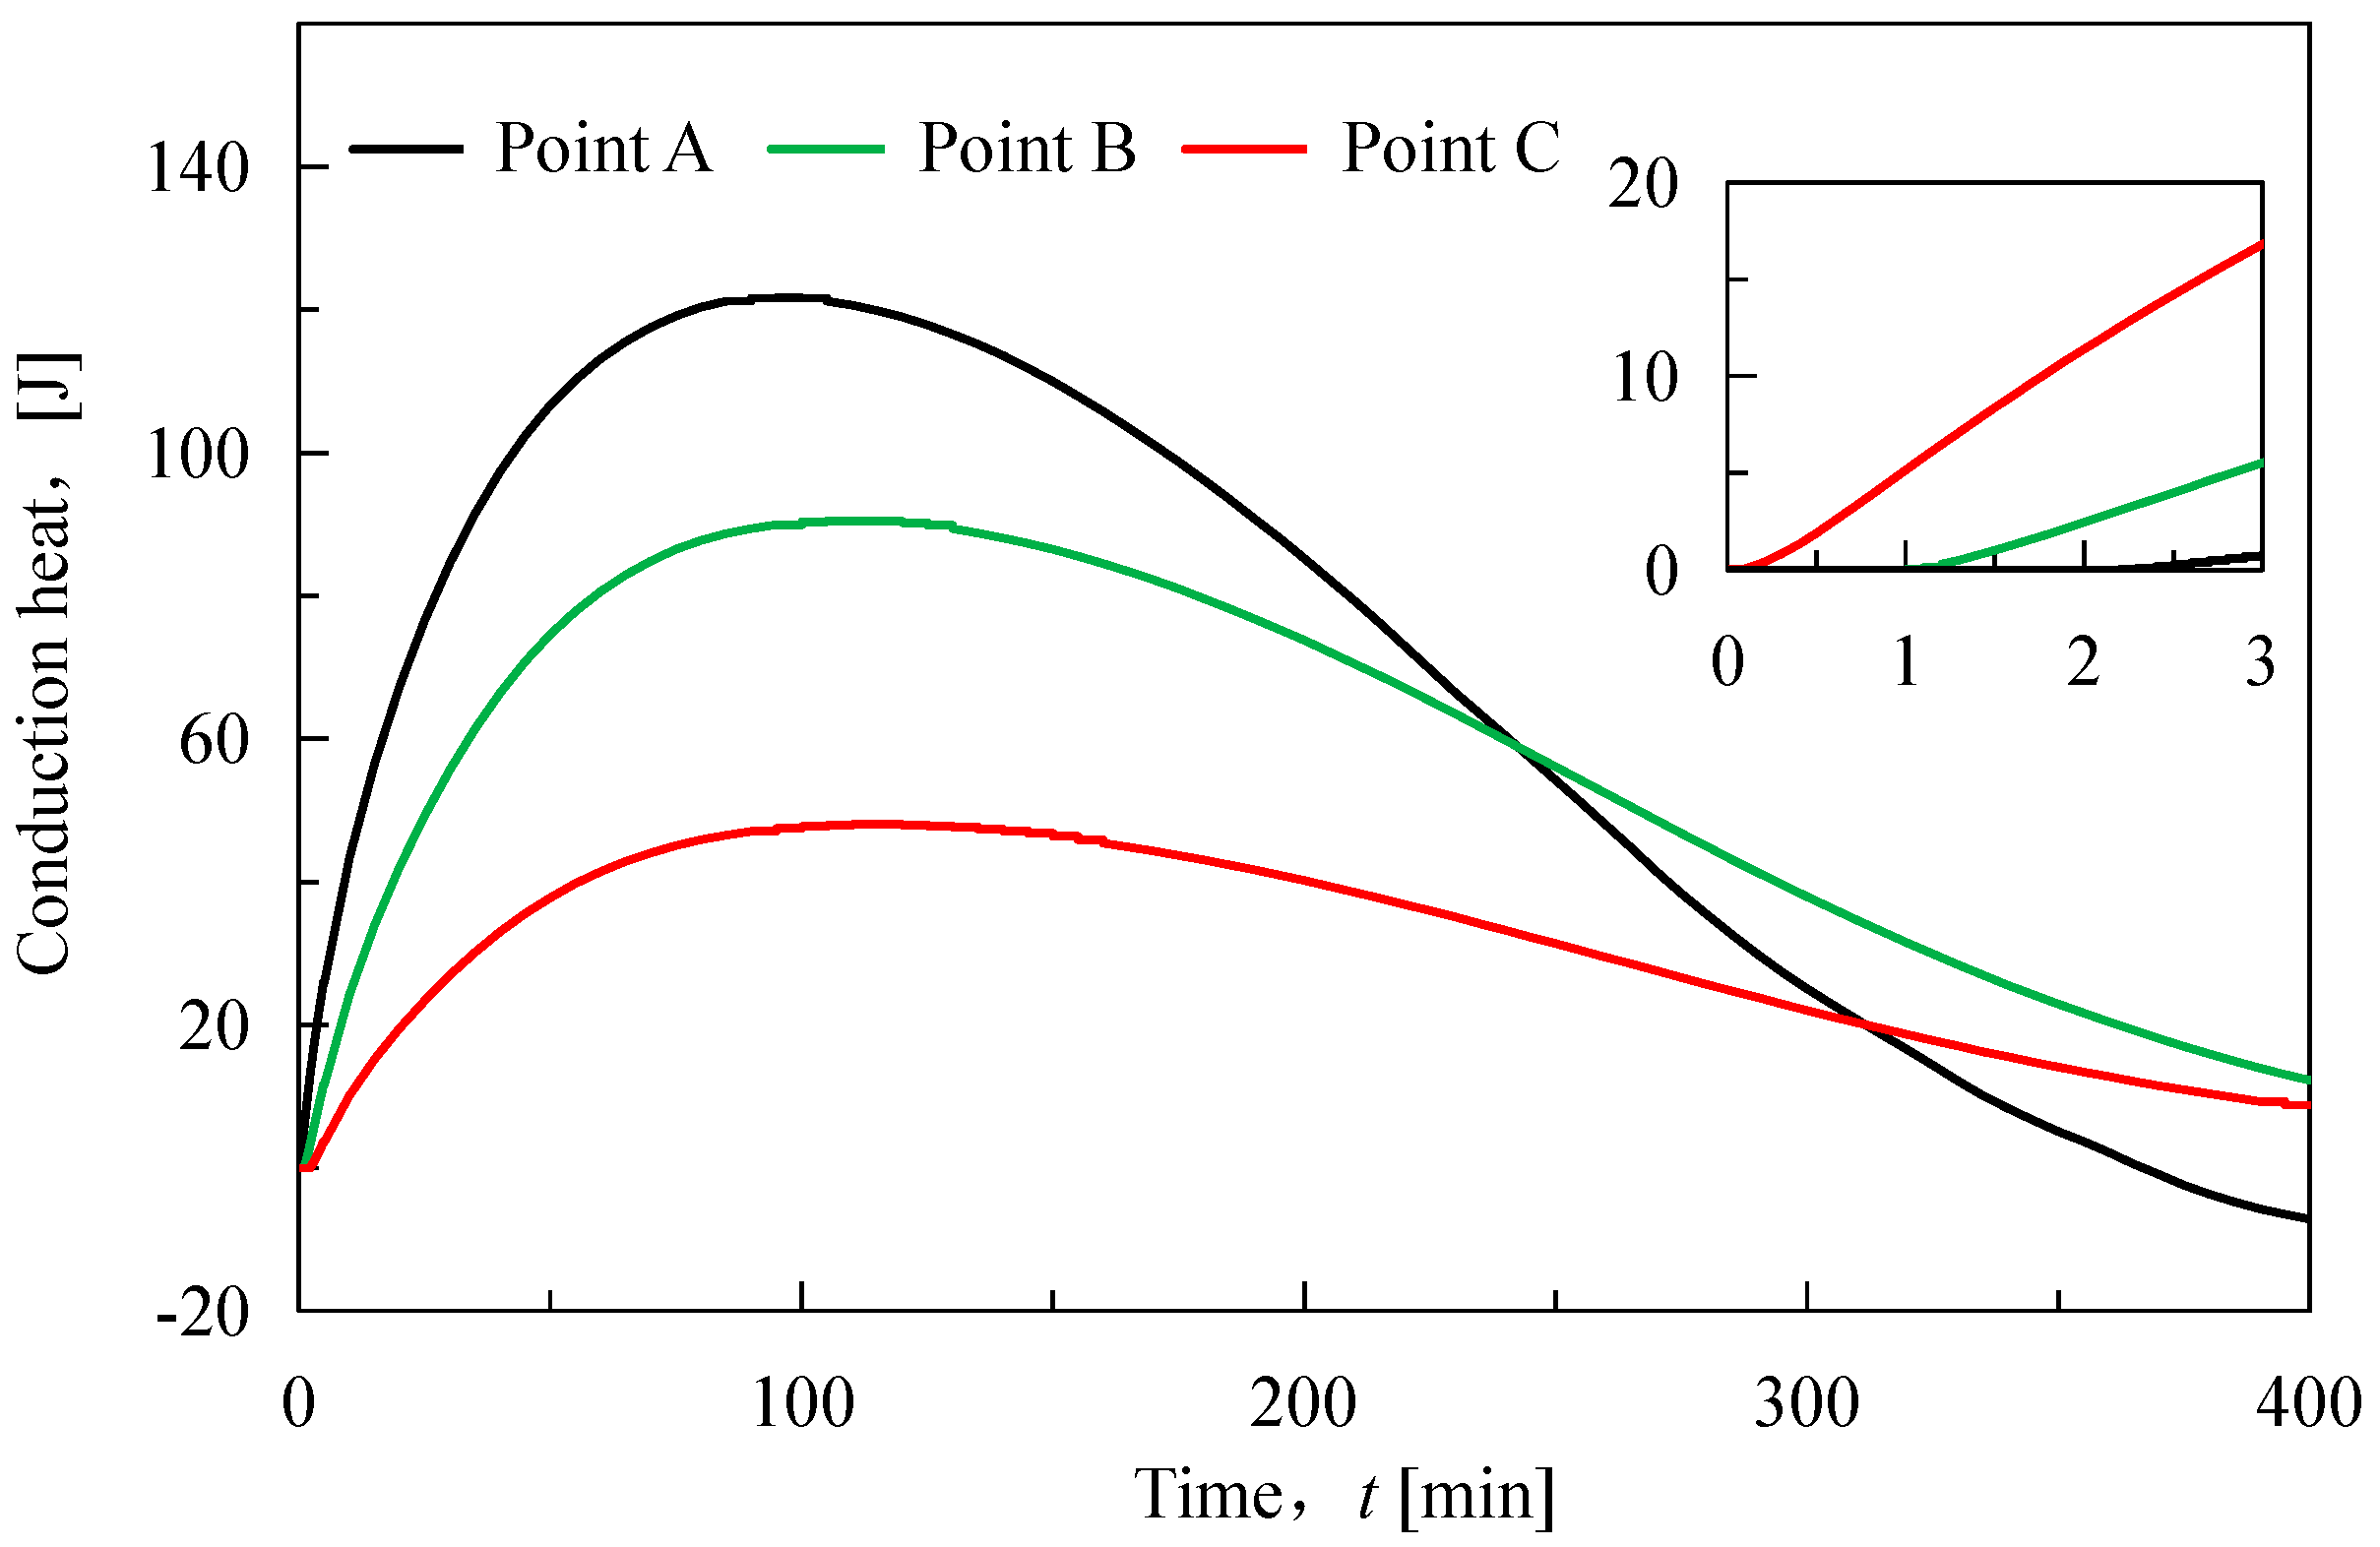
Figure 5.
Change of cumulative advection heat in the process of hydrate dissociation.
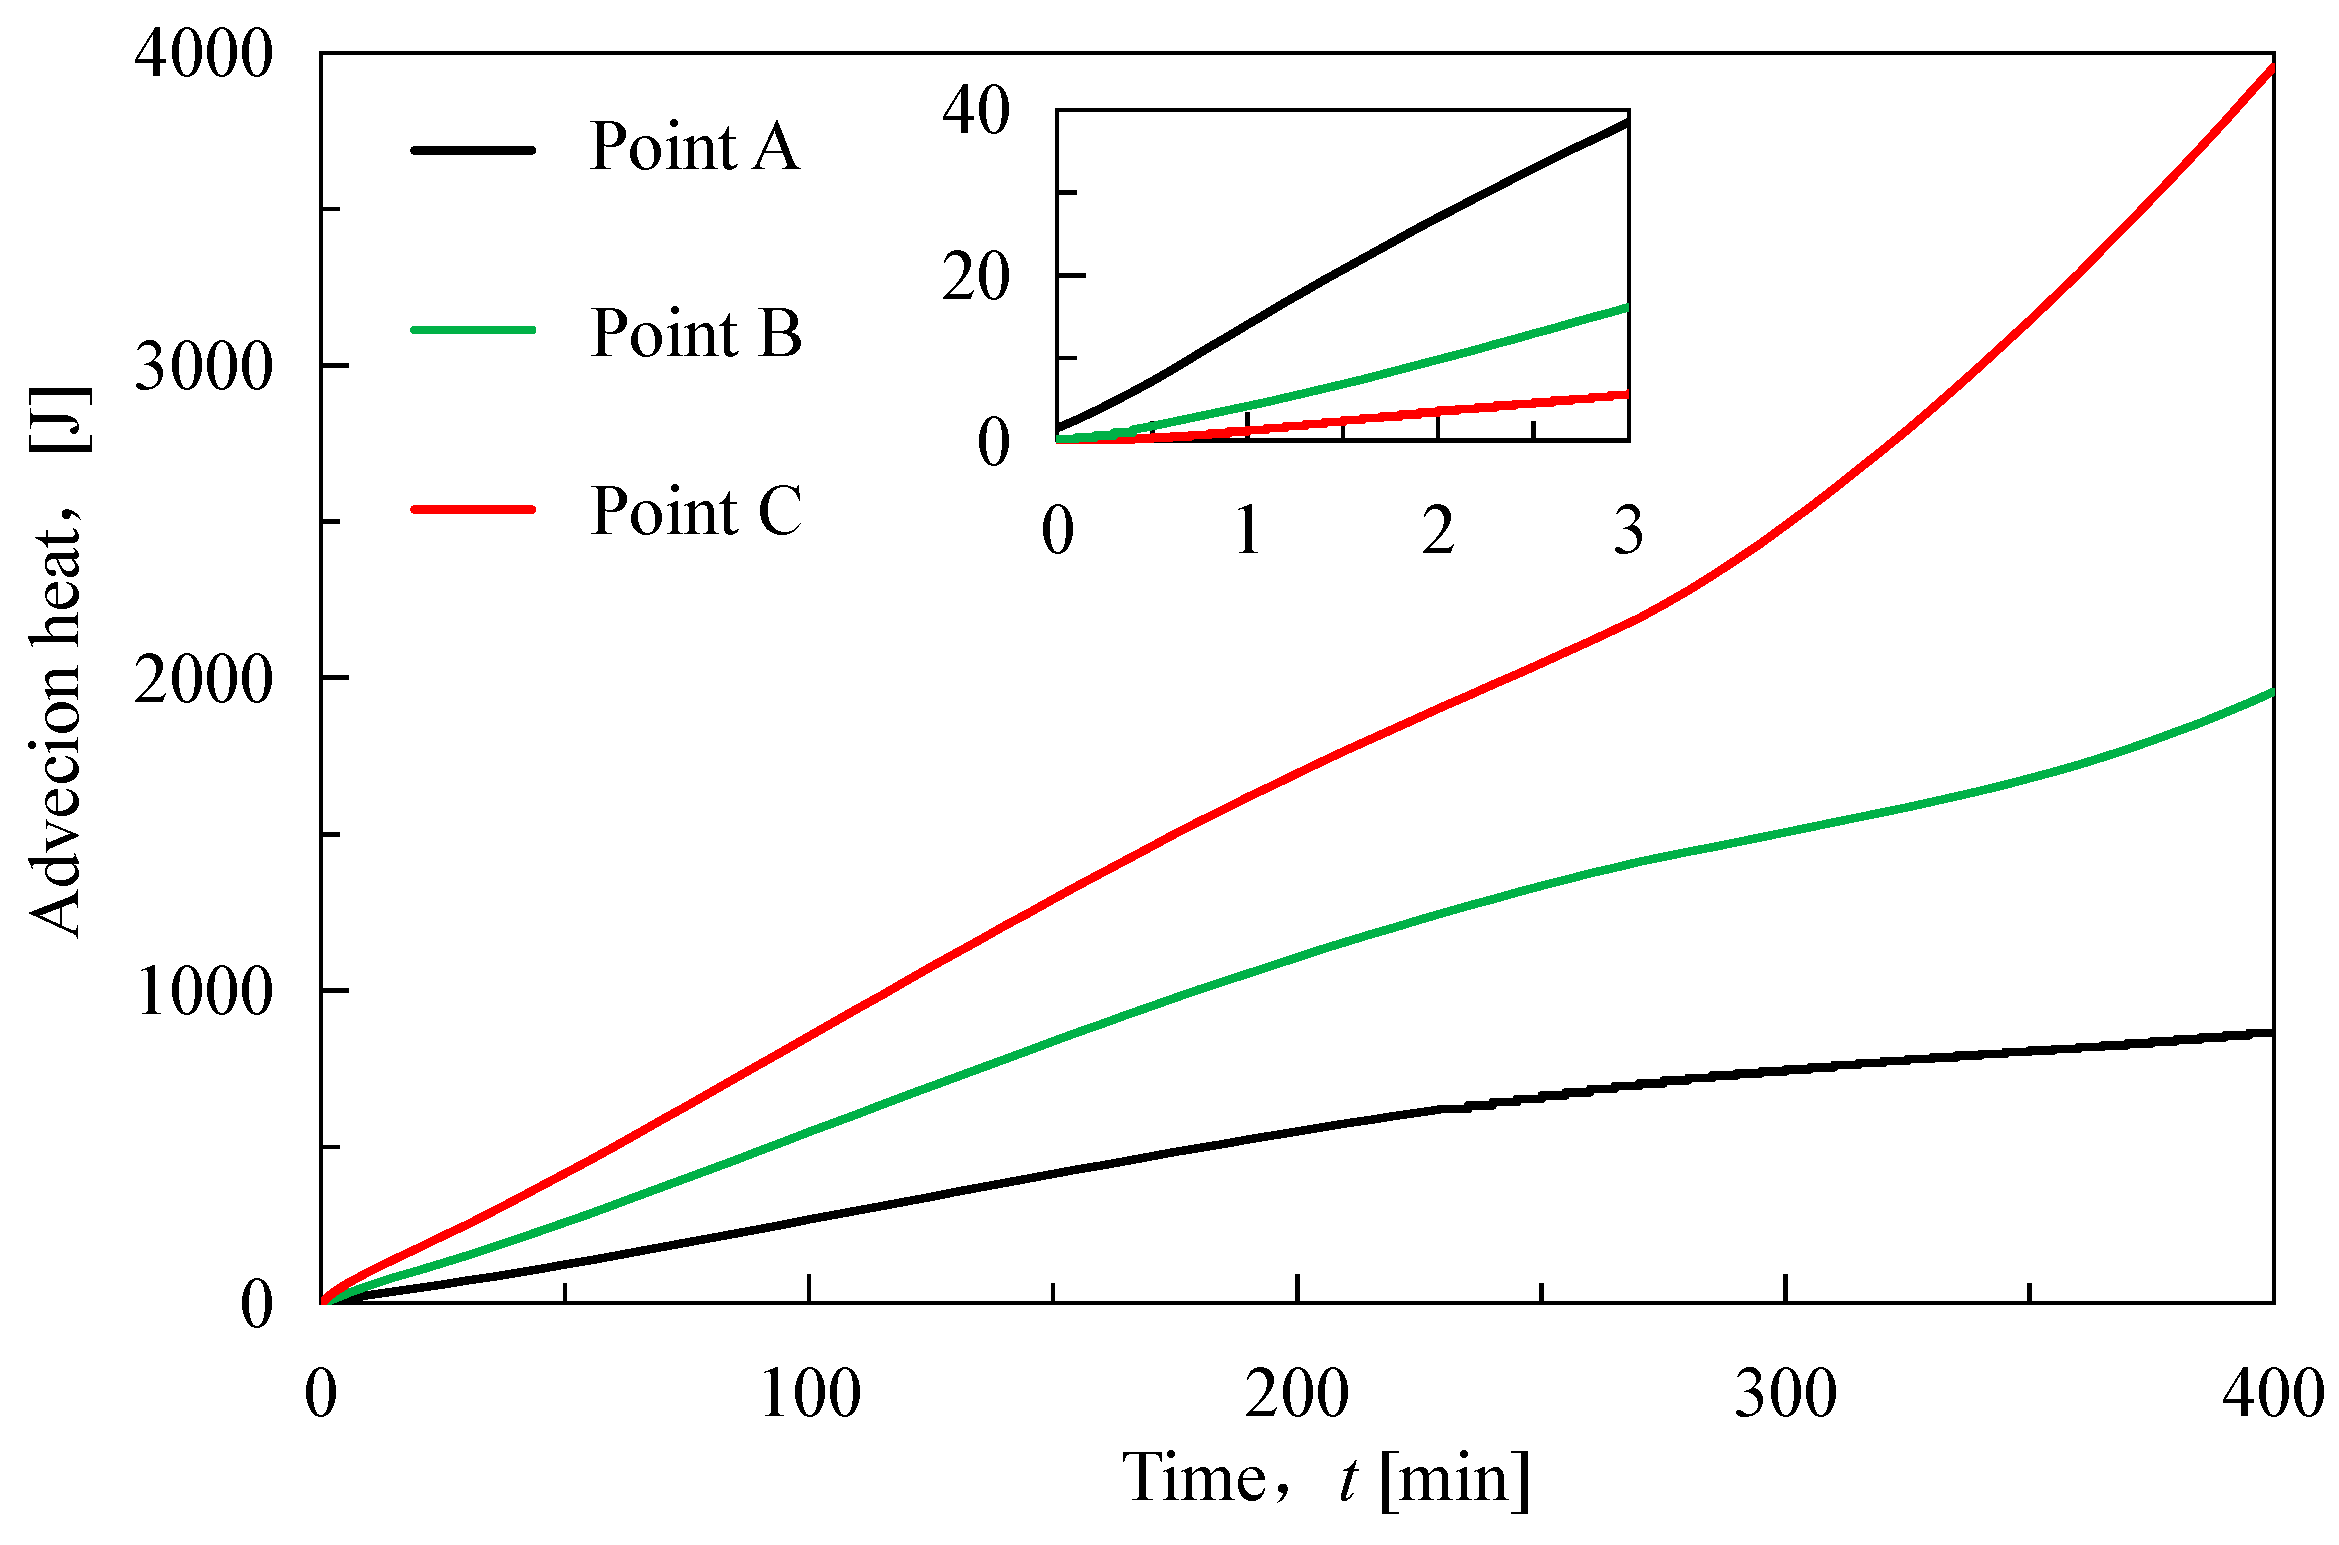
Figure 6.
Change of energy density caused by heat conduction in the process of hydrate dissociation.
Figure 6.
Change of energy density caused by heat conduction in the process of hydrate dissociation.
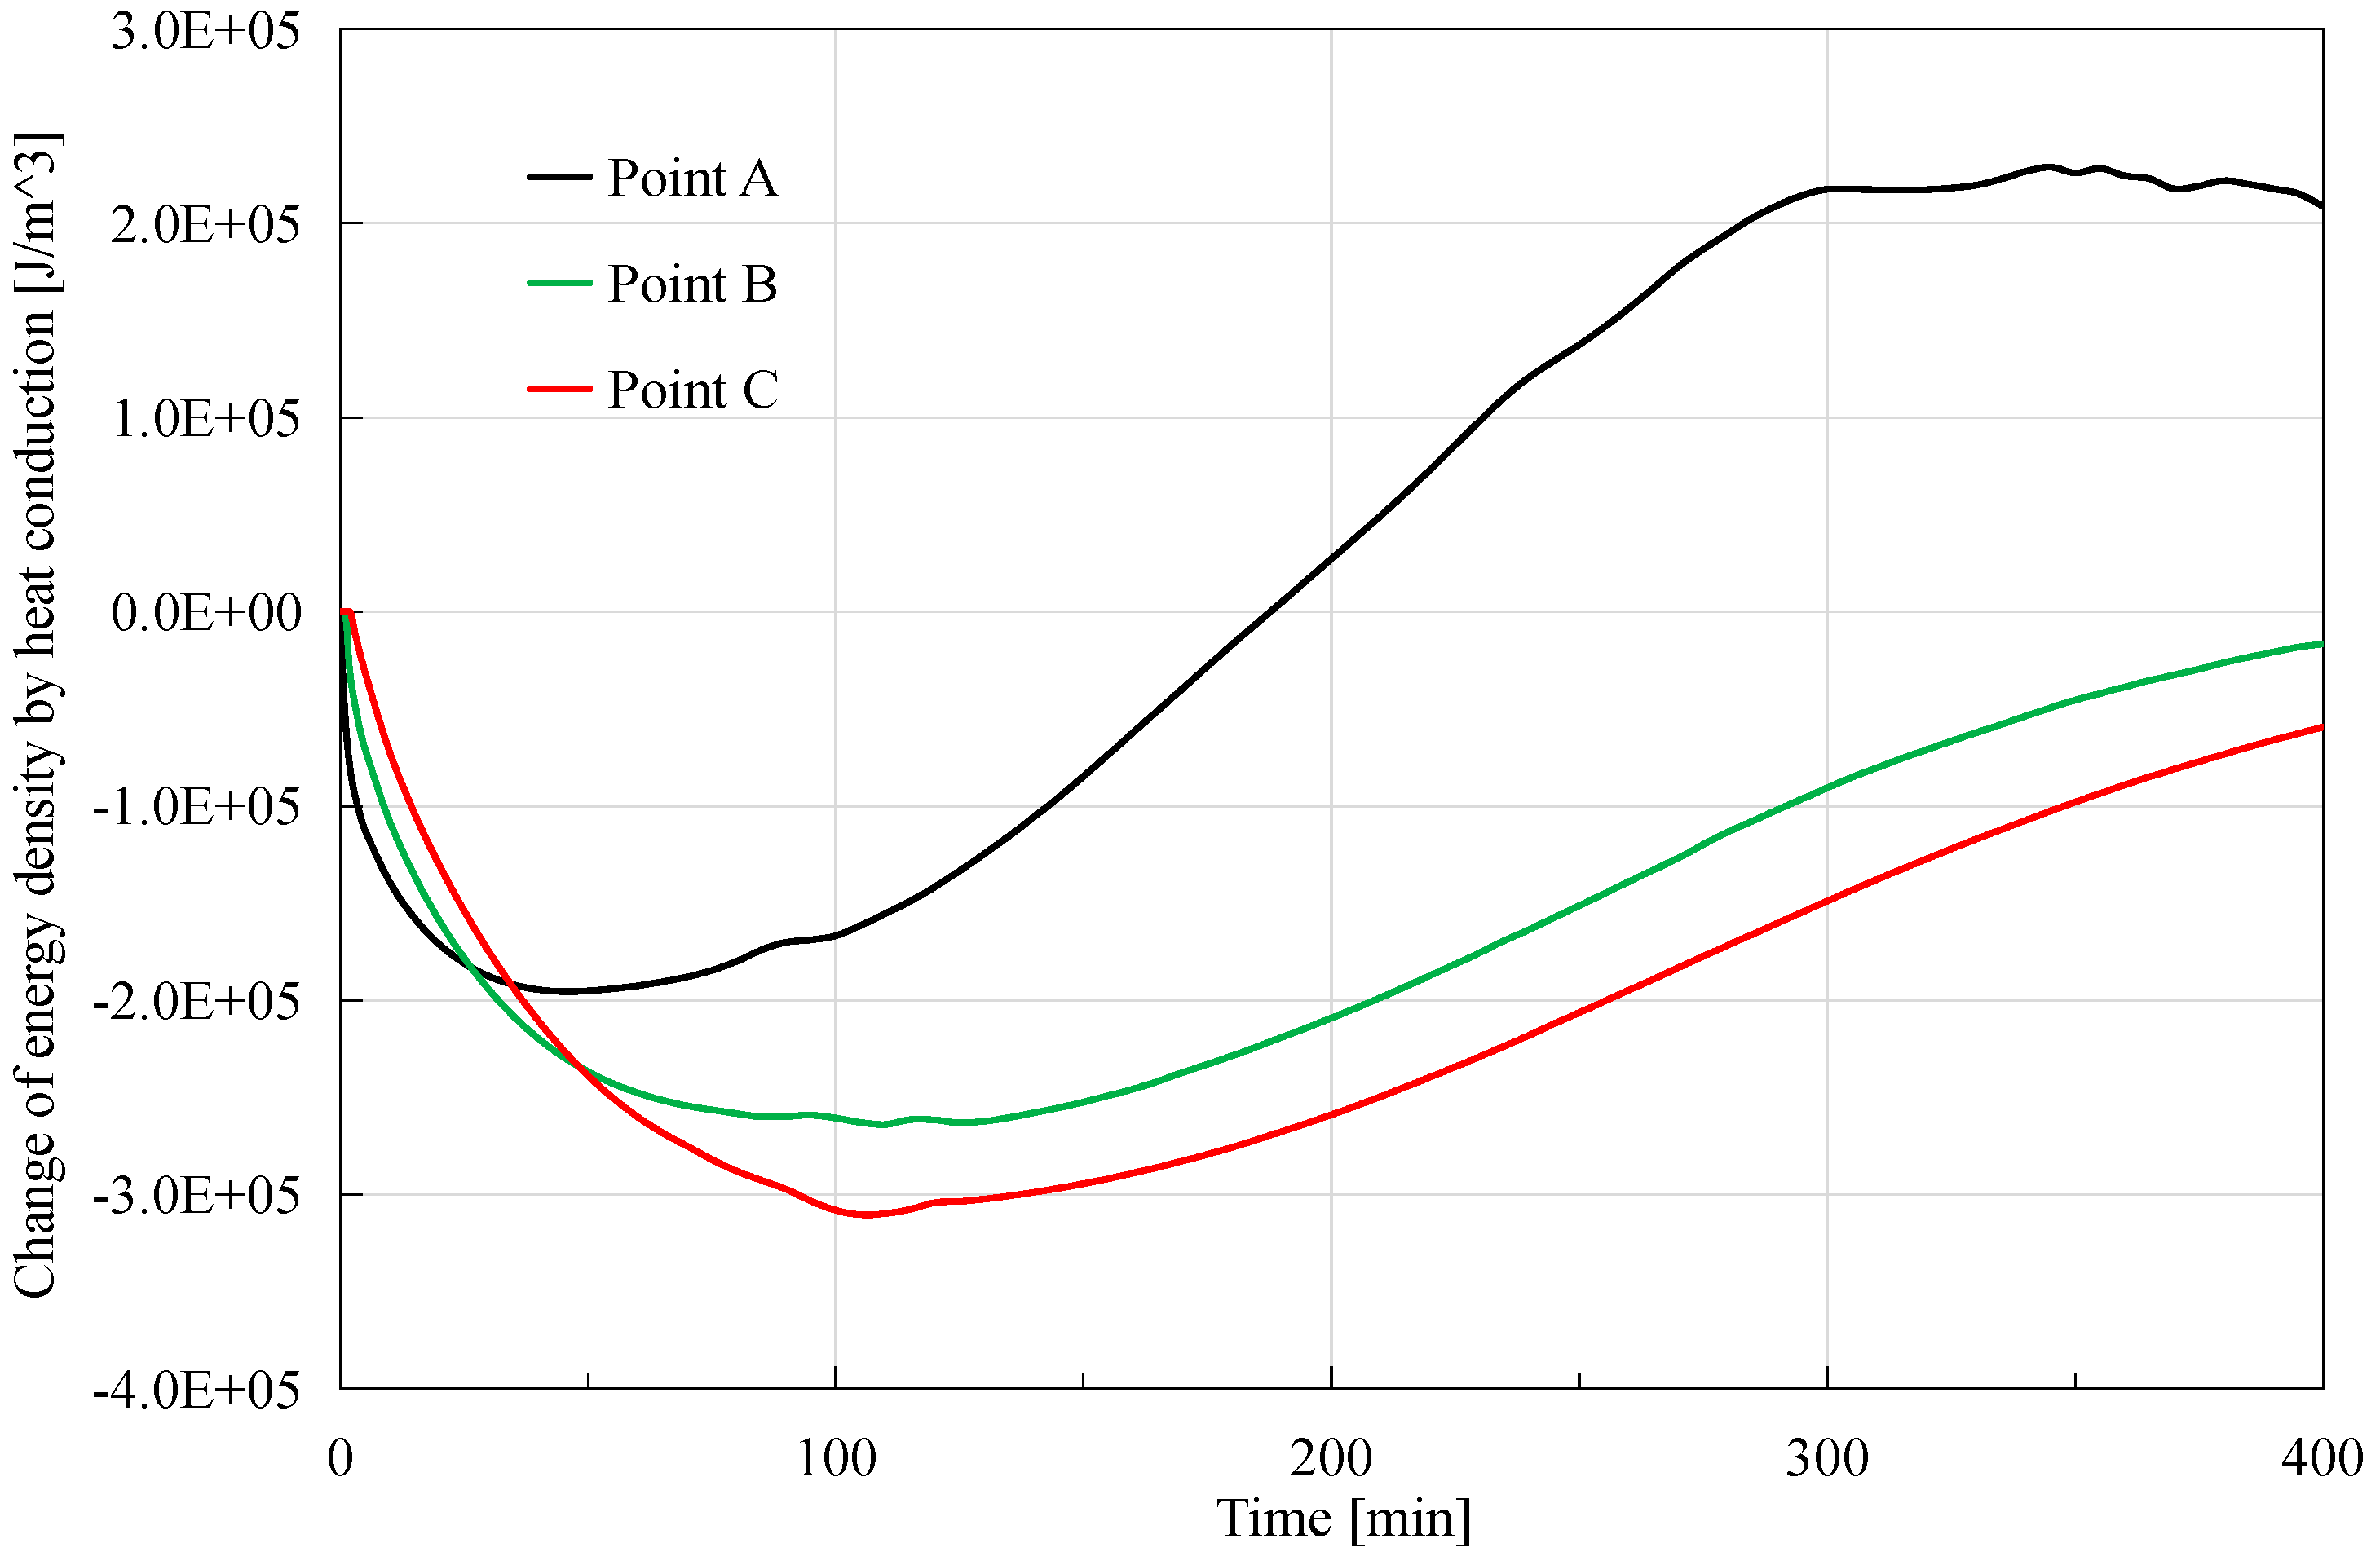
Figure 7.
Change of energy density caused by heat advection in the process of hydrate dissociation.
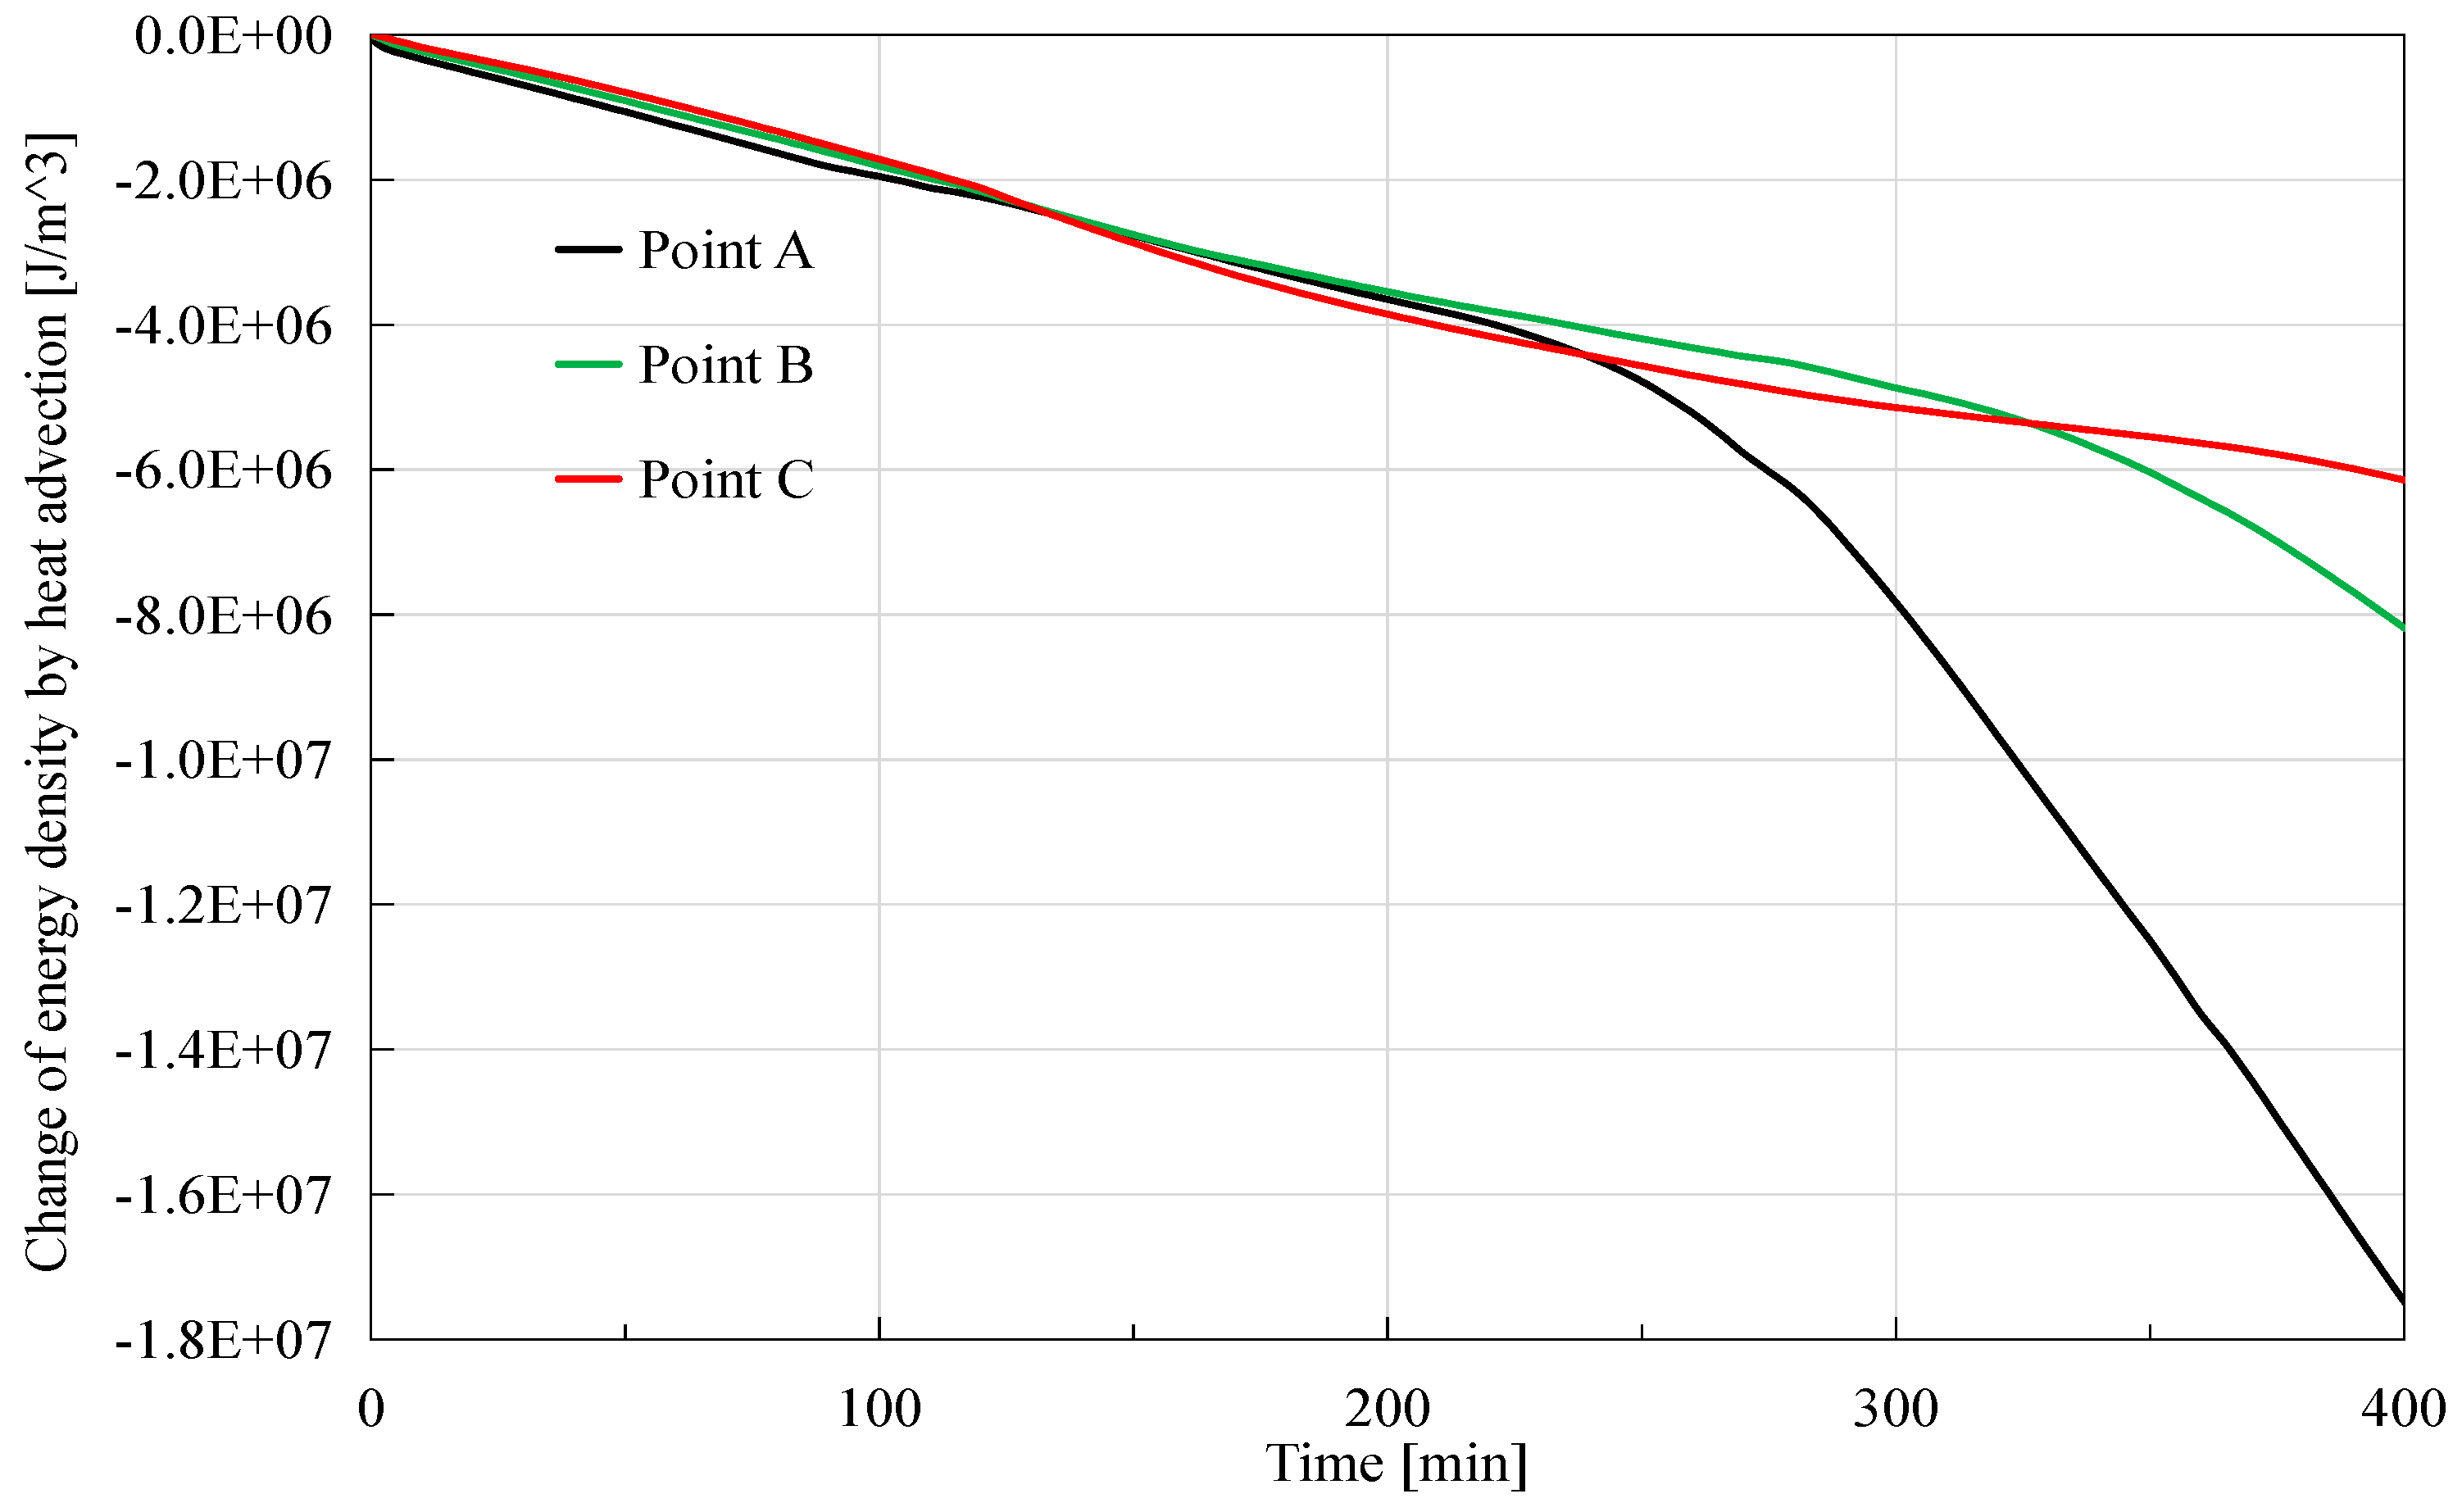
Figure 8.
Change of energy density caused by external heat source in the process of hydrate dissociation.
Figure 8.
Change of energy density caused by external heat source in the process of hydrate dissociation.
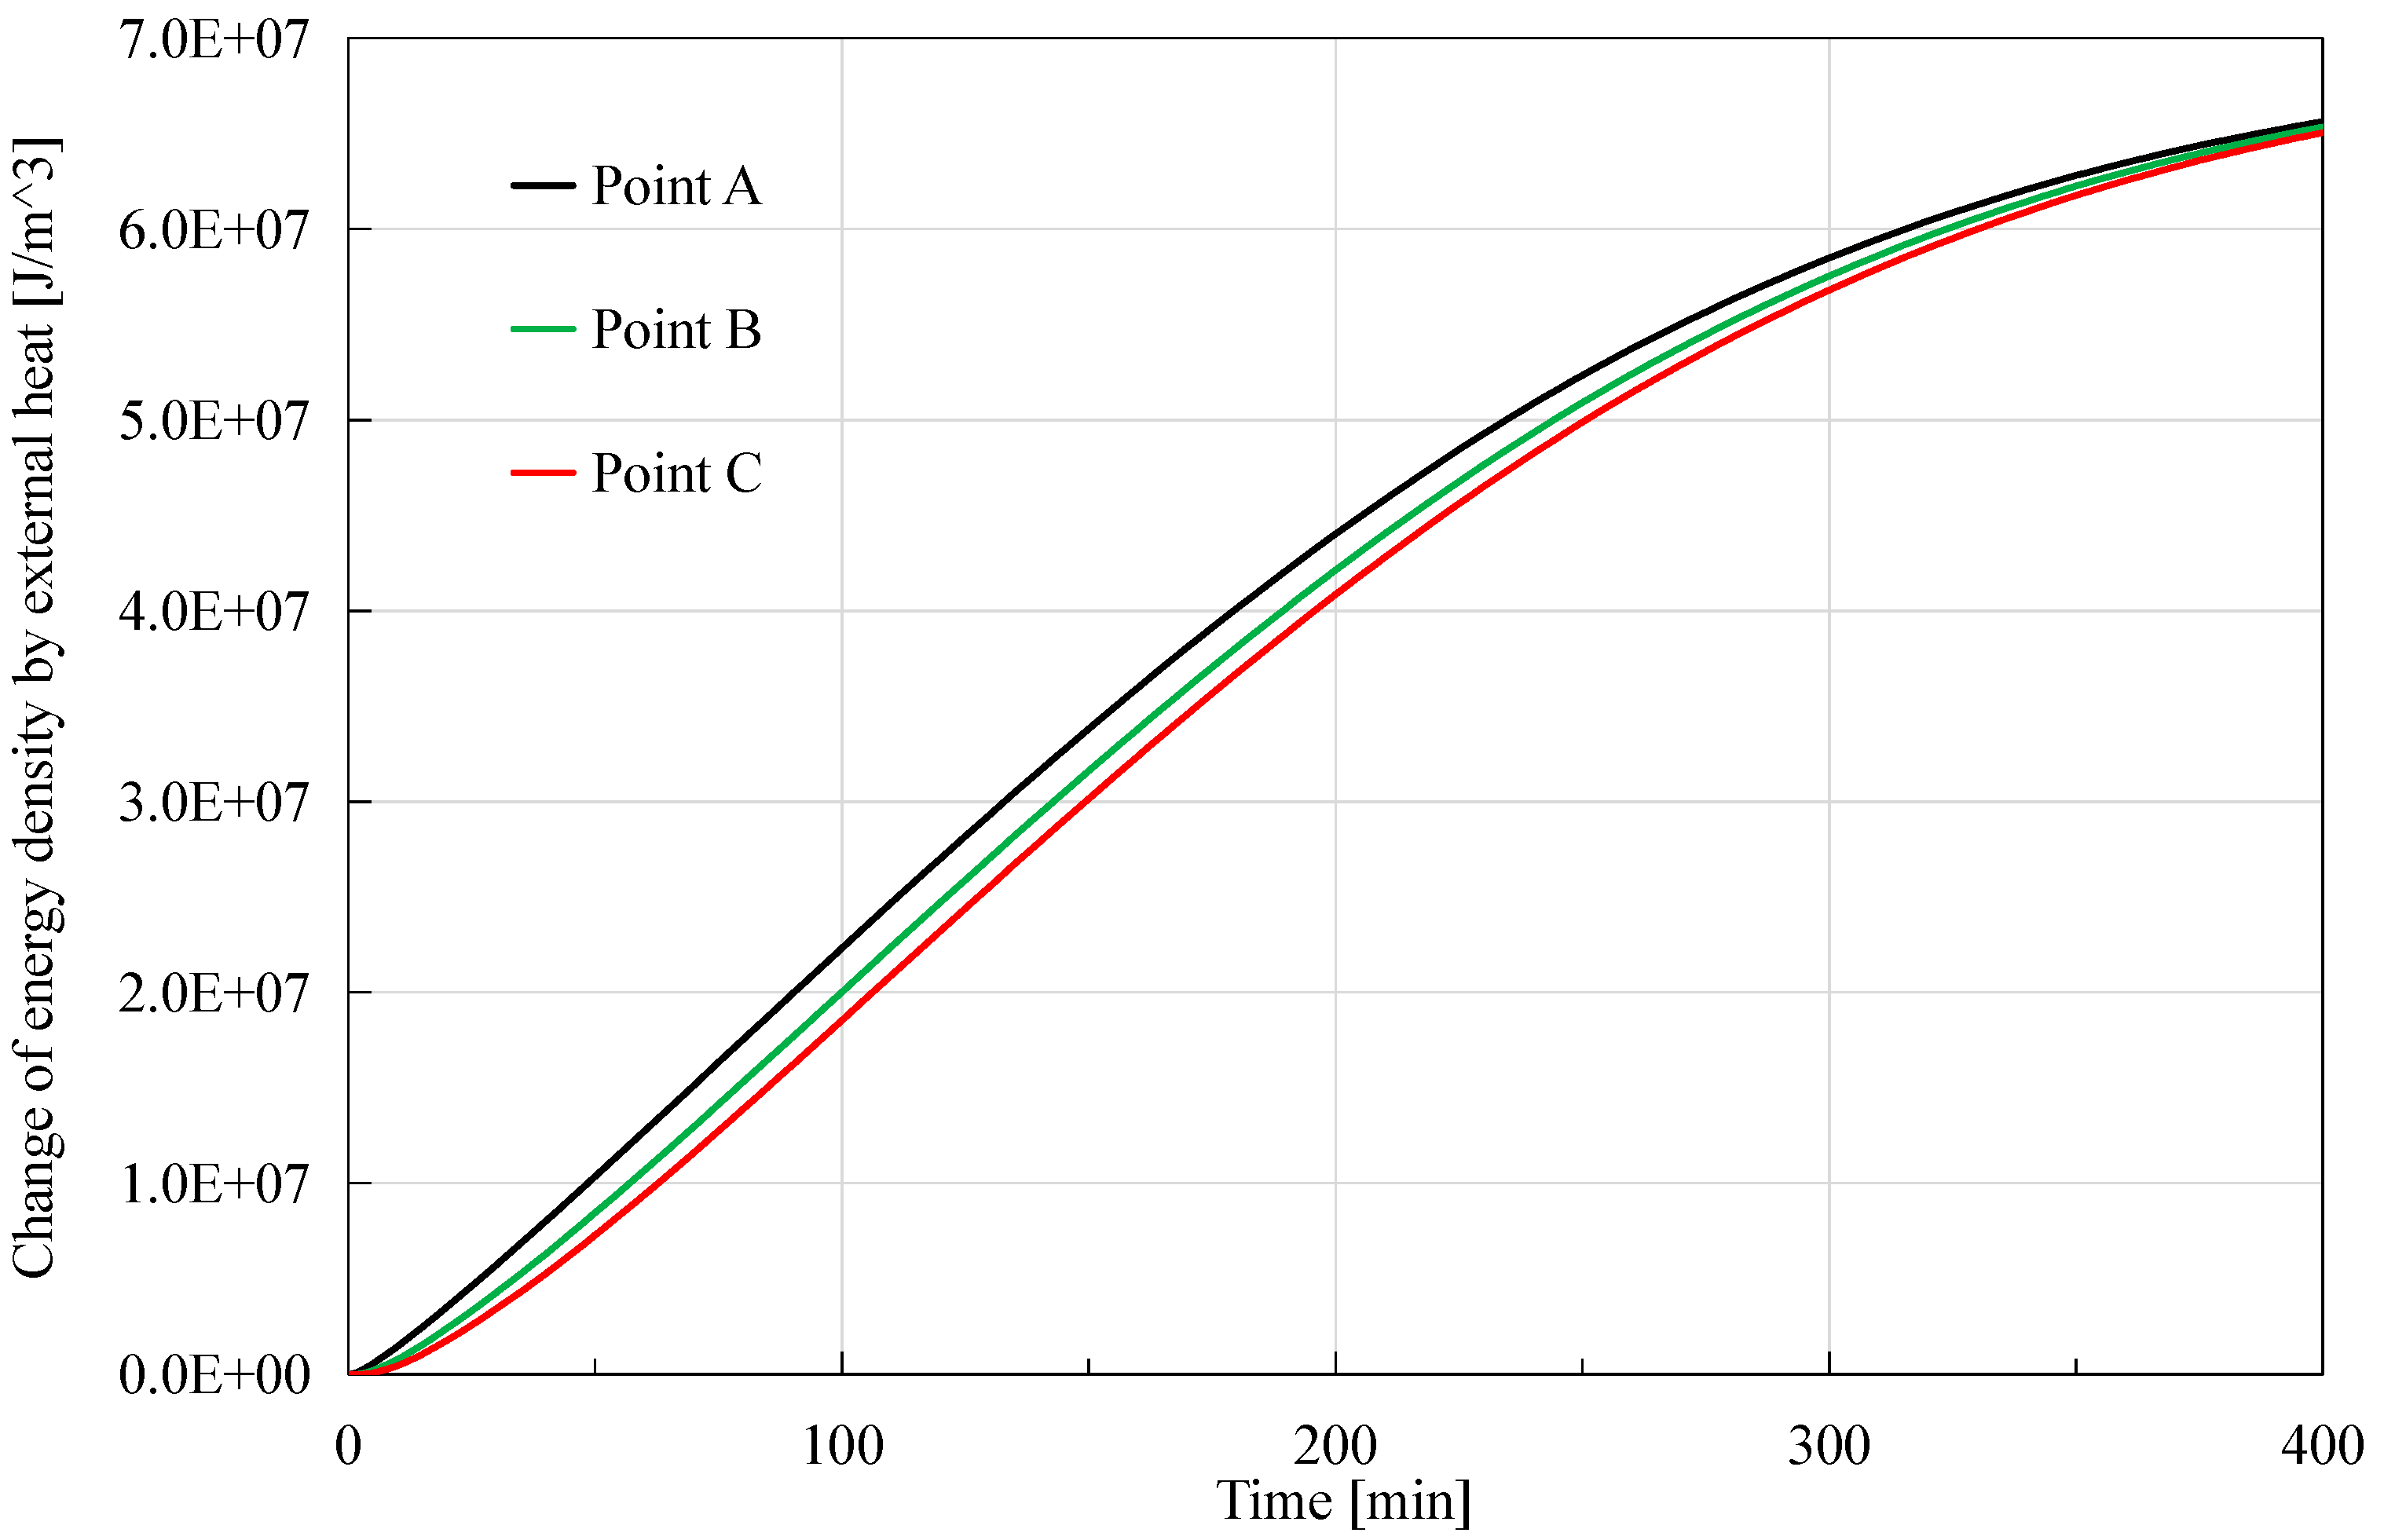
Figure 9.
Change of energy density caused by phase change in the process of hydrate dissociation.
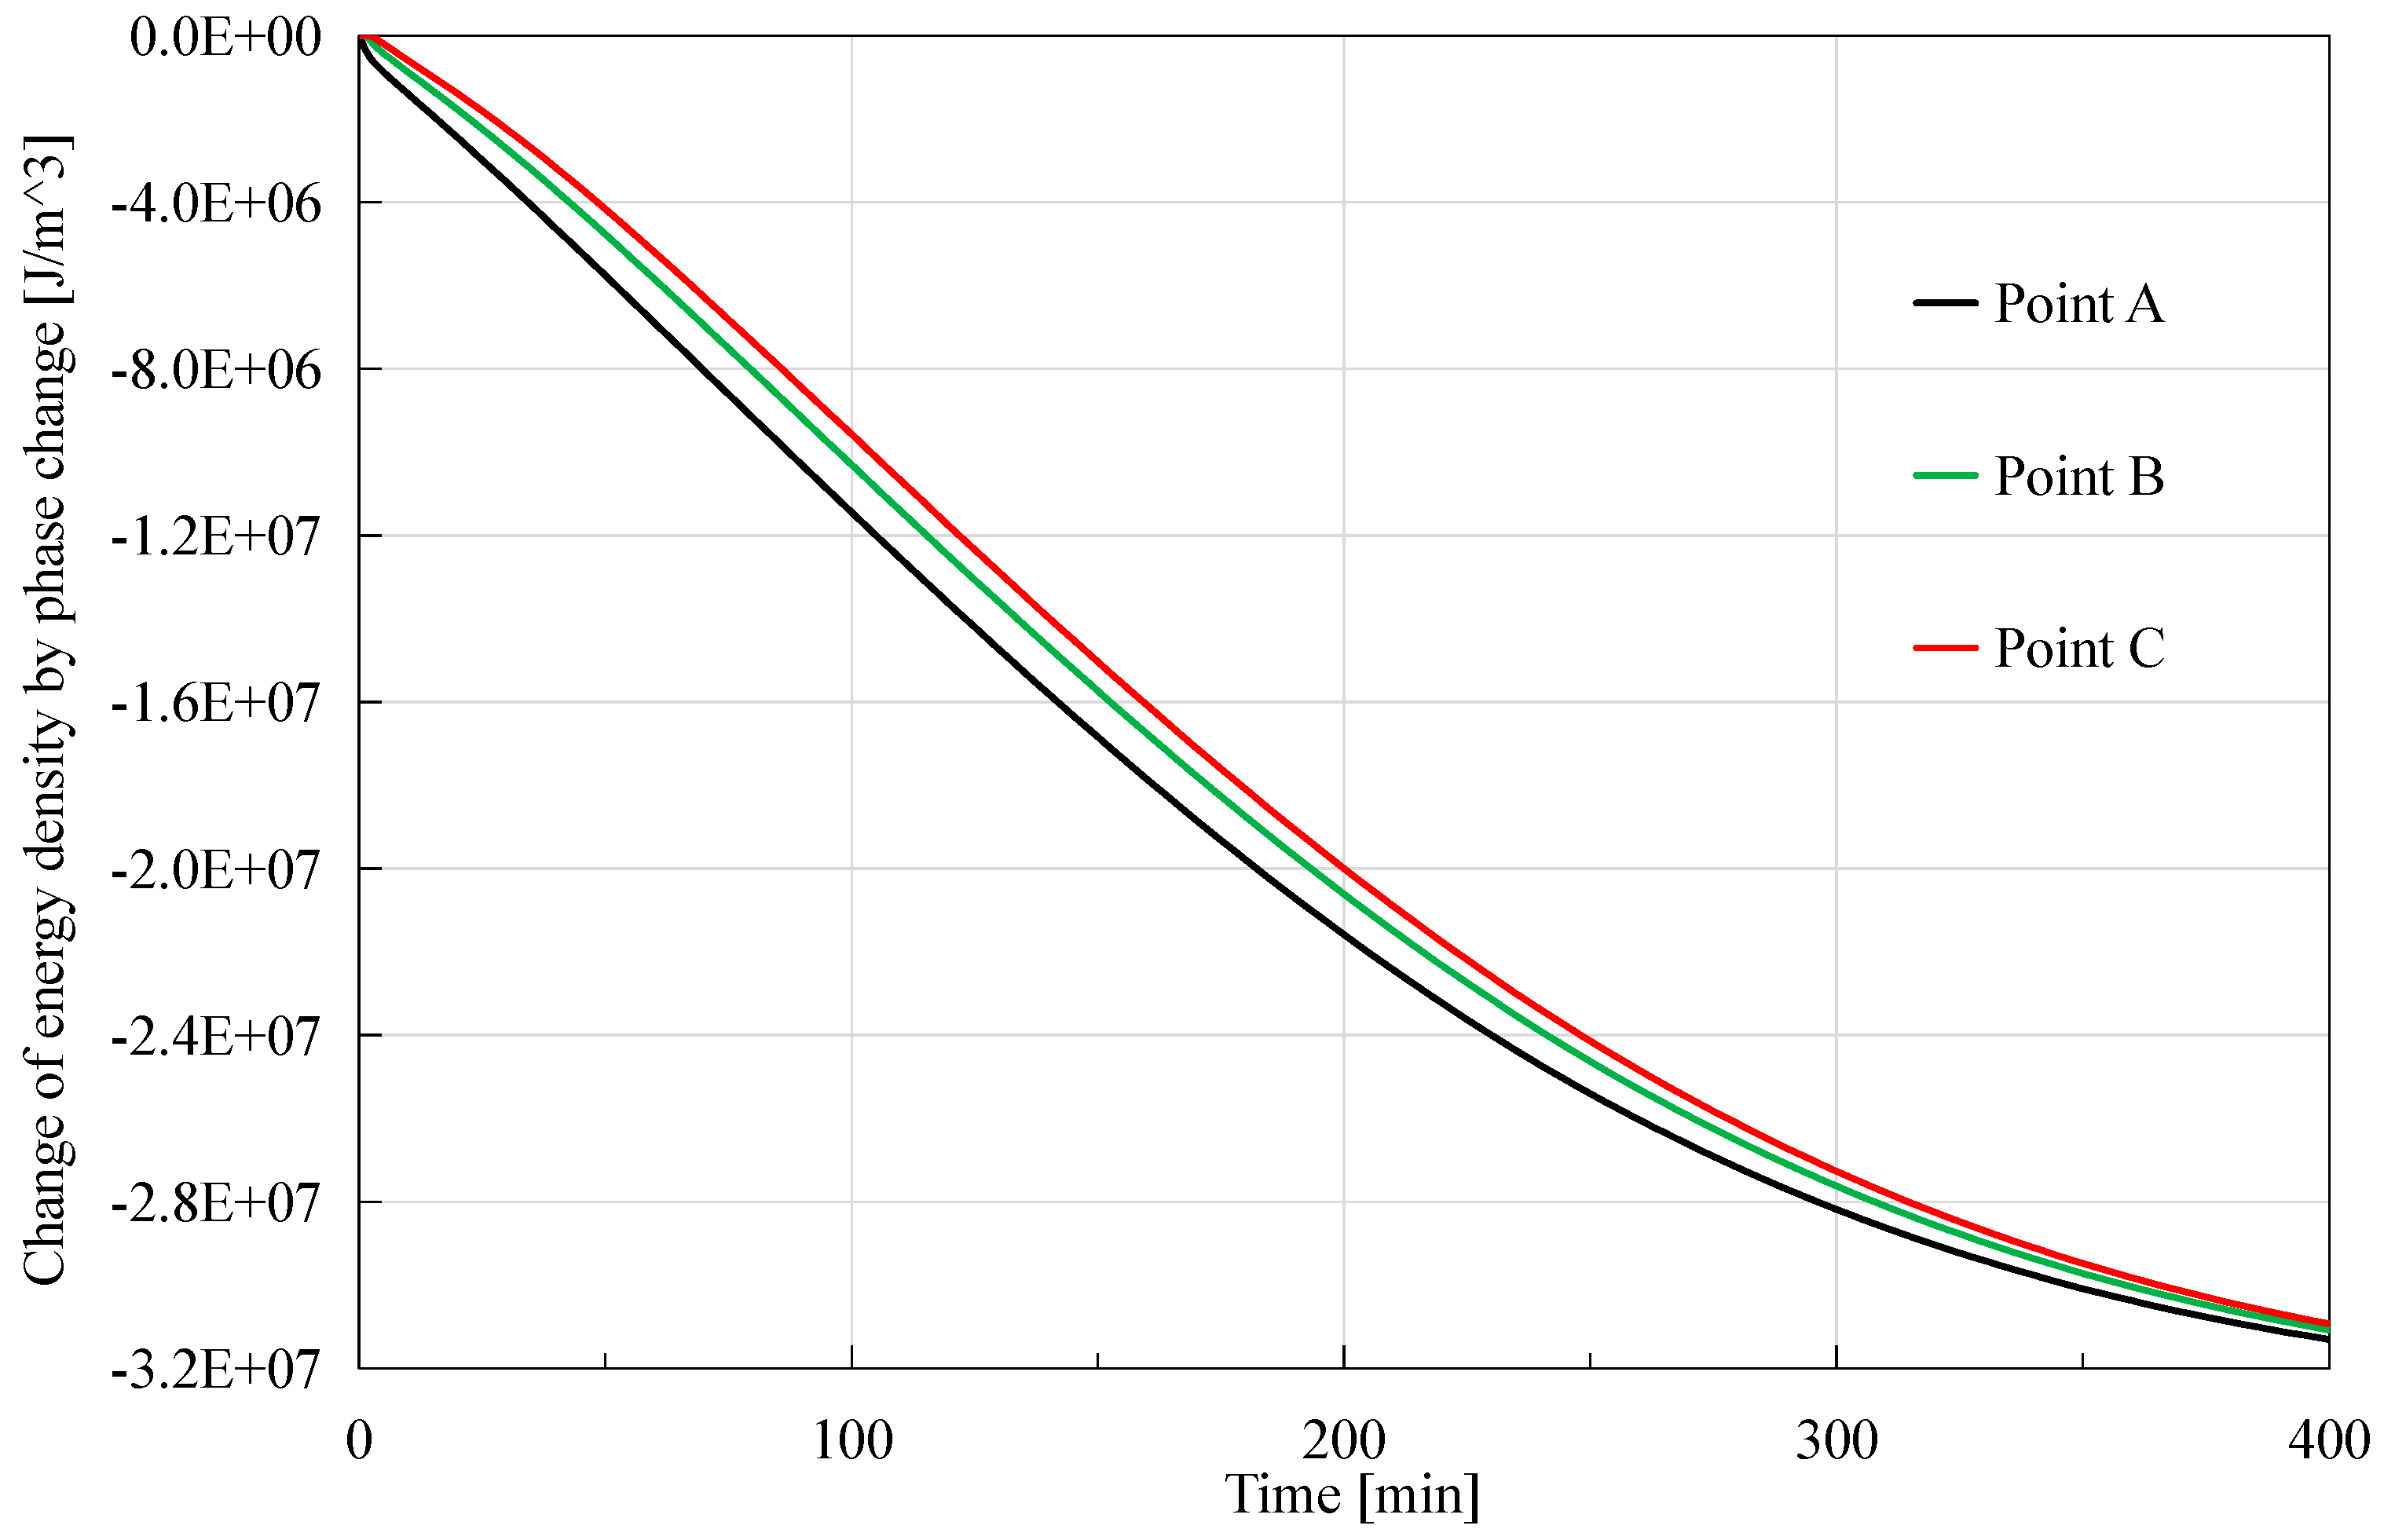
Figure 10.
Change of energy density caused by different factors at the center of the investigated core.
Figure 10.
Change of energy density caused by different factors at the center of the investigated core.
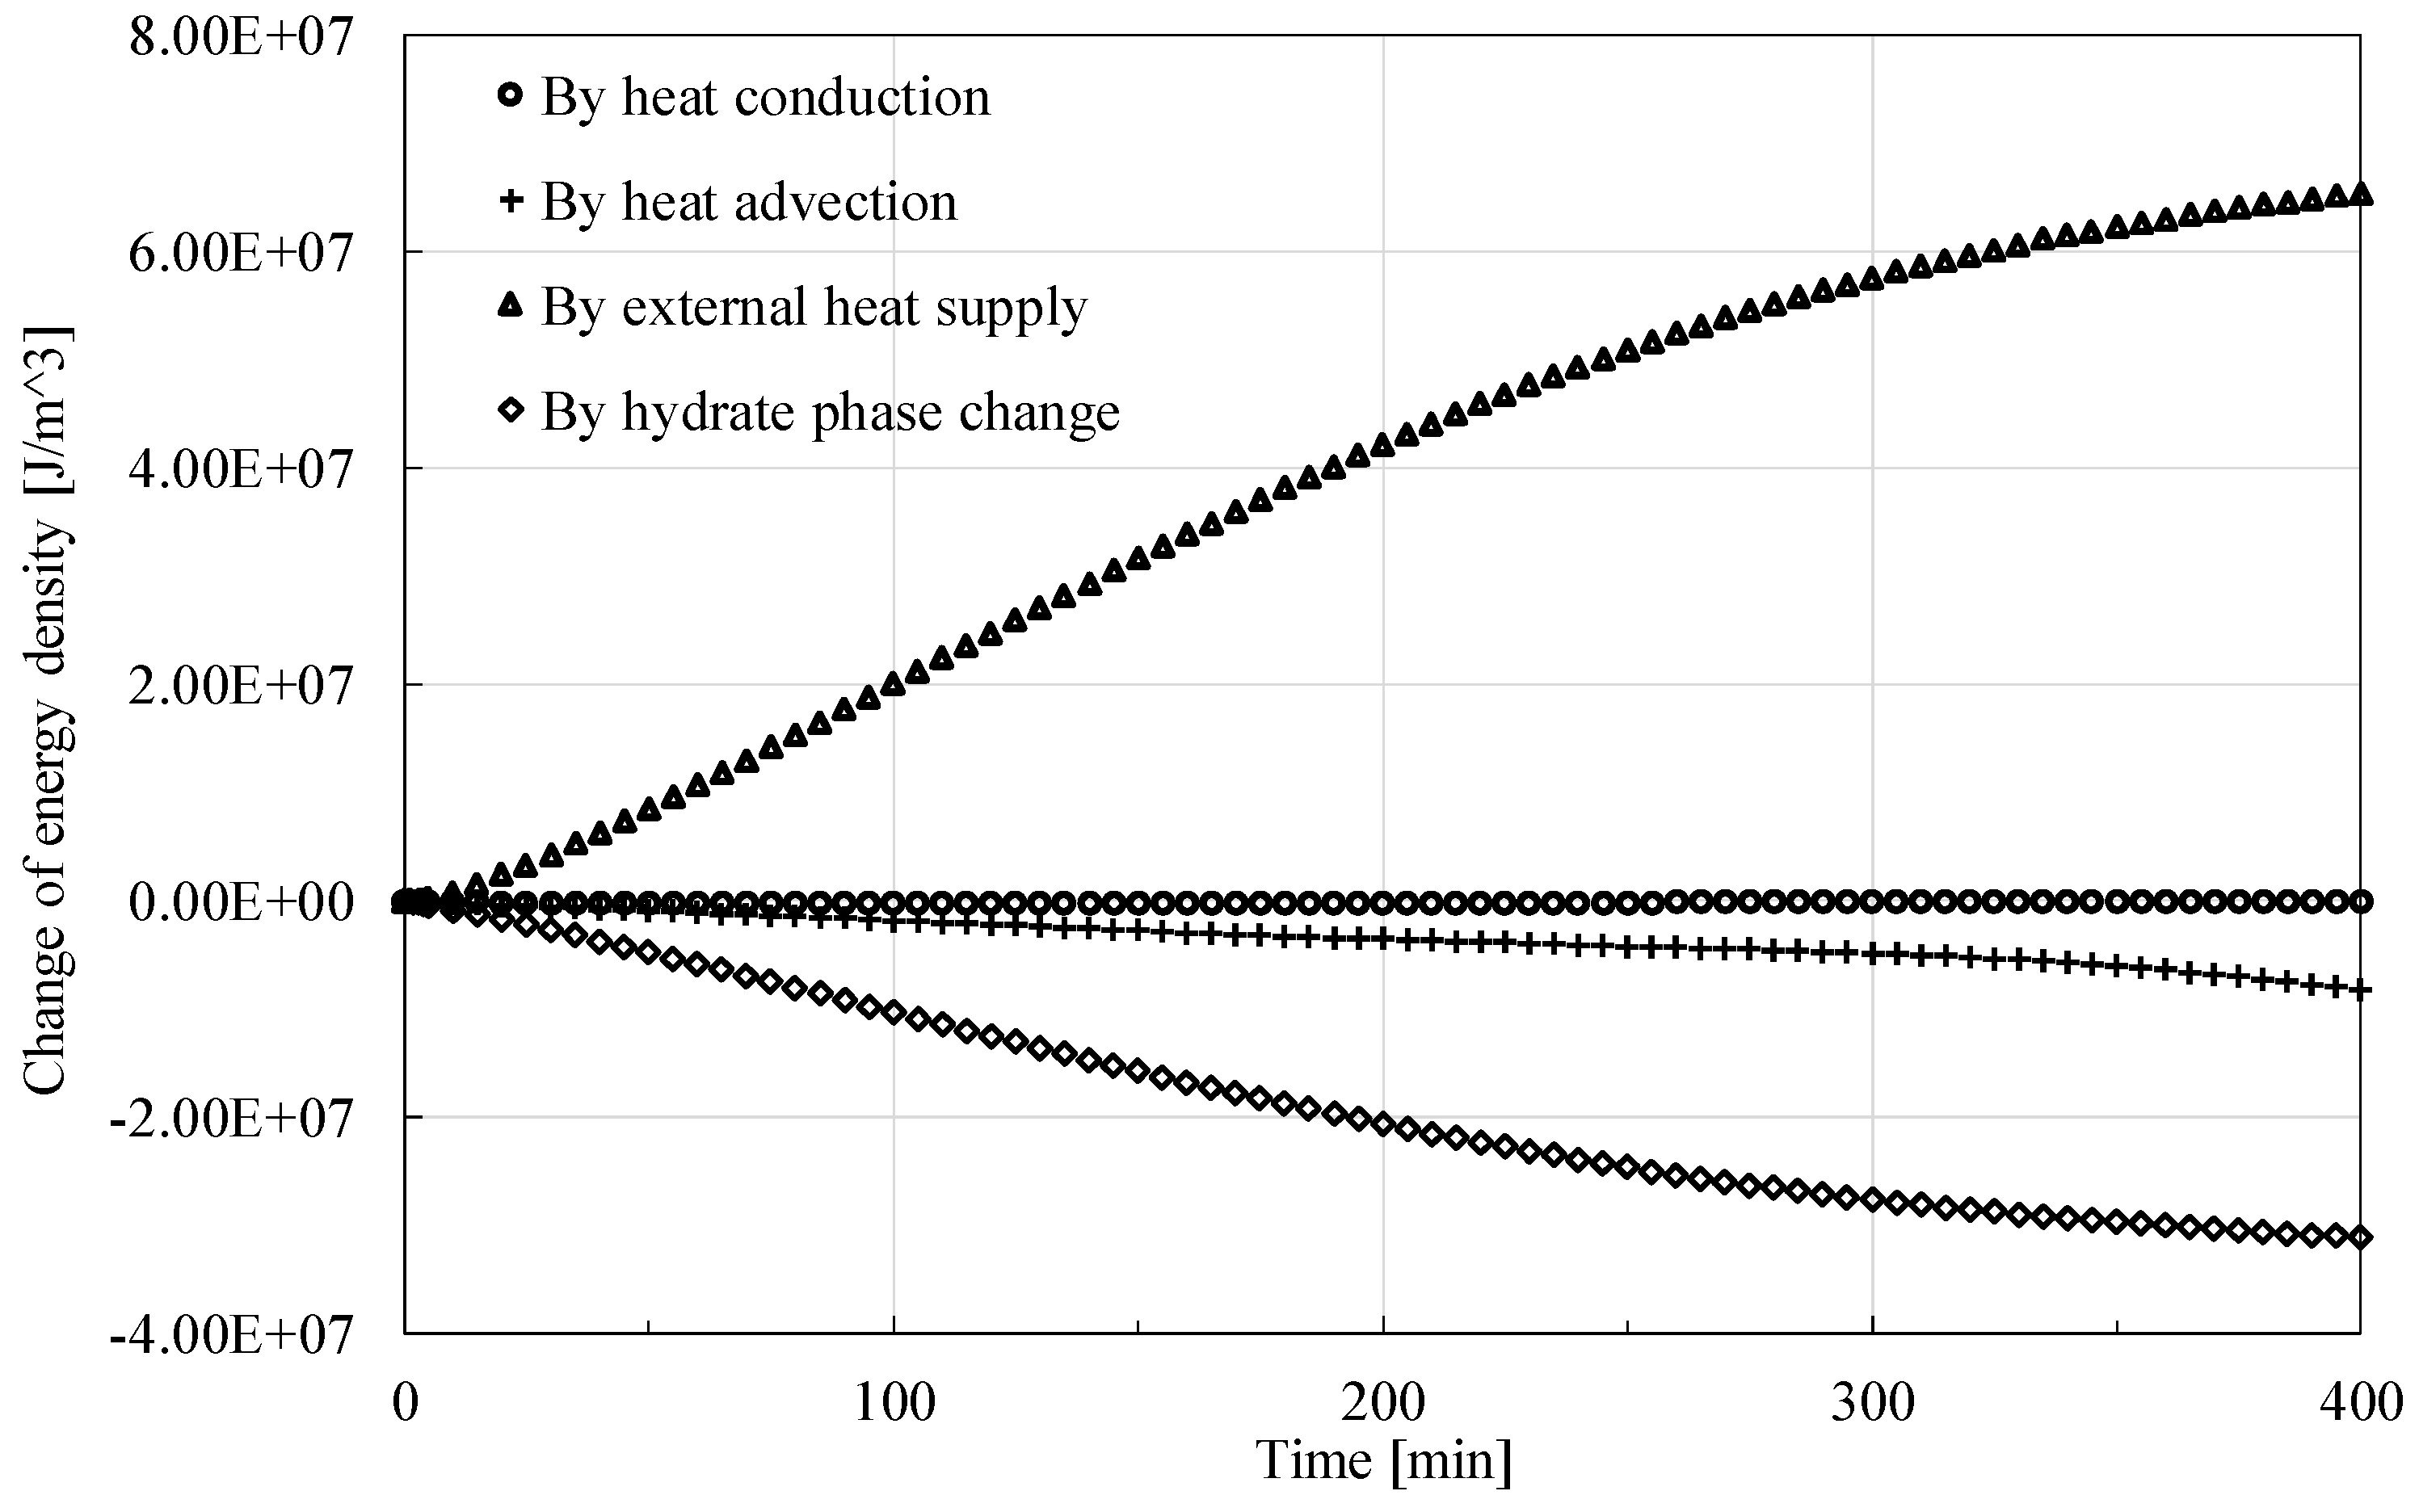
Figure 11.
Change rate of energy density caused by different factors at the center of the investigated core.
Figure 11.
Change rate of energy density caused by different factors at the center of the investigated core.
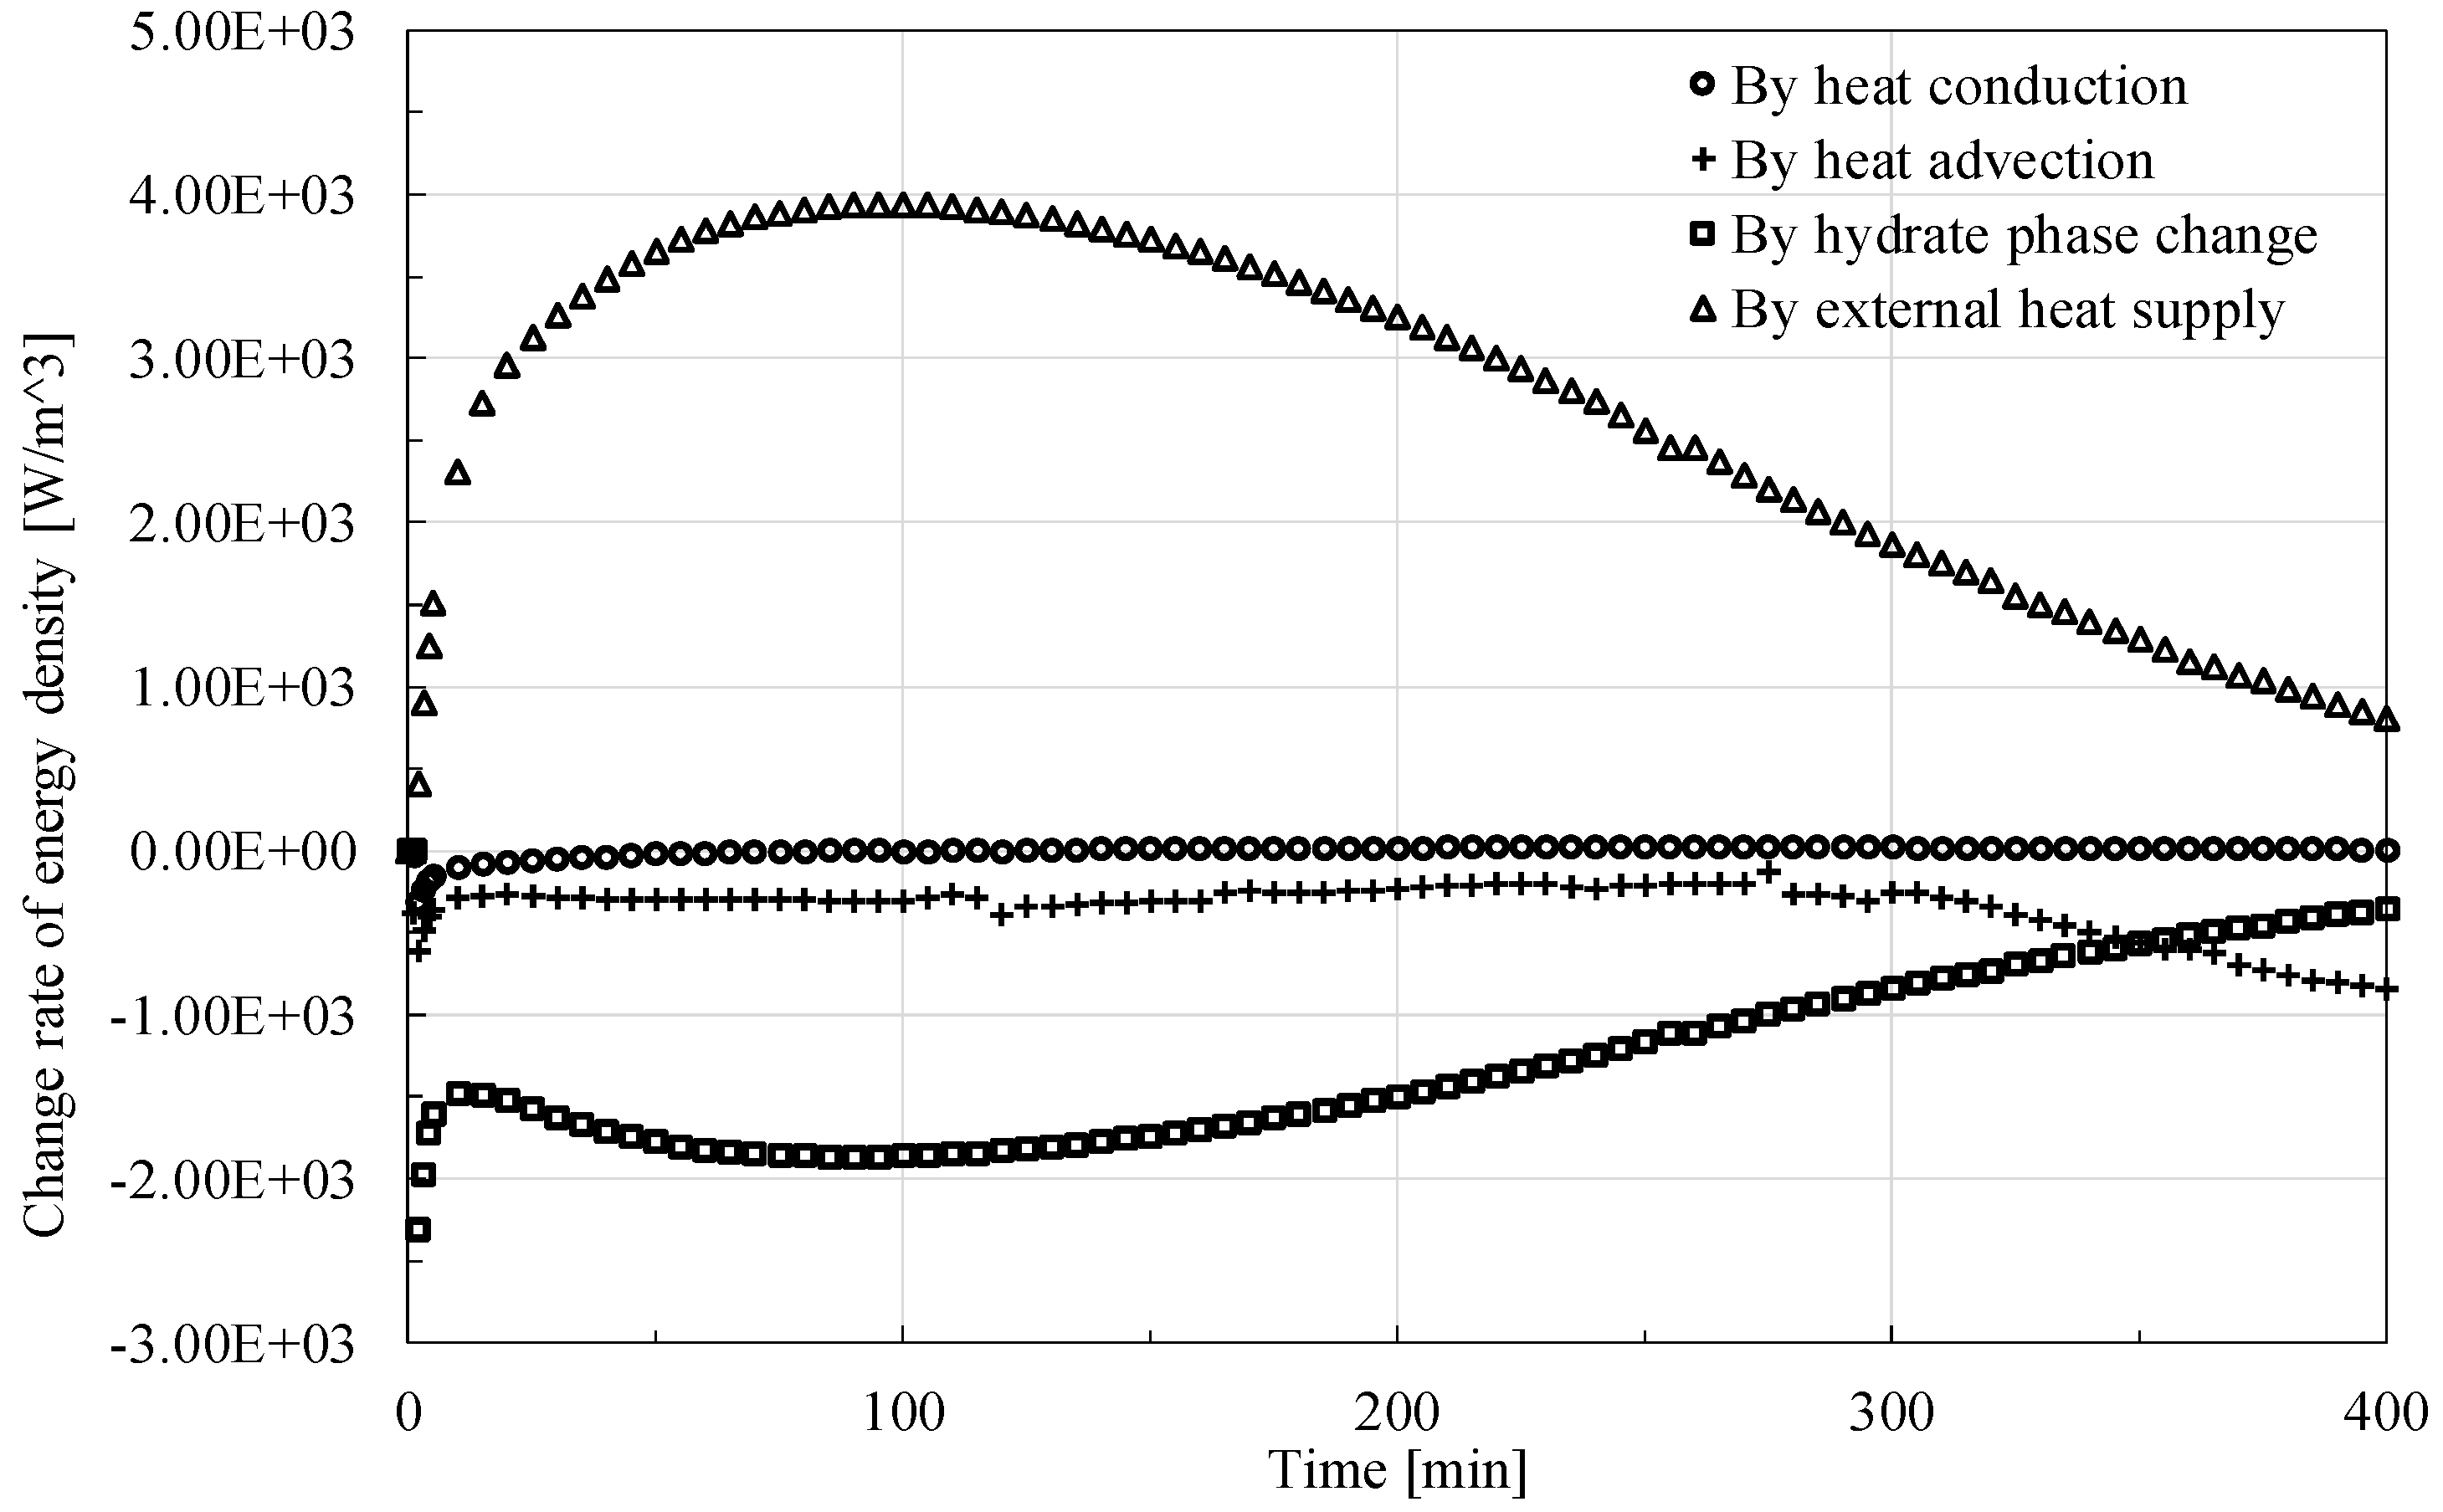

Table 1.
Modelling approaches for hydrate dissociation under framework of continuum mechanics.
| Phenomena | Governing laws | Auxiliary relations |
| Phase change | Mass conservation | Kinetic model for hydrate dissociation rate |
| Water flow | Mass conservation | Darcy's Law for seepage |
| Gas flow | Mass conservation | Darcy's Law for seepage |
| Stress redistribution | Momentum conservation | Elasticity theory for force equilibrium |
| Heat transfer | Energy conservation | Heat conduction and advection theory |
Table 2.
Parameters for numerical computation.
| Parameters | Materials | Symbols | Values |
| Molar mass [kg/mol] |
Hydrate | Mh | 0.1195 |
| Water | Mw | 0.018 | |
| Methane | Mg | 0.016 | |
| Heat capacity [kg/m3] |
Matrix | Cs | 800 |
| Hydrate | Ch | 2010 | |
| Water | Cg | 2180 | |
| Methane | Cw | 4200 | |
| Thermal conductivity [W/m/K] |
Matrix | λs | 8.8 |
| Hydrate | λh | 0.57 | |
| Water | λg | 0.0335 | |
| Methane | λw | 0.6 | |
| Density [kg/m3] |
Matrix | ρs | 2650 |
| Hydrate | ρh | 913 | |
| Watera | ρw | Check notes | |
| Methaneb | ρg | Check notes | |
| Poisson's ratio [-] |
Matrix | νb | 0.2 |
| Hydrate | νh | 0.32 | |
| Young's modulus [GPa] | Matrix | Eb | 20 |
| Hydrate | Eh | 9.06 |
|
| Dynamic viscosity [Pa] |
Waterc | μg | Check notes |
| Methaneb | μw | Check notes |
Disclaimer/Publisher’s Note: The statements, opinions and data contained in all publications are solely those of the individual author(s) and contributor(s) and not of MDPI and/or the editor(s). MDPI and/or the editor(s) disclaim responsibility for any injury to people or property resulting from any ideas, methods, instructions or products referred to in the content. |
© 2025 by the authors. Licensee MDPI, Basel, Switzerland. This article is an open access article distributed under the terms and conditions of the Creative Commons Attribution (CC BY) license (http://creativecommons.org/licenses/by/4.0/).
Copyright: This open access article is published under a Creative Commons CC BY 4.0 license, which permit the free download, distribution, and reuse, provided that the author and preprint are cited in any reuse.


