
Submitted:
25 March 2025
Posted:
26 March 2025
You are already at the latest version
Abstract
This study evaluates the seismic performance of Turkish building stock after the February 6, 2023, Maras earthquakes. Sixty reinforced concrete buildings, designed under Turkish Earthquake Codes (TEC) TEC-1975 and TEC-1998, were analyzed using nonlinear time history analyses with 46 acceleration records. Results highlight that newer buildings show better seismic resilience, with lower collapse rates compared to older structures. Despite updated regulations, non-compliance in construction practices remains a critical issue. The findings emphasize the importance of improved supervision and workmanship, alongside regulatory adherence, to reduce building collapse and enhance earthquake resilience in Turkey.
Keywords:
06/02/2023 Maras earthquakes
; seismic performance
; Turkish building stock
; nonlinear time history analyses
; Seismic resilience
1. Introduction
An extensive study was started into Turkish building stock and regulatory compliance, following the earthquakes that hit Maras province and surrounding areas on February 6, 2023. The studies primarily focused on whether the buildings are designed according to provided regulations. Previous research on the 06/02/2023 Maras earthquake shows that a major problem with Turkish buildings is non-compliance with construction regulations. [1] studied the structural damage caused to reinforced concrete buildings of Adiyaman provience after the major earthquake. The study investigated compliance with Turkish earthquake regulations by focusing on the quality of materials, reinforcing details, and design. Field observations showed typical problems such as low concrete quality, insufficient transverse reinforcement, and design deficiencies, highlighting the necessity of better building practices and stricter compliance with construction codes to improve the earthquake resistance of Turkish structures. The seismic performance of different building typologies was evaluated by [2], focusing on their responses 06/02/2023 Maras earthquakes. Authors focused on the impacts of the earthquakes on reinforced concrete structures, masonry, prefabricated and other types of structures in Maras province, by conducting field observations along with the soil structure interaction problems, code evaluations. The authors indicated that despite advanced earthquake codes in Turkey, occurred damage remains severe due to poor constriction practises, low material quality and soil conditions. [3] stated that the peak ground accelerations (PGA) exceeded design values by 1.75 to 3 times in some locations. Along with this the authors found that the majority of the damaged structures were constructed between 1975 and 2000, and compliance with their earthquake code were minimal or non-exist. Extensive field observations of this study pointed that the “strong column-weak beam” principle not complied with the earthquake regulations. Also, the soft story behavior is one of the major effects that caused collapse of the structures which can be prevent by proper engineering services. [4] provided a detailed analyses of the seismic vulnerability of the existing reinforced concrete building stock in Istanbul. The study focuses on the structures that constructed before the year 2000. The authors indicated that the material quality and insufficient reinforcement. Many structures exhibited significant structural deficiencies such as inadequate lateral reinforcement spacing, weak columns and low strength concrete. [5] presented a comprehensive seismic risk assessment framework using Monte Carlo simulations to predict potential earthquake losses in high-risk regions. Focusing on Adapazari, Turkey, the framework integrates seismic hazard models, vulnerability functions, and exposure models to estimate human and economic losses for various return periods. The authors recommend incorporating site-specific factors such as liquefaction into future risk assessments, as the current model underestimates the impact of soil conditions on damage distribution. [6] investigates the damage and structural performance of school buildings affected by the devastating earthquakes in southeast Turkey on February 6, 2023. The study analyzes the reasons behind the widespread destruction of more than 12,000 school buildings and highlights the importance of adhering to seismic design principles for public buildings, particularly schools, which are critical for post-earthquake recovery. The authors recommended that a comprehensive reassessment of older buildings and adherence to modern codes to ensure life safety. [7] investigated the structural damage in Hatay province caused by Maras earthquakes on February 6, 2023. The response of buildings was evaluated, focusing on steel structures and reinforced concrete. Several issues were found, including neglected corrosion, weak shear reinforcements, poor quality concrete, and strong beam-weak column failure. The study also pointed out design errors such as torsional response, pounding effect, short column failure, rigidity differences, and weak stories. The study underscores that a combination of poor design, inadequate construction practices, and challenging soil conditions played a major role in the widespread damage in Hatay provience.
The literature review suggesting that the lack of compliance on the constructed structures with the provided regulations and Turkish Earthquake Codes (TEC) such as TEC-1975 [8], TEC1998 [9] and TBEC 2018 [10]. This study provides a unique comparison of buildings designed under the TEC-1975 and TEC-1998, examining their performance during the February 6, 2023, Maras Earthquake. Unlike previous research, which often emphasizes field observations, this work applies nonlinear time history analysis to evaluate both older and newer buildings, with a focus on the improvements in regulations over time. The study thoroughly analyzes compliance gaps, demonstrating that despite advances in regulations, non-adherence continues to be a significant factor in building failures. The findings offer practical insights for enhancing code enforcement and reducing earthquake-related damage, both in Turkey and in other regions facing similar challenges.
Despite the update of the regulations in Turkey (TEC 1975, TEC 1998, TBEC 2018), the loss of lives and property in all major earthquakes is significantly higher than in other countries, suggesting a lack of compliance with Turkish construction practices. The aim of this study is to examine buildings constructed in accordance with 1975 and 1998 regulations and demonstrate that regardless of the magnitude of the earthquake, the loss of more than 50,000 lives due to the damage and collapse of reinforced concrete buildings should not have occurred with present engineering knowledge. For this purpose, 30 reinforced concrete frame buildings representing the 1975 regulations and 30 representing the 1998 regulations were empirically modelled in SAP2000 [11]. For the buildings in 1975, C16-S220 materials were selected, whereas C25-S420 materials were used for the buildings in 1998. The designs did not include reinforced concrete shear walls, and the buildings were considered as only frames. The lateral reinforcement spacing was set to 20 cm for older buildings (TEC-1975) and 10 cm for more recent buildings (TEC-1998).
Buildings were modelled with 3, 4, 5, 6, 7, and 8 storeys, reflecting the typical building heights in Turkey to generalize the findings for the Turkish building stock. A total of 60 reinforced concrete building models were designed by producing 5 old and 5 new buildings for every building height (6 heights x 5 structural models x 2 different earthquake codes = 60 models). The study was carried out to assess the performance of Turkish buildings modelled with different storey heights, different numbers of storeys, different earthquake codes, and at different locations (stations 4611 Repicenter 55.32 km and 4615 Repicenter 13.83 km), using a total of 46 (23 each) acceleration records. In the scope of the study, the horizontal strength and horizontal drift capacities of the buildings were assessed and compared with the obtained demands from 3D nonlinear time history analyses. The focus was mainly on the collapse conditions, representing scenarios where the occupants of the building would likely perish.
As a result of 2,760 analyses, findings consistent with previous field observations regarding the Maras earthquake were identified. While older buildings experienced higher rates of collapse, the analysis also revealed that, although the rate was lower, some newer buildings also collapsed. Unlike other studies, this research was conducted to explain why certain buildings remained intact and to further validate field observations. The results confirm that buildings constructed according to the updated regulations (TEC1998) demonstrated significantly better performance compared to older buildings. However, the Maras earthquake also revealed that many buildings were non-compliant with the regulations, and these were the structures most likely to experience collapse. The Maras earthquake highlighted the critical need to assess whether reinforced concrete buildings, particularly those located near fault lines, comply with current regulations.
2. Materials and Methods
2.1. Building Floor Plans and Design of Buildings
In this study, 30 new and 30 old building models were analyzed under 46 acceleration records. The multi-purpose structural analysis program SAP2000 was employed to create the building models. During the modeling process, structural irregularities such as closed projections in the building, plan irregularities, and the use of the store at first floor (soft storey case) were not considered. While creating the building models, attention was given to ensuring that the buildings exhibited different characteristics from one another. Therefore, the selected reinforced concrete element sizes, axis spans, reinforcement diameters used in columns and beams, and floor dead and live loads that determine the seismic weight of the buildings were chosen in accordance with the regulations of 1975 and 1998. In Table 1, the span lengths of the building models in the x and y directions are provided. A selected length represents the length of the relevant axis of the building in the specified direction. The number of axes indicates how many axes the building has in the x direction and how many it has in the y direction. Although floor heights vary between building models, they remain consistent within each building and were chosen from the values shown in Table 1. Column dimensions were also selected separately as h and b, as illustrated. The same approach was used for selecting beam dimensions. For an example building represented in these tables, the number of spans in the x direction is 4, and in the y direction is 3, with the span distances ranging between 2 and 7 meters for each direction. The element dimensions for the columns at each axis intersection were chosen to be between 0.3 and 0.7 meters (e.g., s1 0.30x0.50, s2 0.60x0.40). Beam dimensions were selected once for each building; for instance, if the selected size in a building was 0.25x0.60, that dimension was maintained for the beams on every floor. The overall view of the created floor plans is shown in Figure 1.
The floor plans of the buildings were selected from the data in Table 1 and designed as theoretical models, resulting in 60 reinforced concrete frames. The buildings were modeled as frame elements with smooth floor plans, without reinforced concrete shear walls. Dead loads in the buildings were chosen to vary between 0.1-0.35 t/m² and live loads between 0.2-0.4 t/m². Since the infill walls are expected to separate from the reinforced concrete frame system in the initial moments of an earthquake [12], they were not physically modeled. Instead, the infill walls were represented as loads on the frame systems and were categorized into interior and exterior walls.
The TEC-1998 introduced detailed seismic zoning, refined design spectra, building importance factors, ductility requirements, stricter irregular building rules, and modern analysis methods, significantly improving upon the simpler, strength-based approach of the TEC-1975. The slab thicknesses in the buildings were considered to be either 12 or 15 cm, and the slabs were not physically modelled like the walls but were only assigned as loads on the relevant beams. Subjected structures are designed in seismic zone 1 and site classification of Z3 design spectrum for both regulations. The structural behavior factor (R) taken as 8 for newer structures since the analyzed structures include only frame elements. The P- effects are considered both design and evaluation phases (Design loads, Static Pushover and Direct Time History analyses). Floors are considered as rigid diaphragms. When modeling the column-beam connection areas, the sections where the columns and beams intersect were defined as completely rigid with the end length offset [13]. The effective stiffness of the reinforced concrete elements (Ieff) was considered as 0.7 for columns and 0.35 for beams, in accordance with TBEC-2018. In the modeled buildings, longitudinal column reinforcements started from θ12 for old buildings and ranged up to θ16. In new buildings, this ratio was updated in the new regulation (TEC-1998), with the minimum requirement determined as either 6θ14 or 4θ16. Taking these ratios into account in the theoretical buildings modeled in the study, the column longitudinal reinforcement for the new buildings started from θ14 and ranged up to θ18. For the beams, the longitudinal reinforcement diameters were chosen as θ12 and θ14. Transverse reinforcement diameters were determined as θ8 in both old and new buildings. In the old buildings, transverse reinforcement were not tightened, and the minimum transverse reinforcement spacing was specified as 20 cm. In new buildings, transverse reinforcement were tightened in accordance with the regulation, and the transverse reinforcement spacing in the confinement areas was taken into account as 10 cm. Post-yield hardening behavior was considered in the reinforcement used. The theoretical buildings, for which frame models were created, were subjected to modal analysis. The obtained periods were then compared with the empirical relationship based on building height specified in EC-8 [23] and the results are shown in Figure 2. The empirical building period described in EC-8 is given in Eq. (1).
TEC-8 = 0.0750H0.75
2.2. Nonlinear Modelling and Determining Collapse Points of Structures
As previously mentioned, the reinforcement designs for the reinforced concrete elements of the buildings were carried out in accordance with the TEC-1975 earthquake regulations for older buildings and the TEC-1998 earthquake regulations for newer buildings. However, the section damage limits outlined in the TBEC-2018 were utilized to assess the seismic performance of the buildings. Although the TBEC-2018 also includes building performance limits for beams, this study only considered column elements when determining building performance limits. In other words, when the buildings were evaluated in the study, the performance of the beams, whether limited damage (LD) or collapse prevention (CP), did not affect the overall building performance. The rationale behind this is that the failure of a column significantly increases the probability of loss of life in the building. Table 2 presents the threshold values corresponding to damage limits.
To capture the nonlinear behavior of the structural members, lumped fiber-hinge elements were employed, where the hinges are directly characterized by material nonlinearity. In this approach, each hinge is described by fiber models, with stiffness evaluated directly from the material's nonlinearity. According to [14], a single hinge at each end is sufficient to model biaxial bending. The hinge length is applied as 0.5 of the section height, as recommended by [14]. The compressive strength of the concrete is assumed to be 25 MPa for new buildings and 16 MPa for old buildings, and the yield strength of both the longitudinal and transverse reinforcements is assumed to be 420 MPa for new buildings and 220 MPa for old buildings. The calculations also accounted for the post-yield strengthening of the reinforcement. The longitudinal reinforcement ratios vary between 1.1% and 1.65% for the reinforced concrete columns. No cross-sectional and reinforcement reduction was employed for either the old or new structures, which is widely used, in buildings designed under TEC-1975, [15]. After the nonlinear definitions of the buildings were made, the buildings were subjected to static pushover analysis, and the building performance limits were determined according to TBEC-2018. Both the x and y capacities of the buildings were determined, and the collapse status of the buildings was assessed separately in both directions. The obtained capacity curves and the means of the subjected categories are shown in Figure 3, Figure 4, Figure 5, Figure 6, Figure 7 and Figure 8, with the relevant damage limits indicated by dots along two lines. The averages of the relevant damage limits are shown as immediate occupancy (IO) and ultimate capacity (C) in Table 3. This table shows that the empirical buildings examined represent Turkish buildings in terms of both horizontal strength ratios and horizontal drift capacities, and are consistent with building models in past studies [16].
In this study, the Newmark-Beta method [17] was employed for time history analysis. To ensure unconditional stability, the Gamma (γ) and Beta (β) coefficients were set to 0.5 and 0.25, respectively. Rayleigh damping was used to formulate the damping, with the damping ratio assumed to be 5%. The mass and stiffness proportional coefficients were determined based on different period values and considered for the viscous proportional damping. When determining the number of modes considered in this study, it was ensured that the mass participation rate of the modes exceeded 95% which corresponds to the first 8 modes for this study
2.3. Selection and Scaling of Ground Motion Records
The Maras earthquake, with a magnitude of 7.7 and centered in Pazarcık, occurred at 04:17 in the morning. Consequently, the majority of the over 50,000 fatalities were among citizens who were sleeping at home. Although the second earthquake also caused significant destruction, the loss of life was considerably lower because people were reluctant to re-enter their homes at that time. Therefore, in this study, the term Maras earthquake specifically refers to the first earthquake.
For this reason, the spectrum of the first earthquake were determined as the target spectrum in the study. Almost all major earthquakes in Turkey result in significant loss of life. This situation either indicates that the regulations are insufficient or shows that the buildings constructed are not built in accordance with the regulations, regardless of whether they are new or old. Two scenarios were considered in the study. Firstly, the impact of the earthquake on buildings in the region very close to the epicenter (Repi = 13.83 km) was investigated, including the validity of the regulations and the extent to which old and new buildings collapsed. Secondly, the study examined how buildings in a settlement relatively far from the epicenter (Repi = 55.32 km) were affected by the earthquake and assessed the earthquake behavior of buildings constructed in compliance with the regulations in this region. The locations of these stations are marked on the map and presented in Figure 9.
The purpose of this study is to calculate the extent of destruction in both the near and distant regions, compare the findings with the situation observed in the Maras earthquake, and determine whether the loss of life is due to the inadequacy of the regulations or the failure to construct buildings in accordance with the regulations. The properties of the selected accelerations are presented in Table 4 for 4615 station and Table 5 for 4611 station. The unscaled spectrums and target spectrums according to TBEC-2018 selected ground motions are given in Figure 10 and Figure 11.
In the study, both the region close to the earthquake and the region far from the earthquake were examined. For this reason, the acceleration records to be used for the near and far regions were selected in accordance with the characteristics of these regions. For station 4615, the selection criteria included earthquakes with a magnitude (Mw) greater than 6.5, an epicentral distance between 0-30 km, and shear wave velocities (Vs30) between 400-560 m/sec. For station 4611, the criteria included earthquakes with a magnitude (Mw) greater than 6.5, an epicentral distance between 40-70 km, and shear wave velocities (Vs30) between 560-760 m/sec. The relevant earthquakes were selected based on the PEER [21] strong ground motion database. Simple amplitude scaling was performed to align the averages of the selected earthquakes more closely with those of the Maras earthquake. The scale factors of subjected ground motions are given in Table 6, and the scaled spectrums are shown in Figure 12 and Figure 13.
3. Analyze Results and Discussion
The buildings were analyzed under 23 strong ground motions scaled according to the 4611 station and 23 according to the 4615 station, and the roof displacement demands were compared with the performance points of the buildings. Within the scope of the study, 60 reinforced concrete buildings were examined, and analyzed under a total of 46 strong ground motions. Nonlinear direct time history analyses were performed in a total of 2760 3D time domains (x and y simultaneously). When determining the earthquake performance of a building, those that were undamaged in both directions were evaluated as immediate occupancy overall. If the damage was greater in one direction than the other, the greater damage was used to determine the performance state of the building. For example, if the building is rated as IO in the X direction and LS in the Y direction, the performance of that building is evaluated as LS. Table 7 presents the evaluated performance levels of the investigated structures.
The results obtained from the direct time history analysis are shown in Table 7. According to sources [3] and Kahramanmaras and Hatay Earthquake Reports [18], the total number of residual buildings in the province of Maras is understood to be 243,153. The percentage of reinforced concrete buildings in Turkey is 86.7% of the total building stock according to the Kahramanmaras and Hatay Earthquake Reports totaling of 210,714 reinforced concrete structures. Among these, buildings constructed between 1981 and 2000 constitute 26.9% of the total (amounting to 56,288 old buildings), while buildings constructed after 2001 account for 58.1% of the total (amounting to 122,483 new buildings). Furthermore, the total number of buildings that either collapsed or were severely damaged in Maras is officially recorded as 48,756 as [3] stated. Consequently, the proportion of collapsed or severely damaged buildings in Maras is 23.13% [3]. Unfortunately, no official data could be found regarding the number of floors in the collapsed buildings. Regarding the information about the number of floors in the buildings in Maras province, according to data obtained from [3] and Building and Housing Survey [19], 50% of the buildings have 1-2 floors, 21.7% have 3-5 floors, and 28.3% have 6 or more floors. Therefore, it can be said that the buildings examined within the scope of the study constitute 50% of the building stock in the Maras region. Apart from this, it would not be very realistic to evaluate the number of floors. For this reason, the authors believes it is more realistic to assess this destruction in terms of old and new buildings rather than just the number of floors. Therefore, although the number of collapsed buildings is provided according to the number of floors in Table 6, from this point onward, only old and new buildings will be compared. The obtained roof displacements demands from the nonlinear time history analyses were sorted in ascending order [20] and plotted with a probability equal to Eq. (2), and presented in Figure 14 and Figure 15.
Exceedance probabilities for the identified damage levels were determined by plotting the data obtained from Eq 2. The y-axis of these graphs represents the probabilities, while the x-axis shows the ratio of the obtained displacement demands to the heights of the subjected structures. The procedure followed here involved obtaining displacements at specific damage levels from the examined building groups. These displacements were then plotted in ascending order based on the corresponding exceedance probabilities. Displacement demands that exceeds 4% are not shown in this graphs. In this context, older buildings and the 4615 station are represented on the left side of Figure 14. The immediate occupancy threshold for these older buildings is observed to be 0.75% at this station. In other words, for the examined empirical reinforced concrete structures, the immediate occupancy limit corresponds to 0.75% of the total building height. Displacement values exceeding this threshold will result in increased damage levels. In TEC-1975 buildings and at station 4615 the thresholds of these limits 0.75% for immediate occupancy (IO), 1.75% for life safety (LS), 2.5% for collapse prevention (CP), and 3.5% for total collapse (C). Although these limits show similar values for station 4615 in the case of new buildings, new buildings demonstrate superior performance compared to older buildings. Even when subjected to larger deformations (Δ/H), they exhibit lower probabilities of damage and higher levels of durability. In contrast, older buildings reach higher probabilities of damage more rapidly, particularly at lower deformation levels. This highlights a significant improvement in the seismic performance of newer structures.
Figure15 compares the performance levels of old and new buildings for 4611 station, with older buildings represented on the left and newer buildings on the right. In both graphs, probability distributions are presented based on various performance levels along (Δ/H) and probability. For older buildings, the probability of damage at the Immediate Occupancy (IO) level rapidly reaches 100% at very small Δ/H values (0.2-0.3%). In contrast, new buildings achieve this probability at larger Δ/H values. At the Life Safety (LS) level, older buildings reach 100% probability at smaller deformation levels, whereas new buildings can withstand greater deformations before reaching this threshold. At the Collapse Prevention (CP) level, older buildings attain a 100% probability at approximately 1% Δ/H, while new buildings reach this level later, around 1.5% Δ/H. At the Collapse (C) level, older buildings exhibit a higher probability of collapse at lower Δ/H values, while new buildings are capable of withstanding greater deformations (over 2%). In summary, new buildings demonstrate significantly greater resistance to both small and large deformations compared to older buildings, clearly illustrating the effectiveness of updated building regulations in enhancing earthquake safety.
Previous studies such as [24], as well as the current study, indicate that the destructiveness of earthquakes increases in regions closer to the earthquake’s focal point. Therefore, evaluating this earthquake solely based on data from either Station 4615 or Station 4611 would result in inaccurate data interpretation. To properly assess the province of Maras, this study selected two stations: Station 4615, which is closer to the earthquake’s focal point than Maras, and another station that is farther away. The average performance of buildings at these two stations was used to determine the overall building performance in the region. Maras province is approximately 40 km away from the epicenter of the earthquake. This distance can be considered an average of the two selected stations (approximately 35 km, calculated as (station 4615-13.83 km / 2 + station 4611-55.32 km / 2)). In this way, it was believed that the destruction in the province of Maras would be represented more realistically. Evaluated performance levels of investigated strcutures are given in Table 8, and presented in Figure 16.
To fulfill this purpose, the number of 48,756 collapsed or severely damaged buildings in the official data (which are not divided into old and new) will be compared with the analytically calculated rates. The results obtained from the analysis indicate that 17.17% (7.75% + 9.60%) of the old buildings and 6.81% (4.86% + 1.96%) of the new buildings were heavily damaged or destroyed. When these percentages are applied to the 56,288 old buildings and 122,483 new buildings in the province of Maras, it is found that approximately 9,665 old buildings and 8,342 new buildings are heavily damaged or destroyed, totaling 18,007 buildings. Unfortunately, this figure does not come close to the actual situation of 48,756 buildings being severely damaged or destroyed. Although the second earthquake also contributed to the higher number of collapsed buildings in reality, this alone does not fully explain the difference.
The Figure 16 compares the probability distributions of old and new buildings across different performance levels. The graph on the left represents older buildings, while the graph on the right represents newer buildings. For older buildings, the Immediate Occupancy (IO) level quickly reaches 100% probability at small Δ/H values (below 0.5%), whereas in newer buildings, this level is attained at slightly larger Δ/H values (around 0.7%). At the Life Safety (LS) level, older buildings reach a 100% probability at approximately 1% Δ/H, while newer buildings can withstand deformations up to 1.5%. Similarly, at the Collapse Prevention (CP) level, older buildings quickly reach 100% probability with smaller deformations, while newer buildings reach this level at higher Δ/H values (2-2.5%). A comparable trend is observed at the Collapse (C) level, older buildings reach 100% probability around 3% Δ/H, whereas newer buildings can tolerate deformations up to 4%. Overall, newer buildings demonstrate greater durability than older buildings across all performance levels and provide enhanced safety against larger deformations.
4. Conclusions
Sixty residential buildings, representing the Turkish building stock, including 3, 4, 5, 6, 7, and 8-story old and new buildings designed according to TEC-1975 and TEC-1998, were evaluated according to the TEC-2018 regulations under 23 acceleration records from each near and far regions, with a focus on records closely matching the average conditions of the Maras earthquake. The obtained results are summarized below. In the study, no structural irregularities were designed, but it was assumed that such calculations could be performed with proper engineering.
Although the earthquake was severe, buildings constructed in accordance with the regulations demonstrated significantly better performance during the event than those that collapsed. This also explains why certain buildings did not collapse during the earthquake.
The collapse rate for new buildings was calculated to be 1.96%. Given that the building code was updated in 2018, a collapse rate of less than 2% in such a severe event is quite good. In contrast, the buildings constructed according to the old regulations had a much higher collapse rate (9.6 %) due to insufficient material quality. However, it should be noted that the older regulations also served their purpose and were updated in 1998. Upon examining these data, it can be concluded that the regulations effectively fulfilled their roles during their respective periods, given that the overall collapse rate for the Maras earthquake was recorded at 23.18%. These results indicate that the primary problem with the Turkish building stock is not the regulations, but rather the issues of workmanship and lack of supervision.
Although the reasons for the collapse of buildings have been extensively discussed in previous studies, this study will also address this issue. In particular, during the construction of older buildings, the absence of ready-mix concrete technology resulted in concrete quality that was significantly lower than the calculated compressive strengths. For newer buildings, despite the availability of ready-mix concrete technology, improper vibration, workmanship errors, and general lack of supervision led to the earthquake performance of these buildings being much worse than expected. The same issues apply to the reinforcement processes as well. For example, transverse reinforcements were often tied incorrectly at 90 degrees instead of the required 135 degrees due to lack of supervision. In addition to all these factors, it is also necessary to address the frequently discussed issue of the "construction amnesty" in our country. The continuation of using buildings with additional floors added without any structural calculations or analyses, and without taking any precautions, significantly increases the risk of collapse.
The results for buildings designed according to TEC 1975 indicate that, although these buildings were sufficient for their time, a 9.6% collapse rate is still significant. It is imperative to conduct on-site performance evaluations for buildings constructed under this regulation as soon as possible. Although this situation is not as urgent for buildings constructed according to the TEC-1998, performance evaluations should still be conducted to ensure earthquake resilient cities.
This study was conducted not only to address the significant loss of life in the Maras earthquake but also to investigate whether the problem lies with our regulations or other factors in almost every major earthquake in our country. The findings indicate that the primary issues are poor workmanship and lack of supervision. For future studies, it is recommended to include analyses that consider Soil-Structure Interaction (SSI) and structural irregularities.
Data Availability Statement
We encourage all authors of articles published in MDPI journals to share their research data. In this section, please provide details regarding where data supporting reported results can be found, including links to publicly archived datasets analyzed or generated during the study. Where no new data were created, or where data is unavailable due to privacy or ethical restrictions, a statement is still required. Suggested Data Availability Statements are available in section “MDPI Research Data Policies” at https://www.mdpi.com/ethics.
Conflicts of Interest
Declare conflicts of interest or state “The authors declare no conflicts of interest.” Authors must identify and declare any personal circumstances or interest that may be perceived as inappropriately influencing the representation or interpretation of reported research results. Any role of the funders in the design of the study; in the collection, analyses or interpretation of data; in the writing of the manuscript; or in the decision to publish the results must be declared in this section. If there is no role, please state “The funders had no role in the design of the study; in the collection, analyses, or interpretation of data; in the writing of the manuscript; or in the decision to publish the results”.
References
- İnce, O. (2024). “Structural damage assessment of reinforced concrete buildings in Adıyaman after Kahramanmaraş (Türkiye) Earthquakes on 6 February 2023”, Engineering Failure Analysis, 156, 107. [CrossRef]
- Avcil, F., Işık, E., İzol, R., Büyüksaraç, A., Arkan, E., Arslan, M. H., ... & Harirchian, E. (2024). “Effects of the February 6, 2023, Kahramanmaraş earthquake on structures in Kahramanmaraş city”, Natural Hazards, 120(3), 2953-2991. [CrossRef]
- Mertol, H. C., Tunç, G., Akış, T., Kantekin, Y., & Aydın, İ. C. (2023). “Investigation of RC buildings after 6 February 2023, Kahramanmaraş, Türkiye earthquakes,” Buildings, 13(7), 1789. [CrossRef]
- Aydogdu, H. H., Demir, C., Comert, M., Kahraman, T., & Ilki, A. (2024). “Structural Characteristics of the Earthquake-Prone Building Stock in Istanbul and Prioritization of Existing Buildings in Terms of Seismic Risk-A Pilot Project Conducted in Istanbul,” Journal of Earthquake Engineering, 28(6), 1660-1684. [CrossRef]
- Sianko, I., Ozdemir, Z., Hajirasouliha, I., & Pilakoutas, K. (2023). “Probabilistic seismic risk assessment framework: case study Adapazari, Turkey”, Bulletin of Earthquake Engineering, 21(7), 3133-3162. [CrossRef]
- Ozturk, M., Arslan, M. H., Dogan, G., Ecemis, A. S., & Arslan, H. D. (2023). “School buildings performance in 7.7 Mw and 7.6 Mw catastrophic earthquakes in southeast of Turkey”, Journal of Building Engineering, 79, 107810. [CrossRef]
- Altunsu, E., Güneş, O., Öztürk, S., Sorosh, S., Sarı, A., & Beeson, S. T. (2024). “Investigating the structural damage in Hatay province after Kahramanmaraş-Türkiye earthquake sequences”, Engineering Failure Analysis, 157, 107857. [CrossRef]
- Turkish Earthquake Code (1975) Specifications for buildings to be built in seismic areas. Ministry of Public Works and Settlement. Ankara, Turkey (in Turkish).
- TEC (1998), Turkish Earthquake Code, Ministry of Public Works and Settlement; Ankara, Turkey. (in Turkish).
- TBEC (2018), Turkish Building Earthquake Code, Ministry of Environment and Urban Planning; Ankara, Turkey. (in Turkish).
- SAP2000 (2021), v23.3.1 Ultimate, Computers and Structures, Inc.
- Kamal, M., & Inel, M. (2022), “Simplified approaches for estimation of required seismic separation distance between adjacent reinforced concrete buildings”, Engineering Structures, 252, 113610. [CrossRef]
- Abdel Raheem, S. E., Ahmed, M. M., Ahmed, M. M., & Abdel-shafy, A. G. (2018). “Evaluation of plan configuration irregularity effects on seismic response demands of L-shaped MRF buildings”, Bulletin of Earthquake Engineering, 16, 3845-3869. [CrossRef]
- Carvalho, G., Bento, R., & Bhatt, C. (2013), “Nonlinear static and dynamic analyses of reinforced concrete buildings-comparison of different modelling approaches”, Earthquakes and Structures, 4(5), 451-470. [CrossRef]
- Ozmen, H. B., Inel, M., Senel, S. M., & Kayhan, A. H. (2015), “Load carrying system characteristics of existing Turkish RC building stock”, International Journal of Civil Engineering, 13(1), 76-91. [CrossRef]
- Meral, E., & İnel, M. (2016), “Evaluation of structural parameters properties of low and mid-rise reinforced concrete buildings”, Pamukkale University Journal of Engineering Sciences, 22(6), 468-477. (in Turkish). [CrossRef]
- AFAD https://tadas.afad.gov.tr/list-station (Accessed on 18 January 2024).
- Kahramanmaras and Hatay Earthquake Reports (2023); Turkey Presidency of Strategy and Budget: Ankara, Turkey, 2023. Available online: https://www.sbb.gov.tr/2023-kahramanmaras-ve-hatay-depremleri-raporu/ (Accessed on 5 June 2024).
- Building and Housing Survey. 2021. Available online: https://data.tuik.gov.tr (Accessed on 12 June 2024).
- Ruiz-Garcia, J., & Miranda, E. (2010), “Probabilistic estimation of residual drift demands for seismic assessment of multi-story framed buildings”, Engineering Structures, 32(1), 11-20. [CrossRef]
- PEER (Pacific Earthquake Engineering Research Center) (2021), Strong ground motion database, http://peer.berkeley.edu. (Accessed on 12 November 2023).
- Tani, S., & Nakashima, M. (1999). “Earthquake damage to earth dams in Japan—maximum epicentral distance to cause damage as a function of magnitude”, Soil Dynamics and Earthquake Engineering, 18(8), 593-602. [CrossRef]
- Eurocode 8 (2004), “Design of structures for earthquake resistance. Part 1: General Rules, seismic actions and rules for buildings”, European Committee for Standardization; Brussels.
Figure 1.
Sample floor plans of theoretical buildings created in the study.
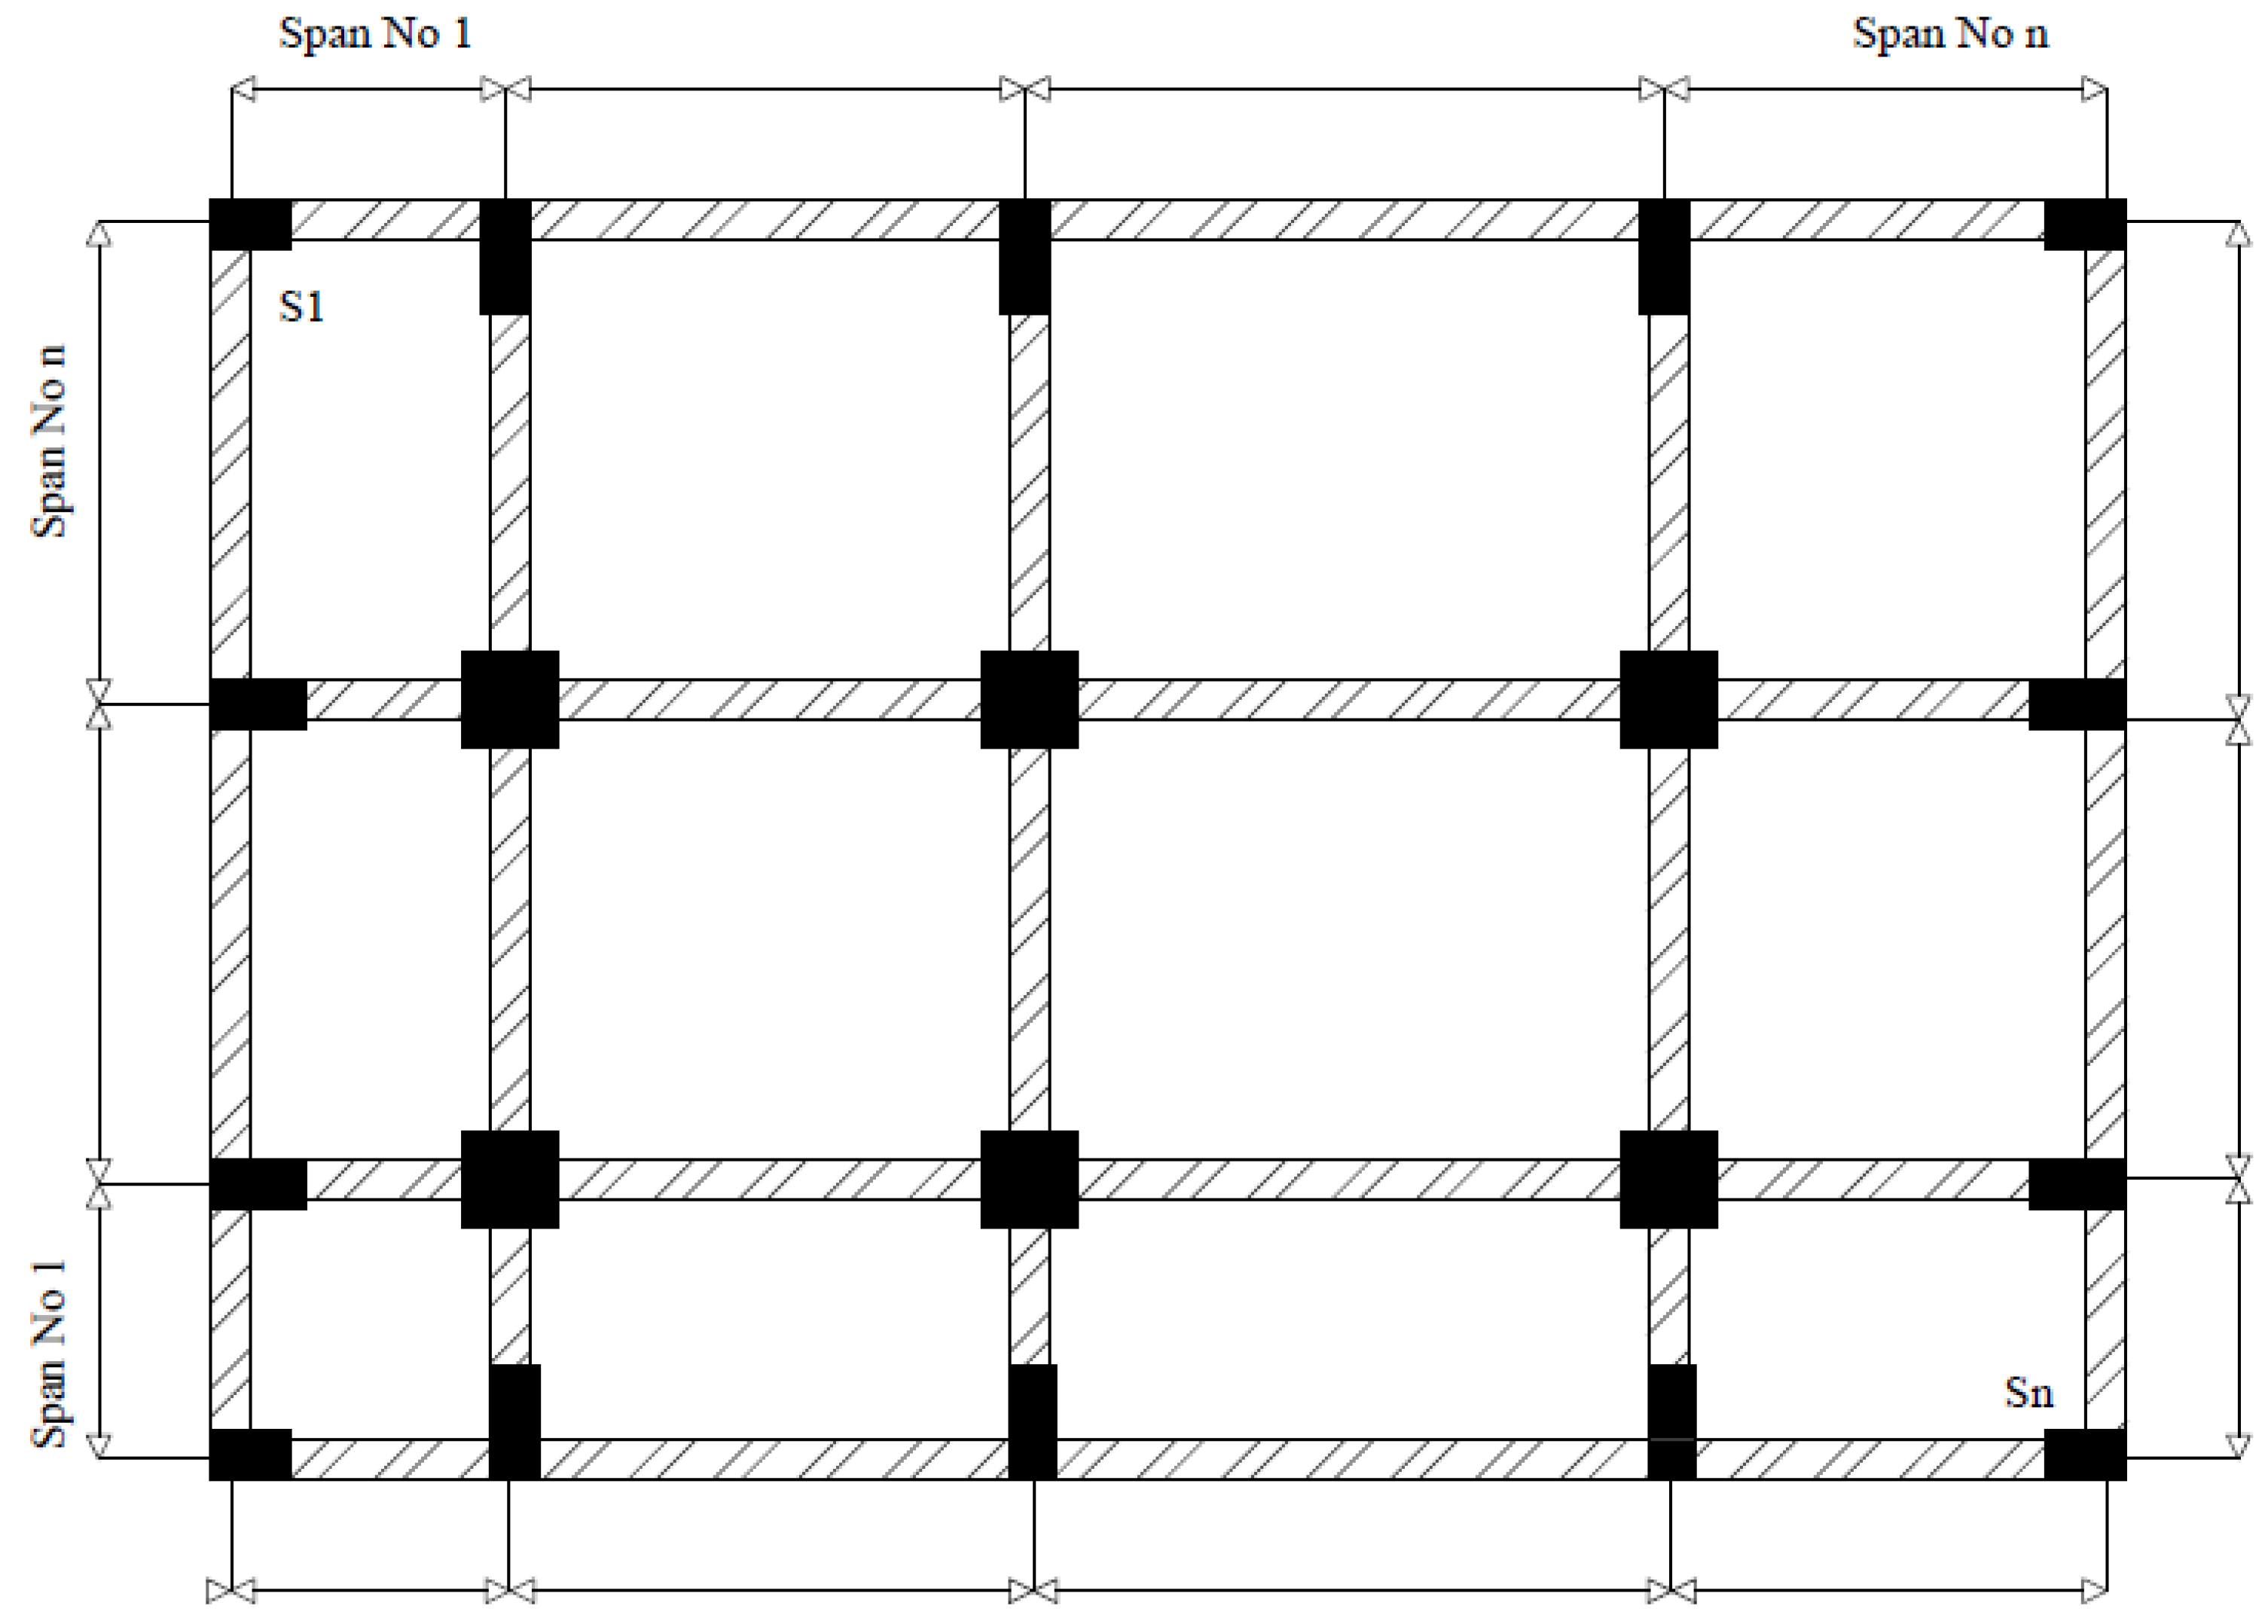
Figure 2.
Calculated natural vibration periods of buildings.
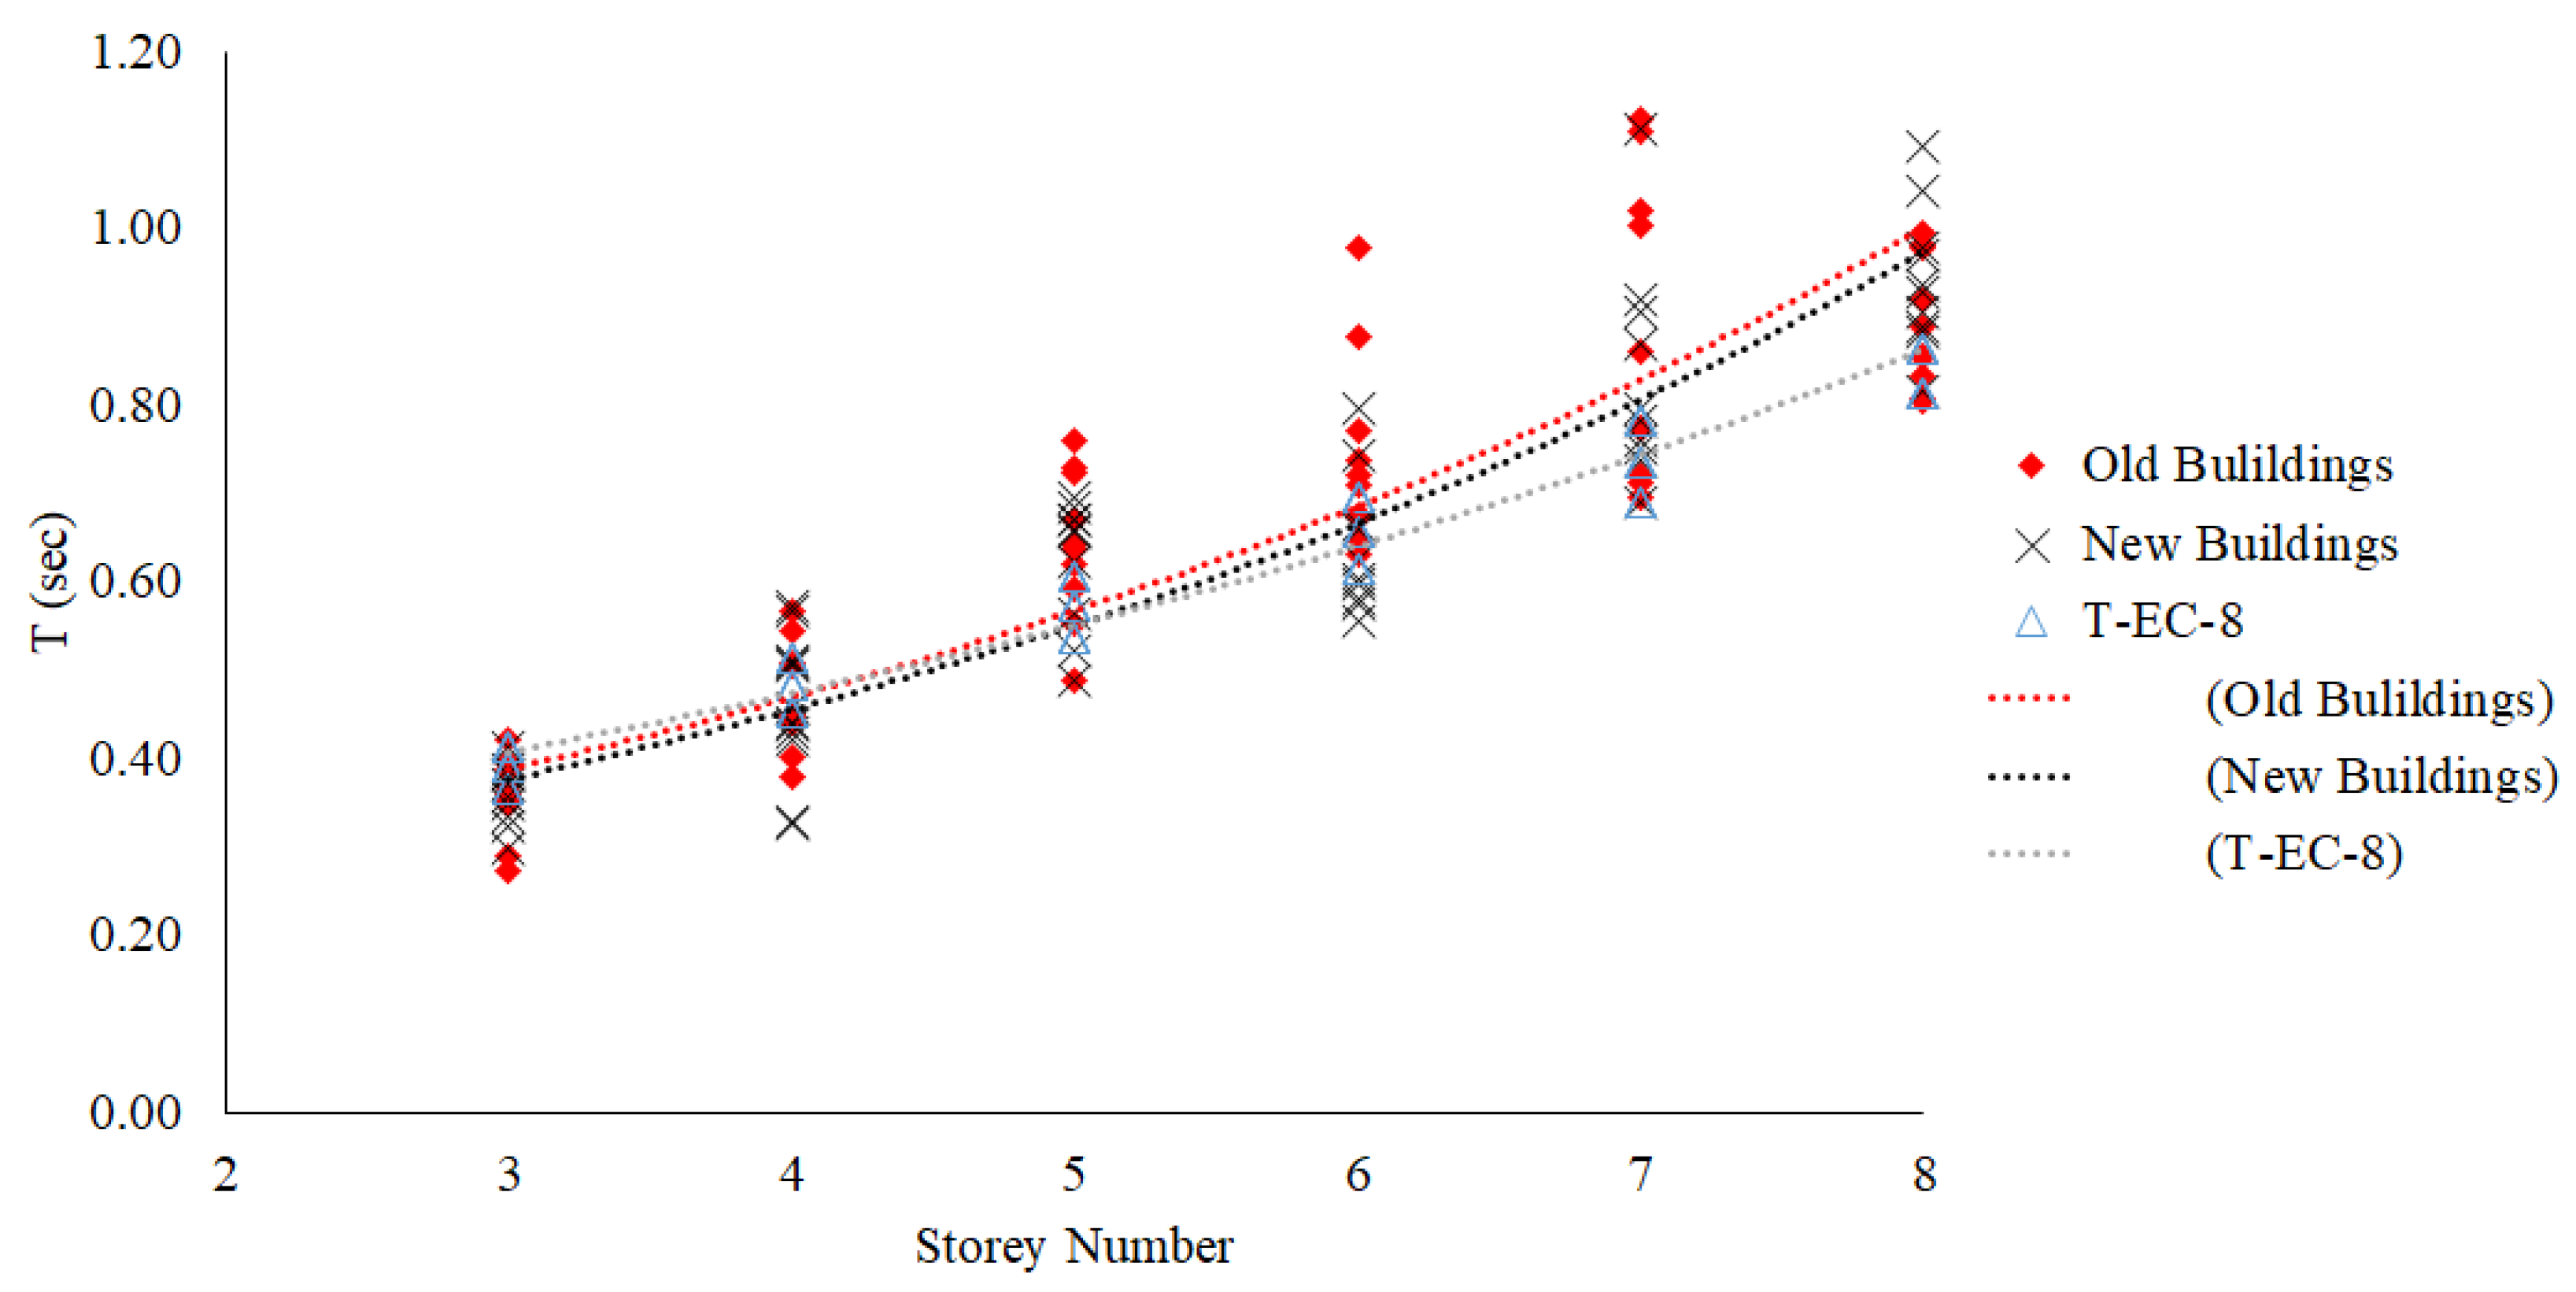
Figure 3.
Capacity information (immediate occupancy and ultimate) of 3-storey buildings.
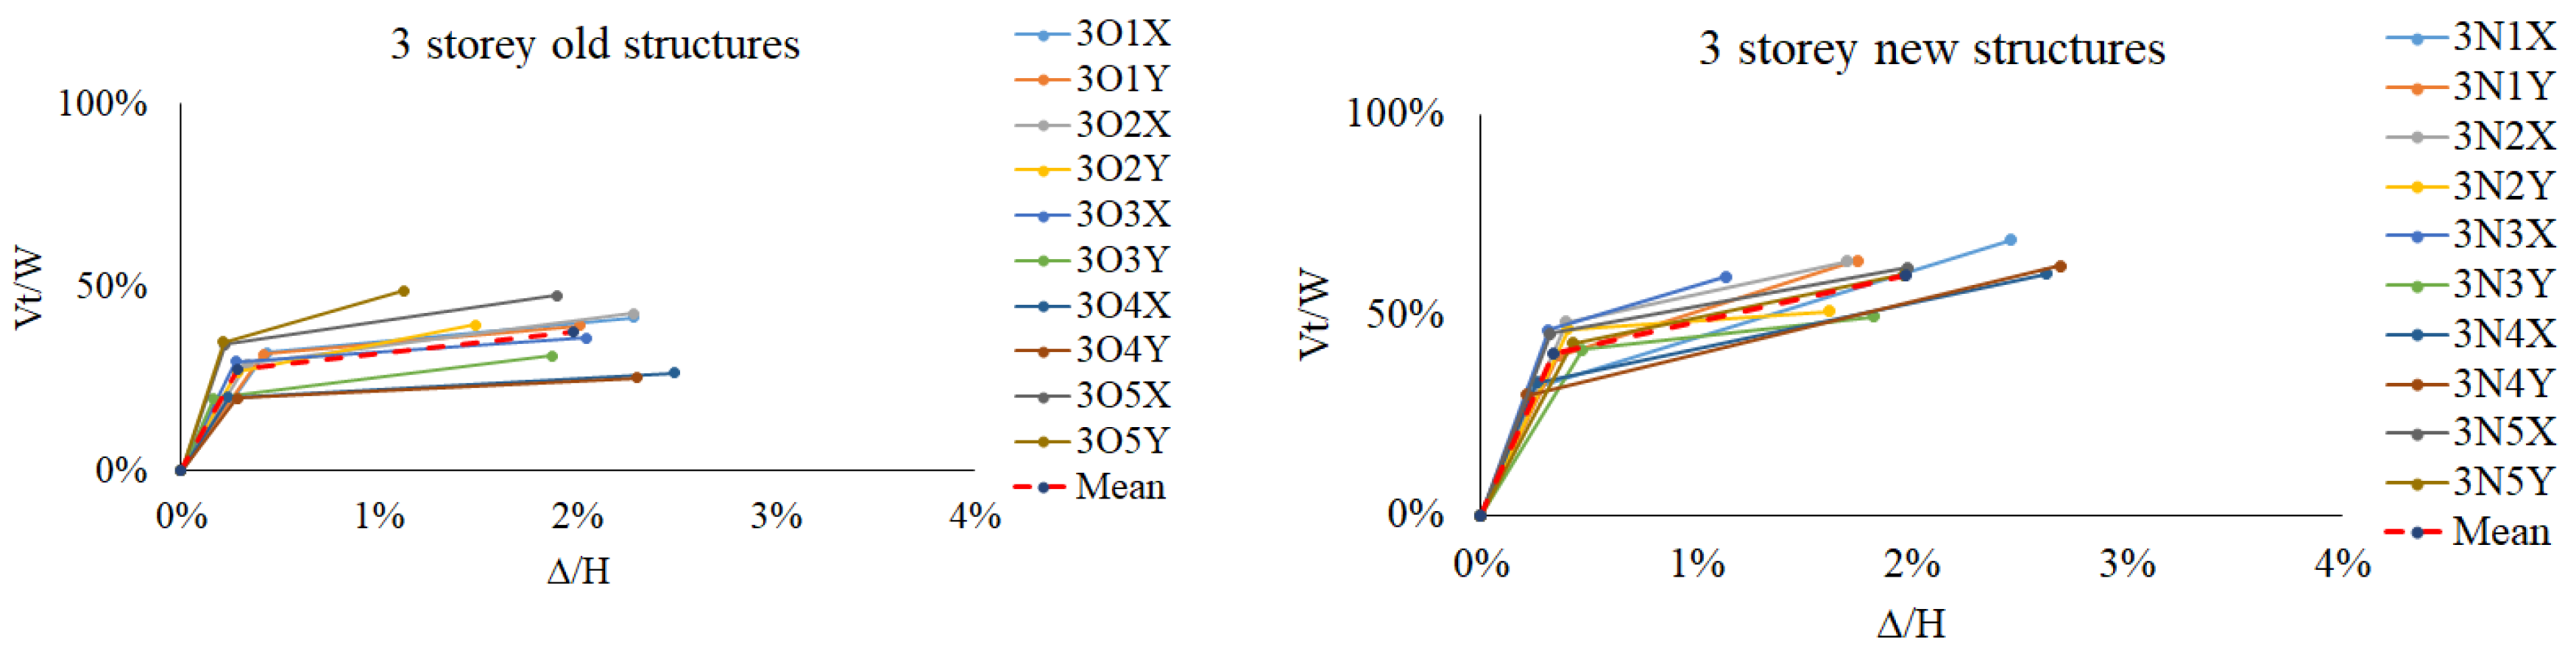
Figure 4.
Capacity information (immediate occupancy and ultimate) of 4-storey buildings.
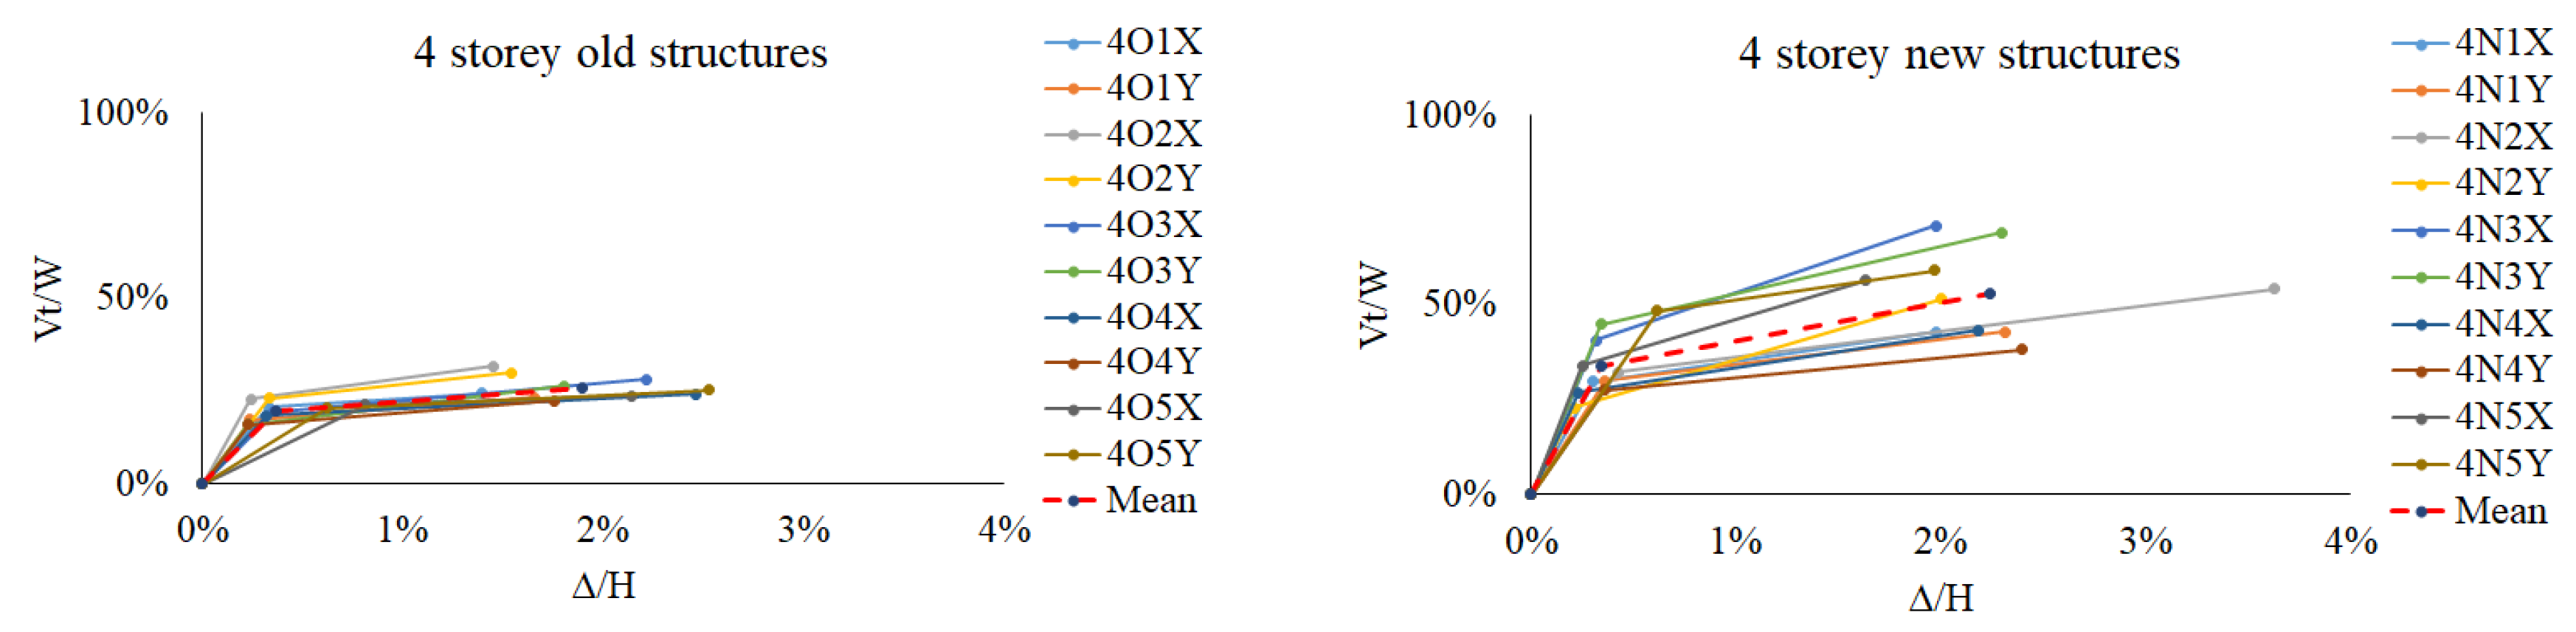
Figure 5.
Capacity information (immediate occupancy and ultimate) of 5-storey buildings.
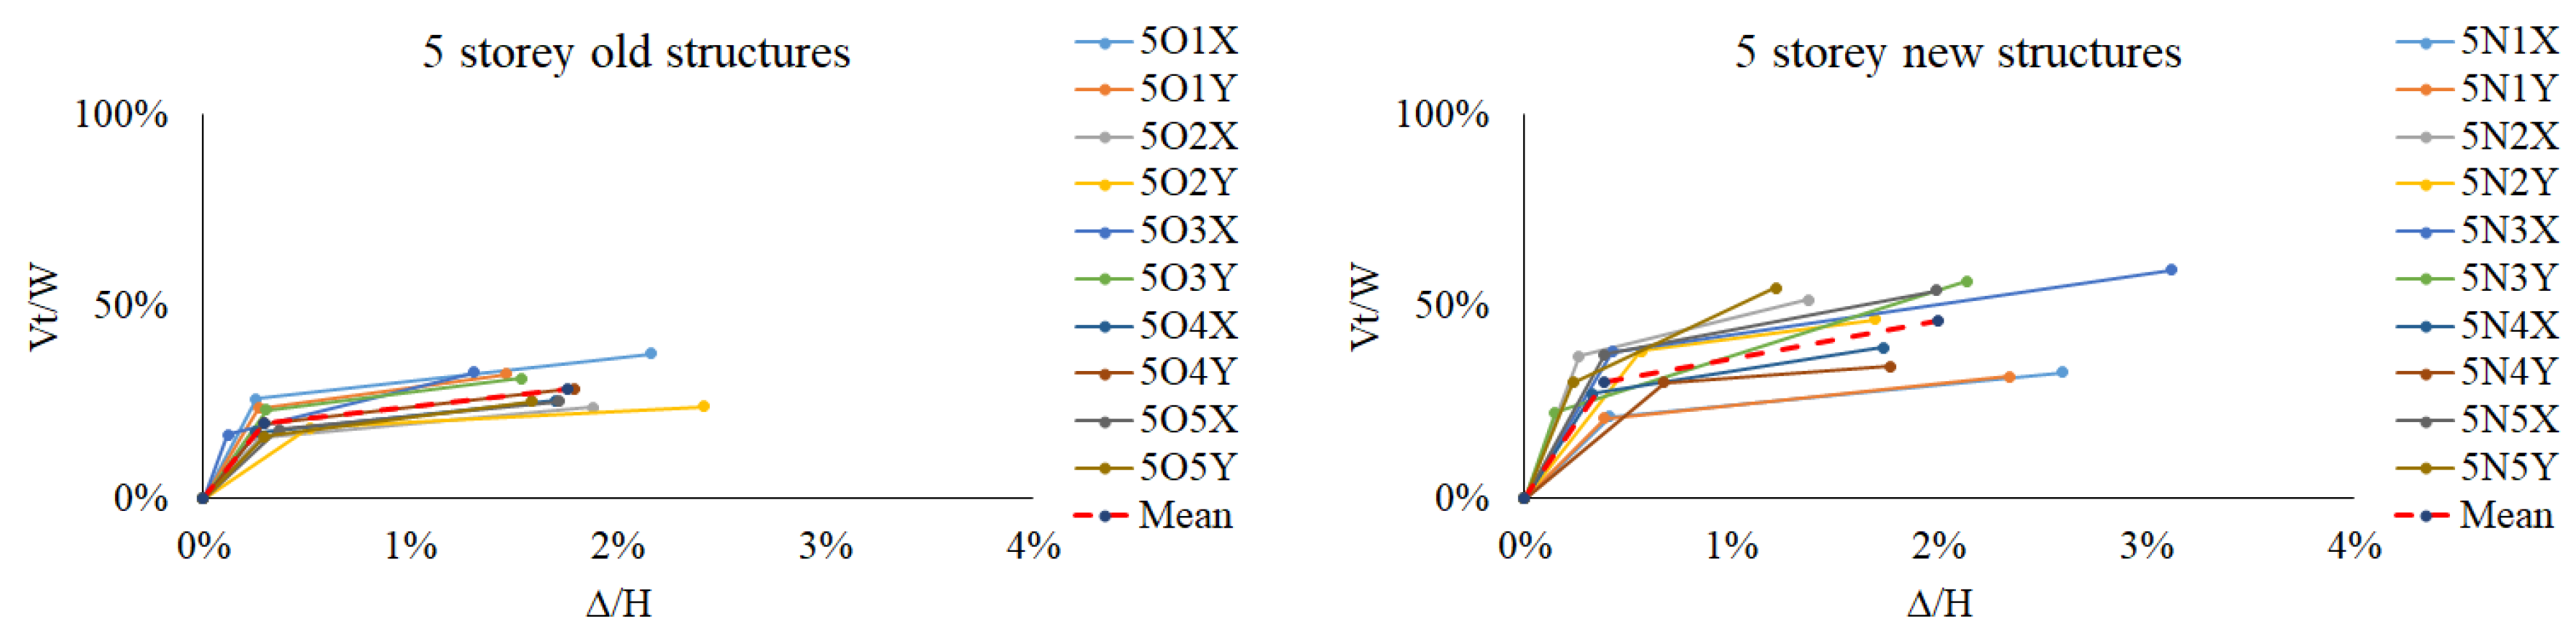
Figure 6.
Capacity information (immediate occupancy and ultimate) of 6-storey buildings.
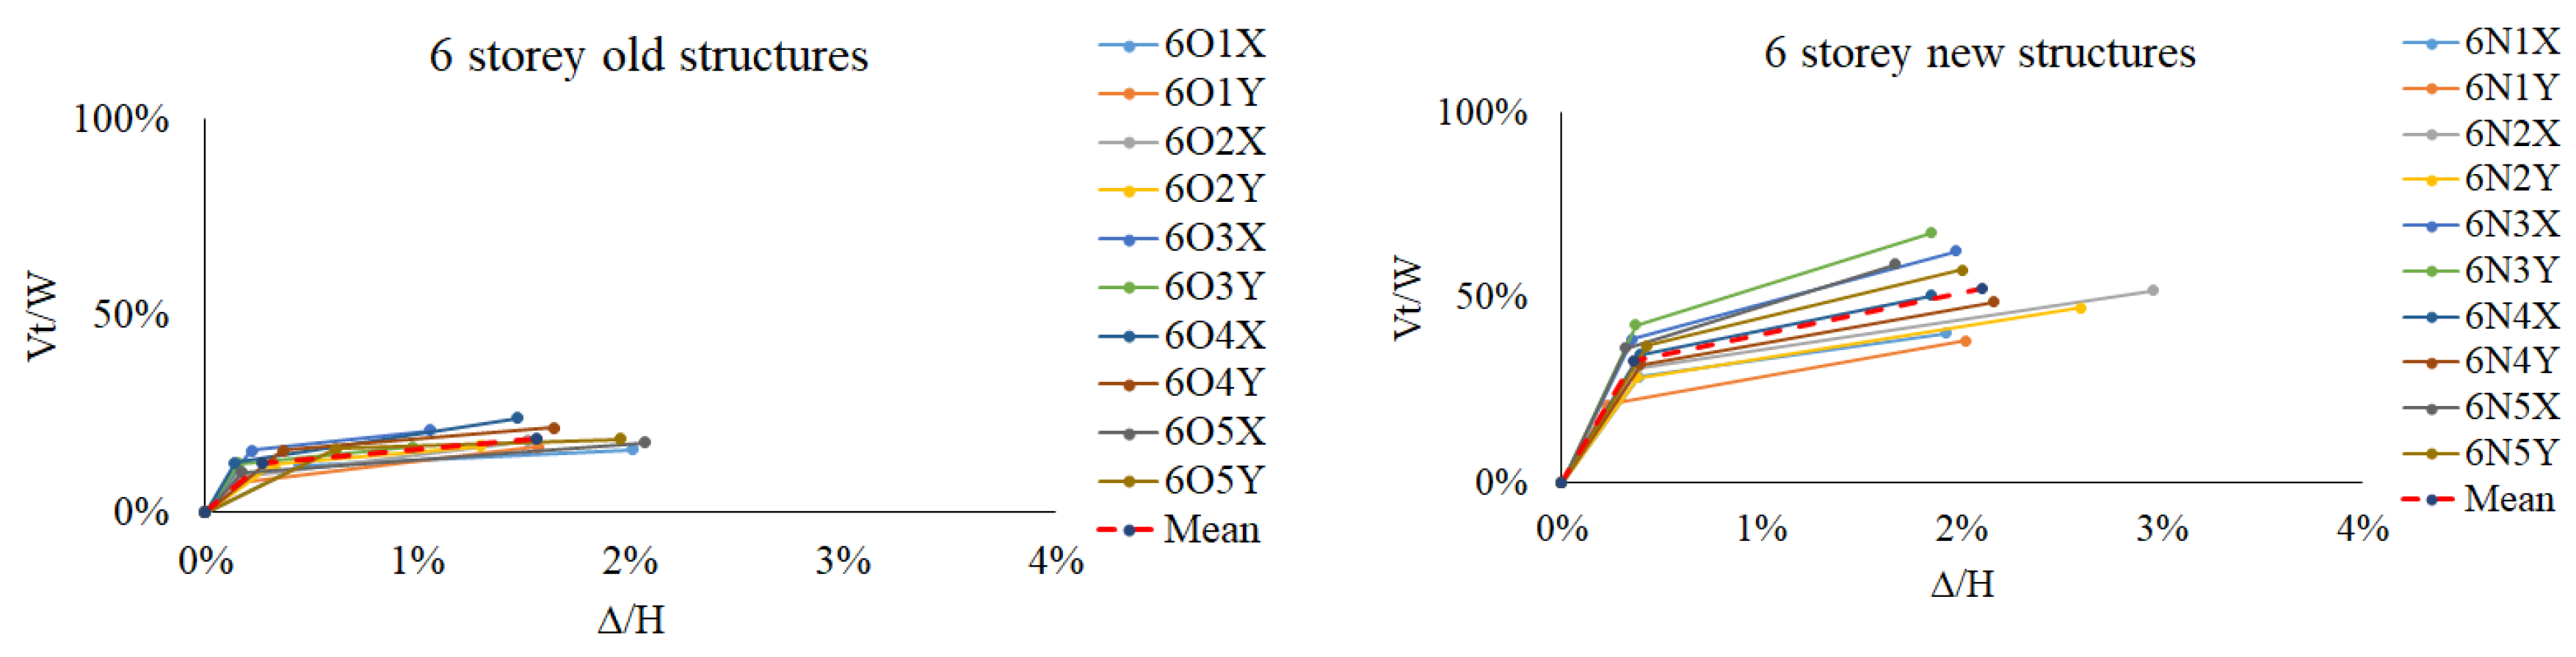
Figure 7.
Capacity information (immediate occupancy and ultimate) of 7-storey buildings.
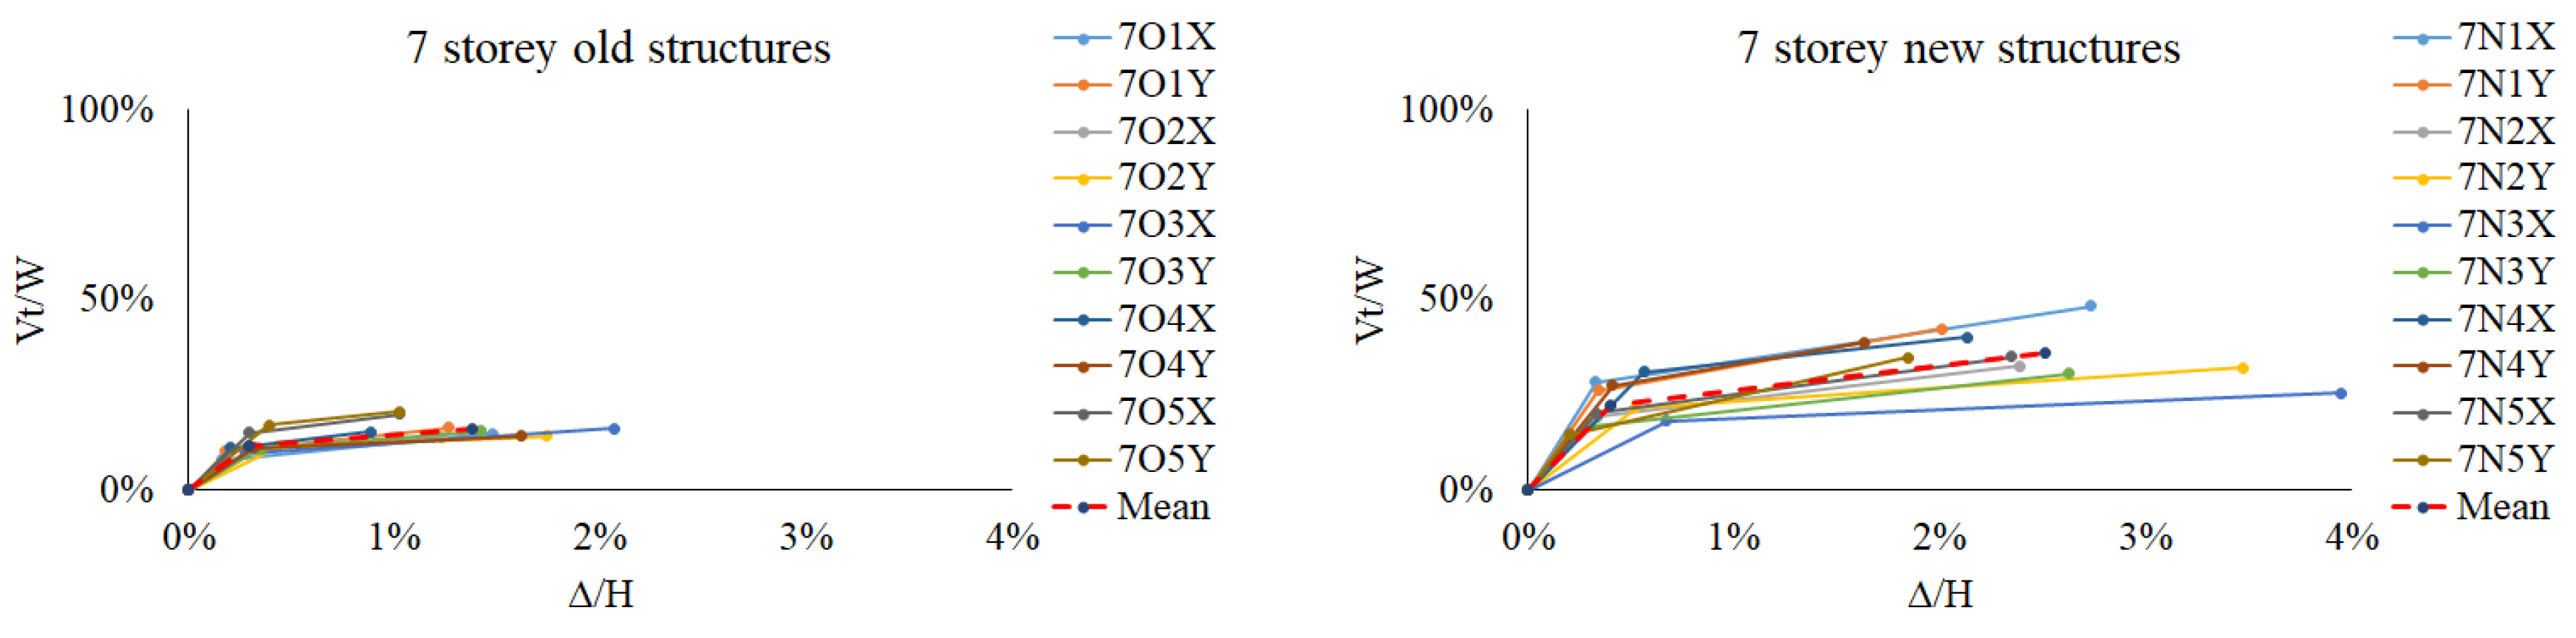
Figure 8.
Capacity information (immediate occupancy and ultimate) of 8-storey buildings.
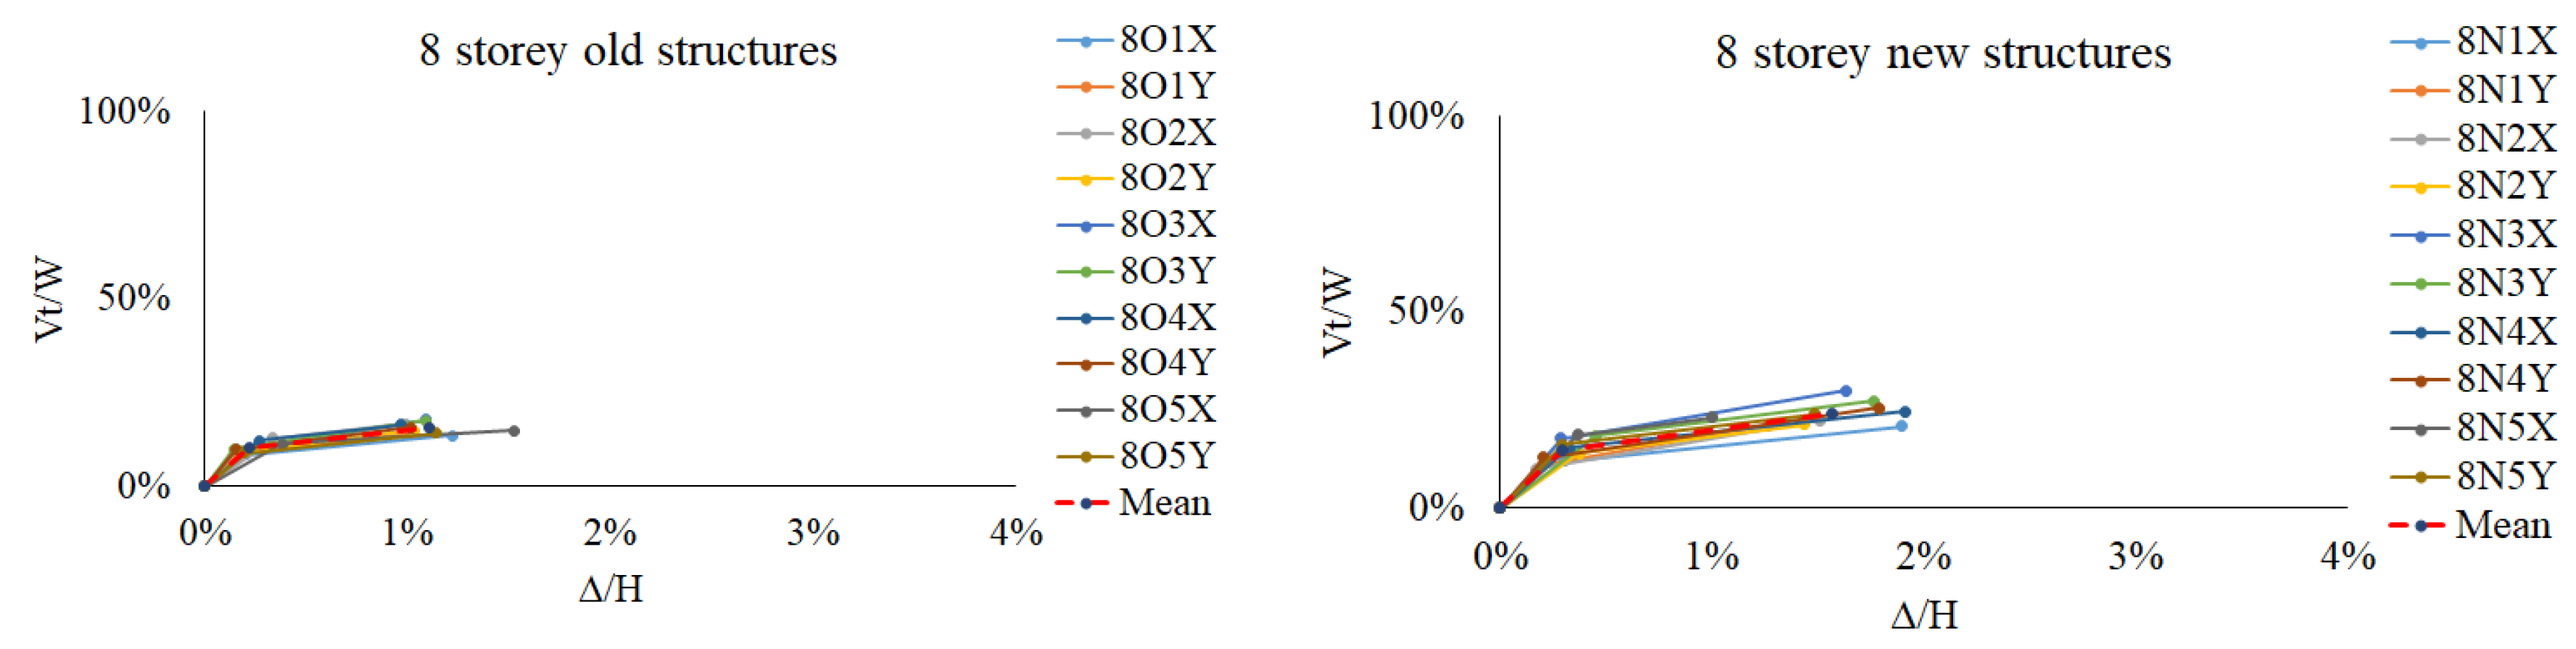
Figure 9.
Map [17] showing that the epicenter of the earthquake, the stations, and the province of Maras.
Figure 9.
Map [17] showing that the epicenter of the earthquake, the stations, and the province of Maras.
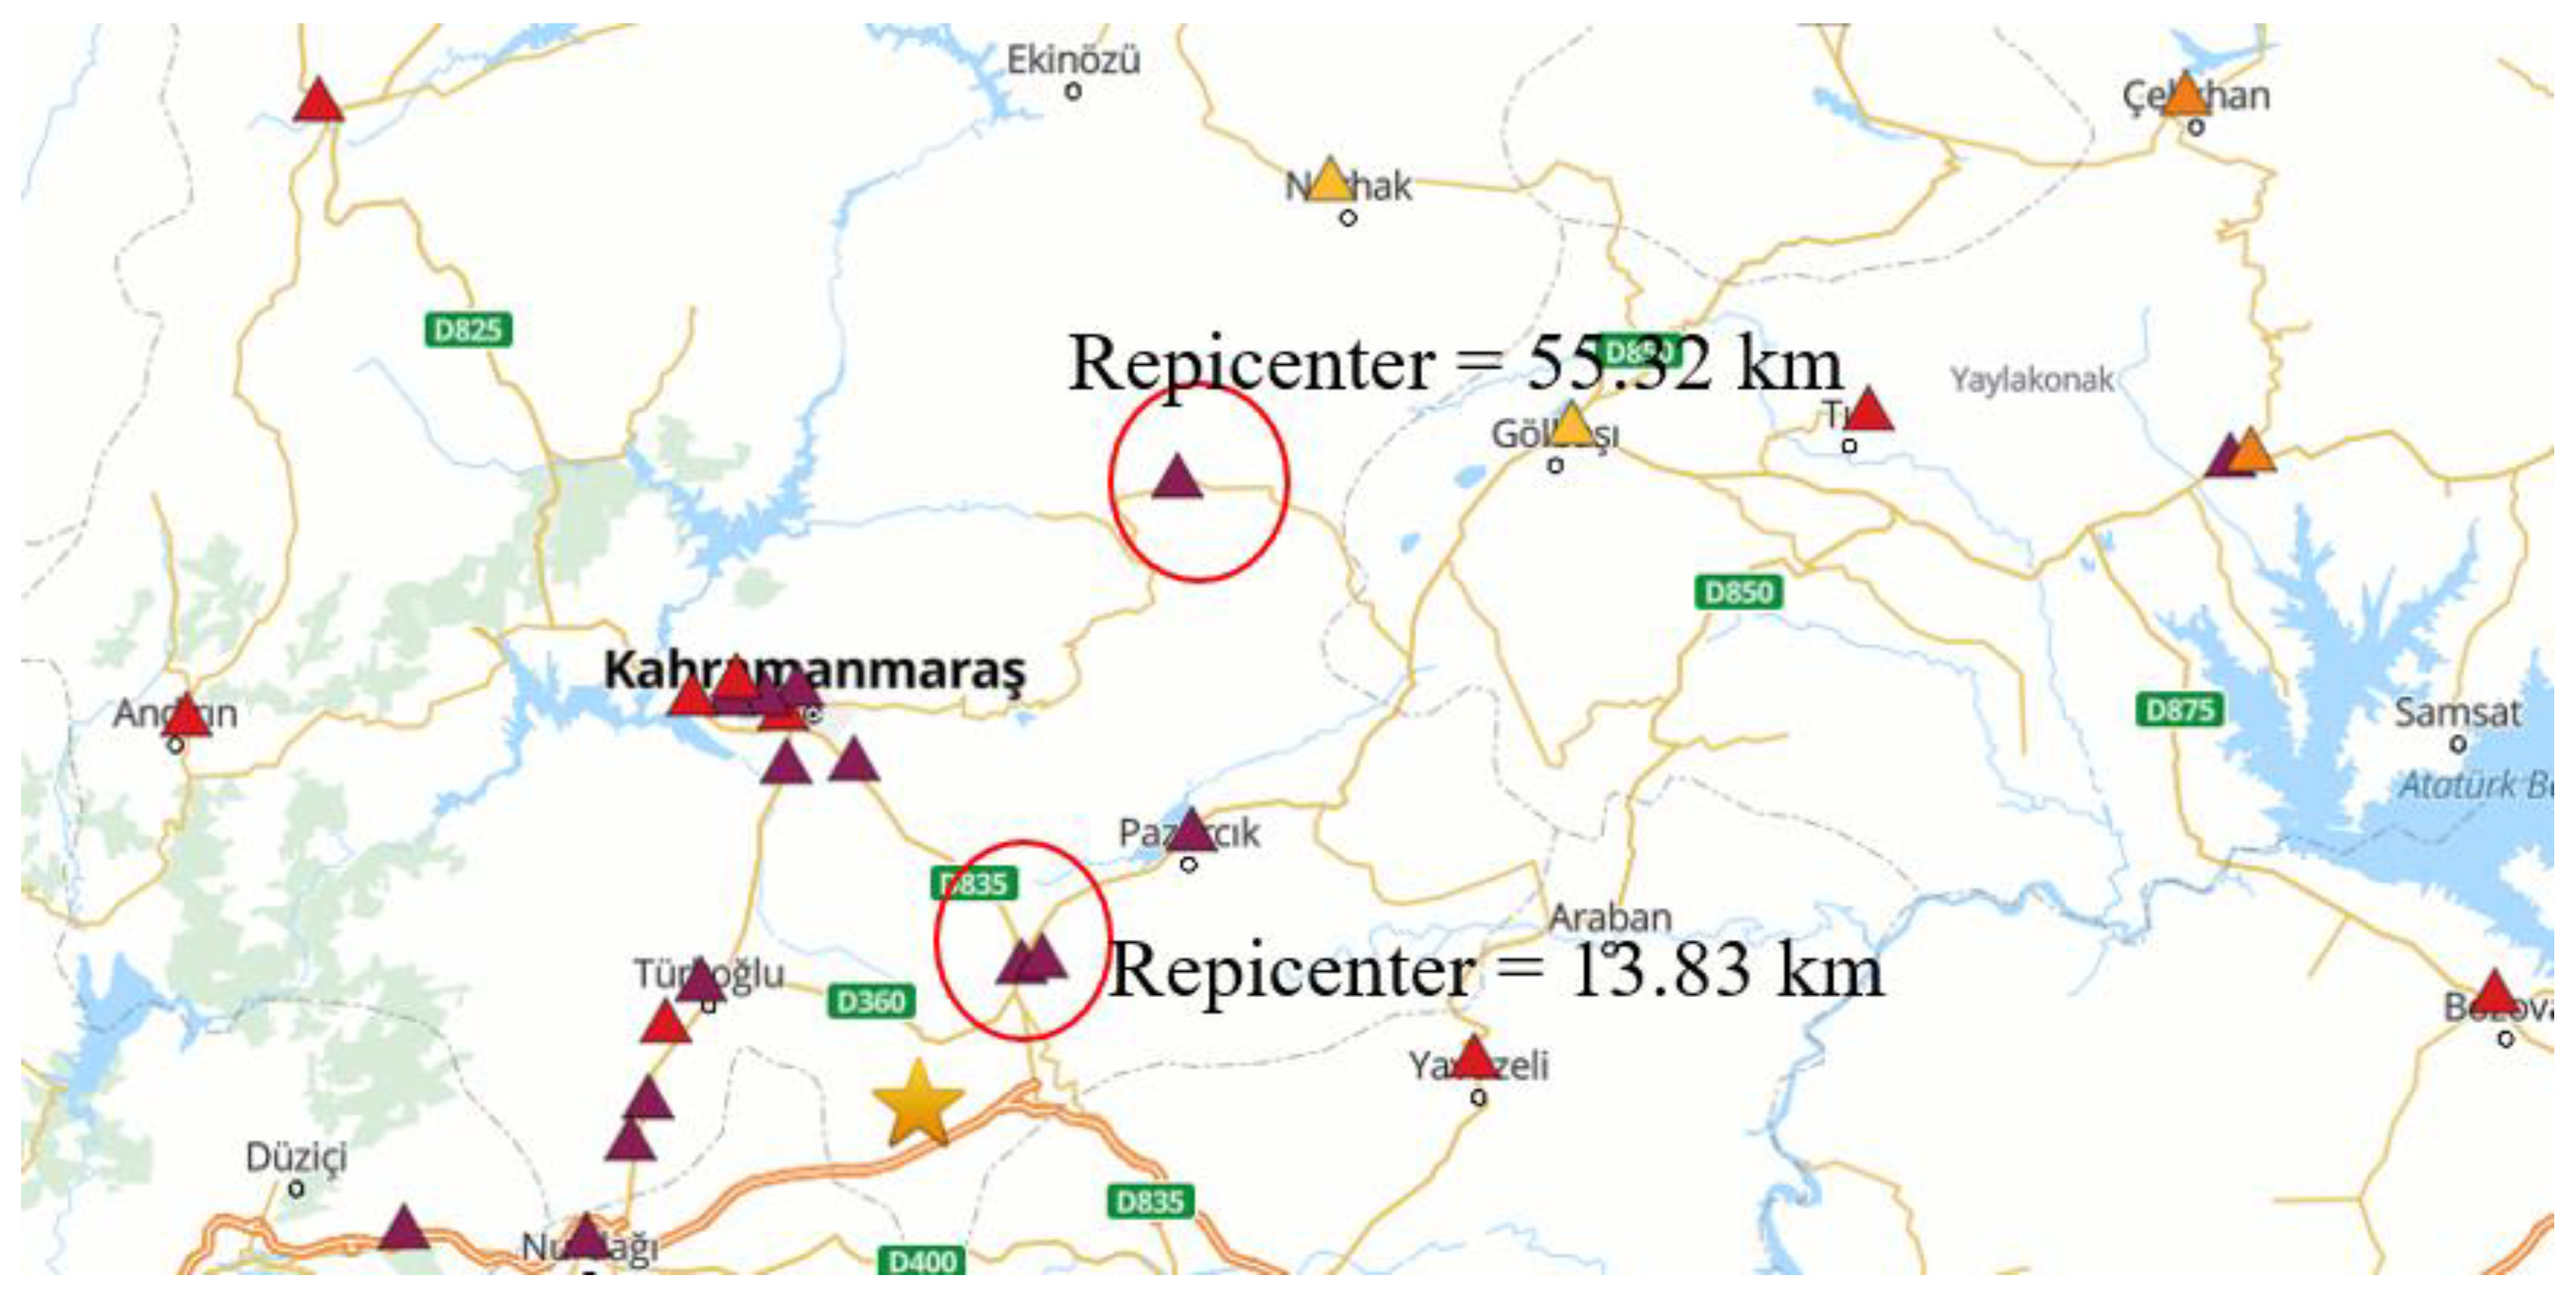
Figure 10.
Unscaled spectrums and the target spectrum of 4615 according to TBEC-2018.
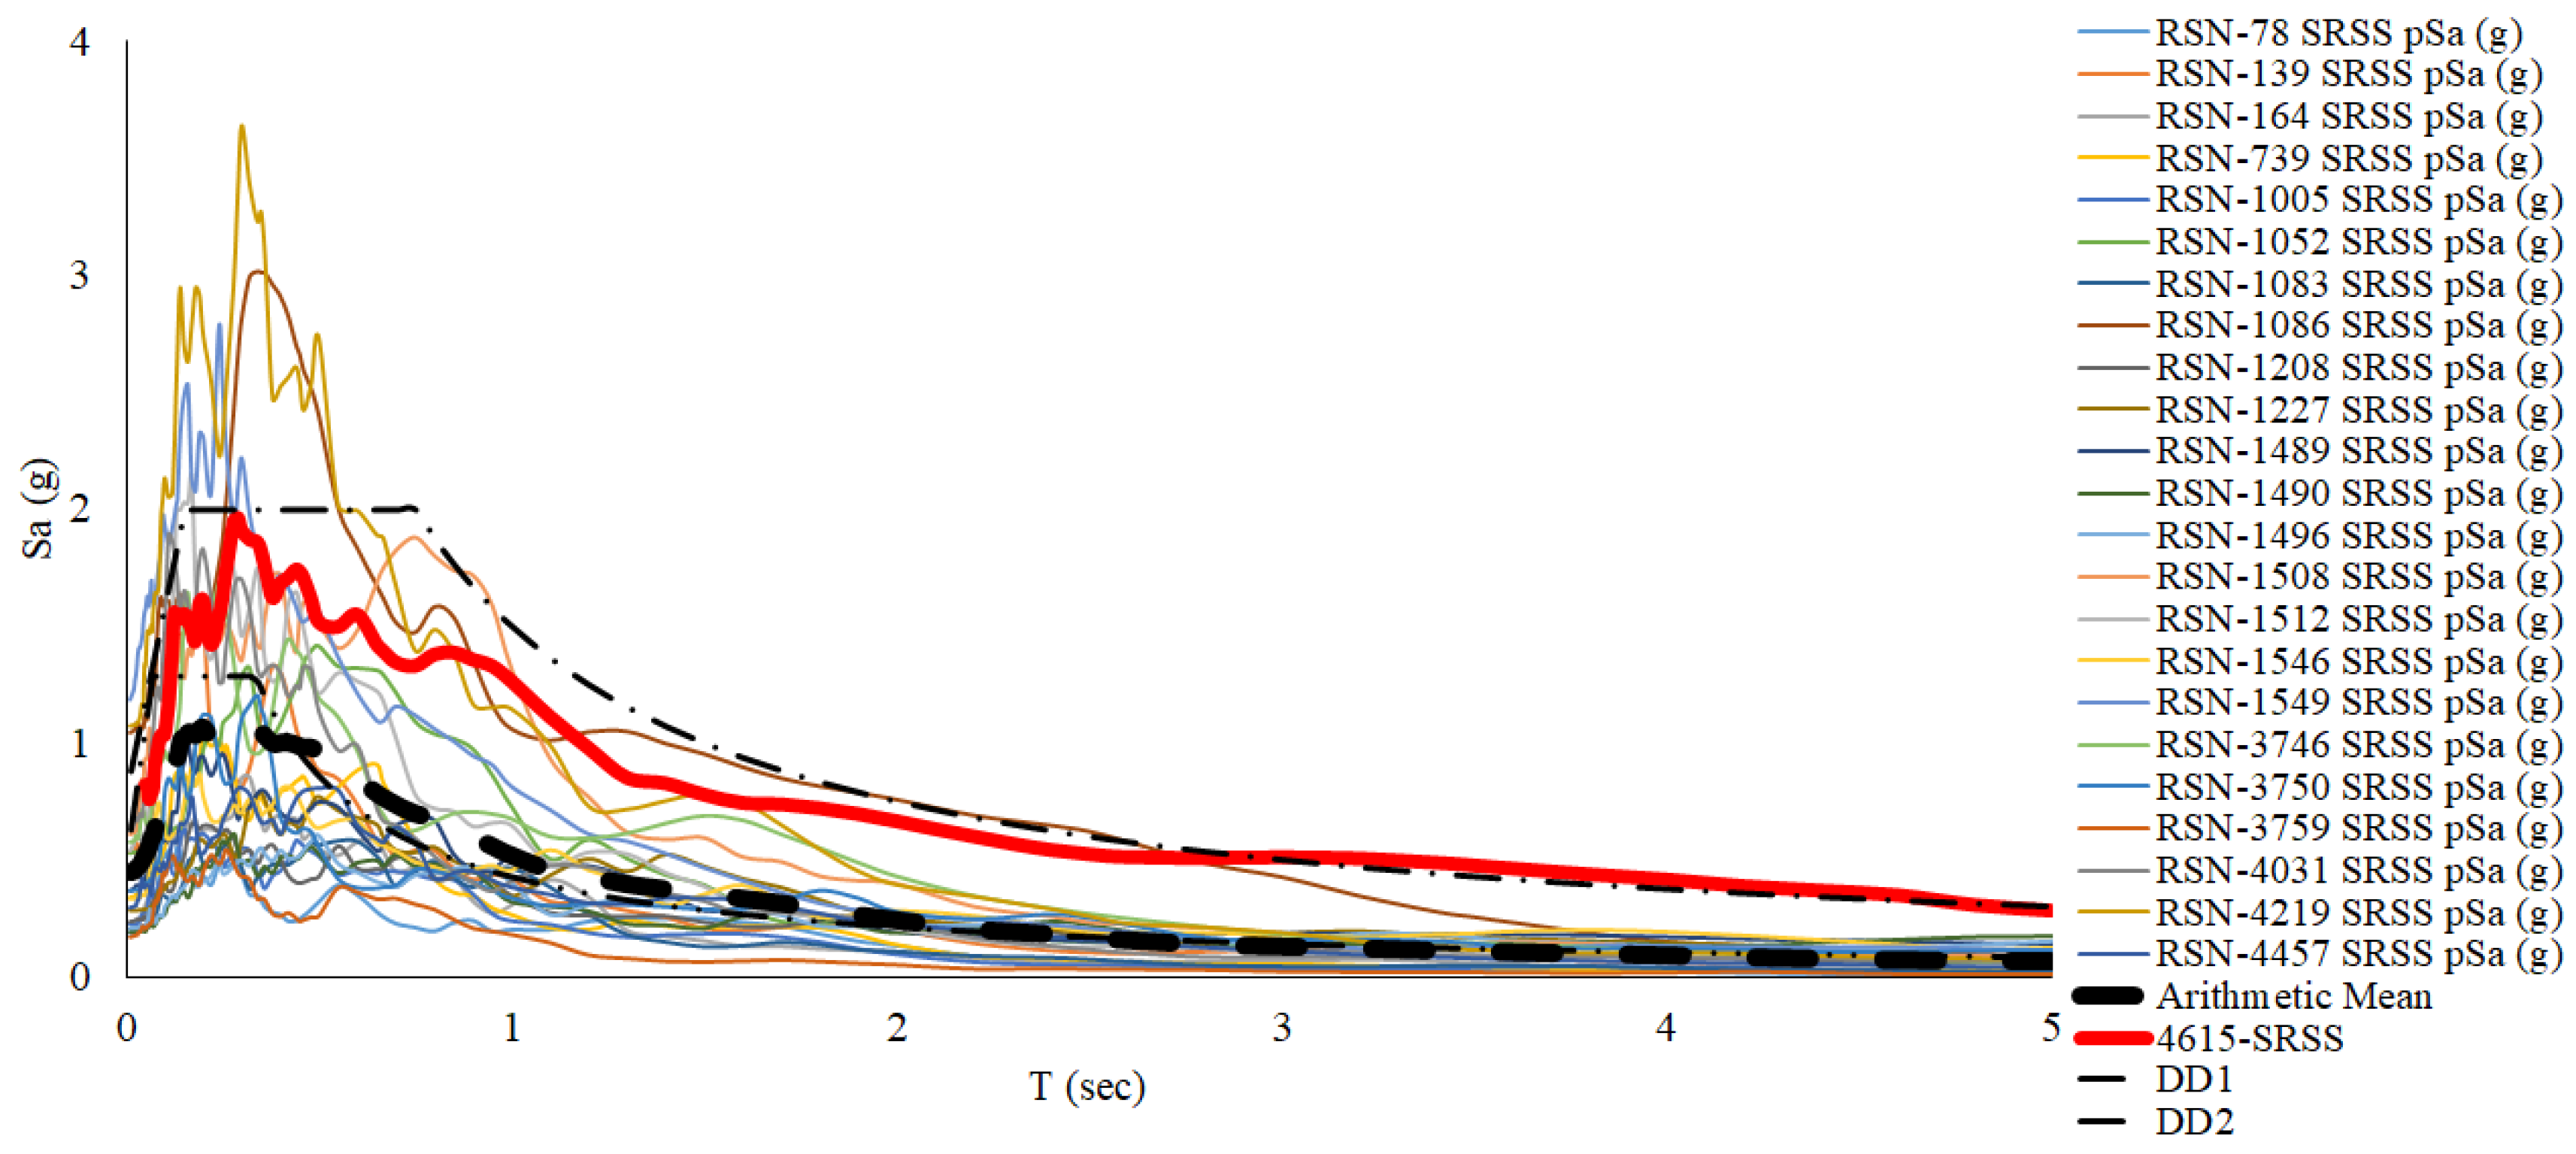
Figure 11.
Unscaled spectrums and the target spectrum of 4611 according to TBEC-2018.
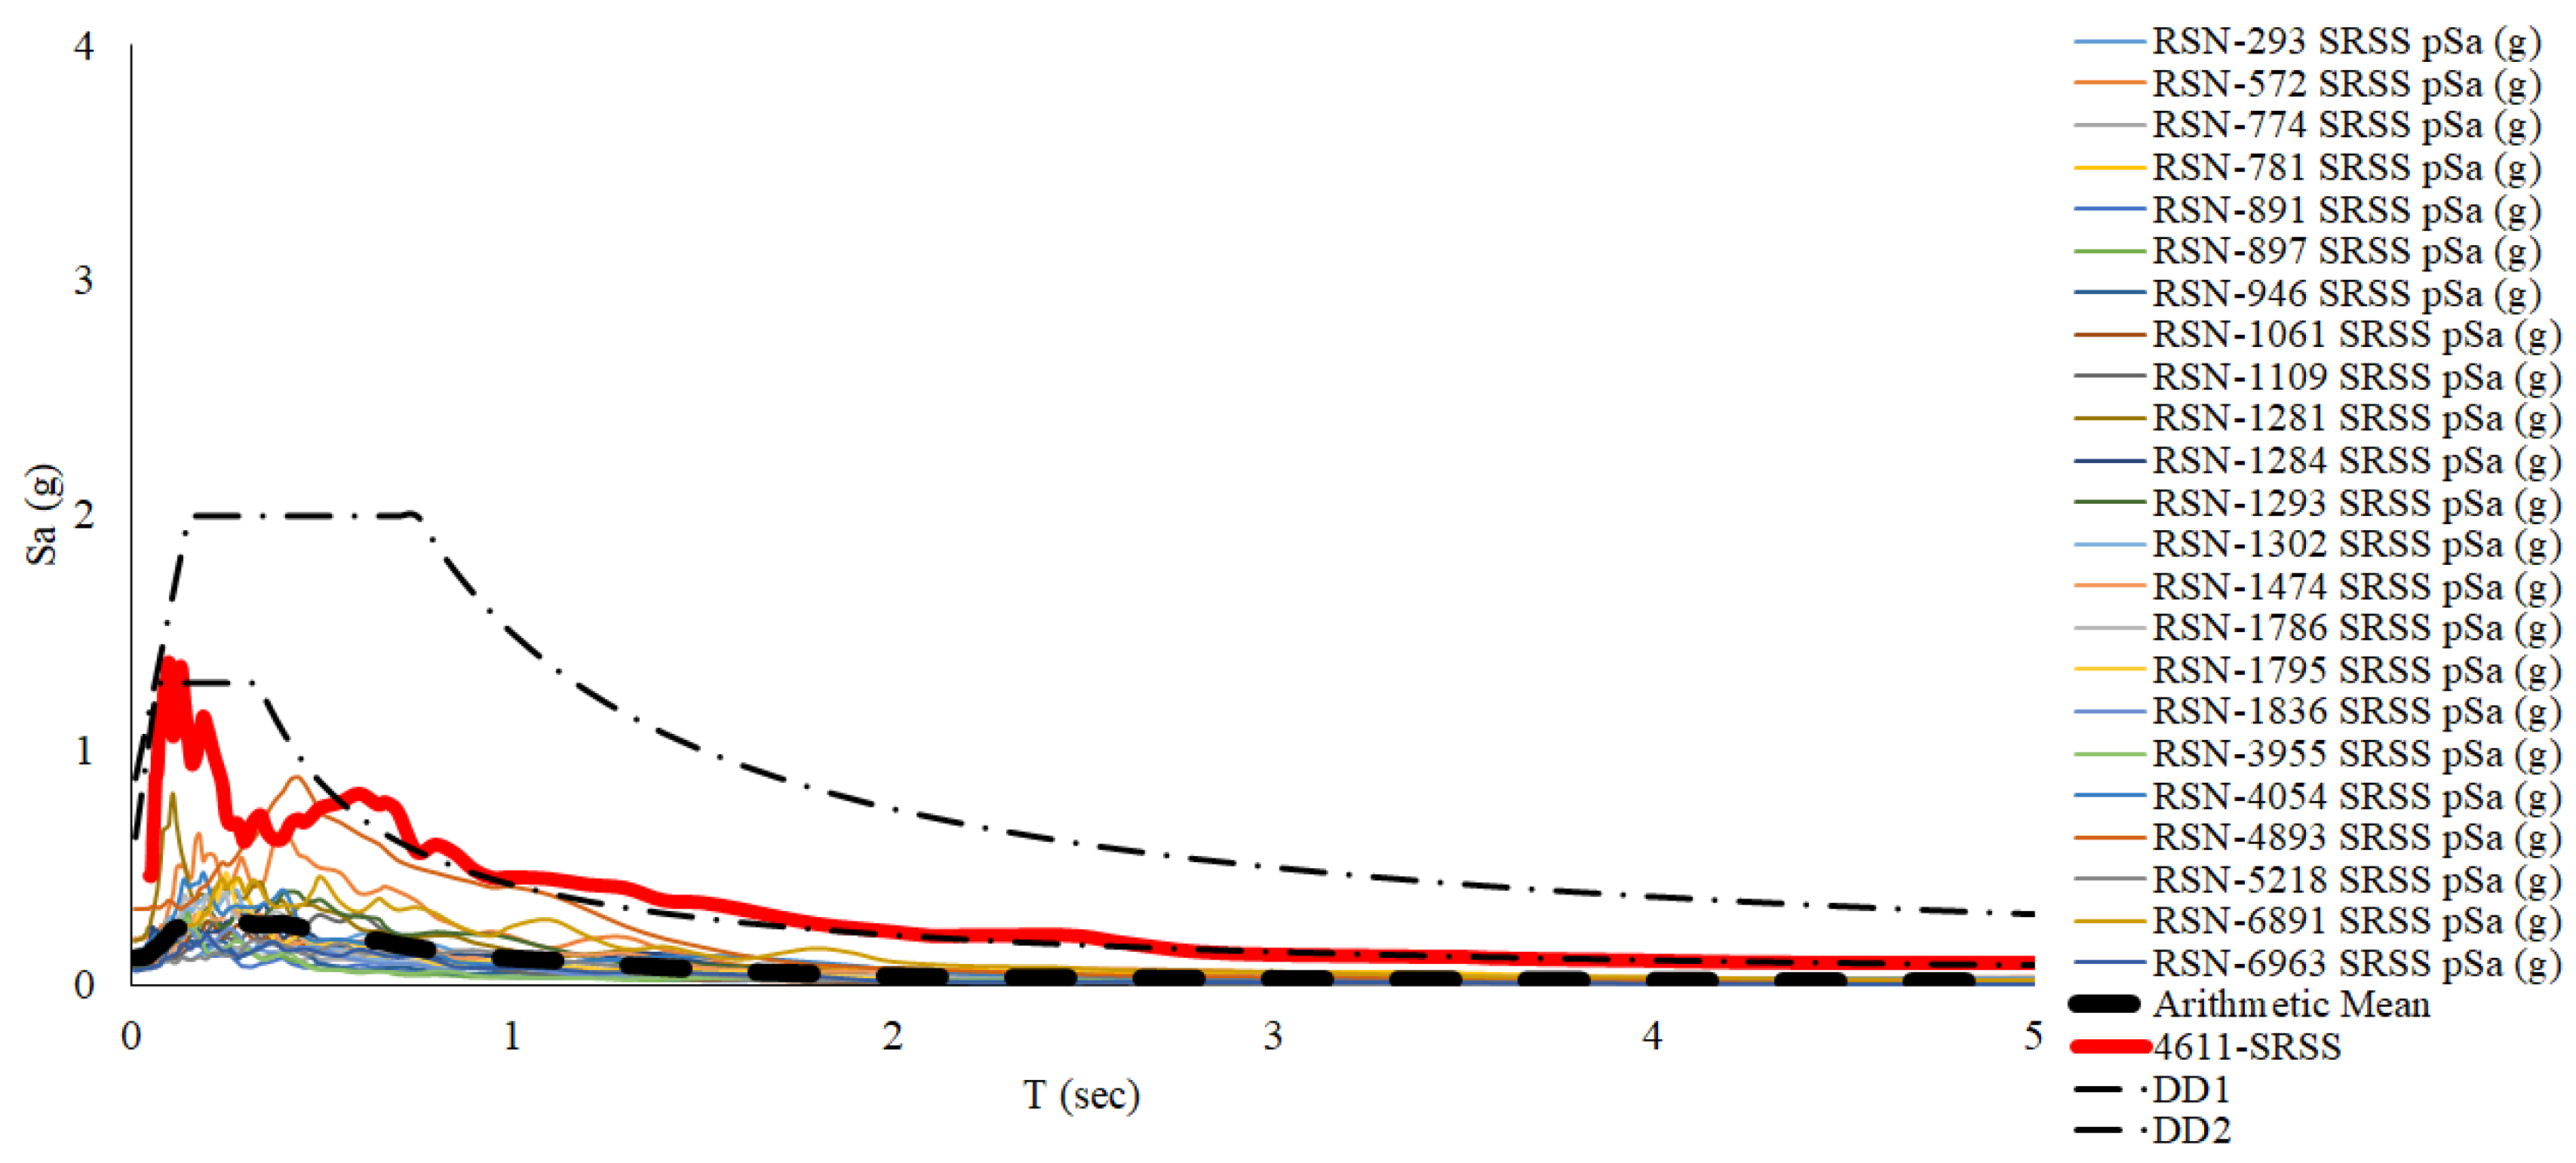
Figure 12.
Scaled spectrums and Maras record of 4615 station.
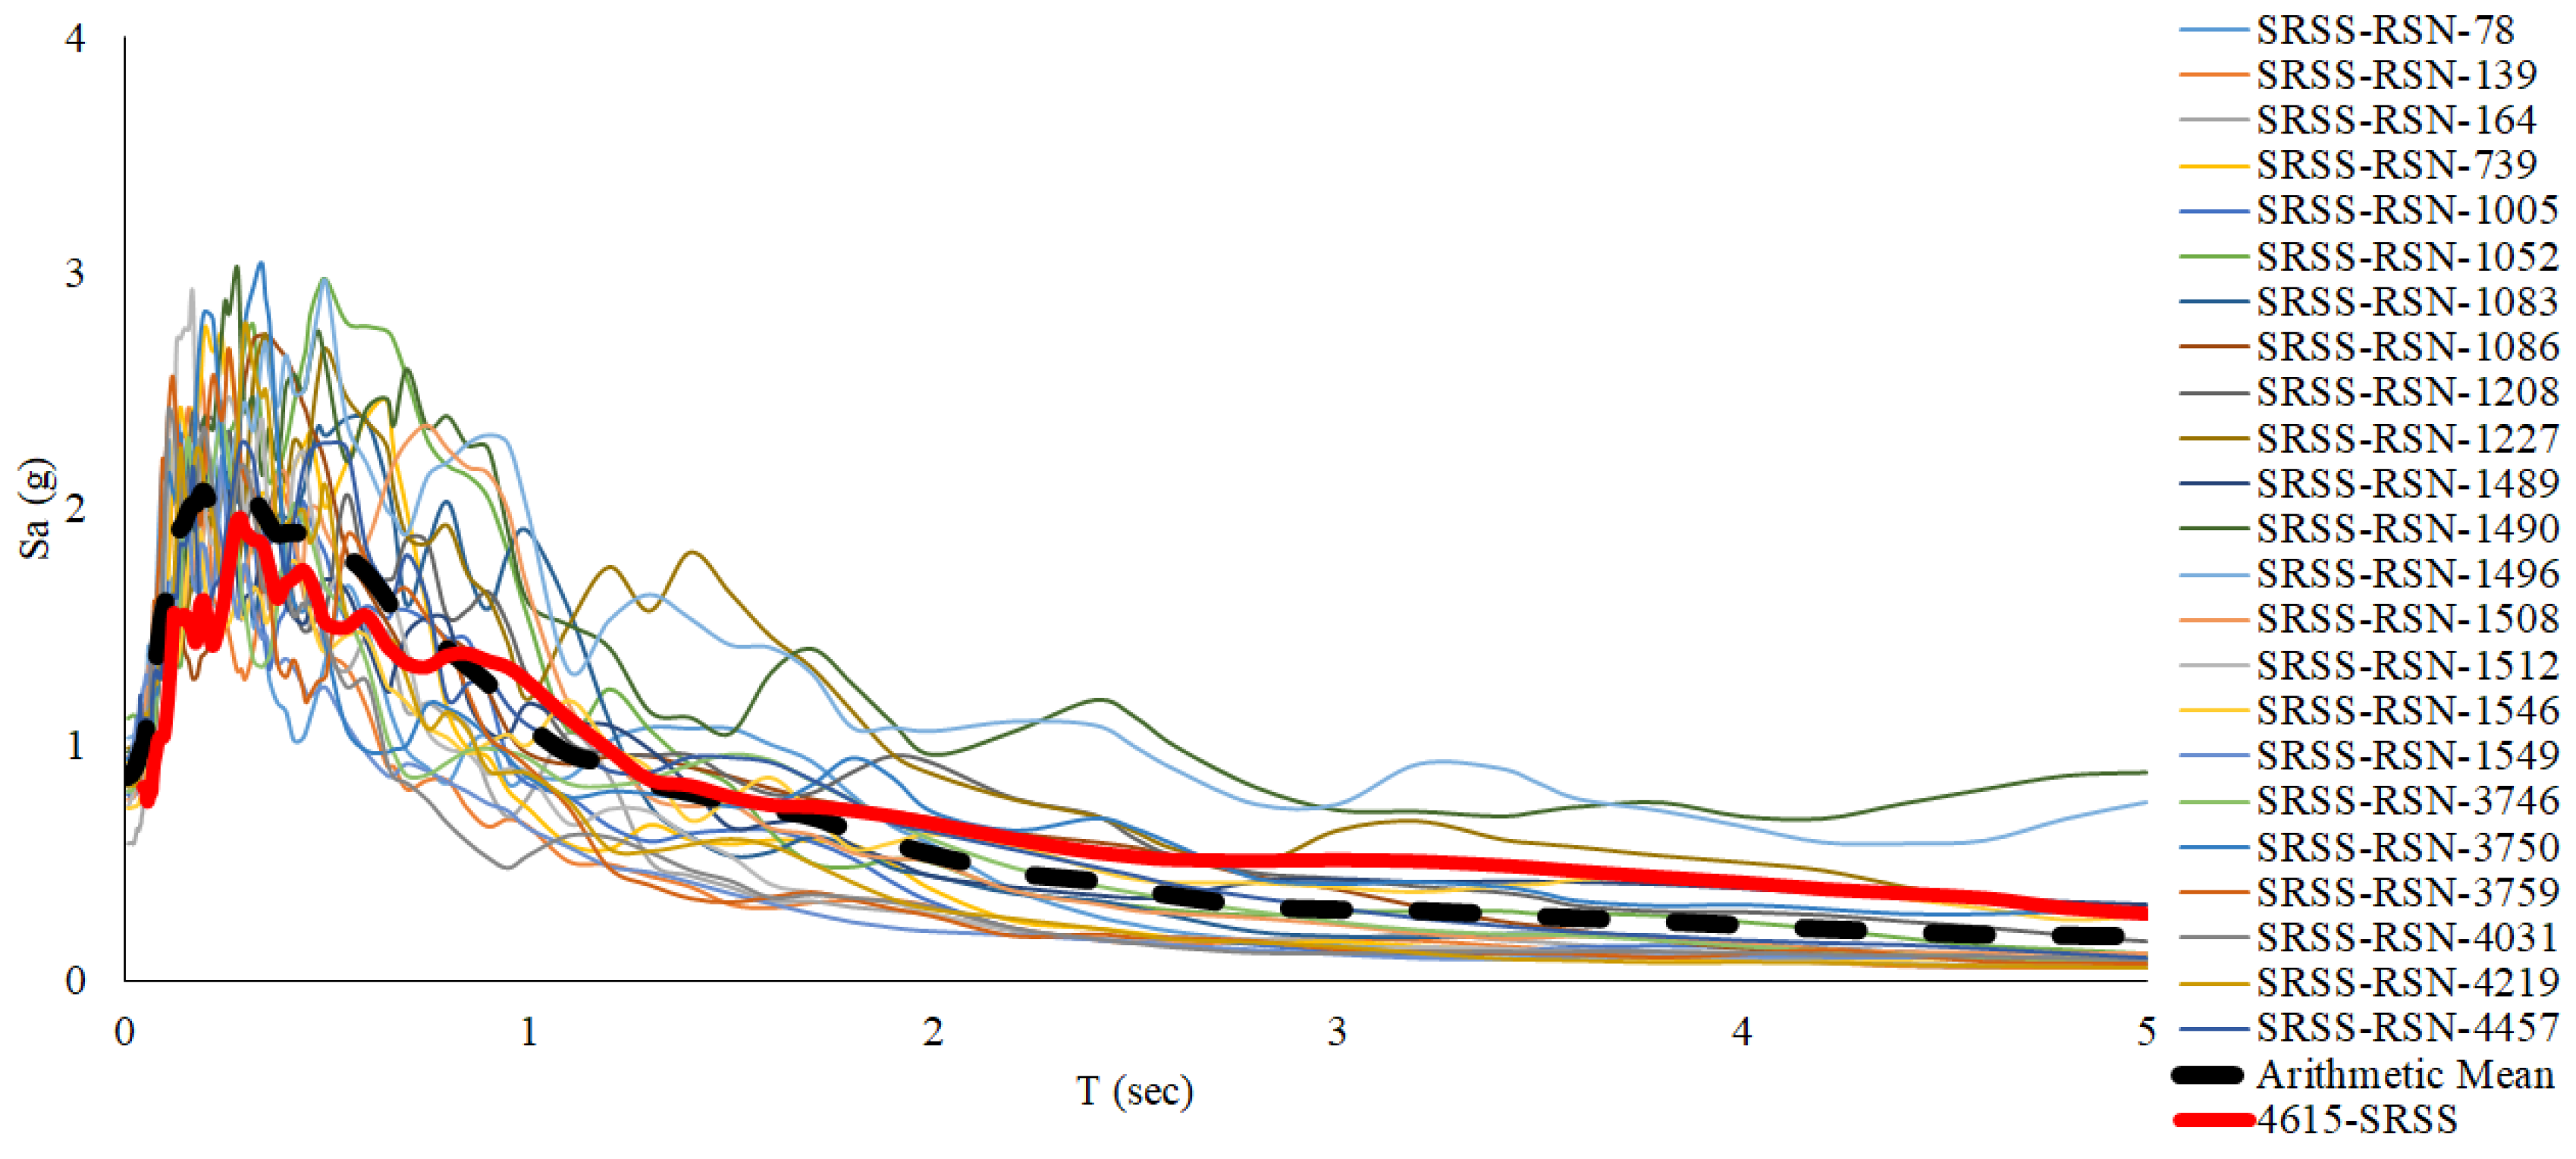
Figure 13.
Scaled spectrums and Maras record of 4611 station.
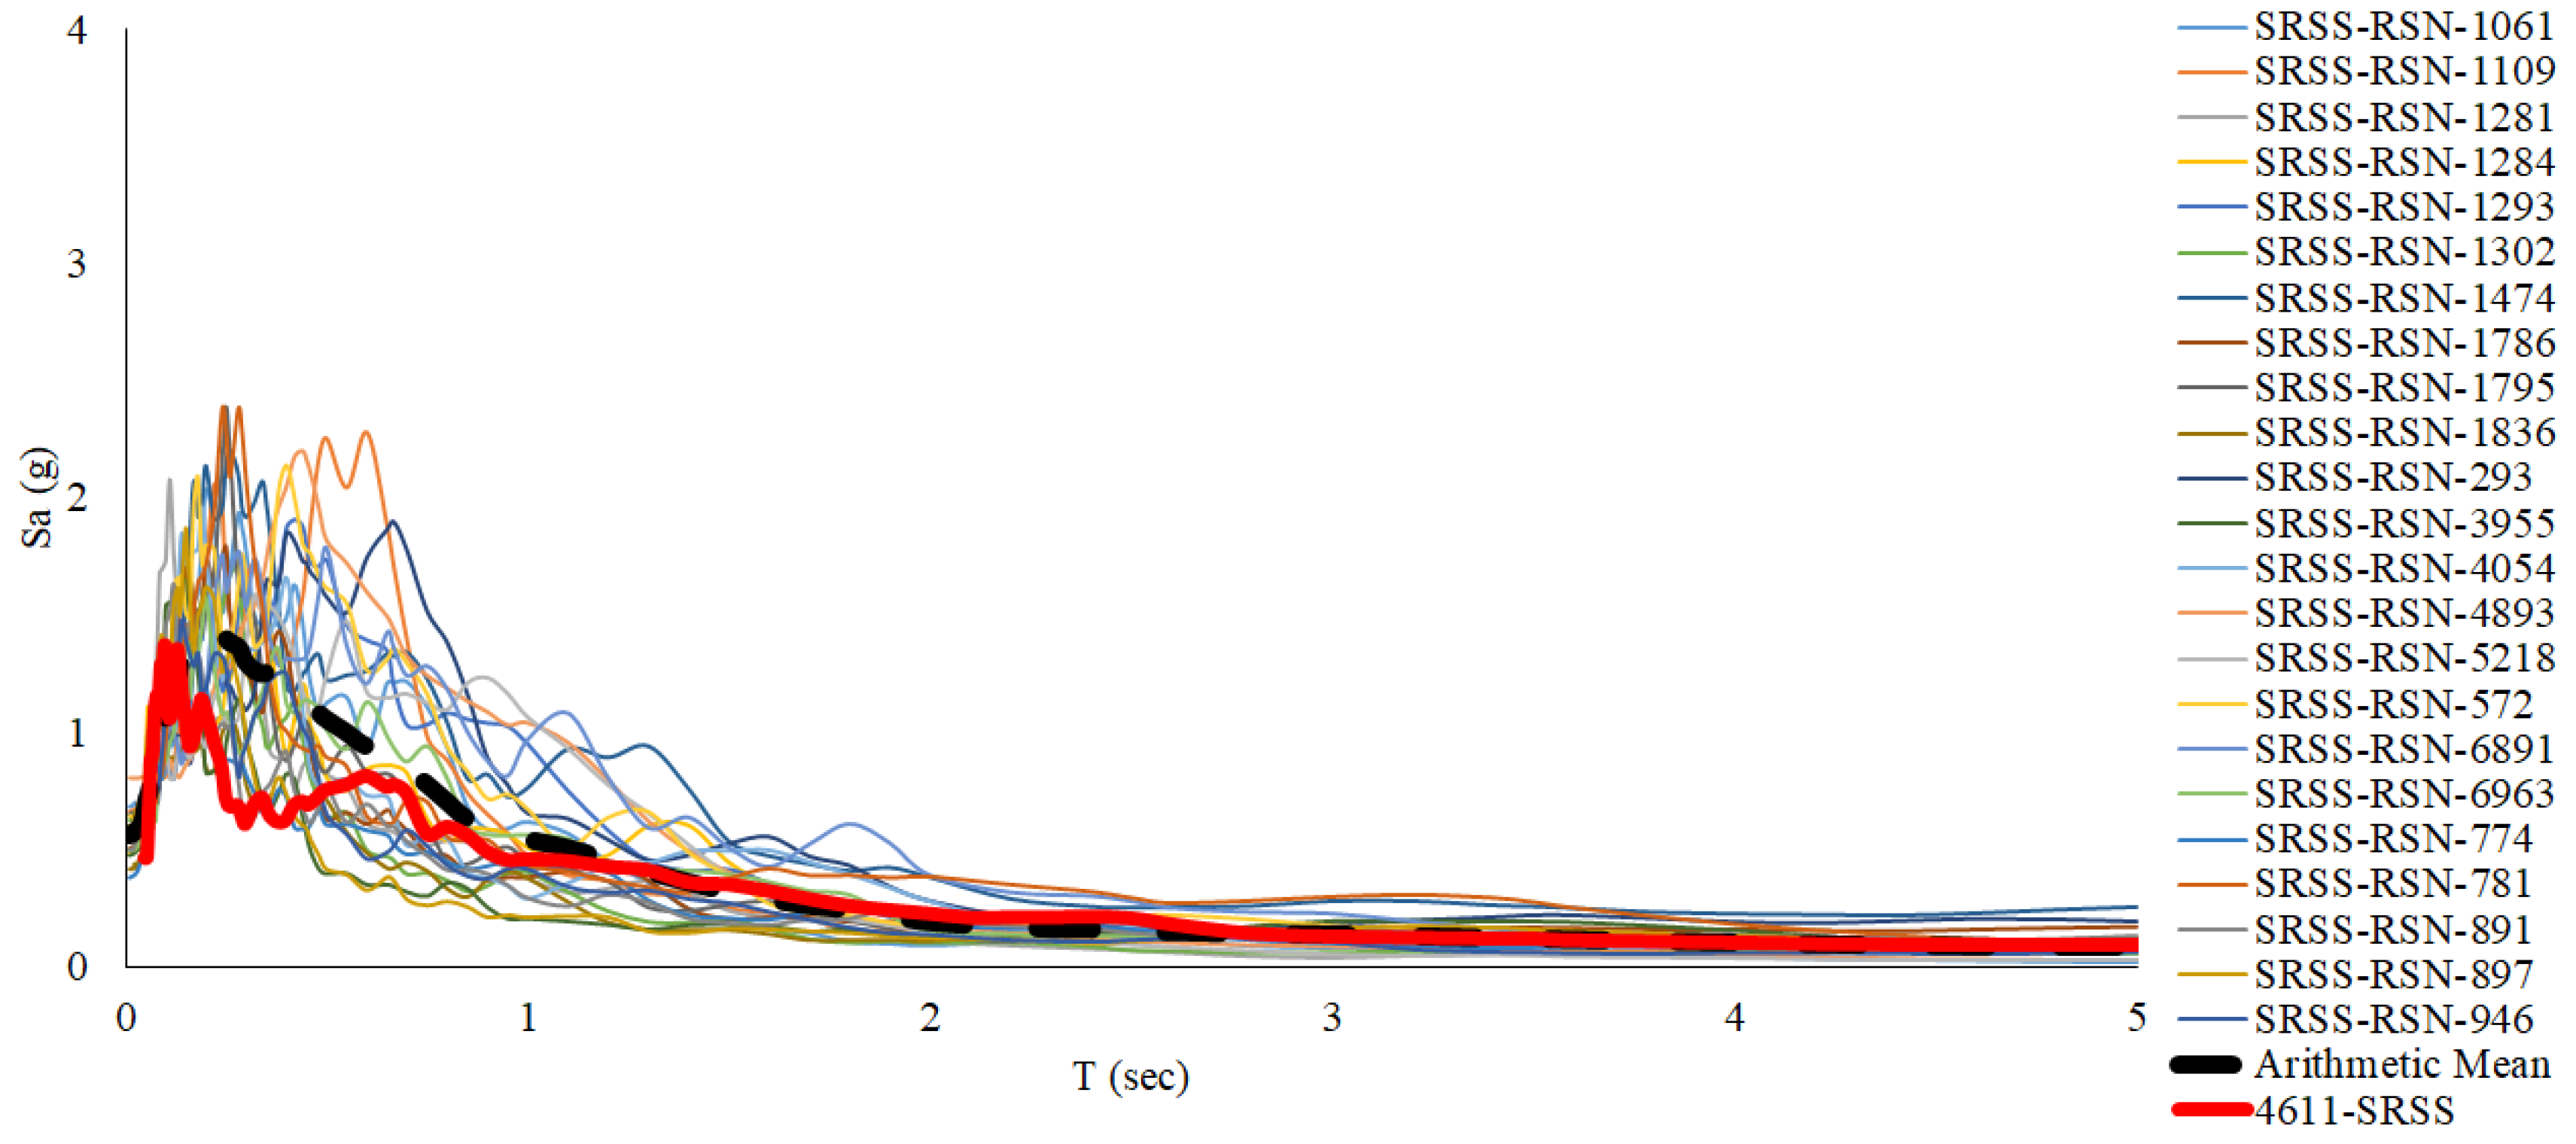
Figure 14.
Fragility curves for new and old buildings (station 4615).
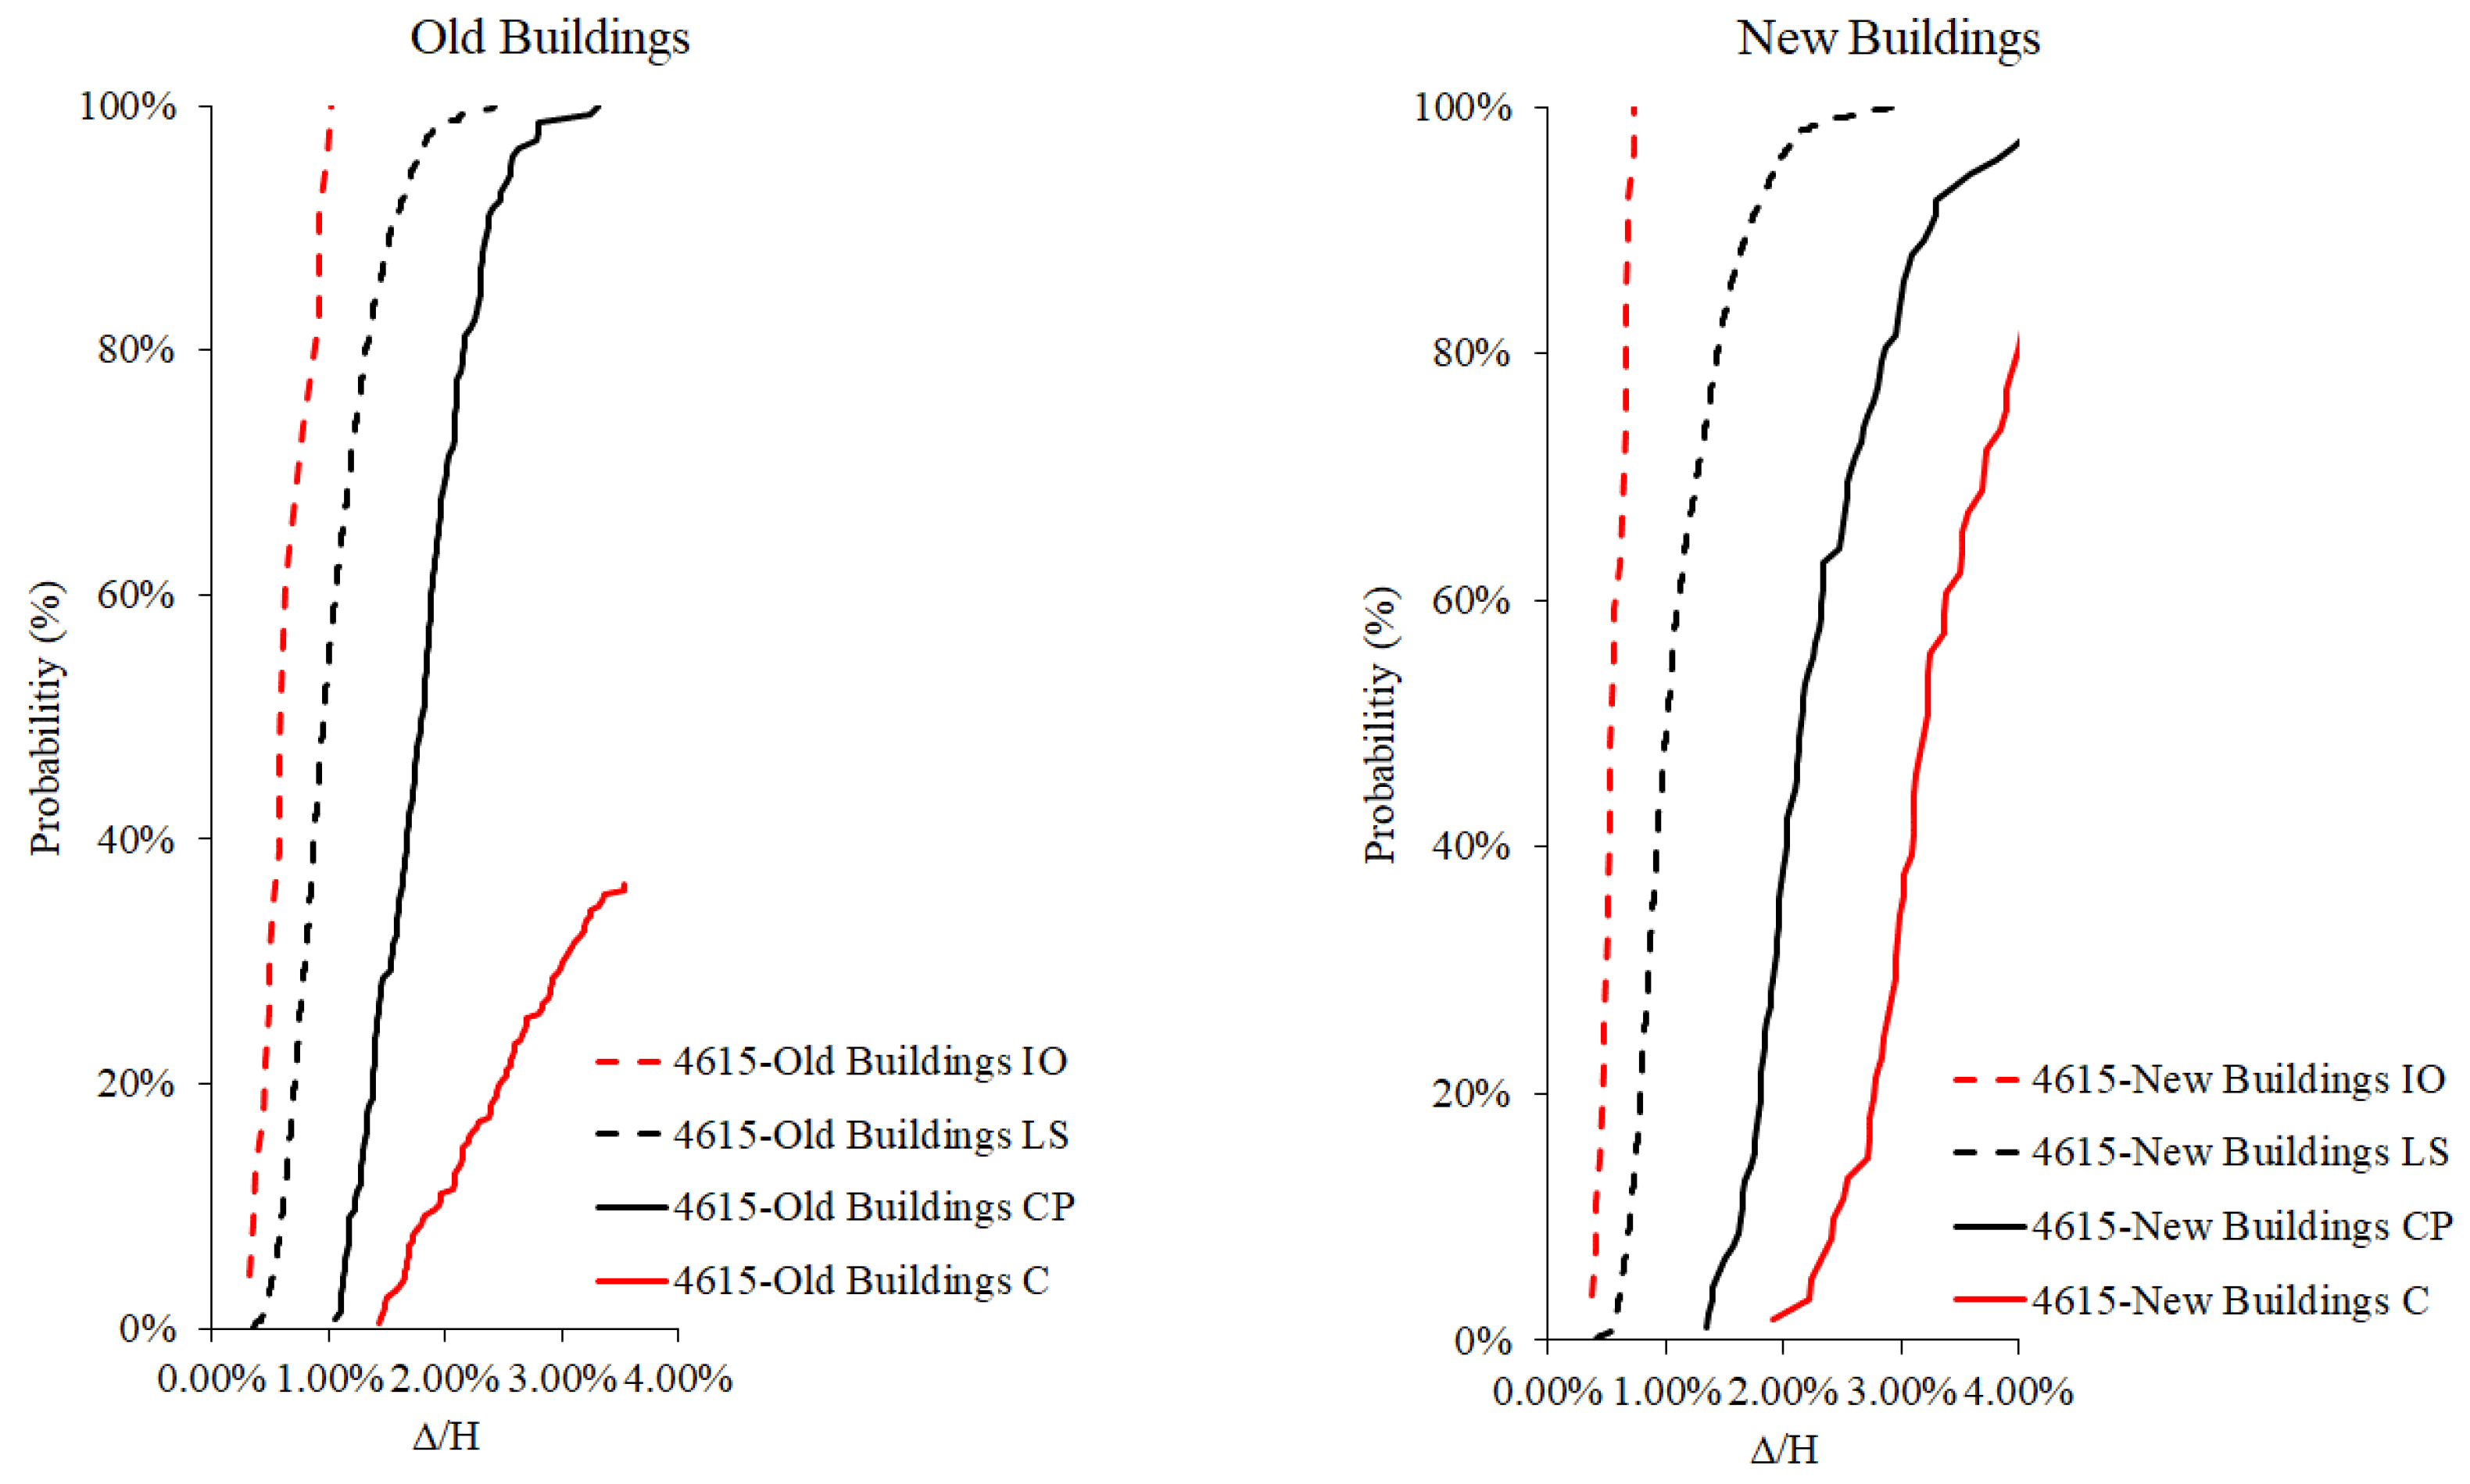
Figure 15.
Fragility curves for new and old buildings (station 4611).
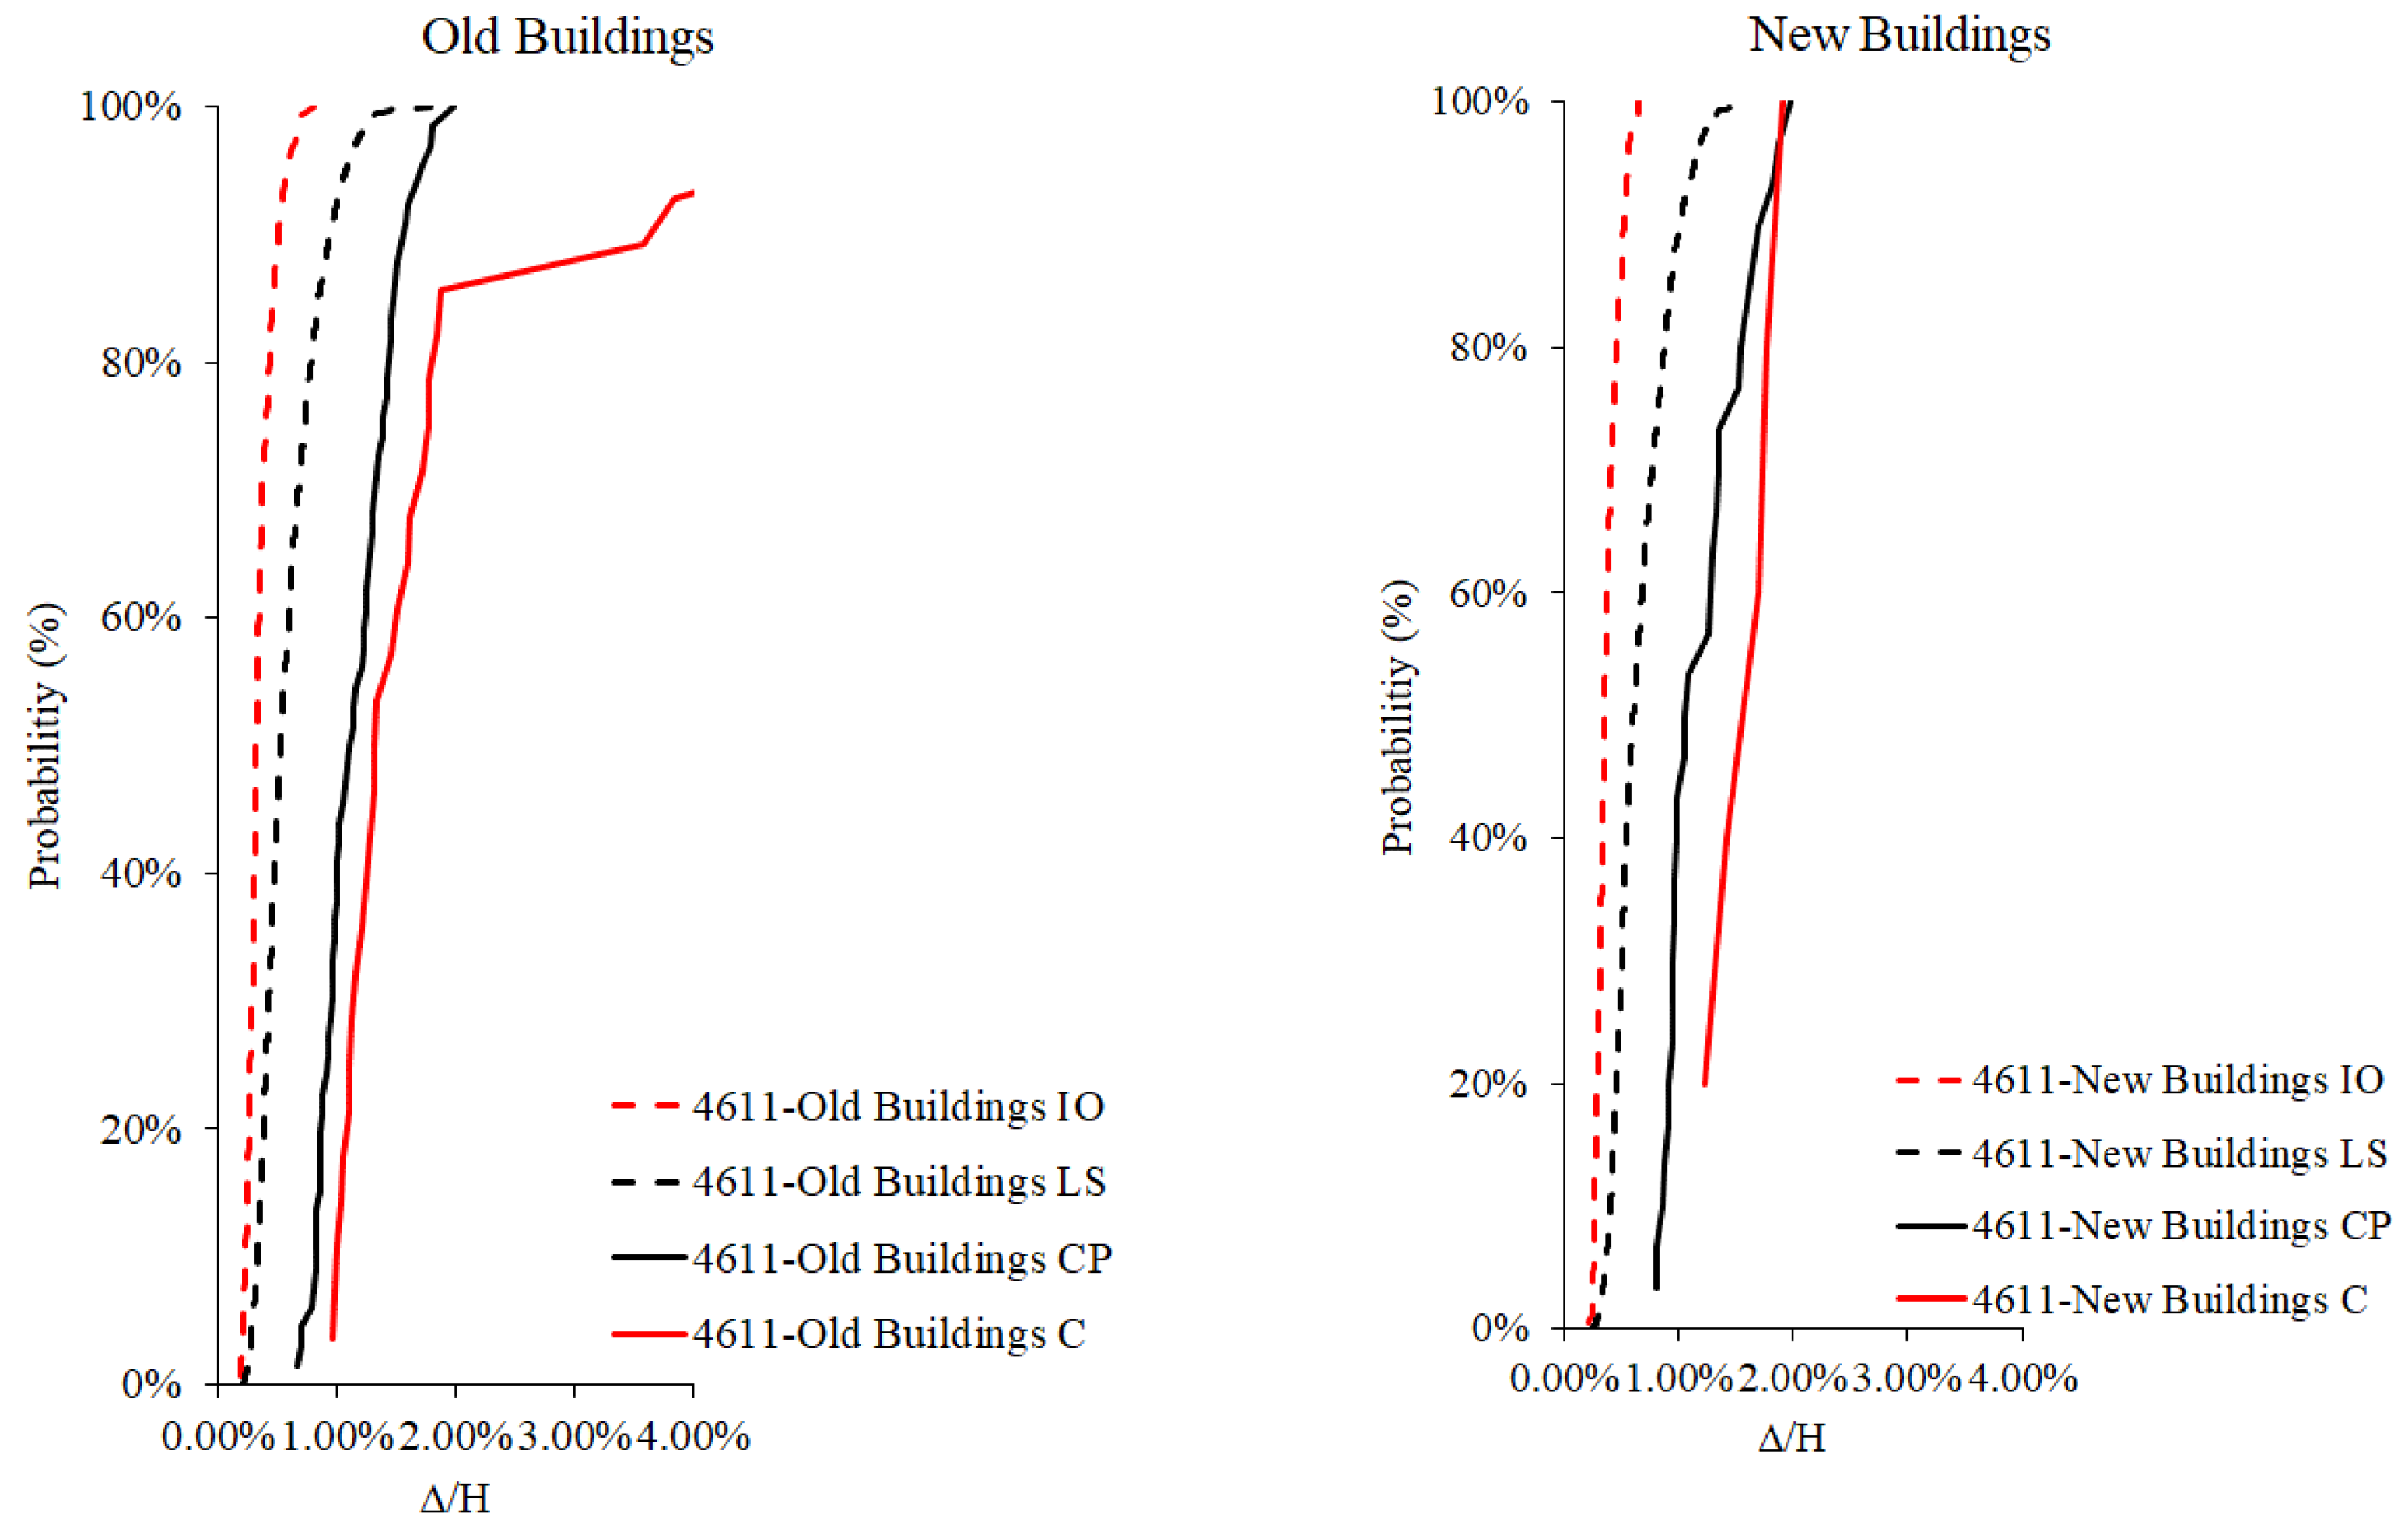
Figure 16.
Fragility curves for new and old buildings.
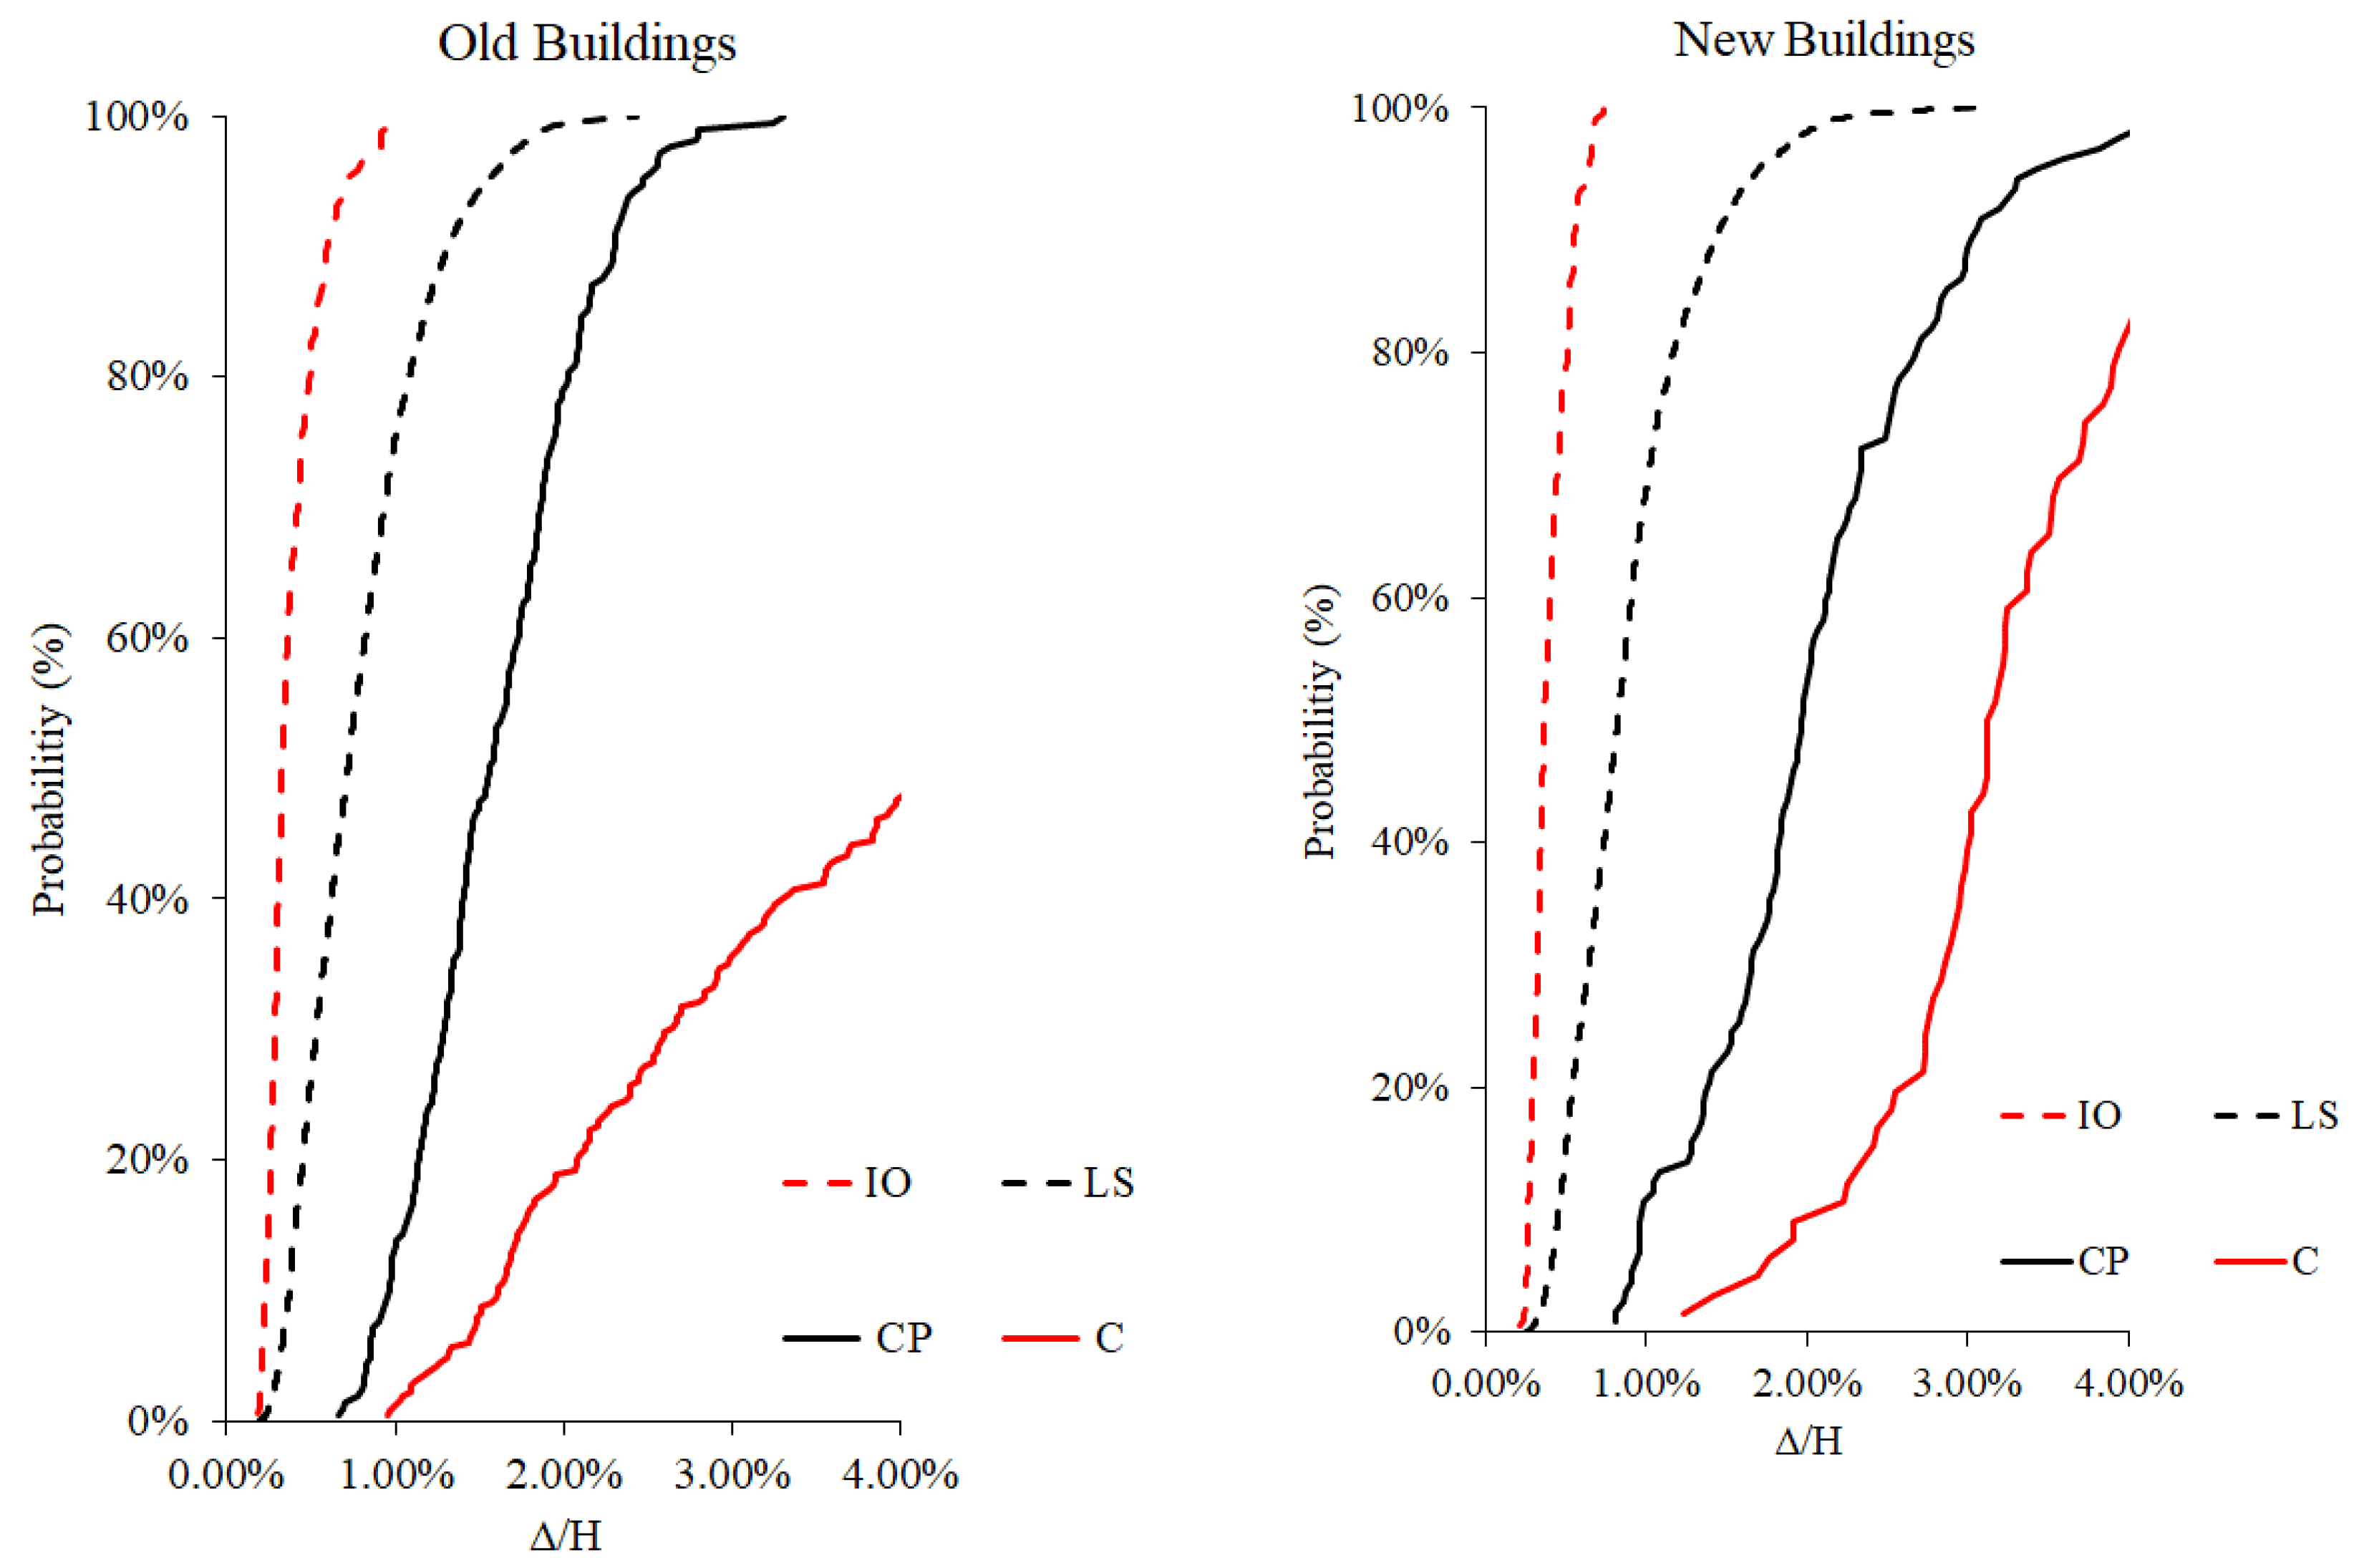

Table 1.
Information considered when creating the floor plans.
| Span (m) | Number of Spans in X and Y Direction | Storey Height (m) | Column Dimensions (b) (m) | Column Dimensions (h) (m) | Beam Dimensions (b) (m) | Beam Dimensions (h) (m) |
|---|---|---|---|---|---|---|
| 2.00 | 2 | 2.75 | 0.30 | 0.30 | 0.25 | 0.50 |
| 2.25 | 3 | 3.00 | 0.35 | 0.35 | 0.30 | 0.60 |
| 2.50 | 4 | 3.25 | 0.40 | 0.40 | ||
| 2.75 | 5 | 0.45 | 0.45 | |||
| 3.00 | 6 | 0.50 | 0.50 | |||
| 3.25 | 7 | 0.55 | 0.55 | |||
| 3.50 | 0.60 | 0.60 | ||||
| 3.75 | 0.65 | 0.65 | ||||
| 4.00 | 0.70 | 0.70 | ||||
| 4.25 | 0.75 | 0.75 | ||||
| 4.50 | ||||||
| 4.75 | ||||||
| 5.00 | ||||||
| 5.25 | ||||||
| 5.50 | ||||||
| 5.75 | ||||||
| 6.00 | ||||||
| 6.25 | ||||||
| 6.50 | ||||||
| 6.75 | ||||||
| 7.00 |
Table 2.
The damage limits specified in the TBEC-2018.
| Damage Level | Concrete Limit State | Steel Limit State |
|---|---|---|
| Limited Damage | εcLD =0.0025 | εs =0.0075 |
| Significant Damage | εcSD =0.75 εcCP | εsSD =0.75 εsCP |
| Collapse Prevention | εcCP =0.0025+0.04 ≤ 0.018 | εs = 0.4 εsu |
Table 3.
Average capacity data for buildings.
| Model Mean | VIO (%) | Vu (%) | ΔIO (%) | Δu (%) |
|---|---|---|---|---|
| 3sO | 27.8 | 38.1 | 0.3 | 2.0 |
| 3sN | 40.4 | 59.8 | 0.3 | 2.0 |
| 4sO | 21.5 | 28.6 | 0.4 | 1.9 |
| 4sN | 33.7 | 52.9 | 0.3 | 2.2 |
| 5sO | 19.5 | 28.7 | 0.3 | 1.8 |
| 5sN | 30.4 | 46.2 | 0.4 | 2.0 |
| 6sO | 12.4 | 18.7 | 0.3 | 1.6 |
| 6sN | 33.1 | 52.5 | 0.4 | 2.1 |
| 7sO | 11.6 | 16.2 | 0.3 | 1.4 |
| 7sN | 22.5 | 36.1 | 0.4 | 2.5 |
| 8sO | 10.1 | 15.6 | 0.2 | 1.1 |
| 8sN | 14.6 | 24.1 | 0.3 | 1.6 |
Table 4.
Selected ground motion records for 4615 station.
| Record Sequence Number | Earthquake Name | Year | Station Name | Magnitude | Rjb (km) | Vs30 (m/sec) |
|---|---|---|---|---|---|---|
| 78 | San Fernando | 1971 | Palmdale Fire Station | 6.61 | 24.16 | 452.86 |
| 139 | Tabas Iran | 1978 | Dayhook | 7.35 | 0.00 | 471.53 |
| 164 | Imperial Valley06 | 1979 | Cerro Prieto | 6.53 | 15.19 | 471.53 |
| 739 | Loma Prieta | 1989 | Anderson Dam (Downstream) | 6.93 | 19.90 | 488.77 |
| 1005 | Northridge01 | 1994 | LA - Temple & Hope | 6.69 | 28.82 | 452.15 |
| 1052 | Northridge01 | 1994 | Pacoima Kagel Canyon | 6.69 | 5.26 | 508.08 |
| 1083 | Northridge01 | 1994 | Sunland - Mt Gleason Ave | 6.69 | 12.38 | 402.16 |
| 1086 | Northridge01 | 1994 | Sylmar - Olive View Med FF | 6.69 | 1.74 | 440.54 |
| 1208 | ChiChi Taiwan | 1999 | CHY046 | 7.62 | 24.10 | 442.15 |
| 1227 | ChiChi Taiwan | 1999 | CHY074 | 7.62 | 0.70 | 553.43 |
| 1489 | ChiChi Taiwan | 1999 | TCU049 | 7.62 | 3.76 | 487.27 |
| 1490 | ChiChi Taiwan | 1999 | TCU050 | 7.62 | 9.49 | 542.41 |
| 1496 | ChiChi Taiwan | 1999 | TCU056 | 7.62 | 10.48 | 403.2 |
| 1508 | ChiChi Taiwan | 1999 | TCU072 | 7.62 | 0.00 | 468.14 |
| 1512 | ChiChi Taiwan | 1999 | TCU078 | 7.62 | 0.00 | 443.04 |
| 1546 | ChiChi Taiwan | 1999 | TCU122 | 7.62 | 9.34 | 475.46 |
| 1549 | ChiChi Taiwan | 1999 | TCU129 | 7.62 | 1.83 | 511.18 |
| 3746 | Cape Mendocino | 1992 | Centerville Beach Naval Fac | 7.01 | 16.44 | 459.04 |
| 3750 | Cape Mendocino | 1992 | Loleta Fire Station | 7.01 | 23.46 | 515.65 |
| 3759 | Landers | 1992 | Whitewater Trout Farm | 7.28 | 27.05 | 425.02 |
| 4031 | San Simeon CA | 2003 | Templeton - 1-story Hospital | 6.52 | 5.07 | 410.66 |
| 4219 | Niigata Japan | 2004 | NIGH01 | 6.63 | 0.49 | 480.4 |
| 4457 | Montenegro Yugoslavia | 1979 | Ulcinj - Hotel Albatros | 7.1 | 1.52 | 410.35 |
| Means | 7.14 | 10.48 | 465.87 | |||
Table 5.
Selected ground motion records for 4611 station.
| Record Sequence Number | Earthquake Name | Year | Station Name | Magnitude | Rjb (km) | Vs30 (m/sec) |
|---|---|---|---|---|---|---|
| 293 | Irpinia Italy01 | 1980 | Torre Del Greco | 6.90 | 59.63 | 593.35 |
| 572 | Taiwan SMART1(45) | 1986 | SMART1 E02 | 7.30 | 51.35 | 671.52 |
| 774 | Loma Prieta | 1989 | Hayward City Hall North | 6.93 | 54.97 | 735.44 |
| 781 | Loma Prieta | 1989 | Lower Crystal Springs Dam dwnst | 6.93 | 48.24 | 586.08 |
| 891 | Landers | 1992 | Silent Valley Poppet Flat | 7.28 | 50.85 | 659.09 |
| 897 | Landers | 1992 | Twentynine Palms | 7.28 | 41.43 | 635.01 |
| 946 | Northridge01 | 1994 | Antelope Buttes | 6.69 | 46.65 | 572.57 |
| 1061 | Northridge01 | 1994 | Rancho Palos Verdes Hawth | 6.69 | 48.02 | 580.03 |
| 1109 | Kobe Japan | 1995 | MZH | 6.90 | 69.04 | 609.00 |
| 1281 | ChiChi Taiwan | 1999 | HWA032 | 7.62 | 42.87 | 573.04 |
| 1284 | ChiChi Taiwan | 1999 | HWA035 | 7.62 | 44.02 | 677.49 |
| 1293 | ChiChi Taiwan | 1999 | HWA046 | 7.62 | 47.79 | 617.52 |
| 1302 | ChiChi Taiwan | 1999 | HWA057 | 7.62 | 46.48 | 671.52 |
| 1474 | ChiChi Taiwan | 1999 | TCU025 | 7.62 | 52.18 | 665.2 |
| 1786 | Hector Mine | 1999 | Heart Bar State Park | 7.13 | 61.21 | 624.94 |
| 1795 | Hector Mine | 1999 | Joshua Tree N.M. Keys View | 7.13 | 50.42 | 686.12 |
| 1836 | Hector Mine | 1999 | Twentynine Palms | 7.13 | 42.06 | 635.01 |
| 3955 | Tottori Japan | 2000 | SMNH11 | 6.61 | 40.07 | 670.73 |
| 4054 | Bam Iran | 2003 | Mohammad AbadeMadkoon | 6.60 | 46.20 | 574.88 |
| 4893 | Chuetsuoki Japan | 2007 | Toyotsu Nakano | 6.80 | 61.16 | 561.59 |
| 5218 | Chuetsuoki Japan | 2007 | NGNH07 | 6.80 | 62.96 | 562.18 |
| 6891 | Darfield New Zealand | 2010 | CSHS | 7.00 | 43.60 | 638.39 |
| 6963 | Darfield New Zealand | 2010 | RPZ | 7.00 | 57.37 | 638.39 |
| Means | 7.09 | 50.80 | 627.78 | |||
Table 6.
Scale factors of subjected ground motions.
| Record Sequence Number (4615) |
Scale Factors | Record Sequence Number (4611) |
Scale Factors |
|---|---|---|---|
| SRSS-RSN-78 | 4.206 | SRSS-RSN-1061 | 7.538 |
| SRSS-RSN-139 | 1.578 | SRSS-RSN-1109 | 7.616 |
| SRSS-RSN-164 | 2.519 | SRSS-RSN-1281 | 2.539 |
| SRSS-RSN-739 | 2.704 | SRSS-RSN-1284 | 4.496 |
| SRSS-RSN-1005 | 3.470 | SRSS-RSN-1293 | 4.761 |
| SRSS-RSN-1052 | 2.101 | SRSS-RSN-1302 | 4.270 |
| SRSS-RSN-1083 | 4.065 | SRSS-RSN-1474 | 6.830 |
| SRSS-RSN-1086 | 0.907 | SRSS-RSN-1786 | 4.510 |
| SRSS-RSN-1208 | 3.651 | SRSS-RSN-1795 | 4.989 |
| SRSS-RSN-1227 | 3.491 | SRSS-RSN-1836 | 4.382 |
| SRSS-RSN-1489 | 2.271 | SRSS-RSN-293 | 8.058 |
| SRSS-RSN-1490 | 4.966 | SRSS-RSN-3955 | 5.974 |
| SRSS-RSN-1496 | 4.853 | SRSS-RSN-4054 | 4.081 |
| SRSS-RSN-1508 | 1.257 | SRSS-RSN-4893 | 2.475 |
| SRSS-RSN-1512 | 1.364 | SRSS-RSN-5218 | 8.080 |
| SRSS-RSN-1546 | 2.173 | SRSS-RSN-572 | 3.256 |
| SRSS-RSN-1549 | 0.796 | SRSS-RSN-6891 | 3.852 |
| SRSS-RSN-3746 | 1.403 | SRSS-RSN-6963 | 7.276 |
| SRSS-RSN-3750 | 2.520 | SRSS-RSN-774 | 5.434 |
| SRSS-RSN-3759 | 4.905 | SRSS-RSN-781 | 5.264 |
| SRSS-RSN-4031 | 1.283 | SRSS-RSN-891 | 7.734 |
| SRSS-RSN-4219 | 0.767 | SRSS-RSN-897 | 5.927 |
| SRSS-RSN-4457 | 2.827 | SRSS-RSN-946 | 6.941 |
Table 7.
Evaluated performance levels of the investigated structures (Provided separately according to stations and storey numbers).
Table 7.
Evaluated performance levels of the investigated structures (Provided separately according to stations and storey numbers).
| Station | IO % | LS % | CP % | C % | |
|---|---|---|---|---|---|
| 3 story | |||||
| Old | 4615 | 0.87 | 88.26 | 4.35 | 6.52 |
| New | 4615 | 2.17 | 90.87 | 5.22 | 1.74 |
| Old | 4611 | 6.52 | 91.74 | 1.30 | 0.43 |
| New | 4611 | 8.26 | 88.26 | 3.04 | 0.43 |
| 4 story | |||||
| Old | 4615 | 5.22 | 74.78 | 8.26 | 11.74 |
| New | 4615 | 0.43 | 92.61 | 4.35 | 2.61 |
| Old | 4611 | 20.87 | 75.65 | 2.17 | 1.30 |
| New | 4611 | 10.00 | 88.26 | 1.74 | 0.00 |
| 5 story | |||||
| Old | 4615 | 0.87 | 73.48 | 11.74 | 13.91 |
| New | 4615 | 2.17 | 82.17 | 9.13 | 6.52 |
| Old | 4611 | 6.52 | 85.65 | 7.39 | 0.43 |
| New | 4611 | 14.78 | 79.13 | 5.65 | 0.43 |
| 6 story | |||||
| Old | 4615 | 2.61 | 66.96 | 9.57 | 20.87 |
| New | 4615 | 2.17 | 90.87 | 4.78 | 2.17 |
| Old | 4611 | 13.91 | 79.57 | 5.22 | 1.30 |
| New | 4611 | 15.65 | 83.91 | 0.43 | 0.00 |
| 7 story | |||||
| Old | 4615 | 0.43 | 58.70 | 12.61 | 28.26 |
| New | 4615 | 3.91 | 86.52 | 8.26 | 1.30 |
| Old | 4611 | 9.57 | 77.39 | 6.96 | 6.09 |
| New | 4611 | 19.13 | 80.87 | 0.00 | 0.00 |
| 8 story | |||||
| Old | 4615 | 0.00 | 62.61 | 15.65 | 21.74 |
| New | 4615 | 0.87 | 78.70 | 12.61 | 7.83 |
| Old | 4611 | 7.83 | 83.91 | 5.65 | 2.61 |
| New | 4611 | 9.13 | 87.39 | 3.04 | 0.43 |
Table 8.
Evaluated performance levels of the investigated structures.
| IO % | LS % | CP % | C % | |
|---|---|---|---|---|
| All Buildings & Both Stations | ||||
| Old | 6.27 | 76.56 | 7.57 | 9.60 |
| New | 7.39 | 85.80 | 4.86 | 1.96 |
Disclaimer/Publisher’s Note: The statements, opinions and data contained in all publications are solely those of the individual author(s) and contributor(s) and not of MDPI and/or the editor(s). MDPI and/or the editor(s) disclaim responsibility for any injury to people or property resulting from any ideas, methods, instructions or products referred to in the content. |
© 2025 by the authors. Licensee MDPI, Basel, Switzerland. This article is an open access article distributed under the terms and conditions of the Creative Commons Attribution (CC BY) license (https://creativecommons.org/licenses/by/4.0/).
Copyright: This open access article is published under a Creative Commons CC BY 4.0 license, which permit the free download, distribution, and reuse, provided that the author and preprint are cited in any reuse.


