
Submitted:
21 March 2025
Posted:
27 March 2025
You are already at the latest version
Abstract
Distraction is a major contributor to road accidents, especially among children who are easily distracted and may not be fully aware of the traffic situation. It is crucial to understand that children up to a certain age may struggle to halt their movement once initiated. This study conclusively demonstrates that the stopping distance, time, and deceleration of children aged six to ten years after a specific stop signal at different speeds are strongly influenced by the speed of movement and the age of the children. The results show that in the “walking” test configuration, the children were able to stop within a range of 0.47 m to 0.63 m, with a shorter distance for older children. The stopping time ranges from 0.84 s to 1.21 s and correlates positively with age. The stopping time and distance of children were measured in both “running” and “walking” test configurations across different age groups. However, in the “running” test configuration, stopping distance is almost the same across all age groups, with children requiring between 1.72 m and 1.84 m and a stopping time ranging from 1.17 s to 1.28 s. In the “walking” test configuration, children are able to decelerate between 0.91 m/s² and 1.57 m/s², while in the “running” test configuration, they are able to decelerate between 2.24 m/s² and 3.19 m/s².
Keywords:
children
; stopping time
; stopping distance
1. Scope
As children reach school age, they become more independent and active road users. Despite this, they remain the most vulnerable group of road users as pedestrians [1]. It is common for children to travel on foot to various destinations, including school, friends’ houses, and sports activities [2]. The American Academy of Pediatrics recommends that children under the age of ten should not be unsupervised pedestrians in road traffic, except under special conditions [3]. However, it may not always be feasible to practice and supervise all trips. It is strongly advised that children practice walking to school with adult supervision before being allowed to walk alone [4]. According to research [5], children up to the age of approximately eight years are unpredictable and untrustworthy as pedestrians in road traffic due to their psychological development. Even older children, aged 8–9 years, are still easily distracted. Therefore, it is crucial for children to focus their attention on the hazardous situation and avoid distractions from other things [4,6,7,8]. Children crossing the road tend to focus on their immediate surroundings, often neglecting traffic [6,9]. It is vital to educate children on the significance of paying attention to traffic when crossing the road. Their attention is often drawn to non-traffic related objects such as animals or other children [4,8]. Thus, inadequate observation of traffic and failure to stop before crossing the road are major contributing factors to accidents, as highlighted by sources [6,10,11]. Accurately estimating the speed and distance of an approaching vehicle is crucial to avoid critical situations. It is important to note that speed estimation is a complex task that requires considering distance [12]. According to various studies, children’s ability to estimate distances ranges from approximately six [13] to approximately nine years [14], as cited in [12]. Additionally, children aged around 10 to 12 have been found to be capable of estimating the speed of approaching vehicles [14], as cited in [12]. It is worth noting that 10-year-old children tend to use distance rather than speed as a reference for their judgment [15]. Furthermore, Tapiro et al. [8] identified a correlation between time taken to clear the roadway and the speed of the next approaching vehicle. The study clearly demonstrates that younger children have a shorter escape time compared with the older children. Each age group (7-8 years, 9-10 years, 11-13 years, and adults) exhibited a significant difference to the next age group. Notably, the age group of 11–13-year-olds showed no significant difference compared with adults. The remaining escape time averaged at 0.7 seconds for 7–8 year olds, 2.7 seconds for the 9–10 year olds, and 4.9 seconds for the 11–13 year olds. Younger children were able to cross the road safely in significantly less time than adults, who had an escape time of 5.7 seconds. These findings suggest that younger children perceive a shorter distance between two vehicles as safe compared with adults or older children. However, in some situations, it may still be more appropriate for all pedestrians to stop and wait for traffic to pass or for vehicles to stop. Children aged six to seven struggle to interrupt a movement once it has begun, making it difficult to stop immediately in dangerous situations [16] (cited in [17]). This task requires a high level of alertness, which refers to the ability to quickly establish a general readiness to react [18]. It is important to note that alertness increases significantly between the ages of 5 and 11 years [19] (cited in [12]). However, for younger children (6–8 years), there are significant inter-individual differences. An average adult level of alertness is typically reached at around 14 years of age.
2. Objective
The objective of the study is to confidently analyze the stopping distance, stopping time, and deceleration of children of varying ages and movement speeds in response to a specific request.
3. Literature
Numerous studies have investigated the effect of different motion speeds of participants. These studies separated adults (e.g., Griffits et al. [20], Knoblauch et al. [21] cited in [22], Forde and Daniel [23], Hussein and Sayed [24]) and children (e.g., Vaughan and Bain [25,26], Eberhardt and Himbert [27] cited in [26], Eubanks and Hill [28] cited in [26]) or analyzed both, adults and children (e.g., Strouhal et al. [29] cited in [30], Tarawneh [31], Kramer and Raddatz [32] cited in [30], Rahman et al. [33]). The studies categorized assessments into slow walking, normal walking, running and jogging, separated by gender. The tests were conducted in both road traffic conditions and a laboratory environment, with a constant focus on the steady-state speed of the participants. However, stopping time or stopping distance has been examined in only a few studies. For example, Wood et al. [34] examined the stopping distance of seven males and one female. The study conducted two test runs with participants jogging and walking at their preferred speed. An acoustic signal was used to prompt them to stop as quickly as possible, with the timing of the signal varied to prevent preparation. Tavana et al. [35] precisely measured the reaction time and stopping distance of 16 participants (nine males and seven females) at three different speeds, with each speed being tested three times. During the test configuration, participants followed a leading person at a comfortable distance. Participants were instructed to react promptly to the leader’s sudden command to stop, without overtaking. The time and location of the stop were randomly selected and unknown to the participants. Zhang et al. [36] investigated the stopping distance of pedestrians (29 males and 25 females) in the context of pedestrian crowd stampede accidents. The tests were conducted at various times and speeds. Pedestrian safety was thoroughly analyzed, including their ability to estimate the speed and stopping distance of oncoming vehicles [37,38], as well as predict the pedestrian’s crossing path [39]. In their study, Kath et al. [40] found that vehicle drivers are willing to stop for pedestrians crossing the road. Meanwhile, Rajendar et al. [41] specifically examined the detection of pedestrians and the stopping distance of a vehicle equipped with an emergency braking system.
4. Method
The experiments were conducted in a child-friendly environment to prevent hazardous situations in real traffic conditions. This space is specifically designed to facilitate experimentation and learning in an enjoyable and safe manner.
4.1. Test Set-Up
The initial point was set 30 centimeters in front of the first light beam of the time-measuring device, which is 30 centimeters before the time measurement begins (Figure 1). To prevent false activation of the time measurement, the starting point was adjusted based on preliminary tests that revealed children tend to move their arms at the starting point. The first light beam was triggered 30 centimeters after the starting point, and the timing began at this point. The second light beam was located one meter after the first, and the third light beam was positioned five meters after the first. Consequently, the distance between the second and third light beam was four meters. Time at all three light beams was used to calculate speed and acceleration.
The children’s movement behavior was recorded in its entirety from a uniform perspective during all tests, which were each filmed from two fixed camera positions.
4.2. Test Matrix
The test configurations used in this study were consistent with those previously examined in the literature – including walking, running, and sprinting. Similar configurations have been investigated by Eberhard and Himbert [27] (cited in Bartels and Erbsmehl [30]), Eubanks and Hill [28] (cited in Vaughan and Bain [25,26]), and Vaughan and Bain [25,26,42]). Prior to testing, each child received clear instructions on which test to complete. The children were instructed to walk or run as they would normally do on a road. Each child completed five tests: two for walking, two for running, and one for running as fast as possible (sprinting). An acoustic stop signal was given after the third light beam during the walking and running tests. The signal time was varied to prevent anticipation and ensure the children’s ability to stop remained unaffected. The children were given clear instructions to freeze immediately upon receiving the signal. During the sprinting test, they were instructed to run as fast as possible to the end of the track and stop. It was not necessary to give a stop signal during this test configuration.
4.3. Sample
The study included a sample of 93 primary school children, consisting of 39 female and 54 males, ranging in age from six to ten years. A total of 32 children were six years old (34.4%), 17 children were seven years old (18.3%), 23 children were eight years old (24.7%), 19 children were nine years old, and two children were 10 years old and grouped together (22.6%). Physiological parameters, such as height and weight, were recorded by age group and are presented in Table 1.
4.4. Data Analysis
Figure 2 illustrates the theoretical speed-distance characteristic. The children begin at the starting point (SP) and accelerate to the target speed. It is assumed that they maintain a constant steady-state speed until they reach the third light beam (LB3). Following the third light beam, an acoustic signal is given, and the deceleration phase commences.
Formula 1 was used to calculate the speed at steady state, taking into account the distance between the second (LB2) and third light beam (LB3) (s3-s2) and the time difference captured at the light beams LB2 and LB3 (t3-t2). The distance that the children moved from the acoustic signal to the final position was also measured. Based on the speed and the distance moved, the deceleration from the acoustic signal to the rest position was calculated (Formula 2). Deceleration time was not measured separately from the time it took to react to the signal.
5. Results
The walking speeds of the different age groups were significantly different from each other, as determined by a single-factorial ANOVA (p=0.005), see Table 2 (A summary of the results for boys and girls can be found in the Appendix). The walking speed of seven-year-olds was significantly different from that of nine-year-olds (p=0.002) (Tukey post-hoc test), while no significant difference were observed among the other age groups. A notable difference was found only between the seven-year-olds and the eight-year-olds (p=0.065).
The results also show a significant difference between the age groups for the “running” test configuration (single-factorial ANOVA, p=0.003). Specifically, the speed difference between six-year-olds and nine-year-olds was significant in the “running” test (p=0.001), as well as between eight-year-olds and nine-year-olds (p=0.041) (Tukey post-hoc test).
For the “sprinting” test configuration, a single-factorial ANOVA yielded a significant difference between age groups (p=0.000). The Tukey post-hoc test revealed significant differences between the age groups of six-year-olds and seven-year-olds (p=0.021), six-year-olds and eight-year-olds (p=0.000), and six-year-olds and nine-year-olds (p=0.000).
Notably, there was no statistically significant difference found between boys and girls in terms of speed in the “walking” and “running” test configurations within each age group. A significant gender difference (p=0.007) was found between eight-year-old boys and girls in the “sprinting” test configuration.
In the “walking” test configuration, an average stopping distance of 0.63 m was recorded for six-year-olds (Table 3). Stopping distance tends to decrease with increasing age and was found to be 0.47 m on average for 9–10 year olds. The Welch-ANOVA test revealed a statistically significant difference between age groups (p=0.030). Further analysis using the Games-Howell post hoc test showed that only the six-year-olds and the 9–10-year-olds exhibited a significant difference (p=0.017). The “running” test configuration produced a stopping distance ranging from 1.72 m to 1.85 m. No significant difference was found between age groups for the “running” test configuration.
Table 4 clearly demonstrates a trend in stopping time for both walking and running, with older children exhibiting significantly faster stopping times than younger children. The difference in stopping time between age groups for walking is statistically significant (Welch-ANOVA test, p=0.000). Additionally, the Games-Howell test reveals statistically significant differences in stopping time between six- and seven-year-olds (p=0.042), six- and nine-year-olds (p=0.000), seven- and nine-year-olds (p=0.017), and eight- and nine-year-olds (p=0.019). There is no significant difference between age groups, despite the fact that older children tend to stop more quickly in the “running” configuration.
The analysis of deceleration shows a similar trend, albeit with an opposite tendency. As children grow older, they achieve higher deceleration values in both in the “walking” and “running” test configurations (Table 5). However, these results are not statistically significant in either configuration (p=0.167 and p=0.284, single-factorial ANOVA).
Speed significantly affects the length of stopping distance and stopping time. The relationship between stopping distance, stopping time, and steady-state speed for the “walking” and “running” test configurations is shown in Figure 3 and Figure 4. The data clearly indicates an increase in stopping distances at higher speeds (R=0.58 for “walking” and R=0.63 for “running”). Notably, this trend is not observed for stopping time.
6. Discussion
During the tests, we carefully considered the boundary conditions of the test setup and determined that the length of the test course differs from what is stated in the literature. While Vaughan and Bain’s complete test course [25,26,42] was 15 meters long, we confidently assumed that the first five meters were assumed to be the acceleration phase. Eberhard and Himbert [27] (cited in Bartels and Erbsmehl [30]) used a test set-up with a complete course length of 10 meters. However, the length of the acceleration phase was not specified. Strouhal et al. [29] (also cited in Bartels and Erbsmehl [30]) used a course length of 10 meters to determine only steady-state speed, indicating that the participants did not accelerate from standstill. The recorded steady-state speeds of the children in different age groups are comparable with findings in the literature. However, they are lower than those reported by some previous studies (see Vaughan and Bain [25,26,42], Eberhard and Himbert [27] (cited in Bartels and Erbsmehl [30]), Eubanks and Hill [28] (cited in Vaughan and Bain [25,26])). These differences may be related to the test configuration. The children will reach a constant speed after the second light beam, following an acceleration phase of 1.3 meters. It is important to note that if the children do not reach a constant speed immediately after this brief acceleration phase, they will continue to accelerate, despite the assumption of a steady-state speed. Between the second and third light beams, a steady-state speed is assumed, but there is still acceleration. It is important to note that the steady-state speed reached after the second light beam may be underestimated and possibly lower compared with the literature. As shown in Figure 5, if the distance and time between the second and third light beams are used to calculate steady-state speed, it would be 7.2 km/h. During the acceleration phase, a lower speed can be calculated based on the distance and time between light beams. In this particular example, the steady-state speed between the first and second light beams is calculated to be 6 km/h.
Older children, both girls and boys, tend to exhibit higher speeds, which is consistent with the literature. Although steady-state speed is lower compared with the literature, this finding does not contradict the observed tendency. Several studies have provided a categorization by specific age groups and gender, including Vaughan and Bain [25,26,42], Eberhard and Himbert [27] (cited in Vaughan and Bain [25,26]), and Eubanks and Hill [28] (cited in Vaughan and Bain [25,26]). The results show that older children achieve higher speeds. Boys tend to have higher speed than girls, according to Vaughan and Bain [25,26,42], as well as Eberhard and Himbert [27] (cited in Vaughan and Bain [25,26]). However, this observation was not found in the current study.
Publicly accessible studies on the stopping distance or deceleration of children differentiated by age groups are currently lacking. However, the existing literature on deceleration behavior primarily focuses on adults and their body postures immediately before collision [43,44,45,46]. It is important to note that these postures can significantly influence injury patterns and injury severity. Research predicts movement trajectories of pedestrians [47,48] and investigates movement characteristics of healthy individuals and those with a unilateral transtibial leg prosthesis [49]. The study confidently determined a steady-state speed with a time to stop of approximately 1.6 seconds (Goldhammer et al. [50]), while senior citizens and children had average times to stop of 3.25 seconds (SD=1.25) and 3.14 seconds (SD=1.13), respectively. These observations suggest that age group may not be a significant factor in reaction time, although further research is needed to confirm this conclusion. According to Tavana et al. [35], the average time to stop was 0.58 seconds (SD=0.31) with a total stopping distance of 0.63 meters and a total stopping time of 1.08 seconds. Notably, the maximum speed in Tavana et al. [35] is comparable with the steady-state speed in the “walking” test configuration and the average stopping time of this test configuration. Additionally, the stopping distance in the “walking” configuration ranges from 0.47 to 0.63 meters at a steady-state speed of between 3.1 and 4.4 km/h. The study’s “walking” test configuration clearly demonstrates that older children have a significantly shorter average stopping distance than younger ones, with the stopping time required to decelerate from steady-state speed to standstill ranging from 0.84 s to 1.21 s and showing a negative correlation with children’s age. Furthermore, in the “running” test configuration, the stopping distances of the different age groups are found to be similar, further supporting the study’s conclusions. Stopping distance ranges from 1.72 m to 1.84 m, and stopping time ranges from 1.17 s to 1.28 s. The time required to decelerate from steady-state speed to standstill decreases with age. These results demonstrate a clear relationship between age and stopping performance. Perception reaction time after the acoustic signal is not explicitly evaluated, but it can be inferred from stopping distance and the deceleration phase. The specific braking distance is shorter, and the deceleration values achieved are potentially higher. Children can achieve a deceleration ranging from 0.91 m/s² (six years old) to 1.57 m/s² (9 to 10 years old) in the “walking” test configuration. In the “running” test configuration, deceleration ranges from 2.24 m/s² (six years old) to 3.19 m/s² (9 to 10 years old). According to Zou et al. [51], pedestrians exhibit a median deceleration of 4.2 m/s² in response to hazardous situations, demonstrating a clear effort to avoid collisions.
7. Limitations
Although the children were instructed on how to carry out the tests, they did not always follow the theoretical velocity-distance characteristics. The acceleration phase was not completed before the second beam and therefore the steady-state velocity between the second and third beams was underestimated. Sometimes they started to reduce their speed too early, i.e., before they had passed the third light beam or before the acoustic signal was given. The stopping distance is therefore underestimated.
The position of the children at the time of the acoustic signal is extracted from the video source. The position was not measured precisely with a measuring device. The position was estimated from the video data analysis and is therefore not accurately recorded.
The tests were carried out in a non-hazardous environment. The extent to which the results can be extrapolated to real traffic conditions is not entirely clear and should be treated with care.
8. Conclusion
The study’s findings emphasize the crucial importance of unobstructed visibility of the roadside in road space design. Obstructed visibility can prevent children from stopping immediately upon recognizing danger while crossing the lane. It is worth noting that the stopping distance when running is almost two meters, which means that children may come to a stop in the middle of the lane.
Stopping distance is a function of speed, and it increases as speed increases. Therefore, it can be concluded that stopping distance is not solely dependent on age, but rather on a combination of factors. Age is one factor in stopping distance, but in the “running” test configuration, older children have a similar stopping distance to younger children despite their higher speed and quicker reaction time. Older children reach higher speeds and therefore experience greater deceleration than younger children.
Author Contributions
“Conceptualization, E.T. and B.S.; methodology, E.T., B.S.; formal analysis, E.T.; investigation, B.S., B.KK., M.S.; data curation, E.T, B.S, M.S.; writing—original draft preparation, E.T.; writing—review and editing, H.H., B.S., B.S., M.S., B.KK., M.P., H.G.; project administration, E.T. and B.S.; funding acquisition, E.T. and B.S. All authors have read and agreed to the published version of the manuscript.”
Funding
This study was funded by the Austrian Federal Ministry for Climate Action, Environment, Energy, Mobility, Innovation and Technology (BMK) by grants (grant number GZ.BMK-2021-0.772.800) of the Austrian Road Safety Fund (VSF). The APC was funded by TU Graz Open Access Publishing Fund. Open Access Funding by the Graz University of Technology.
Institutional Review Board Statement
The study protocol was approved by the Ethics Committee of Medizinische Universität Graz Ethikkommission (protocol code 34-442 ex 21/22, date of approval: 16th August 2022).
Informed Consent Statement
Informed consent was obtained from all subjects involved in the study.
Conflicts of Interest
The authors declare no conflicts of interest.
Appendix A: Girls

Table A1.
Average steady-state speed of the different test configurations according to age groups of girls.
Table A1.
Average steady-state speed of the different test configurations according to age groups of girls.
| Test | Age group | Number | Mean | SD | Min | Q1 | Median | Q3 | Max |
|---|---|---|---|---|---|---|---|---|---|
| Walking | 6 years | 11 | 3.98 | 1.03 | 2.12 | 3.14 | 3.96 | 4.78 | 5.69 |
| 7 years | 8 | 3.23 | 0.89 | 1.92 | 2.72 | 3.11 | 3.63 | 5.22 | |
| 8 years | 11 | 3.70 | 0.38 | 2.93 | 3.47 | 3.64 | 3.88 | 4.62 | |
| 9–10 years | 9 | 3.74 | 0.82 | 2.54 | 3.29 | 3.58 | 3.87 | 5.85 | |
| Running | 6 years | 11 | 9.78 | 1.17 | 7.54 | 9.10 | 10.00 | 10.70 | 11.61 |
| 7 years | 8 | 10.99 | 1.95 | 7.46 | 9.97 | 11.71 | 12.26 | 13.33 | |
| 8 years | 11 | 10.05 | 1.74 | 7.38 | 8.67 | 9.70 | 11.75 | 13.21 | |
| 9–10 years | 9 | 10.85 | 1.58 | 8.14 | 9.72 | 11.25 | 12.18 | 12.74 |
Table A2.
Average stopping distance to standstill after the acoustic signal of the different test configurations according to age groups of girls.
Table A2.
Average stopping distance to standstill after the acoustic signal of the different test configurations according to age groups of girls.
| Test | Age group | Number | Mean | SD | Min | Q1 | Median | Q3 | Max |
|---|---|---|---|---|---|---|---|---|---|
| Walking | 6 years | 11 | 0.72 | 0.24 | 0.38 | 0.51 | 0.80 | 0.91 | 1.03 |
| 7 years | 8 | 0.54 | 0.30 | 0.23 | 0.35 | 0.48 | 0.64 | 1.15 | |
| 8 years | 11 | 0.56 | 0.11 | 0.40 | 0.50 | 0.55 | 0.63 | 0.75 | |
| 9–10 years | 9 | 0.47 | 0.10 | 0.29 | 0.43 | 0.45 | 0.53 | 0.63 | |
| Running | 6 years | 11 | 1.86 | 0.39 | 1.25 | 1.56 | 2.08 | 2.14 | 2.30 |
| 7 years | 8 | 1.93 | 0.63 | 0.90 | 1.56 | 1.96 | 2.26 | 2.95 | |
| 8 years | 11 | 1.73 | 0.36 | 1.20 | 1.46 | 1.73 | 1.95 | 2.40 | |
| 9–10 years | 9 | 1.69 | 0.39 | 1.00 | 1.50 | 1.63 | 1.95 | 2.35 |
Table A3.
Average stopping time to standstill after the acoustic signal of the different test configurations according to age groups of girls.
Table A3.
Average stopping time to standstill after the acoustic signal of the different test configurations according to age groups of girls.
| Test | Age group | Number | Mean | SD | Min | Q1 | Median | Q3 | Max |
|---|---|---|---|---|---|---|---|---|---|
| Walking | 6 years | 11 | 1.29 | 0.24 | 0.89 | 1.19 | 1.26 | 1.48 | 1.61 |
| 7 years | 8 | 1.17 | 0.42 | 0.75 | 0.81 | 1.05 | 1.63 | 1.70 | |
| 8 years | 11 | 1.08 | 0.24 | 0.76 | 0.89 | 1.12 | 1.25 | 1.47 | |
| 9–10 years | 9 | 0.93 | 0.21 | 0.66 | 0.86 | 0.87 | 1.01 | 1.34 | |
| Running | 6 years | 11 | 1.36 | 0.20 | 1.04 | 1.24 | 1.41 | 1.45 | 1.80 |
| 7 years | 8 | 1.25 | 0.29 | 0.84 | 1.04 | 1.32 | 1.42 | 1.65 | |
| 8 years | 11 | 1.24 | 0.11 | 1.04 | 1.18 | 1.26 | 1.31 | 1.37 | |
| 9–10 years | 9 | 1.15 | 0.29 | 0.58 | 0.93 | 1.22 | 1.32 | 1.50 |
Table A4.
Average stopping deceleration of the different test configurations according to age groups of girls.
Table A4.
Average stopping deceleration of the different test configurations according to age groups of girls.
| Test | Age group | Number | Mean | SD | Min | Q1 | Median | Q3 | Max |
|---|---|---|---|---|---|---|---|---|---|
| Walking | 6 years | 11 | 0.89 | 0.24 | 0.50 | 0.75 | 0.86 | 1.02 | 1.26 |
| 7 years | 8 | 0.85 | 0.30 | 0.44 | 0.64 | 0.86 | 1.00 | 1.27 | |
| 8 years | 11 | 1.02 | 0.26 | 0.73 | 0.81 | 0.90 | 1.26 | 1.40 | |
| 9–10 years | 9 | 1.32 | 0.63 | 0.73 | 0.88 | 1.19 | 1.46 | 2.85 | |
| Running | 6 years | 11 | 2.04 | 0.25 | 1.42 | 1.99 | 2.10 | 2.20 | 2.30 |
| 7 years | 8 | 2.61 | 0.75 | 1.70 | 2.22 | 2.39 | 2.87 | 4.18 | |
| 8 years | 11 | 2.30 | 0.40 | 1.85 | 1.99 | 2.19 | 2.57 | 3.16 | |
| 9–10 years | 9 | 3.21 | 1.96 | 1.83 | 2.08 | 2.72 | 3.65 | 8.06 |
Appendix B: Boys
Table A5.
Average steady-state speed of the different test configurations according to age groups of boys.
Table A5.
Average steady-state speed of the different test configurations according to age groups of boys.
| Test | Age group | Number | Mean | SD | Min | Q1 | Median | Q3 | Max |
|---|---|---|---|---|---|---|---|---|---|
| Walking | 6 years | 21 | 3.54 | 0.86 | 2.11 | 2.92 | 3.32 | 4.20 | 5.41 |
| 7 years | 9 | 3.09 | 0.86 | 1.82 | 2.57 | 2.81 | 3.52 | 5.60 | |
| 8 years | 12 | 3.86 | 0.72 | 2.55 | 3.30 | 3.80 | 4.25 | 5.35 | |
| 9–10 years | 12 | 4.35 | 0.89 | 2.14 | 3.95 | 4.32 | 4.69 | 6.21 | |
| Running | 6 years | 21 | 9.49 | 1.85 | 5.12 | 8.13 | 9.26 | 11.12 | 12.85 |
| 7 years | 9 | 9.85 | 2.26 | 6.46 | 8.09 | 9.01 | 11.75 | 13.84 | |
| 8 years | 12 | 10.01 | 1.65 | 6.82 | 9.14 | 9.80 | 10.92 | 13.84 | |
| 9–10 years | 12 | 11.83 | 1.79 | 8.94 | 10.63 | 11.80 | 13.33 | 15.65 |
Table A6.
Average stopping distance to standstill after the acoustic signal of the different test configurations according to age groups of boys.
Table A6.
Average stopping distance to standstill after the acoustic signal of the different test configurations according to age groups of boys.
| Test | Age group | Number | Mean | SD | Min | Q1 | Median | Q3 | Max |
|---|---|---|---|---|---|---|---|---|---|
| Walking | 6 years | 21 | 0.57 | 0.22 | 0.35 | 0.45 | 0.50 | 0.63 | 1.23 |
| 7 years | 9 | 0.52 | 0.29 | 0.28 | 0.35 | 0.40 | 0.60 | 1.20 | |
| 8 years | 12 | 0.53 | 0.13 | 0.28 | 0.49 | 0.55 | 0.61 | 0.73 | |
| 9–10 years | 12 | 0.47 | 0.16 | 0.20 | 0.34 | 0.49 | 0.56 | 0.78 | |
| Running | 6 years | 21 | 1.67 | 0.44 | 0.80 | 1.41 | 1.73 | 1.83 | 2.40 |
| 7 years | 9 | 1.75 | 0.93 | 1.10 | 1.30 | 1.38 | 1.63 | 4.10 | |
| 8 years | 12 | 1.71 | 0.82 | 0.85 | 1.19 | 1.58 | 2.01 | 3.93 | |
| 9–10 years | 12 | 1.97 | 0.72 | 0.25 | 1.74 | 2.15 | 2.43 | 2.85 |
Table A7.
Average stopping time to standstill after the acoustic signal of the different test configurations according to age groups of boys.
Table A7.
Average stopping time to standstill after the acoustic signal of the different test configurations according to age groups of boys.
| Test | Age group | Number | Mean | SD | Min | Q1 | Median | Q3 | Max |
|---|---|---|---|---|---|---|---|---|---|
| Walking | 6 years | 21 | 1.16 | 0.27 | 0.67 | 0.99 | 1.14 | 1.28 | 1.92 |
| 7 years | 9 | 1.16 | 0.34 | 0.80 | 0.92 | 1.06 | 1.26 | 1.85 | |
| 8 years | 12 | 0.99 | 0.16 | 0.63 | 0.91 | 1.00 | 1.09 | 1.20 | |
| 9–10 years | 12 | 0.77 | 0.21 | 0.35 | 0.67 | 0.79 | 0.91 | 1.08 | |
| Running | 6 years | 21 | 1.24 | 0.28 | 0.67 | 1.06 | 1.24 | 1.44 | 1.83 |
| 7 years | 9 | 1.25 | 0.45 | 0.72 | 0.98 | 1.18 | 1.33 | 2.31 | |
| 8 years | 12 | 1.20 | 0.40 | 0.65 | 0.94 | 1.21 | 1.33 | 2.17 | |
| 9–10 years | 12 | 1.17 | 0.36 | 0.18 | 1.13 | 1.26 | 1.40 | 1.47 |
Table A8.
Average stopping deceleration of the different test configurations according to age groups of boys.
Table A8.
Average stopping deceleration of the different test configurations according to age groups of boys.
| Test | Age group | Number | Mean | SD | Min | Q1 | Median | Q3 | Max |
|---|---|---|---|---|---|---|---|---|---|
| Walking | 6 years | 21 | 0.92 | 0.35 | 0.53 | 0.70 | 0.76 | 1.09 | 1.95 |
| 7 years | 9 | 0.78 | 0.16 | 0.59 | 0.67 | 0.72 | 0.94 | 1.05 | |
| 8 years | 12 | 1.13 | 0.25 | 0.75 | 0.98 | 1.13 | 1.24 | 1.62 | |
| 9–10 years | 12 | 1.76 | 0.69 | 0.85 | 1.26 | 1.76 | 2.03 | 3.35 | |
| Running | 6 years | 21 | 2.35 | 0.73 | 1.41 | 1.82 | 2.28 | 2.75 | 3.93 |
| 7 years | 9 | 2.43 | 1.06 | 1.53 | 1.59 | 2.35 | 2.56 | 4.99 | |
| 8 years | 12 | 2.57 | 0.92 | 1.77 | 2.04 | 2.25 | 2.65 | 4.65 | |
| 9–10 years | 12 | 3.17 | 1.52 | 2.15 | 2.37 | 2.77 | 3.20 | 7.81 |
References
- C.V. Zegeer, M. Bushell, Pedestrian crash trends and potential countermeasures from around the world. Accident Analysis & Prevention 2012, 44, 3–11.
- A. Flade, M. A. Flade, M. Limbourg, Das Hineinwachsen in die motorisierte Gesellschaft, IWU, Darmstadt, 1998.
- Policy statement--Pedestrian safety. Pediatrics 2009, 124, 802–812. [CrossRef]
- M. Limbourg, Kinder unterwegs im Verkehr - Ansätze zur Erhöhung der Verkehrssicherheit im Kindes- und Jungendalter, Verkehrswachtforum (1997).
- M. Limbourg, Der Einfluß der schulischen Verkehrserziehung auf das Verhalten von Kindern als Fußgänger im Straßenverkehr, in: Bericht über die 1. Tagung „Kindersicherheit: Was wirkt?”, 1995, pp. 312–324.
- K. Jiang, Y. Wang, Z. Feng, N.N. Sze, Z. Yu, J. Cui, Exploring the crossing behaviours and visual attention allocation of children in primary school in an outdoor road environment. Cogn Tech Work 2021, 23, 587–604. [Google Scholar] [CrossRef]
- H. Tapiro, T. Oron-Gilad, Y. Parmet, Pedestrian distraction: The effects of road environment complexity and age on pedestrian’s visual attention and crossing behavior. Journal of Safety Research 2020, 72, 101–109. [Google Scholar] [CrossRef] [PubMed]
- H. Tapiro, T. Oron-Gilad, Y. Parmet, The effect of environmental distractions on child pedestrian’s crossing behavior. Safety Science 2018, 106, 219–229. [Google Scholar] [CrossRef]
- F. Biassoni, M. Bina, F. Confalonieri, R. Ciceri, Visual exploration of pedestrian crossings by adults and children: Comparison of strategies. Transportation Research Part F: Traffic Psychology and Behaviour 2018, 56, 227–235. [Google Scholar] [CrossRef]
- H. Wang, D. Tan, D.C. Schwebel, L. Shi, L. Miao, Effect of age on children’s pedestrian behaviour: Results from an observational study. Transportation Research Part F: Traffic Psychology and Behaviour 2018, 58, 556–565. [Google Scholar] [CrossRef]
- H. Wang, D.C. Schwebel, D. Tan, L. Shi, L. Miao, Gender differences in children’s pedestrian behaviors: Developmental effects. Journal of Safety Research 2018, 67, 127–133. [Google Scholar] [CrossRef]
- A. Uhr, Entwicklungspsychologische Grundlagen: Überblick und Bedeutung für die Verkehrssicherheit, Bern, 2015.
- U. Sigl, K. Weber, Hurra, wir sind mobil: Mobilitätsverhalten von 5- bis 10-jährigen Kindern in Wien, Niederösterreich und im Burgenland, Kuratorium für Verkehrssicherheit; Inst. für Verkehrserziehung, Wien, 2002.
- M. Limbourg, Kinder unterwegs im Straßenverkehr, Unfallklrass Nordrhein-Westfalen (2008).
- B. Keshavarz, K. Landwehr, R. Baurès, D. Oberfeld, H. Hecht, N. Benguigui, Age-Correlated Incremental Consideration of Velocity Information in Relative Time-to-Arrival Judgments. Ecological Psychology 2010, 22, 212–221. [Google Scholar] [CrossRef]
- J. Brück, Kindersicherheit: Gefahren erkennen, Gefahren vermeiden ; [mit Checklisten und Tipps zur Unfallvermeidung], BEUTH, Berlin, Wien u.a., 2009.
- B. Schlag, S. Richter, S. Kröling, T. Gehlert, Ganzheitliche Verkehrserziehung für Kinder und Jugendliche Teil 1: Entwicklung verkehrsrelevanter Kompetenzen im Alter von 0 bis 14 Jahren Band 2: In ausgewählten Verkehrssituationen, 2nd ed., Gesamtverband der Deutschen Versicherungswirtschaft e.V. Unfallforschung der Versicherer, Berlin, 2021.
- H. Niemann, S. Gauggel, Störungen der Aufmerksamkeit, in: P. Frommelt, H. Lösslein (Eds.), NeuroRehabilitation, Springer Berlin Heidelberg, Berlin, Heidelberg, 2010, pp. 145–170.
- L. Kaufmann, H.-C. Nuerk, K. Konrad, K. Willmes, Kognitive Entwicklungsneuropsychologie, Hogrefe, Göttingen, Germany, 2007.
- J.D. Griffiths, J.G. Hunt, M. Marlow, Delays at pedestrian crossings, Traffic engineering & control.
- R. L. Knoblauch, M.T. Pietrucha, M. Nitzburg, Field Studies of Pedestrian Walking Speed and Start-Up Time. Transportation Research Record 1996, 1538, 27–38. [Google Scholar] [CrossRef]
- R. Rastogi, S. Chandra, J. Vamsheedhar, V.R. Das, Parametric Study of Pedestrian Speeds at Midblock Crossings. J. Urban Plann. Dev. 2011, 137, 381–389. [Google Scholar]
- A. Forde, J. Daniel, Pedestrian walking speed at un-signalized midblock crosswalk and its impact on urban street segment performance. Journal of Traffic and Transportation Engineering (English Edition) 2021, 8, 57–69. [Google Scholar]
- M. Hussein, T. Sayed, Microscopic Pedestrian Interaction Behavior Analysis Using Gait Parameters. Transportation Research Record 2015, 2519, 28–38. [Google Scholar]
- R. Vaughan, J. R. Vaughan, J. Bain, Acceleration and speeds of young pedestrians, 1999.
- R. Vaughan, J. R. Vaughan, J. Bain, Acceleration and Speeds of Young Pedestrians: Phase II, Warrendale, PA, 2000.
- W. Eberhardt, G. W. Eberhardt, G. Himbert, Bewegungsgeschwindigkeiten: Versuchsergebnisse nichtmotorisierter Verkehrsteilnehmer, Ing.-Büro Simon-Himbert-Eberhardt, Saarbrücken, 1977.
- J. Eubanks, P.F. J. Eubanks, P.F. Hill, Pedestrian accident reconstruction and litigation, 2nd ed., Lawyers & Judges Pub, Tucson, AZ, 1999.
- J. Strouhal, K. Kuehnl, H. Hein, Bewegungsgeschwindigkeit von Fussgängern. Verkehrsunfall und Fahrzeugtechnik 1994, 32, 313–314. [Google Scholar]
- B. Bartels, C. Erbsmehl, Bewegungsverhalten von Fußgängern im Straßenverkehr - Teil 1, VDA, Berlin, 2014.
- M. S. Tarawneh, Evaluation of pedestrian speed in Jordan with investigation of some contributing factors. Journal of Safety Research 2001, 32, 229–236. [Google Scholar]
- F. Kramer, M. Raddatz, Das Bewegungsverhalten von Fussgaengern im Strassenverkehr auf Basis einer experimentellen Reihenuntersuchung / The movement behaviour of pedestrians in road traffic on the basis of an experimental serial study. Verkehrsunfall und Fahrzeugtechnik 2010, 48, 382–388. [Google Scholar]
- Khalidur Rahman, Noraida Abdul Ghani, Anton Abdulbasah Kamil, Adli Mustafa, Analysis of Pedestrian Free Flow Walking Speed in a Least Developing Country: A Factorial Design Study. Engineering, Environmental Science 2012, 21, 4299–4304.
- M. Wood, T. Ayres, R. Kelkar, R. Khatua, Walking and Jogging: An Analysis of Pedestrian Stopping Times and Distances. Proceedings of the Human Factors and Ergonomics Society Annual Meeting 2010, 54, 1435–1439. [Google Scholar]
- H. Tavana, P. Thompson, K. Boyce, H. Frantzich, D. Nilsson, D. McGrath, A novel approach to the investigation and quantification of the stop/start process for pedestrian traffic using motion capture devices. Travel Behaviour and Society 2024, 34, 100659. [Google Scholar] [CrossRef]
- Y. Zhang, X. Chen, N. Li, Experimental Research of Relationship between Pedestrian Stopping Distance and Walking Speed to Avoid Pedestrian Crowd Stampede Accident, in: H. Wei, Y. Wang, J. Rong, J. Weng (Eds.), ICCTP 2010, American Society of Civil Engineers, Reston, VA, 2010, pp. 839–850.
- R. Sun, X. Zhuang, C. Wu, G. Zhao, K. Zhang, The estimation of vehicle speed and stopping distance by pedestrians crossing streets in a naturalistic traffic environment. Transportation Research Part F: Traffic Psychology and Behaviour 2015, 30, 97–106. [Google Scholar]
- J. Shi, C. Wu, X. Qian, The Effects of Multiple Factors on Elderly Pedestrians’ Speed Perception and Stopping Distance Estimation of Approaching Vehicles. Sustainability 2020, 12, 5308. [Google Scholar]
- C. G. Keller, D.M. Gavrila, Will the Pedestrian Cross? A Study on Pedestrian Path Prediction. IEEE Trans. Intell. Transport. Syst. 2014, 15, 494–506. [Google Scholar]
- A. Katz, D. Zaidel, A. Elgrishi, An Experimental Study of Driver and Pedestrian Interaction during the Crossing Conflict. Hum Factors 1975, 17, 514–527. [Google Scholar]
- S. Rajendar, D. Rathinasamy, R. Pavithra, V.K. Kaliappan, S. Gnanamurthy, Prediction of stopping distance for autonomous emergency braking using stereo camera pedestrian detection. Materials Today: Proceedings 2022, 51, 1224–1228. [Google Scholar]
- R. Vaughan, J. Bain, Speeds and accelerations of school children. Road & Transport Research 2001, 3, 28–48. [Google Scholar]
- A. Soni, T. Robert, P. Beillas, Effects of pedestrian pre-crash reactions on crash outcomes during multi-body simulations, in: International Research Council on the Biomechanics of Injury (Ed.), 2013 IRCOBI Conference Proceedings, IRCOBI, 2013.
- M. Schachner, B. Schneider, F. Weissenbacher, N. Kirillova, H. Possegger, H. Bischof, C. Klug, Identifying and Extracting Pedestrian Behavior in Critical Traffic Situations, in: IEEE (Ed.), 26th IEEE International Conference on Intelligent Transportation Systems, 2023, pp. 3943–3949.
- M. Schachner, B. Schneider, W. Sinz, C. Klug, Extracting Quantitative Descriptions of Pedestrian Pre-crash Postures from Real-world Accident Videos, in: International Research Council on the Biomechanics of Injury (Ed.), 2020 IRCOBI Conference Proceedings, IRCOBI, 2020, pp. 231–249.
- Y. Han, Q. Li, W. He, F. Wan, B. Wamg, K. Mizuno, Analysis of Vulnerable Road User Kinematics Before/During/After Vehicle Collisions Based on Video Records, in: International Research Council on the Biomechanics of Injury (Ed.), 2017 IRCOBI Conference Proceedings, IRCOBI, 2017, pp. 151–165.
- Y.L. Murphey, C. Liu, M. Tayyab, D. Narayan, Accurate pedestrian path prediction using neural networks, in: 2017 IEEE Symposium Series on Computational Intelligence (SSCI), IEEE, 2017 - 2017, pp. 1–7.
- M. Goldhammer, M. M. Goldhammer, M. Gerhard, S. Zernetsch, K. Doll, U. Brunsmann, Early prediction of a pedestrian’s trajectory at intersections, in: 16th International IEEE Conference on Intelligent Transportation Systems (ITSC), 2013: 6-9 Oct. 2013, Kurhaus, The Hague, The Netherlands, IEEE, Piscataway, NJ, 2013, pp. 237–242.
- S. C. Miff, D.S. Childress, S.A. Gard, M.R. Meier, A.H. Hansen, Temporal symmetries during gait initiation and termination in nondisabled ambulators and in people with unilateral transtibial limb loss. Journal of rehabilitation research and development 2005, 42, 175–182. [Google Scholar]
- M. Goldhammer, A. Hubert, S. Koehler, K. Zindler, U. Brunsmann, K. Doll, B. Sick, Analysis on termination of pedestrians’ gait at urban intersections, in: 17th International IEEE Conference on Intelligent Transportation Systems (ITSC), 2014, pp. 1758–1763.
- T. Zou, Z. Liu, D. Wang, T. Chen, Assessing the effect of pedestrian deceleration on pedestrian autonomous emergency braking systems. INT J CRASHWORTHINES 2022, 27, 1368–1373. [Google Scholar]
Figure 1.
Sketch of the test set-up.
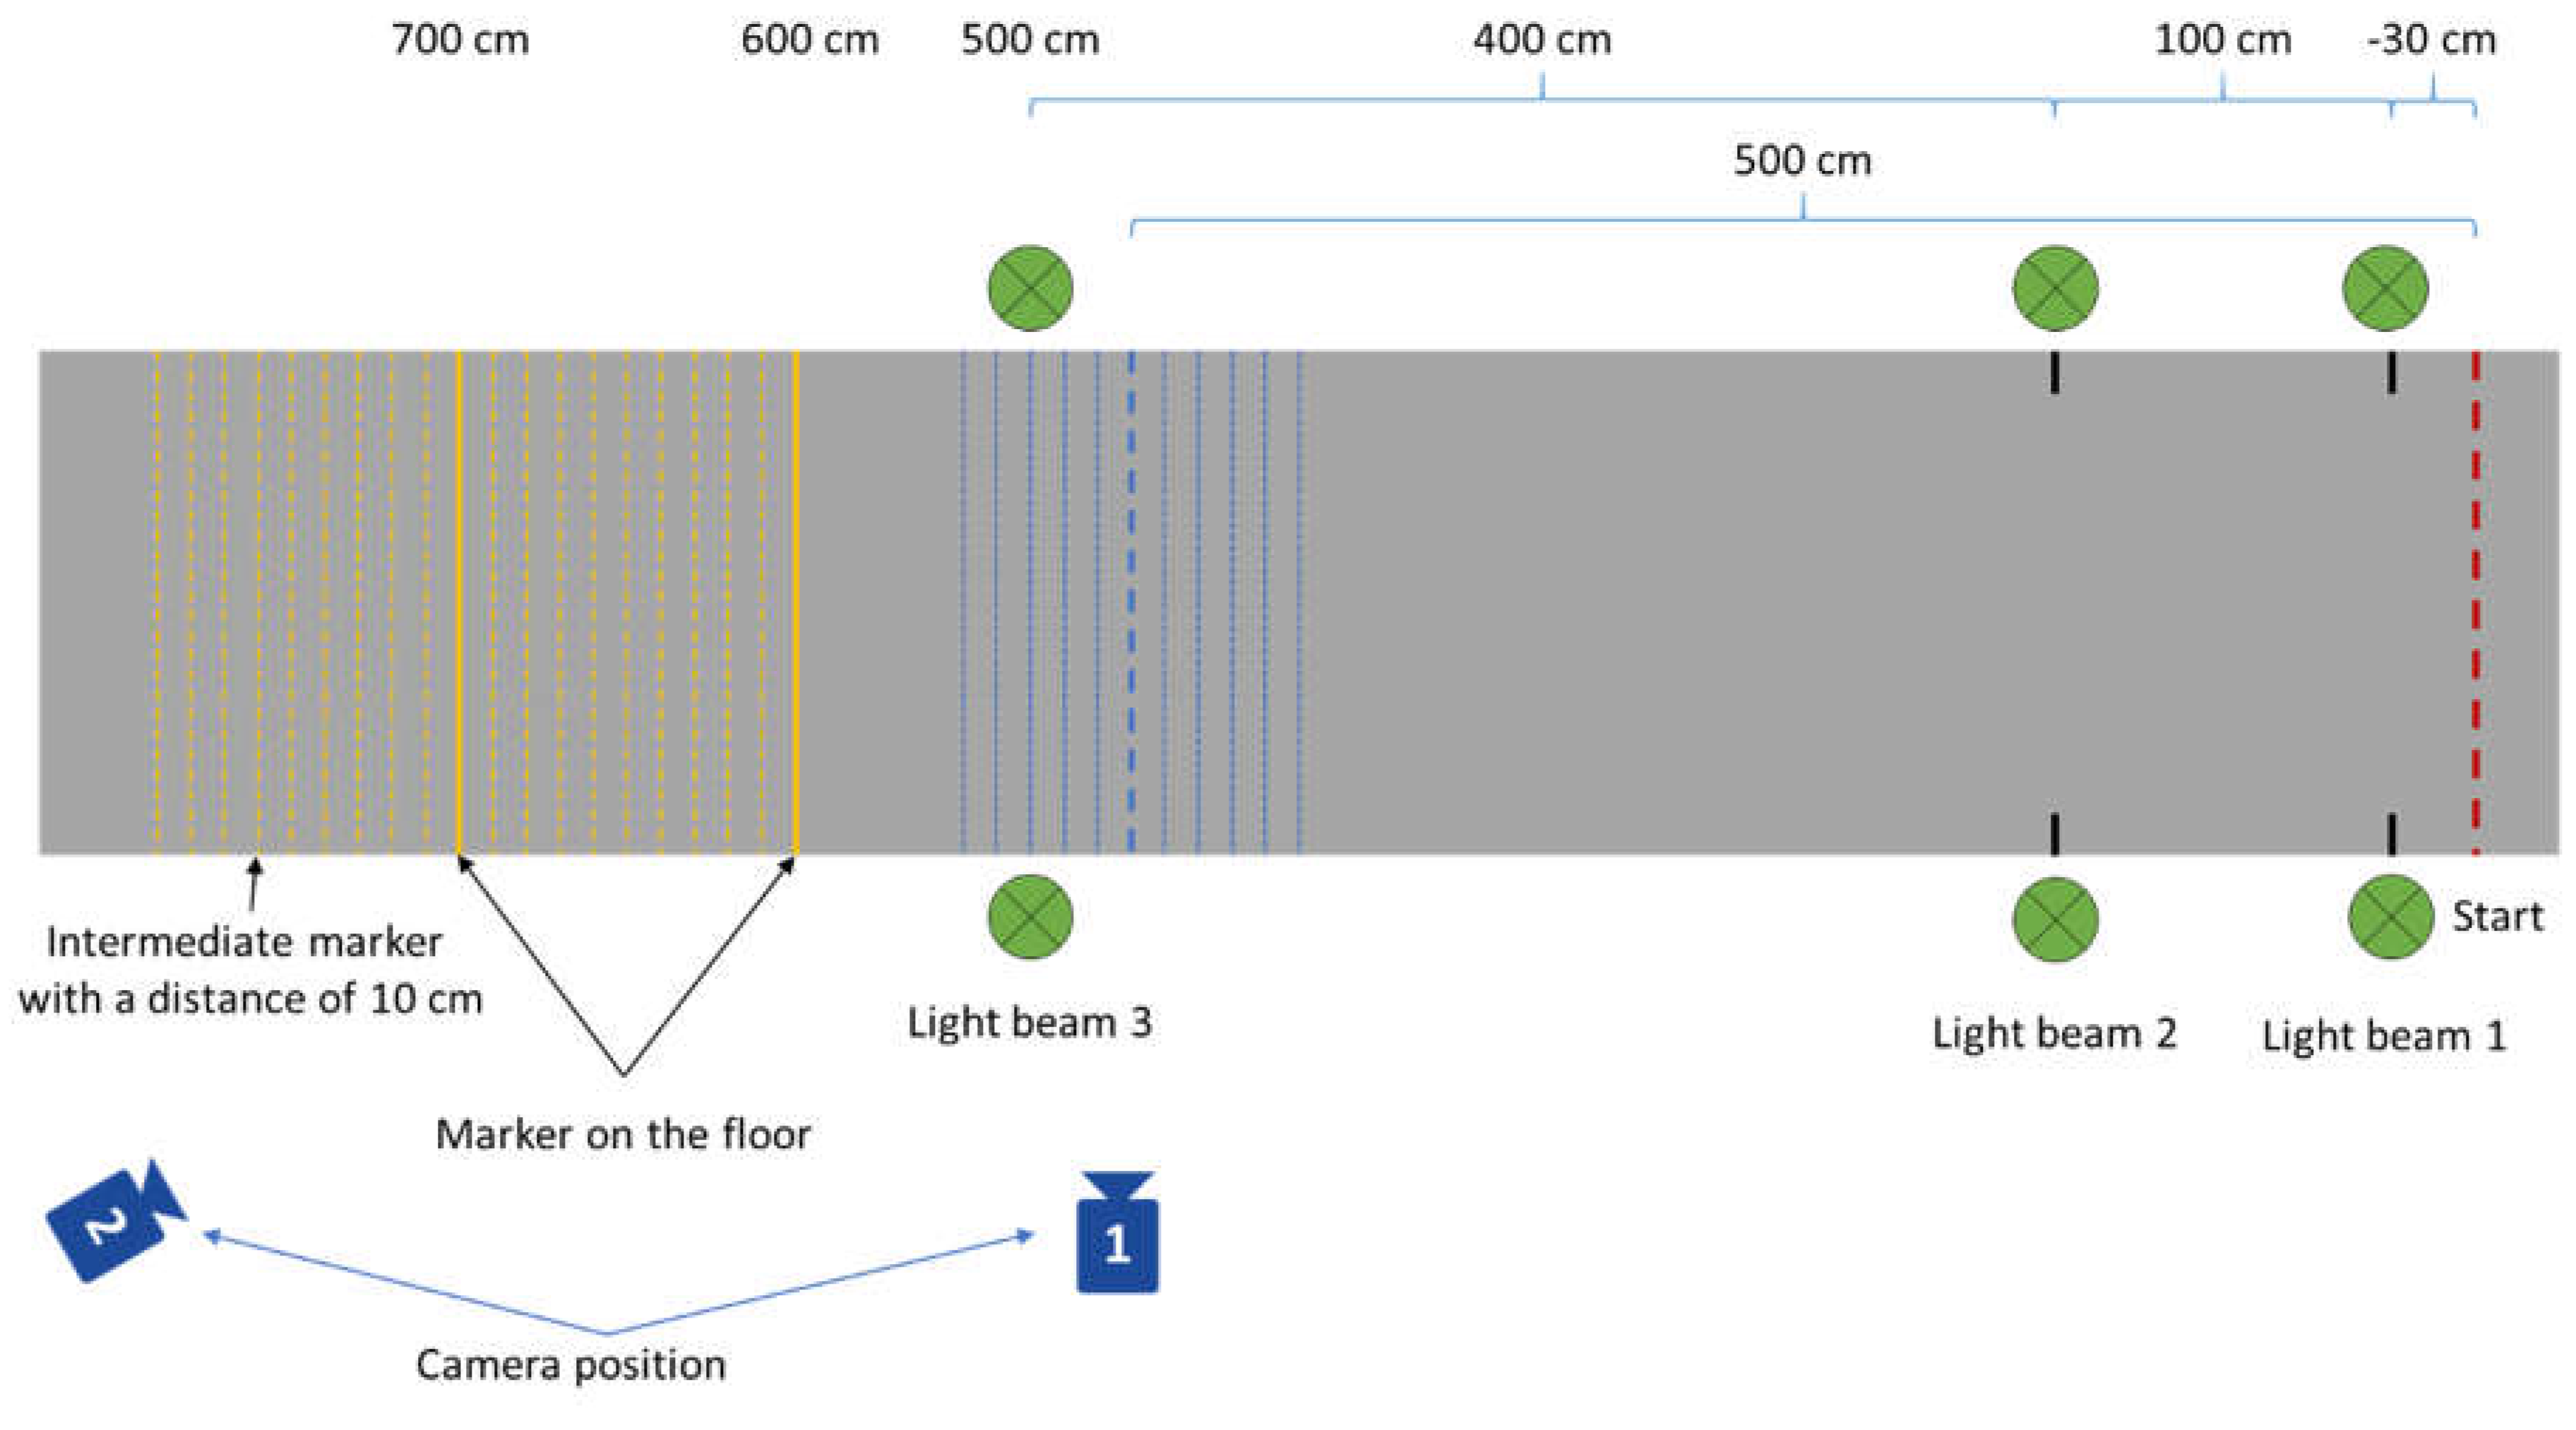
Figure 2.
Theoretical velocity-distance characteristic.
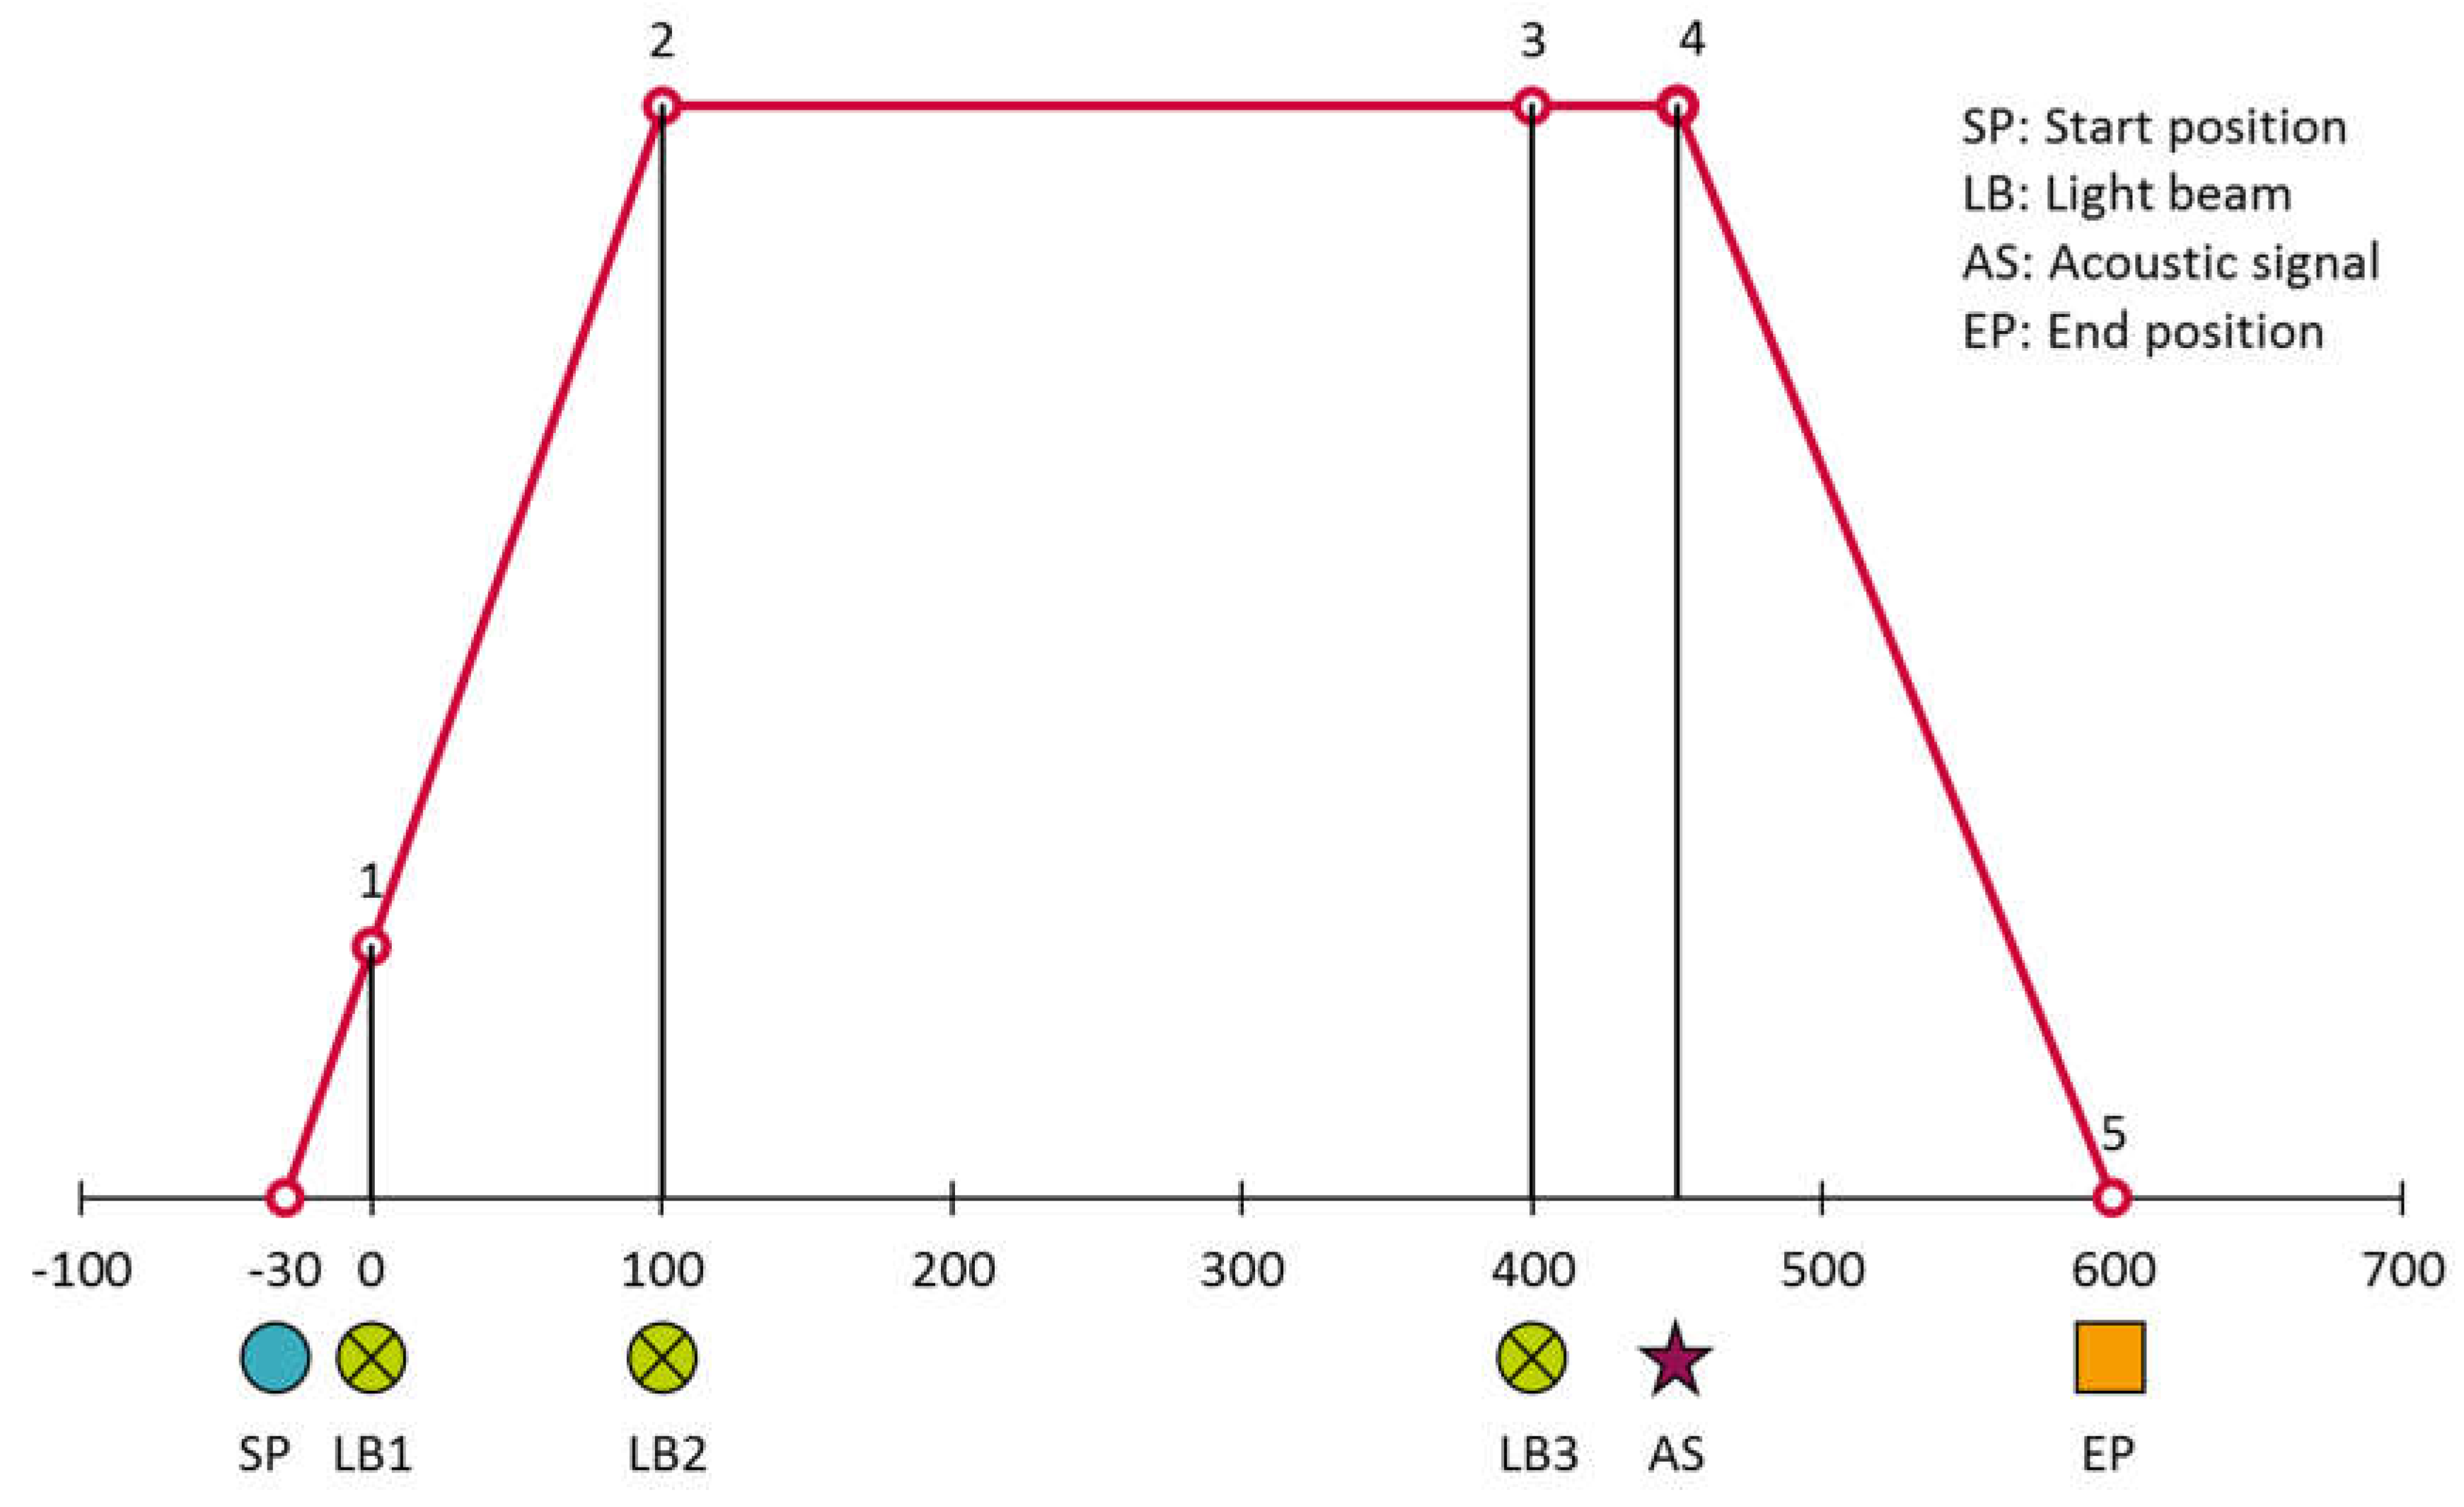
Figure 3.
Correlation between steady-state speed and stopping distance: (a) walkint test configuration; (b) running test configuration.
Figure 3.
Correlation between steady-state speed and stopping distance: (a) walkint test configuration; (b) running test configuration.
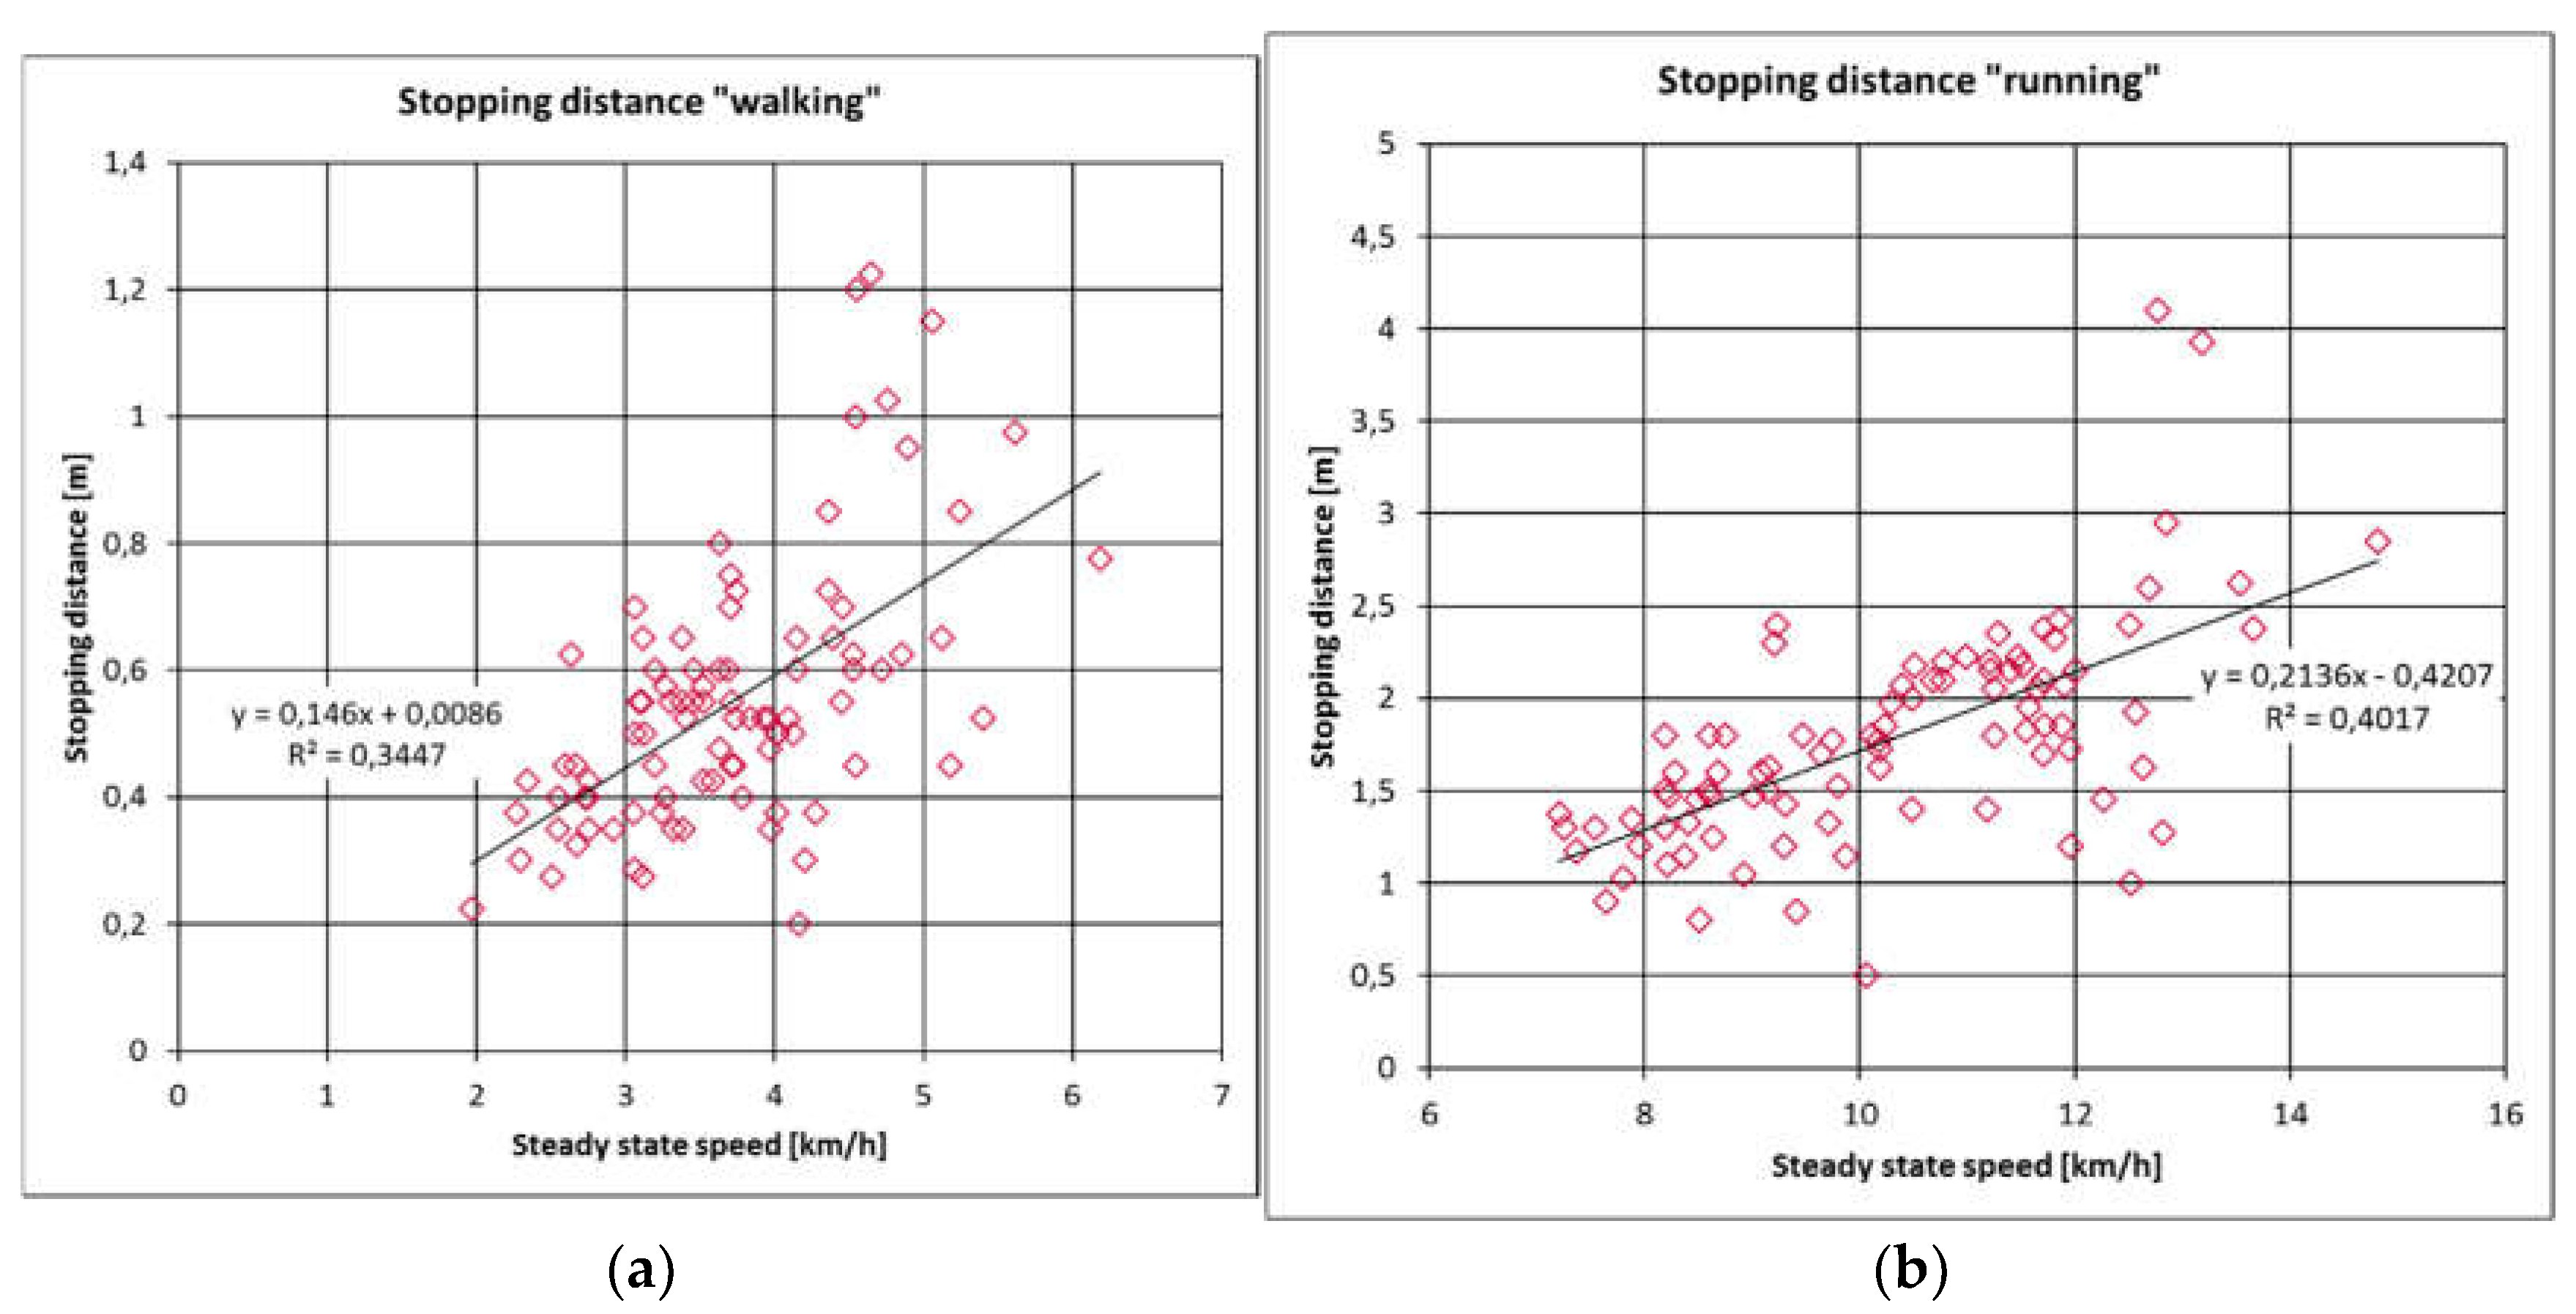
Figure 4.
Correlation between steady-state speed and stopping time: (a) walkint test configuration; (b) running test configuration.
Figure 4.
Correlation between steady-state speed and stopping time: (a) walkint test configuration; (b) running test configuration.
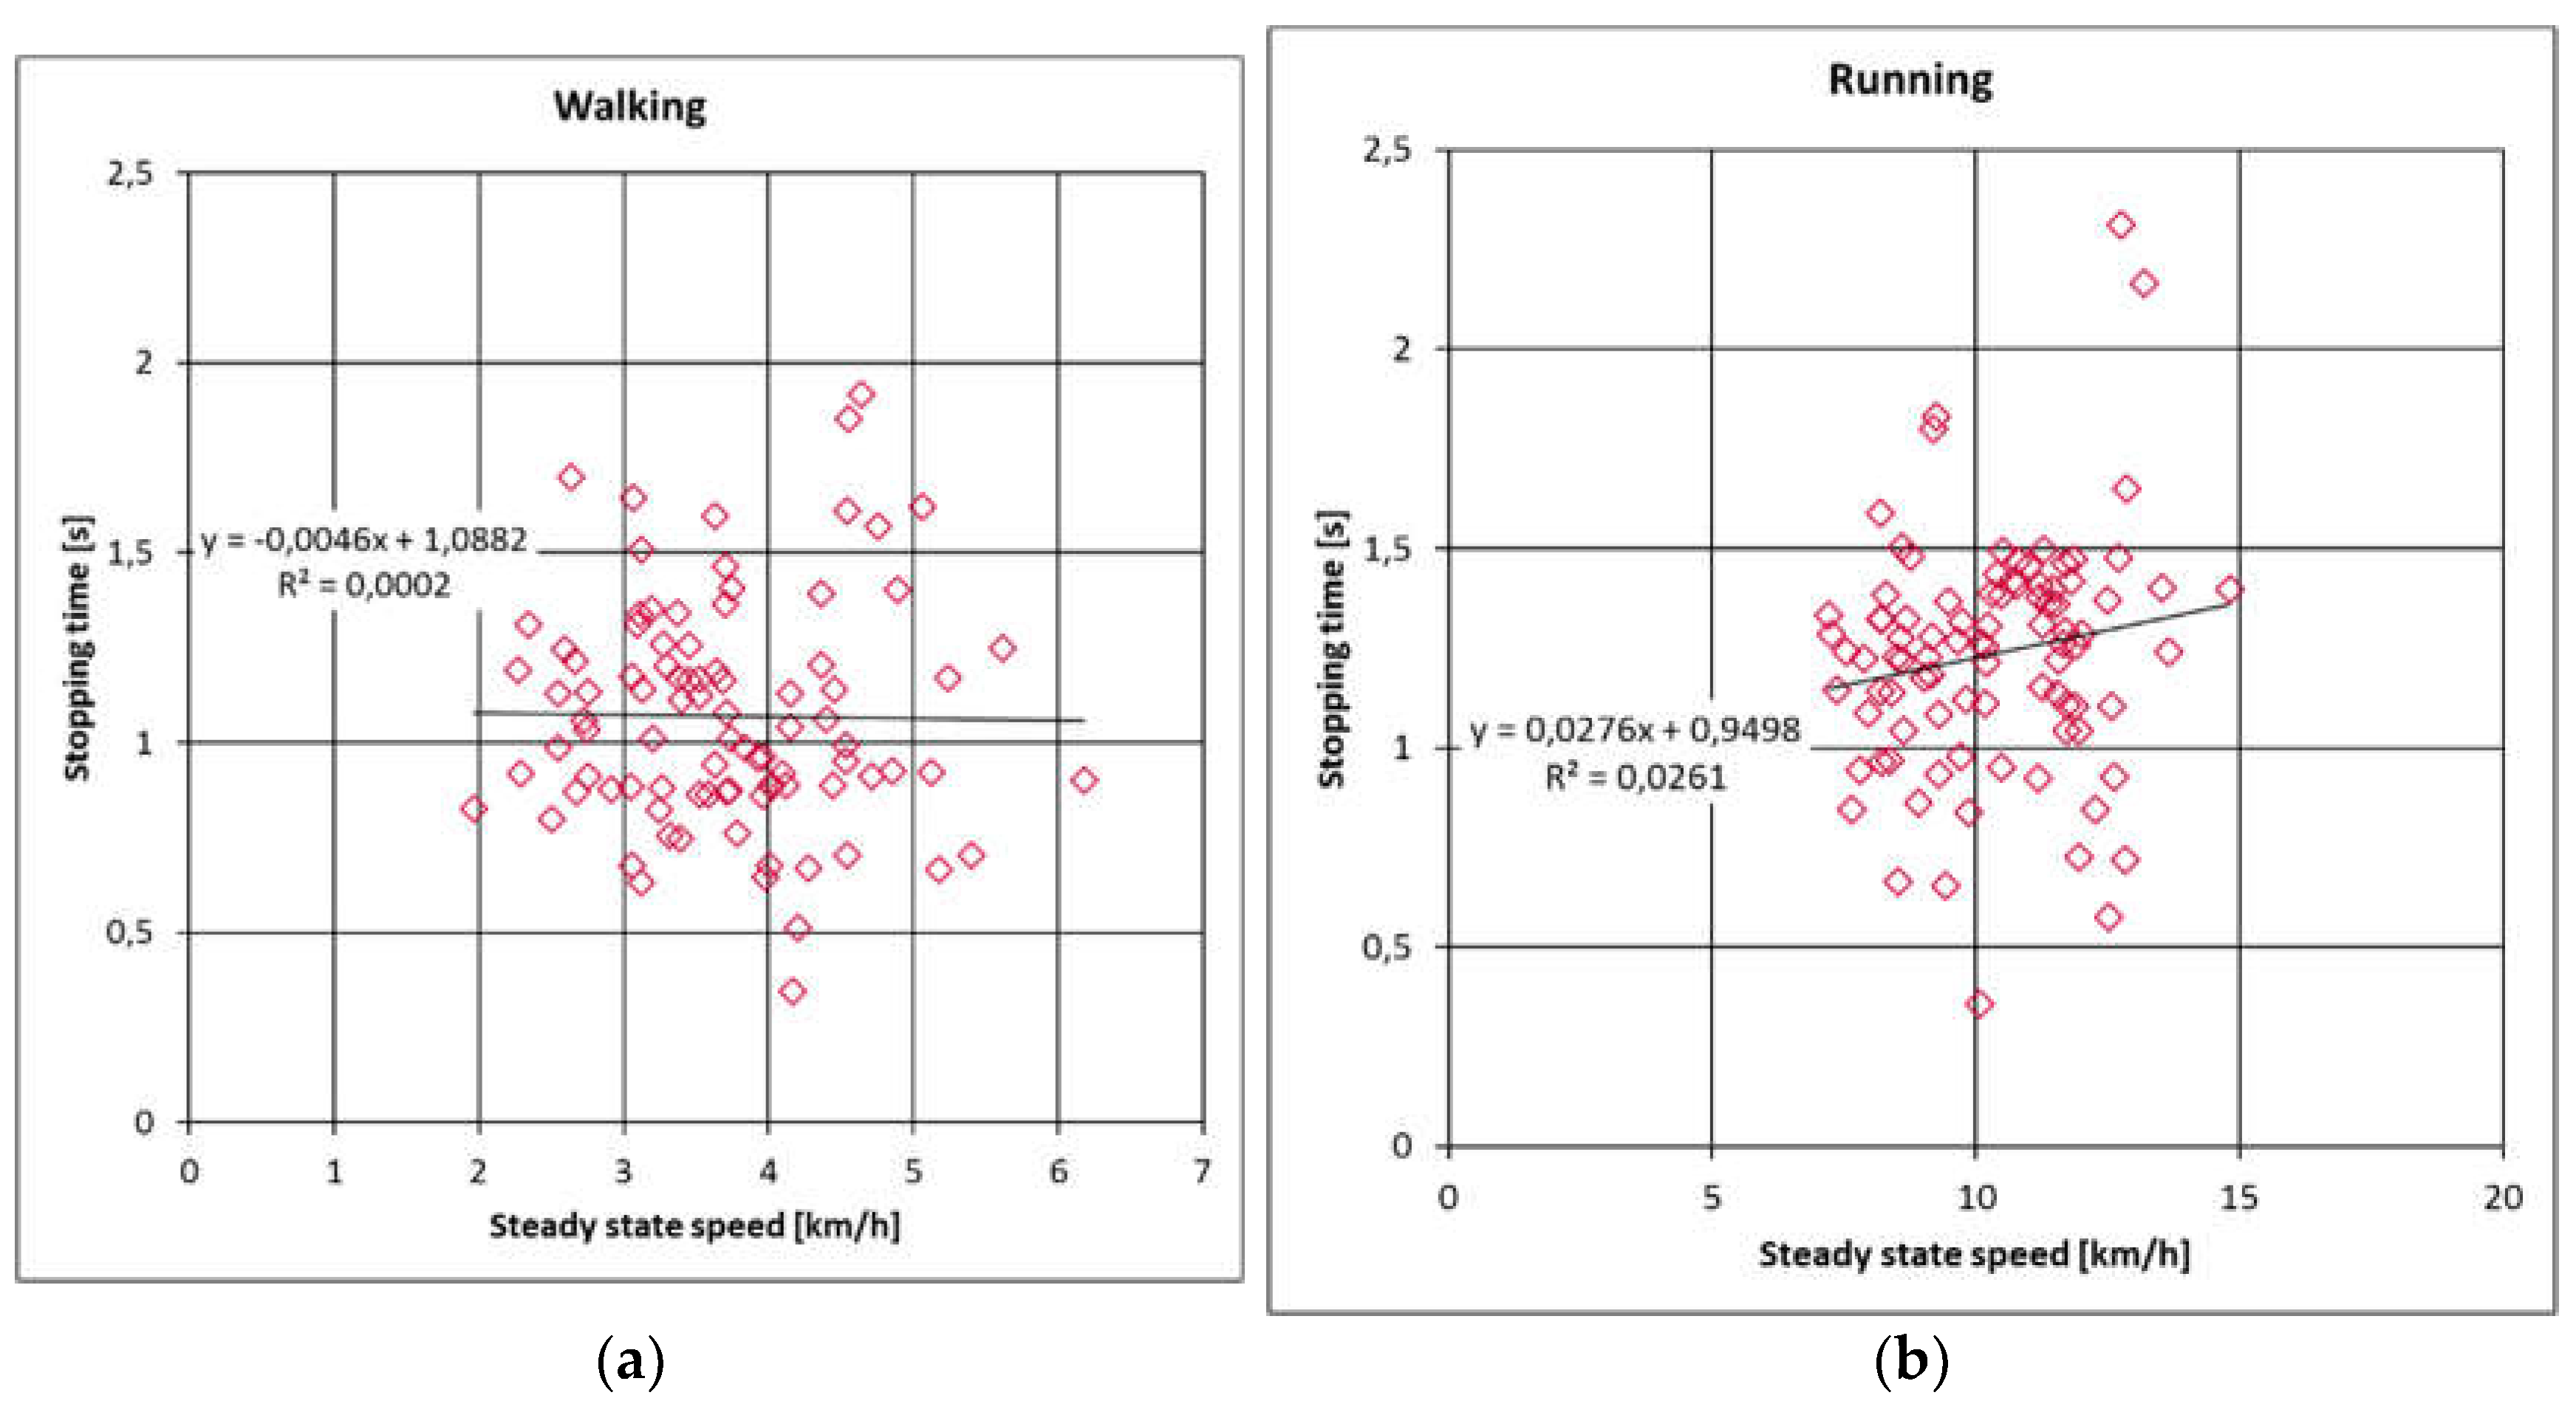
Figure 5.
Influence of the length of the test set-up.
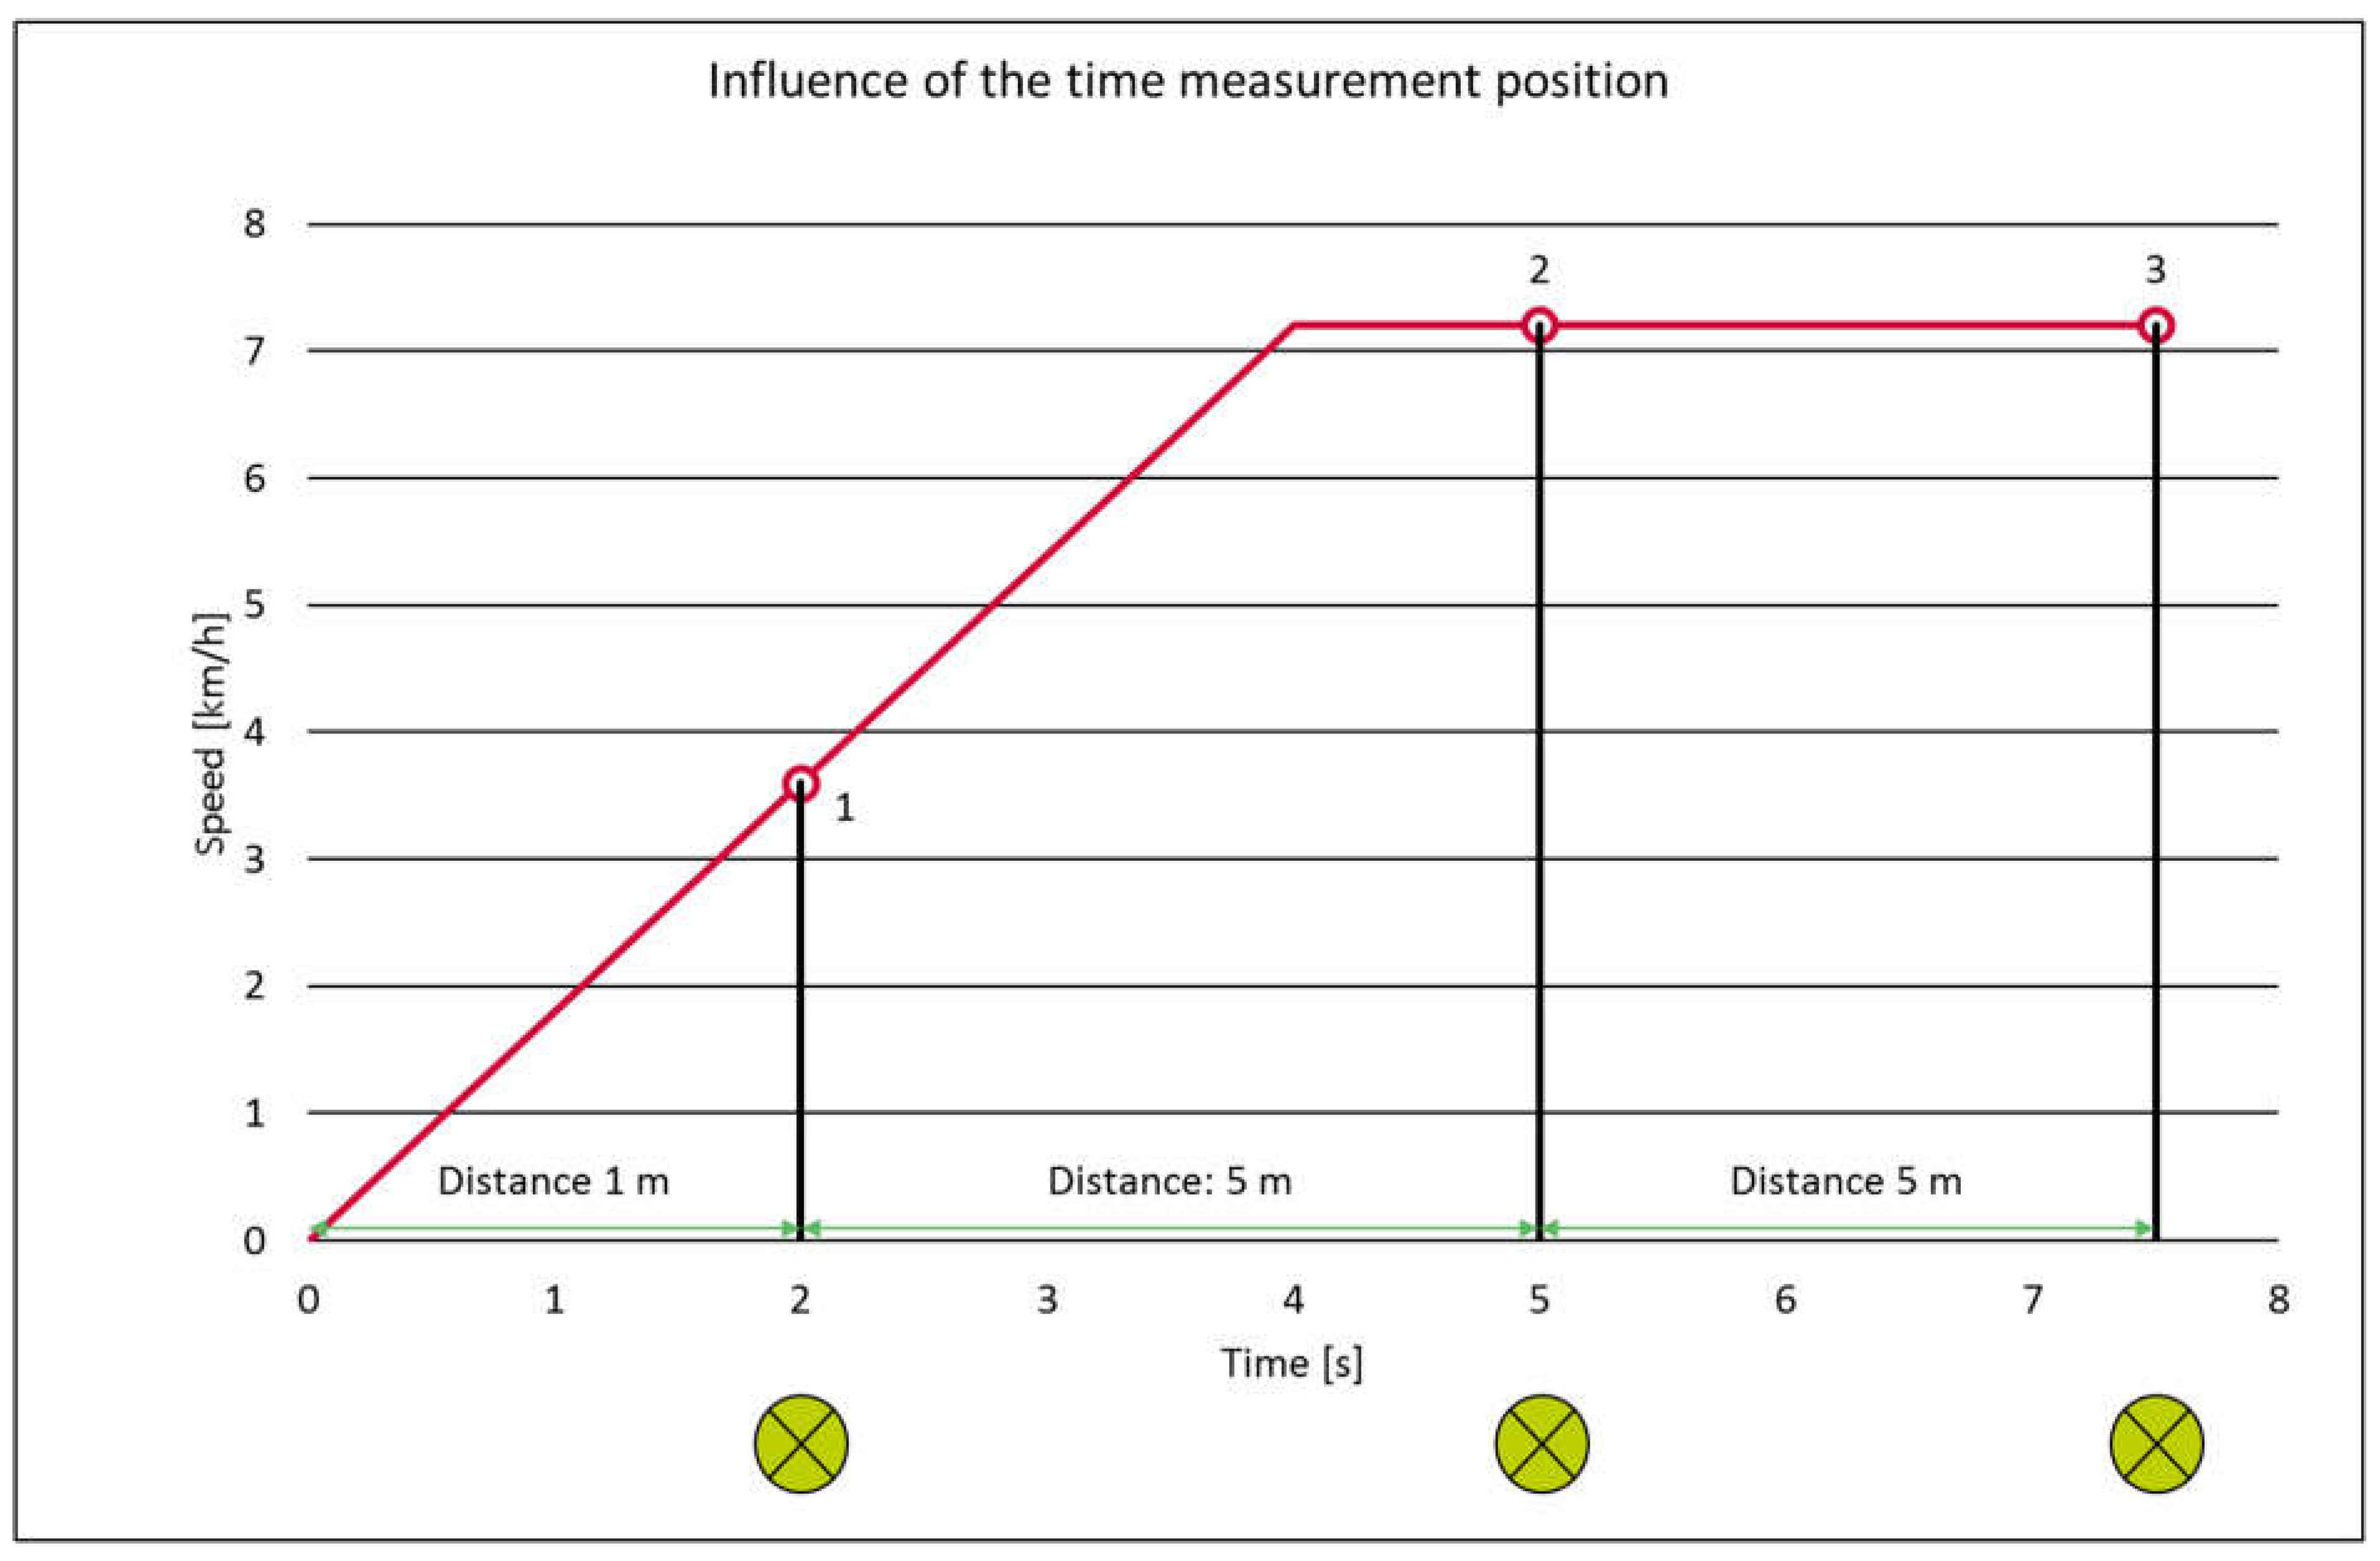
Table 1.
Sample size of the different age groups differentiated by gender.
| Physiological parameter | 6 years | 7 years | 8 years | 9–10 years |
|---|---|---|---|---|
| Number of children | 32 | 17 | 23 | 21 |
| Females | 11 | 8 | 11 | 9 |
| Males | 21 | 9 | 12 | 12 |
Table 2.
Steady-state speed in km/h of the different test configurations according to age groups between the second and third light beam (standard deviation: SD; first quartile: Q1; third quartile: Q3).
Table 2.
Steady-state speed in km/h of the different test configurations according to age groups between the second and third light beam (standard deviation: SD; first quartile: Q1; third quartile: Q3).
| Test | Age group | Number | Mean | SD | Min | Q1 | Median | Q3 | Max |
|---|---|---|---|---|---|---|---|---|---|
| Walking | 6 years | 32 | 3.69 | 0.94 | 2.11 | 3.04 | 3.44 | 4.43 | 5.69 |
| 7 years | 17 | 3.16 | 0.86 | 1.82 | 2.60 | 3.01 | 3.60 | 5.60 | |
| 8 years | 23 | 3.78 | 0.58 | 2.55 | 3.44 | 3.73 | 4.15 | 5.35 | |
| 9–10 years | 21 | 4.09 | 0.91 | 2.14 | 3.45 | 4.03 | 4.52 | 6.21 | |
| Running | 6 years | 32 | 9.59 | 1.65 | 5.12 | 8.23 | 9.47 | 10.76 | 12.85 |
| 7 years | 17 | 10.39 | 2.17 | 6.46 | 8.47 | 11.21 | 11.98 | 13.84 | |
| 8 years | 23 | 10.03 | 1.68 | 6.82 | 8.74 | 9.80 | 11.50 | 13.84 | |
| 9–10 years | 21 | 11.41 | 1.75 | 8.14 | 10.06 | 11.57 | 12.52 | 15.65 | |
| Sprinting | 6 years | 32 | 11.86 | 1.44 | 7.62 | 11.29 | 11.90 | 12.74 | 13.98 |
| 7 years | 17 | 12.87 | 1.11 | 10.06 | 12.30 | 12.97 | 13.33 | 14.54 | |
| 8 years | 23 | 13.25 | 1.02 | 11.42 | 12.52 | 13.33 | 13.91 | 15.65 | |
| 9–10 years | 21 | 13.64 | 0.66 | 12.52 | 13.09 | 13.58 | 13.98 | 14.84 |
Table 3.
Average stopping distance to standstill after the acoustic signal.
| Test | Age group | Number | Mean | SD | Min | Q1 | Median | Q3 | Max |
|---|---|---|---|---|---|---|---|---|---|
| Walking | 6 years | 32 | 0.63 | 0.23 | 0.35 | 0.45 | 0.55 | 0.78 | 1.23 |
| 7 years | 17 | 0.53 | 0.28 | 0.23 | 0.35 | 0.40 | 0.63 | 1.20 | |
| 8 years | 23 | 0.54 | 0.12 | 0.28 | 0.50 | 0.55 | 0.63 | 0.75 | |
| 9–10 years | 21 | 0.47 | 0.14 | 0.20 | 0.38 | 0.45 | 0.55 | 0.78 | |
| Running | 6 years | 32 | 1.74 | 0.43 | 0.80 | 1.41 | 1.79 | 2.10 | 2.40 |
| 7 years | 17 | 1.84 | 0.79 | 0.90 | 1.33 | 1.60 | 2.18 | 4.10 | |
| 8 years | 23 | 1.72 | 0.63 | 0.85 | 1.26 | 1.70 | 2.03 | 3.93 | |
| 9–10 years | 21 | 1.85 | 0.61 | 0.25 | 1.50 | 1.93 | 2.23 | 2.85 | |
| Sprinting | 6 years | 32 | 0.63 | 0.23 | 0.35 | 0.45 | 0.55 | 0.78 | 1.23 |
| 7 years | 17 | 0.53 | 0.28 | 0.23 | 0.35 | 0.40 | 0.63 | 1.20 | |
| 8 years | 23 | 0.54 | 0.12 | 0.28 | 0.50 | 0.55 | 0.63 | 0.75 | |
| 9–10 years | 21 | 0.47 | 0.14 | 0.20 | 0.38 | 0.45 | 0.55 | 0.78 |
Table 4.
Average stopping time to standstill after the acoustic signal.
| Test | Age group | Number | Mean | SD | Min | Q1 | Median | Q3 | Max |
|---|---|---|---|---|---|---|---|---|---|
| Walking | 6 years | 11 | 1.21 | 0.26 | 0.67 | 1.02 | 1.20 | 1.34 | 1.92 |
| 7 years | 8 | 1.16 | 0.37 | 0.75 | 0.88 | 1.06 | 1.51 | 1.85 | |
| 8 years | 11 | 1.03 | 0.20 | 0.63 | 0.89 | 1.04 | 1.17 | 1.47 | |
| 9–10 years | 9 | 0.84 | 0.22 | 0.35 | 0.68 | 0.87 | 0.92 | 1.34 | |
| Running | 6 years | 11 | 1.28 | 0.26 | 0.67 | 1.12 | 1.27 | 1.45 | 1.83 |
| 7 years | 8 | 1.25 | 0.37 | 0.72 | 0.98 | 1.26 | 1.38 | 2.31 | |
| 8 years | 11 | 1.22 | 0.29 | 0.65 | 1.10 | 1.26 | 1.31 | 2.17 | |
| 9–10 years | 9 | 1.17 | 0.30 | 0.36 | 1.10 | 1.24 | 1.39 | 1.50 |
Table 5.
Average stopping deceleration to standstill after the acoustic signal.
| Test | Age group | Number | Mean | SD | Min | Q1 | Median | Q3 | Max |
|---|---|---|---|---|---|---|---|---|---|
| Walking | 6 years | 32 | 0.91 | 0.31 | 0.50 | 0.70 | 0.83 | 1.08 | 1.95 |
| 7 years | 17 | 0.81 | 0.23 | 0.44 | 0.67 | 0.77 | 0.94 | 1.27 | |
| 8 years | 23 | 1.07 | 0.26 | 0.73 | 0.86 | 1.09 | 1.26 | 1.62 | |
| 9–10 years | 21 | 1.57 | 0.68 | 0.73 | 1.15 | 1.45 | 1.90 | 3.35 | |
| Running | 6 years | 32 | 2.24 | 0.61 | 1.41 | 1.96 | 2.12 | 2.35 | 3.93 |
| 7 years | 17 | 2.51 | 0.90 | 1.53 | 2.13 | 2.35 | 2.75 | 4.99 | |
| 8 years | 23 | 2.44 | 0.72 | 1.77 | 2.01 | 2.20 | 2.58 | 4.65 | |
| 9–10 years | 21 | 3.19 | 1.68 | 1.83 | 2.27 | 2.72 | 3.29 | 8.06 |
Disclaimer/Publisher’s Note: The statements, opinions and data contained in all publications are solely those of the individual author(s) and contributor(s) and not of MDPI and/or the editor(s). MDPI and/or the editor(s) disclaim responsibility for any injury to people or property resulting from any ideas, methods, instructions or products referred to in the content. |
© 2025 by the authors. Licensee MDPI, Basel, Switzerland. This article is an open access article distributed under the terms and conditions of the Creative Commons Attribution (CC BY) license (http://creativecommons.org/licenses/by/4.0/).
Copyright: This open access article is published under a Creative Commons CC BY 4.0 license, which permit the free download, distribution, and reuse, provided that the author and preprint are cited in any reuse.


