Submitted:
26 March 2025
Posted:
28 March 2025
You are already at the latest version
Abstract
In close-distance coal seam mining, the concentrated stress from overlying obliquely in-tersected remnant coal pillars significantly impacts the mining of underlying coal seams. Taking the mining of Panel 22208 in the 2-2 coal seam beneath the Huojitu Mine of Da-liuta Coal Mine as the engineering case, this study established an elastic thin plate me-chanical model with two elastically clamped boundaries and two elastically simply sup-ported boundaries under the concentrated stress of overlying obliquely intersected rem-nant coal pillars (nonlinear load Q), based on theoretical analysis and elastic thin plate mechanics theory. The mechanical and fracture characteristics of key rock strata were in-vestigated when the working face was located at 0 m, 20 m, 40 m, and 60 m within the in-fluence range of remnant coal pillars. The results indicate: (1) The spatial sequence of ini-tial fracture in key rock strata is: coal wall side ahead of the working face → coal wall side behind the working face → solid coal side → central area of the working face → coal pillar side. (2) Under nonlinear load Q, a critical transition occurs at 40 m within the influence range of remnant coal pillars. The absolute value of maximum principal bending moment shifts from dual-peak maxima at both sides to a single-peak maximum at one side, with an overall increase of 12%. (3) The concentrated stress from overlying obliquely intersect-ed remnant coal pillars (nonlinear load Q) is the primary factor altering the fracture se-quence and angles of key rock strata, demonstrating significant influence on their fracture characteristics.
Keywords:
Close-distance coal seam mining
; Overlying obliquely intersected remnant coal pillars
; Thin plate theory
; Initial fracture
; Finite difference method
1. Introduction
In close-distance coal seam mining, the roof structure of underlying coal seams exhibits significant differences from single-seam mining due to mining-induced disturbances in overlying seams. Particularly, the uneven stress transfer caused by remnant coal pillars in the floor strata leads to complex stress conditions in the roof of underlying working faces, increasing risks of roof instability, collapse leakage, and shield support failure.
Extensive research has been conducted on roof fracture instability mechanisms and control methods. Previous studies include: Analysis of initial fracture span and post-fracture stability conditions of main roofs using clamped boundary rock beam models [1,2,3]; Investigation of fracture span and rock mass disturbance characteristics via elastic foundation boundary rock beam models [4,5,6]; Exploration of initial fracture patterns in main roofs through four-edge clamped thin plate mechanical models [7,8,9]; Development of plate mechanical models with one simply supported edge (coal pillar side) and three clamped edges (solid coal side) to study fracture patterns under partially mined conditions [10,11,12,13,14].However, limited research exists on roof fracture characteristics under overlying obliquely intersected remnant coal pillars.
To address this gap, an elastic thin plate mechanical model with two elastically clamped boundaries and two elastically simply supported boundaries was established under concentrated stress from overlying obliquely intersected remnant coal pillars. This study investigates the manifestation mechanisms and causative factors of working face pressure in close-distance coal seam mining with overlying oblique remnant coal pillars, providing critical theoretical and practical guidance for roof control and mine safety management.
2. Engineering Overview
The Huojitu Mine belongs to the Daliuta Coal Mine, a representative close-distance coal seam mining operation with 7 minable coal seams. During the initial mining phase, four upper coal group seams were extracted sequentially from top to bottom: 1-2 Upper, 1-2, 2-2 Upper, and 2-2 coal seams. Three lower coal group seams remain for later mining. After years of extraction, numerous remnant coal pillars with varying widths were left in the goaf area during the 1-2 coal seam mining. Current mining operations focus on the 2-2 coal seam, where working face layouts deviate from those in the 1-2 coal seam, resulting in obliquely intersected remnant coal pillars.
This study investigates Panel 22208 in the 2-2 coal seam’s No. 2 panel, located approximately 35 m below the upper coal seam with intervening key rock strata. As shown in Figure 1, the 22208 working face must traverse multiple obliquely intersected remnant coal pillars (intersected at approximately 79°) in the overlying 1-2 coal seam goaf during mining operations. These remnant pillars measure 30 m and 15 m in width. During 2-2 coal seam extraction, localized roof collapse and shield support failures have been observed under the influence of these overlying remnant coal pillars.
2. Establishment of Thin Plate Mechanical Model for Key Rock Strata
2.1. Identification of Key Overburden Strata
Any stratum in the mining-disturbed overburden is subjected to loads from both its self-weight and the interactive forces generated by adjacent overlying strata. Typically, these loads exhibit non-uniform distribution across rock layers. To simplify the analytical complexity, a rational assumption is adopted wherein the strata loads are considered uniformly distributed. As shown in Figure 2, let there be m rock layers above the immediate roof, with thicknesses hi(i= 1, 2, …, m). The first layer (designated Layer 1) governs the deformation of n subordinate strata. Layers 1 through n undergo synchronized deformation, forming a composite beam structure.
According to the composite beam principle, the load (qn)1 induced by the n-th layer on the first layer is expressed as:
In the formula: Ei, γi, hi represent the elastic modulus, unit weight, and thickness of the i-th stratum, respectively.
According to the deformation characteristics of key strata:If n strata exhibit synchronized coordinated deformation, the lowermost stratum within this group is identified as the key stratum. These strata are numbered sequentially from bottom to top. Let there be m additional strata above the n-th stratum.
Based on the load characteristics of key strata:
If Equation (2) holds true, the n-th stratum and the (n+1)-th stratum exhibit incoordinated deformation. The (n+1)-th stratum demonstrates significant load-bearing capacity, thereby identifying the first stratum as a hard stratum. This hard stratum synchronously controls deformation across strata 1 to n.
Based on the theoretical analytical method for key stratum determination outlined above, the positions of key strata were determined. The mechanical parameters of the strata are listed in Table 1.
Due to the completed extraction of the No. 1-2 coal seam, both the primary key stratum and two sub-key strata have been fractured. Only one sub-key stratum above the No. 2-2 coal seam remains intact.
2.2. Floor Stress Transfer from Overlying Obliquely Intersected Remnant Coal Pillars
This section may be divided by subheadings. It should provide a concise and precise description of the experimental results, their interpretation, as well as the experimental conclusions that can be drawn.
Following the extraction of the upper coal seam, remnant coal pillars and articulated rock blocks jointly bear the overburden load. Stress from these pillars transfers to the floor strata, inducing stress redistribution. The stress influence on the floor is predominantly manifested as vertical stress, which attenuates with increasing floor depth [15-16].
As shown in Figure 3, during working face advancement, the load Q on the immediate roof progressively increases under the concentrated stress from overlying remnant coal pillars. A nonlinear relationship exists between load Q and the distance x from the working face to the remnant coal pillar, as expressed in Equation (1):
In the formula: γ is the average bulk density of the bottom layer, kg/m3; H is the mining depth, m; a is a constant.
Under the concentrated stress from overlying obliquely intersected 79° remnant coal pillars (nonlinear load Q), the fracture characteristics of the roof strata exhibit positional variations in the working face open-off-cut area. As illustrated in Figure 3 and Figure 4, this study investigates the fracture patterns of key rock strata when the open-off-cut zone is positioned at locations ①, ②, ③, and ④.
2.3. Establishment of Mechanical Model
Based on the elastic thin plate mechanics assumptions [17], the governing equation is expressed as:
In the formula: h is the thickness of the plate, m; l is the short side length of the board, m. The primary roof strata in conventional mining areas are found to satisfy these criteria prior to initial fracturing and thus qualify as elastic thin plates.
A mechanical model of key rock strata under nonlinear loading is established as shown in Figure 5, featuring elastic fixed support boundaries on two sides and elastic simply supported boundaries on the other two sides. The x-direction represents the working face advancement direction. ABCD denotes the open-off-cut zone (S1 area), D₂C₂C₁D₁ corresponds to the coal pillar support zone (S3 area), and the remaining regions constitute the solid coal support zone (S2 area).
The overlying strata of the key rock stratum are assumed to be infinite-stiffness media, with the key stratum, coal seam, and floor strata also modeled as infinite-stiffness rock masses. Consequently, rigid fixed boundary conditions are imposed at all coal wall interfaces. However, edges A₁B₁ and A₁D₁ in practical calculations do not extend infinitely and better conform to elastic fixed support conditions rather than rigid constraints. The Winkler elastic foundation model is therefore introduced. Coal pillars exhibit width-dependent support capacities for overlying strata, making it more realistic to treat the coal pillar zone as a deformable elastic foundation boundary. Thus, edge C₁D₁ is defined as an elastic simply supported boundary. Edge B₁C₂, located 50 m ahead of the working face and subjected to nonlinear load Q, is treated as an elastic simply supported boundary [18-19].
The region to the right of straight line EF (EB₁C₁F zone) is identified as the remnant coal pillar influence area. Nonlinear load Q is applied to the EB₁C₁F zone, while uniform load q (sum of self-weight and overburden density) is imposed on other regions. Mechanical models are established for working face positions at 0 m, 20 m, 40 m, and 60 m within the remnant pillar influence range.
In the figure: AB is solid coal side, BC is 22208 working face front coal wall, CD is pillar side, DA is 22208 working face rear coal wall.
Partial differential equation for deflection of primary roof strata in S1 area:
In the formula: ω1(x,y) denotes the deflection function of primary roof strata in S1 area, q represents the applied load on the primary roof strata, and D indicates the flexural rigidity of the primary roof strata.
Partial differential equation for deflection of primary roof strata in S2 area:
In the formula: ω2(x,y) denotes the deflection function of primary roof strata in S2 area, and k1 represents the elastic foundation coefficient of the solid coal zone.
Partial differential equation for deflection of primary roof strata in S3 area:
In the formula: ω3(x,y) denotes the deflection function of primary roof strata in S3 area, and k2 represents the elastic foundation coefficient of the coal pillar zone.
In the formula: E denotes the elastic modulus GPa, h represents the thickness of primary roof strata m, and μ indicates the Poisson's ratio.
2.4 Boundary Conditions
- External Boundary Conditions;
Edges A1B1 and A1D1 are elastic fixed support boundaries; Edges B1C1 and C1D1 are elastic simply supported boundaries.
- Internal Boundary Conditions;
2.5 Finite Difference Method for Deflection PDE Solution
When applying the finite difference method for numerical solution, a nodal distribution scheme is constructed as shown in Figure 6, with nodal spacing Δx = Δy = H (H: characteristic length parameter), where node O serves as the characteristic nodal point. This configuration yields a 25-node deflection difference equation corresponding to the primary roof strata deflection PDE under the nodal numbering scheme of Figure 6 [20].
Utilizing matrix operations in MATLAB, combined with boundary condition difference equations, the system of equations is solved to obtain deflection solutions for all nodal points.
The governing equation for deflection ω is expressed as:
Solutions for internal force components are derived as:
Principal bending moments are obtained from the internal force component solutions:
Substituting Equation (9) into Equations (5), (6), (7), and (13) yields the deflection partial differential equations for the primary roof strata in S1, S2, and S3 areas, along with the principal bending moments.
3. Calculation and Result Analysis of Key Stratum Thin-Plate Mechanical Model
The working face length is 150 m, the working face advance distance is 30 m, and the fundamental parameters of the key stratum are as follows: elastic modulus is 32.7 GPa, thickness is 6.75 m, Poisson’s ratio is 0.2, the minimum load borne by the key stratum is 2.23 MPa, the maximum load is 3.19 MPa, the elastic foundation coefficient k1 of the solid coal support area (S2 area) is 2 GN/m³, and the elastic foundation coefficient k2 of the pillar support area (S3 area) is 0.6 GN/m³.
According to the above calculation method, the deflection solution at any point of the key stratum is obtained. The principal bending moments of the key stratum are solved using Equation (13) and plotted with MATLAB software.
Using the computational methodology described, the deflection solutions across the key stratum were obtained. Principal bending moments were calculated through Equation (13) and visualized using MATLAB software.
3.1. Characteristics of Principal Bending Moment Distribution
3.1.1. Working Face at 0 m and 20 m Within Remnant Pillar Influence Zone
From Figure 7 and Figure 8: The maximum principal bending moment M1 in the central working face area is a positive bending moment, indicating compressive stress on the upper surface and tensile stress on the lower surface of the primary roof strata. The peak M1 does not occur at the geometric center of the working face but is offset toward the solid coal side and pillar side.
The maximum principal bending moment M3 at the front coal wall side, rear coal wall side, solid coal side, and pillar side is a negative bending moment, meaning the upper surface of the main roof in these areas is subjected to tensile stress while the lower surface is under compressive stress. The points of maximum principal bending moment on the solid coal side and pillar side are located at the midpoints of the short edges of the working face, while those on the front coal wall side and rear coal wall side are at the ends of the long edges of the working face.
The absolute magnitudes of the maximum principal bending moments follow this order: Front coal wall side = Rear coal wall side > Solid coal side > Working face center > Pillar side.
3.1.2. Working Face at 40 m and 60 m Within Remnant Pillar Influence Zone
As observed in Figure 9 and Figure 10, the maximum principal bending moment M1 at the working face center is a positive bending moment, with its peak value point not located at the central area of the working face but rather near the solid coal side.
The maximum principal bending moment M3 at the front coal wall side, rear coal wall side, solid coal side, and pillar side manifests as negative bending moments. The peak M3 values at the solid coal side and pillar side are located at the midpoints of the short edges of the working face, while those at the front and rear coal wall sides occur near the solid coal side.
The absolute magnitudes of the maximum principal bending moments follow this hierarchy: Front coal wall side > Rear coal wall side > Solid coal side > Working face center > Pillar side.
The bending moment distribution across these positions exhibits a decreasing trend from the front coal wall side to the rear coal wall side and then to the working face center, with the attenuation direction being solid coal side → pillar side.
3.2. Nonlinear Load Q Effects in Key Stratum Thin-Plate Mechanical Model
As shown in Figure 11(a), the principal bending moment M1 curves at the working face center for positions 0 m, 20 m, 40 m, and 60 m within the remnant pillar influence zone are presented. The characteristics of the first two curves are as follows: the maximum principal bending moment points are located near the pillar side and the solid coal side. The characteristics of the latter two curves are as follows: the maximum principal bending moment points are located near the solid coal side. As the working face advances and the distance within the remnant pillar influence zone increases, the applied load gradually increases, leading to progressive growth of the maximum principal bending moment points, which transition from bilateral peak distribution to unilateral peak distribution. The maximum M1 value at the 40 m position is 1.24×10⁸N·m, and the maximum M1 value at the 60 m position is 1.40×10⁸N·m. The curves from the third to fourth positions exhibit an overall increasing trend with a 12% increment.
As shown in Figure 11(b), the absolute principal bending moment M3 curves at the working face center for positions 0 m, 20 m, 40 m, and 60 m are presented. The maximum absolute M3 values are located near the solid coal side. As the working face advances, the maximum absolute M3 value at the 40 m position is 7.18×10⁸N·m, and the maximum absolute M3 value at the 60 m position is 8.10×10⁸N·m. The curves from the third to fourth positions show an overall increase of 12%.
As shown in Figure 12, the principal bending moment M3 curves at the front and rear coal walls of the working face for positions 0 m, 20 m, 40 m, and 60 m are presented. Curves a and b represent the M3 curves at the front and rear coal walls of the working face located at 0 m within the remnant pillar influence zone. Curves c and d represent the M3 curves at the front and rear coal walls of the working face located at 20 m within the remnant pillar influence zone. Curves e and f represent the M3 curves at the front and rear coal walls of the working face located at 40 m within the remnant pillar influence zone. Curves g and h represent the M3 curves at the front and rear coal walls of the working face located at 60 m within the remnant pillar influence zone.
The distribution characteristics of the maximum absolute principal bending moments align with those shown in Figure 11(a), with the following distinction: the absolute maximum principal bending moment at the front coal wall is greater than that at the rear coal wall, which is greater than that at the working face center.
As the working face advances and the distance within the remnant pillar influence zone increases, the applied load progressively intensifies. The peak absolute principal bending moments at all positions gradually increase, with the maximum absolute bending moments at the front coal wall side, rear coal wall side, and working face center transitioning from bilateral peaks to unilateral peaks. The principal bending moment curves from the 40 m to 60 m positions within the remnant pillar influence zone exhibit a 12% overall increase, with the 40 m position serving as the critical transition point.
3.3. Initial Fracture Characteristics of Key Stratum Thin-Plate Mechanical Model
- Working Face at 0 m and 20 m Within Remnant Pillar Influence Zone
As shown in Figure 12 (dashed lines indicate fracture paths), the initial fracture propagation sequence is: Front coal wall side → Rear coal wall side → Solid coal side → Working face center → Pillar side.
- Working Face at 40 m and 60 m Within Remnant Pillar Influence Zone
As shown in Figure 13 (arrows indicate fracture directions), the final fracture patterns of the key stratum at 40 m and 60 m positions are consistent with the aforementioned characteristics, with the following distinctions:
Initial fracture point: Located at the front coal wall side adjacent to the solid coal (Figure 13a).
Fracture propagation: Along the long edges and central zone: solid coal side → pillar side.
- Fracture Direction and Angular Characteristics of Key Stratum
As shown in Figure 14(a), the key stratum forms an "O-X" shaped fracture pattern. The fracture sequence is: coal wall in front of the working face → coal wall behind the working face → solid coal side → middle section of the working face → pillar side. With further fracture development, new rupture zones appear at the coal wall in front of the working face and the middle section, as shown in Figure 14(b). The red areas indicate locations where bending moments first begin to increase, located at the coal wall in front of the working face and the middle section. The line connecting these two areas forms a 48° angle with the horizontal plane. As the fracture process progresses to the middle section of the working face (Figure 14(c)), the red areas show further expansion of bending moments, now covering the coal wall in front of the working face, the middle section, the coal wall behind the working face, and the solid coal side, with an angle of approximately 68°. Finally, fractures extend to the pillar side (Figure 14(d)), where the red areas mark the ultimate intensification of bending moments, located at the coal wall behind the working face, the middle section, the coal wall in front of the working face, and the middle section again, forming a 63° angle. This completes the interconnected "O-X" shaped fracture pattern.
As the working face advances, the influence range of the overlying 79° remnant coal pillar gradually expands, leading to increased loading on the key stratum. This alters both the fracture sequence and angular characteristics of the key stratum. The directional migration of red areas (indicating bending moment intensification) correlates with the dip angle of the remnant coal pillar. The resulting fracture angles (48°, 68°, 63°) also show geometric relationships with the oblique intersection angle of the remnant coal pillar. These observations confirm that overlying obliquely intersecting remnant coal pillars significantly influence the fracture characteristics of key strata.
4. Conclusions
(1) An elastic thin-plate mechanical model with elastic fixed supports on two sides and elastic simply-supported boundaries on the other two sides was established. Using the finite difference method for partial differential equations, the mechanical response and initial fracture characteristics of the key stratum under nonlinear load Q were investigated for working face positions at 0 m, 20 m, 40 m, and 60 m within the remnant pillar influence zone. The spatial sequence of initial fracture propagation was determined as: Front coal wall side → Rear coal wall side → Solid coal side → Working face center → Pillar side.
(2) The influence of nonlinear load Q on the initial fracture characteristics of the key stratum was analyzed. For working face positions at 0 m, 20 m, 40 m, and 60 m, the absolute maximum principal bending moments at the front coal wall side, rear coal wall side, and working face center transitioned from bilateral peak distribution to unilateral peak distribution. When the working face advanced to 60 m, the principal bending moment curves exhibited a 12% overall increase compared to the 40 m position, with the 40 m position identified as the critical transition point.
(3) As the working face advanced through the expanding influence zone of the overlying obliquely oriented remnant pillar, the progressively intensifying applied load modified both the fracture propagation sequence and angular characteristics of the key stratum, thereby inducing distinct fracture patterns influenced by the oblique geometric relationship of the remnant pillar.
Institutional Review Board Statement
Not applicable.
Informed Consent Statement
Not applicable.
Data Availability Statement
All datasets are publicly available.
Acknowledgements
The authors gratefully acknowledge Professor Yang for critical manuscript review and Dr. Han for statistical analysis. We also thank the anonymous reviewers for their constructive suggestions.
Conflicts of Interest
The authors declare no conflict of interest.
References
- Qian, M.; Shi, P.; Xu, J. Mine Pressure and Strata Control; China University of Mining and Technology Press: Xuzhou, China, 2010. [Google Scholar]
- Jia, X. Rock Mechanics and Strata Control; China University of Mining and Technology Press: Xuzhou, China, 2010; pp. 102–171. [Google Scholar]
- Kang, J.; Wang, J. The mechanical model of the overburden rock under mining and the broken condition analysis. J. China Coal Soc. 2002, 27, 16–20. [Google Scholar]
- Jiang, J. Stresses and Movement of Surrounding Rock in Stopes; China Coal Industry Publishing House: Beijing, China, 1993. [Google Scholar]
- He, F.; Zhao, J.; Yao, Z. Theory of Strata Control in Stopes; Metallurgical Industry Press: Beijing, China, 2009. [Google Scholar]
- Ma, Q.-Y.; Zhao, X.-D.; Song, Z.-Q. Break of main roof ahead of workface and ground pressure. J. China Coal Soc. 2001, 26, 473–477. [Google Scholar]
- Zhang, Y.; Cheng, J.; Wang, X.; et al. Thin plate model analysis on roof break of up-dip or down-dip mining stope. J. Min. Saf. Eng. 2010, 27, 487–493. [Google Scholar]
- Pu, H.; Huang, Y.; Chen, R. Mechanical analysis for “X-O”type fracture morphology of stope roof. J. China Univ. Min. Technol. 2011, 40, 835–840. [Google Scholar]
- Li, X.; Gao, F.; Zhong, W. Analysis of fracturing mecha nism of stope roof based on plate model. J. Min. Saf. Eng. 2008, 25, 180–183. [Google Scholar]
- Wang, X.; Gao, M. Mechanical model of frac ture mechanism of stope roof for working face with variable length. J. China Univ. Min. Technol. 2015, 41, 36–45. [Google Scholar]
- Jiang, J.; Zhang, P.; Qin, G.; et al. Fracture laws of one-side mined high-position hard thick key strata and mi croseismic energy distribution. J. Min. Saf. Eng. 2015, 32, 523–529. [Google Scholar]
- He, F.; Chen, D.; Xie, S. The kDL effect on the first fracture of main roof with elastic foundation boundary. Chin. J. Rock Mech. Eng. 2017, 36, 1384–1399. [Google Scholar]
- Chen, D.; Li, Z.; Xie, S.; et al. First fracture characteristics of main roof plate structure with goaf (coal pillar) on both sides and elastic-plastic foundation boundary. J. China Coal Soc. 2024, 49, 2195–2211. [Google Scholar]
- Chen, D.; He, F.; Xie, S.; et al. First fracture of the thin plate of main roof with three sides elastic foundation boundary and one side coal pillar. J. China Coal Soc. 2017, 42, 2528–2536. [Google Scholar]
- Zhang, J.; Sun, J.; He, Y.; et al. Study on floor stress distribution law and roadway layout of close distance coal seams. Coal Sci. Technol. 2024, 1–13. [Google Scholar]
- Zhang, J.; Li, J.; Liu, H. Experimental study on concentrated stress transfer characteristics of district coal pillars in contiguous coal seams. Coal Eng. 2024, 56, 208–215. [Google Scholar]
- Xu, Z. Elasticity Mechanics; Higher Education Press: Beijing, China, 2020. [Google Scholar]
- Xie, S.; Chen, D.; Sun, Y.; et al. Analysis on thin plate model of basic roof at elastic foundation boundary(I): First breaking. J. China Coal Soc. 2016, 41, 1360–1368. [Google Scholar]
- Xie, S.; Chen, D.; He, S.; et al. Analysis on thin plate model of basic roof at elastic foundation boundary(I): First breaking. J. China Coal Soc. 2017, 42, 3106–3115. [Google Scholar]
- Li, R. Nnumerical Methods for Partial Differential Equations, 2nd ed.; Higher Education Press: Beijing, China, 2010. [Google Scholar]
Figure 1.
Plan view of the working face and overlying inclined remnant coal pillars.
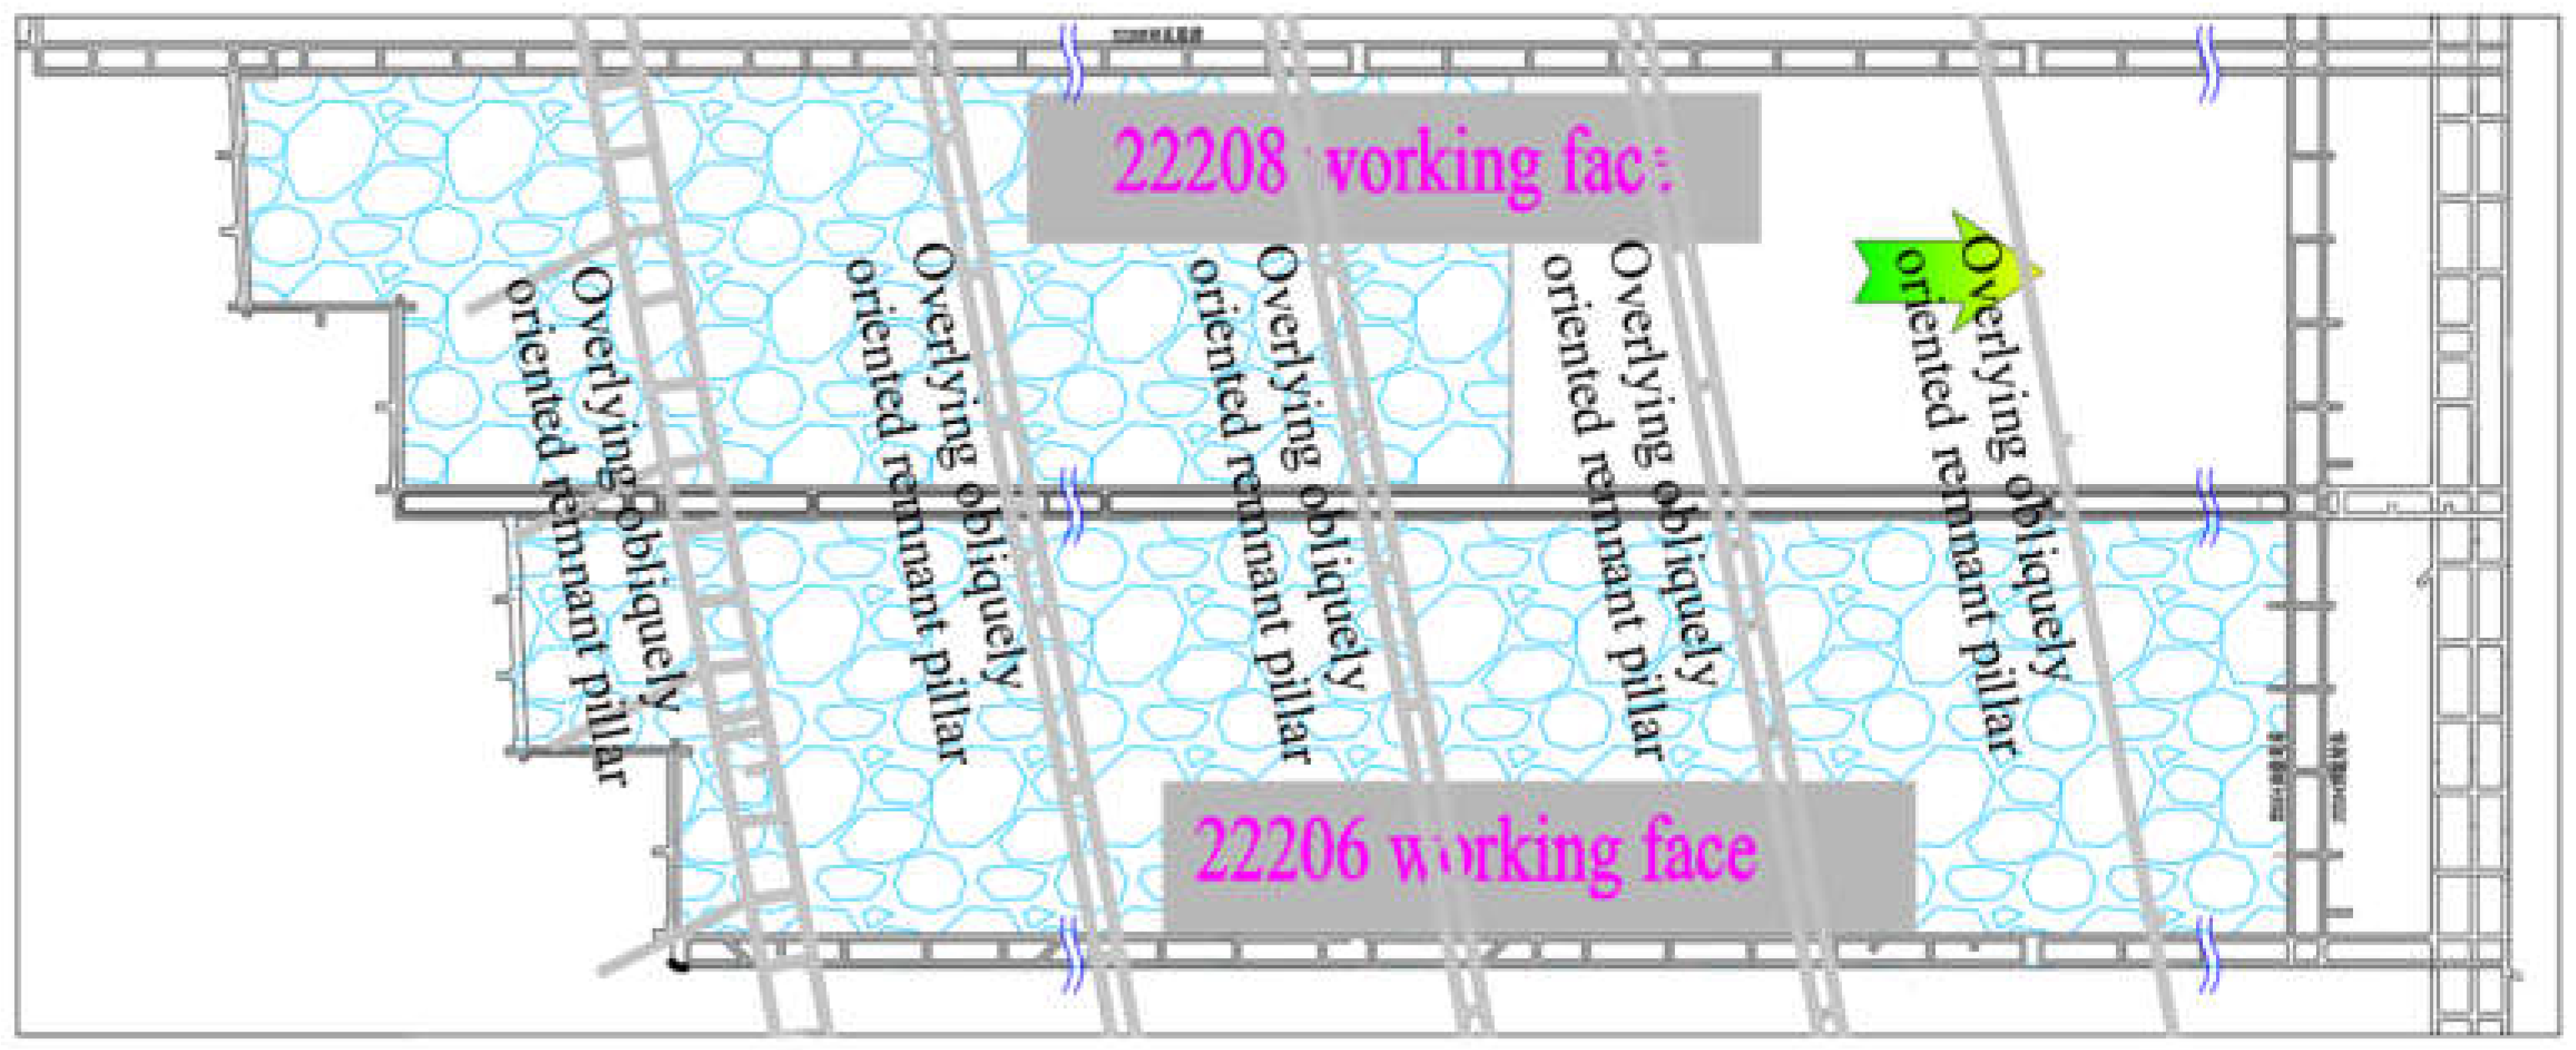
Figure 2.
Schematic Diagram of the Overlying Rock Load.
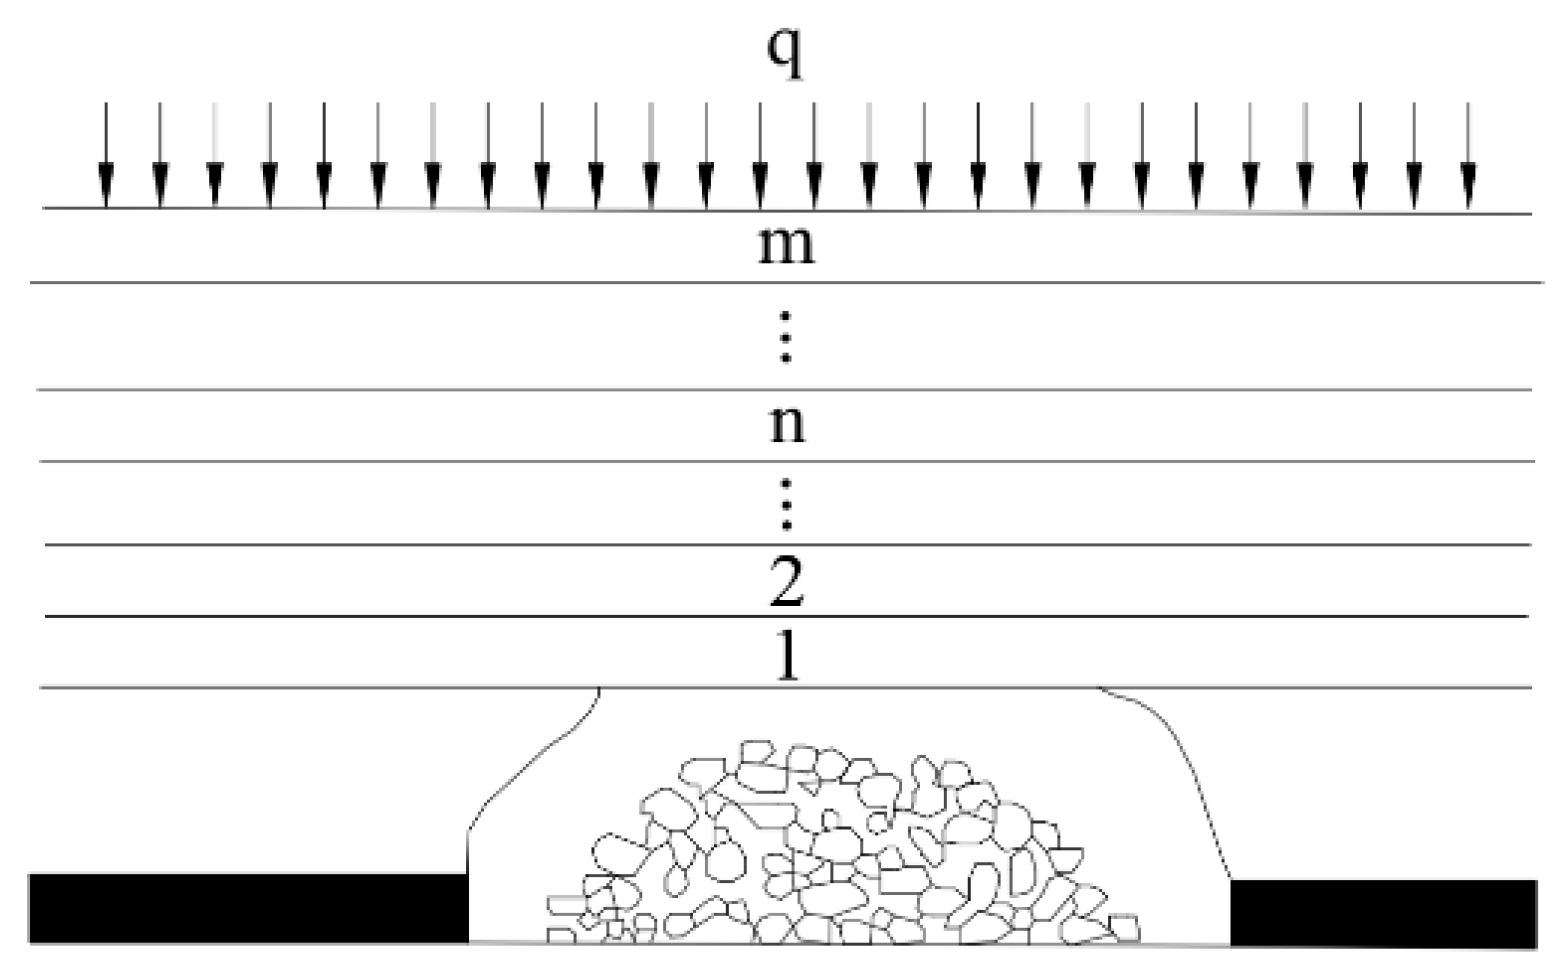
Figure 3.
Two-dimensional diagram of stress transmission at the base of the overlying inclined remnant coal pillar.
Figure 3.
Two-dimensional diagram of stress transmission at the base of the overlying inclined remnant coal pillar.
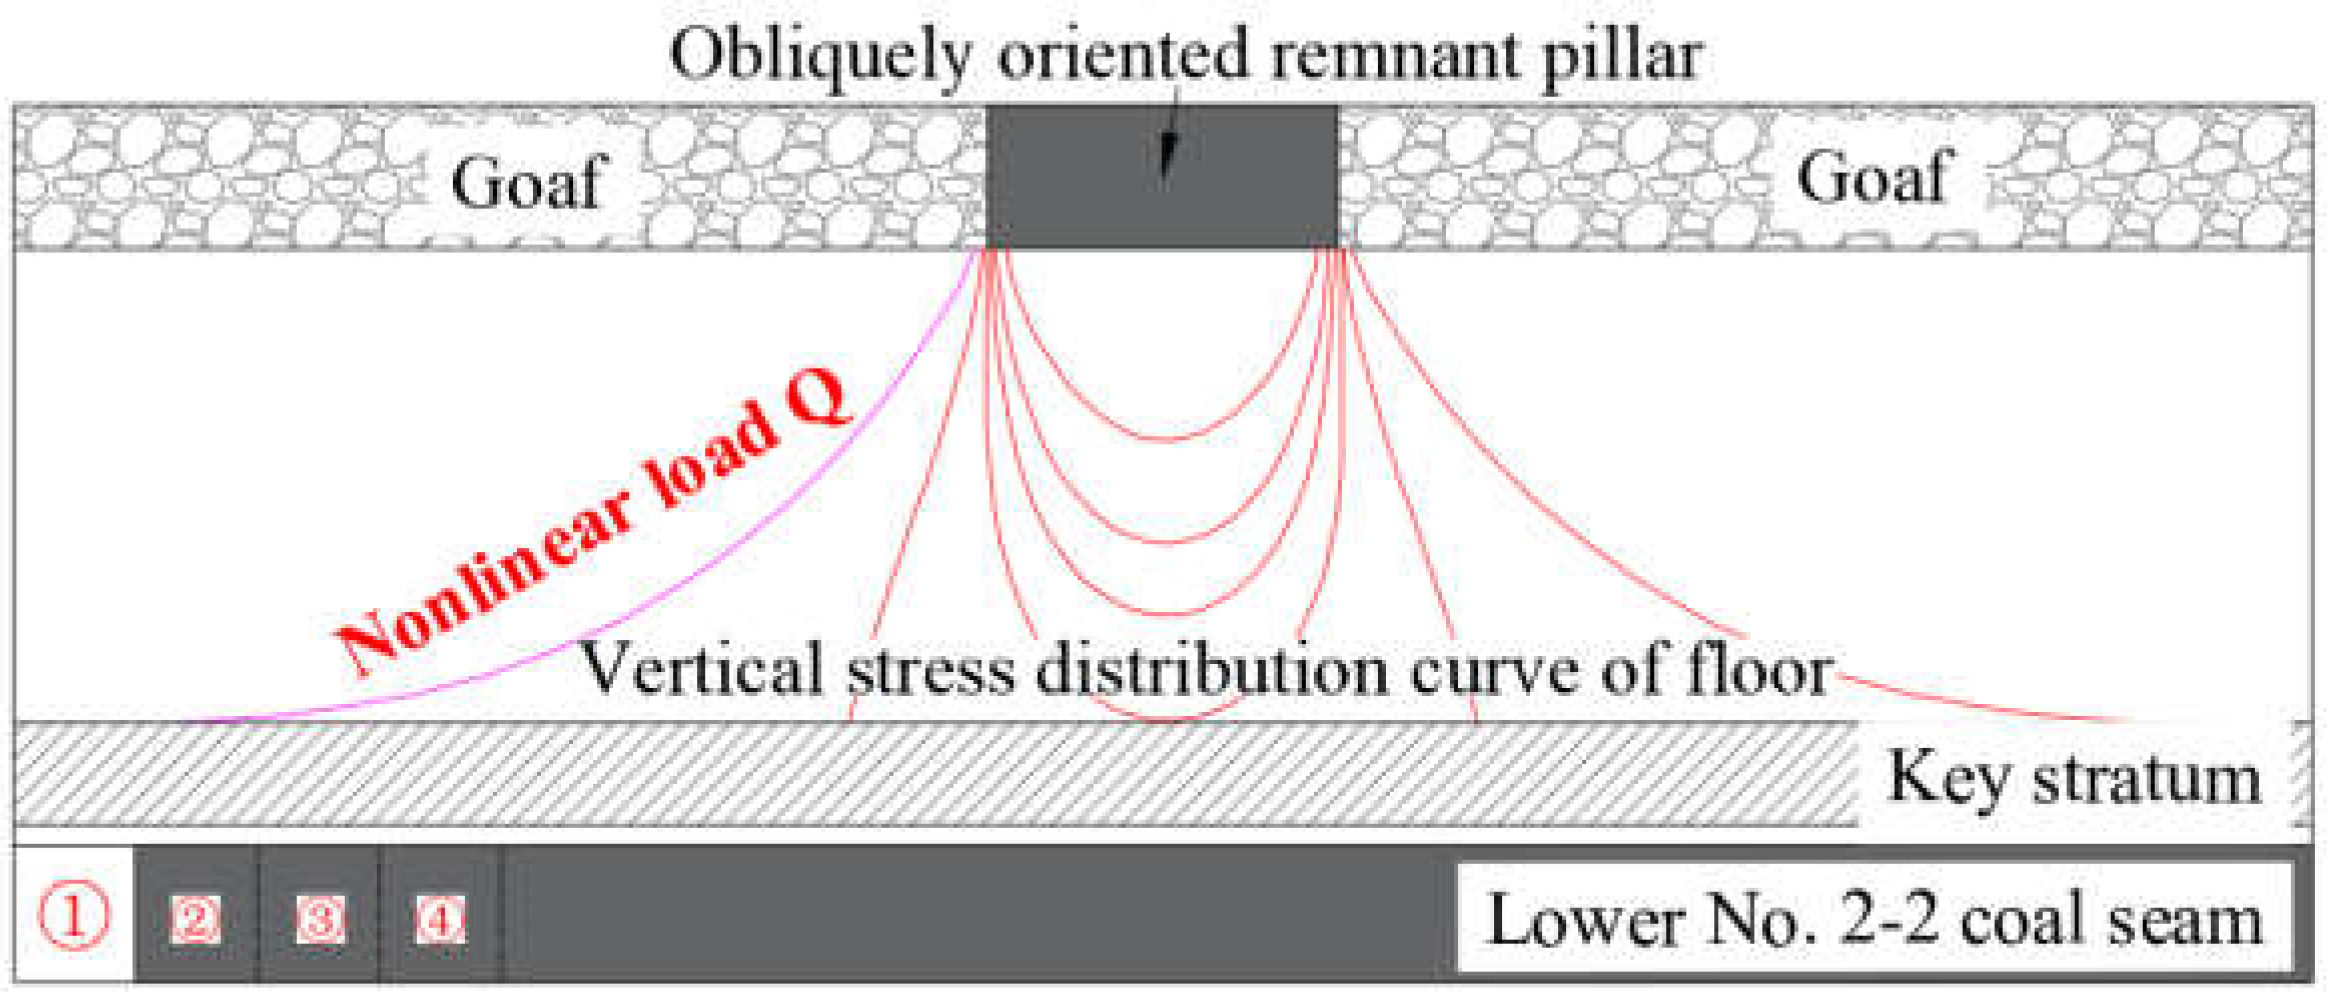
Figure 4.
Three-dimensional diagram of stress transmission at the base of the overlying inclined remnant coal pillar.
Figure 4.
Three-dimensional diagram of stress transmission at the base of the overlying inclined remnant coal pillar.
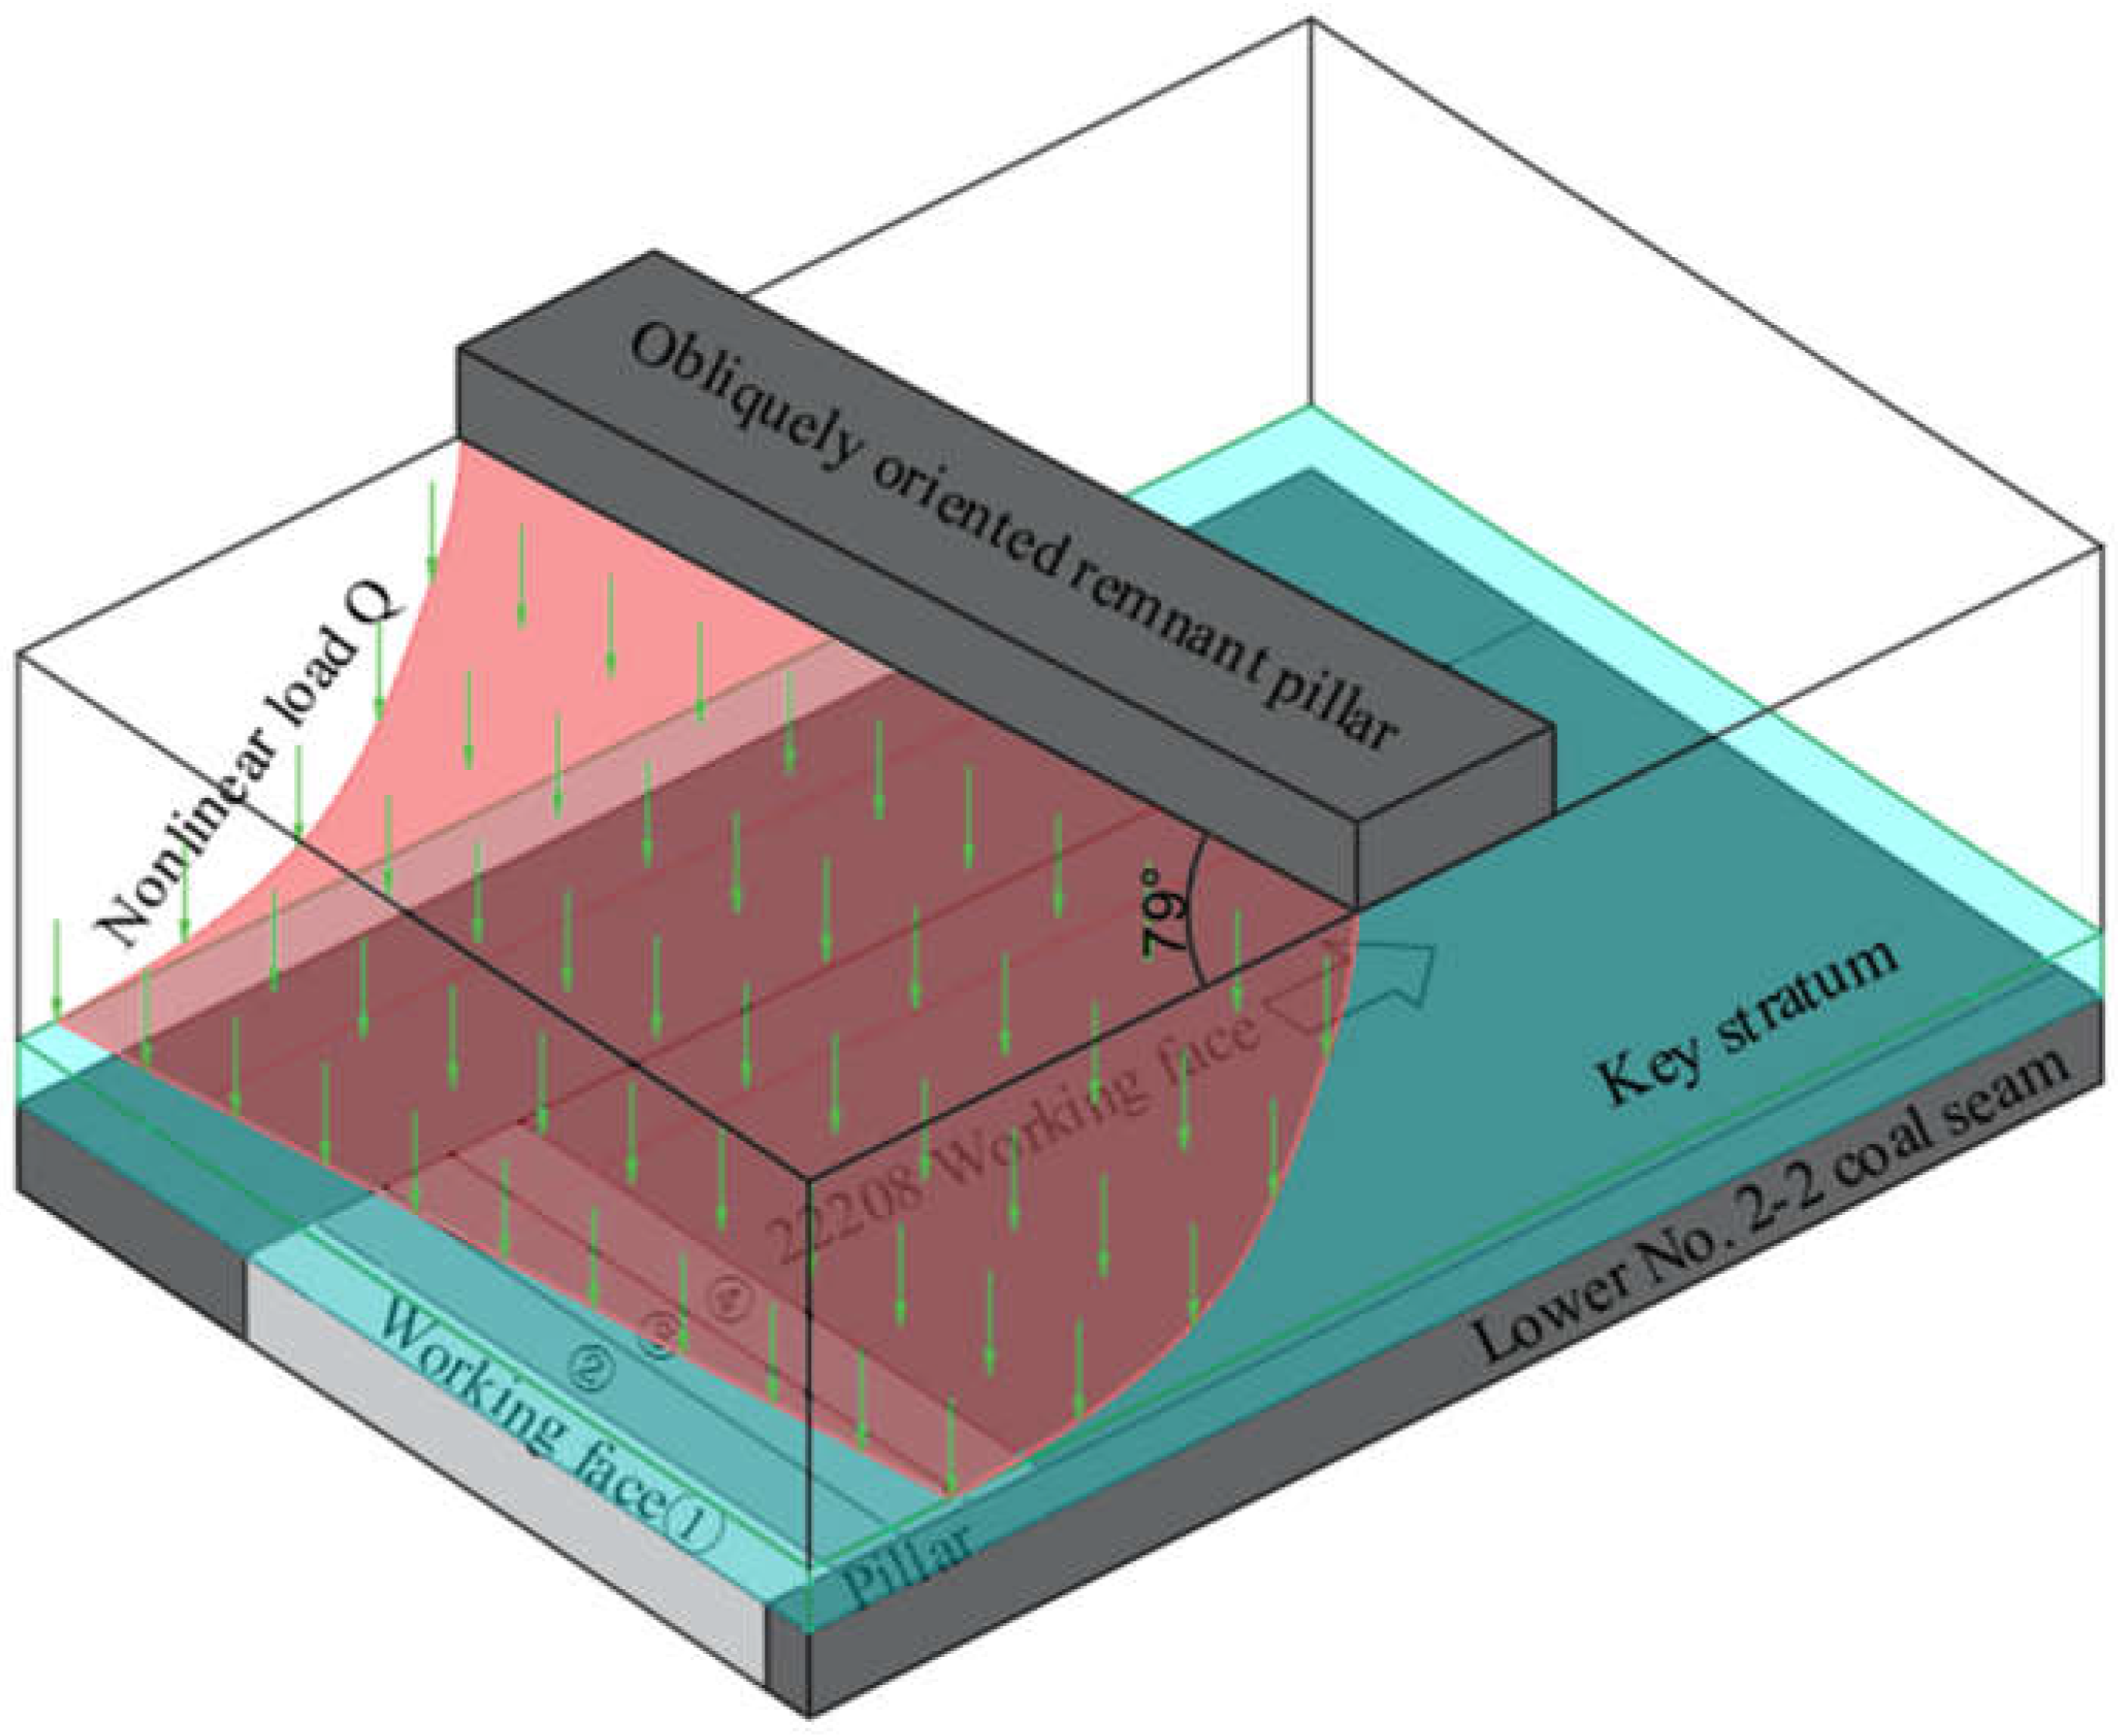
Figure 5.
Elastic thin plate mechanics model with elastically fixed boundaries on two sides and simply supported boundaries on the other two sides.
Figure 5.
Elastic thin plate mechanics model with elastically fixed boundaries on two sides and simply supported boundaries on the other two sides.
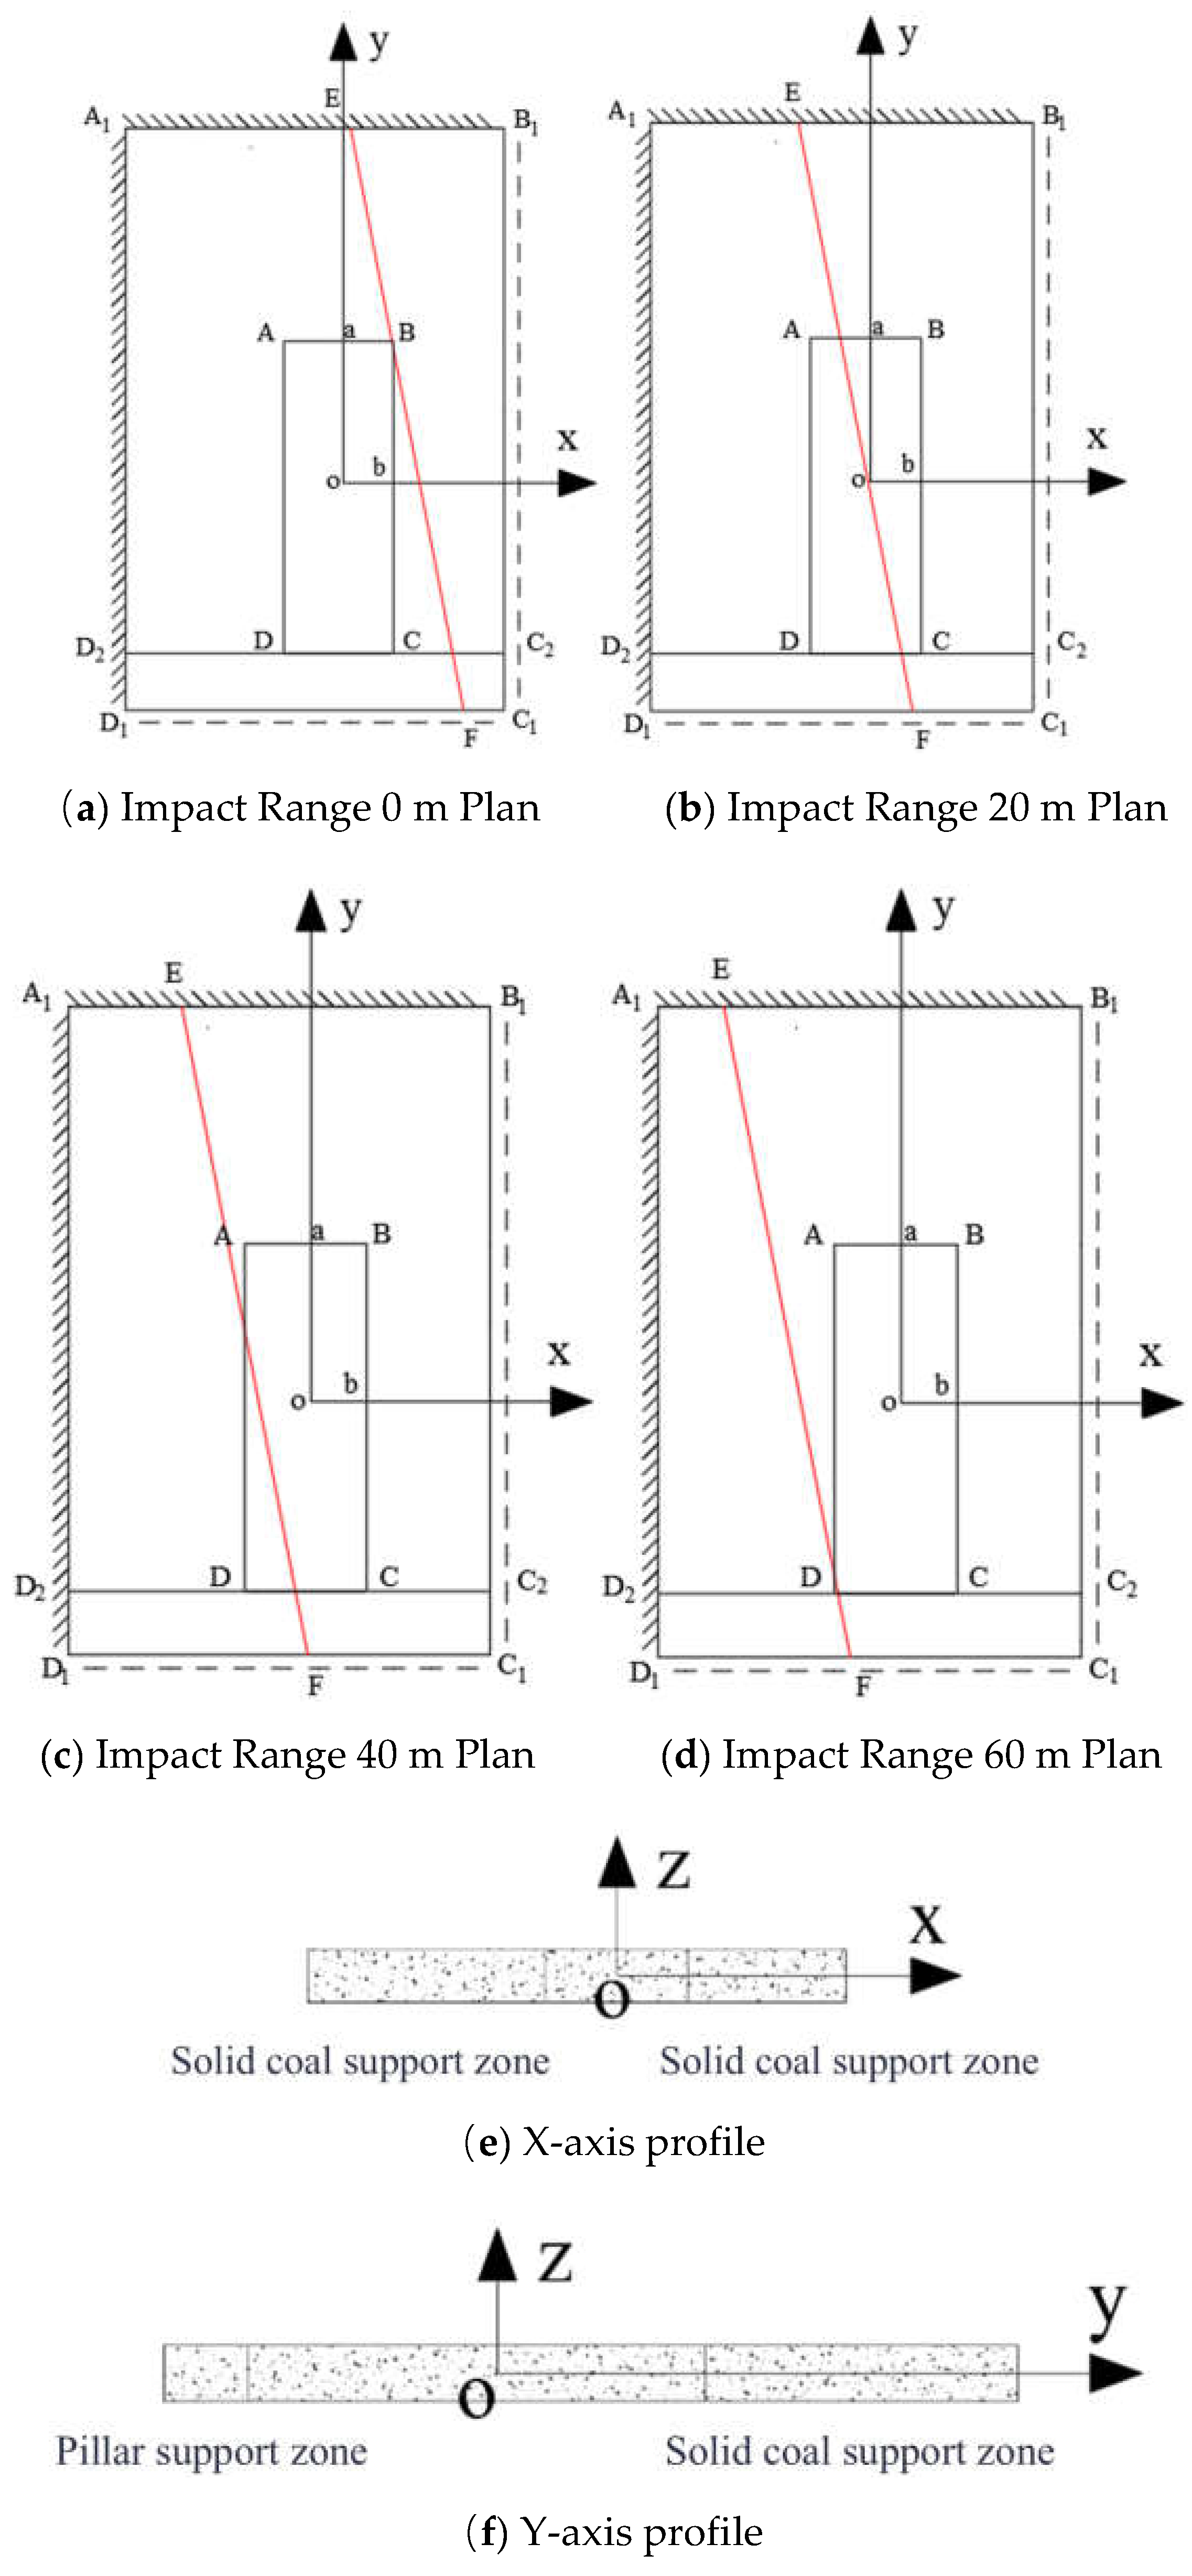
Figure 6.
Node distribution of the finite difference method for partial differential equations.
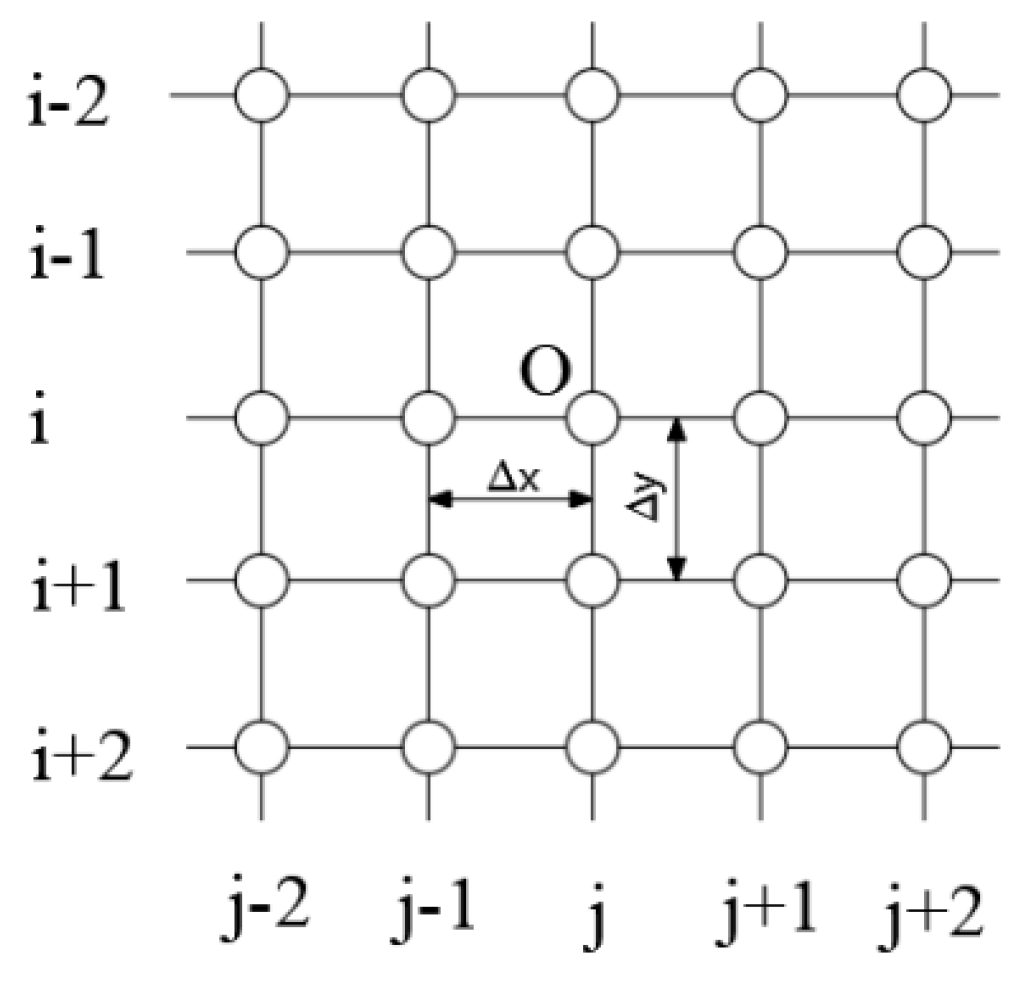
Figure 7.
Contour map of the main bending moment distribution at the working face located within the range of the residual coal pillar's influence at 0 m.
Figure 7.
Contour map of the main bending moment distribution at the working face located within the range of the residual coal pillar's influence at 0 m.
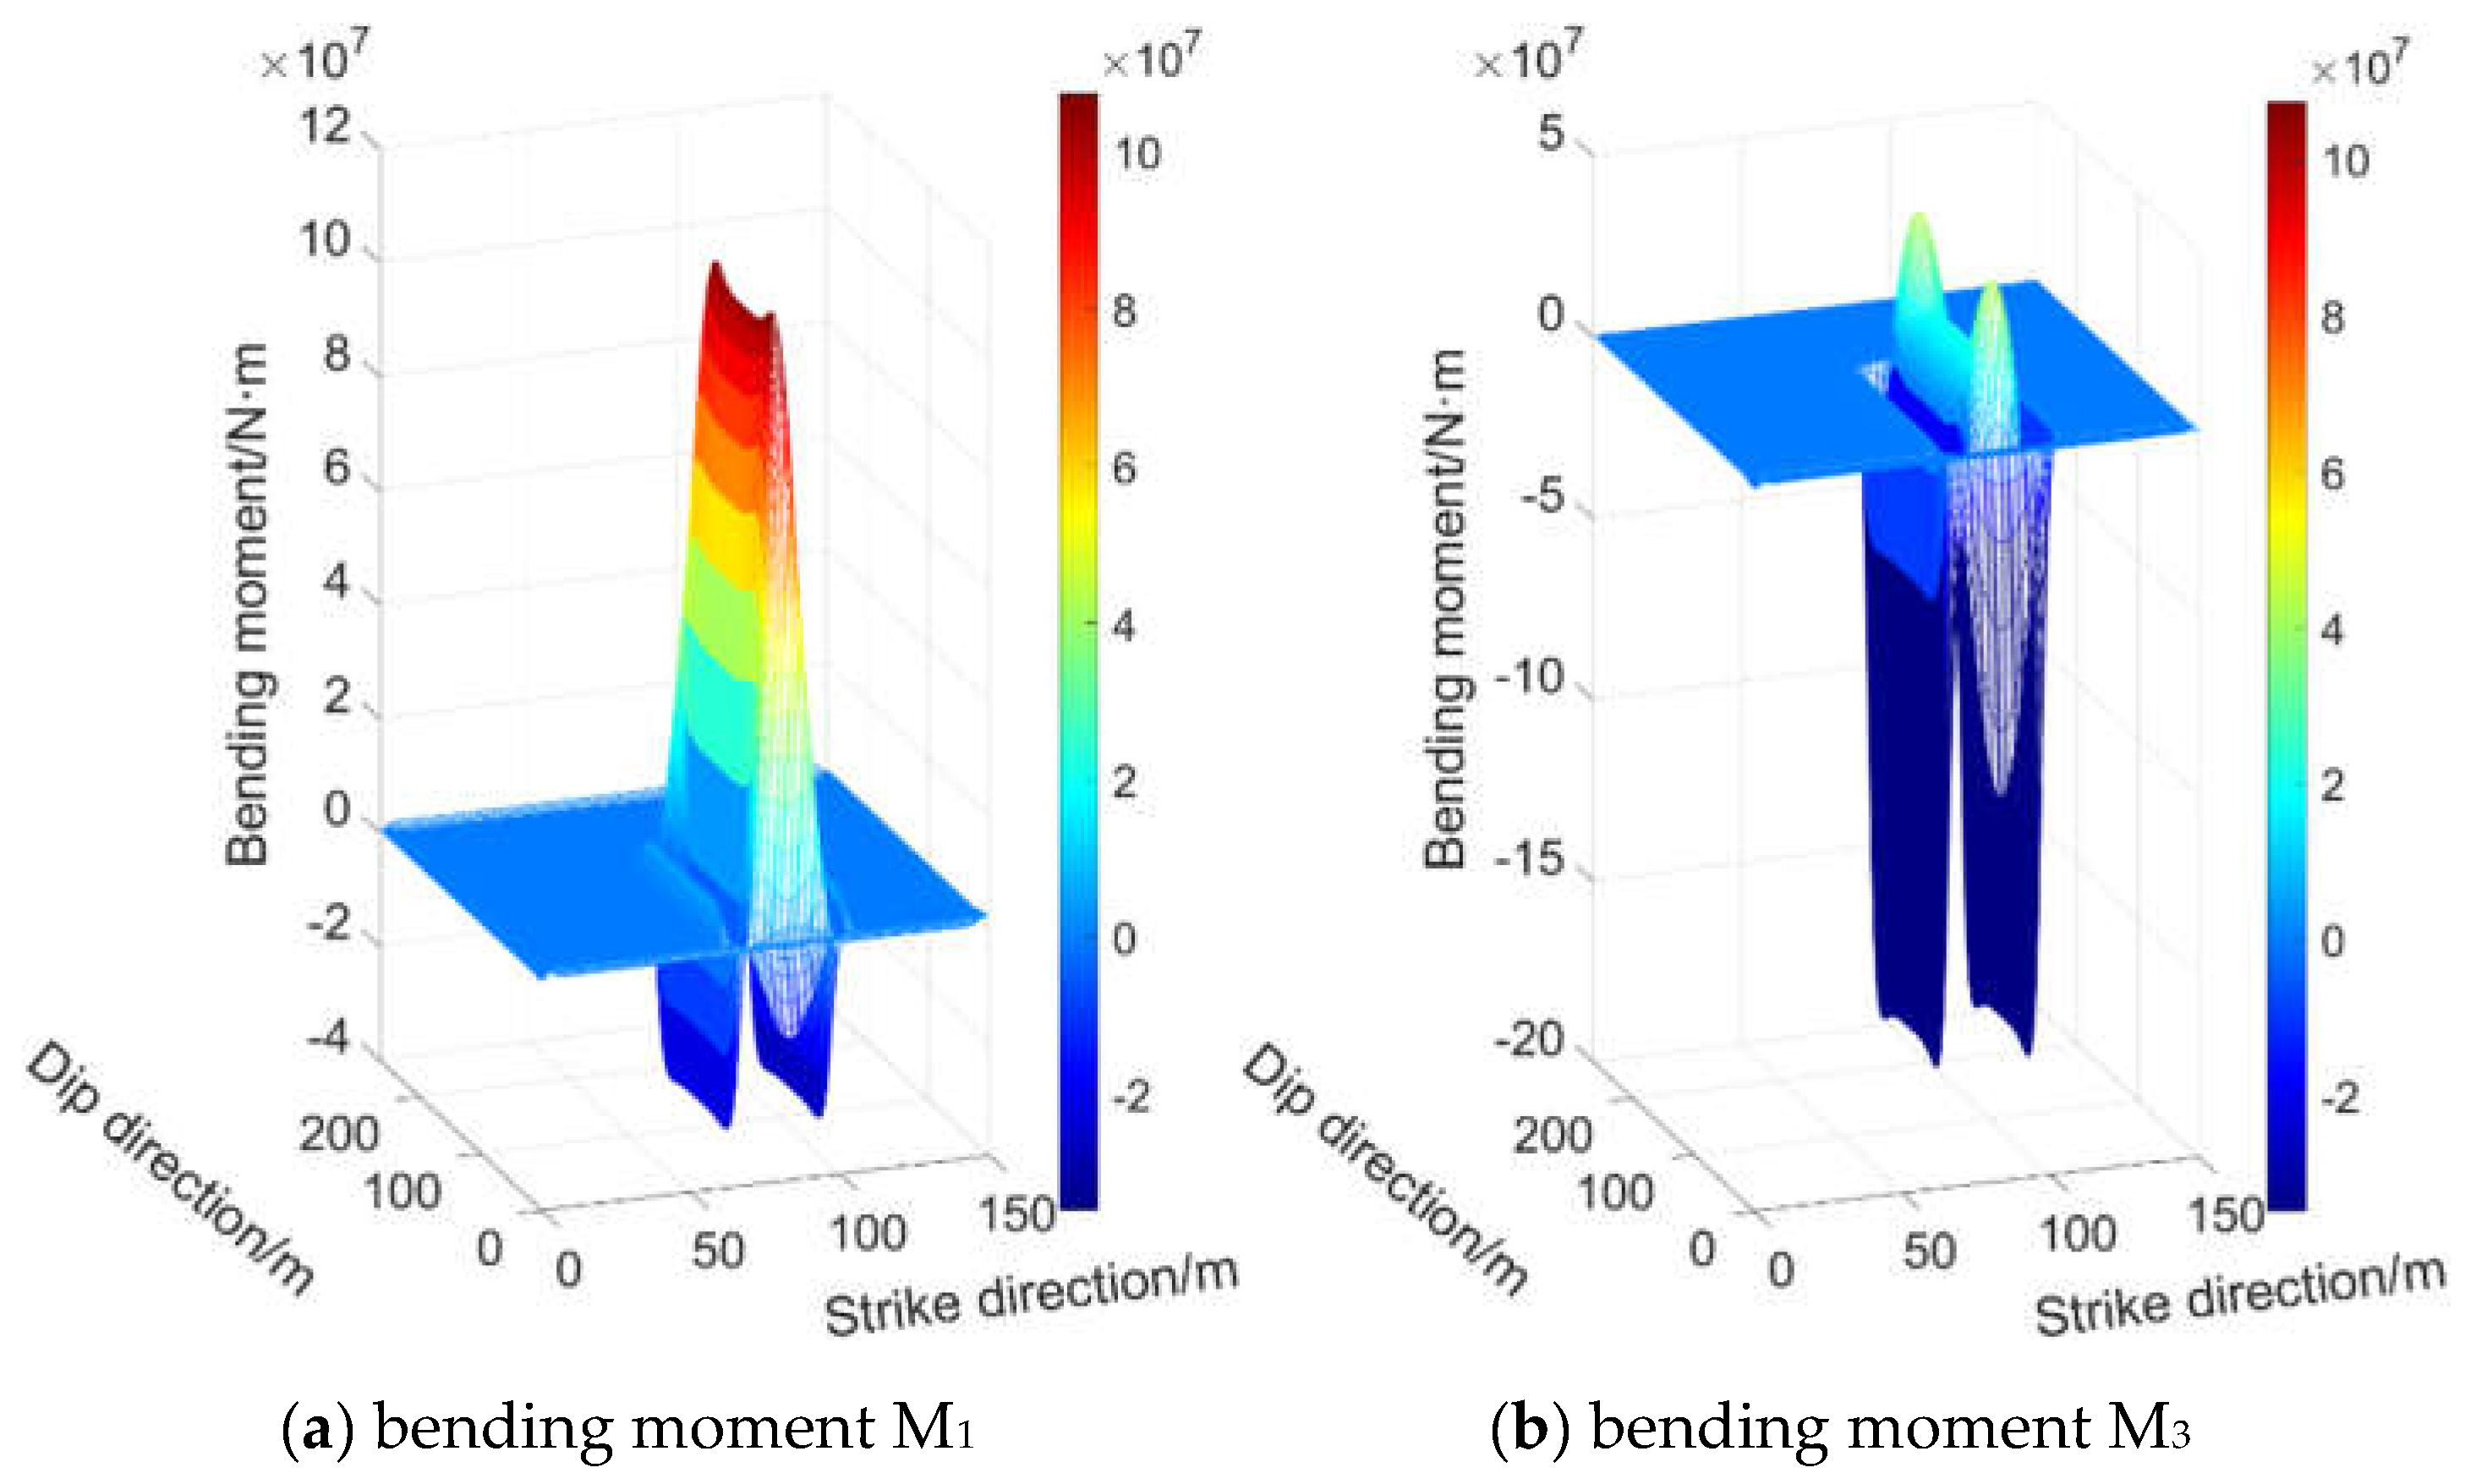
Figure 8.
Contour map of the main bending moment distribution at the working face located within the range of the residual coal pillar's influence at 20 m.
Figure 8.
Contour map of the main bending moment distribution at the working face located within the range of the residual coal pillar's influence at 20 m.
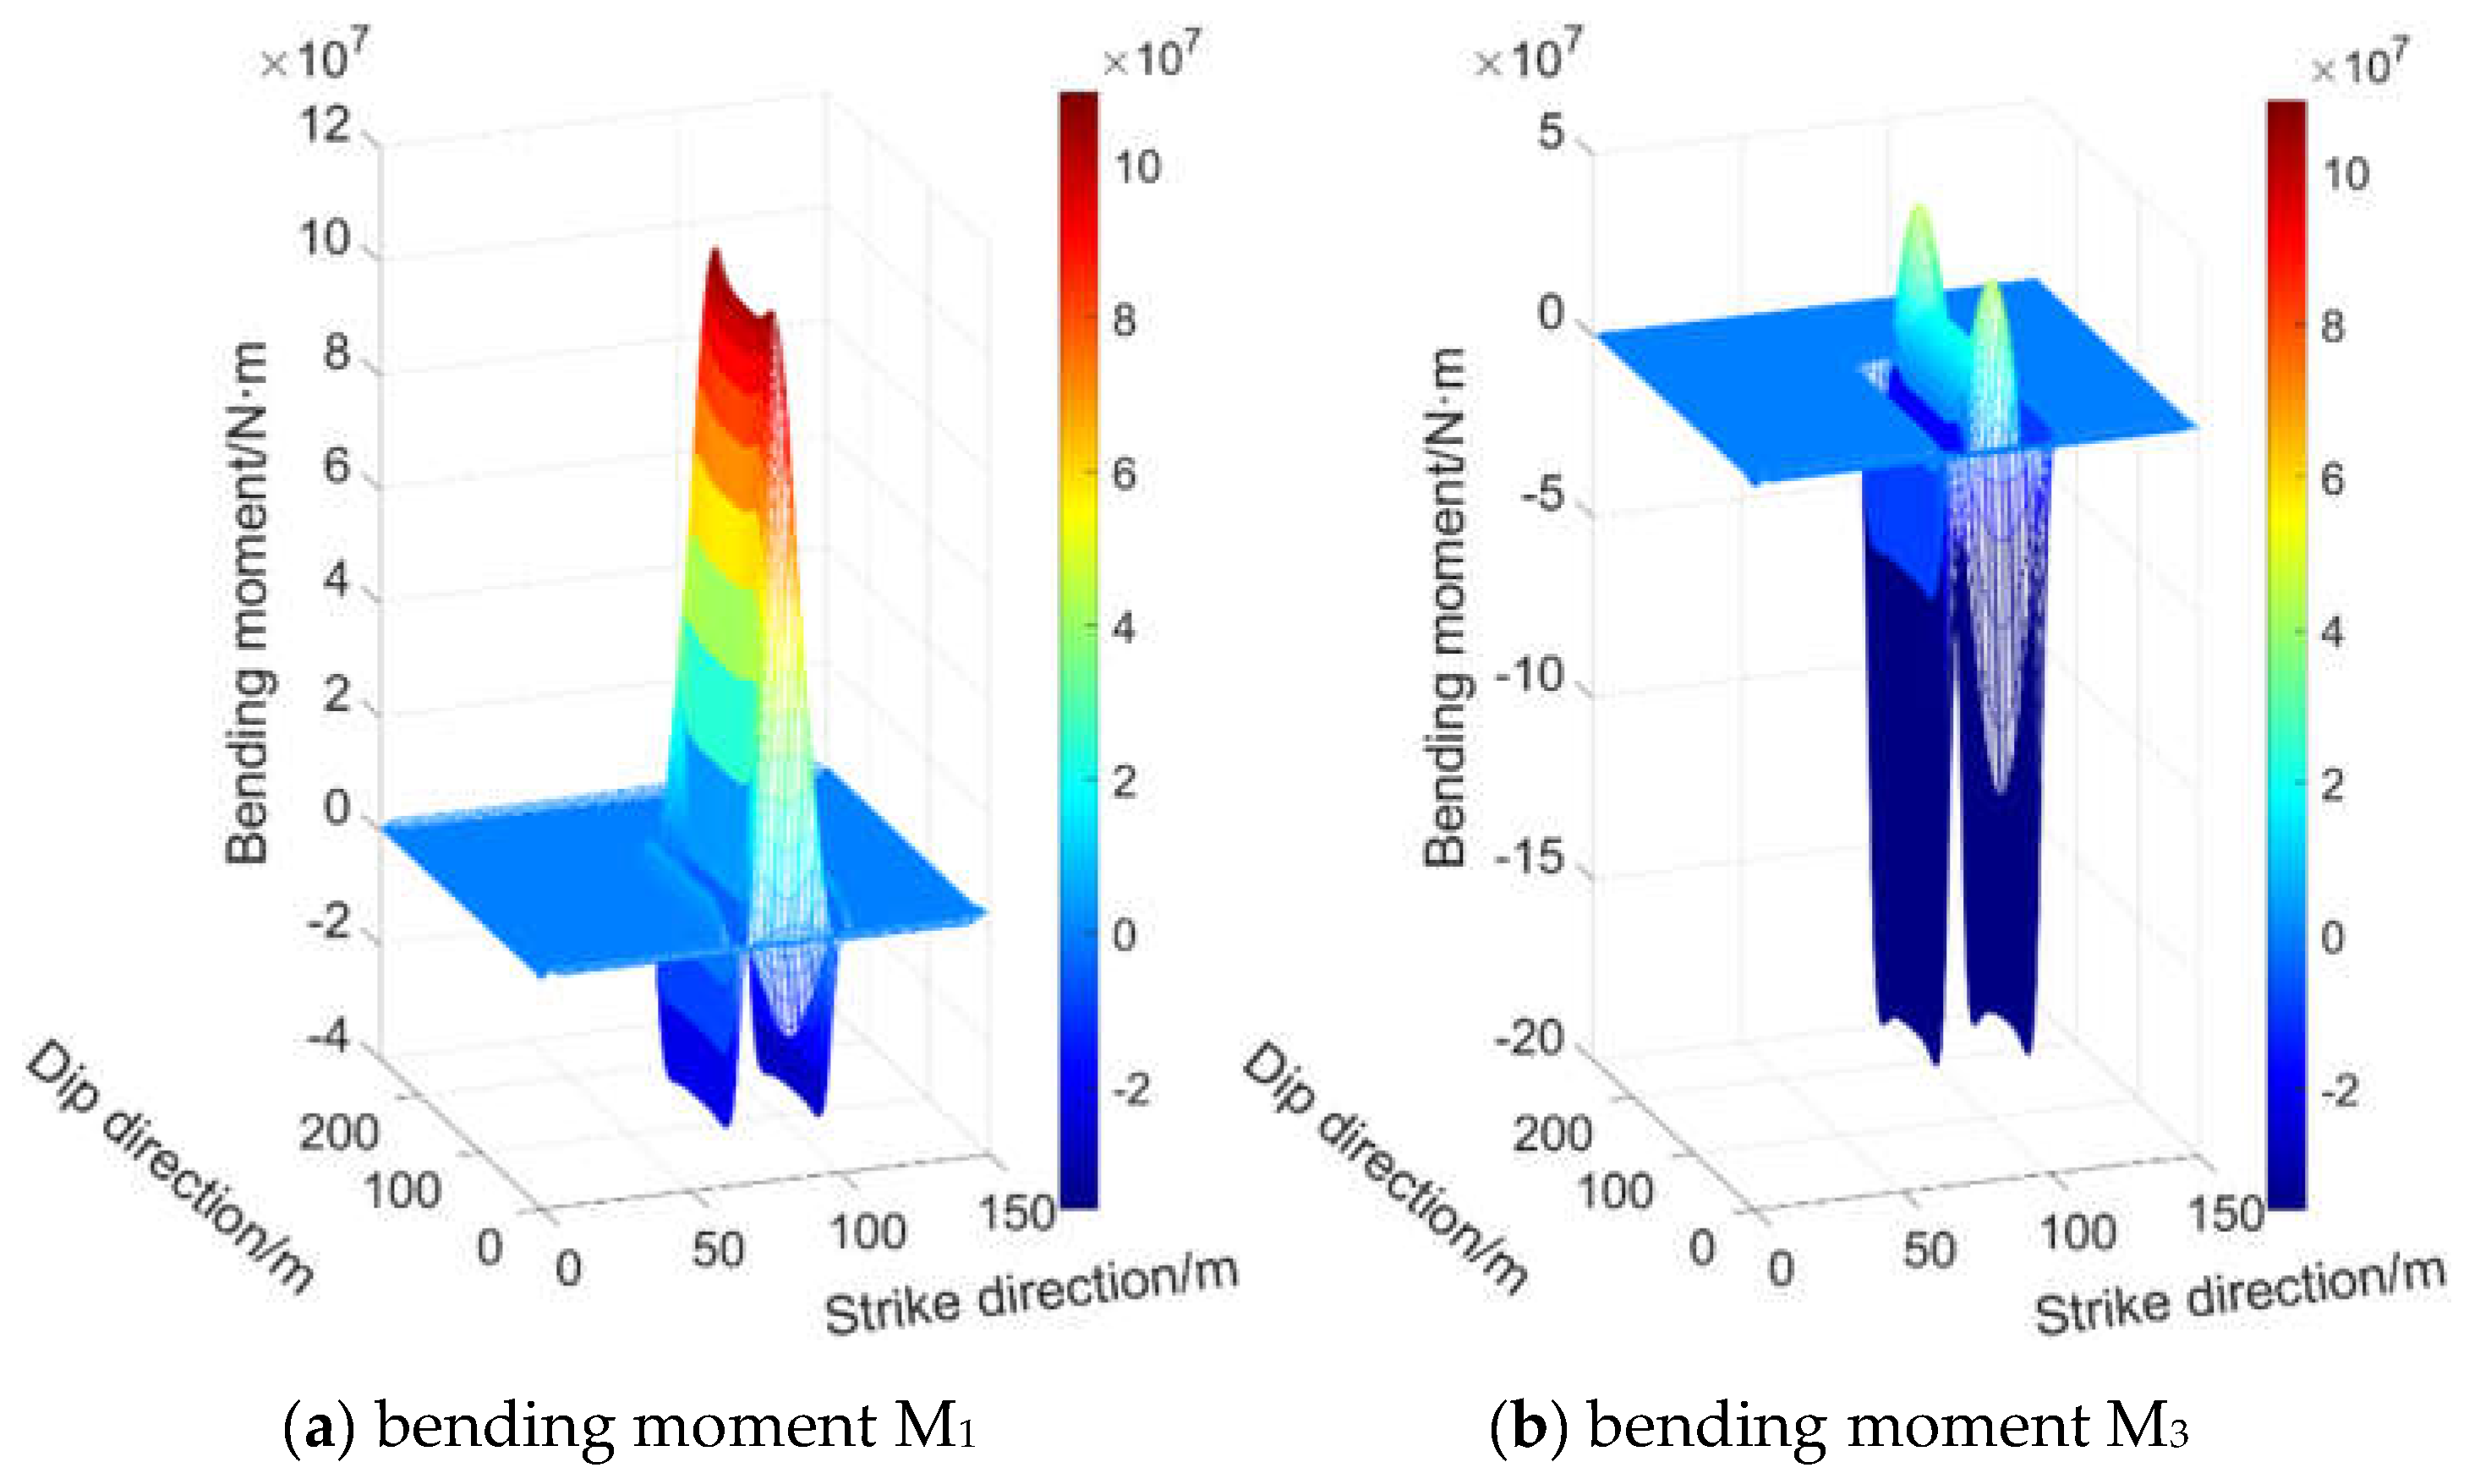
Figure 9.
Contour map of the main bending moment distribution at the working face located within the range of the residual coal pillar's influence at 40 m.
Figure 9.
Contour map of the main bending moment distribution at the working face located within the range of the residual coal pillar's influence at 40 m.
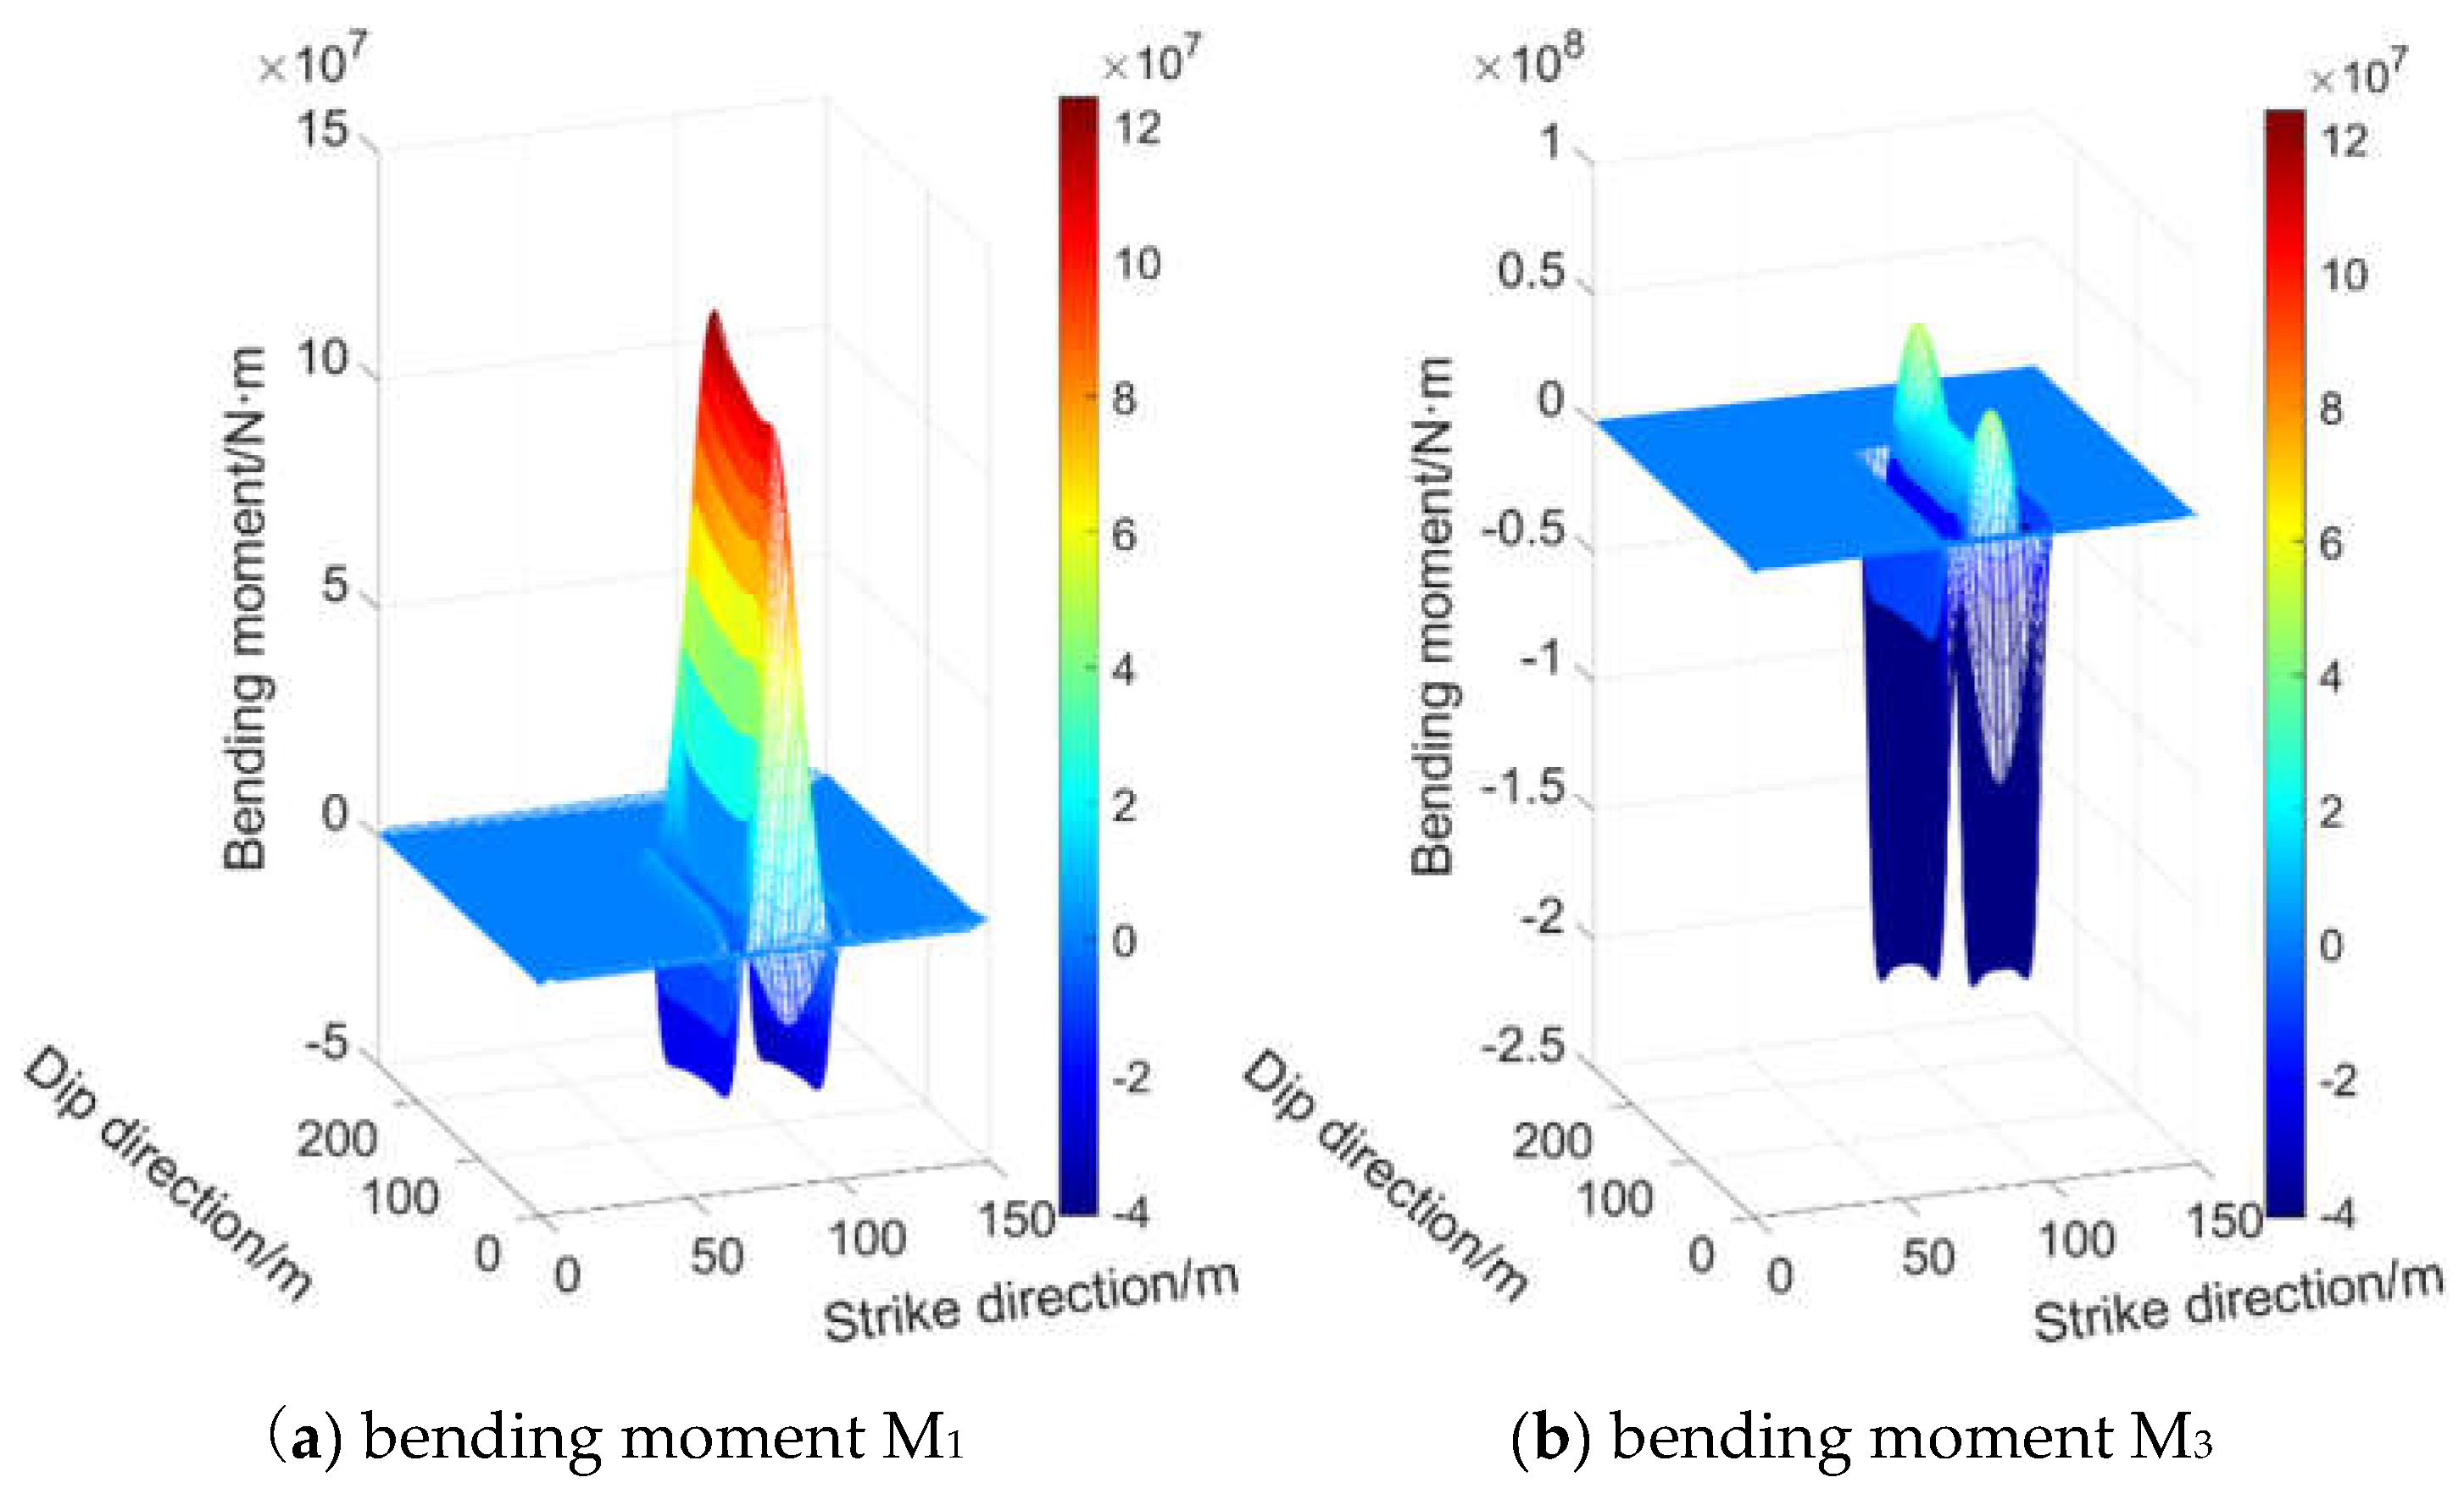
Figure 10.
Contour map of the main bending moment distribution at the working face located within the range of the residual coal pillar's influence at 60 m.
Figure 10.
Contour map of the main bending moment distribution at the working face located within the range of the residual coal pillar's influence at 60 m.
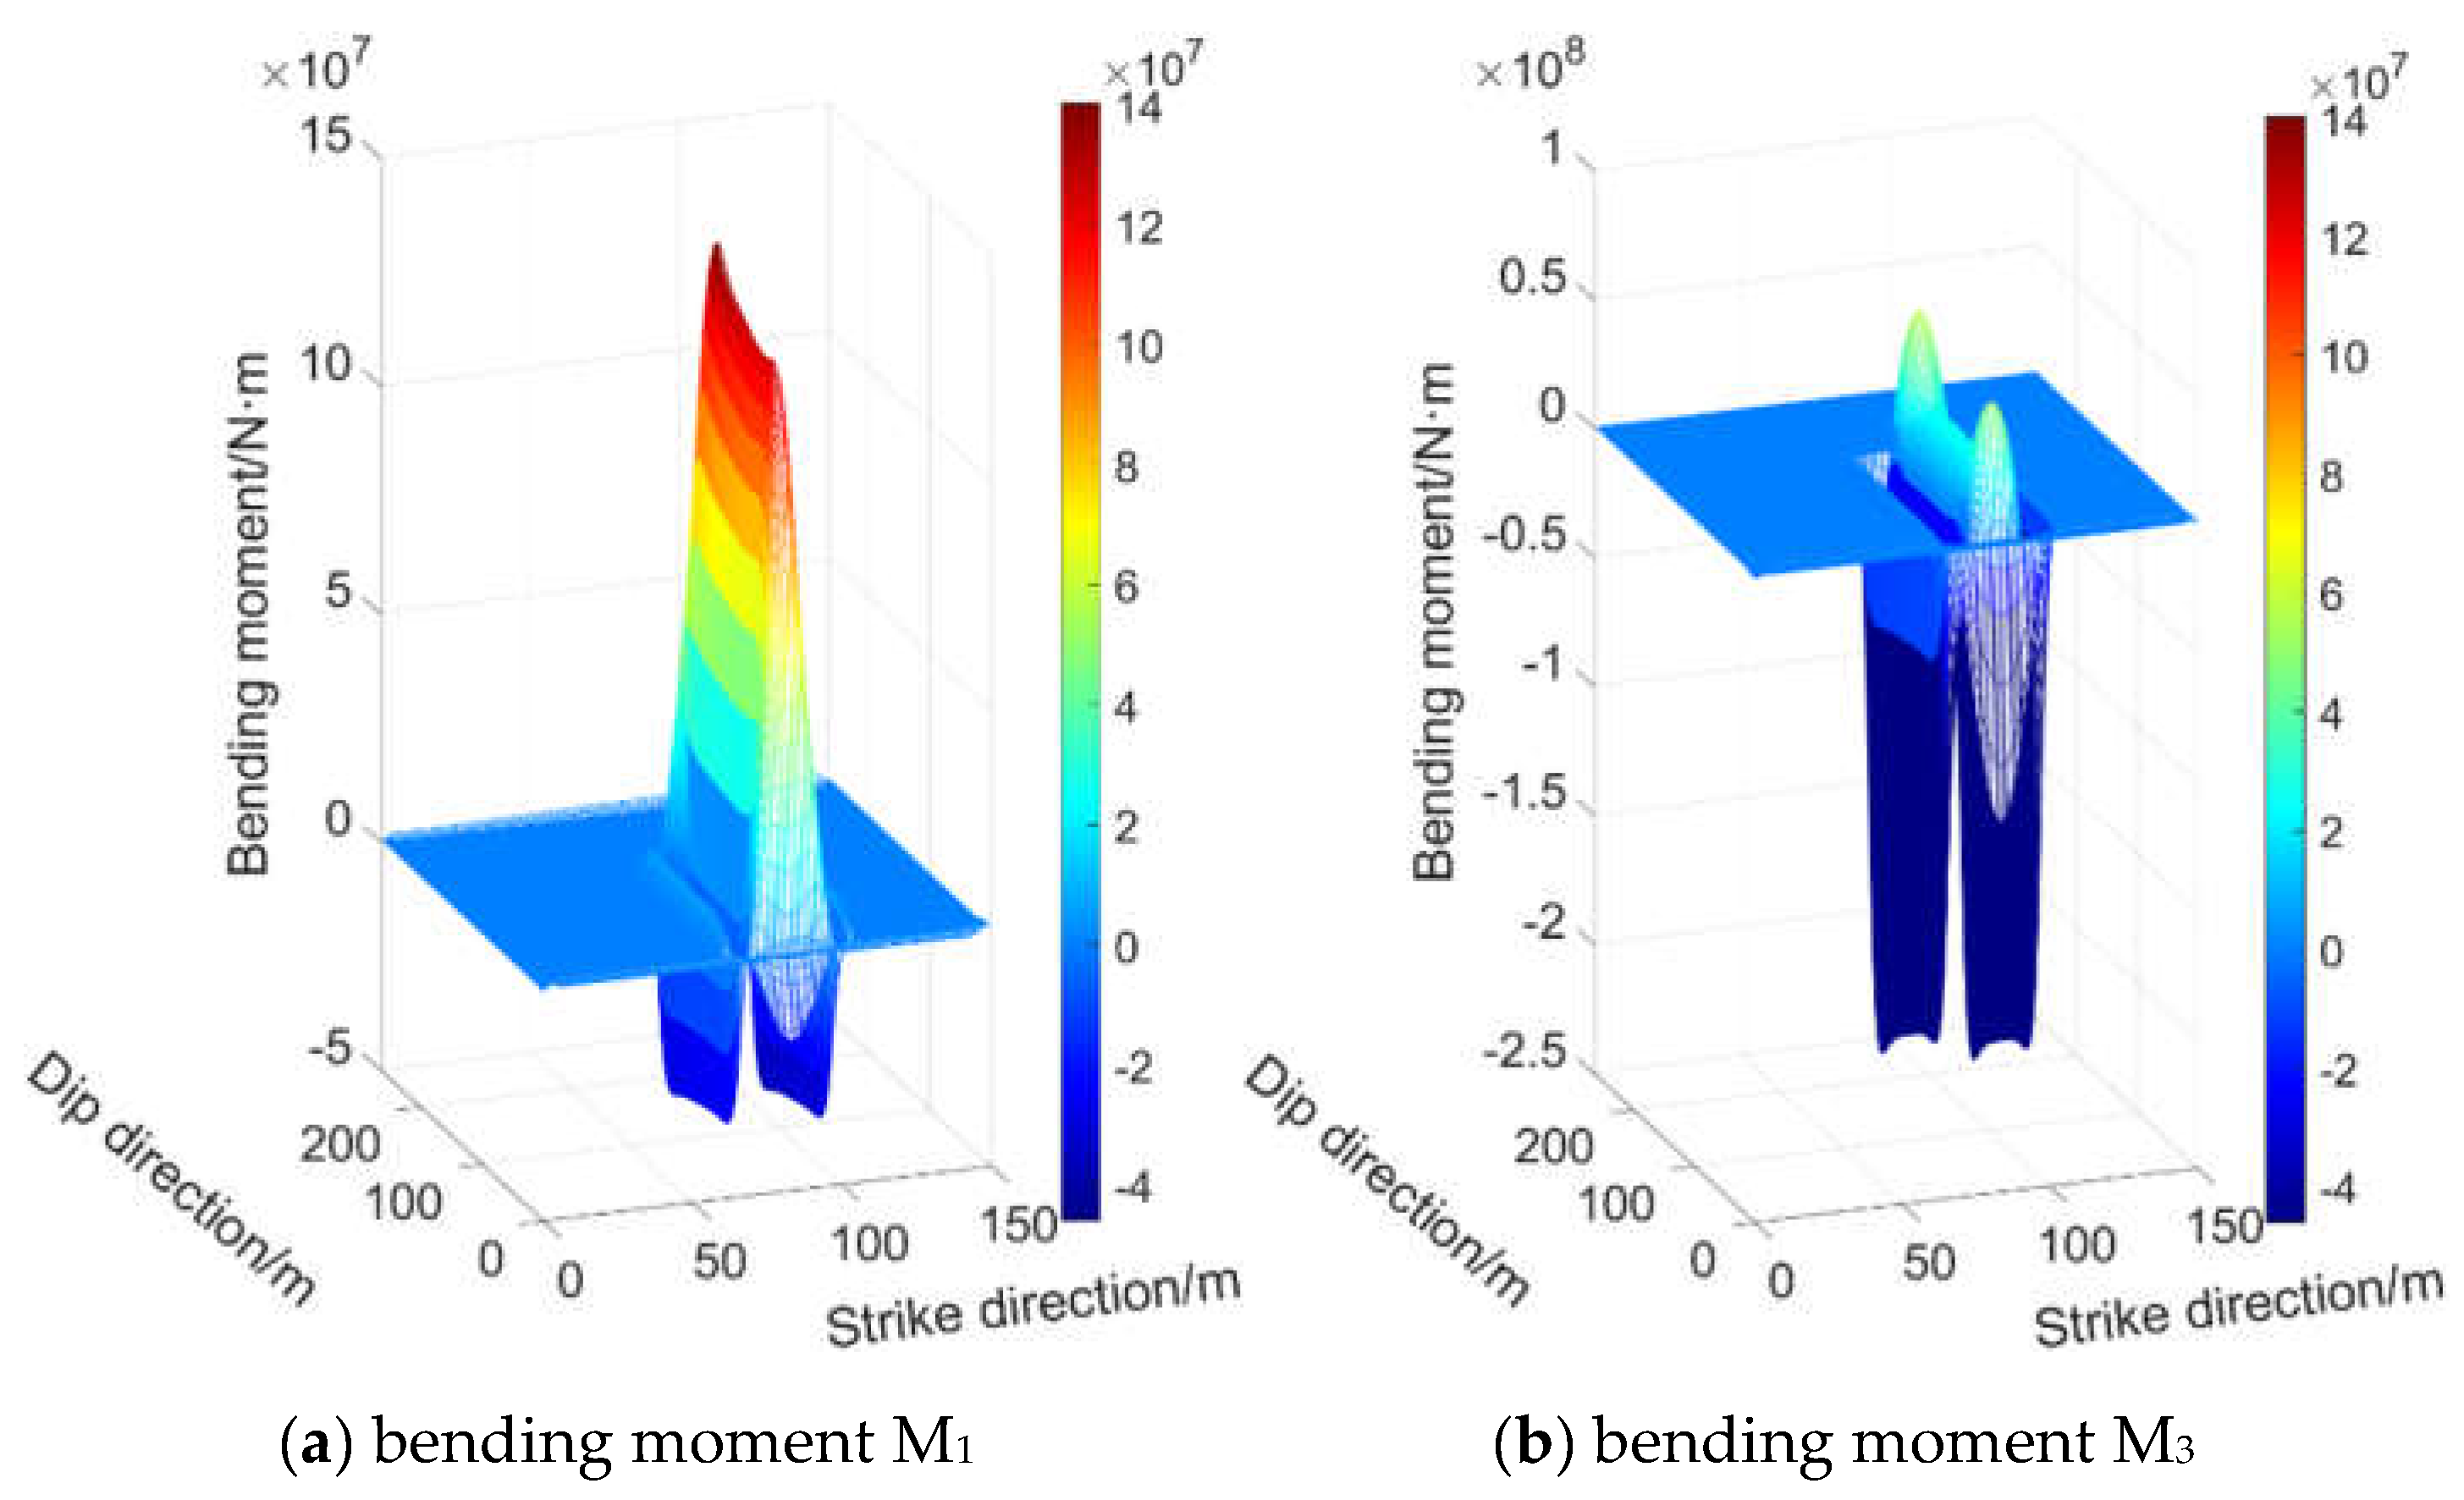
Figure 11.
Main Bending Moment Curve of the Central Cutting Eye.
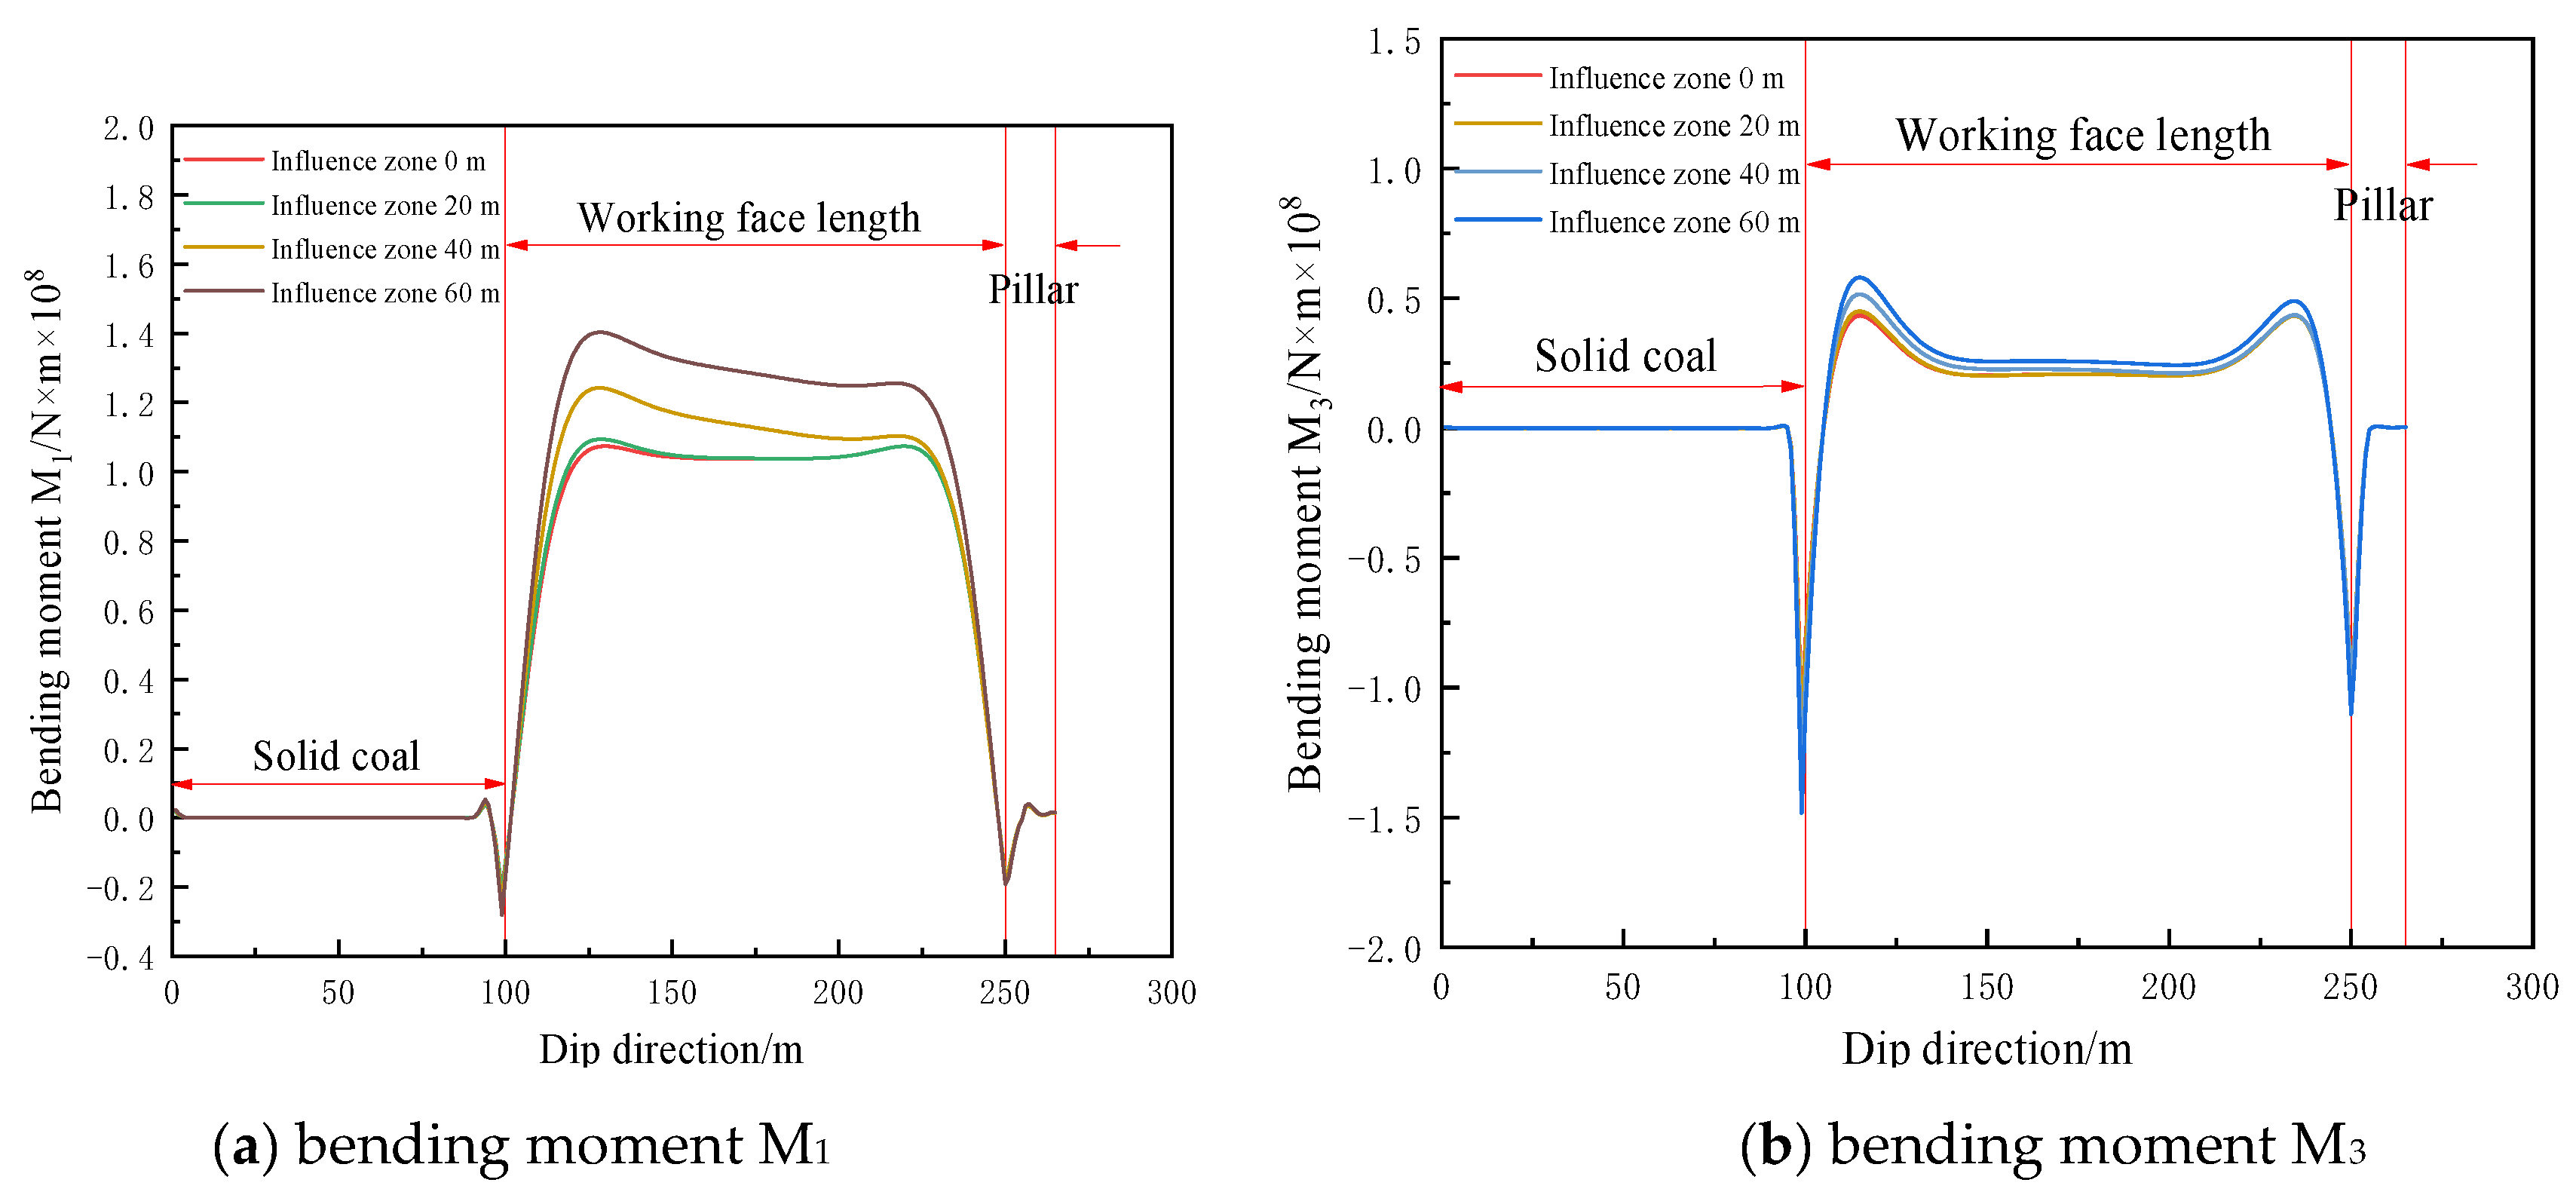
Figure 12.
Fracture characteristics at the working face within the influence range of the residual coal pillar at 0m and 20m.
Figure 12.
Fracture characteristics at the working face within the influence range of the residual coal pillar at 0m and 20m.
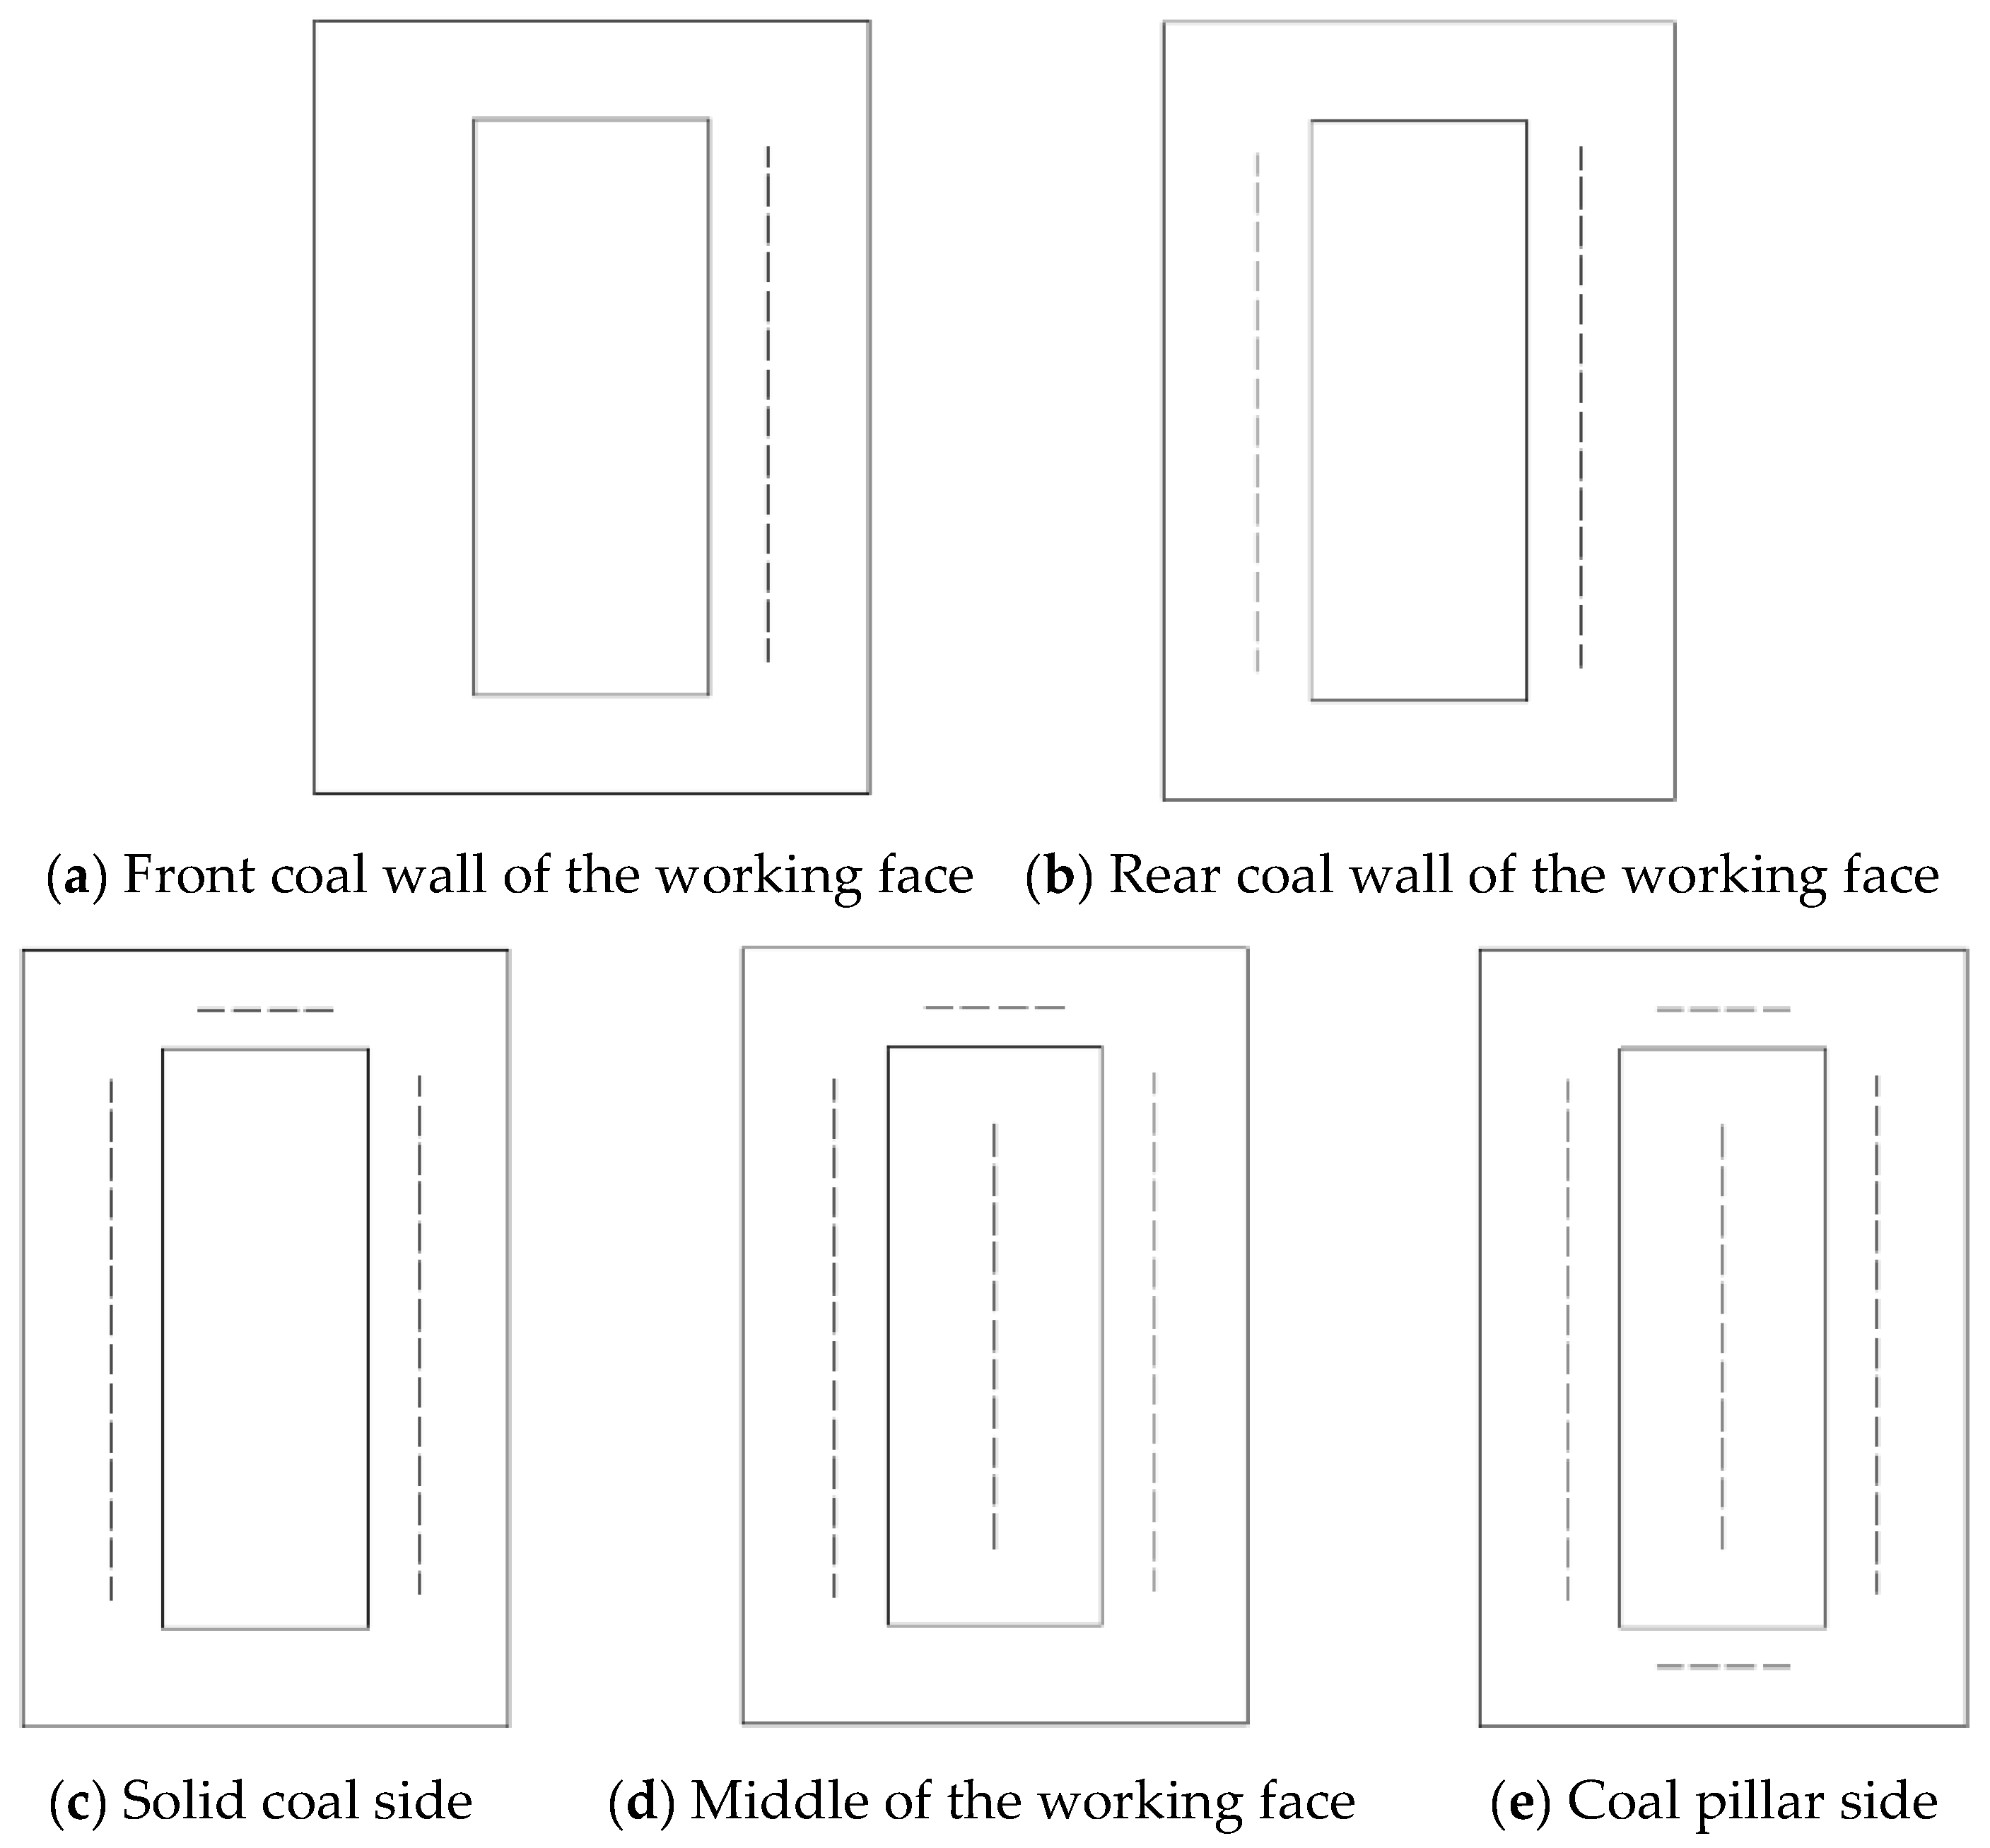
Figure 13.
Fracture characteristics at the working face within the influence range of the residual coal pillar at 40m and 60m.
Figure 13.
Fracture characteristics at the working face within the influence range of the residual coal pillar at 40m and 60m.
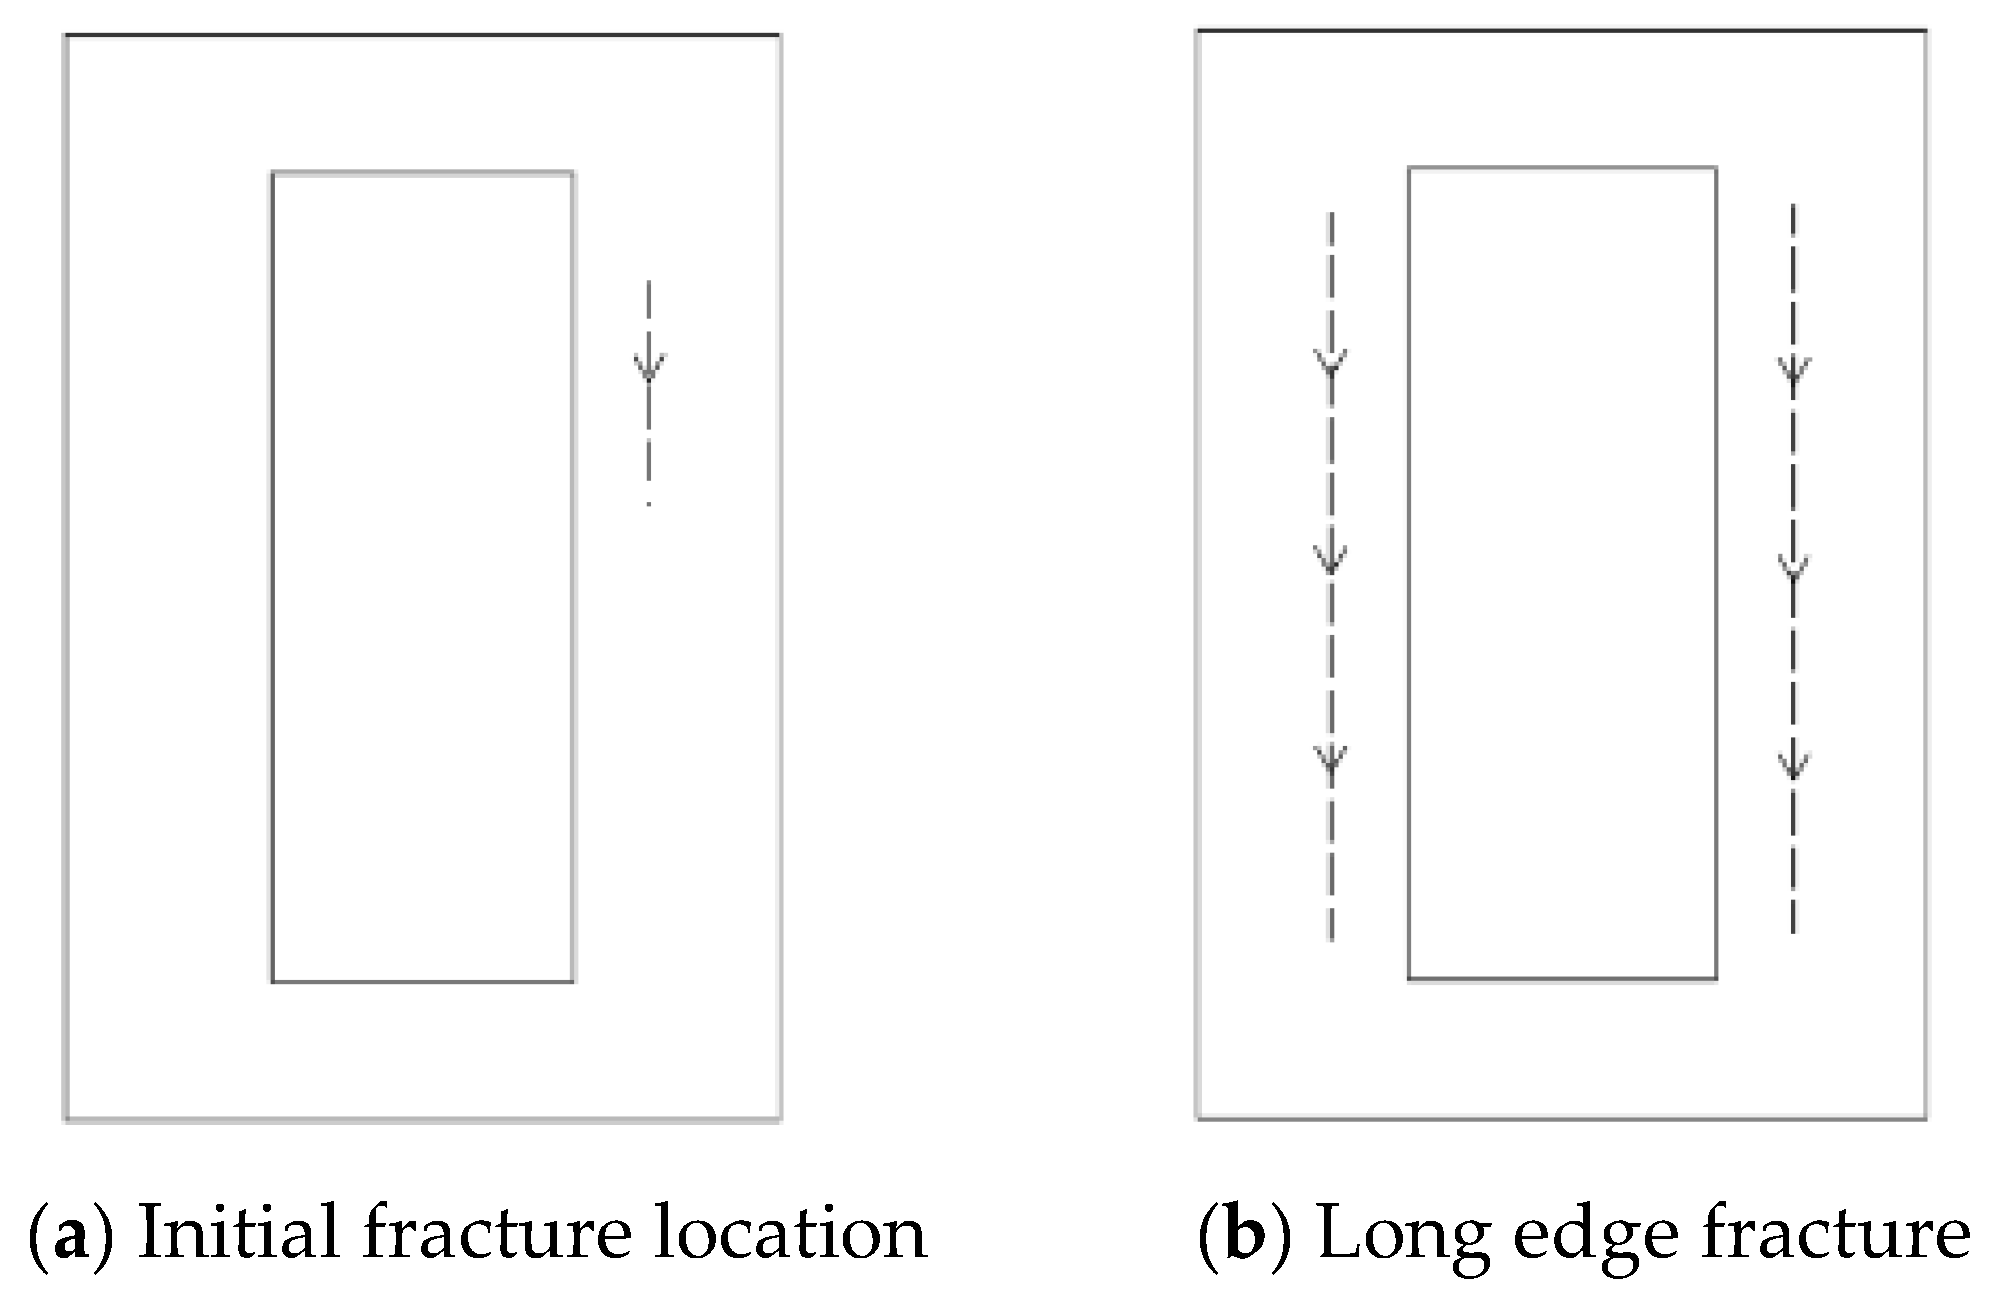
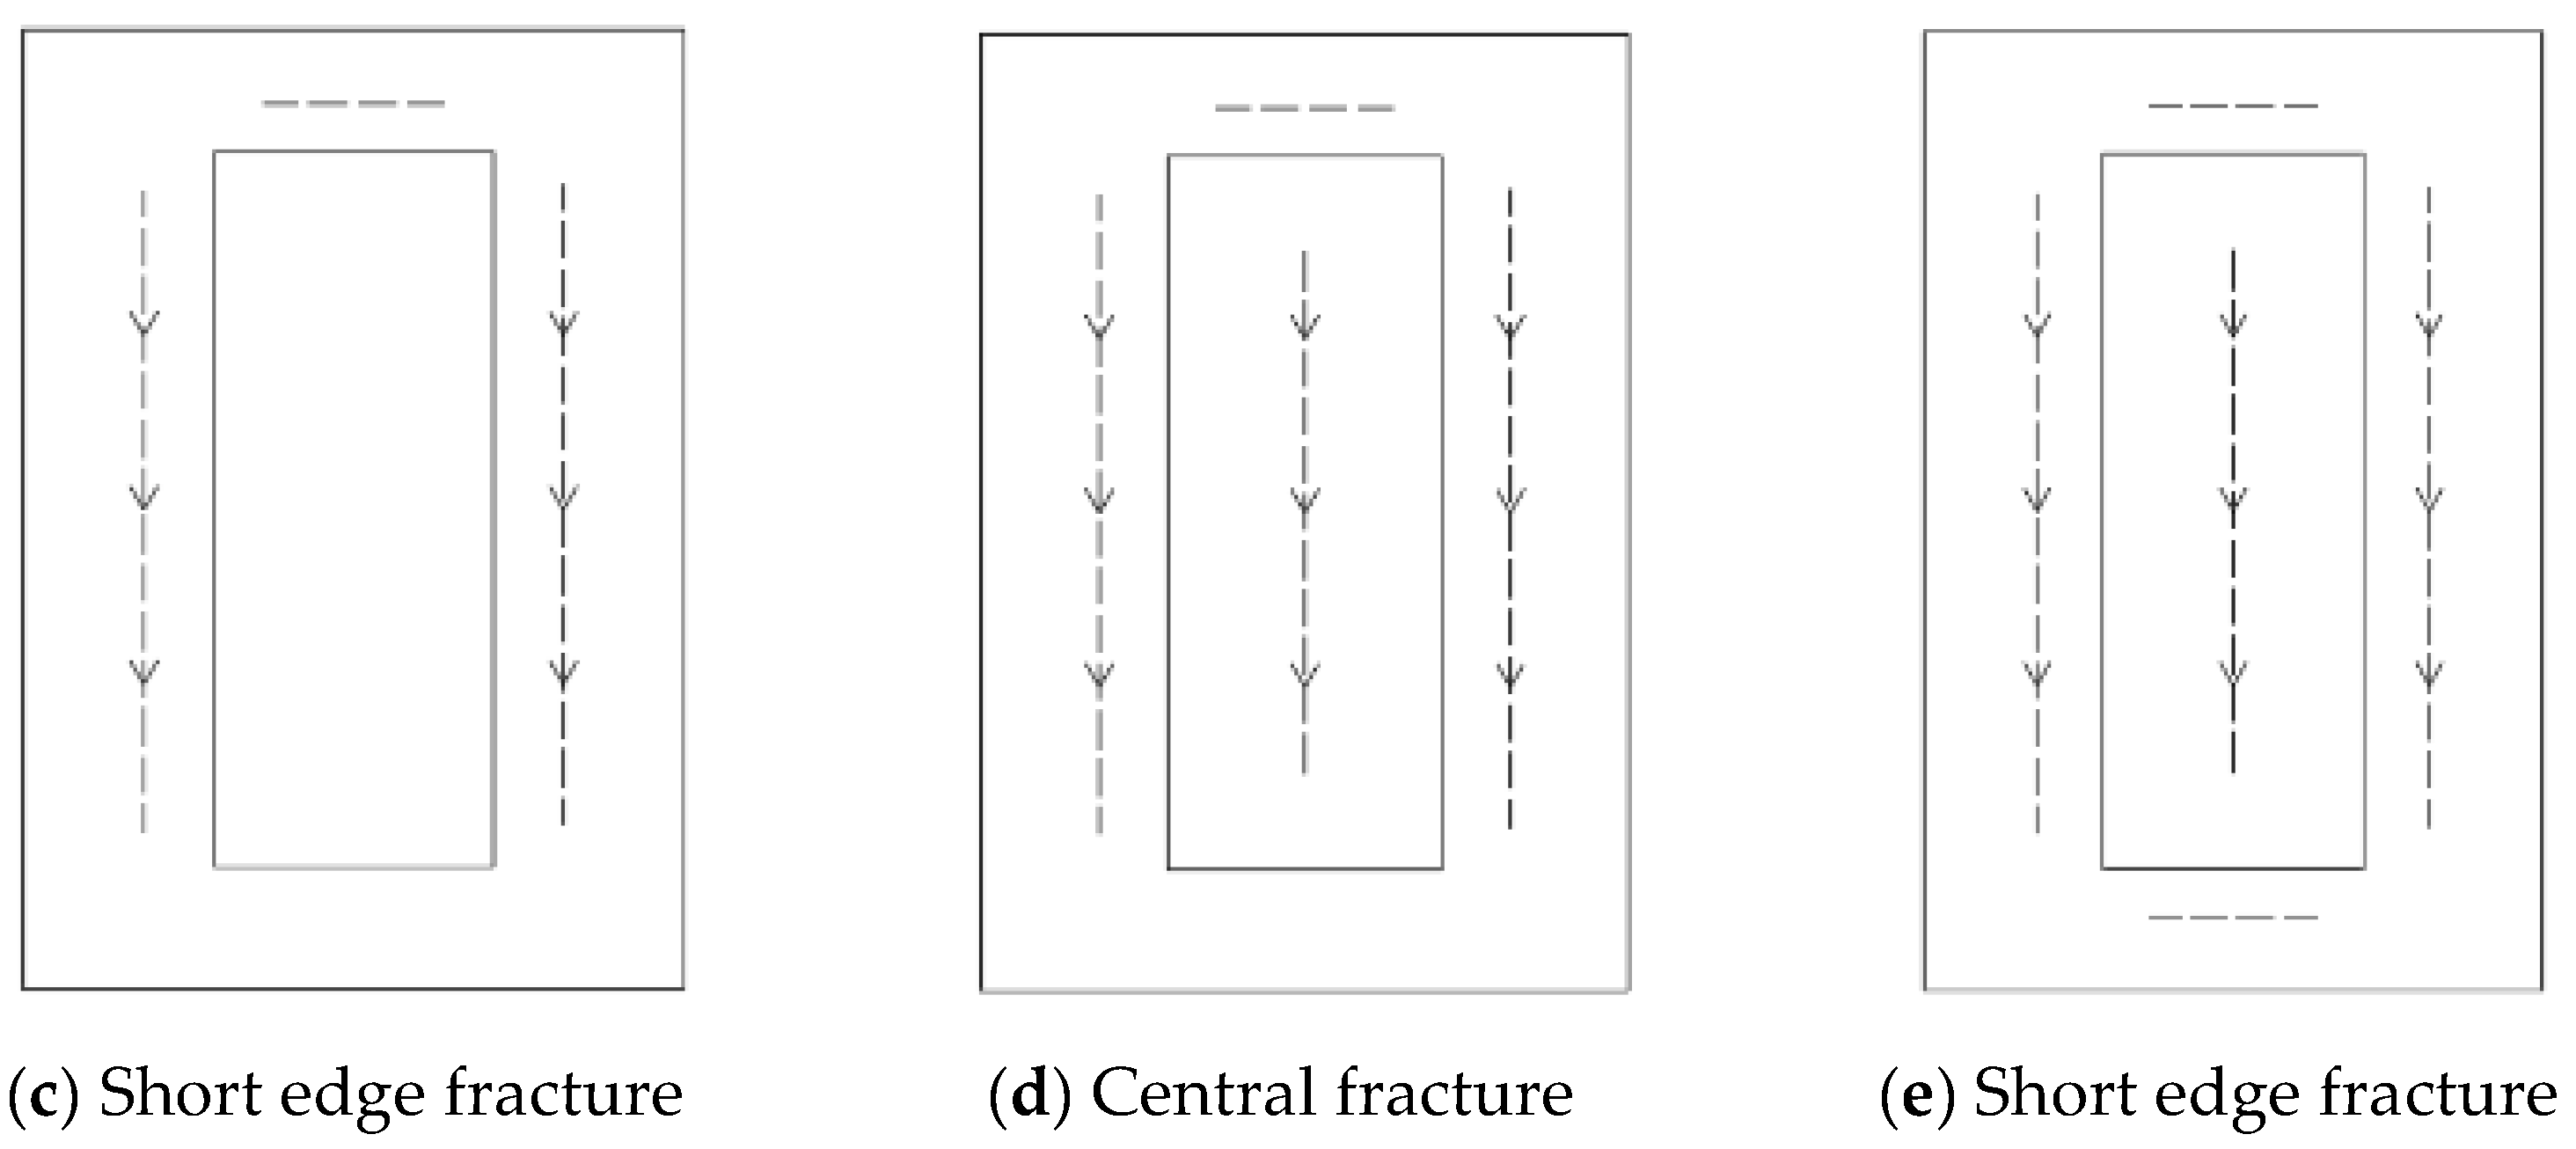
Figure 14.
Key Rock Layer Fracture Directions and Angles.
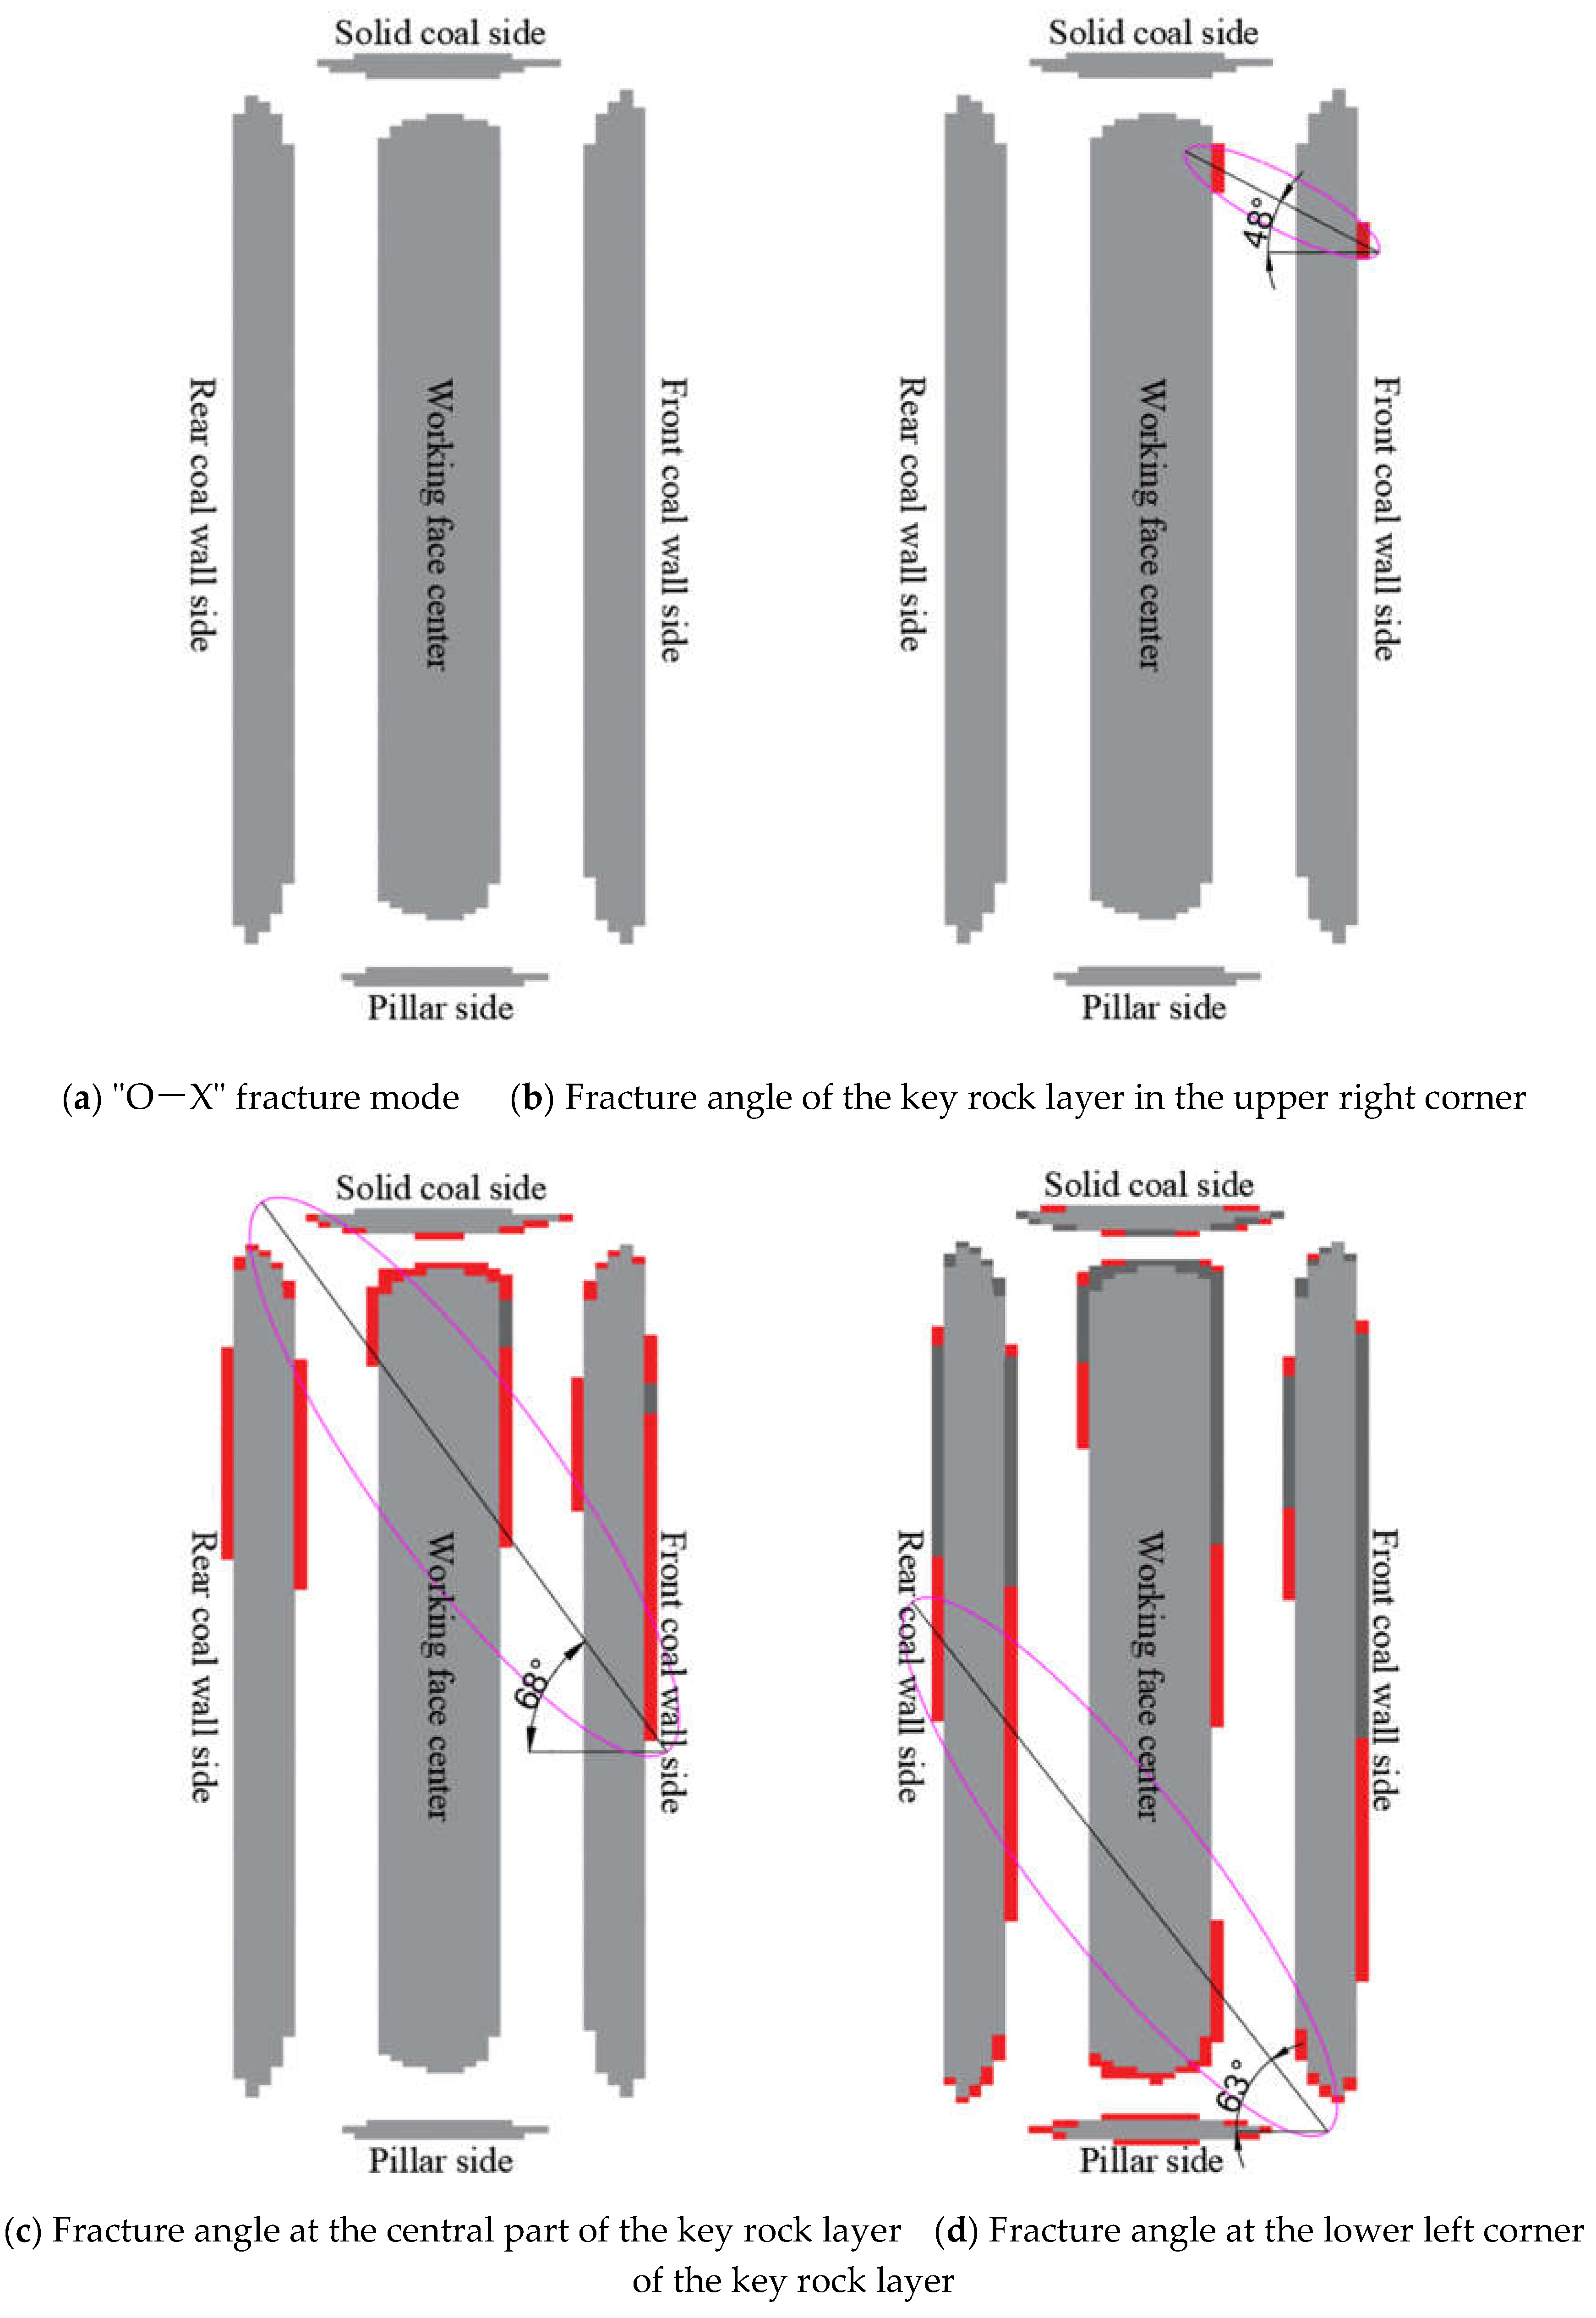

Table 1.
Mechanical parameters of strata between upper and lower coal layers
| Serial number | lithology | thickness/m | Unit weight/kN·m-3 | Modulus of elasticity/GPa | Key Stratum location |
|---|---|---|---|---|---|
| 15 | Fine-grained Sandstone | 4.49 | 26.50 | 23.00 | |
| 14 | Medium-grained Sandstone | 5.31 | 23.85 | 21.85 | |
| 13 | Coarse-grained Sandstone | 1.87 | 21.20 | 20.70 | |
| 12 | Siltstone | 0.66 | 20.90 | 32.70 | |
| 11 | Fine-grained Sandstone | 1.37 | 26.50 | 23.00 | |
| 10 | Siltstone | 3.00 | 20.90 | 32.70 | |
| 9 | Medium-grained Sandstone | 3.65 | 23.85 | 21.85 | |
| 8 | Siltstone | 1.41 | 20.90 | 32.70 | |
| 7 | Medium-grained Sandstone | 1.80 | 23.85 | 21.85 | |
| 6 | Fine Sandstone | 1.66 | 26.50 | 23.00 | |
| 5 | Siltstone | 6.75 | 20.90 | 32.70 | Subkey Stratum |
| 4 | Mudstone | 0.90 | 23.13 | 16.60 | |
| 3 | Sandy Mudstone | 0.30 | 24.58 | 25.80 | |
| 2 | No 2-2 coal seam | 4.50 | 12.84 | 5.00 | |
| 1 | Siltstone | 7.30 | 20.90 | 32.70 |
Disclaimer/Publisher’s Note: The statements, opinions and data contained in all publications are solely those of the individual author(s) and contributor(s) and not of MDPI and/or the editor(s). MDPI and/or the editor(s) disclaim responsibility for any injury to people or property resulting from any ideas, methods, instructions or products referred to in the content. |
© 2025 by the authors. Licensee MDPI, Basel, Switzerland. This article is an open access article distributed under the terms and conditions of the Creative Commons Attribution (CC BY) license (http://creativecommons.org/licenses/by/4.0/).
Copyright: This open access article is published under a Creative Commons CC BY 4.0 license, which permit the free download, distribution, and reuse, provided that the author and preprint are cited in any reuse.


