
Submitted:
28 March 2025
Posted:
28 March 2025
You are already at the latest version
Abstract
Early-life gut microbiota establishment plays a role in lifelong health, with disruptions linked to heightened risks of metabolic and immune disorders. Probiotic supplementation may be used to modulate the infant gut microbiome to promote favourable development and here we evaluate how Lab4B probiotic supplementation shapes infant gut microbiota development over the first six months.
Faecal samples collected from infants enrolled in the PROBAT (ISRCTN26287422) randomised, double-blind, placebo-controlled trial were analysed using culture-dependent, and independent (16S rDNA and metagenomic shotgun sequencing) techniques to examine the composition, diversity, antimicrobial resistance gene (ARG) abundance, and metabolic capabilities of the microbiotas.
Probiotic supplementation encouraged the development of a distinct microbiota composition: characterised by elevated abundances of Bifidobacteriaceae in the first 6 weeks (p = 0.006) and Lactobacillaceae throughout the first 6 months (p < 0.05 at every 6-week time point), accelerated microbial diversification, reduced abundance of beta-lactam and cephalosporin resistance genes and differences in predicted metabolic capabilities at start and end points.
Supplementation of this high atopy risk neonatal population with the Lab4B probiotic significantly influenced the development of the infant gut microbiota during the first 6 months.
Keywords:
Gut microbiota development
; Full-term infants
; multi-strain probiotic
; DNA sequencing
; Food allergy risk
; Atopy risk
1. Introduction
The community of microorganisms that reside in the human gastrointestinal tract, known collectively as the human gut microbiota, is increasingly recognised for its critical role in overall health, influencing metabolic, immunological, and neurological functions throughout life [1,2,3]. The establishment of the gut microbiota plays a pivotal role in shaping how the immature immune system develops, with implications for health and quality of life during childhood and beyond [4,5,6]. Recent studies have proposed a “typical” pattern of microbiota progression within the first year of life that supports healthy immune system development [7,8,9,10]. This progression is characterised by the dominance of bifidobacterium species, which utilise human milk oligosaccharides (HMOs) in breastmilk [5,11], help establish a low abundance of pathobionts [8], and achieve a balanced rate of diversification that is neither delayed nor accelerated [9,12]. Practices such as caesarean delivery, infant formula feeding, and antibiotic exposure may disrupt this “typical” pattern [7,13,14] and are associated with higher incidences of immunological disorders, including allergies, atopy and autoimmune diseases [9,12,15]. Given the potential lifelong implications of establishing a healthy gut microbiota during infancy, there is significant interest in exploring the use of interventions to support microbiota development [2,16,17].
Probiotics offer one option as an intervention for the modulation of the developing infant microbiota. Probiotics are defined by the World Health Organisation as ‘live microorganisms which when administered in adequate amounts confer a health benefit on the host’ [18] and several studies report beneficial effects in lowering the incidence of atopy [16,19] and eczema [20], especially when given both prenatally to mothers and postnatally to infants [21]. However, studies have shown mixed results in terms of whether probiotic supplementation can alter the composition of the gut microbiota of infants born after 37 completed weeks of gestation [22].
The ‘Probiotics in the Prevention of Atopy in Infants and Children’ (PROBAT) study (ISRCTN26287422), was a large, randomised, double-blind, placebo-controlled trial which, assessed the ability of the Lab4B probiotic to prevent the development of atopic conditions in a cohort of 454 new-borns [23]. The study cohort predominantly comprised infants with an anticipated increased risk of developing atopy (a first-degree relative with clinically diagnosed asthma, eczema, or allergic rhinitis). The probiotic reduced the incidence of atopic eczema and protected against sensitisation to cow’s milk and egg proteins. Details of study procedures are described elsewhere [24].
In the current study, faecal samples from a subset of the first 300 infants recruited to the PROBAT trial were selected for microbial analysis using traditional plate culture and DNA sequencing techniques. The objective was to identify differences in the composition of the developing gut microbiome of infants in the Lab4B probiotic and placebo groups.
2. Materials and Methods
2.1. Study Design and Sample Numbers
During the PROBAT trial, expectant mothers in the final month of pregnancy were randomly assigned (1:1) to receive a daily supplement of the Lab4B multi-strain probiotic or a matching placebo until delivery, with their babies receiving the same daily intervention until the age of 6-months. Randomisation was performed by external commercial partners using a computer-generated random sequence without blocks [23]. Participants and researchers were blind to study group allocation until data collection was completed and databases were locked [23]. Ethical approval was granted in February 2004 by the South West Wales Research Ethics Committee on behalf of NHS Wales (Project Ref. HE09 COL 1002) and recruitment took place between May 2005 and October 2007 [25]. Although the inclusion criteria required mothers carrying a foetus with a first-degree relative clinically diagnosed with atopy, this criterion was not always met.
The probiotic daily dose of 1 x 10¹⁰ colony-forming units (CFU) comprised 6.25 x 10⁹ CFU Ligilactobacillus salivarius CUL61 (National Collection of Industrial, Food and Marine Bacteria (NCIMB 30211) and 1.25 x 10⁹ CFU each of Lacticaseibacillus paracasei CUL08 (NCIMB 30154), Bifidobacterium animalis subsp. lactis CUL34 (NCIMB 30172) and Bifidobacterium bifidum CUL20 (NCIMB 30153) on a maltodextrin base. The placebo comprised maltodextrin only and was identical in appearance to the probiotic. The intervention was taken orally by the mothers and for the infants, the powder was either sprinkled into the infant’s open mouth or mixed with infant formula/expressed breast milk.
Carers of the infants were contacted by a research assistant at home and/or over the phone at 6, 12, 18, and 24 weeks to complete questionnaires which recorded information on common symptoms, compliance with the intervention (number of unused capsules), feeding method, visits to general practitioners, hospital admissions, medicines administered (including any antimicrobials), any adverse events, and the infant’s general health [24,25].
Carers were requested, but not obliged, to submit nappies containing their infants' faecal samples at birth, 2 weeks, 6 weeks, 12 weeks, 18 weeks, and 6 months - but provision was sporadic. Nappies were collected by the carers, transferred to Anaerogen bags (Sigma-Aldrich, UK), anaerobically sealed and stored in a refrigerator prior to transfer to the laboratory (typically within 3 days) for storage at -80°C pending further analysis. For this follow-up analysis, antibiotic-treated infants were excluded, and faecal samples from which high-quality DNA was extracted were analysed; 105 samples from 46 infants in the placebo group and 113 samples from 54 infants in the probiotic group.
2.2. Faecal Viable Numbers
Faecal samples from infants who had not received any antibiotics were enumerated within three months of their arrival at the laboratory using traditional culture techniques on selective agars to quantify viable Lactobacilli, Bifidobacteria, Enterobacter, Enterococci, Bacteroides, Staphylococci, Streptococci, Clostridia, as well as yeast, total aerobes, and total anaerobes, following the method of Madden et al. [26]. The detection limit was 5 log10 CFU/g faecal dry weight. Any faecal material not used for this testing was stored at -80°C.
2.3. Genomic DNA Extraction and Quantification
In 2022, the faecal samples were removed from storage and genomic DNA was extracted. The samples were mechanically lysed using Matrix Lysing B tubes in conjunction with a FastPrep-24TM bead beater (MP Biomedicals, USA) and three cycles of 30 seconds at 5 metres/second (with a 5-minute interval between each cycle). Genomic DNA was extracted from the lysed samples using the QIAamp Fast DNA stool kit (Qiagen, UK) and DNA concentrations were measured using a Qubit® 2.0 Fluorometer (Invitrogen, USA), both in accordance with the manufacturer’s instructions. Prior to sequencing, the quality of extracted genomic DNA was assessed by running 20 ng of total isolated gDNA on a 0.7% agarose gel. Intact, non-sheared gDNA was evidenced by discrete, high molecular weight bands on the gel. Isolated gDNA was diluted to 4 ng/µl in nuclease-free water.
2.4. Genomic Analysis
Samples which yielded high-quality DNA were categorised by the age of the infant at the time of sampling; 0 to 6 weeks (T1), 7 to 12 weeks (T2), 13 to 18 weeks (T3) and 19 to 24 weeks (T4). A subset of these samples was analysed in more depth by metagenomic shotgun sequencing: 16 samples (8 placebo and 8 probiotic) from 16 infants up to 2 weeks old (Starting Point [SP]), and 18 samples (5 placebo and 13 probiotic) from 18 infants aged between 19 and 24 weeks (Ending Point [EP]).
2.5. Analysis of the Faecal Microbiota by 16S rDNA
2.5.1. Sequencing and Initial Processing
16S rDNA sequencing from the genomic DNA extracts was performed in accordance with a previously described method [27]. Briefly, sample libraries were prepared using a modified version of Illumina’s 16S Metagenomic Sequencing Library Preparation Protocol targeting the V1-V2 hypervariable region of the 16S rRNA gene [28]. Sample libraries were quantified using the NEBNext Library Quant Kit for Illumina (New England Biolabs, Hitchin, UK) and sequencing was performed on an Illumina MiSeq platform with the MiSeq Reagent Kit v3 (Illumina Inc., Saffron Walden, UK) using paired-end 2 × 300bp chemistry. Raw sequencing data was processed following the DADA2 [29] pipeline in R. Paired-end reads were filtered and trimmed to ensure all nucleotides had a Q score ≥ 30. Forward and reverse reads were merged and chimeric sequences removed. The resulting amplicon sequence variants (ASVs) were assigned taxonomy via alignment to the SILVA database v138 [30].
2.5.2. Bacterial Taxonomic Analysis
The tax_glom function of the R package Phyloseq [31] was used to collapse amplicon sequence variants (ASVs) to the level of family, genus or species, and counts were converted to relative abundance. The 10 most abundant bacterial families across all samples and all time points were identified by summing the relative abundance of all samples, and the remaining families (77) were combined into the ‘Other’ category. Relative abundance data was centre-log-ratio (CLR) transformed using the Microbiome package [32] before statistical analysis.
2.5.3. Differential Abundance
At each time point, differential genera were identified with MaAsLin2 [33] using relative abundance data and controlling for the random effect of the participant and with all covariates as fixed effects (genera present in 10% of samples were compared with the Compound Poisson Linear Model (CPLM) analysis method, default transformation and no normalisation). False discovery rate (FDR) was controlled with the Benjamini-Hochberg method with a significance threshold of Q ≤ 0.05.
2.5.4. Diversity Measures
Alpha and beta diversities were calculated with Phyloseq. Alpha diversity was quantified from untransformed species counts with Shannon and Simpson diversity indices. Beta diversity was analysed by generating Bray-Curtis dissimilarity matrices from relative abundance data at each time point and visualised with Non-Metric Multidimensional Scaling (NMDS) plots.
2.5.5. Neonatal Community State Type Analysis
Partitioning Around Medoids (PAM) analysis (Cluster R package; [34]) was applied to a Jensen-Shannon divergence (JSD) matrix derived from genus-level relative abundance data for the T1 samples. The optimal number of clusters (Community State Types, CSTs) was determined by maximising the median sample silhouette width (Si) and optimising the ratio of positive to negative Si scores across clusters, with k ranging from 2 to the square root of the number of samples. Cluster medoids were visualised with the JSD matrix on a Principal Coordinates Analysis (PCoA) plot using the "cmdscale" function (k = 2). Bacterial genera (relative abundance) and independent variables (study group and covariates) were assessed for their explanatory power on the ordination using the “envfit” function of the vegan R package [35]. The relationship between independent variables and each CST was assessed using CST membership as a dependent variable and following the approach outlined in the ‘statistical analysis’ section.
2.5.6. Microbial Networks
Data was split per study group at each time point and group sample numbers were balanced (using the ‘sample’ function in R) to avoid sample size disparity bias when comparing networks [36]. The NetCoMi R package [37] with SPRING method [38] was used to generate networks from CLR transformed relative abundance of genera present in at least 10% of samples. Each node (genus) in a network had a score calculated for the following metrics of centrality: degree (number of direct connections to other nodes), betweenness (frequency of appearing on the shortest path between nodes), closeness (proximity to other nodes) and eigenvector (influence on highly connected nodes). For each measure of centrality, the genera which scored in the top quartile of the network were considered ‘keystones’ and were compared between study groups at each time point. Network information was imported into Gephi [39] for visual styling and structured using the OpenOrd force-directed algorithm. Nodes were coloured by bacterial family and their sizes were scaled by ‘hub score’, which is the sum of normalised values for degree, betweenness, closeness and eigenvector centrality scores. Edge size represents the strength of an association between genera; green edges represent positive associations (mutualism), red edges represent negative associations (antagonism).
2.6. Analysis of the Faecal Microbiota by Metagenomics
2.6.1. Sequencing and Initial Processing
Shotgun metagenomic sequencing of the genomic DNA extracts was performed using the Illumina NovaSeq 6000 platform (Novogene, China) with 150-nucleotide long paired-end reads. Adaptor removal and quality control of raw reads was conducted by Novogene. Quality was confirmed using FASTQC [40], ensuring all base calls had a Q score of at least 30. Host sequence decontamination was performed using Bowtie2 v2.5.4 [41] (default parameters) against the GRCh38 genome.
2.6.2. Microbial Profiling and Gene Prediction
The relative abundance of microbial taxa was determined by mapping reads to the CHOCOPhlAn database with MetaPhlAn4 v4.1.1 [42] using default parameters. Reads were assembled into contigs using MEGAHIT [43] and open reading frames (ORFs) were predicted with Prodigal in metagenomic-mode [44]. Redundant ORFs were clustered and consolidated into representative sequences using CD-HIT v4.8.1 [45] with criteria of > 95% identity and > 90% coverage, and used to create a custom database. Metagenomic reads were aligned to the custom database using Bowtie2 with the ‘--very-sensitive-local’ parameters. Mapped and unmapped reads were separated, sorted, and indexed using SAMtools v1.2 [46]. The number of reads mapped to each gene was calculated, and the counts were normalised to reads per kilobase per million mapped reads (RPKM).
2.6.3. Antibiotic Resistance Gene, Mobile Genetic Element and Metabolic Pathway Annotation
Identification of Antibiotic Resistant Genes (ARGs) was performed using the Resistance Gene Identifier (RGI) provided by the Comprehensive Antibiotic Resistance Database (CARD; [47]). The abundance of mobile genetic elements (MGEs) was evaluated with ShortBred v.0.9.4 [48] using a reference database of MGEs [49]. Metabolic pathway profiling was performed using HUMAnN v3.0 with the MetaCyc database [50] as a reference. Differential abundance analysis of pathways at each time point was performed in DESeq2 [51] after filtering for pathways present in at least 10% of samples. P-values were adjusted using the Benjamini-Hochberg correction.
2.7. Statistical Analysis
All statistical analyses of the 16S rDNA data, except for beta diversity and microbial network comparisons, were conducted via Generalised Linear Mixed Models (GLMMs) with the glmmTMB R package [52]. Each model included the participant as a random effect, in addition to study group, time point, and their interaction as fixed effects. Any of the following covariates were included as fixed effects if they significantly reduced the Akaike Information Criterion (AIC): delivery mode (vaginal or caesarean), number of weeks of breastfeeding, infant’s intervention compliance as an interaction with group, sex of infant, Townsend index score, presence of a sibling, Good’s coverage (for 16S rDNA data) and infant’s age in days (if separate models were required for each time point). Model details can be found in Supplementary Tables S3, S5, S9 and S11. To assess the significance of fixed effects, the emmeans package [53] was used to calculate marginal means from model coefficients and perform contrasts with a Tukey’s adjustment to control the false discovery rate.
To analyse beta diversity, we first assessed the community dispersion (within-group variability) of each group at each time point using the betadisper and permutest functions [35]. If significant differences in community dispersion were detected between groups, we balanced group sizes using the sample function in R to minimise the risk of false positives when comparing community compositions using PERMANOVA [35,54]. PERMANOVA tests included covariates as fixed effects if they accounted for a significant amount of variance. Within-group community dispersion between time points was compared using pairwise permutests and community composition was assessed using pairwise PERMANOVA [55]. All PERMANOVAs were run with 999 permutations.
Significant differences in keystone taxa between group microbial networks were assessed using Jaccard’s dissimilarity index (NetCoMi package).
Between- and within-group comparisons of the abundance of ARGs and MGEs were assessed with the two tailed Mann-Whitney U test.
For all statistical analyses, * represents differences between groups at a time point and # the difference within groups at different time points. Significance was considered as */# p ≤ 0.05, **/## p ≤ 0.01, ***/### p ≤ 0.001.
3. Results
3.1. Study Population Characteristics
Table 1 provides a summary of the demographic, environmental, behavioural, and socio-economic characteristics of the population, stratified by group. Rates of health-related events during the 6 month study period for infants in this sub-study are presented in Supplementary Table S1.
3.2. Viable Microbial Numbers
The viable counts for bacteria and yeast enumerated on selective media are presented in Figure 1 (detailed data in Supplementary Table S2). Between-group differences were observed at T2 when the probiotic group had a higher abundance of both Bifidobacterium spp. and total bacterial numbers (7.87 vs 6.34 log10 CFU/g, p = 0.008 and 9.36 vs 9.14 log10 CFU/g, p = 0.040, respectively). At T4, Bacteroides spp. numbers were higher in the probiotic group than the placebo group (1.89 log10 CFU/g and 0.89 log10 CFU/g, p = 0.025). At T4, numbers of yeasts, although very low, were significantly higher in the placebo than probiotic (0.31 vs 0.2 log10 CFU/g, p = 0.014, respectively).
Within-group differences in viable numbers indicated an increase of Bifidobacterium spp. from T2 to T3 in the placebo group (6.34 vs 8.38 log10 CFU/g, p = 0.002) and a decrease of yeasts from T2 to T4 in the probiotic group (0.31 vs 0.2 log10 CFU/g, p = 0.023).
3.3. 16S Analysis of Faecal Microbiota
3.3.1. Relative and Differential Abundance of Bacterial Taxa
The abundances of the 10 most prevalent bacterial families differed between the probiotic and placebo groups (Figure 2A, Supplementary Figure S1 and Supplementary Table S4). The probiotic group was significantly enriched in the Lactobacillaceae family throughout the study and had a higher prevalence of the Bifidobacteriaceae at T1. The placebo group had a higher prevalence of the Clostridiaceae and the Staphylococcaceae at T1 and T3, respectively.
At T1, Bifidobacteriaceae represented >70% of the bacterial population in the probiotic group, compared to 51.2% in the placebo group, which significantly increased in this group to 67.17% by T4 (p = 0.006). T1 abundances of the Staphylococcaceae were 5.96% in the placebo group and 1.24% in the probiotic but were not detectable in either group at the end of the intervention period (p = 0.002 and 0.006, respectively). Both groups had an increase in Lachnospiraceae abundance from T1 to T4 (placebo: 0.09% to 4.98%; p = 0.024, probiotic: 0% to 2.07%; p = 0.005).
Between-group differential abundance analysis of all bacterial genera (Figure 2B), indicated significantly higher proportions of Lacticaseibacillus at T1 and T2 and Ligilactobacillus at T1, T2 and T3 in the probiotic group. Statistical modelling focused on the abundance of the supplemented probiotic organisms (Table 2) confirmed the differential abundance analysis results, showing significant differences between groups for Ligilactobacillus and Lacticaseibacillus at T1, T2 and T3. Furthermore, the probiotic group was enriched in B. bifidum at all time points and B. animalis at T2 and T3.
3.3.2. Diversity Measures
There were no significant differences in alpha diversity between groups (Figure 3A and Figure 3B), although at T2 there was a trend (p = 0.059) of a higher Shannon diversity index for the probiotic cohort (median = 1.95 vs 1.81). For the probiotic group both Shannon and Simpson diversity indices significantly increased over time, whereas in the placebo cohort, Shannon diversity remained unchanged but Simpson diversity increased between T1 and T2.
Visualisation of beta diversity revealed that the probiotic and placebo group centroids occupied distinct positions in ordination space at each time point (Figure 4A and Supplementary Table S6), indicative of differences in microbial community composition. There was lower variability in the community composition (community dispersion) of samples within the probiotic group than the placebo, calculated from the distance of samples to the group’s centroid (p = 0.006 at T1, p ≤ 0.001 at T2 and at T3, p ≤ 0.001; Figure 4A and B and Supplementary Table S7). Within each group, the community composition of T1 was distinct from the other time points (Figure 4C and Supplementary Table S8). Additionally, community dispersion varied within groups between time points (Figure 4B and C and Supplementary Table S7). For both groups, community dispersion was highest at T1 and declined over time. For the placebo group, this reduction was only significant by T4 (average sample distance to centroid at T4 was 0.617 vs 0.659 at T1; p ≤ 0.001). Whereas, for the probiotic group, the community dispersion at T2 was significantly lower than T1 (average sample distance to centroid at T1 was 0.620 but 0.557 at T2; p = 0.003) and remained lower until T4, when community dispersion was comparable to T1.
3.3.3. Neonatal Community State Type Analysis
Analysis of the microbiotas of all the faecal samples at T1 identified three distinct community state types (CSTs), each characterised by predominance of a particular genus (Figure 5A to C). CST 1 was characterised by a high relative abundance of Bifidobacterium (median = 45.4%), CST 2 by Staphylococcus (82.9%), and CST 3 by Escherichia-Shigella (47.1%). The abundance of each of these genera explained a significant (after FDR adjustment) proportion of the variance in the ordination (Figure 5B); Escherichia-Shigella R2 = 0.91 (p = 0.046), Staphylococcus R2 = 0.74 (p = 0.046), Bifidobacterium R2 = 0.65 (p = 0.046). Some variance in microbial community composition was explained by the following independent variables (Figure 5A): infant’s age (R2 = 27.4%; p < 0.001), Good’s Coverage scores (R2 = 13.7%; p = 0.013), infant’s compliance with the intervention (R2 = 10.2%; p = 0.03) and whether the infant was in the probiotic or placebo group (R2 = 5.8%; p = 0.021). CST 1 included 44 samples (15 placebo and 29 probiotic; 63.77% of all T1 samples) whereas CST 2 and 3 included 12 (7 placebo and 5 probiotic; 17.4% of T1 samples) and 13 (9 placebo and 4 probiotic; 18.84% of T1 samples), samples respectively.
Associations between independent variables and membership of each CST were evaluated (Supplementary Table S10). CST 1 was strongly associated with older infants (average age: 19 days, range: 1 to 42 days; Adjusted Odds Ratio (AOR): 1.27 [1.06, 1.52] per day increase; p = 0.009) and trended toward association with the probiotic group (AOR: 5.69 [0.95, 33.42]; p = 0.057). CST 2 showed no significant association with independent variables, but CST 3 was associated with: (i) younger infants (average age: 5 days, range: 0 to 16 days; AOR: 0.86 [0.75, 0.98] per one day increase in age; p = 0.028) (ii) higher rates of breastfeeding (AOR: 3.23 [1.27, 8.19] for each 20% increase in weeks breastfed; p = 0.041) (iii) lower compliance with the intervention (AOR: 0.43 [0.22, 0.83] for each 20% increase in compliance; p = 0.041).
3.3.4. Microbial Networks and Keystone Taxa
Bacterial networks for the groups constructed at each time point (Figure 6 and Supplementary Figure S2) indicated keystone taxa differed between groups at T1 (related to betweenness, closeness, and eigenvector centrality), at T2 (eigenvector centrality), at T3 (betweenness centrality) and all measures at T4 (Table 3 and Supplementary Table S12). Descriptive and comparative metrics of the whole and largest connected component of each network are provided in the supplementary material (Supplementary Table S13).
3.4. Metagenomic Analysis
3.4.1. Antibiotic Resistance Gene (ARG) and Mobile Genetic Element (MGE) Abundance
No differences in total ARG abundance were observed between the groups (Figure 7A, Table 4 and Supplementary Table S14), but in the placebo group, the genes associated with resistance to beta-lactams and cephalosporins were more abundant at ending point (EP) (p = 0.035 and 0.007, respectively).
Within the probiotic group, between SP and EP there was a decrease in the abundance of genes associated with resistance to beta-lactams (p = 0.010), elfacmycin (p = 0.003), macrolides (p = 0.013), multidrug (p = 0.008) and phosphonic acid (p = 0.037). In the placebo group, there were significant decreases in the prevalence of genes associated with resistance to disinfecting/antiseptic agents (p = 0.011) and penams (p = 0.045).
3.4.2. Differentially Abundant Metabolic Pathways
Differential metabolic pathway abundance analysis (Figure 7E and Supplementary Table S15) revealed that, at SP the probiotic group was significantly enriched in the ‘glycogen degradation I’ and ‘dTDP-L-rhamnose biosynthesis’ pathways derived from Bifidobacterium bifidum, the ‘D-galactose degradation I’, ‘stachyose degradation’ and ‘5-aminoimidazole ribonucleotide biosynthesis I’ pathways from Bifidobacterium longum and a ‘L-ascorbate degradation I’ pathway derived from Lacticaseibacillus casei. In contrast, the placebo group had a higher SP abundance of pathways derived from Escherichia coli, namely ‘anaerobic sucrose degradation’, ‘heme b biosynthesis from glycine’, ‘mannosylglycerate biosynthesis I’, and four menaquinol biosynthesis pathways. At EP the probiotic group showed enrichment in ‘pyruvate fermentation to isobutanol’ from Bifidobacterium bifidum and several Ligilactobacillus salivarius pathways: ‘dTDP-L-rhamnose biosynthesis’, ‘stachyose degradation’, ‘UDP-N-acetyl-D-glucosamine biosynthesis I’, and three ‘5-aminoimidazole ribonucleotide biosynthesis’ pathways. The ‘dTDP-L-rhamnose biosynthesis’, ‘stachyose degradation’ and ‘5-aminoimidazole ribonucleotide biosynthesis I’ pathways were enriched at both SP and EP, though their microbial sources differed between time points.
4. Discussion
In this subset of infants from the PROBAT study [23], we observed differences in gut microbiota development between those receiving the Lab4B probiotic and those receiving the placebo.
The microbiota composition and maturation from birth for the infants in the placebo group is comparable with that observed in other full-term infants [7,8,56,57] with Bifidobacteriaceae as the most abundant family (51%) at T1 followed by Enterobacteriaceae (19%) and Streptococcaceae (13%). In the probiotic group, Bifidobacteriaceae constituted 73% of the T1 microbiota followed by Lactobacillaceae (12.5%; largely Lacticaseibacillus and Ligilactobacillus), and Streptococcaceae (7%). For both groups, Staphylococcaceae was highest at T1 and declined over time, and this has been seen in other studies [7,56]. Over time for the infants in both groups there was an increase in the presence of bacterial families known to be associated with a more mature microbiota, such as Lachnospiraceae, Bacteroidaceae and Ruminococcaceae [8,13,14,58].
The probiotic group exhibited an age-related microbial diversification that has been seen in healthy infants [12], with temporal increases in the richness and evenness of species (Shannon index) alongside a reduction in the domination by a few groups (Simpson index). In contrast, the placebo group displayed no sustained increase in alpha diversity, potentially reflecting the high atopy-risk population recruited for this study. Delays in microbiota diversification have been associated with the development of paediatric allergies [12] and it has been proposed that a 'microbiota age' which lags behind the infant's chronological age could serve as a biomarker for predicting a predisposition to food allergies [59]. The infants in the placebo group of the PROBAT trial were found to have a higher incidence of food allergy [23] and this may be related to the observed composition of their microbiota.
Beta diversity analysis showed that the gut microbiota composition of infants at T1 was disparate from later time points, and early differences in composition have been previously reported [7,56]. Probiotic supplementation appeared to support the development of a distinct enterotype with between-group differences in community composition at all time points and lower variance between microbiotas (community dispersion) for the probiotic group at T1, T2 and T3.
We observed that the gut microbiotas of infants at T1 were most effectively partitioned into three distinct community state types (CSTs) each defined by the dominance of a specific genus as reported by Shao et al. [15]. At T1, the infant’s age at the time of sampling was the primary driver of microbial differences, with older infants more likely to have a gut microbiota dominated by Bifidobacteria (CST 1) and younger infants enriched in Escherichia-Shigella (CST 3). It has been found that the neonatal gut microbiota is initially dominated by Enterobacteriaceae, with a transition toward a Bifidobacterium-rich community as the neonatal gut matures and becomes increasingly anaerobic [7,13]. There were indications that the probiotic supported such a transition, with CST 1 showing a near-significant association with the probiotic group. The placebo group appeared to align more closely with CST 3.
The bifidobacteria species present in the Lab4B probiotic (B. animalis and B. bifidum) were more abundant in the infants in the probiotic group. Infants with a high abundance of Bifidobacteria in their gut microbiota have been found to exhibit better health outcomes compared to those with lower levels; the benefits observed include a reduced risk of childhood obesity and metabolic disorders [5,11], enhanced resistance to pathogen colonisation [15], and a more tolerant immune system [60] which may contribute to the lower incidence of atopic diseases and cow’s milk allergy [12]. Bifidobacteria also play an important role in the maturation of the butyrogenic microbiota by cross-feeding acetate to support the establishment of butyrate-producing bacteria such as Faecalibacterium prausnitzii, Eubacterium rectale, and species of Anaerostipes, Eubacterium, and Roseburia [61]. Microbially derived butyrate is known to support gut epithelial integrity and reduce the risk of immune-mediated diseases, including food allergies [62,63].
In the probiotic group, Lacticaseibacillus spp. and Ligilactobacillus spp. (components of the probiotic) were detectable throughout the study. Members of the Lactobacillaceae family are typically enriched in vaginally delivered and breastfed infants compared with caesarean delivered or formula fed infants [5]. These bacteria are believed to contribute to positive health outcomes via production of metabolites which lower gastrointestinal pH and may inhibit enteric pathogens [5,64].
There were no between-group structural differences in the genus level microbial networks but keystone genera differed between the two networks at all time points. Keystone (hub) organisms have a large influence on the structure and function of ecological networks but are not necessarily the most abundant organisms [65]. They exert their influence through (i) a high number of direct connections to other organisms (degree centrality), (ii) frequently appearing on the shortest paths between pairs of organisms (betweenness centrality), (iii) being in close proximity to many other organisms (closeness centrality), or (iv) exerting influence over other highly connected organisms within the network (eigenvector centrality). None of the Lab4B probiotic organisms was identified specifically as a keystone organism.
Analysis of the gut resistome revealed no between-group differences in the overall abundance of antibiotic resistance genes (ARGs) but that there were indications of a age/time related decrease in abundance within both groups, as seen in previous studies [66,67,68]. Genes related to multidrug resistance were the most abundant in both groups, as found by Pärnänen et al. [49]; Casaburi et al. [69], and their abundance within the probiotic group decreased significantly between SP and EP. By EP, probiotic supplementation reduced the abundance of ARGs related to beta-lactams and cephalosporin in particular – antibiotics that are used as first-line treatments for serious infections in infants [70]. The abundance of mobile genetic elements was similar between the two groups throughout, suggesting that probiotic supplementation did not impact horizontal ARG transfer. Transposase genes constituted the largest fraction of mobile genetic elements in the gut metagenomes of our cohort, as has been reported for other infant populations [49].
Differential metabolic pathway analysis revealed that at SP, the gut microbiomes of the probiotic group exhibited an enrichment of metabolic pathways related to carbohydrate metabolism, including galactose, glycogen, and stachyose degradation. The enrichment of these pathways may be a reflection of the extensive repertoire of carbohydrate-metabolising genes possessed by the bifidobacteria [71] whose abundance was higher in the probiotic group at T1. Enhanced galactose degradation pathways may support an increased capacity for the gut microbiotas of the probiotic group to utilise galactose from breastmilk. The ‘stachyose degradation’ pathway, enriched in the probiotic group and attributed to B. longum at SP and L. salivarius at EP, enables the metabolism of stachyose (a prebiotic oligosaccharide) into acetate or propionate, which reduces intestinal pH and thereby can inhibit pathogen colonisation [72]. Metabolism of stachyose by the gut microbiota has been found to relieve inflammation [73] and reduce constipation in murine models [74]. Interestingly, Allen et al. [25] reported a reduced incidence of constipation in the infants in the Lab4B group. Peptidoglycan synthesis pathways were also more abundant in the probiotic group, including ‘dTDP-L-rhamnose biosynthesis’ at both time points and ‘UDP-N-acetyl-D-glucosamine biosynthesis I’ at EP. Peptidoglycan, a major component of bacterial cell walls, plays a critical role in shaping the developing innate immune system and influencing immune homeostasis [75]. Additionally, pathways for 5-aminoimidazole ribonucleotide biosynthesis were enriched at both SP and EP, potentially enhancing the synthesis of ribonucleotides—essential nutrients for infant gut and immune development, primarily derived from breastmilk but also synthesised by the gut microbiota [76,77,78]. The placebo group showed enrichment of metabolic pathways derived from E. coli at SP, including several menaquinol (vitamin K2) biosynthesis pathways. Vitamin K2 is primarily produced by gut bacteria and is vital for bone, cardiovascular, neural, and joint health, although its increased presence in faeces does not necessarily correlate with higher plasma levels [79]. Interestingly, the enrichment of ‘dTDP-L-rhamnose biosynthesis’ and D-galactose degradation I’ pathways, along with depletion of the ‘heme b biosynthesis from glycine’ pathway in the probiotic group aligned with findings from a meta-analysis studying the probiotic supplementation of preterm infants [80].
A strength of this study was that both viable microbial numbers alongside molecular analysis have been used to assess the progression of the intestinal microbiota during early infancy with and without probiotic supplementation. Our analysis was limited to bacteria and did not consider the potential impact of probiotic supplementation on the gut mycobiome and virome. The inconsistency in the frequency of faecal sample provision represented a weakness in this work that was addressed as far as possible through the statistical analysis methodology applied. Additionally, the limited size of the cohort available for faecal analysis prevented any correlations with the primary/secondary trial outcomes. Another observation is that our population subset had higher intervention compliance than the wider cohort, suggesting that carers who provided faecal samples were more likely to follow the recommended dosing protocol.
5. Conclusions
In summary, supplementation with the Lab4B probiotic influenced the development of the infant gut microbiota. The microbiome of the infants in the probiotic group had an increased abundance of Bifidobacteriaceae and Lactobacillaceae, an accelerated diversification, lower levels of some antimicrobial resistance genes, and predicted additional functional capabilities when compared with the control infants. Future longitudinal studies throughout infancy and beyond should be considered to gain a greater understanding of the longer term impacts of probiotic supplementation during neonatal development.
Supplementary Materials
The following supporting information can be downloaded at the website of this paper posted on Preprints.org., Figure S1: title; Table S1: title; Video S1: title.
Author Contributions
For research articles with several authors, a short paragraph specifying their individual contributions must be provided. Conceptualization, N.C, D.A.J, S.J, M.S, C.A.T, I.G, D.W, S.J.A, D.R.M, S.F.P, P.F; methodology, N.C, D.A.J, D.W, P. F, S.F.P; formal analysis, N.C, D.A.J, D.R.M,.; investigation, S.J, M.S, C.A.T, I.G, S.J.A, P.F; resources, S.F.P.; data curation, N.C, D.A.J, S.J.A,; writing—original draft preparation, N.C, D.R.M, S.F.P; writing—review and editing, N.C, D.A.J, S.J, M.S, C.A.T, I.G, D.W, S.J.A, D.R.M, S.F.P, P.F.; visualization, N.C, D.A.J; supervision, S.F.P.; project administration, D.R.M, S.F.P.; funding acquisition, S.JA., S.F.A, P.F. All authors have read and agreed to the published version of the manuscript.
Funding
This research was funded by the Knowledge Exploitation Fund, Collaborative Industrial Research (Project No. HE09 COL 1002), European Regional Development Fund (ERDF) Accelerate Programme (Project code: PR-0228) and Cultech Ltd (Port Talbot, UK).
Institutional Review Board Statement
The study was conducted in accordance with the Declaration of Helsinki, and approved by the South West Wales Research Ethics Committee on behalf of NHS Wales (Project Ref. HE09 COL 1002) on 12/02/2004. The trial was registered with the ISRCTN Registry (ISRCTN26287422) on 15/06/2005.
Informed Consent Statement
Informed consent was obtained from participants during recruitment (starting on 01/05/2005) to the trial.
Data Availability Statement
The data that support the findings of this study are available from the corresponding author upon reasonable request. Sequence data generated during the current study have been submitted to the European Molecular Biology Laboratory (EMBL) nucleotide sequence database (https://www.ebi.ac.uk/ena) under accession number PRJEB82926.
Acknowledgments
We appreciate the technical assistance of Dr Laura Baker, Tamsin Joyce and Victoria Clark, and the contribution of all those originally involved in the PROBAT study without which these samples could not have been tested.
Conflicts of Interest
N.C, D.A.J, I.G, D.R.M and S.F.P are/were employees of Cultech Ltd and contributed to the design of the study, lab work, data analysis, manuscript writing, reviewing and/or editing, and approval of the final manuscript, but had no role in recruitment or data collection from study participants. M.S. has previously received financial support from Cultech Ltd. D.W. has previously received consultancy fees from Cultech Ltd. S.J.A reports a grant from Yakult UK outside the submitted work. The remaining authors declare that they have no competing interests. Cultech Ltd provided the study interventions.
Abbreviations
The following abbreviations are used in this manuscript:
| Abbreviation | Expansion |
| PROBAT | Probiotics in the Prevention of Atopy in Infants and Children |
| SP | Starting Point |
| EP | Ending Point |
| CST | Community State Type |
| IQR | Interquartile Range |
| AOR | Adjusted Odds Ratio |
| CFU | Colony Forming Units |
| gDNA | Genomic DNA |
| ASV | Amplicon Sequence Variant |
| 16S rDNA | 16S Ribosomal DNA |
| CLR | Centre-Log-Ratio |
| ARG | Antibiotic Resistance Gene |
| MGE | Mobile Genetic Element |
| ORF | Open Reading Frame |
| RPKM | Reads Per Kilobase per Million mapped reads |
| PCoA | Principal Coordinates Analysis |
| NMDS | Non-Metric Multidimensional Scaling |
| JSD | Jensen-Shannon Divergence |
| GLMM | Generalised Linear Mixed Model |
| AIC | Akaike Information Criterion |
| FDR | False Discovery Rate |
| DADA2 | Divisive Amplicon Denoising Algorithm 2 |
| NCIMB | National Collection of Industrial, Food and Marine Bacteria |
| CARD | Comprehensive Antibiotic Resistance Database |
| RGI | Resistance Gene Identifier |
| DESeq2 | Differential Expression Sequencing version 2 |
| HUMAnN | The HMP Unified Metabolic Analysis Network |
| MetaCyc | Metabolic Pathway Database |
| CHOCOPhlAn | A pan-genome database used with MetaPhlAn |
| NetCoMi | Network Construction and Comparison for Microbiome Data |
References
- Lynch, S.V.; Pedersen, O. The Human Intestinal Microbiome in Health and Disease. N. Engl. J. Med. 2016, 375, 2369–2379. [Google Scholar] [CrossRef]
- Durack, J.; Lynch, S.V. The gut microbiome: Relationships with disease and opportunities for therapy. J. Exp. Med. 2019, 216, 20–40. [Google Scholar] [CrossRef]
- Tilg, H.; Zmora, N.; Adolph, T.E.; Elinav, E. The intestinal microbiota fuelling metabolic inflammation. Nat. Rev. Immunol. 2020, 20, 40–54. [Google Scholar] [CrossRef] [PubMed]
- Gensollen, T.; Iyer, S.S.; Kasper, D.L.; Blumberg, R.S. How colonization by microbiota in early life shapes the immune system. Science 2016, 352, 539–544. [Google Scholar] [CrossRef]
- Milani, C.; Duranti, S.; Bottacini, F.; Casey, E.; Turroni, F.; Mahony, J.; Belzer, C.; Delgado Palacio, S.; Arboleya Montes, S.; Mancabelli, L.; et al. The First Microbial Colonizers of the Human Gut: Composition, Activities, and Health Implications of the Infant Gut Microbiota. Microbiol. Mol. Biol. Rev. 2017, 81, e00036-17. [Google Scholar] [CrossRef]
- Sanidad, K.Z.; Zeng, M.Y. Neonatal gut microbiome and immunity. Curr. Opin. Microbiol. 2020, 56, 30–37. [Google Scholar] [CrossRef] [PubMed]
- Beller, L.; Deboutte, W.; Falony, G.; Vieira-Silva, S.; Tito, R.Y.; Valles-Colomer, M.; Rymenans, L.; Jansen, D.; Van Espen, L.; Papadaki, M.I.; et al. Successional Stages in Infant Gut Microbiota Maturation. mBio 2021, 12, e01857-21. [Google Scholar] [CrossRef] [PubMed]
- Hickman, B.; Salonen, A.; Ponsero, A.J.; Jokela, R.; Kolho, K.-L.; De Vos, W.M.; Korpela, K. Gut microbiota wellbeing index predicts overall health in a cohort of 1000 infants. Nat. Commun. 2024, 15, 8323. [Google Scholar] [CrossRef]
- Shenhav, L.; Fehr, K.; Reyna, M.E.; Petersen, C.; Dai, D.L.Y.; Dai, R.; Breton, V.; Rossi, L.; Smieja, M.; Simons, E.; et al. Microbial colonization programs are structured by breastfeeding and guide healthy respiratory development. Cell 2024, 187, 5431–5452.e20. [Google Scholar] [CrossRef]
- Wopereis, H.; Oozeer, R.; Knipping, K.; Belzer, C.; Knol, J. The first thousand days - intestinal microbiology of early life: Establishing a symbiosis. Pediatr. Allergy Immunol. Off. Publ. Eur. Soc. Pediatr. Allergy Immunol. 2014, 25, 428–438. [Google Scholar] [CrossRef]
- Saturio, S.; Nogacka, A.M.; Alvarado-Jasso, G.M.; Salazar, N.; De Los Reyes-Gavilán, C.G.; Gueimonde, M.; Arboleya, S. Role of Bifidobacteria on Infant Health. Microorganisms 2021, 9, 2415. [Google Scholar] [CrossRef] [PubMed]
- Davis, E.C.; Monaco, C.L.; Insel, R.; Järvinen, K.M. Gut microbiome in the first 1000 days and risk for childhood food allergy. Ann. Allergy. Asthma. Immunol. 2024, S1081120624001522. [Google Scholar] [CrossRef] [PubMed]
- Bokulich, N.A.; Chung, J.; Battaglia, T.; Henderson, N.; Jay, M.; Li, H.; Lieber, A.D.; Wu, F.; Perez-Perez, G.I.; Chen, Y.; et al. Antibiotics, birth mode, and diet shape microbiome maturation during early life. Sci. Transl. Med. 2016, 8. [Google Scholar] [CrossRef]
- Yassour, M.; Vatanen, T.; Siljander, H.; Hämäläinen, A.-M.; Härkönen, T.; Ryhänen, S.J.; Franzosa, E.A.; Vlamakis, H.; Huttenhower, C.; Gevers, D.; et al. Natural history of the infant gut microbiome and impact of antibiotic treatment on bacterial strain diversity and stability. Sci. Transl. Med. 2016, 8. [Google Scholar] [CrossRef]
- Shao, Y.; Garcia-Mauriño, C.; Clare, S.; Dawson, N.J.R.; Mu, A.; Adoum, A.; Harcourt, K.; Liu, J.; Browne, H.P.; Stares, M.D.; et al. Primary succession of Bifidobacteria drives pathogen resistance in neonatal microbiota assembly. Nat. Microbiol. 2024, 9, 2570–2582. [Google Scholar] [CrossRef]
- Fang, Z.; Li, L.; Zhang, H.; Zhao, J.; Lu, W.; Chen, W. Gut Microbiota, Probiotics, and Their Interactions in Prevention and Treatment of Atopic Dermatitis: A Review. Front. Immunol. 2021, 12, 720393. [Google Scholar] [CrossRef]
- Renz, H.; Skevaki, C. Early life microbial exposures and allergy risks: Opportunities for prevention. Nat. Rev. Immunol. 2021, 21, 177–191. [Google Scholar] [CrossRef]
- Hill, C.; Guarner, F.; Reid, G.; Gibson, G.R.; Merenstein, D.J.; Pot, B.; Morelli, L.; Canani, R.B.; Flint, H.J.; Salminen, S.; et al. The International Scientific Association for Probiotics and Prebiotics consensus statement on the scope and appropriate use of the term probiotic. Nat. Rev. Gastroenterol. Hepatol. 2014, 11, 506–514. [Google Scholar] [CrossRef] [PubMed]
- Lemoine, A.; Tounian, P.; Adel-Patient, K.; Thomas, M. Pre-, pro-, syn-, and Postbiotics in Infant Formulas: What Are the Immune Benefits for Infants? Nutrients 2023, 15, 1231. [Google Scholar] [CrossRef]
- Sun, M.; Luo, J.; Liu, H.; Xi, Y.; Lin, Q. Can Mixed Strains of Lactobacillus and Bifidobacterium Reduce Eczema in Infants under Three Years of Age? A Meta-Analysis. Nutrients 2021, 13, 1461. [Google Scholar] [CrossRef]
- Zhang, G.-Q.; Hu, H.-J.; Liu, C.-Y.; Zhang, Q.; Shakya, S.; Li, Z.-Y. Probiotics for Prevention of Atopy and Food Hypersensitivity in Early Childhood: A PRISMA-Compliant Systematic Review and Meta-Analysis of Randomized Controlled Trials. Medicine (Baltimore) 2016, 95, e2562. [Google Scholar] [CrossRef] [PubMed]
- Indrio, F.; Gutierrez Castrellon, P.; Vandenplas, Y.; Cagri Dinleyici, E.; Francavilla, R.; Mantovani, M.P.; Grillo, A.; Beghetti, I.; Corvaglia, L.; Aceti, A. Health Effects of Infant Formula Supplemented with Probiotics or Synbiotics in Infants and Toddlers: Systematic Review with Network Meta-Analysis. Nutrients 2022, 14, 5175. [Google Scholar] [CrossRef]
- Allen, S.J.; Jordan, S.; Storey, M.; Thornton, C.A.; Gravenor, M.B.; Garaiova, I.; Plummer, S.F.; Wang, D.; Morgan, G. Probiotics in the prevention of eczema: A randomised controlled trial. Arch. Dis. Child. 2014, 99, 1014–1019. [Google Scholar] [CrossRef]
- Jordan, S.; Watkins, A.; Storey, M.; Allen, S.J.; Brooks, C.J.; Garaiova, I.; Heaven, M.L.; Jones, R.; Plummer, S.F.; Russell, I.T.; et al. Volunteer Bias in Recruitment, Retention, and Blood Sample Donation in a Randomised Controlled Trial Involving Mothers and Their Children at Six Months and Two Years: A Longitudinal Analysis. PLoS ONE 2013, 8, e67912. [Google Scholar] [CrossRef]
- Allen, S.J.; Jordan, S.; Storey, M.; Thornton, C.A.; Gravenor, M.; Garaiova, I.; Plummer, S.F.; Wang, D.; Morgan, G. Dietary Supplementation with Lactobacilli and Bifidobacteria Is Well Tolerated and Not Associated with Adverse Events during Late Pregnancy and Early Infancy. J. Nutr. 2010, 140, 483–488. [Google Scholar] [CrossRef] [PubMed]
- Madden, J.A.J.; Plummer, S.F.; Tang, J.; Garaiova, I.; Plummer, N.T.; Herbison, M.; Hunter, J.O.; Shimada, T.; Cheng, L.; Shirakawa, T. Effect of probiotics on preventing disruption of the intestinal microflora following antibiotic therapy: A double-blind, placebo-controlled pilot study. Int. Immunopharmacol. 2005, 5, 1091–1097. [Google Scholar] [CrossRef]
- Cherta-Murillo, A.; Danckert, N.P.; Valdivia-Garcia, M.; Chambers, E.S.; Roberts, L.; Miguens-Blanco, J.; McDonald, J.A.K.; Marchesi, J.R.; Frost, G.S. Gut microbiota fermentation profiles of pre-digested mycoprotein (Quorn) using faecal batch cultures in vitro : A preliminary study. Int. J. Food Sci. Nutr. 2023, 74, 327–337. [Google Scholar] [CrossRef]
- Mullish, B.H.; Pechlivanis, A.; Barker, G.F.; Thursz, M.R.; Marchesi, J.R.; McDonald, J.A.K. Functional microbiomics: Evaluation of gut microbiota-bile acid metabolism interactions in health and disease. Methods 2018, 149, 49–58. [Google Scholar] [CrossRef] [PubMed]
- Callahan, B.J.; McMurdie, P.J.; Rosen, M.J.; Han, A.W.; Johnson, A.J.A.; Holmes, S.P. DADA2: High-resolution sample inference from Illumina amplicon data. Nat. Methods 2016, 13, 581–583. [Google Scholar] [CrossRef]
- Quast, C.; Pruesse, E.; Yilmaz, P.; Gerken, J.; Schweer, T.; Yarza, P.; Peplies, J.; Glöckner, F.O. The SILVA ribosomal RNA gene database project: Improved data processing and web-based tools. Nucleic Acids Res. 2012, 41, D590–D596. [Google Scholar] [CrossRef]
- McMurdie, P.J.; Holmes, S. phyloseq: An R Package for Reproducible Interactive Analysis and Graphics of Microbiome Census Data. PLoS ONE 2013, 8, e61217. [Google Scholar] [CrossRef] [PubMed]
- Lahti, L. Microbiome R package. 2019.
- Mallick, H.; Rahnavard, A.; McIver, L.J.; Ma, S.; Zhang, Y.; Nguyen, L.H.; Tickle, T.L.; Weingart, G.; Ren, B.; Schwager, E.H.; et al. Multivariable association discovery in population-scale meta-omics studies. PLOS Comput. Biol. 2021, 17, e1009442. [Google Scholar] [CrossRef] [PubMed]
- Maechler, M.; Rousseeuw, P.; Struyf, A.; Hubert, M.; Hornik, K. Cluster: Cluster Analysis Basics and Extensions. 2023.
- Oksanen, J.; Blanchet, F.; Friendly, M.; Kindt, R.; Legendre, P.; McGlinn, D. vegan: Community Ecology Package.
- Ullmann, T.; Peschel, S.; Finger, P.; Müller, C.L.; Boulesteix, A.-L. Over-optimism in unsupervised microbiome analysis: Insights from network learning and clustering. PLOS Comput. Biol. 2023, 19, e1010820. [Google Scholar] [CrossRef] [PubMed]
- Peschel, S.; Müller, C.L.; Von Mutius, E.; Boulesteix, A.-L.; Depner, M. NetCoMi: Network construction and comparison for microbiome data in R. Brief. Bioinform. 2021, 22, bbaa290. [Google Scholar] [CrossRef]
- Yoon, G.; Gaynanova, I.; Müller, C.L. Microbial Networks in SPRING - Semi-parametric Rank-Based Correlation and Partial Correlation Estimation for Quantitative Microbiome Data. Front. Genet. 2019, 10, 516. [Google Scholar] [CrossRef]
- Bastian, M.; Heymman, S.; Jacomy, M. Gephi: An open source software for exploring and manipulating networks. 2009.
- Andrews, S. FastQC: A quality control tool for high throughput sequence data 2010.
- Langmead, B.; Salzberg, S.L. Fast gapped-read alignment with Bowtie 2. Nat. Methods 2012, 9, 357–359. [Google Scholar] [CrossRef]
- Blanco-Míguez, A.; Beghini, F.; Cumbo, F.; McIver, L.J.; Thompson, K.N.; Zolfo, M.; Manghi, P.; Dubois, L.; Huang, K.D.; Thomas, A.M.; et al. Extending and improving metagenomic taxonomic profiling with uncharacterized species using MetaPhlAn 4. Nat. Biotechnol. 2023, 41, 1633–1644. [Google Scholar] [CrossRef]
- Li, D.; Liu, C.-M.; Luo, R.; Sadakane, K.; Lam, T.-W. MEGAHIT: An ultra-fast single-node solution for large and complex metagenomics assembly via succinct de Bruijn graph. Bioinformatics 2015, 31, 1674–1676. [Google Scholar] [CrossRef]
- Hyatt, D.; Chen, G.-L.; LoCascio, P.F.; Land, M.L.; Larimer, F.W.; Hauser, L.J. Prodigal: Prokaryotic gene recognition and translation initiation site identification. BMC Bioinformatics 2010, 11, 119. [Google Scholar] [CrossRef]
- Fu, L.; Niu, B.; Zhu, Z.; Wu, S.; Li, W. CD-HIT: Accelerated for clustering the next-generation sequencing data. Bioinformatics 2012, 28, 3150–3152. [Google Scholar] [CrossRef]
- Li, H.; Handsaker, B.; Wysoker, A.; Fennell, T.; Ruan, J.; Homer, N.; Marth, G.; Abecasis, G.; Durbin, R.; 1000 Genome Project Data Processing Subgroup. The Sequence Alignment/Map format and SAMtools. Bioinformatics 2009, 25, 2078–2079. [Google Scholar] [CrossRef]
- Alcock, B.P.; Huynh, W.; Chalil, R.; Smith, K.W.; Raphenya, A.R.; Wlodarski, M.A.; Edalatmand, A.; Petkau, A.; Syed, S.A.; Tsang, K.K.; et al. CARD 2023: Expanded curation, support for machine learning, and resistome prediction at the Comprehensive Antibiotic Resistance Database. Nucleic Acids Res. 2023, 51, D690–D699. [Google Scholar] [CrossRef]
- Kaminski, J.; Gibson, M.K.; Franzosa, E.A.; Segata, N.; Dantas, G.; Huttenhower, C. High-Specificity Targeted Functional Profiling in Microbial Communities with ShortBRED. PLOS Comput. Biol. 2015, 11, e1004557. [Google Scholar] [CrossRef] [PubMed]
- Pärnänen, K.; Karkman, A.; Hultman, J.; Lyra, C.; Bengtsson-Palme, J.; Larsson, D.G.J.; Rautava, S.; Isolauri, E.; Salminen, S.; Kumar, H.; et al. Maternal gut and breast milk microbiota affect infant gut antibiotic resistome and mobile genetic elements. Nat. Commun. 2018, 9, 3891. [Google Scholar] [CrossRef] [PubMed]
- Beghini, F.; McIver, L.J.; Blanco-Míguez, A.; Dubois, L.; Asnicar, F.; Maharjan, S.; Mailyan, A.; Manghi, P.; Scholz, M.; Thomas, A.M.; et al. Integrating taxonomic, functional, and strain-level profiling of diverse microbial communities with bioBakery 3. eLife 2021, 10, e65088. [Google Scholar] [CrossRef] [PubMed]
- Love, M.I.; Huber, W.; Anders, S. Moderated estimation of fold change and dispersion for RNA-seq data with DESeq2. Genome Biol. 2014, 15, 550. [Google Scholar] [CrossRef]
- Brooks, M., E.; Kristensen, K.; Benthem, K., J.; Magnusson, A.; Berg, C., W.; Nielsen, A.; Skaug, H., J.; Mächler, M.; Bolker, B., M. glmmTMB Balances Speed and Flexibility Among Packages for Zero-inflated Generalized Linear Mixed Modeling. R J. 2017, 9, 378. [Google Scholar] [CrossRef]
- Lenth, R. emmeans: Estimated marginal means, aka least-squares means 2024.
- Anderson, M.J.; Walsh, D.C.I. PERMANOVA, ANOSIM, and the Mantel test in the face of heterogeneous dispersions: What null hypothesis are you testing? Ecol. Monogr. 2013, 83, 557–574. [Google Scholar] [CrossRef]
- Martinez Arbizu, P. pairwiseAdonis: Pairwise multilevel comparison using adonis 2020.
- Bäckhed, F.; Roswall, J.; Peng, Y.; Feng, Q.; Jia, H.; Kovatcheva-Datchary, P.; Li, Y.; Xia, Y.; Xie, H.; Zhong, H.; et al. Dynamics and Stabilization of the Human Gut Microbiome during the First Year of Life. Cell Host Microbe 2015, 17, 690–703. [Google Scholar] [CrossRef]
- Hill, C.J.; Lynch, D.B.; Murphy, K.; Ulaszewska, M.; Jeffery, I.B.; O’Shea, C.A.; Watkins, C.; Dempsey, E.; Mattivi, F.; Tuohy, K.; et al. Evolution of gut microbiota composition from birth to 24 weeks in the INFANTMET Cohort. Microbiome 2017, 5, 4. [Google Scholar] [CrossRef]
- Laursen, M.F.; Andersen, L.B.B.; Michaelsen, K.F.; Mølgaard, C.; Trolle, E.; Bahl, M.I.; Licht, T.R. Infant Gut Microbiota Development Is Driven by Transition to Family Foods Independent of Maternal Obesity. mSphere 2016, 1, e00069-15. [Google Scholar] [CrossRef] [PubMed]
- Hoskinson, C.; Dai, D.L.Y.; Del Bel, K.L.; Becker, A.B.; Moraes, T.J.; Mandhane, P.J.; Finlay, B.B.; Simons, E.; Kozyrskyj, A.L.; Azad, M.B.; et al. Delayed gut microbiota maturation in the first year of life is a hallmark of pediatric allergic disease. Nat. Commun. 2023, 14, 4785. [Google Scholar] [CrossRef] [PubMed]
- Henrick, B.M.; Rodriguez, L.; Lakshmikanth, T.; Pou, C.; Henckel, E.; Arzoomand, A.; Olin, A.; Wang, J.; Mikes, J.; Tan, Z.; et al. Bifidobacteria-mediated immune system imprinting early in life. Cell 2021, 184, 3884–3898.e11. [Google Scholar] [CrossRef] [PubMed]
- Rivière, A.; Selak, M.; Lantin, D.; Leroy, F.; De Vuyst, L. Bifidobacteria and Butyrate-Producing Colon Bacteria: Importance and Strategies for Their Stimulation in the Human Gut. Front. Microbiol. 2016, 7. [Google Scholar] [CrossRef]
- Berni Canani, R.; Paparo, L.; Nocerino, R.; Di Scala, C.; Della Gatta, G.; Maddalena, Y.; Buono, A.; Bruno, C.; Voto, L.; Ercolini, D. Gut Microbiome as Target for Innovative Strategies Against Food Allergy. Front. Immunol. 2019, 10. [Google Scholar] [CrossRef]
- Di Costanzo, M.; De Paulis, N.; Biasucci, G. Butyrate: A Link between Early Life Nutrition and Gut Microbiome in the Development of Food Allergy. Life 2021, 11, 384. [Google Scholar] [CrossRef]
- Tang, H.; Huang, W.; Yao, Y.-F. The metabolites of lactic acid bacteria: Classification, biosynthesis and modulation of gut microbiota. Microb. Cell 2023, 10, 49. [Google Scholar] [CrossRef]
- Mills, L.S.; Doak, D.F. The Keystone-Species Concept in Ecology and Conservation. BioScience 1993, 43, 219–224. [Google Scholar] [CrossRef]
- Leo, S.; Curtis, N.; Zimmermann, P. The neonatal intestinal resistome and factors that influence it—A systematic review. Clin. Microbiol. Infect. 2022, 28, 1539–1546. [Google Scholar] [CrossRef]
- Jokela, R.; Pärnänen, K.M.; Ponsero, A.J.; Lahti, L.; Kolho, K.-L.; De Vos, W.M.; Salonen, A. A cohort study in family triads: Impact of gut microbiota composition and early life exposures on intestinal resistome during the first two years of life. Gut Microbes 2024, 16, 2383746. [Google Scholar] [CrossRef]
- Patangia, D.V.; Grimaud, G.; Wang, S.; Ross, R.P.; Stanton, C. Influence of age, socioeconomic status, and location on the infant gut resistome across populations. Gut Microbes 2024, 16, 2297837. [Google Scholar] [CrossRef]
- Casaburi, G.; Duar, R.M.; Vance, D.P.; Mitchell, R.; Contreras, L.; Frese, S.A.; Smilowitz, J.T.; Underwood, M.A. Early-life gut microbiome modulation reduces the abundance of antibiotic-resistant bacteria. Antimicrob. Resist. Infect. Control 2019, 8, 131. [Google Scholar] [CrossRef]
- Tauzin, M.; Ouldali, N.; Béchet, S.; Caeymaex, L.; Cohen, R. Pharmacokinetic and pharmacodynamic considerations of cephalosporin use in children. Expert Opin. Drug Metab. Toxicol. 2019, 15, 869–880. [Google Scholar] [CrossRef] [PubMed]
- Milani, C.; Lugli, G.A.; Duranti, S.; Turroni, F.; Mancabelli, L.; Ferrario, C.; Mangifesta, M.; Hevia, A.; Viappiani, A.; Scholz, M.; et al. Bifidobacteria exhibit social behavior through carbohydrate resource sharing in the gut. Sci. Rep. 2015, 5, 15782. [Google Scholar] [CrossRef] [PubMed]
- Xi, M.; Tang, H.; Zhang, Y.; Ge, W.; Chen, Y.; Cui, X. Microbiome-metabolomic analyses of the impacts of dietary stachyose on fecal microbiota and metabolites in infants intestinal microbiota-associated mice. J. Sci. Food Agric. 2021, 101, 3336–3347. [Google Scholar] [CrossRef] [PubMed]
- Liu, G.; Bei, J.; Liang, L.; Yu, G.; Li, L.; Li, Q. Stachyose Improves Inflammation through Modulating Gut Microbiota of High-Fat Diet/Streptozotocin-Induced Type 2 Diabetes in Rats. Mol. Nutr. Food Res. 2018, 62, 1700954. [Google Scholar] [CrossRef]
- Li, T.; Lu, X.; Yang, X. Stachyose-enriched α-galacto-oligosaccharides regulate gut microbiota and relieve constipation in mice. J. Agric. Food Chem. 2013, 61, 11825–11831. [Google Scholar] [CrossRef]
- Wolf, A.J.; Underhill, D.M. Peptidoglycan recognition by the innate immune system. Nat. Rev. Immunol. 2018, 18, 243–254. [Google Scholar] [CrossRef]
- Abbaslou, Y.; Mahjoubi, E.; Ahmadi, F.; Farokhzad, M.R.; Zahmatkesh, D.; Yazdi, M.H.; Beiranvand, H. Short communication: Performance of Holstein calves fed high-solid milk with or without nucleotide. J. Dairy Sci. 2020, 103, 11490–11495. [Google Scholar] [CrossRef]
- Gao, L.; Xie, C.; Liang, X.; Li, Z.; Li, B.; Wu, X.; Yin, Y. Yeast-based nucleotide supplementation in mother sows modifies the intestinal barrier function and immune response of neonatal pigs. Anim. Nutr. Zhongguo Xu Mu Shou Yi Xue Hui 2021, 7, 84–93. [Google Scholar] [CrossRef]
- Qu, Z.; Tian, P.; Zhao, J.; Wang, G.; Chen, W. Feeding the microbiota–gut–brain axis: Nucleotides and their role in early life. Food Front. 2023, 4, 1164–1178. [Google Scholar] [CrossRef]
- Karl, J.P.; Meydani, M.; Barnett, J.B.; Vanegas, S.M.; Barger, K.; Fu, X.; Goldin, B.; Kane, A.; Rasmussen, H.; Vangay, P.; et al. Fecal concentrations of bacterially derived vitamin K forms are associated with gut microbiota composition but not plasma or fecal cytokine concentrations in healthy adults1234. Am. J. Clin. Nutr. 2017, 106, 1052–1061. [Google Scholar] [CrossRef] [PubMed]
- He, W.; Russel, J.; Klincke, F.; Nesme, J.; Sørensen, S.J. Insights into the ecology of the infant gut plasmidome. Nat. Commun. 2024, 15, 6924. [Google Scholar] [CrossRef] [PubMed]
Figure 1.
Viable Organisms Data are presented as log10 CFU/g dry weight and represent mean ± SEM (sample/infant numbers in supplementary). Statistically significant differences between groups at each time point are indicated by asterisks (* p ≤ 0.05, ** p ≤ 0.01, *** p ≤ 0.001). Significant differences between time points within a group are indicated by hashtags (# p ≤ 0.05, ## p ≤ 0.01, ### p ≤ 0.001).
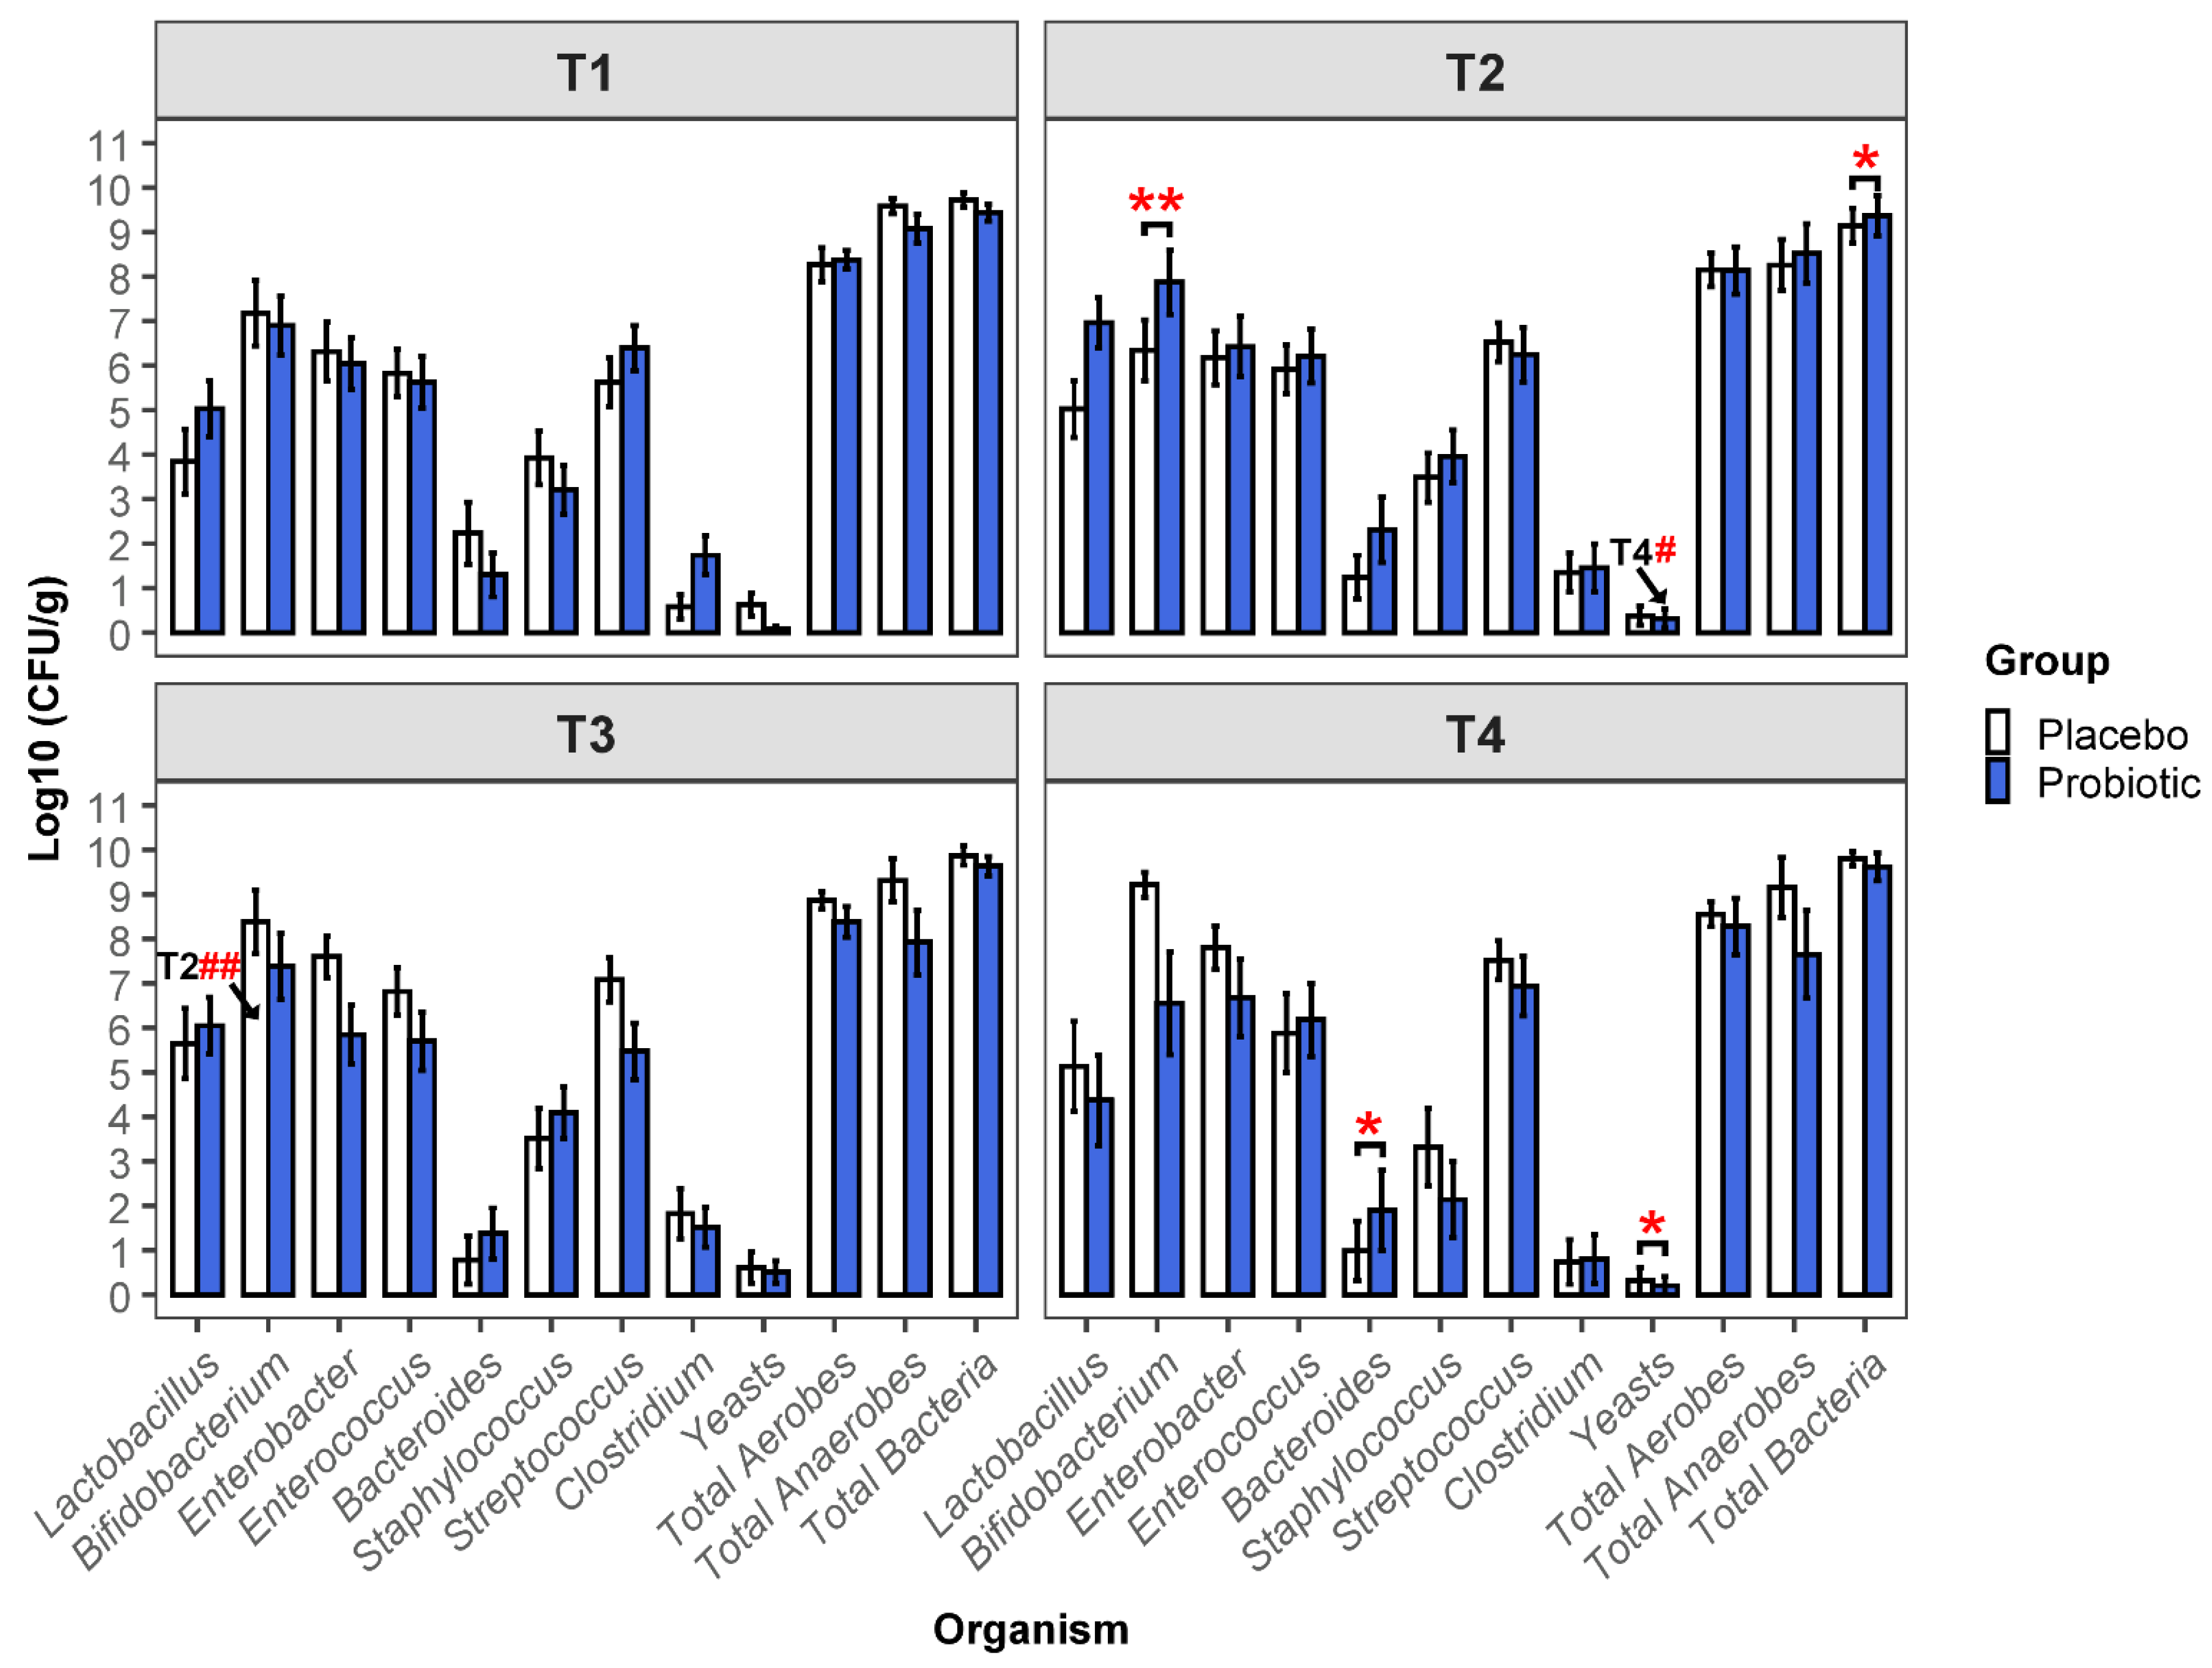
Figure 2.
Comparison of Bacterial Family and Genus Abundance (A) Donut plots represent the median relative abundance of the 10 most abundant bacterial families, with all remaining families are aggregated as 'Other.' Statistically significant differences between groups at each time point are indicated by asterisks (* p ≤ 0.05, ** p ≤ 0.01, *** p ≤ 0.001). Significant differences between time points within a group are indicated by hashtags (# p ≤ 0.05, ## p ≤ 0.01, ### p ≤ 0.001). (B) Bacterial genera found to be significantly differentially abundant in the probiotic group relative to the placebo group.
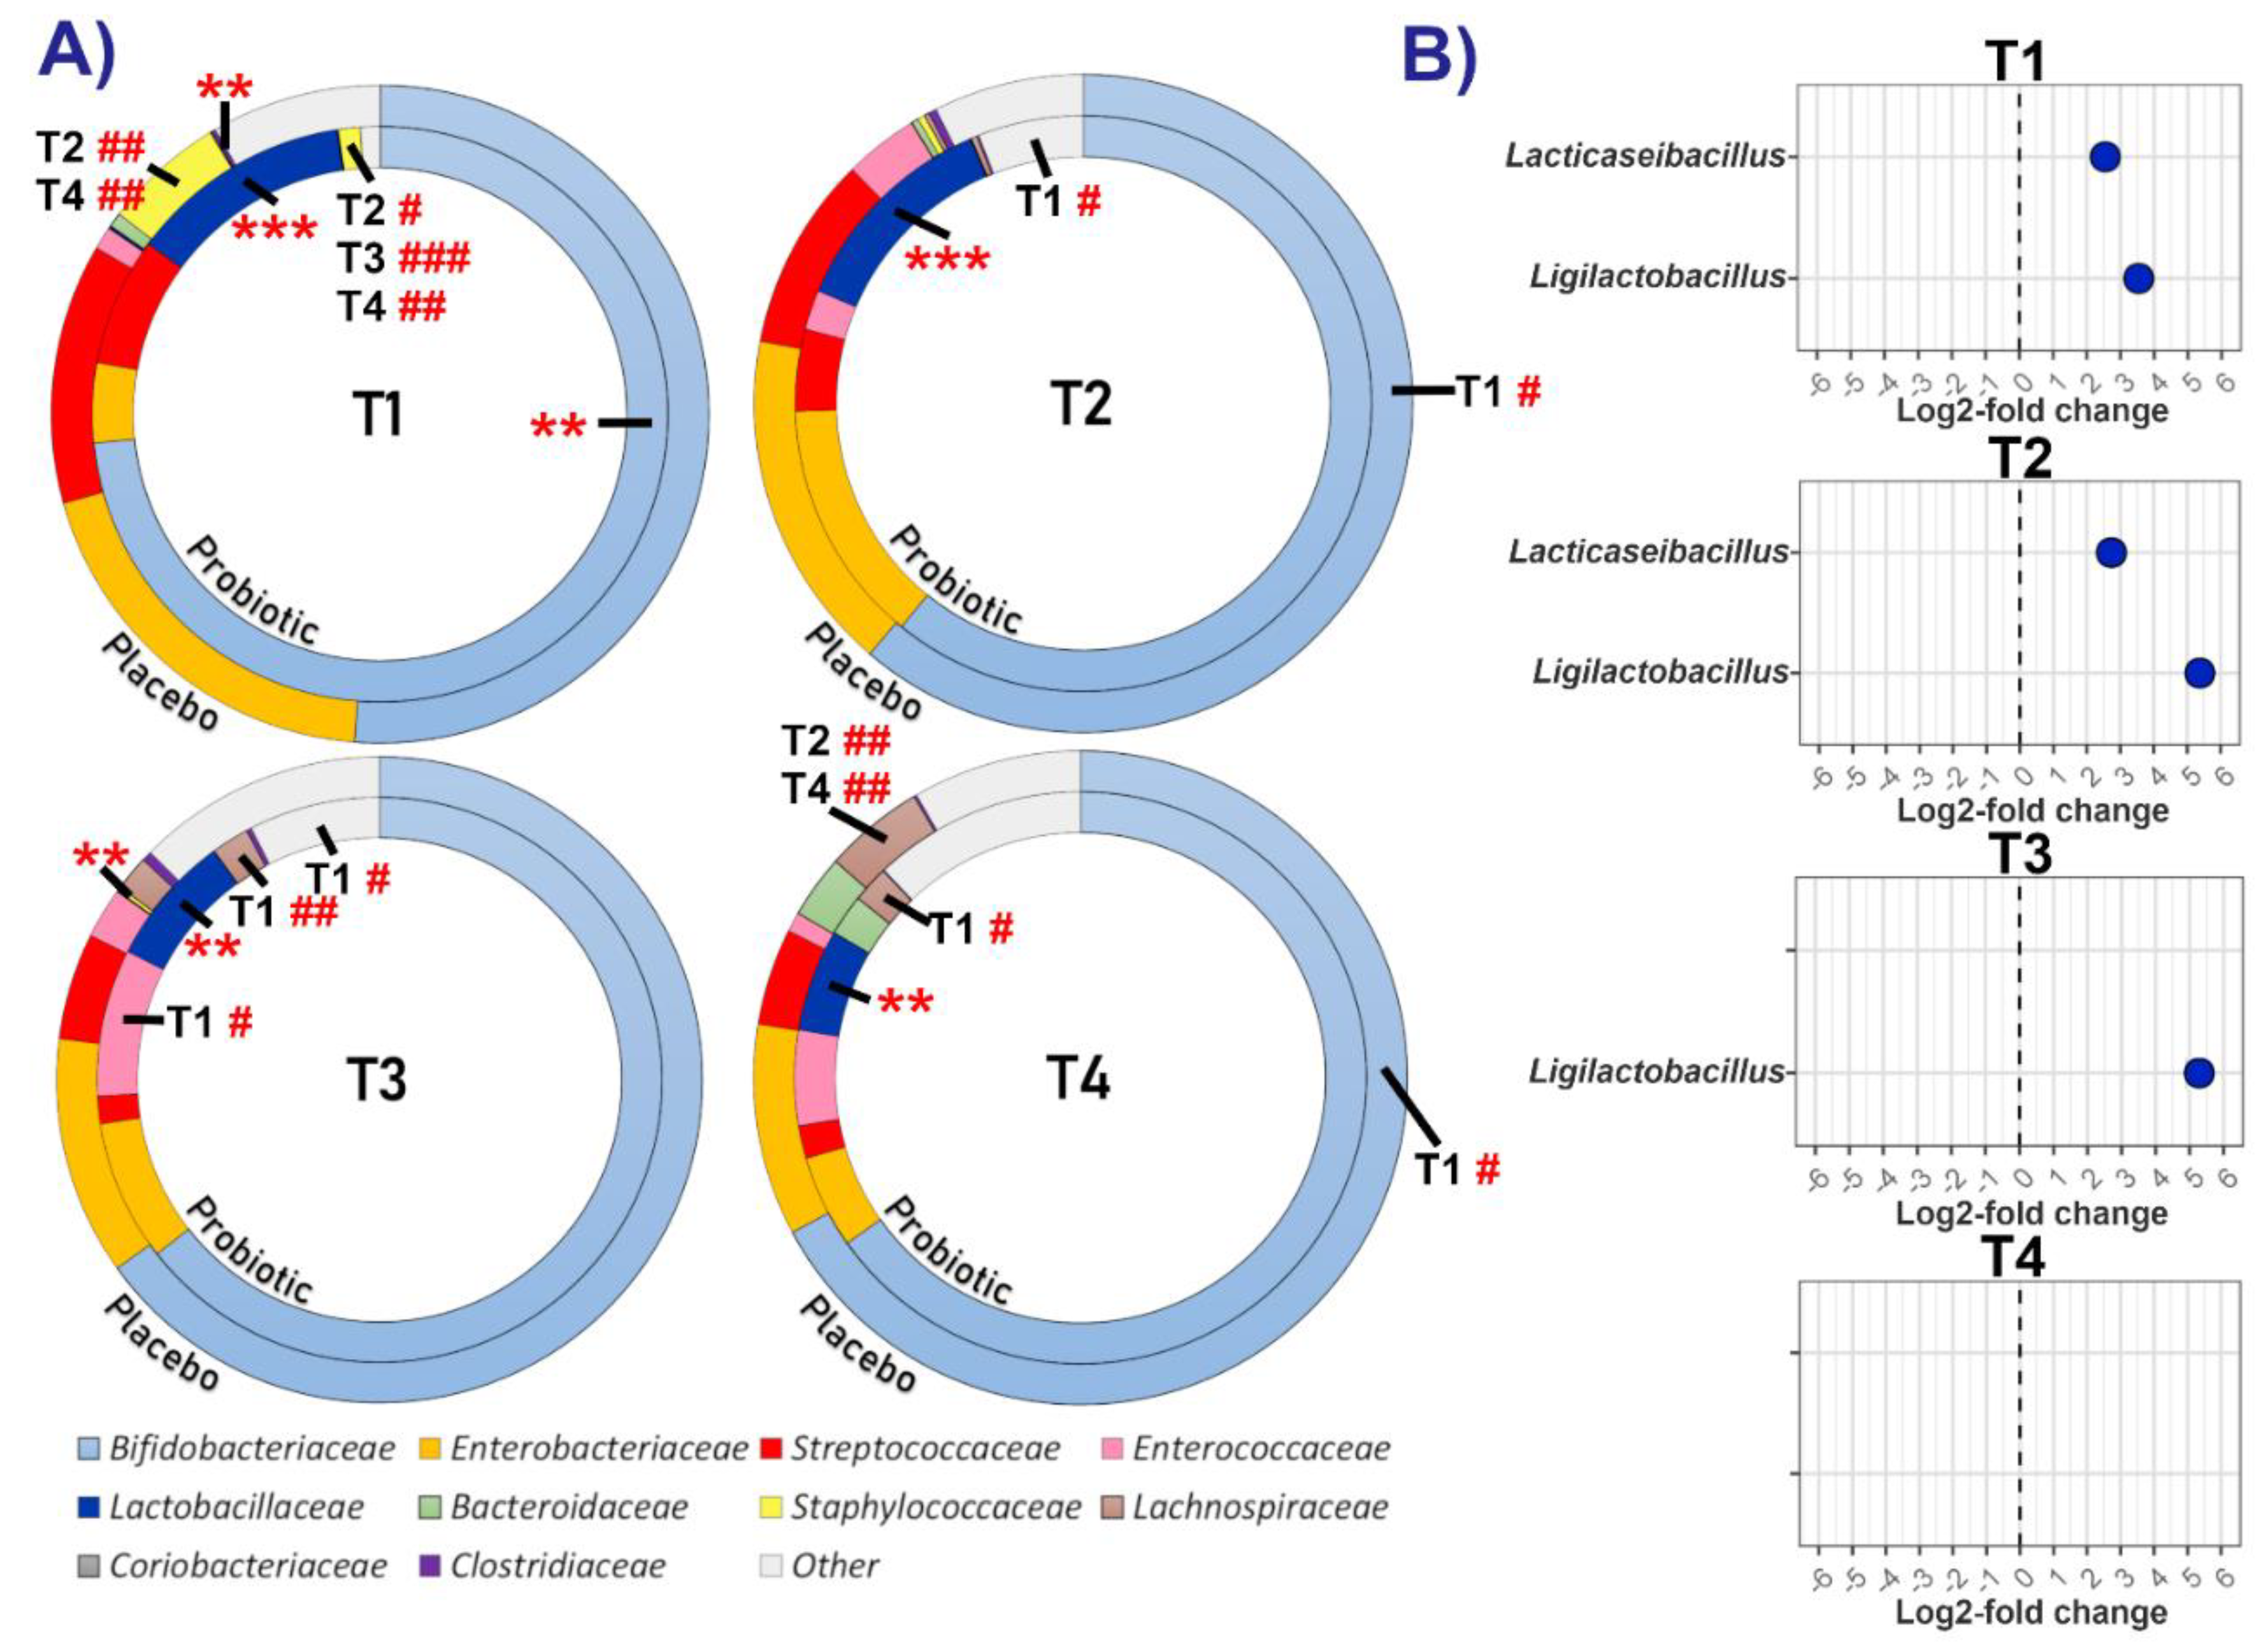
Figure 3.
Alpha Diversity points represent individual faecal samples. (A) Shannon and (B) Simpson alpha diversity indices. Values of p: *p ≤ 0.05, **p ≤ 0.01, ***p ≤ 0.001.
Figure 3.
Alpha Diversity points represent individual faecal samples. (A) Shannon and (B) Simpson alpha diversity indices. Values of p: *p ≤ 0.05, **p ≤ 0.01, ***p ≤ 0.001.
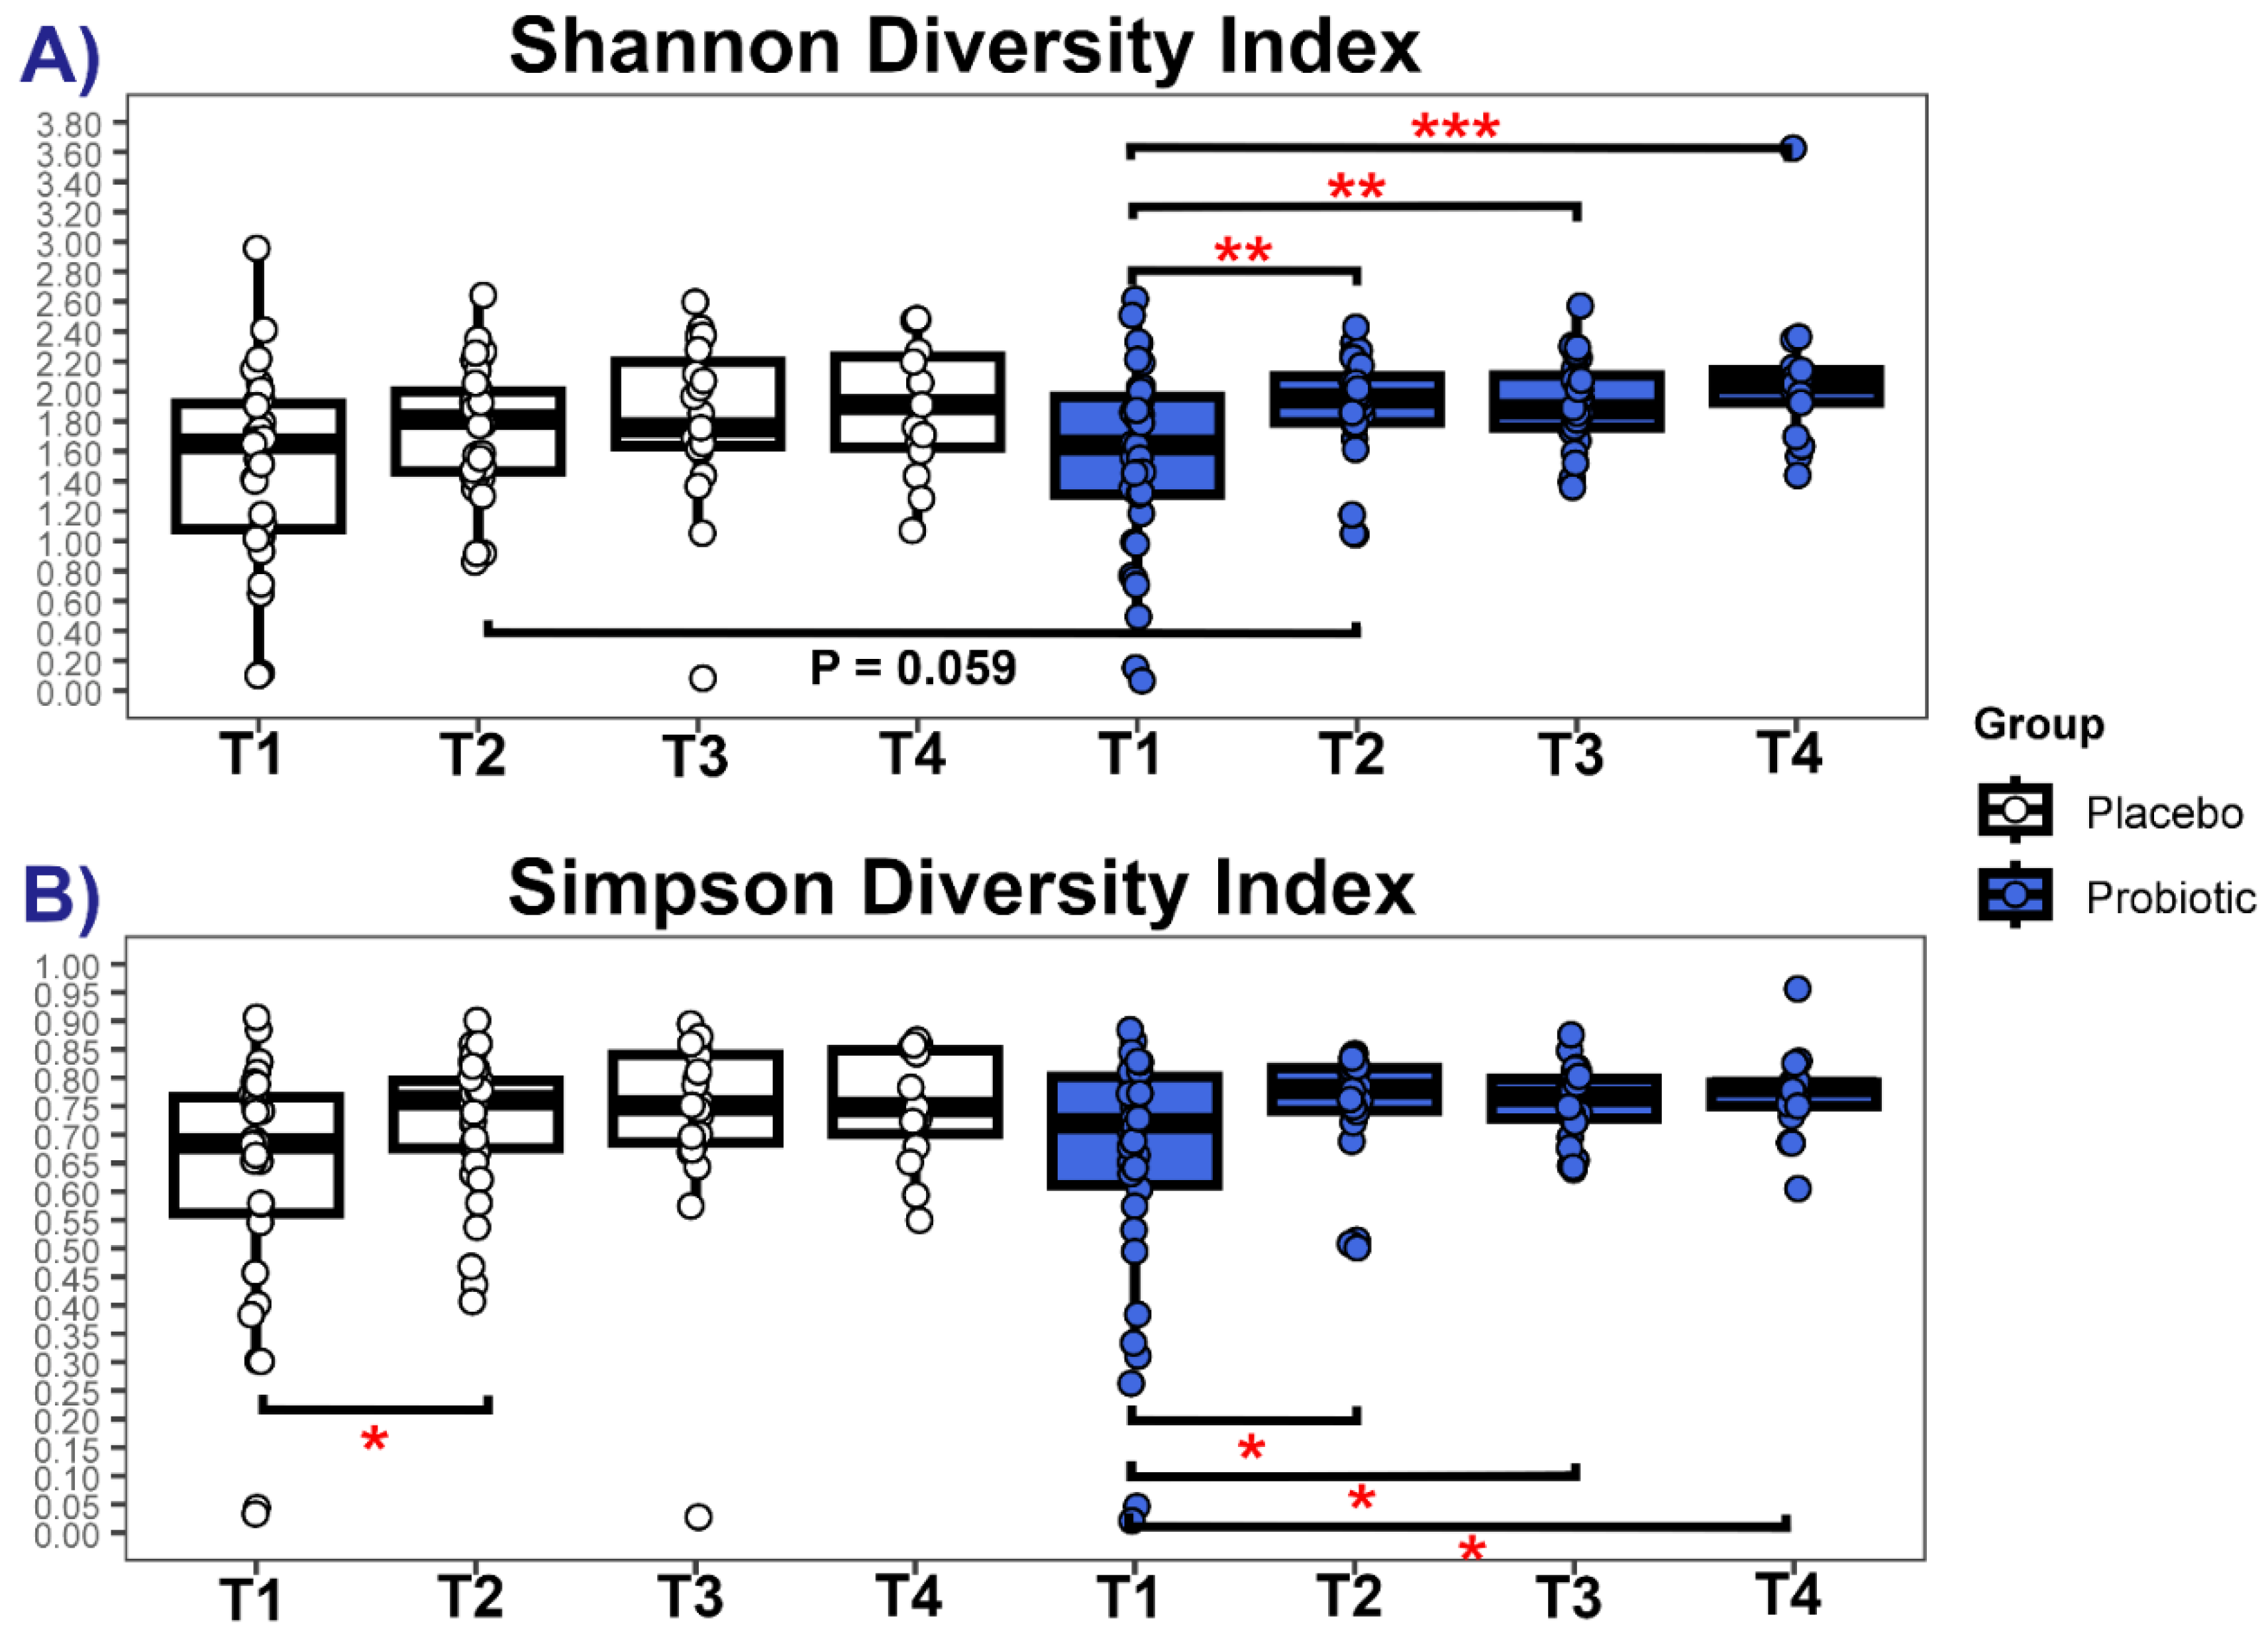
Figure 4.
Beta Diversity points represent individual faecal samples, ellipses indicate 95% confidence intervals around centroids. CC (community composition) is a test of differences in ordination space of group/time point centroids, CD (community dispersion) is a test of the variance of sample dispersion around the group/time point centroid. (A) Comparison of beta diversity between groups at each time point, (B) values of community dispersion within groups at each time point, (C) comparison of beta diversity at each time point within groups. Values of p: *p ≤ 0.05, **p ≤ 0.01, ***p ≤ 0.001.
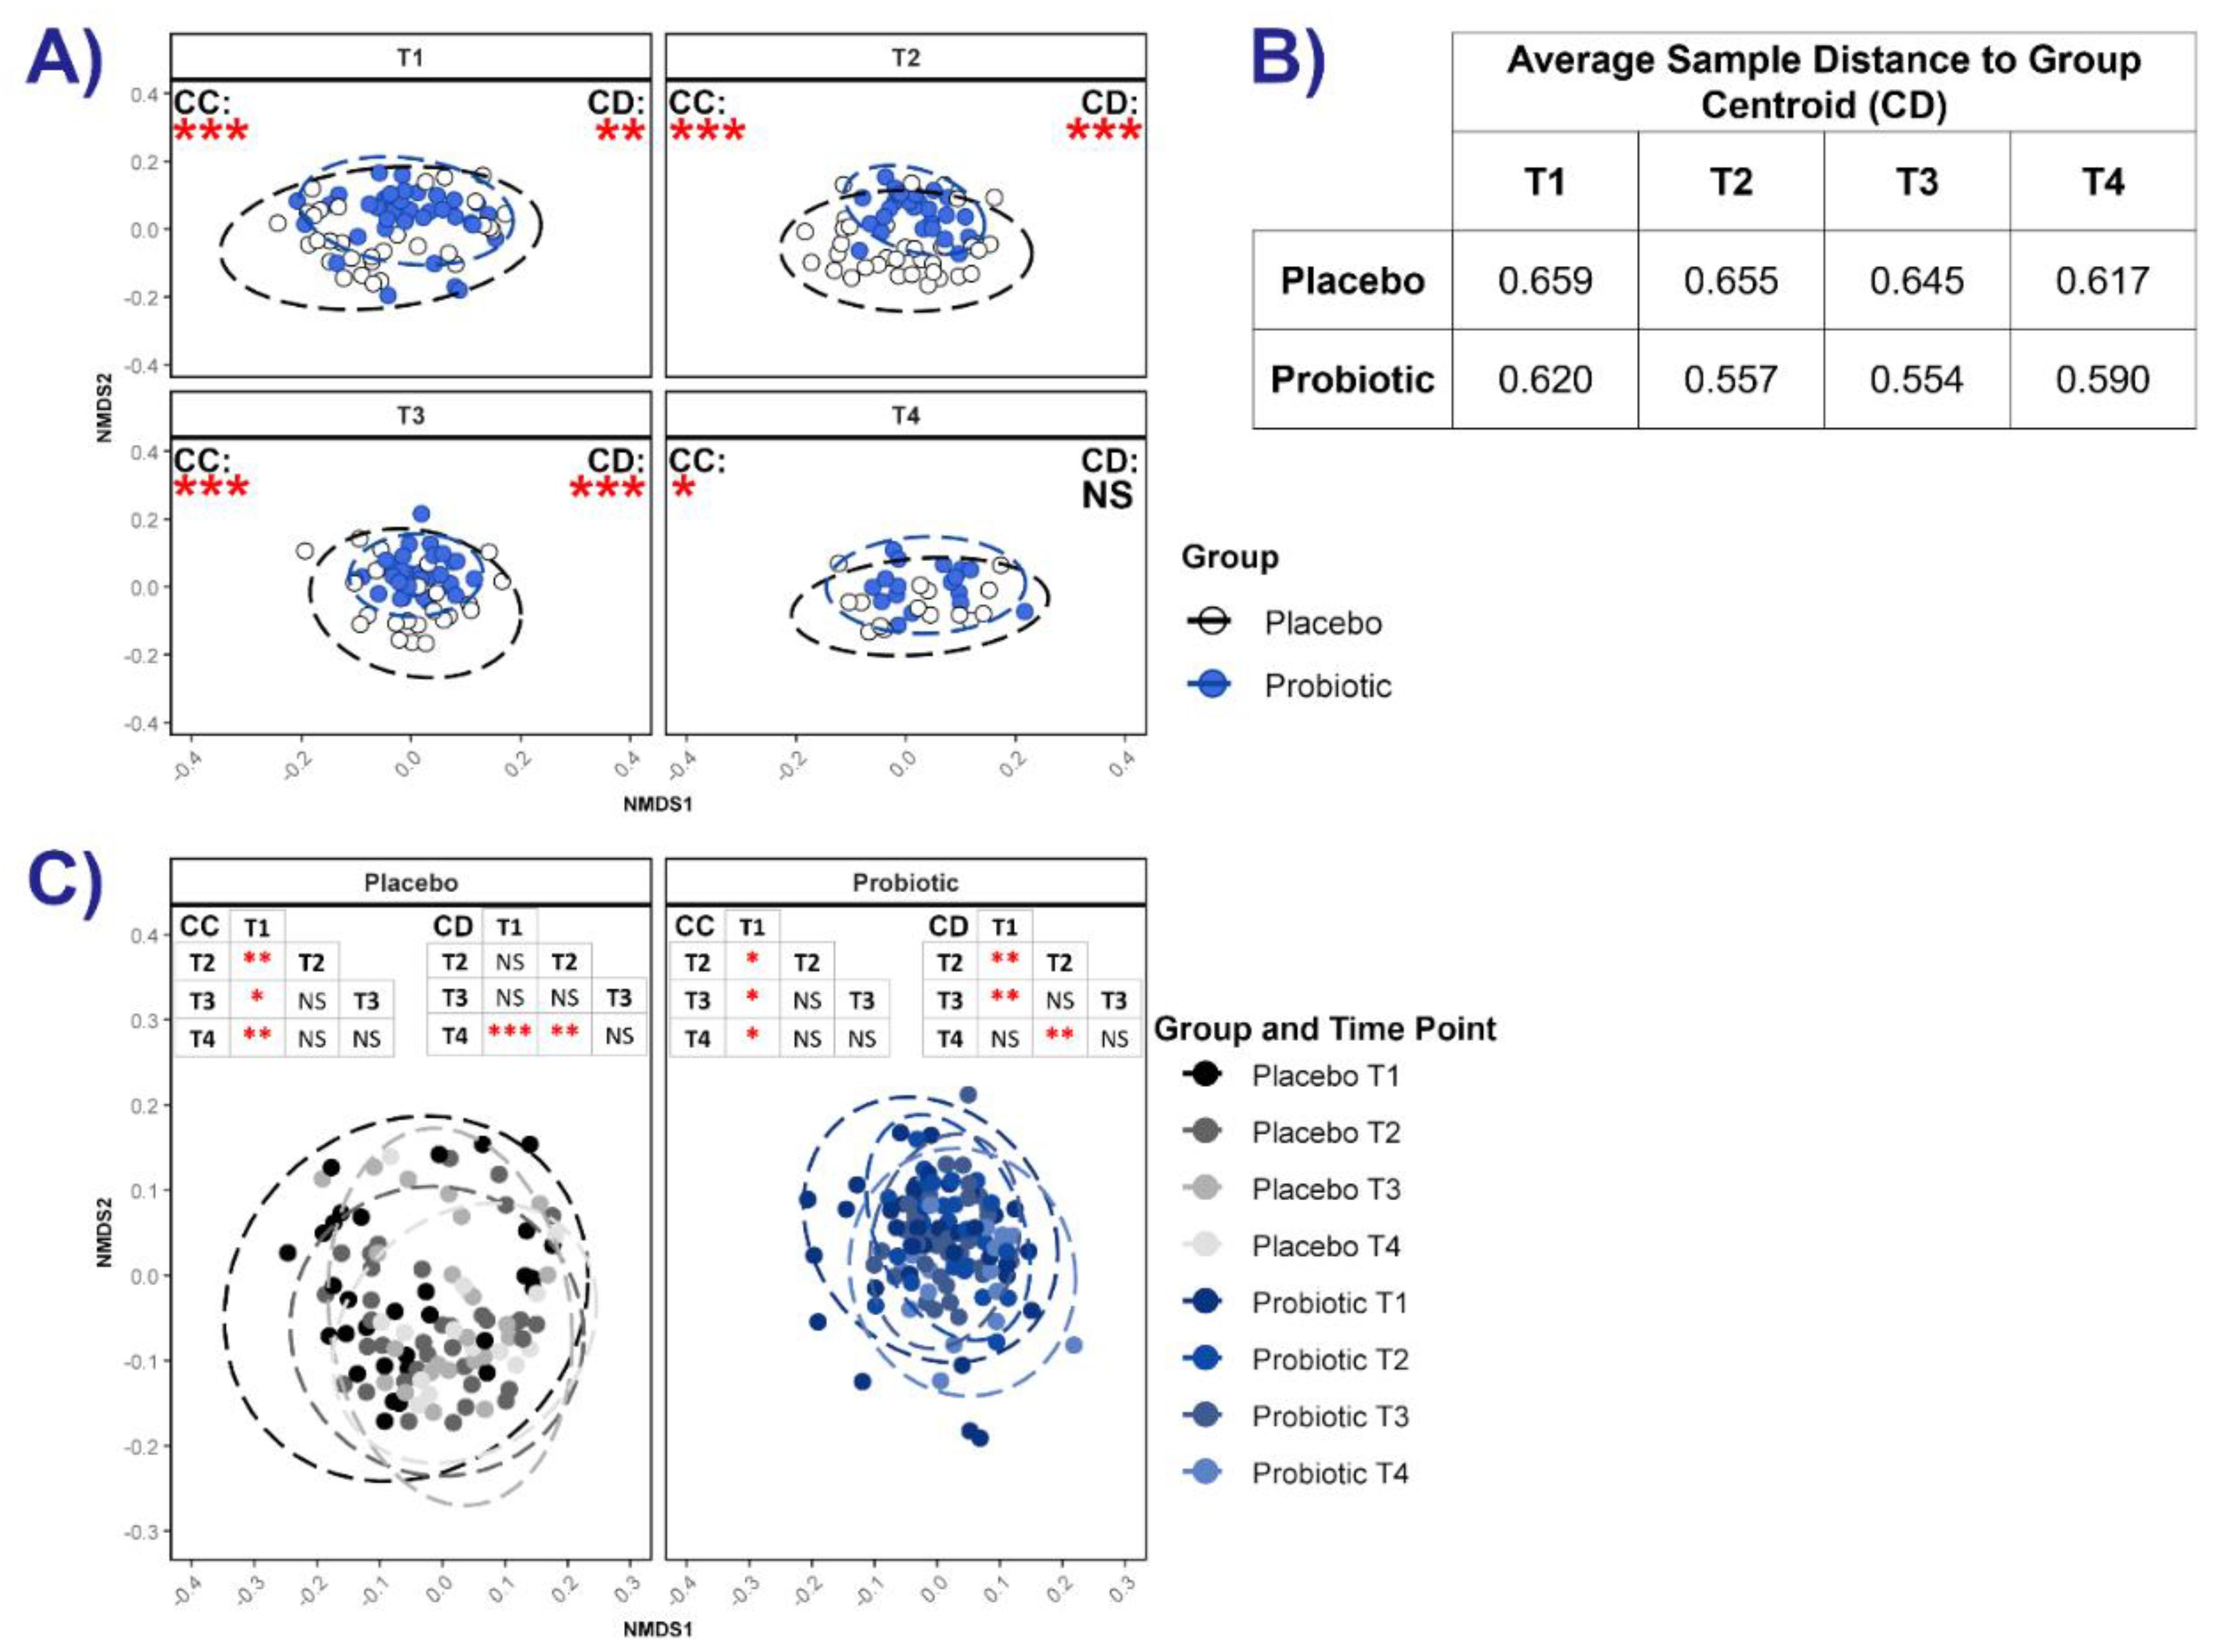
Figure 5.
Community State Type (CST) Analysis at Time Point 1 (A) Ordination plot of faecal microbiotas, showing samples coloured by CST with ellipses representing the 95% confidence interval around CST medoids. Vectors indicate significant environmental variables (p < 0.05), with length proportional to effect size. (B) Genera driving the ordination; colours indicate the CST where each genus dominates. Asterisks (*) denote significant variance explained (BH-adjusted p < 0.05). C) Relative abundance (%) of significant genera for each CST.
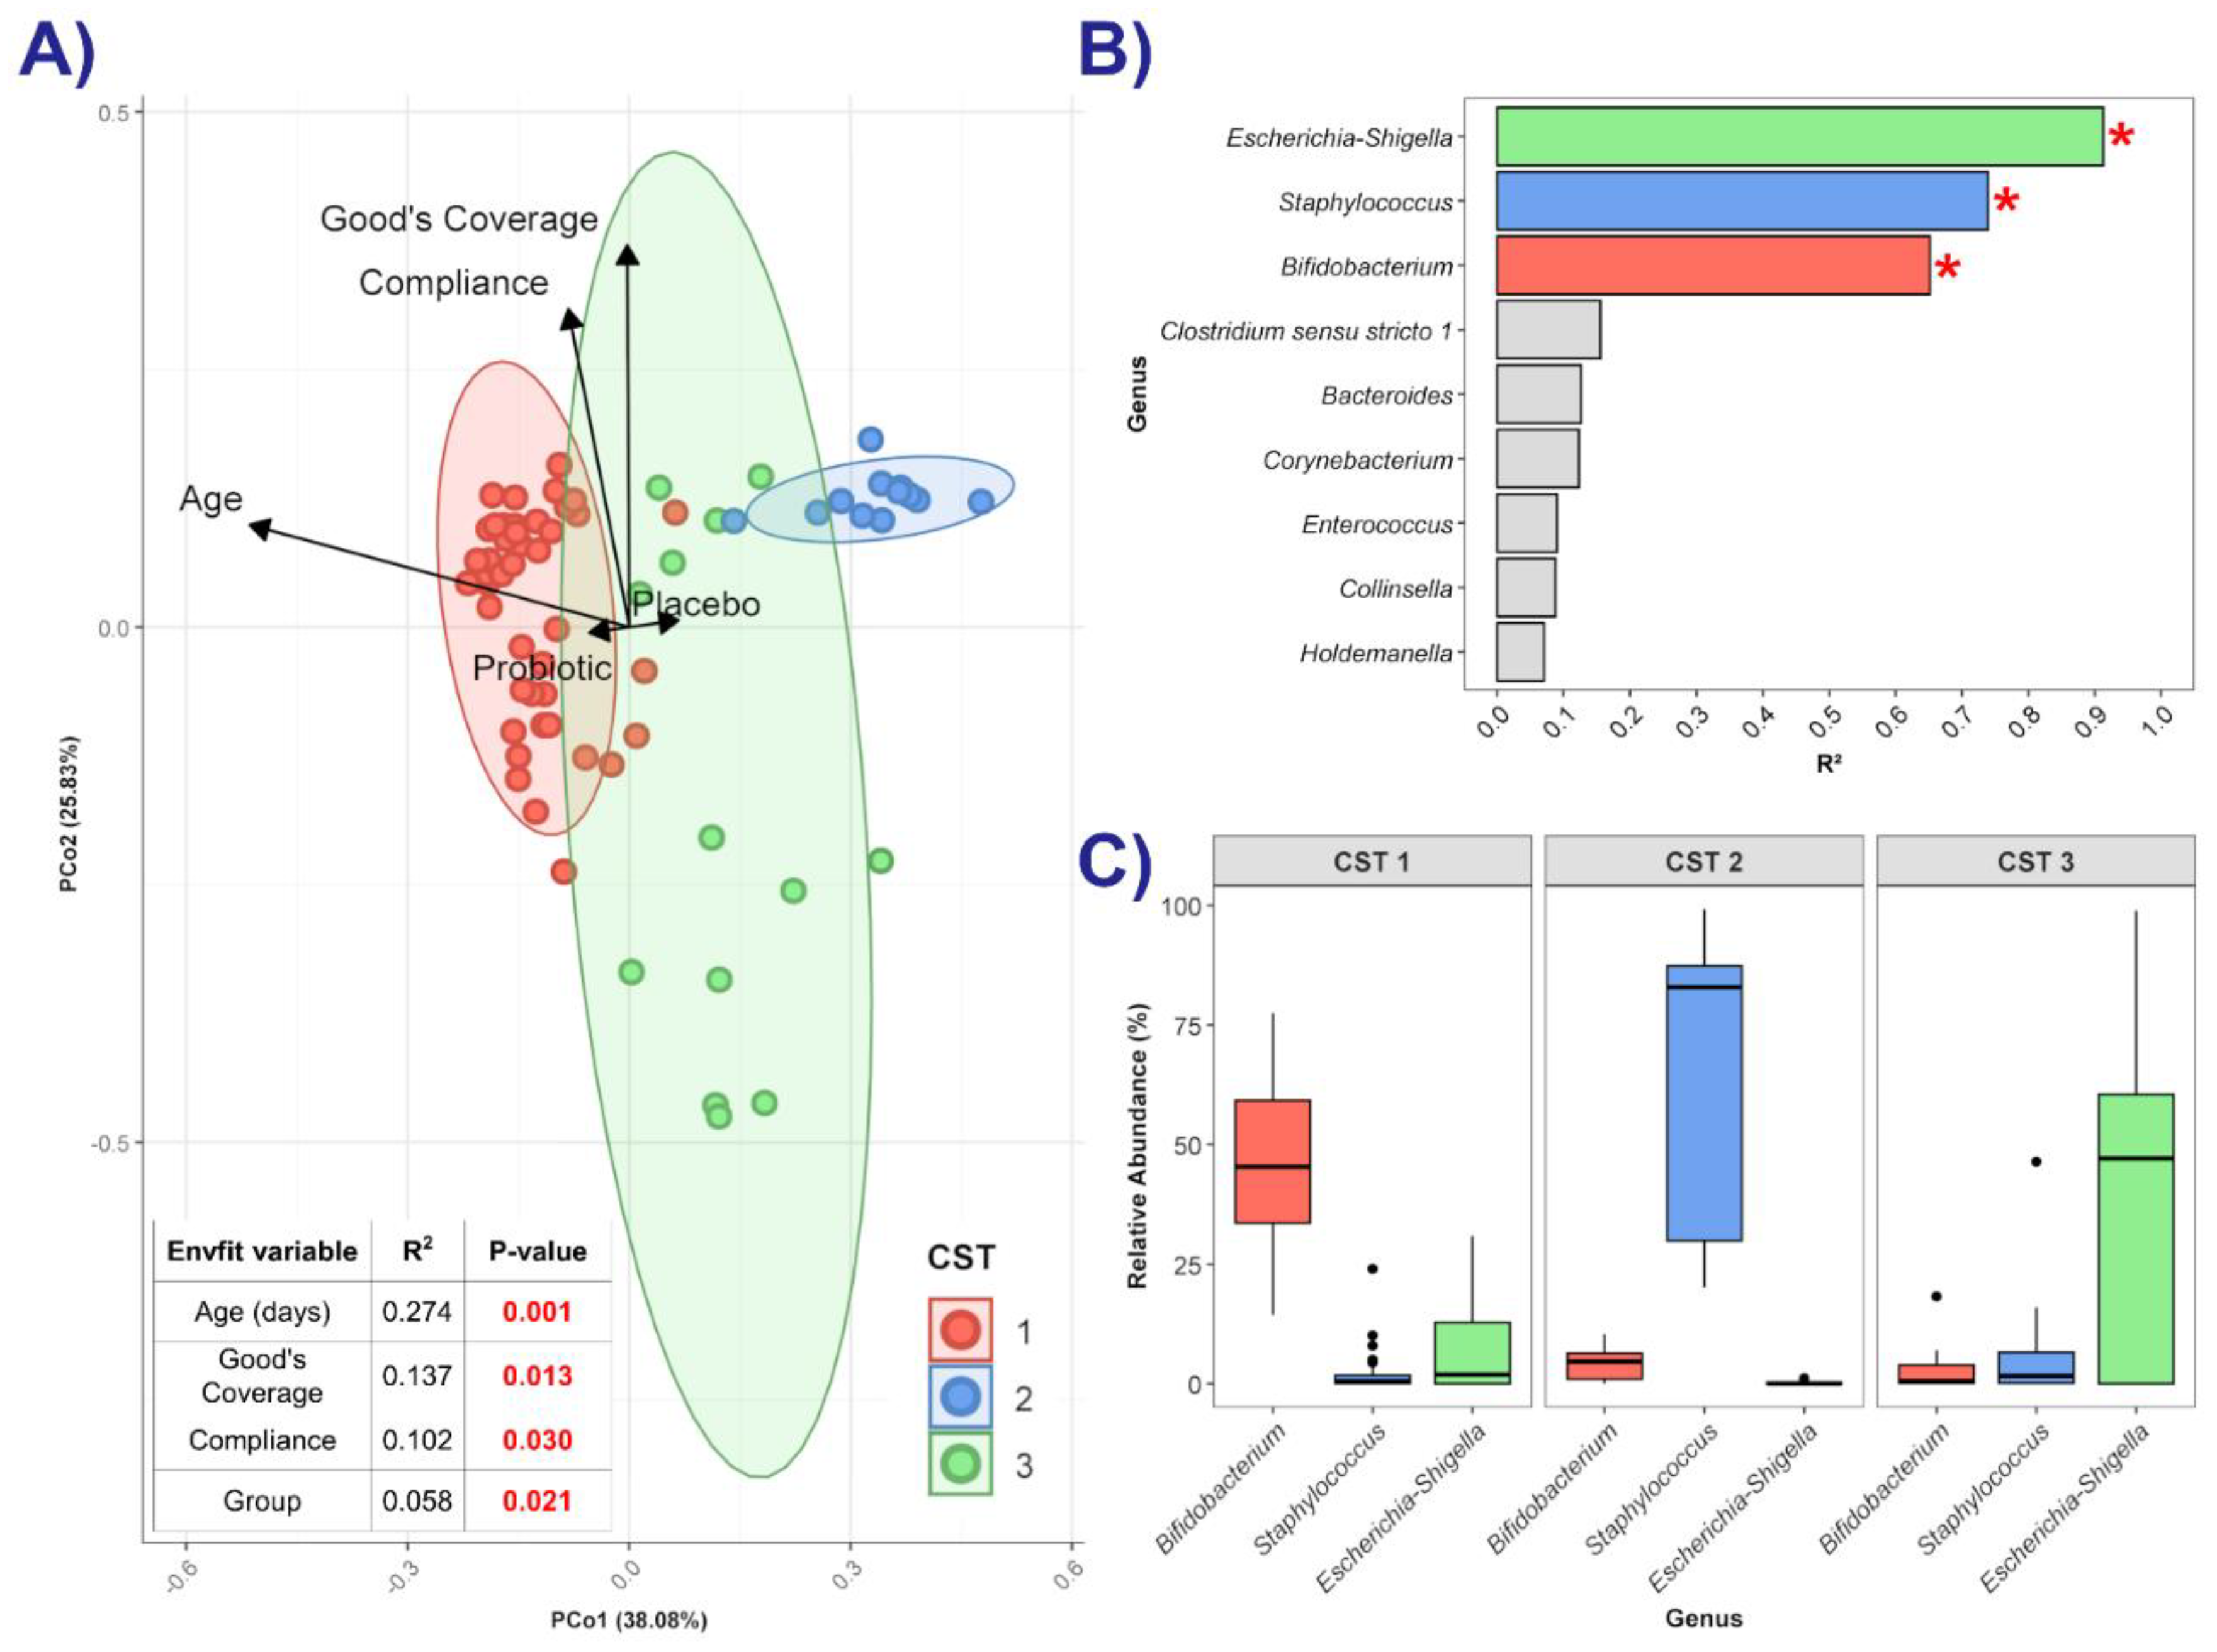
Figure 6.
Genus Level Bacterial Networks nodes represent bacterial genera coloured by family taxonomy and sized proportionally to their “hub score”. Green and red edges represent mutualistic and antagonistic relationships, respectively, between nodes. The strength of the relationship is proportional to the thickness of the edge. The bacterial genera that form part of the probiotic consortium are indicated with arrows.
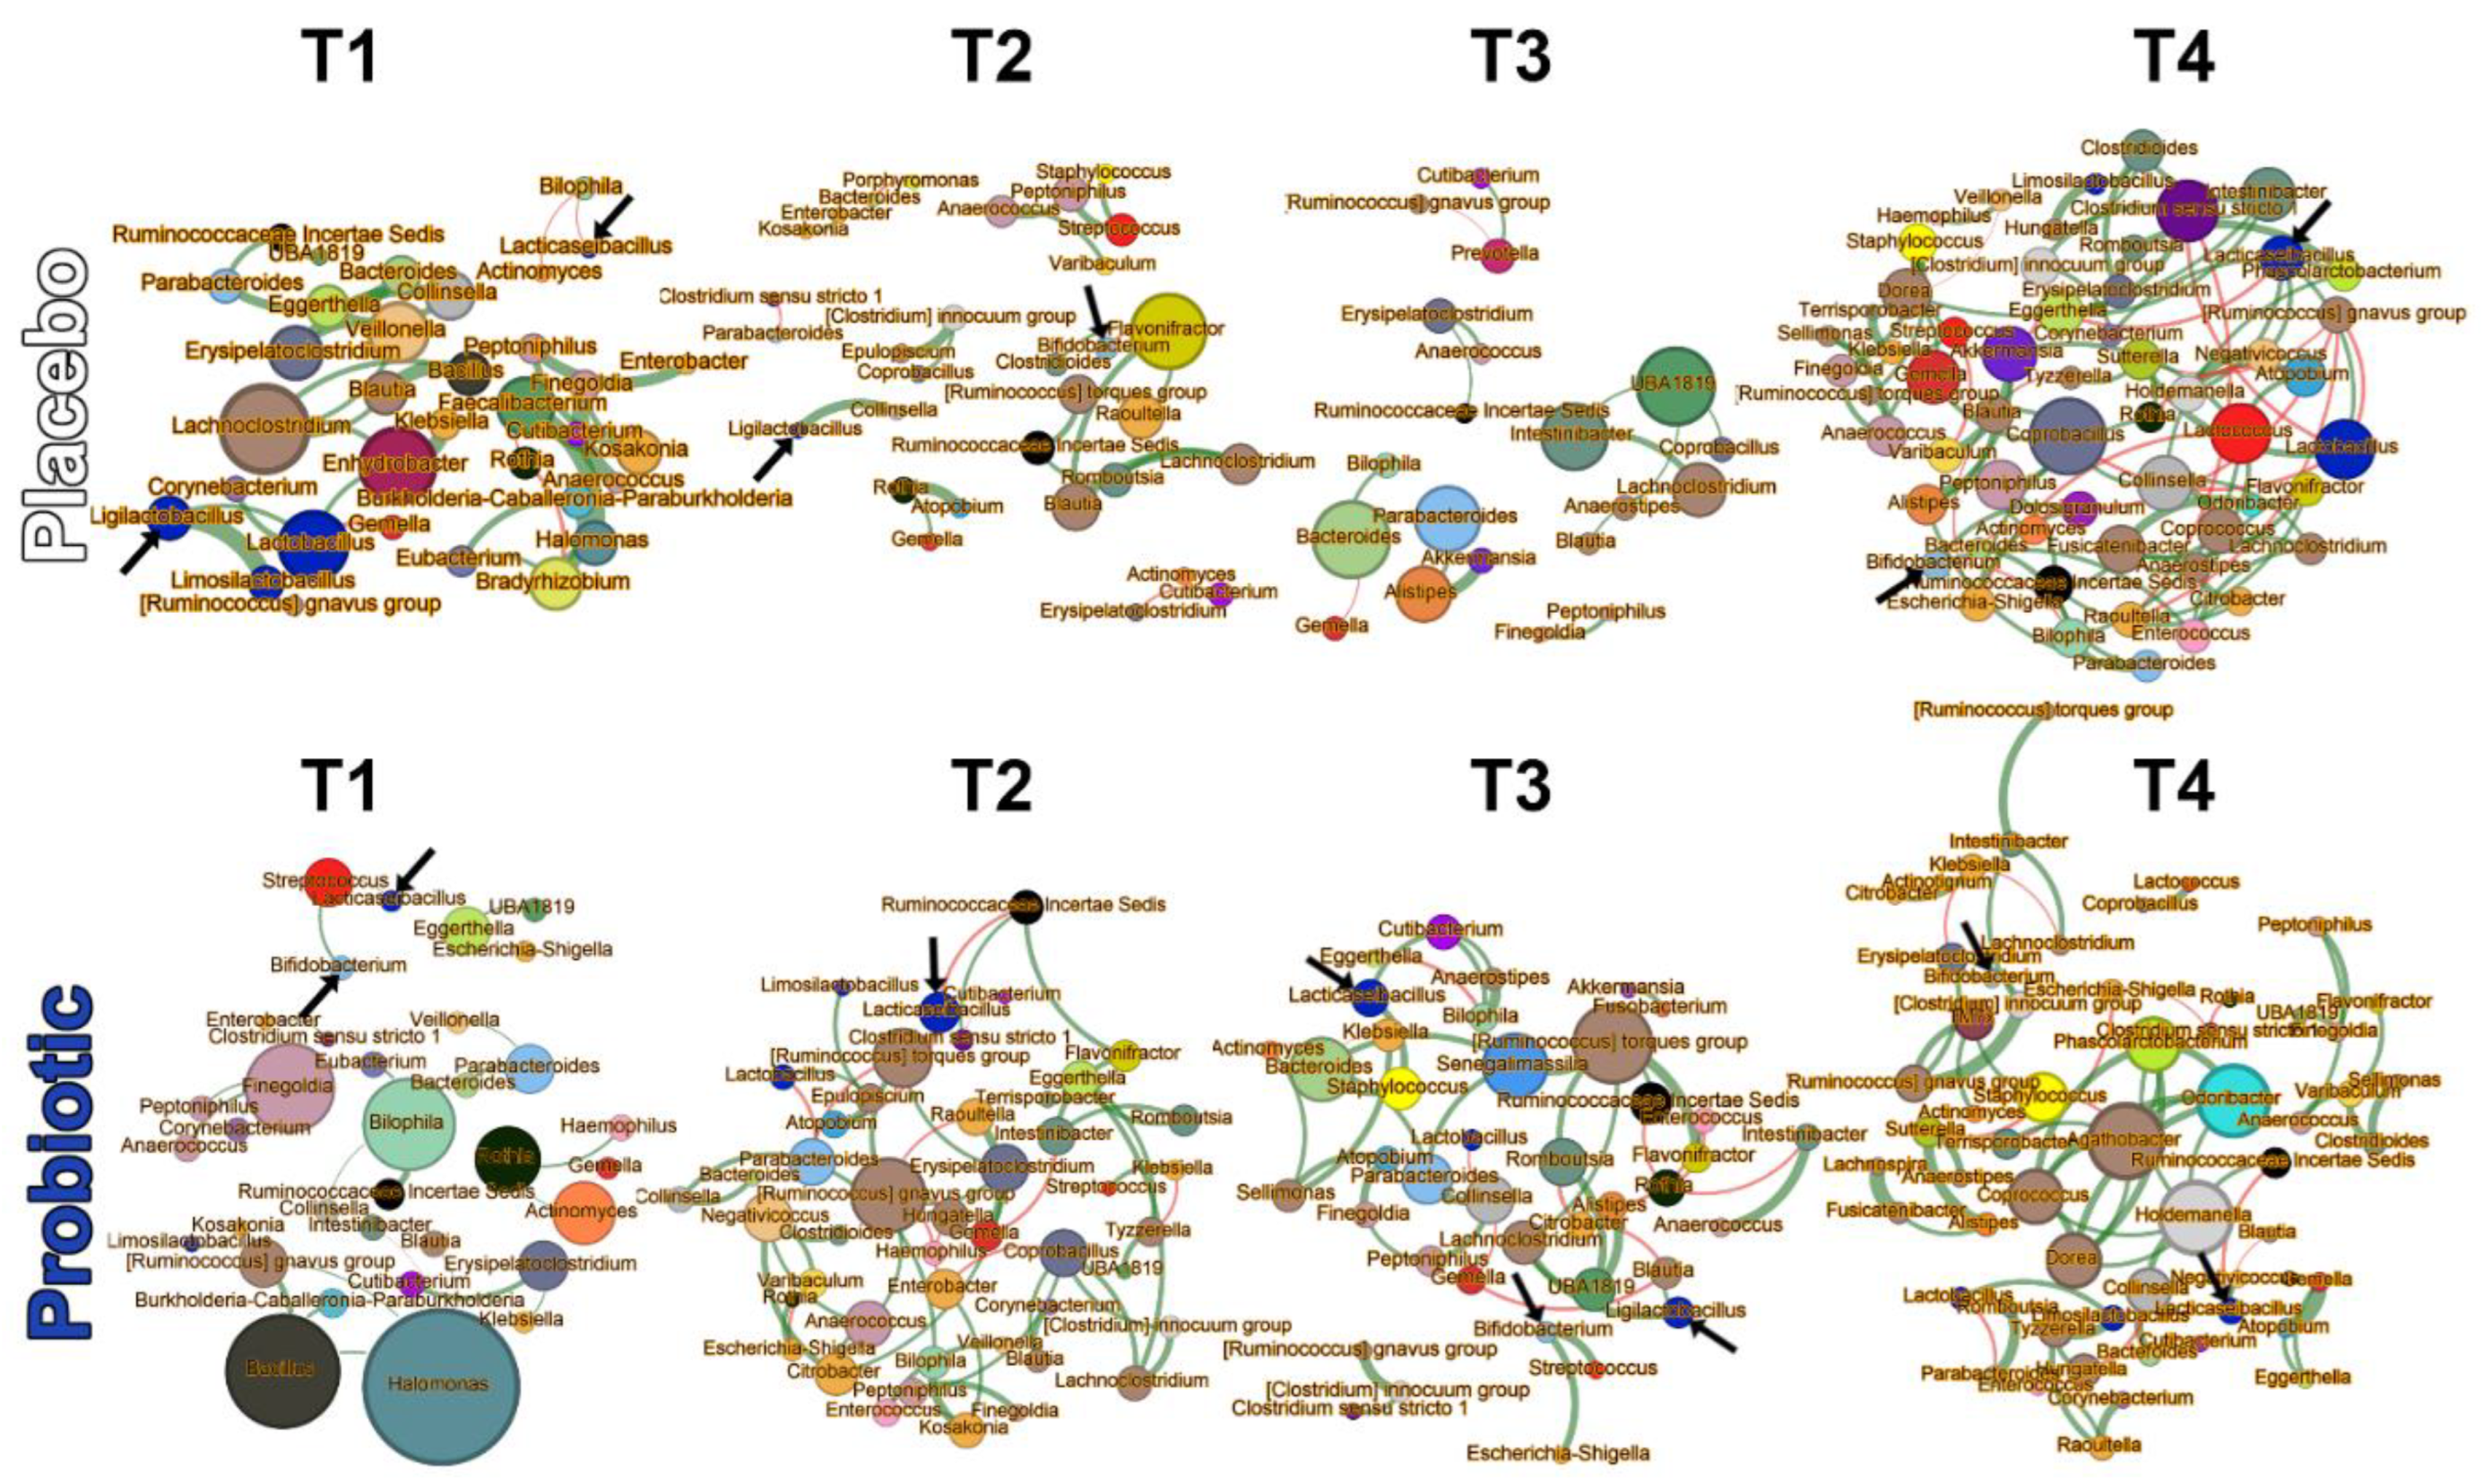
Figure 7.
Resistome, Mobilome, and Differentially Abundant Metabolic Pathways total Antibiotic Resistance Gene (ARG) abundance at starting point (SP) and ending point (EP); (A) total and (B) class medians. (C) Total Mobile Genetic Elements (MGE) abundance (D) MGE class median abundances. Statistically significant differences between groups are indicated by asterisks (* p ≤ 0.05, ** p ≤ 0.01, *** p ≤ 0.001) whereas significant differences within a group are indicated by hashtags (# p ≤ 0.05, ## p ≤ 0.01, ### p ≤ 0.001). (E) Significantly differentially abundant metabolic pathways at SP and EP. Log2-fold changes of the pathway abundance in the probiotic group, relative to the abundance in the placebo group. Points are coloured by the bacterial genus the pathway originates from. Species provided in the probiotic supplement are represented by triangles. Underlined pathways are differentially abundant at both time points.
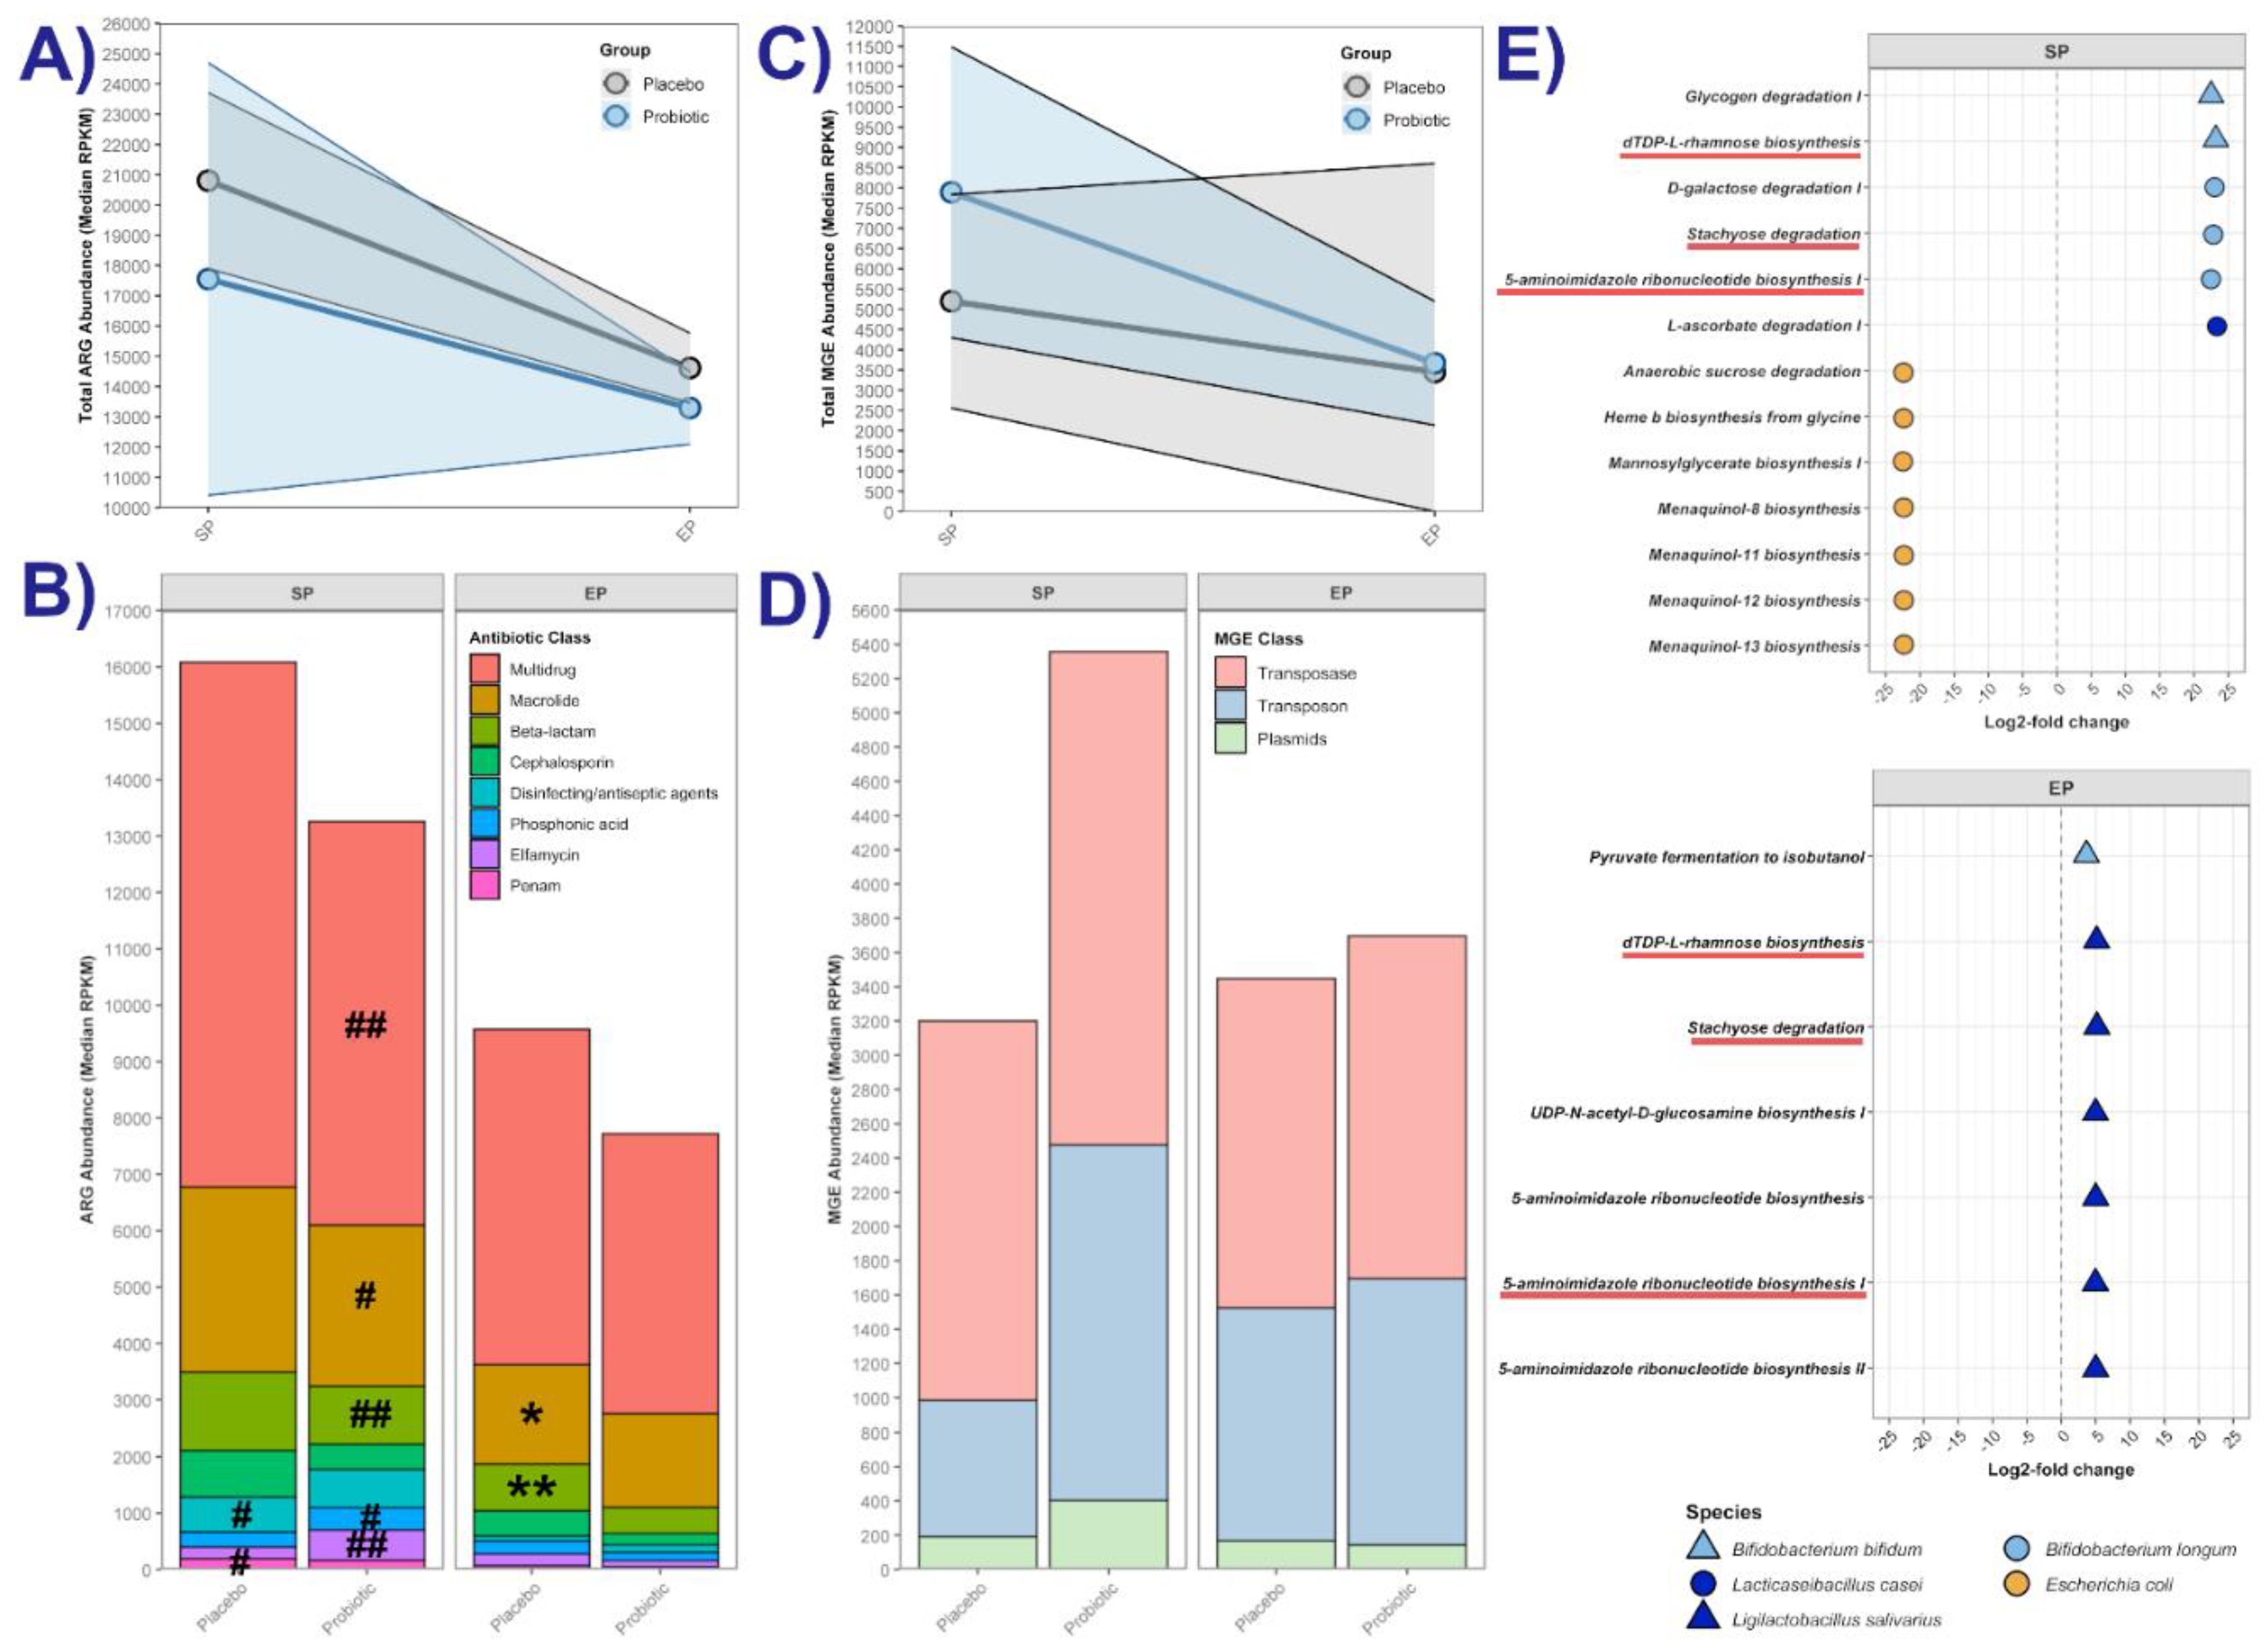

Table 1.
Study Population Characteristics.
| Variable | Placebo N = 46 |
Probiotic N = 54 |
|---|---|---|
| Adherence to intervention in the first 6 weeks (mean ± SD) | 74.3% ± 31.2% | 66.4% ± 32.2% |
| Adherence to intervention over 6 months (mean ± SD) | 71.39% ± 30.7% | 66.25% ± 26.2% |
| Caesarean section | 41.3% | 35.2% |
| Female | 45.7% | 42.6% |
| Median birth weight in kg (IQR) | 3.44 (0.66) | 3.49 (0.77) |
| Sibling in household | 43.5% | 46.3% |
| Some breastfeeding | 82.6% | 77.8% |
| Breastfeeding (median no. weeks in 6 months (IQR)) | 7.5 (23) | 5.5 (23) |
| Townsend score (median (min - max)) | 533 (89 - 1794) | 795 (61 - 1891) |
| Townsend quintile 1 | 21.7% | 18.5% |
| Townsend quintile 2 | 23.9% | 16.7% |
| Townsend quintile 3 | 19.6% | 25.9% |
| Townsend quintile 4 | 13.0% | 24.1% |
| Townsend quintile 5 | 21.7% | 14.8% |
| Number of infants with a first degree relative that has diagnosed atopy | 84.8% | 87.0% |
Table 2.
Relative Abundance of Supplemented Organisms.
| T1 | T2 | T3 | T4 | |
|---|---|---|---|---|
|
Bifidobacteria Mean Relative Abundance ± SD (%) |
||||
| Placebo | 23.14 ± 23.90 | 41.46 ± 20.26 | 40.69 ± 22.29 | 46.55 ± 17.85 |
| Probiotic | 36.41 ± 24.34 | 48.99 ± 18.71 | 47.71 ± 13.90 | 47.94 ± 14.32 |
| p-value | 0.008 | 0.074 | 0.269 | 0.636 |
|
B. animalis Mean Relative Abundance ± SD (%) |
||||
| Placebo | 0.00 ± 0.00 | 0.59 ± 2.00 | 0.42 ± 1.14 | 0.62 ± 2.41 |
| Probiotic | 0.49 ± 1.16 | 0.85 ± 1.31 | 0.50 ± 0.97 | 0.18 ± 0.30 |
| p-value | 0.998 | 0.001 | 0.043 | 0.331 |
|
B. bifidum Mean Relative Abundance ± SD (%) |
||||
| Placebo | 0.09 ± 0.27 | 0.18 ± 0.69 | 0.44 ± 0.91 | 0.19 ± 0.43 |
| Probiotic | 0.57 ± 0.83 | 0.86 ± 0.63 | 0.70 ± 0.44 | 0.70 ± 0.64 |
| p-value | <0.001 | <0.001 | 0.004 | 0.013 |
|
Lacticaseibacillus Mean Relative Abundance ± SD (%) |
||||
| Placebo | 1.01 ± 3.44 | 0.84 ± 2.61 | 2.71 ± 6.27 | 2.90 ± 6.57 |
| Probiotic | 6.83 ± 11.71 | 6.25 ± 7.66 | 4.02 ± 6.27 | 3.70 ± 7.31 |
| p-value | <0.001 | <0.001 | 0.031 | 0.206 |
|
Ligilactobacillus Mean Relative Abundance ± SD (%) |
||||
| Placebo | 0.18 ± 0.74 | 0.11 ± 0.66 | 1.36 ± 6.51 | 0.00 ± 0.00 |
| Probiotic | 6.04 ± 14.03 | 3.87 ± 5.72 | 3.36 ± 5.73 | 2.65 ± 3.86 |
| p-value | <0.001 | <0.001 | <0.001 | 1.000 |
| Number of samples/infants | ||||
| Placebo | 31/25 | 36/32 | 23/22 | 15/13 |
| Probiotic | 38/30 | 26/22 | 32/26 | 17/15 |
Table 3.
Top 5 Taxa for Centrality Measures with Different Keystones between Groups.
| Time Point | Centrality Measure (p-value) | Group (No. samples/ infants) |
Network Size (No. Genera) | Keystones (top 5) | ||||
|---|---|---|---|---|---|---|---|---|
| Rank 1 | Rank 2 | Rank 3 | Rank 4 | Rank 5 | ||||
| T1 | Betweenness (0.044) | Placebo (31/25) | 40 | Faecalibacterium | Bradyrhizobium | Lachnoclostridium | Lactobacillus | Enhydrobacter |
| Probiotic (31/25) | 29 | Halomonas | Bacillus | Bilophila | Finegoldia | [Ruminococcus] gnavus group | ||
| T1 | Closeness (0.002) | Placebo (31/25) | 40 | Lachnoclostridium | Enhydrobacter | Lactobacillus | Faecalibacterium | Veillonella |
| Probiotic (31/25) | 29 | Halomonas | Bacillus | [Ruminococcus] gnavus group | Bilophila | Finegoldia | ||
| T1 | Eigenvector (0.002) | Placebo (31/25) | 40 | Lachnoclostridium | Enhydrobacter | Bacillus | Blautia | Bradyrhizobium |
| Probiotic (31/25) | 29 | Bacillus | Halomonas | [Ruminococcus] gnavus group | Bilophila | Finegoldia | ||
| T2 | Eigenvector (0.026) | Placebo (26/25) | 43 | Flavonifractor | Blautia | Raoultella | Lachnoclostridium | Peptoniphilus |
| Probiotic (26/21) | 45 | [Ruminococcus] gnavus group | [Ruminococcus] torques group | Erysipelatoclostridium | Anaerococcus | Citrobacter | ||
| T3 | Betweenness (0.033) | Placebo (23/22) | 40 | Bacteroides | UBA1819 | Intestinibacter | Parabacteroides | Alistipes |
| Probiotic (23/20) | 39 | [Ruminococcus] torques group | Bacteroides | Senegalimassilia | Staphylococcus | Collinsella | ||
| T4 | Degree (0.004) | Placebo (15/13) | 48 | Fusicatenibacter | Clostridium sensu stricto 1 | Coprobacillus | Lactococcus | Lactobacillus |
| Probiotic (15/13) | 57 | Holdemanella | Agathobacter | Dorea | Odoribacter | Phascolarctobacterium | ||
| T4 | Betweenness (<0.001) | Placebo (15/13) | 48 | Coprobacillus | Gemella | Dorea | Collinsella | Lactococcus |
| Probiotic (15/13) | 57 | Agathobacter | Staphylococcus | Holdemanella | Odoribacter | Collinsella | ||
| T4 | Closeness (0.004) | Placebo (15/13) | 48 | Coprobacillus | Lactobacillus | Lactococcus | Clostridium sensu stricto 1 | Collinsella |
| Probiotic (15/13) | 57 | Agathobacter | Holdemanella | Dorea | Odoribacter | Phascolarctobacterium | ||
| T4 | Eigenvector (<0.001) | Placebo (15/13) | 48 | Lactobacillus | Clostridium sensu stricto 1 | Coprobacillus | Lacticaseibacillus | Eggerthella |
| Probiotic (15/13) | 57 | Dorea | Odoribacter | Phascolarctobacterium | Coprococcus | Holdemanella | ||
Table 4.
Antibiotic Resistance Genes Showing Significant Between or Within Group Changes.
| Placebo | Probiotic | Placebo vs Probiotic | ||||||
|---|---|---|---|---|---|---|---|---|
| Time point (no. samples/infants) |
SP (8/8) |
EP (5/5) |
SP vs EP | SP (8/8) |
EP (13/13) |
SP vs EP | SP | EP |
| Antibiotic Class | Median abundance | p-value | Median abundance | p-value | p-value | |||
| Total | 20,801.05 | 14,610.85 | 0.065 | 17,550.55 | 13,291.35 | 0.121 | 0.798 | 0.566 |
| Multidrug | 9312.27 | 5949.31 | 0.222 | 7162.09 | 4964.88 | 0.008 | 0.959 | 0.703 |
| Macrolide | 3285.32 | 1755.77 | 0.065 | 2852.80 | 1655.09 | 0.013 | 0.505 | 1.000 |
| Beta-lactam | 1376.59 | 824.35 | 0.171 | 1022.68 | 460.44 | 0.010 | 0.645 | 0.035 |
| Cephalosporin | 827.68 | 448.33 | 0.524 | 444.36 | 201.70 | 0.121 | 0.083 | 0.007 |
| Disinfecting/antiseptic agents | 618.95 | 87.95 | 0.011 | 678.31 | 134.43 | 0.104 | 0.798 | 0.059 |
| Phosphonic acid | 268.09 | 230.47 | 0.724 | 397.25 | 142.55 | 0.037 | 0.878 | 0.566 |
| Elfamycin | 206.26 | 208.86 | 0.833 | 536.86 | 114.71 | 0.003 | 0.161 | 0.336 |
| Penam | 190.43 | 66.87 | 0.045 | 163.54 | 46.72 | 0.076 | 1.000 | 0.924 |
Table 5.
Abundance of Mobile Genetic Elements.
| Placebo | Probiotic | Placebo vs Probiotic | ||||||
|---|---|---|---|---|---|---|---|---|
| Time point (no. samples/infants) |
SP (8/8) |
EP (5/5) |
SP vs EP | SP (8/8) |
EP (13/13) |
SP vs EP | SP | EP |
| Mobile Genetic Elements | Median abundance | p-value | Median abundance | p-value | p-value | |||
| Total | 5194.99 | 3447.77 | 0.943 | 7888.70 | 3665.54 | 0.456 | 0.645 | 0.849 |
| Integron | 0.00 | 0.00 | 0.268 | 0.00 | 0.00 | 0.287 | - | 0.879 |
| Plasmids | 190.31 | 167.93 | 0.941 | 402.95 | 143.02 | 0.634 | 0.957 | 0.766 |
| Transposase | 2216.19 | 1925.02 | 0.622 | 2882.01 | 2001.04 | 0.972 | 0.721 | 0.633 |
| Transposon | 793.86 | 1354.81 | 0.509 | 2072.63 | 1552.11 | 0.856 | 0.873 | 1.000 |
Disclaimer/Publisher’s Note: The statements, opinions and data contained in all publications are solely those of the individual author(s) and contributor(s) and not of MDPI and/or the editor(s). MDPI and/or the editor(s) disclaim responsibility for any injury to people or property resulting from any ideas, methods, instructions or products referred to in the content. |
© 2025 by the authors. Licensee MDPI, Basel, Switzerland. This article is an open access article distributed under the terms and conditions of the Creative Commons Attribution (CC BY) license (http://creativecommons.org/licenses/by/4.0/).
Copyright: This open access article is published under a Creative Commons CC BY 4.0 license, which permit the free download, distribution, and reuse, provided that the author and preprint are cited in any reuse.


