Submitted:
29 March 2025
Posted:
31 March 2025
You are already at the latest version
Preprints on COVID-19 and SARS-CoV-2
Abstract
Objectives: We identified cell counts and proportions reported in, or calculated from, a complete blood count (CBC) that independently predicted mortality in hospitalized COVID-19 patients. The primary objective was to characterize a CBC signature at presentation that might provide insights for tracking immune response and disease management.Methods/Study design: This was a retrospective longitudinal observational study. The primary outcome was in-hospital mortality. Secondary outcomes included the need for mechanical ventilation, development of sepsis, and ICU admission. Electronic medical records underwent IRB exempted extraction of clinical data. Univariate logistic regression was used to identify CBC parameters and putative inflammatory markers independently predictive of hospital mortality. Bootstrap Forest (BF) modeling was employed to aggregate predictive CBC parameters that optimized generalized coefficient of variation (R2) concurrently computing their proportion of explained variance in mortality. BF modeling was replicated with inflammatory markers and subsequently with pooled features from both models.Results: CBC parameters including segmented neutrophils, bands, ANC, and RDW-CV were significantly elevated in non-survivors compared to survivors. In addition, patients with decreased platelets, lymphocytes and monocytes were more likely to be in the non-survivor group. Incorporating these CBC parameters amplified R2 for mortality in a presentation prognostic model with only inflammatory markers including C-reactive protein, lactate dehydrogenase and ferritin.Conclusion: Routinely obtained CBC parameters improve predictive power of putative COVID-19 severity markers and enhance accuracy of mortality risk assessment at presentation. We recommend that these CBC parameters be considered for presentation risk stratification, level of care triaging decisions and longitudinal tracking of disease management.
Keywords:
covid-19
; cbc
; inflammatory markers
; predictive medicine
; public health
; machine learning
Introduction
SARS-CoV-2 was first identified in Wuhan, China in December 2019 [1]. Following its identification, there was rapid global spread of COVID-19 prompting the World Health Organization (WHO) to declare a worldwide emergency on January 30, 2020 [2]. As of 03/03/2022, there have been 437,333,859 confirmed cases of COVID-19, including 5,960,972 deaths, reported to the WHO [3]. This ongoing public health emergency demands the discovery of reliable prognostic factors that may include demographics, laboratory markers and past medical illnesses to guide clinical decision making. In general, information regarding risk factors of mortality from COVID-19 is scarce. Several laboratory biomarkers including lactated dehydrogenase (LDH), C-reactive protein (CRP), ferritin, D-dimer and creatine kinase (CK) have so far been identified as being associated with severe COVID-19 [4]. We aimed to investigate if certain parameters and parameter ratios obtained from a routine complete blood count would help to improve presentation risk stratification. The primary aim of this analysis was to evaluate whether data provided via routine CBC could be used to risk stratify which hospitalized patients would progress to death.
Materials & Methods
Study Design and Population
We performed a retrospective longitudinal observational study of adult patients hospitalized with COVID-19 at Sarasota Memorial Hospital (SMH) between March 14, 2020, to December 31, 2021. The study was exempted by the SMH institutional review board. Adults at least 18 years old with a SARSCoV- 2 reverse transcriptase-polymerase chain reaction positive test on nasopharyngeal swabs during index admission were included. The primary outcome was in-hospital mortality. Secondary outcomes included ICU admission, need for mechanical ventilation, sepsis level, ICU length of stay (LOS), and hospital LOS.
Statistical Analysis
Medical records in Allscripts Sunrise Clinical Manager and APACHE IV databases underwent extraction of administrative and clinical data. These data included demographics, anthropometrics, vital signs, laboratory test results, COVID-19 directed medications, clinical support interventions and ICD-10-CMbased Elixhauser comorbidity categories. Univariate logistic regression was used to identify CBC parameters associated (p<.05) with hospital mortality. Generalized regression with adaptive LASSO modeling was used to evaluate explanatory probability while eliminating collinearities in identified CBC parameters associated with mortality while statistically balancing age, sex, race, baseline vital signs, Elixhauser comorbidities, COVID-19 directed treatment, and local COVID-19 surges. Additional analysis with Bootstrap Forest (BF) was employed to evaluate aggregated synergies and retain parameters that optimized generalized coefficient of variation (R2) representing multivariate prediction accuracy and explained variance proportion (EV%) in mortality provided by each variable. Further BF analysis was used to examine relative magnitude of EV% versus putative COVID-19 inflammatory markers. To evaluate longitudinal variability across hospitalization, CBC variables included in final BF model were temporally parsed into 24h intervals for initial 5-days since presentation vital signs. Results were averaged when a patient underwent multiple assays within an interval. A two-way ANOVA was employed to compare survival vs. non-survival patterns. Given 4 repeated measures, a Bonferroni corrected P-value <0.0125 was considered significant.
Results
Among 3925 patients consecutively discharged between March 1st and December 31st, 2021, 12% (n=464) suffered hospital mortality. Survivor vs. non-survivor patient and clinical characteristics within initial 24h of hospitalization are summarized in Table 1. The median age respectfully of non-survivors was 71 years compared to 67 for survivors. Younger patients were more likely to be in the survivor group. 67% of patients who died were male compared to 33% females hence males were more likely to suffer in patient mortality compared to females. Survivors exhibited a median of 3 compared to 5 comorbidities in non-survivors. The 9 most prevalent comorbidities were: hypertension, obesity, neurologic diseases, previous thromboembolic disease, diabetes mellitus type 2, renal failure (chronic kidney disease stage III or higher), chronic pulmonary disease (including chronic obstructive pulmonary disease, emphysema, and pulmonary fibrosis), heart failure and iron deficiency anemia. Patients with higher values of CRP, ferritin, LDH, D-dimer, PT and INR on admission were more likely to suffer in hospital mortality
BMI-Body mass index; WBC-White blood cells; RDW-Red cell distribution width; RDW-SD- Red cell distribution width-standard deviation; ANC-Absolute neutrophil count; ALC-Absolute lymphocyte count; APC-Absolute platelet count; CRP-C-reactive protein; LDH-Lactate dehydrogenase; INR-International normalized ratio.
CBC parameters obtained within 24 hours of admission were analyzed. Patients with a higher WBC count were more likely to be in the non-survivor group (median of 7.6 for non survivors compared to 6.9 for survivors). Patients with increased segmented neutrophils (81%) were more likely to be in the nonsurvivor group, compared to patients with decreased neutrophils (75%) who were more likely to survive. Consequently, patients with increased bands (4% as compared to 3%) as well as increased ANC (5.97 compared to 5.10) were more likely to be in the non-survivor group. Patients with increased RDW-CV (14.0 compared to 13.6) were also more likely to be in the non-survivor group. Patients with decreased platelets (190 compared to 205) were more likely to be in the non-survivor group. Similarly, patients with decreased lymphocytes (10 compared to 14) and decreased monocytes (4 compared to 8) were more likely to be in the non-survivor group.Computed ANC/ALC and APC/ALC ratios were higher in the non-survivor group. Other components of the CBC including hemoglobin concentration, eosinophils and RDW-SD were also analyzed. Patients with slightly higher hemoglobin were more likely to die, but these results were not statistically significant.
CBC-Complete blood count; R2- Coefficient of determination; LDH-Lactate dehydrogenase; CRP-C-reactive protein; ANC-Absolute neutrophil count; RDW-CV-Red cell distribution width-coefficient of variation
Table 2a demonstrates the results of bootstrap forest (BF) modeling for inflammatory markers alone. The R2 was 53% which indicated that the model represented 53% of the variance in hospital mortality. Relative contribution of the model components included LDH (45%), CRP (30%) and ferritin (26%).
Table 2b demonstrates the results of bootstrap forest modeling for CBC parameters alone. The R2 was 63%. Within this model, platelet counts, monocytes, RDW-CV, ANC, lymphocytes and segmented neutrophils contributed an average of 15% each to the overall explained variance. Bands contributed 10%
Table 2c demonstrates the results of bootstrap forest modeling for CBC parameters combined with inflammatory markers. The R2 was 69%. Within this model, LDH contributed the most to the overall explained variance at 21%. Monocytes and RDW-CV each contributed 11%. Overall, the use of inflammatory markers alone demonstrated the lowest positive correlation with mortality with R2 of 53%. The use of CBC parameters alone demonstrated positive correlation with mortality with R2 of 63%. The highest R2 was generated when CBC parameters were combined with inflammatory markers. This model demonstrated positive correlation to mortality with R2 of 69%.
Longitudinal box plots illustrated in Figure 1, Figure 2 and Figure 3 again show survivor vs non survivor characteristics. These 7 CBC parameters are illustrated because they were retained in the BF modeling in Table 2. The box plots demonstrate that differential patterns observed at presentation are sustained with variations in magnitude, but statistically significant (p<.0125) across up to 5-days hospitalization. Namely, lymphopenia, thrombocytopenia and monocytopenia, all predict a poorer outcome as do elevated RDW-CV, neutrophils, ANC and bands.
RDW-Red cell distribution width-coefficient of variation
ANC-Absolute neutrophil count
Discussion
This study sought to identify baseline cell counts and proportions reported in or calculated from a complete blood count that may provide prognostic information in hospitalized patients with laboratory confirmed SARS-CoV-2 infection. Despite the widespread incidence of this disease, little is known about the underlying pathogenicity that predicts for which patients suffer mortality or develop critical disease versus mild disease. A possible first step in unraveling this mystery would be to characterize risk factors at presentation. Thus, enabling early identification of patients exhibiting excess risk for progression to death.
Inflammatory markers including serum levels of ferritin, LDH and CRP have been proposed to carry prognostic significance [4]. Coagulopathy and overt disseminated intravascular coagulation appear to be associated with high mortality rates [4]. Our findings suggest use of putative COVID-19 inflammatory markers alone to predict mortality demonstrated an explanatory variance (R2) in mortality of 53%. Whereas a CBC parameter ensemble (signature) provided 10% greater explained variance. Integration of CBC ensemble and inflammatory marker signatures increased explanatory power to 69%.
Similar studies have suggested that certain CBC parameters, including lymphocyte, platelet, neutrophil, and monocyte counts appear to correlate with the severity and mortality of COVID-19 cases. Kilercik and coinvestigators [5] concluded that increased neutrophil-lymphocyte ratio (NLR) or ANC/ALC is a strong predictor for poor prognosis in COVID-19 patients. Other indices associated with severe illness in their study were decreased platelet counts and increased RDW as well as monocytopenia and lymphopenia. Tan and coinvestigators [6] concluded that lymphopenia is an effective and reliable indicator of the severity and hospitalization in COVID-19 patients. Linssen and coinvestigators [7] developed a parameter prognostic score to predict, during the first three days after presentation, which patients would recover without ventilation or deteriorate within a two-week timeframe. They found that lymphopenia is present for 7 days in non-critical illness group compared to 10 days in the critical illness group. The NLR is also increased in the critical illness group compared to the non-critical group. In addition, the plateletto- lymphocyte ratio (PLR) was abnormally elevated for both groups throughout, with values slightly higher in the critical illness group, but only until day 5, after which the non-critical and critical illness groups overlapped. Wang’s team [8] concluded that WBC, neutrophil count, NLR, PLR, RDW-CV and RDW-SD parameters in patients in the severe illness group were significantly higher than those in the moderate illness group. Bellan and coinvestigators [9] built a final multivariate model which confirmed that median age of 67 or greater as well as male gender, thrombocytopenia <166,000, NLR>4.68 and RDW >13.7 were independent predictors of in-hospital mortality. Hemoglobin levels were not associated with in-hospital mortality. Zheng and coinvestigators [10] showed that the neutrophil count in patients with severe disease was higher than that in those with non-severe disease, while the platelet count in patients with the severe type was lower than that in those with the non-severe type. The authors also noted lymphopenia which is consistent with most studies discussed above. They were able to create a NLP (neutrophil-lymphocyte-platelet score) by assigning points to certain cutoffs for neutrophil counts, lymphocyte counts and platelet counts. In their study, a higher NLP was associated with a greater risk of COVID progression.
Taken together, our findings are consistent with others described above. Lymphopenia, thrombocytopenia, and monocytopenia are generally observed in non-survivors or patients who progressed to critical illness. In addition, elevated ANC/ALC (or NLR) and APC/ALC (or PLR) also manifest in patients who progress to critical illness, but these ratios are only sustained for the initial 120hrs after hospitalization.
The clinical manifestations of COVID-19 range from asymptomatic, to mild-moderate clusters of flu like symptoms such as fever, fatigue, myalgia, dry cough, dyspnea, and anorexia. Patients may manifest life threatening disease including ARDS requiring mechanical ventilation, sepsis, coagulopathy and multi system organ failure [11]. The severity of COVID-19 has been attributed to a dysregulated innate immune response prompting a proinflammatory cytokine storm [12]. No single definition of cytokine storm or the cytokine release syndrome is widely accepted however, a cytokine storm is a potentially fatal immune mediated condition characterized by high-level activation of immune cells and excessive production of massive inflammatory cytokines and chemical mediators [13]. It is the main cause of disease severity and death in patients with COVID-19, and is related to high levels of circulating cytokines, severe lymphopenia, thrombosis, and massive mononuclear cell infiltration in multiple organs [13]. Based on recent studies and currently available literature, there are several different hypotheses for the observed leukocytosis with lymphopenia that is observed in severe COVID-19 patients. During the inflammatory cytokine storm, elevated levels of pro-inflammatory cytokines, such as tumor necrosis factor-alpha (TNF-α) and interleukin-6 (IL-6), have been closely correlated with lymphopenia. Treatment with tocilizumab, an IL-6 receptor antagonist, increased the number of circulatory lymphocytes, further suggesting IL-6 increase is a key player in the lymphopenia development [13]. Other studies have noted that COVID-19 infection can result in exhaustion of T cells. In one study, it was found that T cell counts are reduced significantly in COVID-19 patients, and the surviving T cells appeared functionally exhausted [14]. Overall, lymphopenia and increased levels of certain cytokines, such as IL-6, have been closely associated with the disease severity and a remarkable decrease in T cell counts is almost always observed in severe cases [13]. Additionally, another study demonstrated that the SARS-CoV-2 virus can infect macrophages and dendritic cells in human lymph nodes and spleens, which leads to tissue damage and lymphocyte reduction through the promotion of IL-6 secretion [15].
Lymphopenia can occur during sepsis, viral infections, or infections due to other pathogens and therefore is not pathognomic to COVID-19 infection alone [16]. However, a study from 2014 demonstrated that persistent lymphopenia was associated with increased mortality in sepsis [17]. This is of particular importance in COVID-19 infections where the lymphopenia is not just transient but is often persistent and in our study is maintained for up to 120hours after hospitalization. Importantly, eliminating lymphopenia would also help to decrease the NLR and the PLR which may improve the likelihood of survival in patients.
A randomized clinical trial conducted showed that recombinant human granulocyte colony-stimulating factor (rhG-CSF) treatment for patients with COVID-19 with lymphopenia but no comorbidities did not accelerate clinical improvement, but the number of patients developing critical illness or dying may have been reduced [18]. Further studies will need to be done to determine if repletion of lymphocytes and platelets can become an important element for consideration in decreasing the amount of moderately ill patients with covid who progress to critical illness or death.
Our study had several limitations that we attempted to minimize with statistical balancing of confounders:It was a single center study and most of the study population was not racially diverse or representative ofnational statistics. There were also some differences between the amount of male and female patients who were included although it can be argued that this is expected since multiple studies have shown that males are more likely to suffer critical illness requiring hospitalization from COVID-19 infection [19]. In addition, patient enrolment and data collection occurred over several COVID-19 surges with presumed multiple variants undergoing temporally emerging treatment recommendations could have impacted survival. Data from out-patient settings including milder cases not requiring hospitalization were not compared.
Conclusions
The complete blood count is an inexpensive, automated, and readily available test. Our study reveals a CBC signature for COVID-19 that may be useful for clinical assessment of mortality risk at presentation. CBC signature provided 63% of explained variance in mortality risk compared to 53% by putative inflammatory markers of COVID-19 severity including LDH, ferritin and CRP. Survivor differential in CBC signature parameters was sustained for up to 120h from presentation. Since CBC routinely may be serially assayed more frequently than inflammatory markers, we recommend that CBC parameters specifically platelet counts, lymphocyte counts, and ANC be considered for presentation risk stratification and COVID-19 management tracking.
References
- Coronaviruses. National Foundation for Infectious Diseases. (2022). Accessed: 05/22: https://www.nfid.org/infectious-diseases/coronaviruses.
- World Health Organization. (2022). Accessed: 05/22: https://www.who.int/publications/m/item/covid-19-public-health-emergency-ofinternational- concern-(pheic)-global-rese.
- (By. Coronavirus world map: Tracking the global outbreak. The New York Times). Accessed: 2021282020: https://www.nytimes.com/interactive/2021/world/covid-cases.html.
- Velavan TP, Meyer CG: Mild versus severe covid- 19: Laboratory markers. International Journal of Infectious Diseases. 2020, 95:304-307. [CrossRef]
- Kilercik M, Demirelce Ö, Serdar MA, Mikailova P, Serteser M: A new haematocytometric index: Predicting severity and mortality risk value in COVID-19 patients. PLOS ONE. 2021, 16. [CrossRef]
- Tan L, Wang Q, Zhang D, et al.: Lymphopenia predicts disease severity of covid- 19: A descriptive and predictive study. Signal Transduction and Targeted Therapy. 2020, 5:10. [CrossRef]
- Linssen J, Ermens A, Berrevoets M, et al.: A novel haemocytometric covid-19 prognostic score developed and validated in an observational multicentre European Hospital-based study. eLife. 2020, 9. [CrossRef]
- Wang C, Deng R, Gou L, et al.: Preliminary study to identify severe from moderate cases of covid-19 using combined hematology parameters. Annals of Translational Medicine. 2020, 8:593-593. [CrossRef]
- Bellan M, Azzolina D, Hayden E, et al.: Simple parameters from complete blood count predict in-hospital mortality in COVID-19. 2021-2021. [CrossRef]
- Zheng Y, Zhang Y, Chi H, et al.: The hemocyte counts as a potential biomarker for predicting disease progression in covid- 19: A retrospective study. Clinical Chemistry and Laboratory Medicine (CCLM. 2020, 58:1106-1115. [CrossRef]
- Hu B, Huang S, Yin L: The cytokine storm and Covid-19. Journal of Medical Virology. 2020, 93:250-256. [CrossRef]
- Ragab D, Salah Eldin H, Taeimah M, Khattab R, Salem R: The COVID-19 cytokine storm; what we know so far. Frontiers in Immunology. 2020, 11. [CrossRef]
- Tavakolpour S, Rakhshandehroo T, Wei EX, Rashidian M: Lymphopenia during the COVID-19 infection: What it shows and what can be learned. Immunology Letters. 2020, 225:31-32. [CrossRef]
- Diao B, Wang C, Tan Y, et al.: Reduction and functional exhaustion of T cells in patients with coronavirus disease 2019 (COVID-19). Frontiers in Immunology. 2020, 11. [CrossRef]
- Xiang Q, Feng Z, Diao B, et al.: SARS-COV-2 induces lymphocytopenia by promoting inflammation and decimates secondary lymphoid organs. Frontiers in Immunology. 2021, 12. [CrossRef]
- Cavaillon J-M, Adib-Conquy M: Immune status in sepsis: The bug, the site of infection and the severity can make the difference. Critical Care. 2010, 14:167. [CrossRef]
- Drewry AM, Samra N, Skrupky LP, Fuller BM, Compton SM, Hotchkiss RS: Persistent lymphopenia after diagnosis of sepsis predicts mortality. Shock. 2014, 42:383-391. [CrossRef]
- Meyer NJ, Lindell RB, Wherry EJ: Immune stimulation with recombinant human granulocyte colony-stimulating factor for coronavirus disease 2019 (covid-19)—beware of blind spots. JAMA Internal Medicine. 2021, 181:78. [CrossRef]
- Huang C, Wang Y, Li X, et al.: Clinical features of patients infected with 2019 novel coronavirus in Wuhan, China. The. Lancet. 2020, 395:497-506. [CrossRef]
Figure 1.
Box plots demonstrating initial 5-day kinetics of survivors (blue) vs non-survivors (red) in intervals representing time from first vital sign at hospitalization to assay.
Figure 1.
Box plots demonstrating initial 5-day kinetics of survivors (blue) vs non-survivors (red) in intervals representing time from first vital sign at hospitalization to assay.
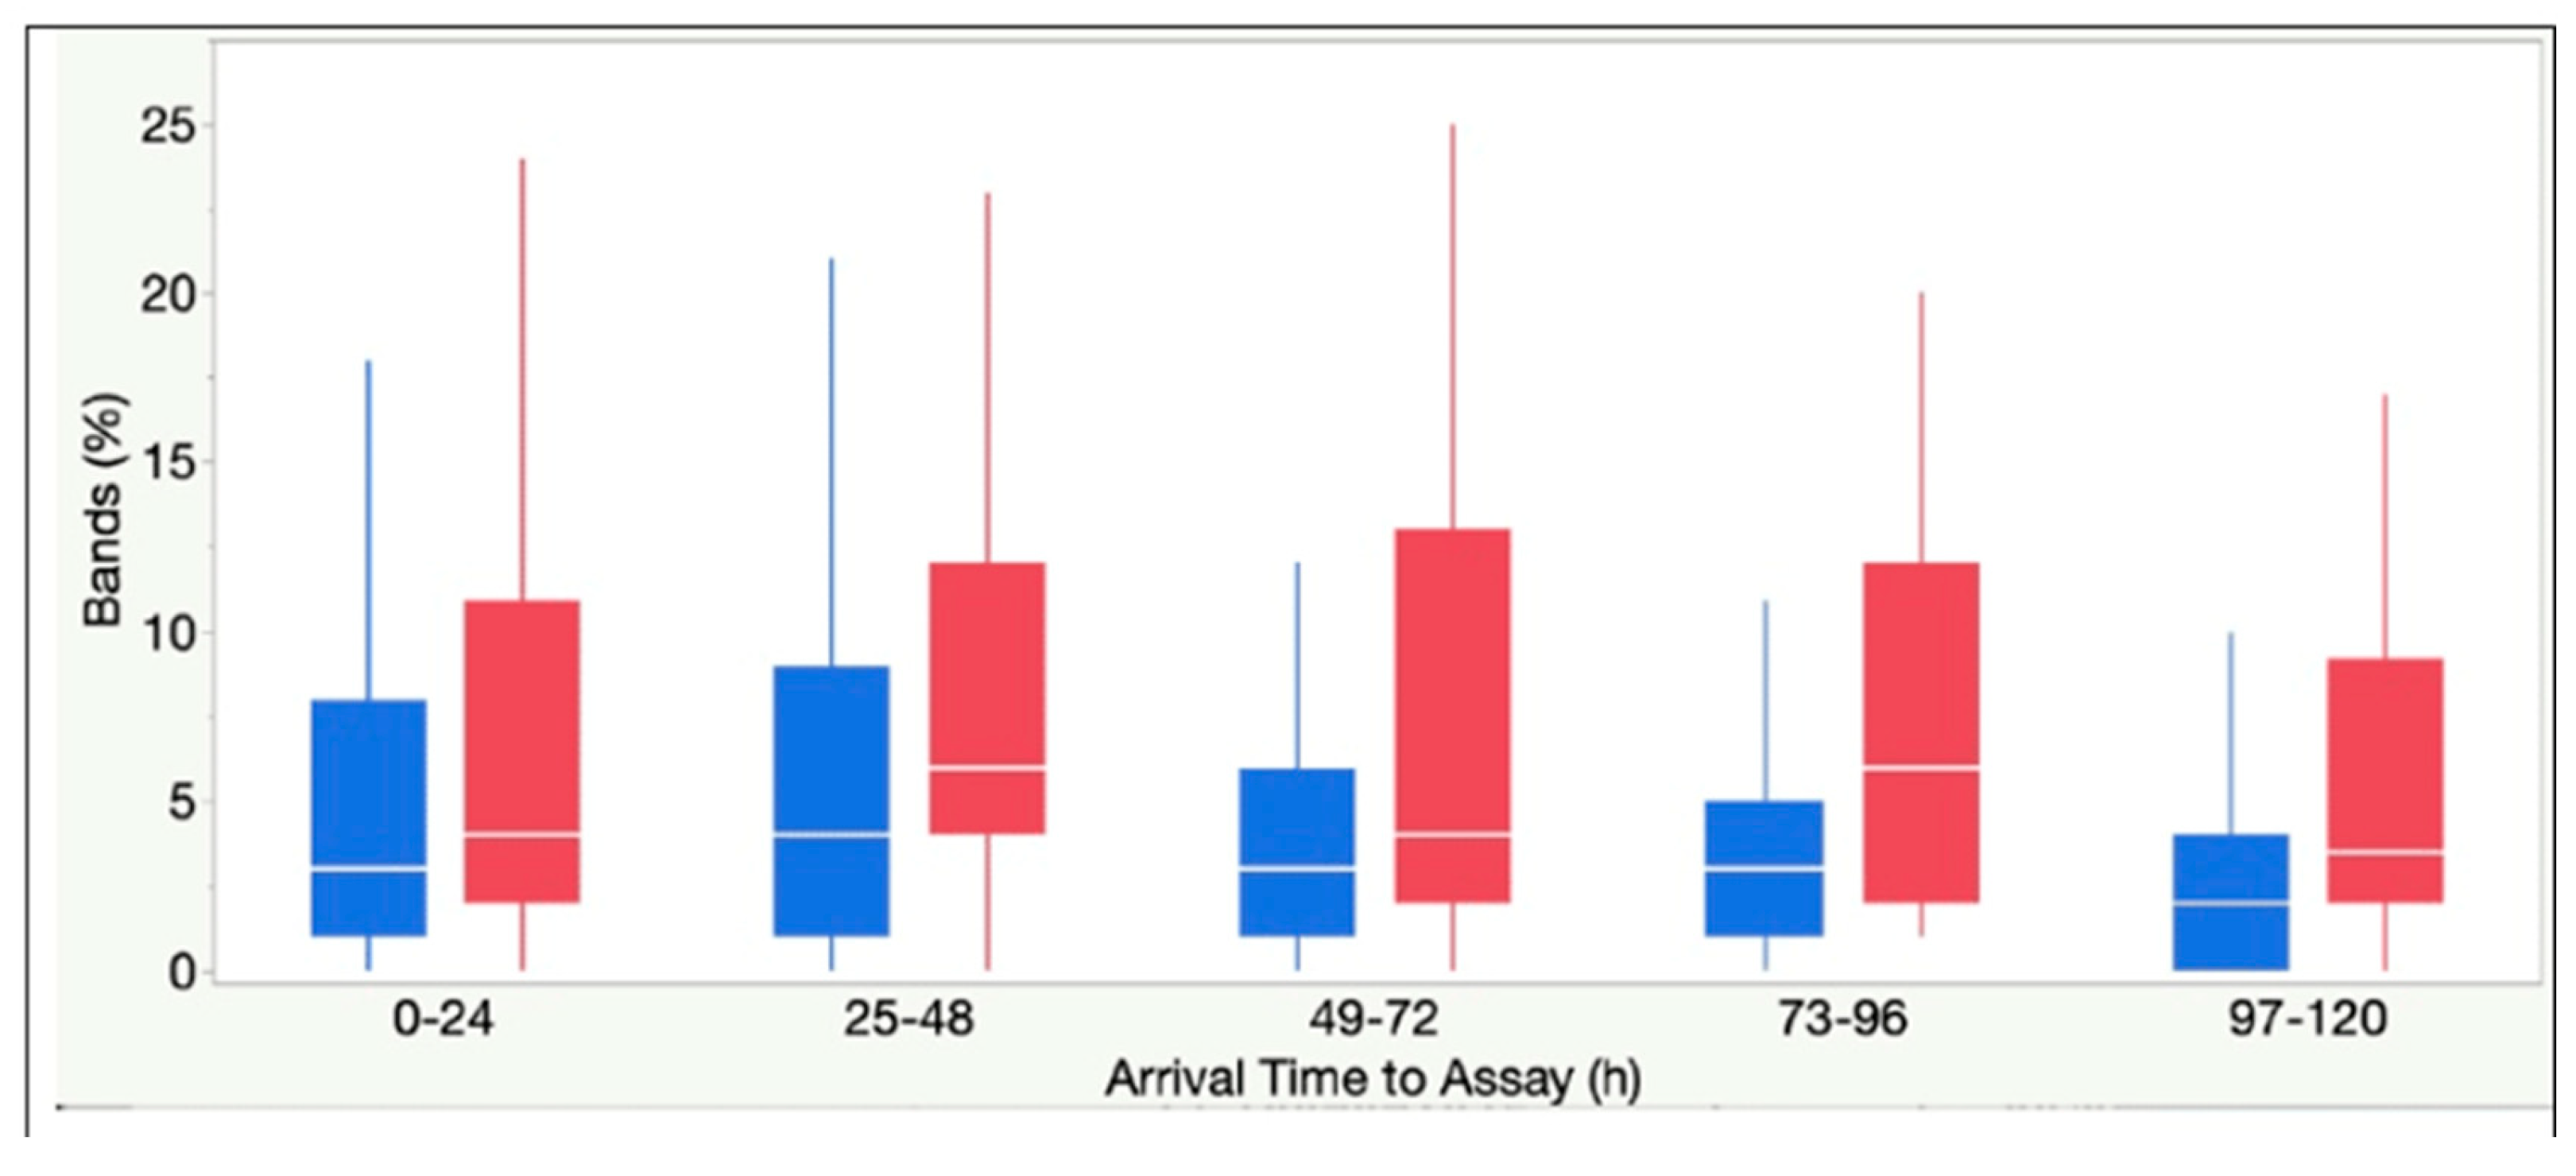
Figure 2.
Box plots demonstrating initial 5-day kinetics of survivors (blue) vs non-survivors (red) in intervals representing time from first vital sign at hospitalization to assay.
Figure 2.
Box plots demonstrating initial 5-day kinetics of survivors (blue) vs non-survivors (red) in intervals representing time from first vital sign at hospitalization to assay.
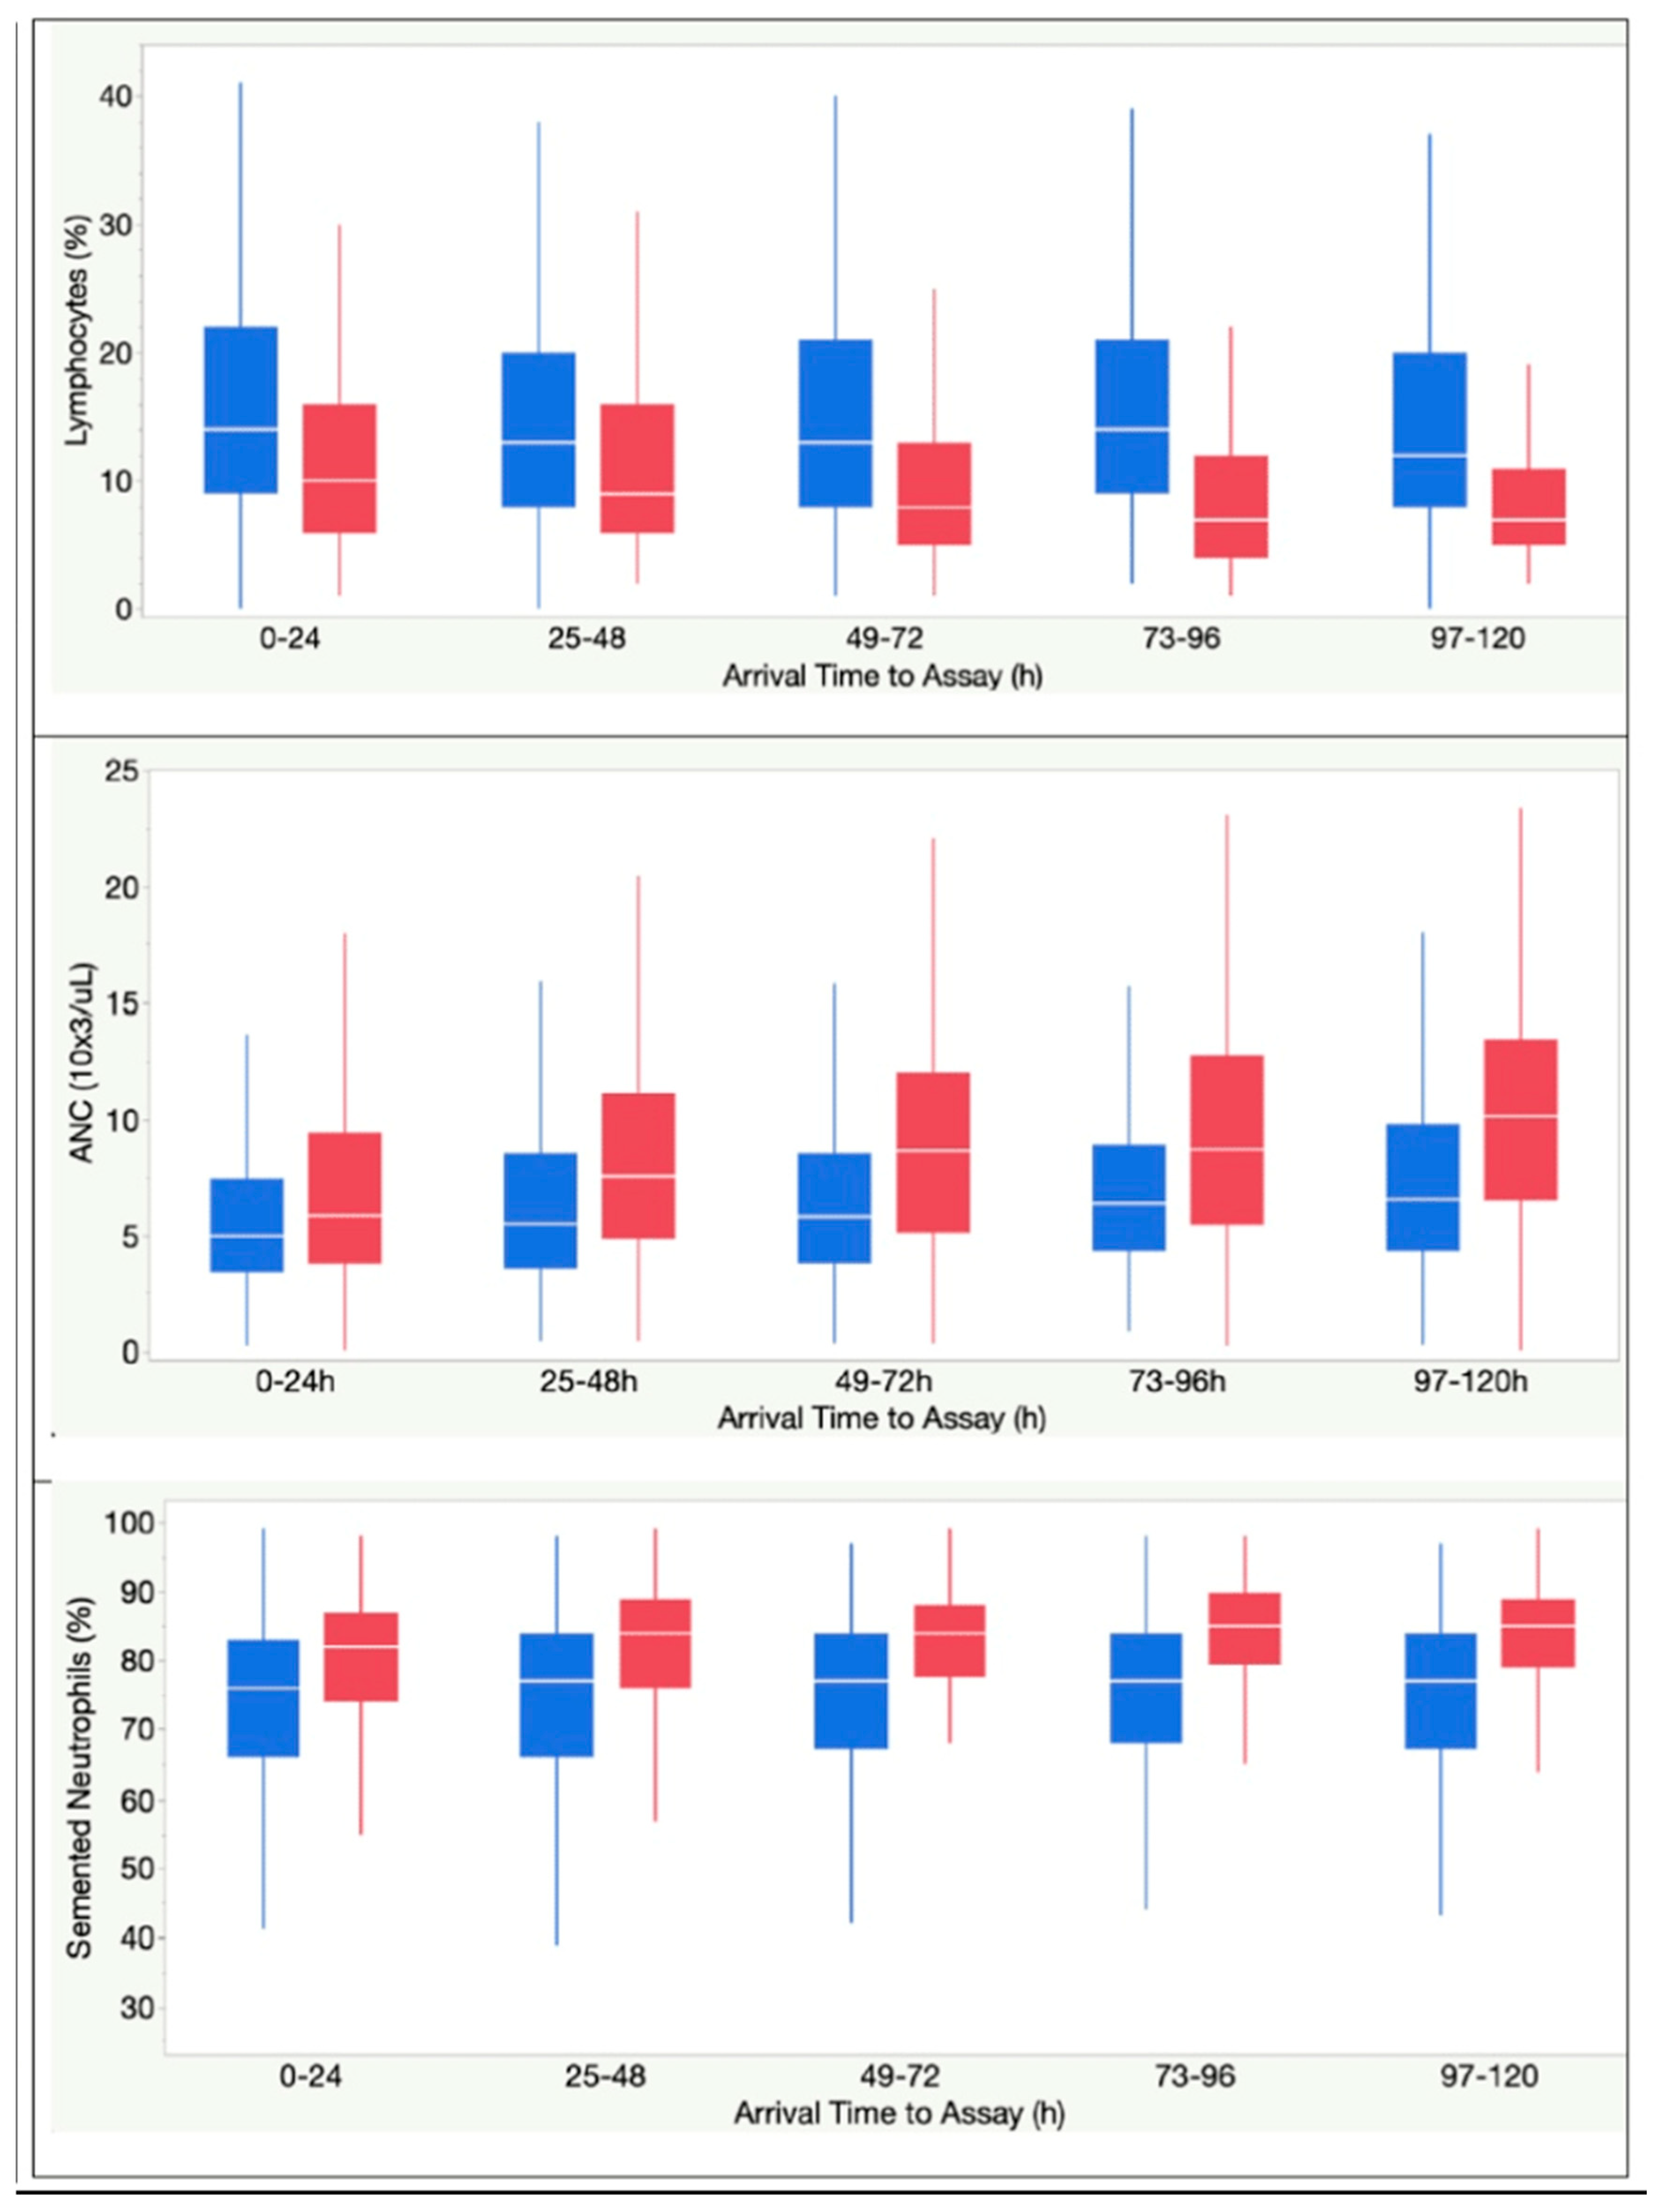
Figure 3.
A-Box plots demonstrating initial 5-day kinetics of survivors (blue) vs non-survivors (red) in intervals representing time from first vital sign at hospitalization to assay.
Figure 3.
A-Box plots demonstrating initial 5-day kinetics of survivors (blue) vs non-survivors (red) in intervals representing time from first vital sign at hospitalization to assay.
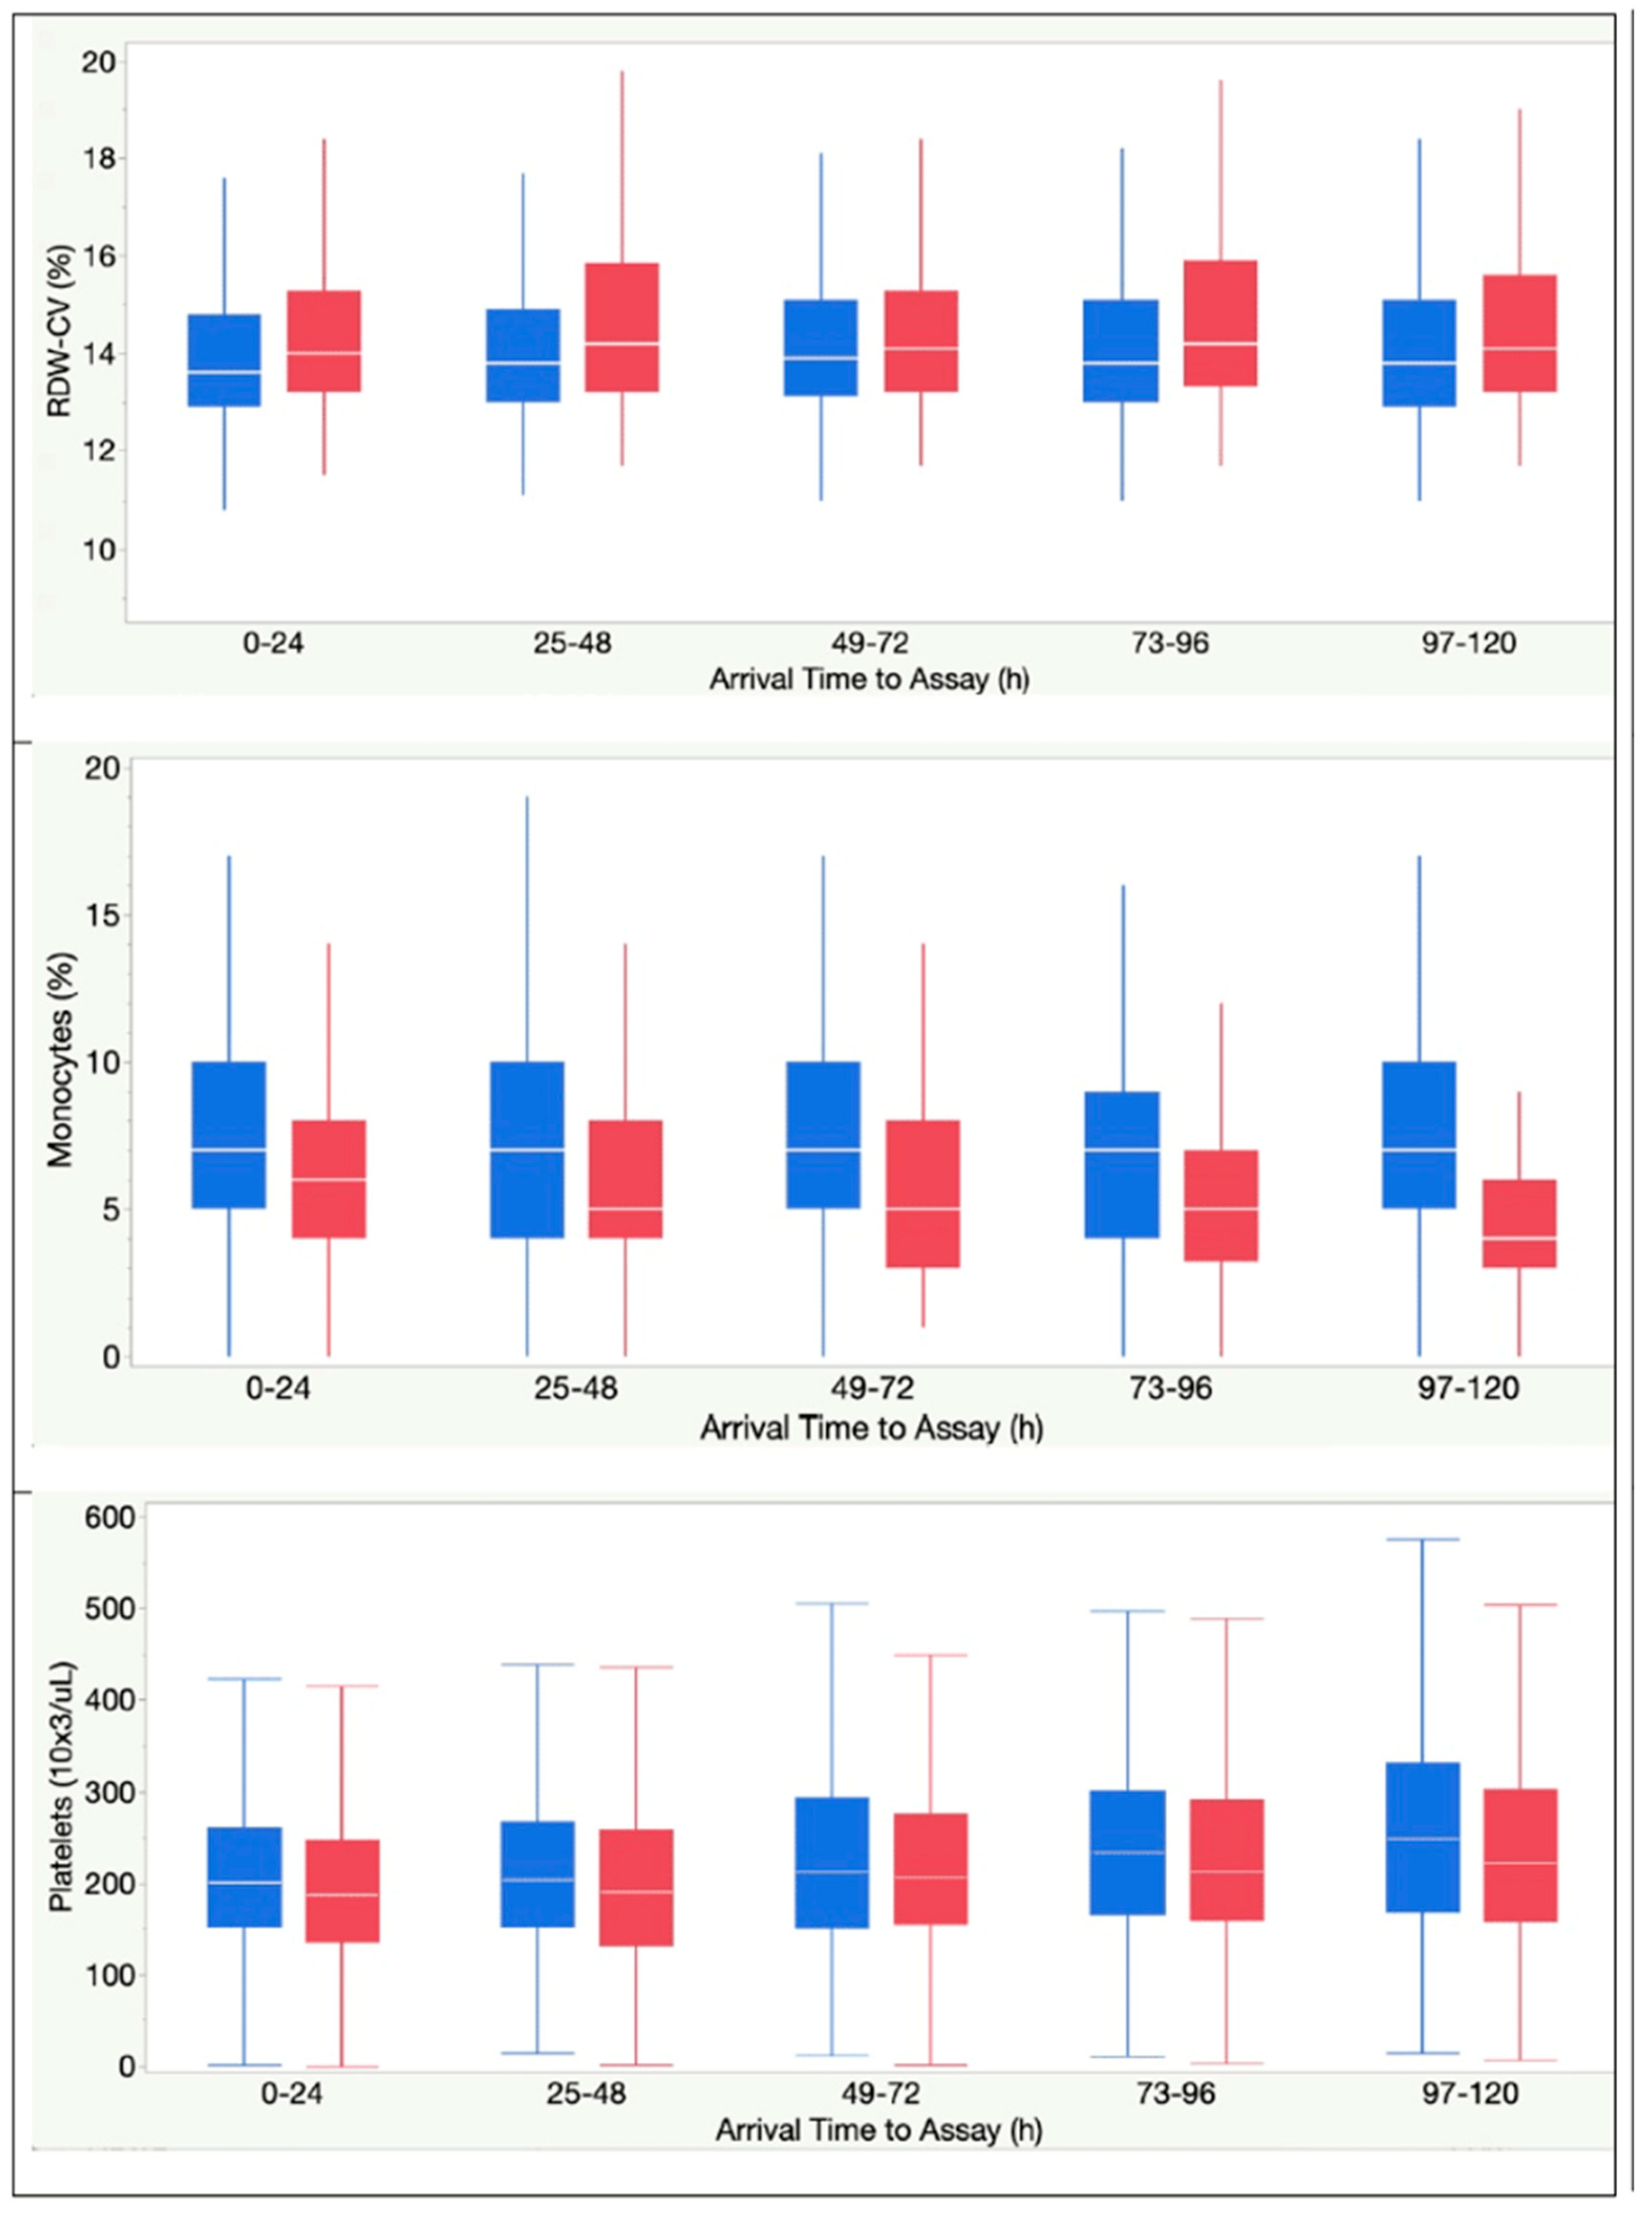

Table 1.
Patient characteristics and clinical measures within 24h of hospitalization.
| Variables | Hospital Mortality | P value | |
| No (Survivors) | Yes (Non-survivors) | ||
| N (%) | 3461 (88%) | 464 (12%) | |
| Patient characteristics | |||
| Age, years, median (IQR) | 67 (54-79) | 71 (61-81) | < .0001 |
| Sex, n (%) | |||
| Male | 1838 (53%) | 309 (67%) | < .0001 |
| Female | 1623 (47%) | 155 (33%) | < .0001 |
| Race, n (%) | |||
| White | 2707 (78%) | 363 (78%) | ns |
| Black | 341 (10%) | 41 (9%) | ns |
| Other | 413 (12%) | 60 (13%) | ns |
| BMI, kg/m2, median (IQR) | 28.7 (24.6-34.2) | 30.8 (25.9-36.0) | < .0001 |
| Elixhauser comorbidities, median (IQR) | 3 (2-5) | 5 (3-6) | < .0001 |
| Top 9 comorbidity categories, n (%) | |||
| Hypertension (pooled) | 2337 (68%) | 336 (72%) | ns |
| Obesity | 1157 (33%) | 220 (47%) | < .0001 |
| Neurologic diseases (pooled) | 602 (17%) | 215 (46%) | < .0001 |
| Diabetes mellitus (pooled) | 1031 (30%) | 172 (37%) | .0014 |
| Coagulopathy | 500 (14%) | 159 (34%) | < .0001 |
| Renal failure (pooled) | 571 (16%) | 132 (28%) | < .0001 |
| Chronic pulmonary disease | 752 (22%) | 106 (23%) | ns |
| Heart failure (pooled) | 474 (14%) | 105 (23%) | < .0001 |
| Iron deficiency anemia | 690 (20%) | 181 (39%) | < .0001 |
| CBC parameters and ratios, median (IQR) | |||
| WBC, 103 cells/mL | 6.9 (5.1-9.7) | 7.6 (5.0-11.1) | .0025 |
| Segmented neutrophils, % | 75 (66-82) | 81 (74-87) | < .0001 |
| Lymphocytes, % | 14 (9-21) | 10 (5-15) | < .0001 |
| Monocytes, % | 8 (5-10) | 4 (3-7) | < .0001 |
| Eosinophils, % | 0 (0-1) | 0 (0-0) | ns |
| Bands, % | 3 (1-7) | 4 (2-12) | < .0001 |
| Absolute Neutrophil Count, 103 ells/mL | 5.10 (3.51-7.54) | 5.97 (3.85-9.28) | < .0001 |
| Hemoglobin, gm/dL | 13.2 (11.7-14.5) | 13.3 (11.7-14.7) | ns |
| RDW-SD, (fL) | 44.5 (41.4-48.5) | 45.6 (42.8-50.3) | ns |
| RDW-CV, % | 13.6 (12.9-14.7) | 14.0 (13.2-15.2) | < .0001 |
| Platelet, 103 cells/mL | 205 (158-268) | 190 (142-257) | .0001 |
| ANC/ALC ratio | 5.5 (3.2-9.4) | 8.3 (5.0-16.4) | < .0001 |
| APC/ALC ratio | 222 (145-333) | 273 168-444) | < .0001 |
| Inflammatory markers, median (IQR) | |||
| CRP, mg/dL | 6.9 (2.8-12.1) | 11.4 (6.9-17.4) | < .0001 |
| Ferritin, ng/mL | 456 (203-935) | 966 (494-1709) | < .0001 |
| LDH, U/L | 308 (233-415) | 458 (355-648) | < .0001 |
| Coagulation markers, median (IQR) | |||
| D-dimer, mg/mL | 0.90 (0.54-1.71) | 1.30 (0.79-3.55) | < .0001 |
| Pro Time, s | 11.3 (10.8-12.0) | 11.5 10.9-12.8) | < .0001 |
| INR | 1.07 (1.02-1.14) | 1.09 (1.03-1.22) | < .0001 |
Table 2.
Bootstrap Forest Modeling showing relative explained variance and R2 of CBC parameters alone, inflammatory markers alone, and CBC parameters integrated with inflammatory markers.
Table 2.
Bootstrap Forest Modeling showing relative explained variance and R2 of CBC parameters alone, inflammatory markers alone, and CBC parameters integrated with inflammatory markers.
| Laboratory features in inflammatory biomarkers model (2a) | Percentage of feature contribution | Percentage of feature contribution | Overall R2 of model |
| LDH (U/L) | 45% | 53% | |
| CRP (mg/dL) | 30% | ||
| Ferritin (ng/mL) | 26% | ||
| Laboratory features in CBC model (2b) | Percentage of feature contribution | Percentage of feature contribution | Overall R2 of model |
| Monocytes (%) | 16% | 63% | |
| Lymphocytes (%) | 15% | ||
| Platelet (10X3/UL) | 15% | ||
| ANC (10X3/UL) | 15% | ||
| RDW-CV (%) | 15% | ||
| Segmented Neutrophils (%) | 13% | ||
| Bands (%) | 10% | ||
| Laboratory features in combined model (2c) | Percentage of feature contribution | Percentage of feature contribution | Overall R2 of model |
| LDH (U/L) | 45% | 69% | |
| RDW-CV (%) | 11% | ||
| Monocytes (%) | 11% | ||
| Platelet (10X3/UL) | 9% | ||
| Lymphocytes (%) | 9% | ||
| ANC (10X3/UL) | 8% | ||
| CRP (mg/dL) | 8% | ||
| Ferritin (ng/mL) | 8% | ||
| Segmented Neutrophils (%) | 8% | ||
| Bands (%) | 7% |
Disclaimer/Publisher’s Note: The statements, opinions and data contained in all publications are solely those of the individual author(s) and contributor(s) and not of MDPI and/or the editor(s). MDPI and/or the editor(s) disclaim responsibility for any injury to people or property resulting from any ideas, methods, instructions or products referred to in the content. |
© 2025 by the authors. Licensee MDPI, Basel, Switzerland. This article is an open access article distributed under the terms and conditions of the Creative Commons Attribution (CC BY) license (http://creativecommons.org/licenses/by/4.0/).
Copyright: This open access article is published under a Creative Commons CC BY 4.0 license, which permit the free download, distribution, and reuse, provided that the author and preprint are cited in any reuse.


