
Submitted:
30 March 2025
Posted:
31 March 2025
You are already at the latest version
Abstract
The objectives of the study include identifying key miRNAs and their target genes associated with severe tolerance in individuals exposed to aluminum and welding fumes and providing a molecular basis for the demonstration of the underlying regulatory mechanisms. In this study, the levels of seven miRNAs (hsa-miR-19a-3p, hsa-miR-130b-3p, hsa-miR-25-3p, hsa-miR-363-3p, hsa-miR-92a-3p, hsa-miR-24-3p, and hsa-miR-19b-3p) were compared to a reference miRNA (hsa-miR-16-5p). The qRT-PCR method was used on blood serum samples from 16 workers who were exposed to aluminum, 16 workers who were exposed to welding fumes, and 16 healthy controls who were not exposed to aluminum or welding fumes. We determined heavy metal levels from serum samples of workers exposed to aluminum and welding fumes and control groups using the ICP-OES method. The expression levels of hsa-miR-19a-3p and hsa-miR-19b-3p in aluminum-exposed and control groups were found to be statistically significant (p < 0.05). When workers exposed to welding fumes were compared with the those in the control groups, the expression levels of hsa-miR-19a-3p, hsa-miR-130b-3p, hsa-miR-92a-3p, and hsa-miR-24-3p were observed to be statistically significant (p < 0.05). This study shows that the identification of miRNAs and target genes in different biological functions and pathways plays an important role in understanding the molecular mechanisms of responses to heavy metal toxicity. We share the view that the study will make a significant contribution to the literature in that seven candidate miRNAs can be used as possible biomarkers for exposure to aluminum and welding fumes in humans.
Keywords:
expression
; miRNA
; qRT-PCR
; aluminum
; welding fume
; heavy metal exposure
1. Introduction
Heavy metal contamination is a growing environmental and public health concern due to its adverse effects on human health. Among toxic metals, Chromium (Cr), Copper (Cu), Nickel (Ni), Lead (Pb), Aluminum (Al), and Cadmium (Cd) are particularly significant due to their widespread industrial use and persistence in the environment. Chronic exposure to these metals has been associated with various health issues, including neurotoxicity, carcinogenesis, oxidative stress, and immune system dysfunction [1]. Recent studies have highlighted the role of microRNAs (miRNAs) in mediating cellular responses to heavy metal toxicity, particularly in regulating gene expression related to inflammation, apoptosis, and oxidative stress [2]
Aluminum (Al), the third most common element in the Earth’s crust, makes up over 8% of the planet’s surface yet it is not necessary for human health and has long been regarded as a safe and non-toxic metal. Researchers are growing increasingly concerned about aluminum’s harmful effects on the human body due to its increasing use and the toxicity mechanisms of aluminum remain incompletely understood. Al is the most common metal in daily life and is widely used in drinking water treatment systems, food additives, antacids, cosmetics, dairy products, and other daily uses. Vaccines also incorporate it as an adjuvant in microscale amounts. Al is neurotoxic and can cause significant cognitive impairment. Its main neurotoxic mechanism is to cause synaptic plasticity reduction and neuronal apoptosis [3].
miRNAs are a type of regulatory RNAs made up of 19–22 nucleotides. They control gene expression by matching bases with complementary sequences in target messenger RNA (mRNA) molecules. This stops translation of target mRNAs or causes them to be broken down. Evidence from a large body of research suggests that miRNAs may play a role in controlling crucial biological events such as cell proliferation, differentiation, development, and cell death [4]. Environmental variables, such as pharmaceuticals, hazardous metals, and organic contaminants may influence miRNA function in humans. The toxicant to which the cells are exposed determines the changes in miRNA expression levels. [5]. Widely used in industrial applications, water treatment, food additives, and medicines, aluminum is the most prevalent metal in the biosphere and the third most abundant element overall [6].
Welding is a rapidly expanding sector because it is a very effective method of joining metal parts. The health risks associated with welding fumes are faced daily by thousands of welders. Lead, aluminum, titanium, iron, zinc, and cadmium are some of the other probable elements included in the welding electrode. It is also conceivable for the electrode to have 19% chromium, 12% nickel, 3% molybdenum, about 0.8% silicon, and 0.8% manganese [7]. Multiple studies found robust correlations between ambient metal concentrations and exposure indicators, such as blood and urine metal concentrations. Asthma, bronchitis, pneumoconiosis, lung cancer, neurological diseases, and decreased kidney and reproductive system function are among many possible health problems caused by welding fumes, which are irritating and harmful. Metal particle mechanisms of action on miRNA expression might be better understood with larger-scale research [8].
During the course of welding the stainless steel, fumes that include nickel (Ni), manganese (Mn), iron (Fe), and chromium (Cr(III)) and chromium (Cr(VI)) compounds that dissolve in different amounts are released. In particular, the respiratory system and neurological system are vulnerable to the potentially harmful consequences of differentiated exposure. Some evidence suggests that soluble intermediate metals cause the molecular mechanism of the effects of welding fumes after inflammation through oxidative stress. Inhaling metal ion combinations with a high reduction potential trigger an oxidative stress reaction in the respiratory system [9].
miR-19a-3p and miR-19b-3p belong to the miR-17-92 cluster and are known to regulate crucial cellular processes such as proliferation, differentiation, and apoptosis. Studies have shown that exposure to hexavalent chromium [Cr(VI)] results in the downregulation of miR-19a-3p and miR-19b-3p in human blood samples, suggesting a potential role in chromium-induced carcinogenesis [10]. Additionally, research has indicated that miR-19a-3p regulates PTEN, a key tumor suppressor gene involved in the AKT signaling pathway, which is often disrupted upon heavy metal exposure [11].
miR-24-3p is a microRNA that plays a significant role in regulating DNA repair and cellular stress responses. Research has demonstrated that miR-24-3p modulates the cellular response to DNA damage by targeting key proteins involved in apoptosis and DNA repair mechanisms. For instance, miR-24-3p suppresses apoptosis by targeting the pro-apoptotic protein BIM and inhibits homology-directed DNA repair by downregulating BRCA1 expression [12]. Regarding the p53 signaling pathway, miR-24 has been shown to directly target p53, leading to enhanced cell death under oxidative stress conditions. This interaction suggests that miR-24 can modulate p53 activity, thereby influencing cellular responses to stress and maintaining genomic stability [13]. While specific studies on the impact of Cr exposure on miR-24-3p expression are limited, it is well-established that exposure to Cr(VI) induces oxidative stress and DNA damage.
Soil, plants, and animals can contain nickel (Ni), a metallic element. Exposure routes, concentration, chemical species, and physical form all have a role in the hazardous effects of nickel and nickel compounds on living beings. Workers in the Ni industries, whether they are manufacturing or utilizing the metal, are more likely to inhale Ni-contaminated air at work than the general population [14]. Studies have shown that being exposed to harmful metals like lead (Pb) changes the way genes are expressed by affecting epigenetic status. This may then change the harmful effects of Pb. It is interesting to note that more and more research is being done to find out how Pb-related disorders change epigenetic status, mainly by looking at DNA methylation and the expression of non-coding RNAs (nc-RNAs), especially miRNAs. Some inorganic and organic toxicants may cause changes in miRNA expression profiles. This can be a sensitive sign of both short-term and long-term exposure. Chronic lead poisoning is a complicated illness because it takes a long time for the harmful effects of the metal to start affecting people’s health. Genetic and environmental factors that interact with each other make the illness even more complicated. It might be helpful to keep an eye on changes in miRNA expression to guess how cells and the body will react to Pb-induced toxicity [15].
Cadmium (Cd) has long been known to have detrimental effects on human health [16]. Lung and kidney damage is the most common adverse effect of Cd exposure [17]. The molecular mechanism of Cd toxicity has only recently revealed Cd’s involvement in producing epigenetic changes [16]. In various metal sectors, hexavalent chromium (Cr (VI)) is used. This includes the leather industry, chromium manufacture, electroplating, welding technology, and others [18]. Cd exposure has been shown to downregulate miR-25-3p expression, leading to the upregulation of its target genes, including AMPK, ULK1, and PTEN. This modulation suggests that miR-25-3p plays a role in Cd-induced autophagy. Additionally, Cd exposure activates heat shock proteins, specifically Hsp70 and Hsp90, which are involved in the oxidative stress response and further mediate autophagy in Cd-treated hepatopancreatic cells [19].
Copper (Cu) is an element that naturally occurs in living things and has several biological uses, such as promoting healthy development and growth of bones, connective tissues, and organs. In addition to its role in wound healing and injury prevention, it also stimulates the immune system. It is an important part of many enzymes, like cytochrome oxidase and superoxide dismutase, and helps cells communicate and divide [20]. The link between Cu anomalies and Alzheimer’s disease (AD), the most common form of dementia in the elderly with a complex etiology, is being increasingly studied. There is evidence of a direct link between COMMD1, which controls the Cu pathway and hypoxia-inducible factor (HIF) HIF-1a in ischemia damage. However, there is not a lot of information available about how Cu is involved in hypoxia in AD right now [21].
First, the study used web-based bioinformatic tools to perform miRNA selection. We identified genes related to chromium (Cr), nickel (Ni), copper (Cu), lead (Pb), and aluminum (Al) using the comparative toxicogenomics database (CTD) (https://ctdbase.org/). The Biotools (https://www.biotools.fr/) website’s Venn Diagrams were used to find genes that are common among heavy metals like Chromium (Cr), Copper (Cu), Nickel (Ni), Lead (Pb), and Aluminum (Al). Then, we used MIENTURNET’s network analysis to assess the connections between target genes and miRNAs.
The aim of the study was to determine whether the expression levels of hsa-miR-19a-3p, hsa-miR-19b-3p, hsa-miR-130b-3p, hsa-miR-25-3p, hsa-miR-363-3p, hsa-miR-92a-3p, and hsa-miR-24-3p genes, which were identified in genes associated with aluminum and welding fume exposure show toxic effects at the genome level in cells. We used the candidate reference gene, hsa-miR-16-5p, as an internal control.
2. Materials and Methods
2.1. Identification of Cr, Ni, Cu, Pb, and Al-Related Genes Through a Comparative Toxicogenomics Database (CTD)
The Comparative Toxicogenomics Database (CTD) (https://ctdbase.org/) was used to find genes linked to Cr, Ni, Cu, Pb, and Al. The CTD is a public database that aims to advance understanding of how environmental exposures affect human health. Chemical gene/protein interactions provide manually curated information on chemical-disease and gene-disease associations.These data are integrated with functional and pathway data to help develop hypotheses about the mechanisms underlying environmentally influenced diseases.
After CTD screening, it was found that 761 genes were linked to Al, 889 genes were linked to Cr, 2440 genes were linked to Cu, 3040 genes were linked to Ni, and 1054 genes were linked to Pb. Using Venn diagrams via the Biotools (https://www.biotools.fr/) web portal, 69 (ALB, BAX, C3, CASP3, CASP9, CAT, CXCL8, CYP7A1, FOS, GPX1, GSR, HAVCR1, HMOX1, IGF1, IGF2, IL1B, IL4, IL6, JUN, MAPK3, MAPT, MMP2, NFE2L2, PIK3R1, RELA, SLC2A1, SOD1, SOD2, TF, TGFB1, TNF, ACHE, ACSL4, ADH1B, ATF2, BCL2, BCL2L1, CASP12, COL1A1, CRP, CYCS, ELN, ESR1, FDFT1, FDPS, G6PD, GCHFR, IL2, KRT5, LRIG3, LYZ, MAP1LC3B, MCM8, MYC, NAA15, NOS2, PADI2, PINK1, PRKN, PTGS2, PTK2, RPL37, RRM2, SQSTM1, STAT1, TFRC, VEGFA, VIM, XDH69) common genes were detected from heavy metals: Cr, Cu, Ni, Pb, and Al (Figure 1).
2.2. MIENTURNET (MicroRNA ENrichment TURned NETwork) Analysis
In the present study, MIENTURNET’s network analysis was used to evaluate the relationships between target genes and miRNAs. The MIENTURNET online tool was used to determine which miRNAs were induced by Cr, Ni, Cu, Pb, and Al based on genes associated with heavy metal exposure. We determined the biological significance of these miRNAs by constructing a miRNA target interaction network and performing functional enrichment analysis. miRNAs thought to play a role in Cr, Ni, Cu, Pb, and Al toxicity responses associated with 69 genes were investigated as a result of miRTarBase and TargetScan miRNA-target enrichment analyses.
The threshold value for the minimum number of miRNA-target interactions was taken as 1 and the threshold value for adjusted p value (FDR) was taken as 1. From the analysis results obtained, hsa-miR-19a-3p, hsa-miR-130b-3p, hsa-miR-25-3p, hsa-miR-363-3p, hsa-miR-92a-3p, hsa-miR-24-3p, and hsa-miR-19b-3p miRNAs associated with Cr, Ni, Cu, Pb, and Al toxicity were included in the study. hsa-miR-16-5p was selected as the reference miRNA.
The false discovery rate (FDR) was calculated using the nominal P value obtained from the hypergeometric test.We determined fold enrichment by dividing the genes in a pathway in the list by the background percentage.FDRs tend to be smaller for larger pathways due to increased statistical power. We use this measure to show how strongly a pathway overrepresents certain genes.Using the MIENTURNET miRNA-target enrichment analysis, the best pathways based on FDR were chosen from 69 genes linked to the toxicity of five heavy metals that were part of the study. The pathways were then ranked by fold enrichment, and the best miRNAs were found using miRTarBase (Table 1) and TargetScan (Table 2).
Accordingly, hsa-miR-19a-3p was found to have high interactions with ESR1 (Estrogen Receptor 1), TNF (tumor necrosis factor), TF (Transferrin), MYC (MYC Proto-Oncogene, BHLH Transcription Factor), ACSL4 (Acyl-CoA Synthetase Long Chain Family Member 4), PRKN (Parkin RBR E3 Ubiquitin Protein Ligase) genes, hsa-miR-130b-3p with ESR1, ACSL4, MMP2 (Matrix Metallopeptidase 2), IGF1 (Insulin Like Growth Factor 1) genes, hsa-miR-25-3p with MYC gene, hsa-miR-363-3p with CASP3 (Caspase 3) gene, hsa-miR-92a-3p with CYP7A1 (Cytochrome P450 Family 7 Subfamily A Member 1), GCHFR (GTP Cyclohydrolase I Feedback Regulator), MYC genes, hsa-miR-24-3p with MYC, TGFB1 (Transforming Growth Factor Beta 1), RRM2 (Ribonucleotide Reductase Regulatory Subunit M2), HMOX1 (heme oxygenase 1 gene), IGF1, IL4 (Interleukin-4), IL1B (Interleukin 1 Beta), TNF genes, hsa-miR-19b-3p with ESR1, LRIG3 (Leucine Rich Repeats And Immunoglobulin Like Domains 3), ATF2 (Activating Transcription Factor 2), TGFB1, ACSL4, PRKN genes via miRTarBase database (Table 1).
In the TargetScan database, it was determined that hsa-miR-19a-3p/hsa-miR-19b-3p had high interaction with ESR1, LRIG3, ATF2, IGF1, ACSL4, HAVCR1 (Hepatitis A Virus Cellular Receptor 1), and SLC2A1 (solute carrier family 2 member 1) genes; hsa-miR-130a-3p with IGF1, ESR1, ACSL4, SLC2A1, and TNF genes; hsa-miR-25-3p/hsa-miR-363-3p/hsa-miR-92a-3p with NAA15 (N-Alpha-Acetyltransferase 15, NatA Auxiliary Subunit) gene; and hsa-miR-24-3p with G6PD (Glucose-6-Phosphate Dehydrogenase) gene (Table 2).
2.3. Sample Size
In the study, sample size calculation was done using the ANOVA method, and it was calculated using an open access website as software (https://homepage.univie.ac.at/robin.ristl/samplesize.phptest=anova).In the calculation method (in miRNA values measured according to the reference miRNA value, in any group with an estimated standard deviation of 0.5 units, a 1-unit difference (Type I error 0.05, Type II error 0.20, power 0.80), the minimum sample size for each group is 16 people. Blood samples were analyzed by taking them from a company that has an occupational physician and regularly follows occupational safety measures and that performs aluminum casting and welding operations. Office workers without any diagnosed diseases and without exposure to aluminum and welding fumes made up the control group.
The Public Health Department of the X Faculty of Medicine evaluated workers who applied to the Occupational Diseases Polyclinic for diagnostic accuracy, took their consent forms and blood samples, and began the study. The study included 16 workers between the ages of 20-55 who were exposed to aluminum and had no disease, 16 workers who were exposed to welding fumes and had no disease, and 16 healthy controls who were known not to have been exposed to aluminum or welding fumes. Istanbul University, Faculty of Science, Department of Biology University Trace Element Analysis Laboratory tested serum samples taken from workers and healthy controls for aluminum and welding fume exposure. The inductively coupled plasma-optical emission spectrometry (ICP-OES) method was used to find out how much of the heavy metals Al, Cd, Cr, Cu, Ni, and Pb were in serum samples. The methodological study aims to identify miRNAs potentially associated with heavy metal exposure.
The age range of workers exposed to aluminum is 20-55. The age range of workers exposed to welding fumes is 20-54. The age range of healthy control groups is 32-55. All volunteers participating in the study are male. The X Clinical Research Ethic Committee approved our research on January 8, 2025, with the following number and date: E-29624016-050.99-3104384. Each individual gave their express consent before taking part.
2.4. Serum Preparation
10 ml of venous blood was placed in vacuum-dry blood collection tubes and incubated at room temperature for 30 minutes. Then, it was first centrifuged at 4ºC at 1900 x g for 10 minutes, and then the upper serum phase was transferred to a new tube and then centrifuged again at 4ºC at 3000 x g for 15 minutes. The completed serum was separated into eppendorf tubes and frozen at -80°C for later use.
2.5. Microwave Acid Extraction
In order to use ICP-OES (Inductively Coupled Plasma-Optical Emission Spectrometer) to measure heavy metal levels, serum samples must first be broken down and turned into a solution. First, we used 1 ml of serum samples. The serum sample was put in Teflon containers of a Berghoff wet separation device (Italy) along with 1.9 ml of nitric acid, 2 ml of hydrogen peroxide, and 3 ml of ultrapure water. The samples were heated in a microwave to 130°C for 8 minutes, then 155°C for 5 minutes with 5°C increases, 185°C for 12 minutes with 5°C increases, 100°C for 5 minutes with 5°C increases, and finally 50°C for 5 minutes with a sudden drop in pressure. Acid extraction was then done on the samples.
2.6. ICP-OES Parameters
Quantitative analyses of heavy metals for serum samples were performed using a Perkin Elmer brand Optima 7000DV model ICP-OES device with a concentric nebulizer, standard-section cyclonic spray chamber, alumina injector, and quartz torch. We accepted the relative standard deviation as 10% and carried out nine replicate analyses. We tested the device’s sensitivity and accuracy with heavy metal mixtures of 0.6, 0.8, 1.0, 2.0, 4.0, and 5.0 μg/L and an internal standard of 1.0 μg/L manganese. Before analyzing real samples, we performed calibration and determined stability. It was set so that the RF power was 1.3 kW, the nebulizer gas flow rate was 0.6 (L.min-1), the auxiliary gas flow rate was 0.2 (L.min-1), the plasma gas flow rate was 16.0 (L.min-1), the sample aspiration rate was 1.0 (mL.min-1), the platinum element detection wavelengths were 265.945 and 214.423 nm, the argon flow rate was 8 bar, and the nitrogen flow rate was 5 bar.
2.7. RNA Isolation and cDNA Synthesis
miRNAs were isolated from patients’ serum samples and control serum samples using the miRNeasy Serum/Plasma Kit (catalog no. 217204; Qiagen, USA) according to the manufacturer’s instructions. In order to determine the amount and quality of RNA, the NanoDrop 2000c (Thermo Fisher Scientific, USA) was used (A260/A280: 1.8-2.0). cDNA synthesis from samples was performed using miRCURY LNA RT Kit (catalog no. 339340; Qiagen, USA) and Applied Biosystems 2720 Thermal Cycler (California, USA). The expression levels of miRNAs were determined using the miRCURY LNA SYBR Green PCR Kit (catalog no. 339346; Qiagen, USA) and the QIAGEN Rotor-Gene Q. miRNA assay information used for miRCURY LNA miRNA PCR analysis is given in Table 3.
2.8. Quantitative Real-Time Polymerase Chain Reaction (qRT-PCR)
The Rotor-Gene Q RT-PCR device (Qiagen, USA) received a total reaction volume of 10 μl from the Qiagen RT2 SYBR Green qPCR mastermix kit, which included 5 μl of 2x miRCURY SYBR green master mix, 1 μl of ddH2O, 1 μl of resuspended PCR primer mix, and 3 μl of cDNA template (diluted 1:30) (Table 4). hsa-miR 16-5p was selected as the reference gene. The PCR process was performed once.
2.9. Data Analysis and Statistics
The variables obtained from the study at the proportional measurement level are presented as mean, median, standard deviation, minimum, and maximum, and variables at the classificatory measurement level are presented as number and percentage. The distribution of age, working years, and smoking among the three groups, heavy metal analysis results were performed with One-Way Analysis of Variance (ANOVA). Multiple comparisons after analysis were made with the TUKEY test.
Using Ct data obtained from RT-PCR experiments, fold changes were calculated for each miRNA relative to each reference miRNA in the examined condition by the Livak (2-ΔΔCt) method. Statistical evaluation: ΔCt data were calculated according to hsa-miR-16-5p, which was taken as the reference miRNA in the aluminum, source, and control groups..
hsa-miR-16-5p is frequently utilized as a reference gene in metal exposure studies due to its stable expression across various conditions, including different metal exposures. This stability makes it a reliable normalization control in quantitative real-time PCR (qRT-PCR) and other gene expression analyses, ensuring accurate comparisons of target miRNA expression levels [33,34].
A comparison of different miRNA values was performed using the Mann Whitney U test according to the study year group and smoking group. Two-way analysis of variance was used to compare the interaction of each miRNA difference value with the smoking year group and study year group.
In terms of occupational health and safety, it is very important to know how accurately individuals exposed to heavy metals can be distinguished from healthy individuals. In the decision-making process, ROC (Receiver Operating Characteristic) analysis was used to assess the discriminatory power of the test. We conducted the ROC analysis using the licensed software IBM SPSS 30 for Windows, provided by Istanbul University (https://bilgiislem.istanbul.edu.tr/tr/yalis/Veri%20Analizi/). Statistical significance was determined using a two-tailed test, with p < 0.05 considered significant.
3. Results
3.1. Demographic Information Distributions
When the ages, working years and smoking distribution of the participants were examined, no statistically significant difference was found (p>0.05) (Table 5).
3.2. Serum Heavy Metal Analyses
The simultaneous biological monitoring of chromium, cadmium, aluminum, nickel, copper, and lead in the serum of aluminum workers, welding workers, and a control group was performed using ICP-OES. The results of the metal concentrations measured in the serum of aluminum workers, welding workers, and the control group are presented in Table 6.
The results shown in Table 4 present the serum concentrations tested in aluminum workers, welding workers, and controls. The mean serum concentrations of metal workers were significantly higher in Al and Pb compared to the control group. These differences were found to be statistically significant (p < 0.001). Although Cu, Cr, and Ni concentrations were higher in metal and aluminum workers, the differences were not statistically significant (p > 0.05).
3.3. Correlation Analysis
When Table 7 is examined, weak positive correlations were observed between serum aluminum values and hsa-miR-19a-3p (r=0.319, p=0.027), hsa-miR-19b-3p (r=0.413, p=0.003), hsa-miR-130b-3p (r=0.356, p=0.013), hsa-miR-25-3p (r=0.304, p=0.036), hsa-miR-92a-3p (r=0.354, p=0.014), and hsa-miR-24-3p (r=0.411, p=0.004). Serum chromium values showed weak positive correlations with hsa-miR-363-3p (r=0.383, p=0.03) and hsa-miR-92a-3p (r=0.363, p=0.041). Additionally, a weak negative correlation was observed between serum copper values and hsa-miR-363-3p (r=0.295, p=0.042).
We found no statistically significant relationship between serum nickel levels and the Ct values of all miRNAs (p > 0.05). However, weak positive correlations were observed between serum lead levels and the miRNA values of hsa-miR-130b-3p, hsa-miR-92a-3p, and hsa-miR-24-3p, with correlation coefficients of r = 0.399, p = 0.005; r = 0.370, p = 0.01; and r = 0.478, p < 0.001, respectively.
3.4. Differential microRNA Expression Analyses
When comparing the 16 aluminum-exposed and control groups, the ΔCt values for the housekeeping gene hsa-miR-16-5p showed that hsa-miR-19a-3p and hsa-miR-19b-3p exhibited statistically significant differences (p < 0.05). However, the expression levels of hsa-miR-130b-3p, hsa-miR-25-3p, hsa-miR-363-3p, hsa-miR-92a-3p, and hsa-miR-24-3p did not differ significantly between the two groups (p > 0.05). Additionally, hsa-miR-16-5p indicated that the ΔCt values for hsa-miR-19a-3p, hsa-miR-130b-3p, hsa-miR-92a-3p, and hsa-miR-24-3p were statistically significant (p < 0.05) between the 16 welding fume-exposed and control groups (Table 8).
When comparing aluminum-exposed individuals with non-aluminum-exposed individuals, hsa-miR-19a-3p, hsa-miR-19b-3p, hsa-miR-130b-3p, hsa-miR-25-3p, hsa-miR-363-3p, hsa-miR-92a-3p, and hsa-miR-24-3p showed downregulation with fold changes of -1.58, -1.69, -1.53, -1.33, -1.01, -1.16, and -1.49, respectively. Similarly, when comparing individuals exposed to welding fumes with those not exposed, hsa-miR-19a-3p, hsa-miR-19b-3p, hsa-miR-130b-3p, hsa-miR-25-3p, hsa-miR-363-3p, hsa-miR-92a-3p, and hsa-miR-24-3p were downregulated with fold changes of -1.35, -1.16, -2.36, -1.06, -1.24, -1.76, and -2.46, respectively (Table 8).
3.5. Two-Way Analysis of Variance (ANOVA)
We evaluated how two independent variables (study year and smoking) affected a dependent variable (miRNA). We tested the effect of more than one independent variable on the dependent variable at the same time and examined whether there was an interaction between the independent variables. The miRNAs hsa-miR-19a-3p, hsa-miR-19b-3p, hsa-miR-130b-3p, hsa-miR-92a-3p, and hsa-miR-24-3p, which were found to differ between the groups, were evaluated with a two-way analysis of variance based on study year and smoking status.
The ΔCt values for hsa-miR-19a-3p, hsa-miR-130b-3p, hsa-miR-25-3p, hsa-miR-363-3p, hsa-miR-92a-3p, hsa-miR-24-3p, and hsa-miR-19b-3p miRNAs, obtained according to the study groups and the hsa-miR-16-5p reference gene, are provided in Table 8, Table 9, Table 10, Table 11, Table 12 and Table 13, based on study year and smoking status. The years of work revealed a significant difference in the hsa-miR-24-3p Ct value of the control group. This difference was significantly higher compared to those who had worked for 11 years or more (Table 9).
The years of study revealed no significant difference in the ΔCt values of the aluminum group (p > 0.05) (Table 10).
Depending on their years of experience, welding workers showed a significant difference in their hsa-miR-363-3p Ct values. The difference was significantly greater for workers with 11 or more years of experience (p < 0.05) (Table 11).
We found no statistically significant correlation between Ct values and the number of years of smoking in the control group (Table 12).
The aluminum workers group did not show statistically significant Ct values based on the number of years smoked (Table 13).
In the evaluations according to study year, a significant difference in ΔCt hsa-miR-24-3p was found in individuals who had worked for 11 years or more (p<0.05). In welding workers, a significant difference was observed in ΔCt hsa-miR-363-3p in those who had worked for 11 years or more (p<0.05). The evaluations based on smoking status revealed a significant difference in Ct hsa-miR-19a-3p and Ct hsa-miR-25-3p among welding workers. Those who smoked one pack of cigarettes per day for more than 5 years showed a significantly higher difference in hsa-miR-19a-3p and hsa-miR-25-3p (p<0.05). It is suggested that metal fume exposure and smoking influence both hsa-miRs.
When the important Ct values were analyzed, several miRNAs showed differences between the source group and the control group based on both the study year and the number of years of smoking. However, in the source group, hsa-miR-24-3p exhibited a two-way interaction. In the source group, the trend was not in the same direction as in the control and aluminum groups. No significant differences were found in other miRNAs between the study group, study year, and smoking group. We observed that the two-way interaction followed the same direction. The F values and p-values obtained indicate whether the effects of the independent variables on the dependent variable are significant. Table 15, Table 16, Table 17, Table 18, Table 19, Table 20, Table 21, Table 22, Table 23, Table 24, Table 25 and Table 26 present the results of our examination of the interaction effect between the independent variables.
The values of hsa-miR-19a-3p, hsa-miR-19b-3p, hsa-miR-24-3p, hsa-miR-363-3p, and hsa-miR-92a-3p, which were found to be significant among the three groups, were evaluated using Two-Way Analysis of Variance based on working years and smoking status. The results are presented in Figures 2a,b, 3a,b, 4a,b, 5a,b, and 6a,b.
Figure 3.
(a) Two-way interaction in hsa-miR-19b-3p by group and study year (F=0.46; p=0.63); (b) Two-way interaction in hsa-miR-19b-3p by group and smoking year (F=1.18; p=0.33).
Figure 3.
(a) Two-way interaction in hsa-miR-19b-3p by group and study year (F=0.46; p=0.63); (b) Two-way interaction in hsa-miR-19b-3p by group and smoking year (F=1.18; p=0.33).
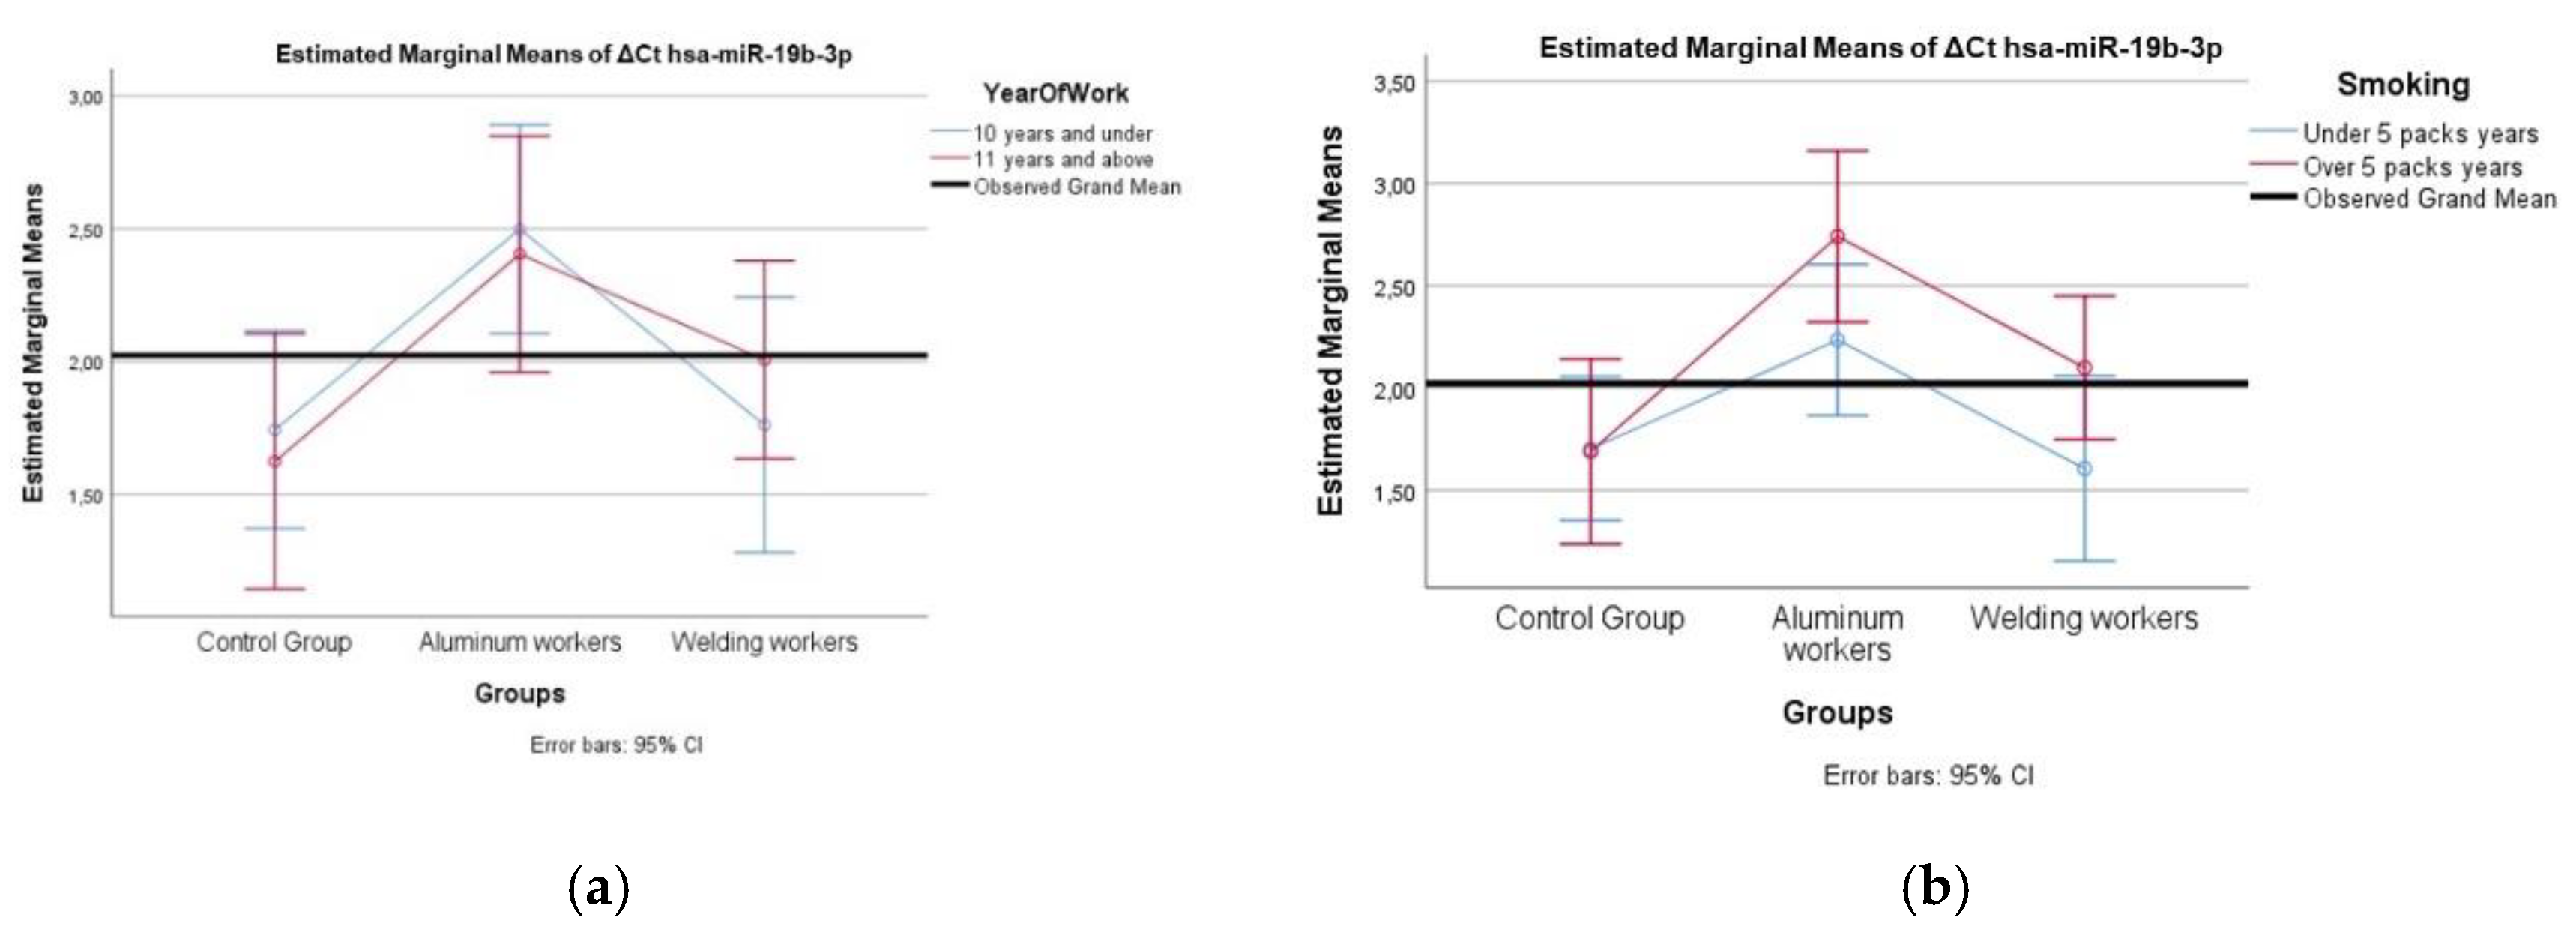
The interaction of ∆Ct values for six of the seven hsa-miRs included in the study was analyzed in relation to the study year and smoking year (Table 15, Table 16, Table 17, Table 18, Table 19, Table 20, Table 21, Table 22, Table 23, Table 24, Table 25 and Table 26). A two-way interaction was found only in ΔCt hsa-miR-24-3p between the working year and groups. The ΔCt hsa-miR-24-3p value in welding workers differs according to the working years (Table 19). The differences in ΔCt hsa-miR-24-3p values in welding workers are not consistent in direction. This result suggests that people are affected differently by welding fumes over time (F = 3.42; p = 0.04, Figure 4a). The interaction between the working groups and smoking years was not found to be statistically significant in all ΔCt miR values (p > 0.05).
Figure 4.
(a) Two-way interaction in hsa-miR-24-3p by group and study year (F=3.42; p=0.04); (b) Two-way interaction in hsa-miR-24-3p by group and smoking year (F=1.19; p=0.31).
Figure 4.
(a) Two-way interaction in hsa-miR-24-3p by group and study year (F=3.42; p=0.04); (b) Two-way interaction in hsa-miR-24-3p by group and smoking year (F=1.19; p=0.31).
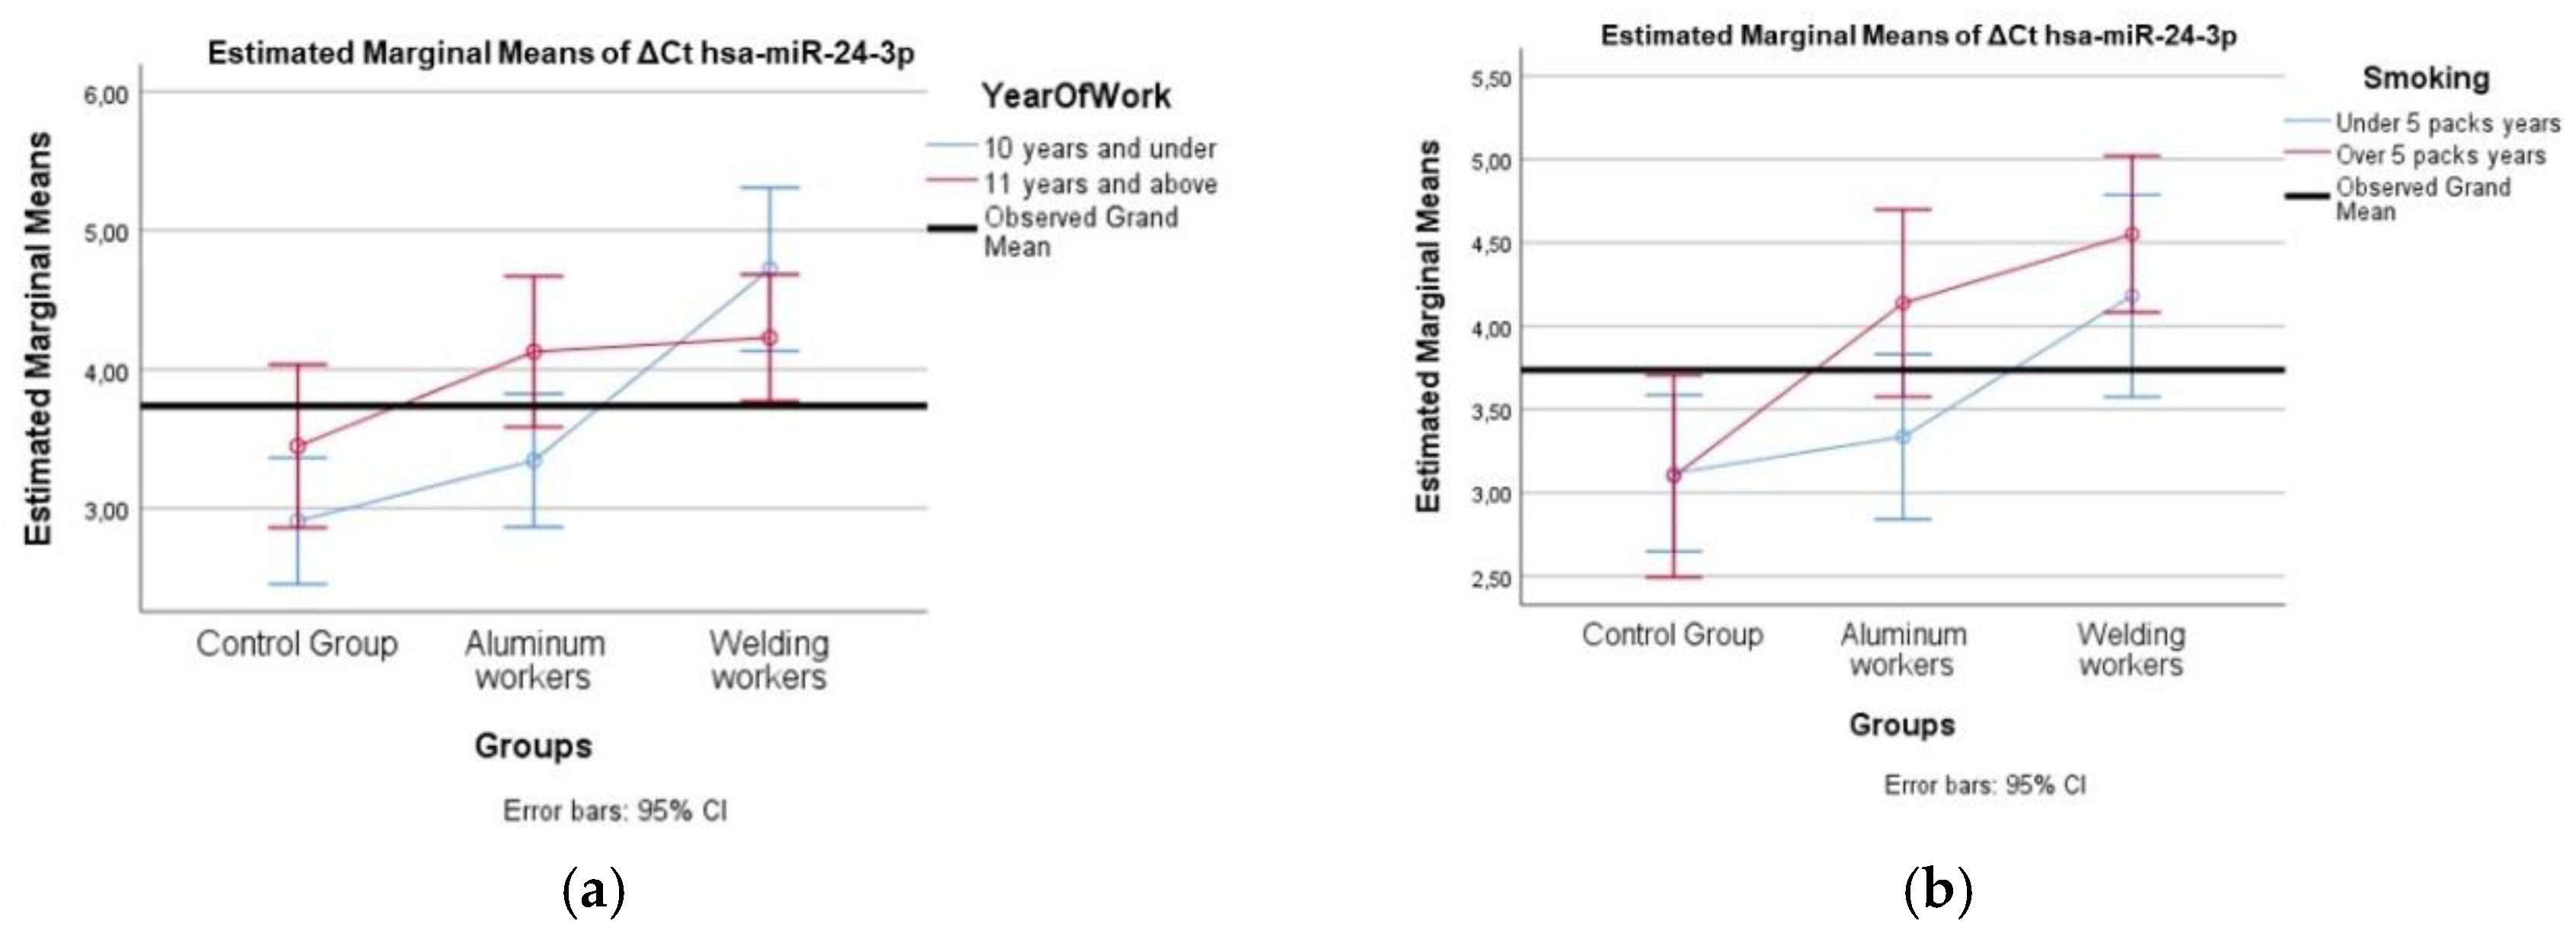
Figure 5.
(a) Two-way interaction in hsa-miR-92a-3p hsa-miR-92a 3p by group by group and study year (F=0.07; p=0.92); (b) Two-way interaction in and smoking year (F=2.41; p=0.10).
Figure 5.
(a) Two-way interaction in hsa-miR-92a-3p hsa-miR-92a 3p by group by group and study year (F=0.07; p=0.92); (b) Two-way interaction in and smoking year (F=2.41; p=0.10).
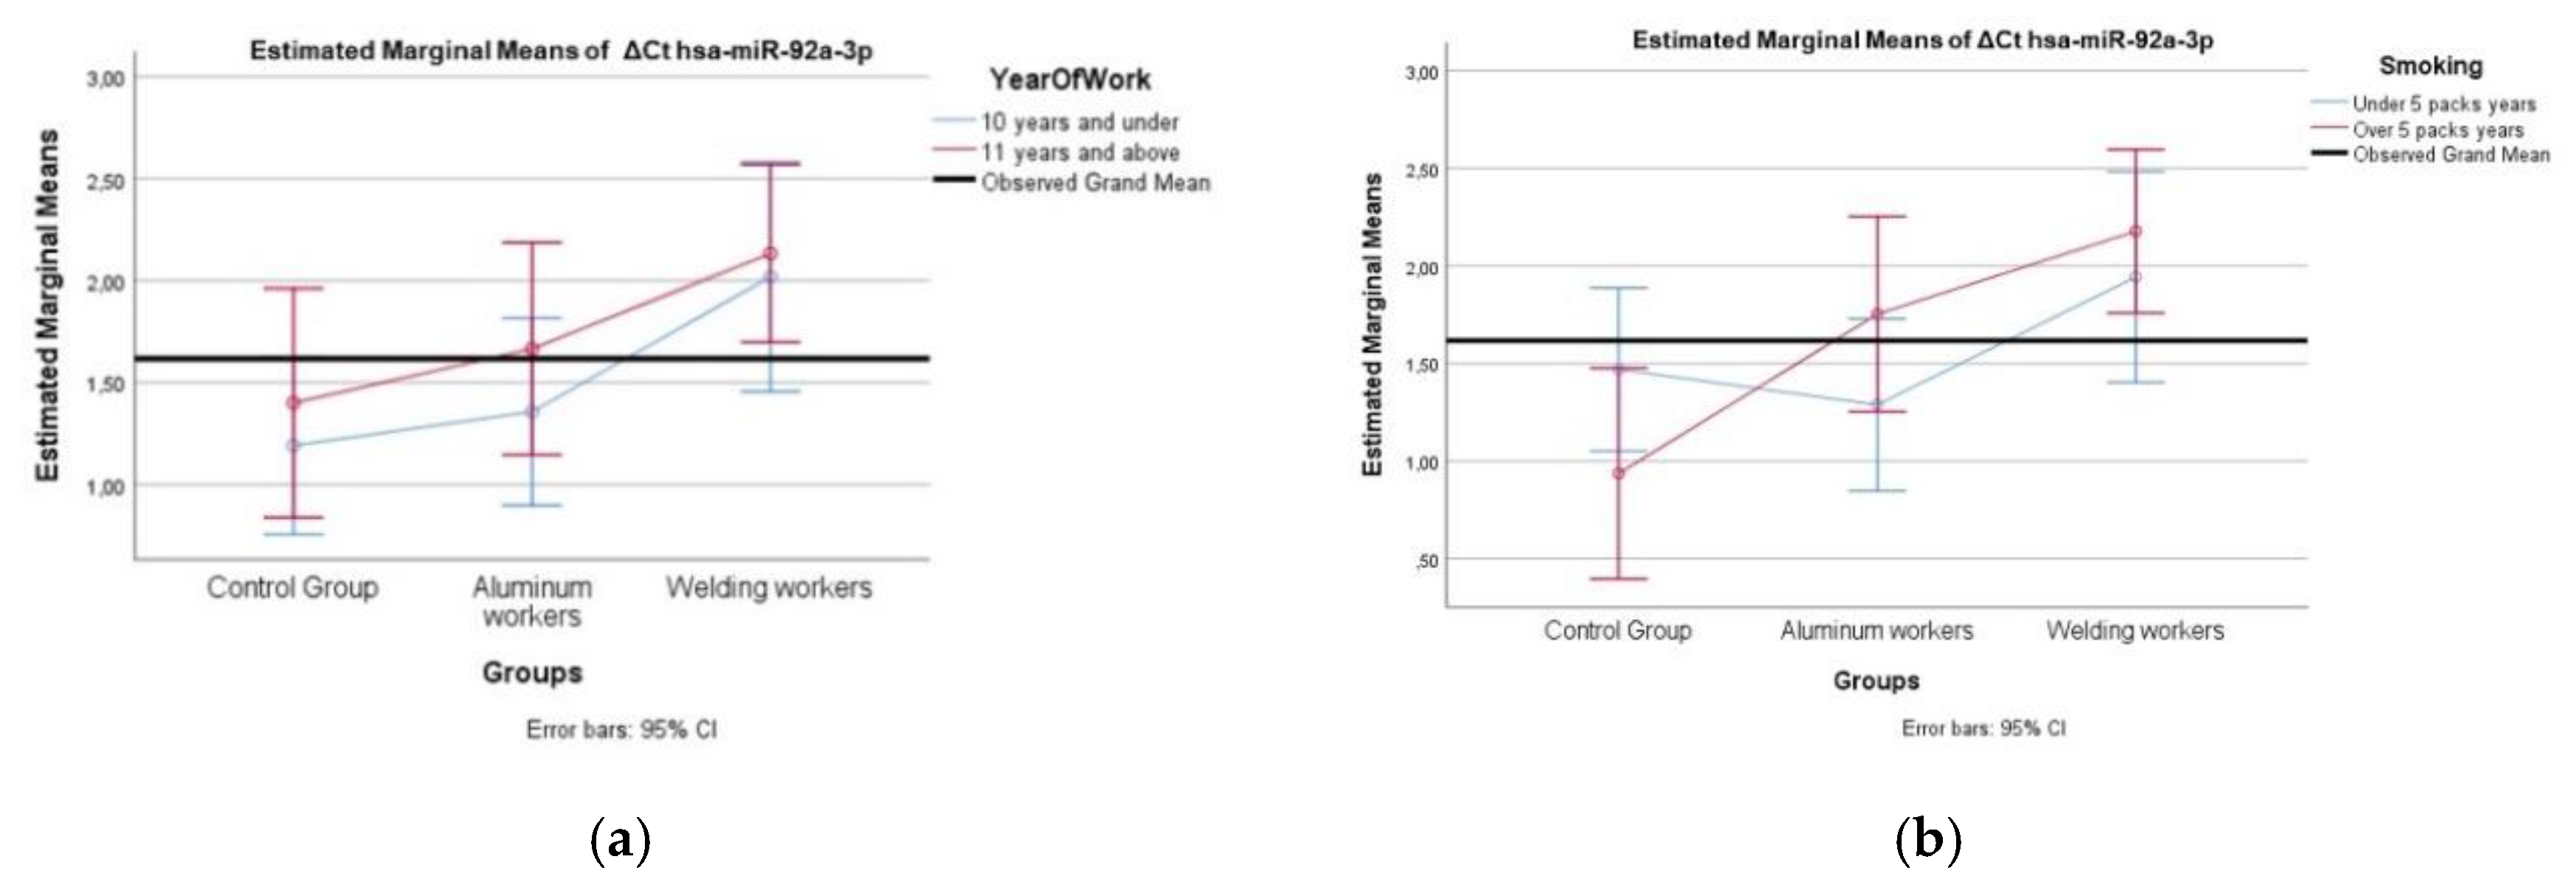
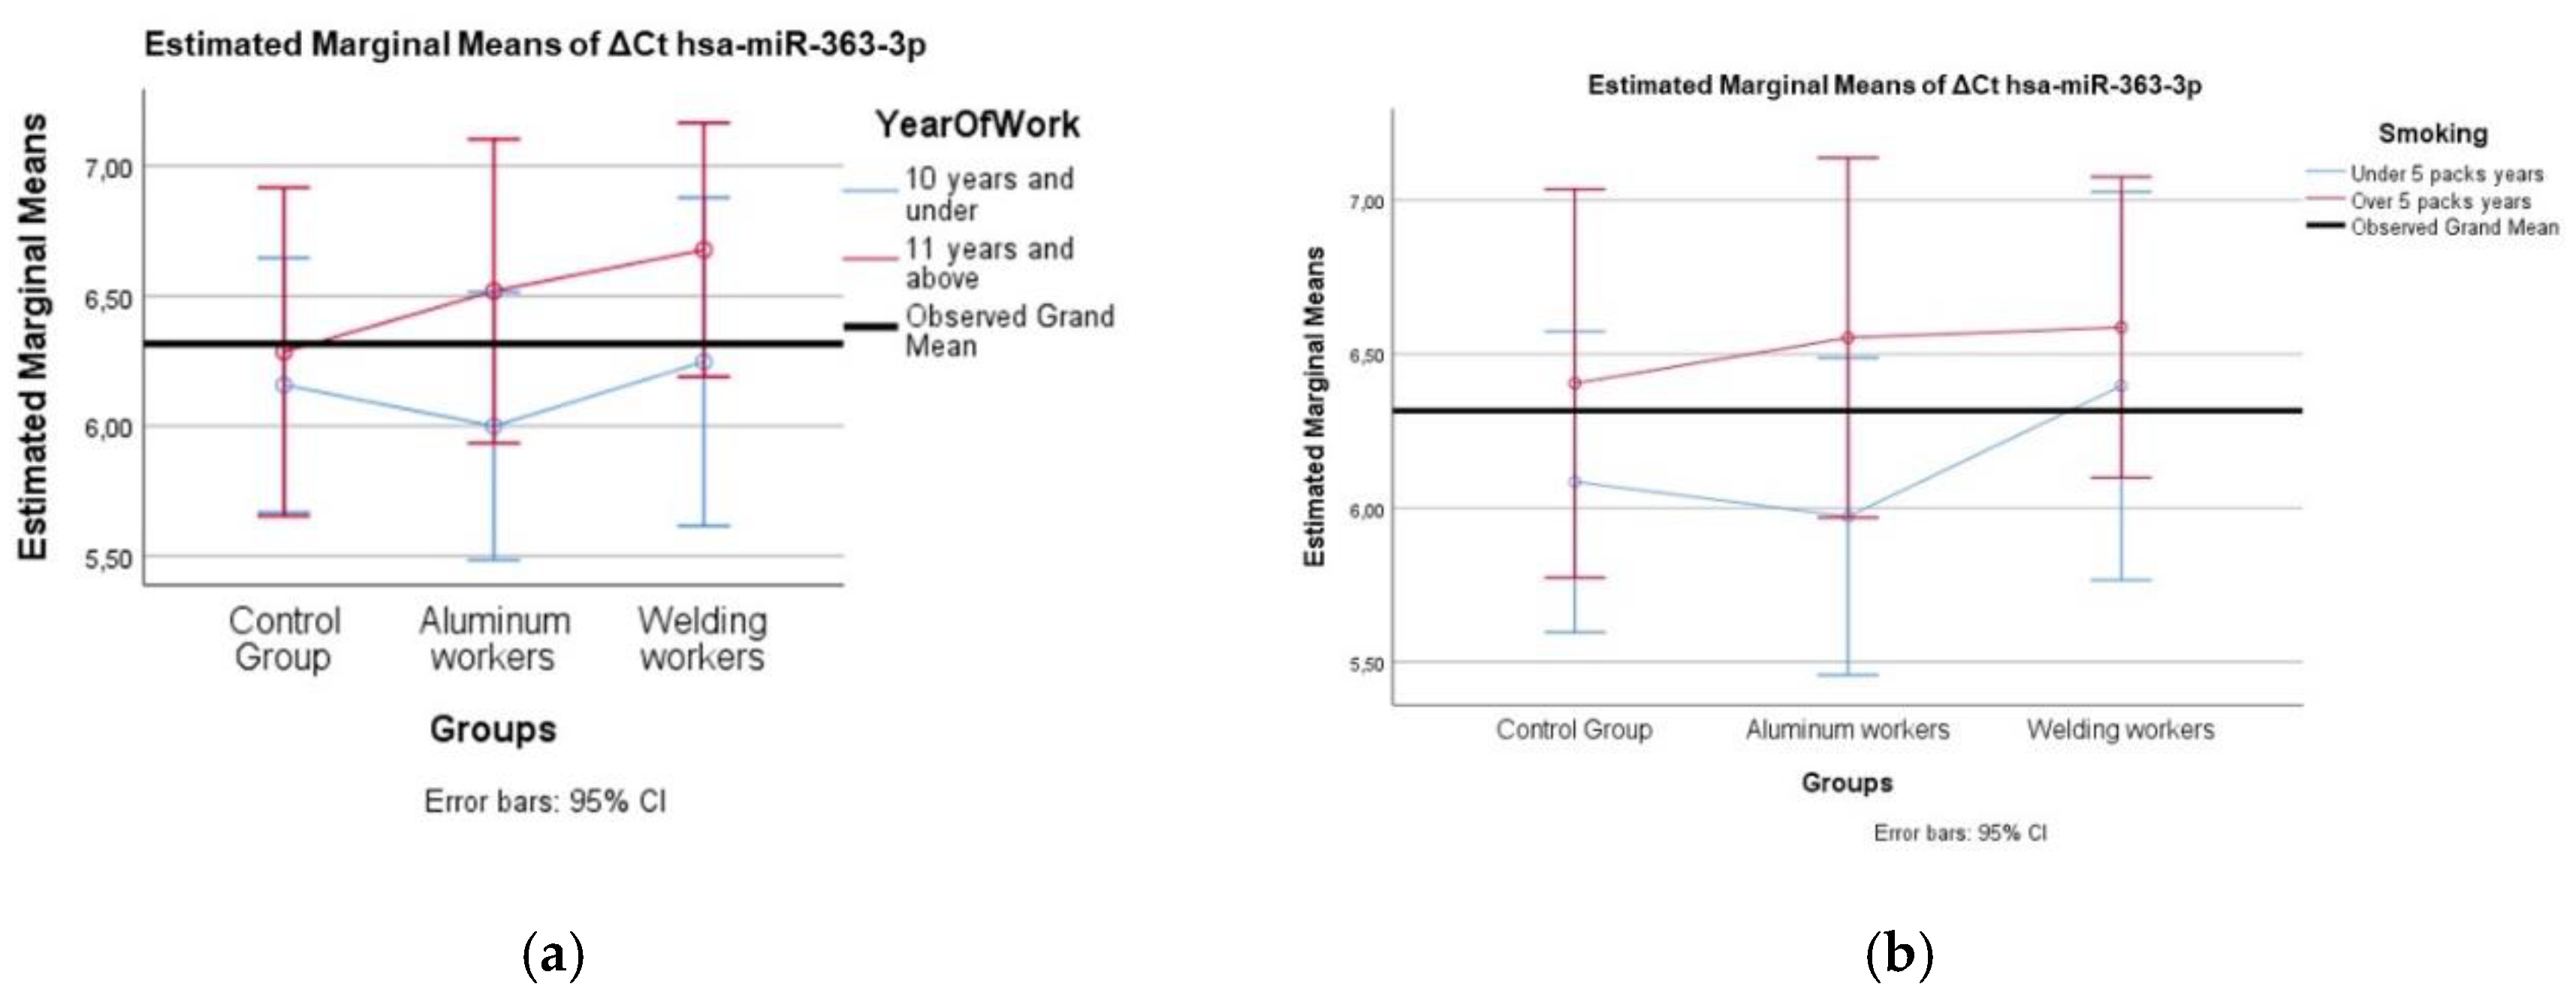
Figure 6.
(a) Two-way interaction in hsa-miR-363-3p according to group and study year (F=0.27; p=0.78); (b) Two-way interaction in hsa-miR-363-3p according to group and smoking year (F=0.26; p=0.77).
Figure 6.
(a) Two-way interaction in hsa-miR-363-3p according to group and study year (F=0.27; p=0.78); (b) Two-way interaction in hsa-miR-363-3p according to group and smoking year (F=0.26; p=0.77).
3.6. ROC Analysis
In aluminum and welding workers, we identified five serum miRNAs (hsa-miR-19a-3p, hsa-miR-19b-3p, hsa-miR-130b-3p, hsa-miR-92a-3p, and hsa-miR-24-3p) as significant compared to the reference miRNA hsa-miR-16-5p. We applied ROC analysis to these five significant serum miRNAs to identify a discriminatory miRNA in aluminum and welding workers.
As a result of the analysis, hsa-miR-19a-3p and hsa-miR-19b-3p were found to be significant in aluminum workers, with area under the curve (AUC) values of 0.764 and 0.852, respectively (p = 0.011, p = 0.001). (Figure 7) (Table 27). Similarly, in hsa-miR-19a-3p, a ∆Ct value above 1.47 at the positivity cut-off value can distinguish between individuals exposed to 69% aluminum and those not exposed to 75% aluminum. Similarly, in hsa-miR-19a-3p, a ∆Ct value above 1.59 at the positivity cut-off value can distinguish between individuals exposed to 69% aluminum and those not exposed to 75% aluminum. In hsa-miR-19b-3p, a ∆Ct value above 2.03 at the positivity cut-off value can distinguish between individuals exposed to 88% aluminum and those not exposed to 81% aluminum. In addition, in hsa-miR-19a-3p, a ∆Ct value above 2.08 at the positivity cut-off value can distinguish between individuals exposed to 75% aluminum and those not exposed to 81% aluminum. (Table 28). According to ROC analysis, people exposed to aluminum can use hsa-miR-19a-3p and hsa-miR-19b-3p as markers.
As a result of the analysis, hsa-miR-130b-3p, hsa-miR-92a-3p, hsa-miR-24-3p, and hsa-miR-19a-3p were found to be significant in welding workers, with area under the curve (AUC) values of 0.773 (p = 0.008), 0.898 (p < 0.001), 0.914 (p < 0.001), and 0.961 (p < 0.001), respectively (Figure 8, Table 29).
A hsa miR-19a-3p Ct value greater than 1.39 has the ability to discriminate between 81% of the welding workers and 69% of the controls. The hsa-miR-130-3p ΔCt value of 1.44 has the power to discriminate between 75% of the source workers and 69% of the controls. A hsa-miR-130-3p Ct value greater than 7.61 has the ability to discriminate between 81% of the welding workers and 81% of the controls. The hsa-miR-130-3p ΔCt value of 7.67 has the power to discriminate between 81% of the source workers and 88% of the controls. The hsa-miR-92a-3p ΔCt value of 1.57 has the power to discriminate between 94% of the welding workers and 75% of the controls. The Hsa-miR-92a-3p ΔCt value of 1.83 has the power to discriminate 94% of the source workers and 81% of the controls.In hsa-miR-24-3p, a ∆Ct value above 6.39 at the positivity cutoff value tells the difference between people who were exposed to the welding by 69% and people who were not exposed to the welding by 75%. In hsa-miR-24-3p, a ∆Ct value above 6.46 at the positivity cutoff value tells the difference between people who were exposed to the welding by 69% and people who were not exposed to the welding by 75%. (Table 30). As a result of ROC analysis, it can be said that hsa-miR-19a-3p, hsa-miR-130b-3p, hsa-miR-92a-3p, and hsa-miR-24-3p can be used as a marker in individuals exposed to welding workers.
3.7. Independent Cohort Validation via GEO Database
We selected the GEO dataset “GSE63087” from the GEO database (https://www.ncbi.nlm.nih.gov/geo/) for the independent cohort validation of our study. In the study titled “Expression of viral and human microRNAs in blood in The Beijing Truck Driver Air Pollution Study (BTDAS),” a total of 240 peripheral blood samples were taken from 120 participants, 60 truck drivers and 60 office workers, on both examination days, and the NanoString nCounter Human miRNA assay method was applied.
In the P value calculation, the Benjamini & Hochberg (False Discovery Rate) method was used to compare two sample groups to determine differentially expressed miRNAs via R 4.2.2, Biobase 2.58.0, GEOquery 2.66.0, and limma 3.54.0 version. We found that the GSE63087 raw data set had hsa-miR-19a, hsa-miR-130b, hsa-miR-25, hsa-miR-363, hsa-miR-92a, hsa-miR-24, and hsa-miR-19b, which are all miRNAs that were part of our study. We display the distribution of values from selected samples (Figure 9).
4. Discussion
The identification of specific miRNAs, including hsa-miR-19a-3p, hsa-miR-130b-3p, hsa-miR-25-3p, hsa-miR-363-3p, hsa-miR-92a-3p, hsa-miR-24-3p, and hsa-miR-19b-3p, is crucial for understanding the molecular responses to heavy metal exposure. These miRNAs play significant roles in regulating oxidative stress, apoptosis, inflammation, and DNA damage repair, which are key mechanisms of metal-induced toxicity [1].
In our study, the qRT-PCR method was used to analyze two serum miRNAs—hsa-miR-19a-3p and hsa-miR-19b-3p—that showed greater significance in aluminum-exposed individuals compared to the reference miRNA, hsa-miR-16-5p. ROC analysis revealed that hsa-miR-19a-3p and hsa-miR-19b-3p were significantly associated with aluminum exposure, as indicated by the area under the curve. Additionally, we identified four serum miRNAs—hsa-miR-19a-3p, hsa-miR-130b-3p, hsa-miR-92a-3p, and hsa-miR-24-3p—as significant in individuals exposed to welding fumes, compared to the reference miRNA, hsa-miR-16-5p. According to ROC analysis, hsa-miR-19a-3p, hsa-miR-130b-3p, hsa-miR-92a-3p, and hsa-miR-24-3p were significantly identified in individuals exposed to welding fumes, while the remaining miRNAs fell under the curve.
We observed that the expression levels of seven miRNAs obtained from serum were decreased (down-regulated) in both aluminum-exposed and welding fume-exposed workers. Our study suggests that hsa-miR-19a-3p may be an important biomarker for both aluminum exposure (p = 0.009) and welding fume exposure (p = 0.010).
MiRNA-target enrichment analysis of hsa-miR-19a-3p, hsa-miR-19b-3p, and hsa-miR-363-3p, which were found to be significant in aluminum-exposed workers, revealed strong interactions of hsa-miR-19a-3p and hsa-miR-363-3p with the ESR1, TNF, TF, MYC, ACSL4, PRKN, and CASP3 genes. Additionally, hsa-miR-19b-3p, which was identified as significant in workers exposed to both aluminum and welding fumes, exhibited high interaction with the ESR1, LRIG3, ATF2, TGFB1, ACSL4, and PRKN genes. Furthermore, hsa-miR-130b-3p, hsa-miR-25-3p, hsa-miR-92a-3p, and hsa-miR-24-3p, which were found to be significant in workers exposed to welding fumes, showed strong interactions with multiple genes, including ESR1, ACSL4, MMP2, IGF1, MYC, CYP7A1, GCHFR, TGFB1, RRM2, HMOX1, IGF1, IL4, IL1B, and TNF.
In our study, hsa-miR-19a-3p and hsa-miR-19b-3p were found to be decreased in workers exposed to aluminum (p < 0.05). Our study observed weak positive correlations between aluminum exposure and hsa-miR-19a-3p, hsa-miR-19b-3p, hsa-miR-130b-3p, hsa-miR-25-3p, hsa-miR-92a-3p, hsa-miR-24-3p (p < 0.05). Research indicates that exposure to aluminum, particularly in the form of aluminum-maltolate, leads to the downregulation of both miR-19a and miR-19b in human neuroblastoma SH-SY5Y cells. This downregulation is associated with increased neural cell apoptosis. The mechanism involves the modulation of apoptotic-related proteins, including PTEN, p-AKT, and p53. Inhibition of miR-19a or miR-19b alone has been shown to decrease cell viability and activate caspase 9 and caspase 3, further promoting apoptosis. These findings suggest that maintaining the expression levels of miR-19a and miR-19b is crucial for neuronal cell survival under aluminum exposure [6]. Due to the downregulation of miR-19a-3p and miR-19b-3p, aluminum exposure is associated with an increase in neural cell apoptosis.
Research indicates that oxidative stress can lead to the downregulation of miR-92a-3p. In the study by Li et al., it was found that, in endothelial cells, exosomes stimulated by oxidative stress decreased miR-92a-3p levels and promoted angiogenesis through the modulation of proteins such as PTEN, p-AKT, and p53 [22]. Altered miR-92a-3p levels have been observed in neurodegenerative diseases. Studies have reported downregulation of miR-92a-3p in plasma samples from patients with mild cognitive impairment and Alzheimer’s disease, suggesting its potential role in synaptic function deficits associated with these conditions [23]. These findings suggest that miR-92a-3p plays a role in cellular stress responses and neurological processes, which could be relevant to understanding its potential involvement in aluminum-induced toxicity.
In our study, hsa-miR-19a-3p, hsa-miR-130b-3p, hsa-miR-92a-3p, and hsa-miR-24-3p were found to be decreased in workers exposed to welding fumes (p < 0.05). We observed weak positive correlations between chromium exposure and hsa-miR-363-3p and hsa-miR-92a-3p (r = 0.383 and 0.363, respectively; p < 0.05). For instance, hsa-miR-19a-3p and hsa-miR-19b-3p, both members of the miR-17-92 cluster, are known to regulate PTEN, a key tumor suppressor gene involved in the AKT pathway. Exposure to hexavalent chromium [Cr(VI)] has been shown to downregulate these miRNAs, leading to enhanced carcinogenic potential due to increased AKT activation and reduced apoptosis [24].
Recent studies have identified a connection between chromium exposure and the downregulation of miR-19a-3p. Specifically, research involving workers exposed to Cr (VI) revealed a significant reduction in miR-19a-3p expression levels. This downregulation was accompanied by decreased levels of miR-19b-3p and miR-142-3p, while miR-590-3p and miR-941 were upregulated in the exposed group. These findings suggest that miR-19a-3p, along with other microRNAs, may serve as potential biomarkers for chromium exposure and its associated health effects [25]. Observed changes in miRNA expression, including downregulation of miR-19a-3p, may lead to various health problems. miR-19a-3p has been shown to play a role in endothelial function, and its overexpression protects against atherosclerosis-associated endothelial dysfunction.Therefore, its downregulation in response to chromium exposure could potentially exacerbate vascular health problems [26]. So, we can say that chromium exposure is linked to miR-19a-3p downregulation, which could affect the health of blood vessels and be used as a biomarker to measure exposure.
Hsa-miR-24-3p plays a significant role in regulating cellular stress responses, including DNA damage repair and apoptosis. Studies have shown that decreased miR-24-3p expression correlates with increased susceptibility to apoptosis and emphysema, particularly in the context of cigarette smoke exposure [12]. Given that Cr(VI) is a known human carcinogen associated with lung cancer and can induce oxidative stress and DNA damage [27], it’s plausible that chromium exposure might influence miR-24-3p expression. Despite the significant role miR-24-3p plays in cellular stress responses, more research is required to understand how it reacts to chromium exposure.
We found negative, weak correlations between copper values and hsa-miR-363-3p (r=0.295; p=0.042). miR-363-3p is a microRNA involved in regulating various cellular processes, including inflammation, oxidative stress, and apoptosis. Studies have demonstrated that miR-363-3p can reduce endothelial cell inflammatory responses by targeting NADPH oxidase 4 and inhibiting the p38 MAPK signaling pathway, thereby decreasing oxidative stress and cell apoptosis [28]. Regarding copper exposure, there is no literature information linking it to miR-363-3p expression, and it is known that copper can cause oxidative stress and inflammation.
Our study observed positive weak correlations between lead exposure and hsa-miR-130b-3p, hsa-miR-92a-3p, and hsa-miR-24-3p (p < 0.05). Lead exposure is known to induce epigenetic modifications, including alterations in miRNA expression, which can contribute to neurotoxicity and immune dysfunction [29]. Studies have shown that miR-19a-3p and miR-19b-3p are upregulated after spinal cord injury, leading to increased expression of proinflammatory cytokines and decreased expression of nuclear receptors Nurr1 and Nur77 in microglia. This suggests that miR-19a-3p and miR-19b-3p contribute to neuroinflammation and neuropathic pain by modulating microglial activation [30]. It has been shown that miR-130b-3p may control fibroblast activities by focusing on the 3’-UTR of IGF-1 mRNA. This can change the way epithelial and mesenchymal cells talk to each other in lung fibrosis [31]. Given the roles of miR-19a-3p and miR-19b-3p miRNAs in regulating inflammatory responses and oxidative stress in relation to lead exposure, it is possible that changes in their expression may affect cellular responses to lead-induced neurotoxicity.
“We found no statistically significant correlation (p > 0.05) between the Ct values of the seven miRNAs we investigated and serum nickel levels. hsa-miR-24-3p plays a role in regulating dendritic cell (DC) activation. miR-24-3p has been shown to be upregulated in DCs when exposed to contact allergens and plays a role in immune activation [32]. Nickel is a known contact allergen that can trigger immune responses. Therefore, it is likely that Ni exposure upregulates hsa-miR-24-3p in DCs, leading to increased immune activation and potentially contributing to allergic reactions. In contrast, in our study, since serum samples were used, hsa-miR-24-3p was downregulated. This discrepancy may be due to differences in exposure levels and biological matrices.
Nickel exposure is known to cause oxidative stress, inflammation, and fibrosis. However, there are limited studies in the literature on nickel exposure. The known functions of miR-19a-3p and miR-130b-3p suggest that their downregulation may exacerbate the adverse effects associated with nickel exposure, such as increased inflammation, fibrosis, and cellular senescence.
Combining tests that assess occupational exposure with those that detect miRNA biomarkers can help determine the role of genetics in occupational diseases. This study underscores the importance of utilizing miRNAs as biomarkers and incorporating them into routine genetic testing programs in workplaces. Although implementing such programs may be costly, they offer significant benefits in preventing occupational diseases. By focusing on seven specific miRNAs, this research aims to identify new biomarkers, enabling the early detection of diseases caused by heavy metal exposure. Furthermore, the findings will provide valuable insights for establishing necessary workplace safety measures to protect employees.
However, this study has certain limitations. First, the participants were currently employed and had not been diagnosed with any occupational diseases. They belonged to a workforce with established occupational safety measures and were continuously monitored by an occupational physician. Second, the heavy metal analyses in this study were based on a single blood measurement, conducted using ICP-OES, one of the most reliable methods available. Due to financial constraints, we were unable to validate the results using an alternative measurement technique. Additionally, the analyzed heavy metals have relatively short half-lives in the human body. While blood lead levels in welding workers were higher than those in the control and aluminum-exposed groups, they were not elevated enough to diagnose an occupational disease.
Another limitation was the small sample size. Future studies should include larger cohorts and more comprehensive data collection to enhance the reliability of these findings. Validation in an independent, large-scale cohort is essential to assess the potential of these miRNAs as biomarkers for heavy metal toxicity. Cross-validation with larger datasets will further confirm the consistency and specificity of the observed dysregulation patterns in occupationally exposed workers. Integrating these miRNAs into occupational health surveillance programs could improve the early detection of heavy metal-induced health risks, facilitating timely interventions.
In conclusion, miR-19a-3p, miR-130b-3p, miR-25-3p, miR-363-3p, miR-92a-3p, miR-24-3p, and miR-19b-3p play critical roles in cellular responses to heavy metal exposure. These miRNAs regulate key pathways involved in oxidative stress, inflammation, apoptosis, and DNA damage repair. The dysregulation of these miRNAs upon exposure to toxic metals such as Cr, Cu, Ni, Pb, Al, and Cd underscores their potential as biomarkers for metal-induced toxicity and disease progression. Further research is necessary to elucidate their precise mechanisms and therapeutic applications in mitigating heavy metal-induced health risks.
Author Contributions
Conceptualization, G.Ö.; methodology, G.Ö., H.İ., C.K.; validation, G.Ö., F.O., H.İ.; formal analysis, G.Ö. and H.İ.; investigation, G.Ö., T.İ., F.O., S.C.; resources, G.Ö., T.İ., and H.İ.; data curation, G.Ö., H.İ. K.Y.A.; writing—original draft preparation, G.Ö.; writing—review and editing, G.Ö., T.İ., S.C., H.İ., F.O.; visualization, G.Ö., H.İ., C.K., K.Y.A.; supervision, G.Ö., H.İ., T.İ., S.C., F.O., C.K., K.Y.A.; project administration, G.Ö., T.İ., H.İ. All authors have read and agreed to the published version of the manuscript.
Funding
This research was funded by a grant from TUSEB EMERGENCY RESEARCH AND DEVELOPMENT PROJECT SUPPORT PROGRAM (Project No: 32405).
Institutional Review Board Statement
The study was conducted in accordance with the Declaration of Helsinki and approved by the Istanbul Faculty of Medicine Clinical Research Ethic Committee with the approval number and date: E-29624016-050.99-3104384/ January 8, 2025.
Informed Consent Statement
Informed consent was obtained from all subjects involved in the study.
Conflicts of Interest
The authors declare no conflict of interest. The funders had no role in the design of the study; in the collection, analyses, or interpretation of data; in the writing of the manuscript; or in the decision to publish the results.
References
- Tchounwou, P. B.; Yedjou, C. G.; Patlolla, A. K.; Sutton, D. J. Heavy metal toxicity and the environment. Exp Suppl 2012, 101, 133–164, From NLM Medline. [Google Scholar] [CrossRef] [PubMed]
- Koyama, H.; Kamogashira, T.; Yamasoba, T. Heavy Metal Exposure: Molecular Pathways, Clinical Implications, and Protective Strategies. Antioxidants (Basel) From NLM PubMed-not-MEDLINE. 2024, 13. [Google Scholar] [CrossRef] [PubMed]
- Li, H.; Liu, Q.; Xue, X.; Lu, X.; Song, J.; He, C.; Hao, Y.; Nie, J.; Zhang, Q.; Zhao, Y.; et al. miR-29a/b1 Regulates BACE1 in Aluminum-Induced Abeta Deposition in Vitro. ACS Chem Neurosci 2021, 12, 3250–3265, From NLM Medline. [Google Scholar] [CrossRef] [PubMed]
- Lee, K. M.; Bassig, B. A.; Zhang, L.; Vermeulen, R. C.; Hu, W.; Wong, J. Y. Y.; Qiu, C.; Wen, C.; Huang, Y.; Purdue, M. P.; et al. Association between occupational exposure to trichloroethylene and serum levels of microRNAs: a cross-sectional molecular epidemiology study in China. Int Arch Occup Environ Health 2019, 92, 1077–1085, From NLM Medline. [Google Scholar] [CrossRef]
- Wallace, D. R.; Taalab, Y. M.; Heinze, S.; Tariba Lovakovic, B.; Pizent, A.; Renieri, E.; Tsatsakis, A.; Farooqi, A. A.; Javorac, D.; Andjelkovic, M.; et al. Toxic-Metal-Induced Alteration in miRNA Expression Profile as a Proposed Mechanism for Disease Development. Cells 2020, 9. From NLM Medline. [Google Scholar] [CrossRef]
- Zhu, M.; Huang, C.; Ma, X.; Wu, R.; Zhu, W.; Li, X.; Liang, Z.; Deng, F.; Zhu, J.; Xie, W.; et al. Modulation of miR-19 in Aluminum-Induced Neural Cell Apoptosis. J Alzheimers Dis 2016, 50, 1149–1162, From NLM Medline. [Google Scholar] [CrossRef]
- Soltanpour, Z.; Rasoulzadeh, Y.; Mohammadian, Y. Occupational Exposure to Metal Fumes Among Iranian Welders: Systematic Review and Simulation-Based Health Risk Assessment. Biol Trace Elem Res 2023, 201, 1090–1100, From NLM Medline. [Google Scholar] [CrossRef]
- Amrani, I.; Haddam, N.; Garat, A.; Allorge, D.; Zerimech, F.; Schraen, S.; Taleb, A.; Merzouk, H.; Edme, J. L.; Lo-Guidice, J. M. Exposure to metal fumes and circulating miRNAs in Algerian welders. Int Arch Occup Environ Health 2020, 93, 553–561, From NLM Medline. [Google Scholar] [CrossRef]
- Stanislawska, M.; Janasik, B.; Kuras, R.; Malachowska, B.; Halatek, T.; Wasowicz, W. Assessment of occupational exposure to stainless steel welding fumes - A human biomonitoring study. Toxicol Lett 2020, 329, 47–55, From NLM Medline. [Google Scholar] [CrossRef]
- Sahebdel, F.; Morse, L.; Battaglino, R.; Olson, J. K. miR-19a-3p and miR-19b-3p promote microglia activation associated with neuroinflammation following spinal cord injury. J Immunol 2023, 210. [Google Scholar] [CrossRef]
- Jiang, X. M.; Yu, X. N.; Liu, T. T.; Zhu, H. R.; Shi, X.; Bilegsaikhan, E.; Guo, H. Y.; Song, G. Q.; Weng, S. Q.; Huang, X. X.; et al. microRNA-19a-3p promotes tumor metastasis and chemoresistance through the PTEN/Akt pathway in hepatocellular carcinoma. Biomed Pharmacother 2018, 105, 1147–1154, From NLM Medline. [Google Scholar] [CrossRef] [PubMed]
- Nouws, J.; Wan, F.; Finnemore, E.; Roque, W.; Kim, S. J.; Bazan, I.; Li, C. X.; Skold, C. M.; Dai, Q.; Yan, X.; et al. MicroRNA miR-24-3p reduces DNA damage responses, apoptosis, and susceptibility to chronic obstructive pulmonary disease. JCI Insight 2021, 6. From NLM Medline. [Google Scholar] [CrossRef] [PubMed]
- Lu, B.; Christensen, I. T.; Ma, L. W.; Wang, X. L.; Jiang, L. F.; Wang, C. X.; Feng, L.; Zhang, J. S.; Yan, Q. C. miR-24-p53 pathway evoked by oxidative stress promotes lens epithelial cell apoptosis in age-related cataracts. Mol Med Rep 2018, 17, 5021–5028, From NLM Medline. [Google Scholar] [CrossRef]
- Waseem, A.; Arshad, J. A review of Human Biomonitoring studies of trace elements in Pakistan. Chemosphere 2016, 163, 153–176, From NLM Medline. [Google Scholar] [CrossRef]
- de Araujo, M. L.; Gomes, B. C.; Devoz, P. P.; Duarte, N. A. A.; Ribeiro, D. L.; de Araujo, A. L.; Batista, B. L.; Antunes, L. M. G.; Barbosa, F., Jr.; Rodrigues, A. S.; et al. Association Between miR-148a and DNA Methylation Profile in Individuals Exposed to Lead (Pb). Front Genet From NLM PubMed-not-MEDLINE. 2021, 12, 620744. [Google Scholar] [CrossRef]
- Goyal, T.; Mitra, P.; Singh, P.; Ghosh, R.; Sharma, S.; Sharma, P. Association of microRNA expression with changes in immune markers in workers with cadmium exposure. Chemosphere 2021, 274, 129615, From NLM Medline. [Google Scholar] [CrossRef]
- Finicelli, M.; Squillaro, T.; Galderisi, U.; Peluso, G. Micro-RNAs: Crossroads between the Exposure to Environmental Particulate Pollution and the Obstructive Pulmonary Disease. Int J Mol Sci 2020, 21. From NLM Medline. [Google Scholar] [CrossRef] [PubMed]
- Shi, L.; Feng, L.; Tong, Y.; Jia, J.; Li, T.; Wang, J.; Jiang, Z.; Yu, M.; Xia, H.; Jin, Q.; et al. Genome wide profiling of miRNAs relevant to the DNA damage response induced by hexavalent chromium exposure (DDR-related miRNAs in response to Cr (VI) exposure). Environ Int 2021, 157, 106782, From NLM Medline. [Google Scholar] [CrossRef]
- Li, Z.; Ali Shah, S. W.; Zhou, Q.; Yin, X.; Teng, X. The contributions of miR-25-3p, oxidative stress, and heat shock protein in a complex mechanism of autophagy caused by pollutant cadmium in common carp (Cyprinus carpio L.) hepatopancreas. Environ Pollut 2021, 287, 117554, From NLM Medline. [Google Scholar] [CrossRef]
- Rossner, P.; Vrbova, K.; Rossnerova, A.; Zavodna, T.; Milcova, A.; Klema, J.; Vecera, Z.; Mikuska, P.; Coufalik, P.; Capka, L.; et al. Gene Expression and Epigenetic Changes in Mice Following Inhalation of Copper(II) Oxide Nanoparticles. Nanomaterials (Basel) From NLM PubMed-not-MEDLINE. 2020, 10. [Google Scholar] [CrossRef]
- Sacco, A.; Martelli, F.; Pal, A.; Saraceno, C.; Benussi, L.; Ghidoni, R.; Rongioletti, M.; Squitti, R. Regulatory miRNAs in Cardiovascular and Alzheimer’s Disease: A Focus on Copper. Int J Mol Sci 2022, 23. From NLM Medline. [Google Scholar] [CrossRef] [PubMed]
- Li, S.; Yuan, L.; Su, L.; Lian, Z.; Liu, C.; Zhang, F.; Cui, Y.; Wu, M.; Chen, H. Decreased miR-92a-3p expression potentially mediates the pro-angiogenic effects of oxidative stress-activated endothelial cell-derived exosomes by targeting tissue factor. Int J Mol Med 2020, 46, 1886–1898, From NLM Medline. [Google Scholar] [CrossRef] [PubMed]
- Verma, S.; Sivanandam, T. M. Analysis of Differential microRNA Expression in the Hippocampus of Scopolamine-Induced Amnesic Mouse Model. Mol Neurobiol From NLM Publisher. 2024. [Google Scholar] [CrossRef] [PubMed]
- Zhang, L.; Li, N.; Zhang, X.; Wu, H.; Yu, S. Hexavalent chromium caused DNA damage repair and apoptosis via the PI3K/AKT/FOXO1 pathway triggered by oxidative stress in the lung of rat. Ecotoxicol Environ Saf 2023, 267, 115622, From NLM Medline. [Google Scholar] [CrossRef]
- Hossini, H.; Shafie, B.; Niri, A. D.; Nazari, M.; Esfahlan, A. J.; Ahmadpour, M.; Nazmara, Z.; Ahmadimanesh, M.; Makhdoumi, P.; Mirzaei, N.; et al. A comprehensive review on human health effects of chromium: insights on induced toxicity. Environ Sci Pollut Res Int 2022, 29, 70686–70705, From NLM Medline. [Google Scholar] [CrossRef]
- Luo, J.; Wang, L.; Cui, C.; Chen, H.; Zeng, W.; Li, X. MicroRNA-19a-3p inhibits endothelial dysfunction in atherosclerosis by targeting JCAD. BMC Cardiovasc Disord 2024, 24. From NLM Medline. [Google Scholar] [CrossRef]
- Jiang, Z.; Person, R.; Lundh, T.; Pineda, D.; Engfeldt, M.; Krais, A. M.; Hagberg, J.; Ricklund, N.; Vogel, U.; Saber, A. T.; et al. Circulating lung-cancer-related non-coding RNAs are associated with occupational exposure to hexavalent chromium - A cross-sectional study within the SafeChrom project. Environ Int 2024, 190, 108874, From NLM Medline. [Google Scholar] [CrossRef]
- Zhou, T.; Li, S.; Yang, L.; Xiang, D. microRNA-363-3p reduces endothelial cell inflammatory responses in coronary heart disease via inactivation of the NOX4-dependent p38 MAPK axis. Aging (Albany NY) 2021, 13, 11061–11082, From NLM Medline. [Google Scholar] [CrossRef]
- Liu, R.; Wang, Y.; Bai, L.; Wang, R.; Wu, Y.; Liu, M.; Li, Q.; Ba, Y.; Zhang, H.; Zhou, G.; et al. Time-course miRNA alterations and SIRT1 inhibition triggered by adolescent lead exposure in mice. Toxicol Res (Camb) From NLM PubMed-not-MEDLINE. 2021, 10, 667–676. [Google Scholar] [CrossRef]
- Sahebdel, F.; Olson, J.; Battaglino, R.; Morse, L.; Quinta, H. Regulation of Nurr1 and Nur77 by miR-19a-3p and miR-19b-3p during spinal cord injury. The Journal of Immunology 2024, 212. [Google Scholar]
- Li, S.; Geng, J.; Xu, X.; Huang, X.; Leng, D.; Jiang, D.; Liang, J.; Wang, C.; Jiang, D.; Dai, H. miR-130b-3p Modulates Epithelial-Mesenchymal Crosstalk in Lung Fibrosis by Targeting IGF-1. PLoS One 2016, 11, e0150418, From NLM Medline. [Google Scholar] [CrossRef] [PubMed]
- Galbiati, V.; Lefevre, M. A.; Maddalon, A.; Vocanson, M.; Iulini, M.; Marinovich, M.; Corsini, E. Role of miR-24-3p and miR-146a-5p in dendritic cells’ maturation process induced by contact sensitizers. Arch Toxicol 2023, 97, 2183–2191, From NLM Medline. [Google Scholar] [CrossRef] [PubMed]
- Ghafouri-Fard, S.; Khoshbakht, T.; Hussen, B. M.; Abdullah, S. T.; Taheri, M.; Samadian, M. A review on the role of mir-16-5p in the carcinogenesis. Cancer Cell Int From NLM PubMed-not-MEDLINE. 2022, 22. [Google Scholar] [CrossRef] [PubMed]
- Lange, T.; Stracke, S.; Rettig, R.; Lendeckel, U.; Kuhn, J.; Schluter, R.; Rippe, V.; Endlich, K.; Endlich, N. Identification of miR-16 as an endogenous reference gene for the normalization of urinary exosomal miRNA expression data from CKD patients. PLoS One 2017, 12. From NLM Medline. [Google Scholar] [CrossRef]
Figure 1.
Evaluation of genes associated with Cr, Ni, Cu, Pb, and Al using a Venn diagram.
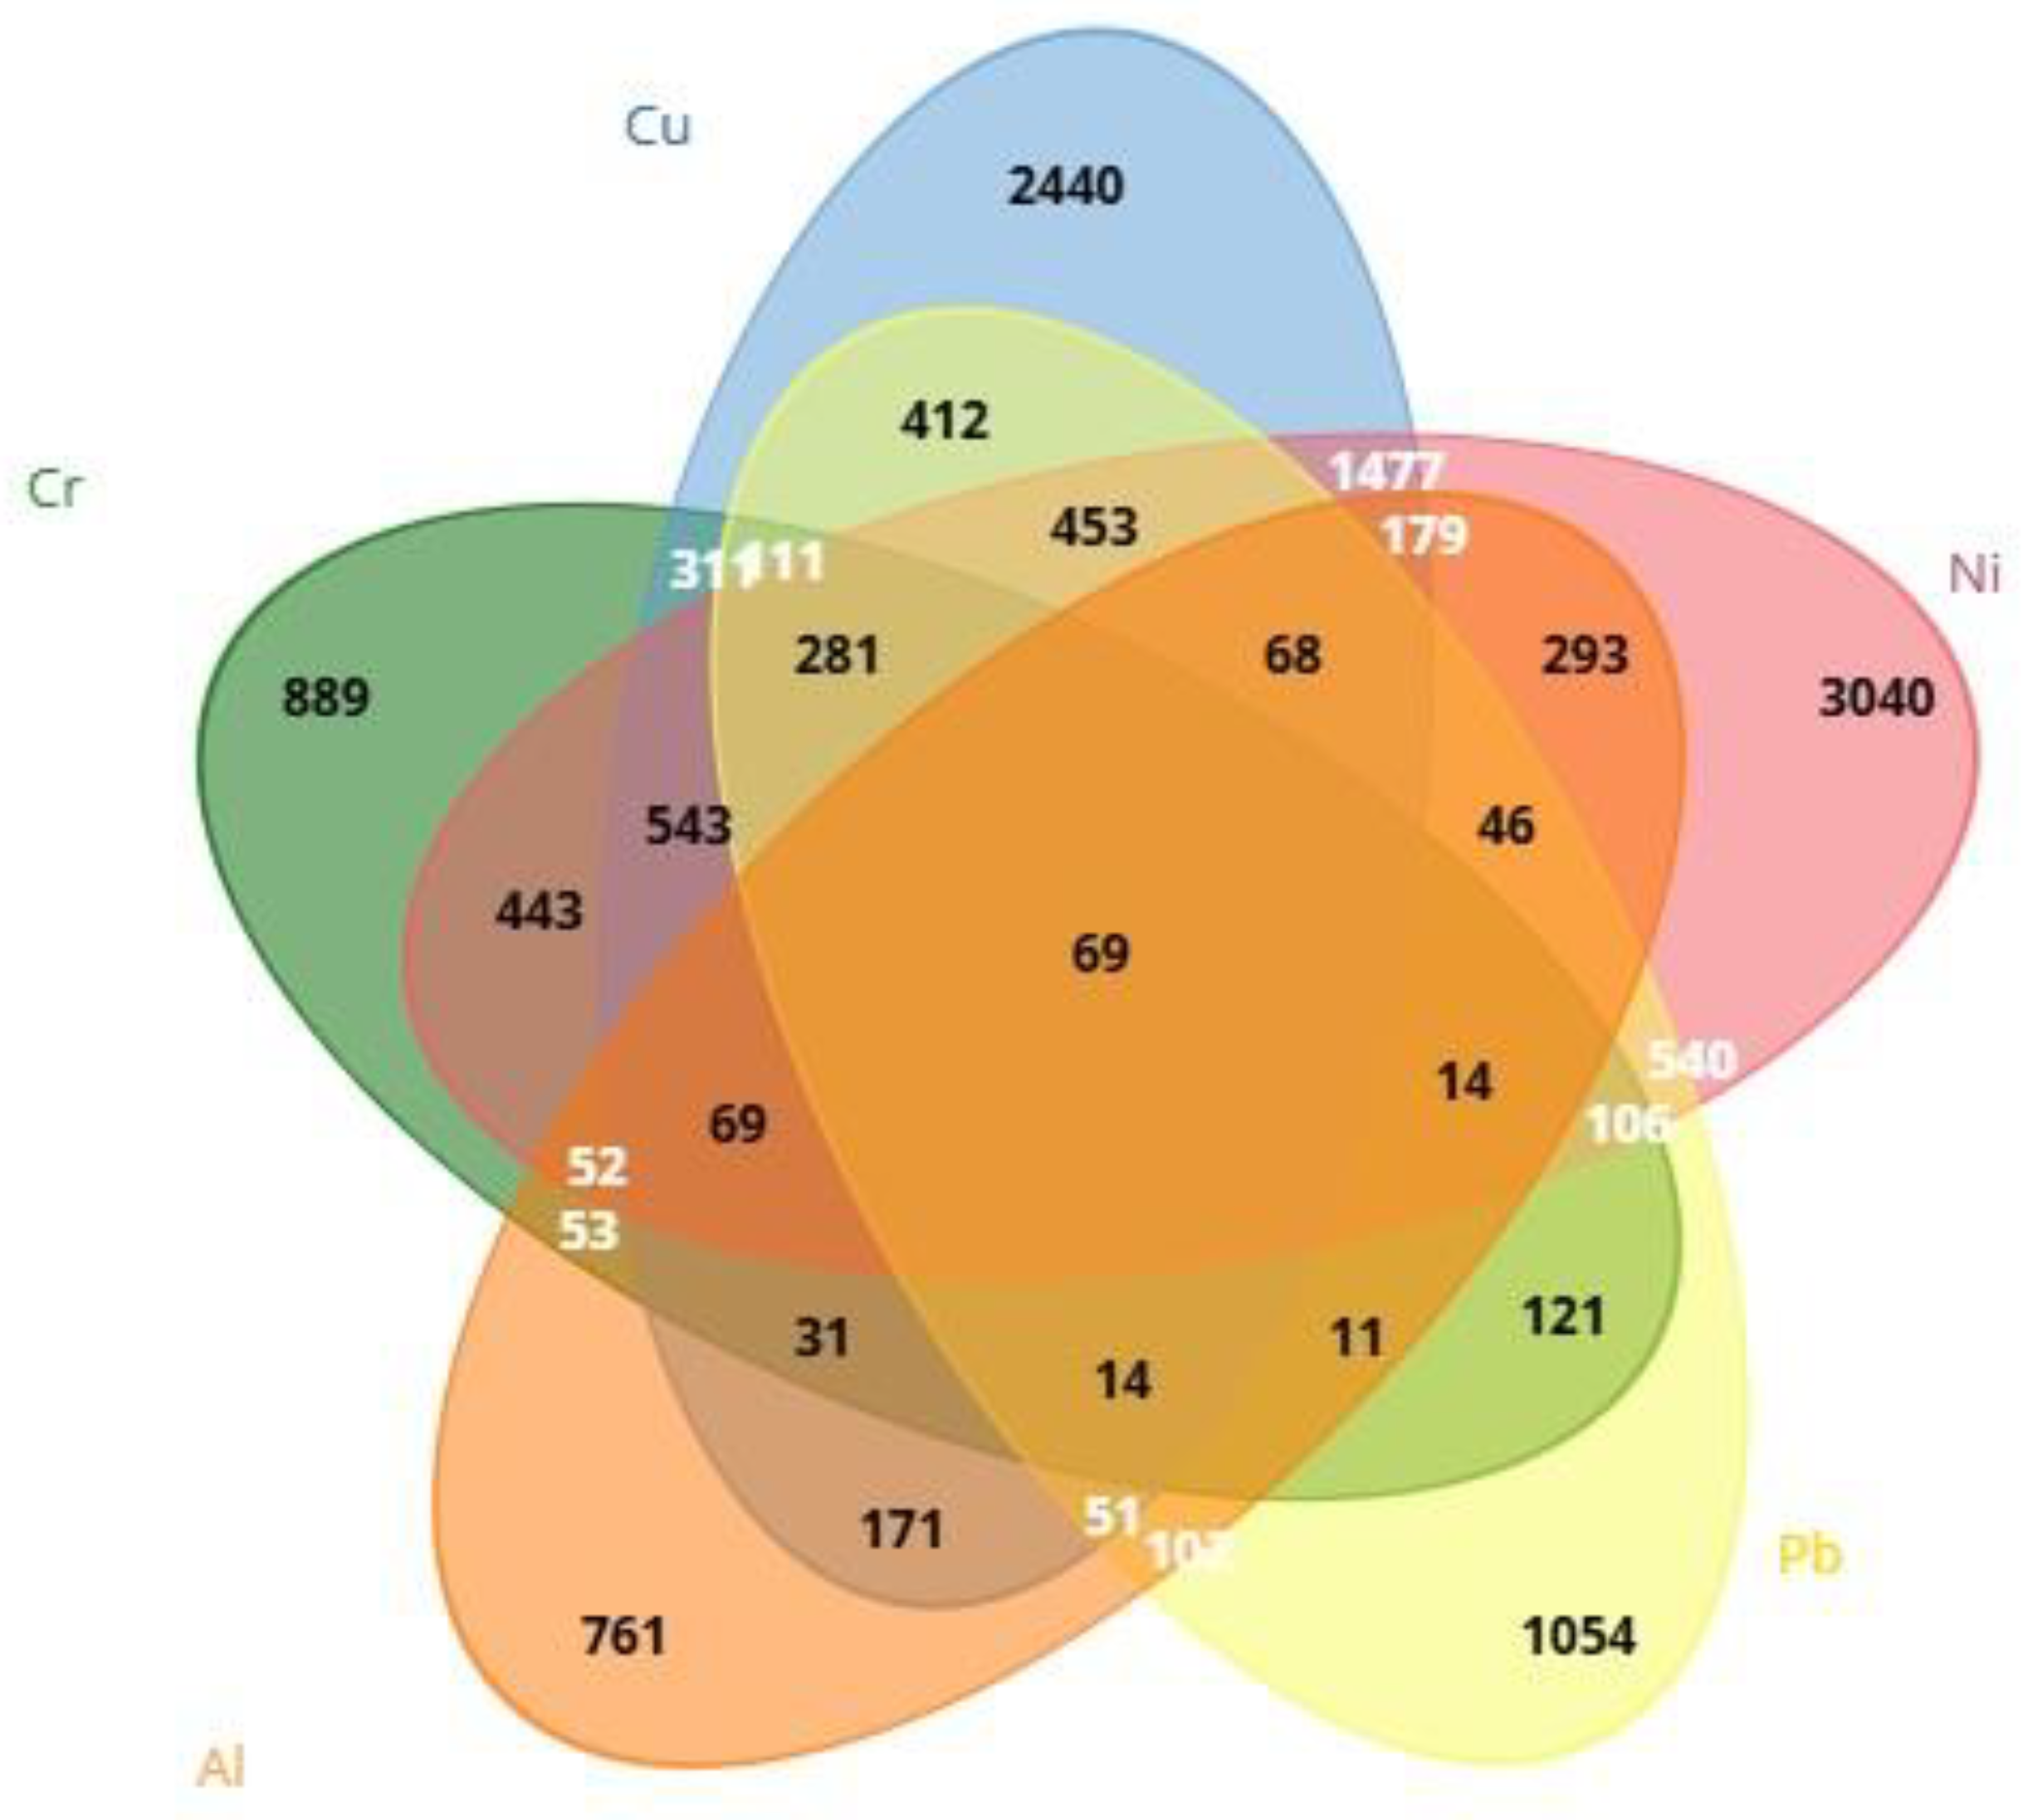
Figure 2.
(a) Two-way interaction in hsa-miR-19a-3p by group and study year (F=0.27; p=0.76) ; (b) Two-way interaction in hsa-miR-19a-3p by group and smoking year (F=0.48; p=0.82).
Figure 2.
(a) Two-way interaction in hsa-miR-19a-3p by group and study year (F=0.27; p=0.76) ; (b) Two-way interaction in hsa-miR-19a-3p by group and smoking year (F=0.48; p=0.82).
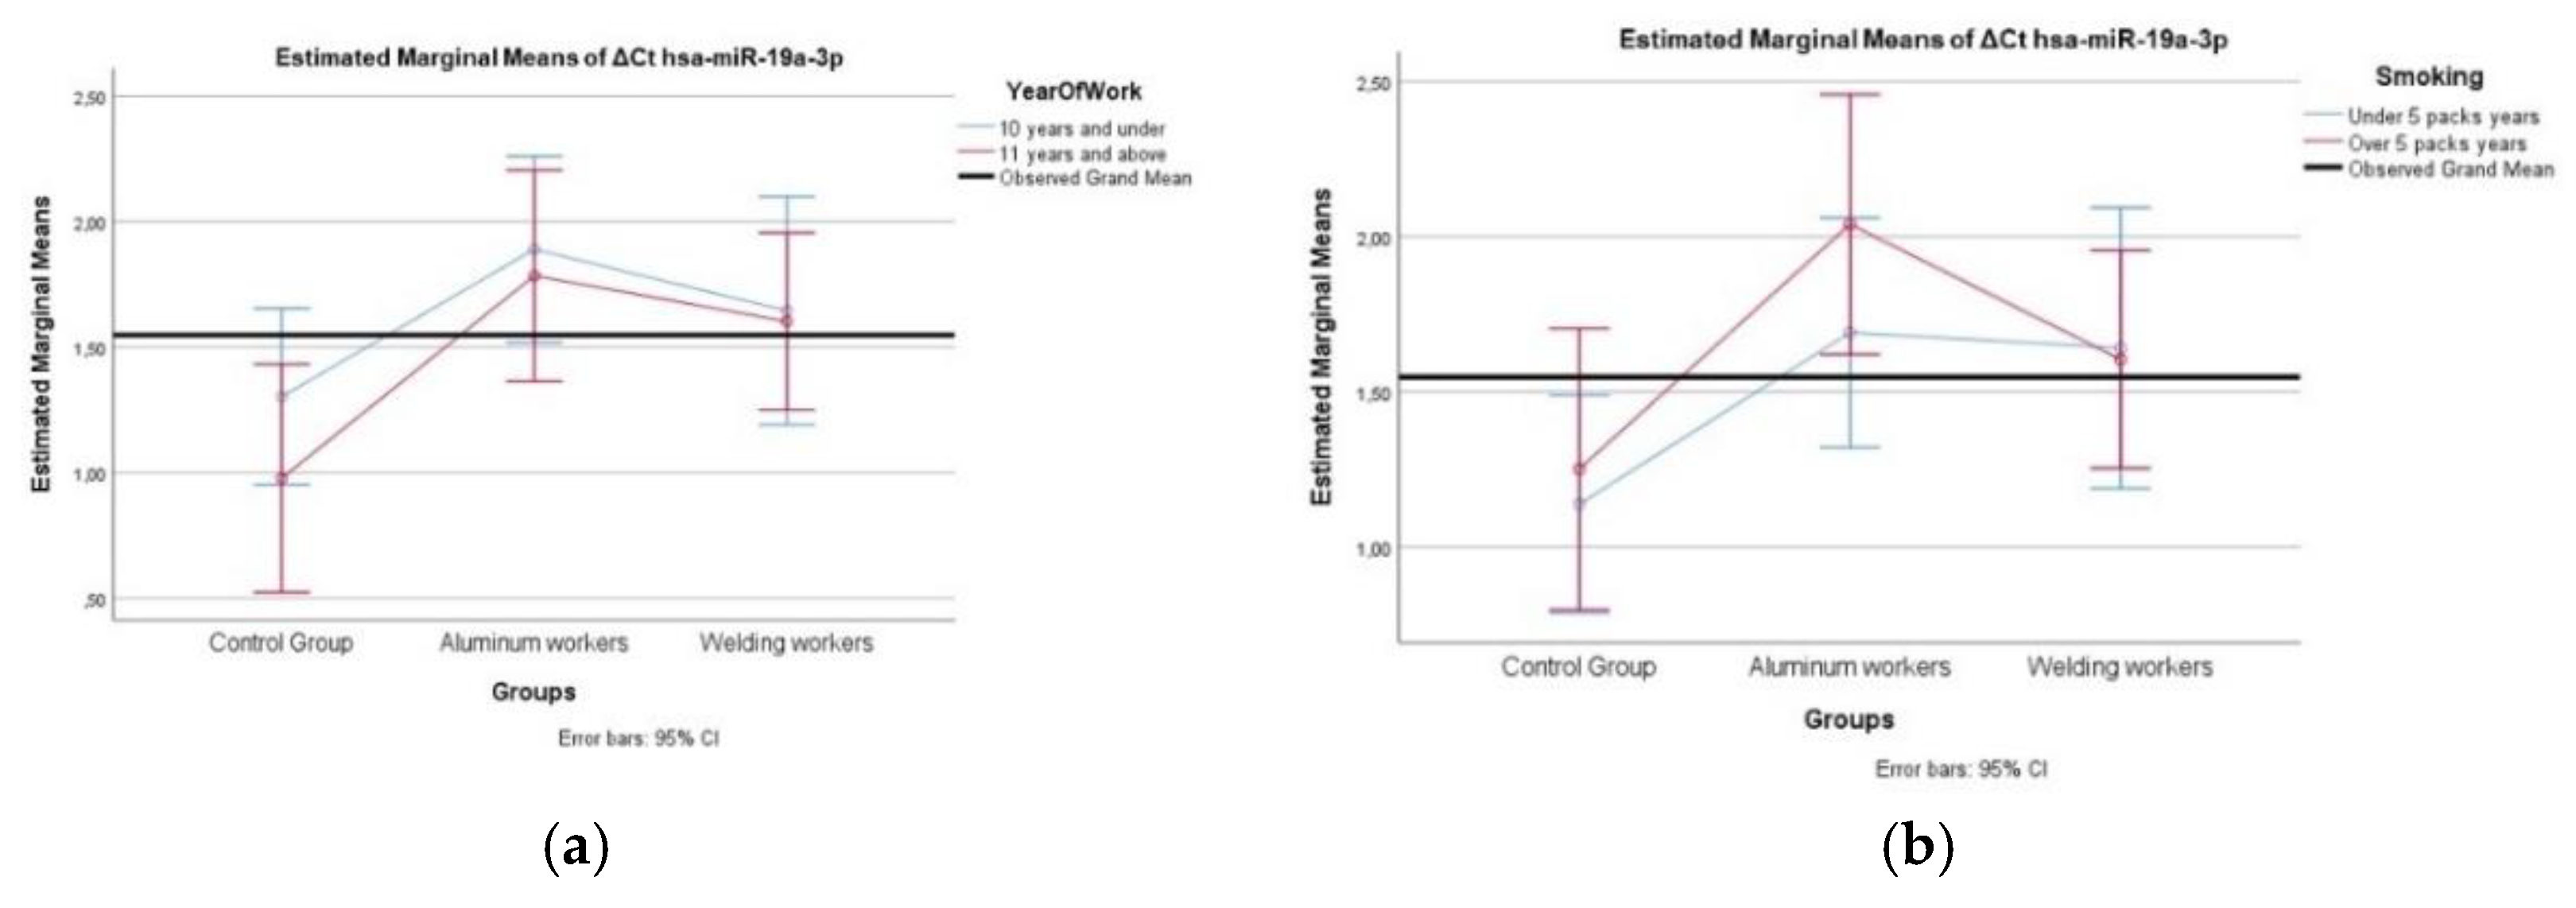
Figure 7.
Significant miRNA values in aluminum workers compared to the control group.

Figure 8.
Significant miRNA values in welding workers compared to the control group.
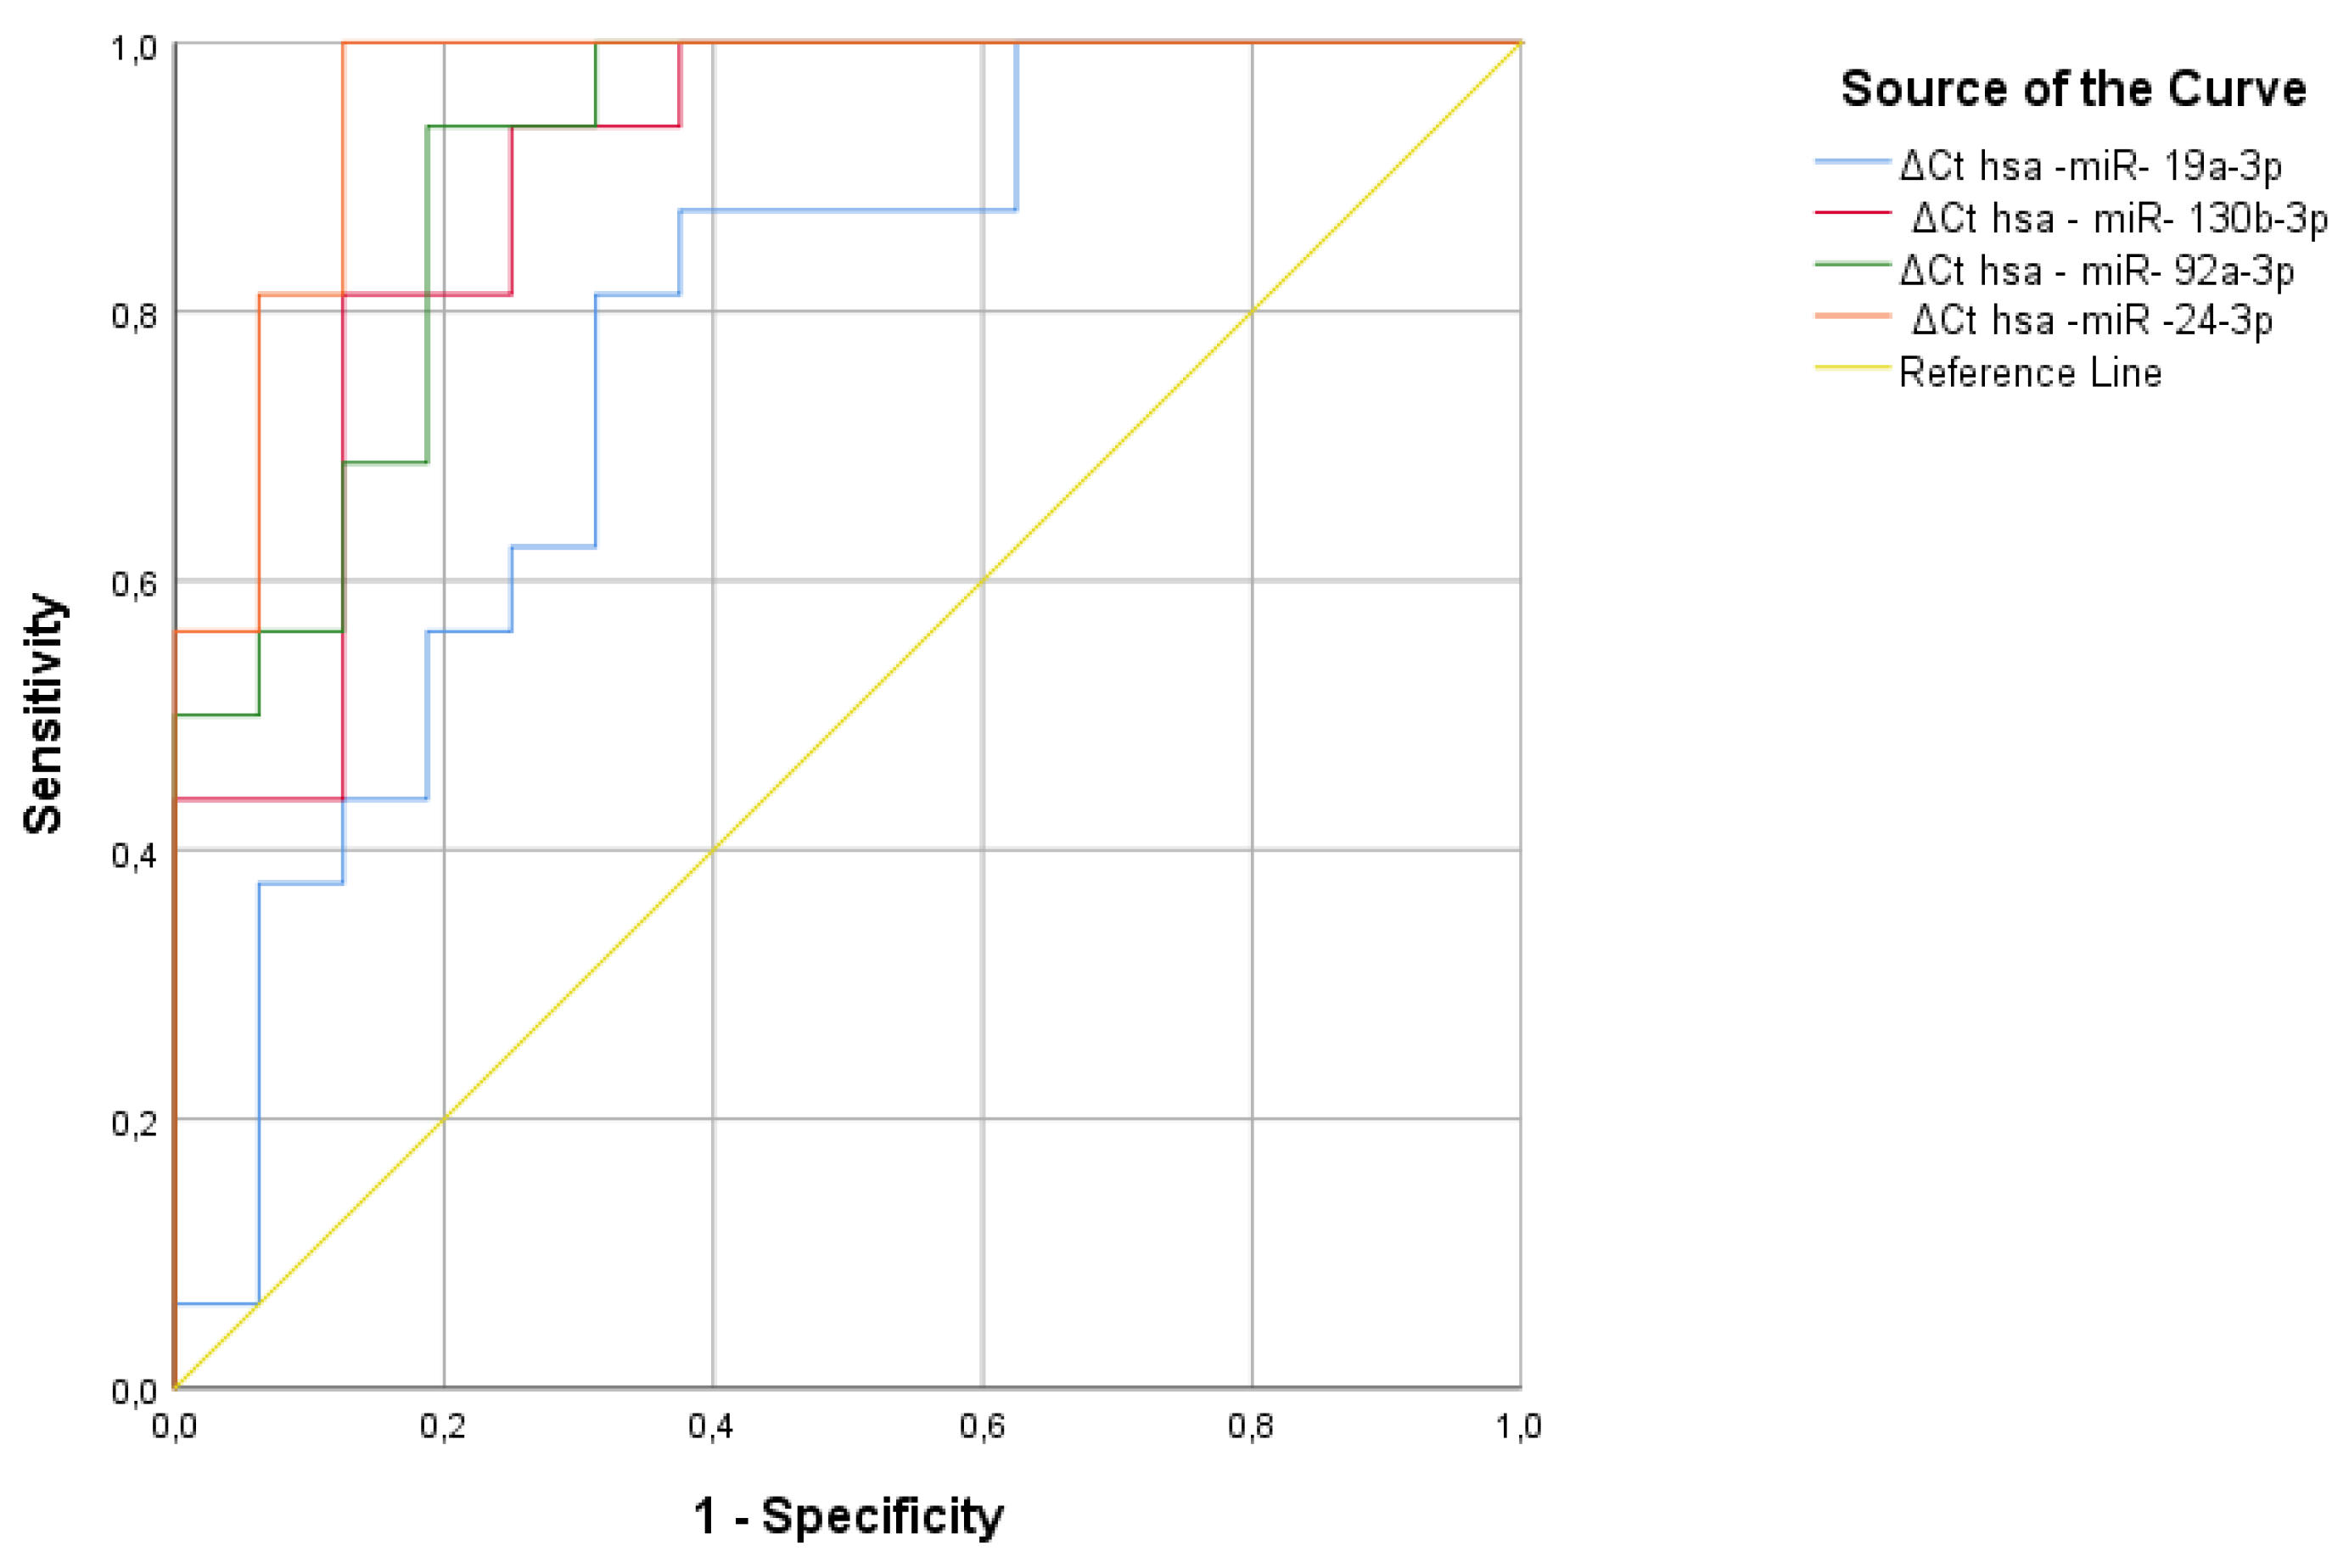
Figure 9.
Displaying the distribution of values for selected samples as a boxplot.
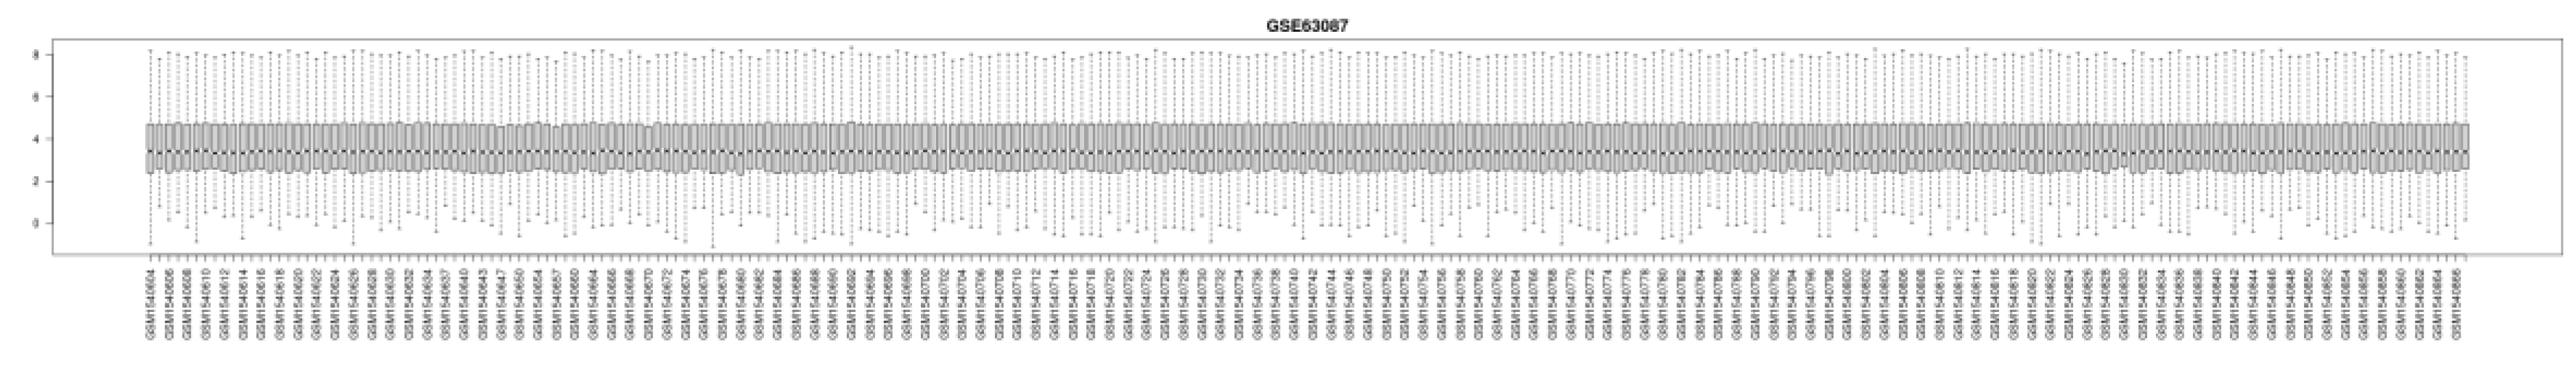

Table 1.
MIENTURNET enrichment results in Cr, Cu, Ni, Pb, and Al (via miRTarBase).
| microRNA | p-value | FDR | Odd ratio | Number of interactions | Target Genes |
|---|---|---|---|---|---|
| hsa-miR-19a-3p | 0,0437 | 0,33 | 0,43 | 6 | ESR1, TNF, TF, MYC, ACSL4, PRKN |
| hsa-miR-130b-3p | 0,257 | 0,523 | 0,644 | 4 | ESR1, ACSL4, MMP2, IGF1 |
| hsa-miR-25-3p | 0,908 | 0,91 | 2,34 | 1 | MYC |
| hsa-miR-363-3p | 0,791 | 0,8 | 1,54 | 1 | CASP3 |
| hsa-miR-92a-3p | 0,959 | 0,959 | 2,12 | 3 | CYP7A1, GCHFR, MYC |
| hsa-miR-24-3p | 0,038 | 0,33 | 0,482 | 8 | MYC, TGFB1, RRM2, HMOX1, IGF1, IL4, IL1B, TNF |
| hsa-miR-19b-3p | 0,103 | 0,418 | 0,537 | 6 | ESR1, LRIG3, ATF2, TGFB1, ACSL4, PRKN |
Table 2.
MIENTURNET enrichment results in Cr, Cu, Ni, Pb, and Al (via TargetScan).
| microRNA | p-value | FDR | Odd ratio | Number of interactions | Target Genes |
|---|---|---|---|---|---|
| hsa-miR-19a-3p/hsa-miR-19b-3p | 0,3 | 0,954 | 0,778 | 7 | ESR1, LRIG3, ATF2, IGF1, ACSL4, HAVCR1, SLC2A1 |
| hsa-miR-130a-3p | 0,408 | 0,954 | 0,837 | 5 | IGF1, ESR1, ACSL4, SLC2A1, TNF |
| hsa-miR-25-3p/hsa-miR-363-3p/ hsa-miR-92a-3p | 0,988 | 0,988 | 4,23 | 1 | NAA15 |
| hsa-miR-24-3p | 0,959 | 0,982 | 3,09 | 1 | G6PD |
Table 3.
miRNA assay list.
| miRNA Symbol | Assay Catolog | Lot Number |
|---|---|---|
| hsa-miR-19a-3p | YP00205862 | 201803080052-4 |
| hsa-miR-19b-3p | YP00204450 | 31201015-3 |
| hsa-miR-130b-3p | YP00204317 | 41000618-1 |
| hsa-miR-25-3p | YP00204361 | 40301621-2 |
| hsa-miR-363-3p | YP00204726 | 201803060217-1 |
| hsa-miR-92a-3p | YP00204258 | 40805431-3 |
| hsa-miR-24-3p | YP00204260 | 31200624-2 |
| hsa-miR-16-5p | YP00205702 | 40501706-1 |
Table 4.
PCR cycling conditions.
| Cycles | Duration | Temperature | Program name |
|---|---|---|---|
| 1 | 2 min. | 950C | PCR initial heat activation |
| 45 | 15 sec. | 950C | Denaturation |
| 60 sec. | 560C | Combined annealing/extension | |
| 1 | 600C 950C |
Melting curve analysis |
Table 5.
Age, working years and smoking distribution of the people included in the study.
| Descriptives | n | Mean | Std. Deviation |
95% CI | Minimum | Maximum | Significance | |||
|---|---|---|---|---|---|---|---|---|---|---|
| Lower | Upper | F | p | |||||||
| Age(Year) | Control Group | 16 | 39,69 | 6,39 | 36,29 | 43,09 | 32 | 55 | 1,079 | 0,348 |
| Aluminum workers | 16 | 38,69 | 10,35 | 33,17 | 44,20 | 20 | 55 | |||
| Welding workers | 16 | 35,06 | 10,75 | 29,34 | 40,79 | 20 | 54 | |||
| Year of work | Control Group | 16 | 10,88 | 2,68 | 9,45 | 12,30 | 7 | 16 | 0,241 | 0,787 |
| Aluminum workers | 16 | 10,50 | 3,25 | 8,77 | 12,23 | 2 | 15 | |||
| Welding workers | 16 | 11,50 | 5,75 | 8,44 | 14,56 | 1 | 18 | |||
| smoking /pack/year | Control Group | 16 | 4,81 | 1,76 | 3,87 | 5,75 | 2 | 8 | 2,227 | 0,12 |
| Aluminum workers | 16 | 5,38 | 2,03 | 4,29 | 6,46 | 2 | 10 | |||
| Welding workers | 16 | 6,31 | 2,27 | 5,10 | 7,52 | 2 | 10 | |||
Table 6.
Metal Concentration (mg/L) in Controls, Aluminum workers, Welding workers.
| Control | Aliminum workers | Welding workers | |||||||||||||
| Descriptive | Al | Cr | Cu | Ni | Pb | Al* | Cr | Cu | Ni | Pb¶ | Al* | Cr | Cu | Ni | Pb¶ |
| Mean | 4,932 | nd | 3,001 | 2,976 | 0,667 | 7,320 | 0,237 | 3,099 | 3,347 | 0,804 | 6,904 | 0,316 | 3,134 | 3,196 | 0,903 |
| Std. Deviation | 0,566 | nd | 0,165 | 0,342 | 0,068 | 1,630 | 0,191 | 0,334 | 1,264 | 0,104 | 1,998 | 0,145 | 0,168 | 1,500 | 0,084 |
| Median | 4,881 | nd | 3,025 | 2,900 | 0,653 | 6,980 | 0,172 | 3,183 | 2,896 | 0,824 | 6,489 | 0,298 | 3,130 | 2,632 | 0,890 |
| Minimum | 4,240 | nd | 2,722 | 2,479 | 0,580 | 5,620 | 0,046 | 2,456 | 2,279 | 0,574 | 4,357 | 0,075 | 2,903 | 2,332 | 0,719 |
| Maximum | 5,810 | nd | 3,307 | 3,553 | 0,821 | 12,429 | 0,654 | 3,610 | 7,567 | 0,930 | 12,952 | 0,554 | 3,442 | 8,343 | 1,053 |
**Cadmium was not detected in all three groups; * p<0.001 is significantly higher compared to that in the control group; ¶ significantly higher than the control group ; nd: non-detected.
Table 7.
Correlation coefficients for miRNAs analyzed in relation to heavy metal results.
| . | Heavy metals | hsa-miR-19a-3p | hsa-miR-19b-3p | hsa-miR-130b-3p | hsa-miR-25-3p | hsa-miR-363-3p | hsa-miR-92a-3p | hsa-miR-24-3p |
|---|---|---|---|---|---|---|---|---|
| Al | Pearson Correlation | 0,319* | 0,413** | 0,356* | 0,304* | 0,183 | 0,354* | 0,411** |
| p | 0,027 | 0,003 | 0,013 | 0,036 | 0,214 | 0,014 | 0,004 | |
| n | 48 | 48 | 48 | 48 | 48 | 48 | 48 | |
| Cr | Pearson Correlation | -0,225 | -0,156 | 0,255 | -0,126 | 0,383* | 0,363* | 0,245 |
| p | 0,216 | 0,393 | 0,16 | 0,49 | 0,03 | 0,041 | 0,177 | |
| n | 32 | 32 | 32 | 32 | 32 | 32 | 32 | |
| Cu | Pearson Correlation | 0,075 | 0,093 | -0,046 | 0,195 | -0,295* | -0,089 | -0,057 |
| p | 0,611 | 0,531 | 0,756 | 0,185 | 0,042 | 0,549 | 0,701 | |
| n | 48 | 48 | 48 | 48 | 48 | 48 | 48 | |
| Ni | Pearson Correlation | -0,018 | 0,091 | 0,074 | -0,006 | 0,047 | 0,032 | 0,014 |
| p | 0,902 | 0,537 | 0,616 | 0,967 | 0,753 | 0,829 | 0,923 | |
| n | 48 | 48 | 48 | 48 | 48 | 48 | 48 | |
| Pb | Pearson Correlation | 0,175 | 0,112 | 0,399** | 0,006 | 0,209 | 0,370** | 0,478** |
| p | 0,233 | 0,447 | 0,005 | 0,965 | 0,154 | 0,01 | 0,001 | |
| n | 48 | 48 | 48 | 48 | 48 | 48 | 48 |
Table 8.
Comparison of mean ΔCt and fold change values between the heavy metal-exposed group and the group without heavy metal exposure (p<0.05).
Table 8.
Comparison of mean ΔCt and fold change values between the heavy metal-exposed group and the group without heavy metal exposure (p<0.05).
| miRNA. | ΔCt | ΔΔCt | 2-ΔΔCt | Fold Change | Fold up-or down- regulation | p value | p value | ||||||||
|---|---|---|---|---|---|---|---|---|---|---|---|---|---|---|---|
| AE | WFE | Non-E | AE | WFE | Non-E | AE | WFE | Non-E | AE/ Non-E |
WFE/ Non-E |
AE/ Non-E |
WFE/ Non-E |
AE/ Non-E |
WFE/ Non-E |
|
| hsa-miR-19a-3p | 20,51 | 18,34 | 21,02 | 1,84375 | 1,61875 | 1,18125 | 0,278597 | 0,325617 | 0,440969 | 0,6318 | 0,7384 | -1,5828 | -1,3543 | 0,009145 | 0,01051 |
| hsa-miR-19b-3p | 21,12 | 18,64 | 21,72 | 2,456875 | 1,915 | 1,699375 | 0,182141 | 0,265172 | 0,307919 | 0,5915 | 0,8612 | -1,6906 | -1,1612 | 0,010407 | 0,243103 |
| hsa-miR-130b-3p | 26,09 | 24,77 | 26,83 | 7,42625 | 8,043125 | 6,80375 | 0,005814 | 0,003791 | 0,008951 | 0,6495 | 0,4236 | -1,5395 | -2,361 | 0,572081 | 0,000041 |
| hsa-miR-25-3p | 22,46 | 20,2 | 23,4 | 3,79375 | 3,47375 | 3,376875 | 0,072105 | 0,090011 | 0,096263 | 0,749 | 0,9351 | -1,335 | -1,0695 | 0,283009 | 0,547976 |
| hsa-miR-363-3p | 24,89 | 23,24 | 26,23 | 6,22625 | 6,515625 | 6,205 | 0,013357 | 0,01093 | 0,013555 | 0,9854 | 0,8063 | -1,0148 | -1,2402 | 0,636084 | 0,08771 |
| hsa-miR-92a-3p | 20,16 | 18,81 | 21,29 | 1,491875 | 2,09 | 1,269375 | 0,35555 | 0,234881 | 0,414839 | 0,8571 | 0,5662 | -1,1668 | -1,7662 | 0,849347 | 0,000375 |
| hsa-miR-24-3p | 22,35 | 21,13 | 23,13 | 3,68625 | 4,4125 | 3,11 | 0,077683 | 0,046958 | 0,115824 | 0,6707 | 0,4054 | -1,491 | -2,4666 | 0,098174 | 0 |
ΔCt : Delta cycle threshold AE: aluminum-exposed WFE: welding fume-exposed non-E: non-exposed.
Table 9.
ΔCt values in the control group according to working years.
| Groups | MiRNA | Years of working | n | Mean | Std. Deviation | Minimum | Maximum | Z | Sig. |
|---|---|---|---|---|---|---|---|---|---|
| Control Group | ΔCt hsa-miR-19a-3p | 10 years and under | 10 | 1,30 | 0,36 | 0,90 | 1,94 | -0,651 | 0,515 |
| 11 years and above | 6 | 0,98 | 0,70 | 0,12 | 1,71 | ||||
| ΔCt hsa-miR-19b-3p | 10 years and under | 10 | 1,74 | 0,54 | 0,60 | 2,38 | -0,434 | 0,664 | |
| 11 years and above | 6 | 1,63 | 0,45 | 1,03 | 2,01 | ||||
| ΔCt hsa-miR-130b-3p | 10 years and under | 10 | 6,62 | 0,78 | 5,85 | 8,12 | -1,41 | 0,159 | |
| 11 years and above | 6 | 7,11 | 0,76 | 6,09 | 8,17 | ||||
| ΔCt hsa-miR-25-3p | 10 years and under | 10 | 3,42 | 0,45 | 2,69 | 4,36 | -0,76 | 0,447 | |
| 11 years and above | 6 | 3,31 | 0,24 | 3,06 | 3,68 | ||||
| ΔCt hsa-miR-363-3p | 10 years and under | 10 | 6,16 | 0,97 | 4,53 | 8,28 | -0,651 | 0,515 | |
| 11 years and above | 6 | 6,29 | 0,24 | 6,04 | 6,67 | ||||
| ΔCt hsa-miR-92a-3p | 10 years and under | 10 | 1,19 | 0,58 | -0,10 | 2,12 | -0,651 | 0,515 | |
| 11 years and above | 6 | 1,40 | 0,62 | 0,60 | 2,17 | ||||
| ΔCt hsa-miR-24-3p | 10 years and under | 10 | 2,91 | 0,34 | 2,49 | 3,44 | -2,118 | 0,034 | |
| 11 years and above | 6 | 3,45 | 0,49 | 2,87 | 4,24 |
Table 10.
ΔCt values in the aluminum group according to the working years.
| Groups. | MiRNA | Years of working | n | Mean | Std. Deviation | Minimum | Maximum | Z | Sig. |
|---|---|---|---|---|---|---|---|---|---|
| Aluminum workers | ΔCt hsa-miR-19a-3p | 10 years and under | 9 | 1,89 | 0,92 | 0,96 | 3,58 | 0 | 1 |
| 11years and above | 7 | 1,78 | 0,45 | 1,05 | 2,57 | ||||
| ΔCt hsa-miR-19b-3p | 10 years and under | 9 | 2,50 | 0,93 | 0,71 | 3,97 | -0,159 | 0,874 | |
| 11 years and above | 7 | 2,40 | 0,43 | 2,04 | 3,18 | ||||
| ΔCt hsa-miR-130b-3p | 10 years and under | 9 | 7,34 | 1,50 | 5,62 | 9,94 | -0,318 | 0,751 | |
| 11 years and above | 7 | 7,53 | 1,66 | 5,25 | 10,07 | ||||
| ΔCt hsa-miR-25-3p | 10 years and under | 9 | 3,94 | 1,43 | 2,35 | 6,49 | -0,742 | 0,458 | |
| 11 years and above | 7 | 3,61 | 0,26 | 3,33 | 4,05 | ||||
| ΔCt hsa-miR-363-3p | 10 years and under | 9 | 6,00 | 1,12 | 3,36 | 7,41 | -0,212 | 0,832 | |
| 11 years and above | 7 | 6,52 | 0,86 | 5,67 | 7,90 | ||||
| ΔCt hsa-miR-92a-3p | 10 years and under | 9 | 1,36 | 0,88 | -0,30 | 2,91 | -0,371 | 0,711 | |
| 11 years and above | 7 | 1,67 | 1,11 | 0,12 | 3,59 | ||||
| ΔCt hsa-miR-24-3p | 10 years and under | 9 | 3,34 | 0,73 | 2,24 | 4,10 | -1,115 | 0,265 | |
| 11 years and above | 7 | 4,13 | 1,28 | 2,77 | 6,80 |
Table 11.
ΔCt values according to working years in the welding workers group.
| Groups. | MiRNA | Years of working | n | Mean | Std. Deviation | Minimum | Maximum | Z | Sig. |
|---|---|---|---|---|---|---|---|---|---|
| Welding workers | ΔCt hsa-miR-19a-3p | 10 years and under | 6 | 1,65 | 0,38 | 1,10 | 2,15 | -0,435 | 0,664 |
| 11 years and above | 10 | 1,60 | 0,23 | 1,10 | 1,83 | ||||
| ΔCt hsa-miR-19b-3p | 10 years and under | 6 | 1,76 | 0,60 | 0,72 | 2,29 | -0,542 | 0,588 | |
| 11 years and above | 10 | 2,01 | 0,30 | 1,52 | 2,44 | ||||
| ΔCt hsa-miR-130b-3p | 10 years and under | 6 | 8,20 | 0,87 | 6,91 | 8,96 | -0,759 | 0,448 | |
| 11 years and above | 10 | 7,95 | 0,33 | 7,53 | 8,53 | ||||
| ΔCt hsa-miR-25-3p | 10 years and under | 6 | 3,29 | 0,50 | 2,39 | 3,70 | -1,303 | 0,193 | |
| 11 years and above | 10 | 3,58 | 0,24 | 3,12 | 3,87 | ||||
| ΔCthsa-miR-363-3p | 10 years and under | 6 | 6,25 | 0,30 | 5,76 | 6,66 | -2,386 | 0,017 | |
| 11 years and above | 10 | 6,68 | 0,33 | 5,88 | 7,04 | ||||
| ΔCt hsa-miR-92a-3p | 10 years and under | 6 | 2,02 | 0,35 | 1,34 | 2,26 | -0,326 | 0,745 | |
| 11 years and above | 10 | 2,13 | 0,18 | 1,88 | 2,51 | ||||
| ΔCt hsa-miR-24-3p | 10 years and under | 6 | 4,72 | 0,84 | 3,53 | 5,77 | -1,193 | 0,233 | |
| 11 years and above | 10 | 4,23 | 0,42 | 3,65 | 4,84 |
Table 12.
ΔCt values in the aluminum workers group based on smoking years.
| Groups | MiRNA | Years of Smoking | n | Mean | Std. Deviation | Minimum | Maximum | Z | Sig. |
|---|---|---|---|---|---|---|---|---|---|
| Control Group | ΔCt hsa-miR-19a-3p | Under 5 packs years | 10 | 1,14 | 0,60 | 0,12 | 1,94 | 0 | 1 |
| Over 5 packs years | 6 | 1,25 | 0,39 | 0,90 | 1,74 | ||||
| ΔCt hsa-miR-19b-3p | Under 5 packs years | 10 | 1,71 | 0,43 | 1,03 | 2,38 | -0,217 | 0,828 | |
| Over 5 packs years | 6 | 1,69 | 0,64 | 0,60 | 2,37 | ||||
| ΔCt hsa-miR-130b-3p | Under 5 packs years | 10 | 6,79 | 0,81 | 5,85 | 8,12 | -0,325 | 0,745 | |
| Over 5 packs years | 6 | 6,83 | 0,80 | 5,98 | 8,17 | ||||
| ΔCt hsa-miR-25-3p | Under 5 packs years | 10 | 3,41 | 0,40 | 2,97 | 4,36 | -0,163 | 0,871 | |
| Over 5 packs years | 6 | 3,33 | 0,38 | 2,69 | 3,70 | ||||
| ΔCt hsa-miR-363-3p | Under 5 packs years | 10 | 6,09 | 0,61 | 4,53 | 6,67 | -0,054 | 0,957 | |
| Over 5 packs years | 6 | 6,41 | 1,00 | 5,52 | 8,28 | ||||
| ΔCt hsa-miR-92a-3p | Under 5 packs years | 10 | 1,47 | 0,52 | 0,85 | 2,17 | -1,193 | 0,233 | |
| Over 5 packs years | 6 | 0,94 | 0,58 | -0,10 | 1,36 | ||||
| ΔCt hsa-miR-24-3p | Under 5 packs years | 10 | 3,12 | 0,58 | 2,49 | 4,24 | -0,217 | 0,828 | |
| Over 5 packs years | 6 | 3,10 | 0,25 | 2,60 | 3,24 |
Table 13.
ΔCt values in the aluminum workers group according to smoking years.
| Groups. | MiRNA | Years of Smoking | n | Mean | Std. Deviation | Minimum | Maximum | Z | Sig. |
|---|---|---|---|---|---|---|---|---|---|
| Aluminum workers | ΔCt hsa-miR-19a-3p | Under 5 packs years | 9 | 1,69 | 0,80 | 0,96 | 3,58 | -1,218 | 0,223 |
| Over 5 packs years | 7 | 2,04 | 0,64 | 1,05 | 3,02 | ||||
| ΔCt hsa-miR-19b-3p | Under 5 packs years | 9 | 2,24 | 0,72 | 0,71 | 3,28 | -1,166 | 0,244 | |
| Over 5 packs years | 7 | 2,74 | 0,68 | 2,04 | 3,97 | ||||
| ΔCt hsa-miR-130b-3p | Under 5 packs years | 9 | 6,98 | 1,18 | 5,62 | 9,29 | -1,218 | 0,223 | |
| Over 5 packs years | 7 | 8,00 | 1,80 | 5,25 | 10,07 | ||||
| ΔCt hsa-miR-25-3p | Under 5 packs years | 9 | 3,59 | 1,06 | 2,35 | 6,24 | -1,536 | 0,125 | |
| Over 5 packs years | 7 | 4,06 | 1,10 | 3,33 | 6,49 | ||||
| ΔCt hsa-miR-363-3p | Under 5 packs years | 9 | 5,97 | 1,05 | 3,36 | 6,85 | -0,053 | 0,958 | |
| Over 5 packs years | 7 | 6,55 | 0,95 | 5,67 | 7,90 | ||||
| ΔCt hsa-miR-92a-3p | Under 5 packs years | 9 | 1,29 | 0,75 | -0,30 | 2,20 | -0,371 | 0,711 | |
| Over 5 packs years | 7 | 1,75 | 1,20 | 0,12 | 3,59 | ||||
| ΔCt hsa-miR-24-3p | Under 5 packs years | 9 | 3,34 | 0,73 | 2,24 | 4,10 | -1,327 | 0,184 | |
| Over 5 packs years | 7 | 4,14 | 1,27 | 2,77 | 6,80 |
Table 14.
ΔCt values in the welding workers group according to smoking years.
| Groups | MiRNA | Years of Smoking | n | Mean | Std. Deviation | Minimum | Maximum | Z | Sig. |
|---|---|---|---|---|---|---|---|---|---|
| Welding workers | ΔCt hsa-miR-19a-3p | Under 5 packs years | 6 | 1,64 | 0,34 | 1,10 | 2,15 | -0,054 | 0,957 |
| Over 5 packs years | 10 | 1,61 | 0,26 | 1,10 | 1,88 | ||||
| ΔCt hsa-miR-19b-3p | Under 5 packs years | 6 | 1,61 | 0,49 | 0,72 | 2,11 | -2,278 | 0,023 | |
| Over 5 packs years | 10 | 2,10 | 0,29 | 1,49 | 2,44 | ||||
| ΔCt hsa-miR-130b-3p | Under 5 packs years | 6 | 7,73 | 0,44 | 6,91 | 8,25 | -1,41 | 0,159 | |
| Over 5 packs years | 10 | 8,23 | 0,58 | 7,39 | 8,96 | ||||
| ΔCt hsa-miR-25-3p | Under 5 packs years | 6 | 3,20 | 0,47 | 2,39 | 3,72 | -2,171 | 0,03 | |
| Over 5 packs years | 10 | 3,64 | 0,17 | 3,42 | 3,87 | ||||
| ΔCt hsa-miR-363-3p | Under 5 packs years | 6 | 6,40 | 0,50 | 5,76 | 7,04 | -0,651 | 0,515 | |
| Over 5 packs years | 10 | 6,59 | 0,28 | 6,12 | 6,98 | ||||
| ΔCt hsa-miR-92a-3p | Under 5 packs years | 6 | 1,94 | 0,34 | 1,34 | 2,30 | -1,194 | 0,232 | |
| Over 5 packs years | 10 | 2,18 | 0,15 | 1,91 | 2,51 | ||||
| ΔCt hsa-miR-24-3p | Under 5 packs years | 6 | 4,18 | 0,21 | 3,88 | 4,50 | -1,085 | 0,278 | |
| Over 5 packs years | 10 | 4,55 | 0,76 | 3,53 | 5,77 |
Table 15.
Group and study year interaction in ΔCt hsa-miR-19a-3p.
| Tests of Between-Subjects Effects | |||||
|---|---|---|---|---|---|
| Dependent Variable: ΔCt hsa-miR-19a-3p | |||||
| Source | Type III Sum of Squares | df | Mean Square | F | Sig. |
| Corrected Model | 4,078a | 5 | 0,816 | 2,684 | 0,034 |
| Intercept | 107,591 | 1 | 107,591 | 354,084 | p<0,001 |
| Groups | 3,888 | 2 | 1,944 | 6,398 | 0,004 |
| YearOfWork | 0,283 | 1 | 0,283 | 0,933 | 0,34 |
| Groups * YearOfWork | 0,165 | 2 | 0,083 | 0,272 | 0,763 |
| Error | 12,762 | 42 | 0,304 | ||
| Total | 131,85 | 48 | |||
| Corrected Total | 16,84 | 47 | |||
| a R Squared = 0,242 (Adjusted R Squared = 0,152) | |||||
Table 16.
Group and smoking year interaction in ΔCt hsa-miR-19a-3p.
| Dependent Variable: ΔCt hsa-miR-19a-3p | |||||
|---|---|---|---|---|---|
| Source | Type III Sum of Squares | df | Mean Square | F | Sig. |
| Corrected Model | 4,164a | 5 | 0,833 | 2,759 | 0,03 |
| Intercept | 111,479 | 1 | 111,479 | 369,37 | p<0,001 |
| Groups | 3,524 | 2 | 1,762 | 5,837 | 0,006 |
| Smoking | 0,229 | 1 | 0,229 | 0,76 | 0,388 |
| Groups * Smoking | 0,291 | 2 | 0,146 | 0,483 | 0,62 |
| Error | 12,676 | 42 | 0,302 | ||
| Total | 131,85 | 48 | |||
| Corrected Total | 16,84 | 47 | |||
| a R Squared = 0,247 (Adjusted R Squared = 0,158) | |||||
Table 17.
Group and study year interaction in ΔCt hsa-miR-19b-3p.
| Tests of Between-Subjects Effects | |||||
|---|---|---|---|---|---|
| Dependent Variable: ΔCt hsa-miR-19b-3p | |||||
| Source | Type III Sum of Squares | df | Mean Square | F | Sig. |
| Corrected Model | 5,188a | 5 | 1,038 | 3,056 | 0,019 |
| Intercept | 184,116 | 1 | 184,116 | 542,354 | p<0,001 |
| Groups | 4,889 | 2 | 2,444 | 7,201 | 0,002 |
| YearOfWork | 0,001 | 1 | 0,001 | 0,004 | 0,95 |
| Groups * YearOfWork | 0,312 | 2 | 0,156 | 0,46 | 0,634 |
| Error | 14,258 | 42 | 0,339 | ||
| Total | 216,033 | 48 | |||
| Corrected Total | 19,446 | 47 | |||
| a R Squared = 0,267 (Adjusted R Squared = 0,179) | |||||
Table 18.
Group and smoking year interaction in ΔCt hsa-miR-19b-3p.
| Dependent Variable: ΔCt hsa-miR-19b-3p | |||||
|---|---|---|---|---|---|
| Source | Type III Sum of Squares | df | Mean Square | F | Sig. |
| Corrected Model | 6,795a | 5 | 1,359 | 4,512 | 0,002 |
| Intercept | 185,309 | 1 | 185,309 | 615,25 | p<0,001 |
| Groups | 5,434 | 2 | 2,717 | 9,02 | 0,001 |
| Smoking | 1,23 | 1 | 1,23 | 4,085 | 0,05 |
| Groups * Smoking | 0,668 | 2 | 0,334 | 1,109 | 0,339 |
| Error | 12,65 | 42 | 0,301 | ||
| Total | 216,033 | 48 | |||
| Corrected Total | 19,446 | 47 | |||
| a R Squared = 0,349 (Adjusted R Squared = 0,272) | |||||
Table 19.
Group and study year interaction in ΔCt hsa-miR-24-3p.
| Dependent Variable: ΔCt hsa-miR-24-3p | |||||
|---|---|---|---|---|---|
| Source | Type III Sum of Squares | df | Mean Square | F | Sig. |
| Corrected Model | 18,047a | 5 | 3,609 | 7,102 | p<0,001 |
| Intercept | 658,726 | 1 | 658,726 | 1296,073 | p<0,001 |
| Groups | 12,695 | 2 | 6,347 | 12,489 | p<0,001 |
| YearOfWork | 0,876 | 1 | 0,876 | 1,724 | 0,196 |
| Groups * YearOfWork | 3,485 | 2 | 1,742 | 3,428 | 0,042 |
| Error | 21,346 | 42 | 0,508 | ||
| Total | 709,452 | 48 | |||
| Corrected Total | 39,393 | 47 | |||
| a R Squared = 0,458 (Adjusted R Squared = 0,394) | |||||
Table 20.
Group and smoking year interaction in ΔCt hsa-miR-24-3p.
| Dependent Variable: ΔCt hsa-miR-24-3p | |||||
|---|---|---|---|---|---|
| Source | Type III Sum of Squares | df | Mean Square | F | Sig. |
| Corrected Model | 16,675a | 5 | 3,335 | 6,165 | p<0,001 |
| Intercept | 638,494 | 1 | 638,494 | 1180,397 | p<0,001 |
| Groups | 11,882 | 2 | 5,941 | 10,983 | p<0,001 |
| Smoking | 1,686 | 1 | 1,686 | 3,118 | 0,085 |
| Groups * Smoking | 1,295 | 2 | 0,647 | 1,197 | 0,312 |
| Error | 22,718 | 42 | 0,541 | ||
| Total | 709,452 | 48 | |||
| Corrected Total | 39,393 | 47 | |||
| a R Squared = 0,423 (Adjusted R Squared = 0,355) | |||||
Table 21.
Group and study year interaction in ΔCt hsa-miR-92a-3p.
| Dependent Variable: hsa-miR-92a-3p | |||||
|---|---|---|---|---|---|
| Source | Type III Sum of Squares | df | Mean Square | F | Sig. |
| Corrected Model | 6,353a | 5 | 1,271 | 2,728 | 0,032 |
| Intercept | 121,109 | 1 | 121,109 | 260,073 | p<0,001 |
| Groups | 4,879 | 2 | 2,44 | 5,239 | 0,009 |
| YearOfWork | 0,508 | 1 | 0,508 | 1,092 | 0,302 |
| Groups * YearOfWork | 0,073 | 2 | 0,036 | 0,078 | 0,925 |
| Error | 19,558 | 42 | 0,466 | ||
| Total | 151,429 | 48 | |||
| Corrected Total | 25,911 | 47 | |||
| a R Squared = 0,245 (Adjusted R Squared = 0,155) | |||||
Table 22.
Group and smoking year interaction in ΔCt hsa-miR-92a-3p.
| Dependent Variable: ΔCt hsa-miR-92a-3p | |||||
|---|---|---|---|---|---|
| Source | Type III Sum of Squares | df | Mean Square | F | Sig. |
| Corrected Model | 7,880a | 5 | 1,576 | 3,671 | 0,008 |
| Intercept | 116,297 | 1 | 116,297 | 270,897 | p<0,001 |
| Groups | 5,646 | 2 | 2,823 | 6,576 | 0,003 |
| Smoking | 0,035 | 1 | 0,035 | 0,082 | 0,776 |
| Groups * Smoking | 2,073 | 2 | 1,036 | 2,414 | 0,102 |
| Error | 18,031 | 42 | 0,429 | ||
| Total | 151,429 | 48 | |||
| Corrected Total | 25,911 | 47 | |||
| a R Squared = 0,304 (Adjusted R Squared = 0,221) | |||||
Table 23.
Group and study year interaction in ΔCt hsa-miR-363-3p.
| Dependent Variable: ΔCt hsa-miR-363-3p | |||||
|---|---|---|---|---|---|
| Source | Type III Sum of Squares | df | Mean Square | F | Sig. |
| Corrected Model | 2,783a | 5 | 0,557 | 0,948 | 0,461 |
| Intercept | 1822,848 | 1 | 1822,848 | 3103,541 | p<0,001 |
| Groups | 0,506 | 2 | 0,253 | 0,43 | 0,653 |
| YearOfWork | 1,476 | 1 | 1,476 | 2,513 | 0,12 |
| Groups * YearOfWork | 0,321 | 2 | 0,16 | 0,273 | 0,762 |
| Error | 24,668 | 42 | 0,587 | ||
| Total | 1942,033 | 48 | |||
| Corrected Total | 27,451 | 47 | |||
| a R Squared = 0,101 (Adjusted R Squared = -0,006) | |||||
Table 24.
Group and smoking year interaction in ΔCt hsa-miR-363-3p.
| Dependent Variable: ΔCt hsa-miR-363-3p | |||||
|---|---|---|---|---|---|
| Source | Type III Sum of Squares | df | Mean Square | F | Sig. |
| Corrected Model | 2,811a | 5 | 0,562 | 0,958 | 0,454 |
| Intercept | 1833,992 | 1 | 1833,992 | 3126,066 | p<0,001 |
| Groups | 0,573 | 2 | 0,286 | 0,488 | 0,617 |
| Smoking | 1,512 | 1 | 1,512 | 2,577 | 0,116 |
| Groups * Smoking | 0,305 | 2 | 0,153 | 0,26 | 0,772 |
| Error | 24,64 | 42 | 0,587 | ||
| Total | 1942,033 | 48 | |||
| Corrected Total | 27,451 | 47 | |||
| a R Squared = 0,102 (Adjusted R Squared = -0,004) | |||||
Table 25.
Group and study year interaction in ΔCt hsa-miR-130b-3p.
| Dependent Variable: ΔCt hsa-miR-130b-3p. | |||||
|---|---|---|---|---|---|
| Source | Type III Sum of Squares | df | Mean Square | F | Sig. |
| Corrected Model | 13,546a | 5 | 2,709 | 2,386 | 0,054 |
| Intercept | 2544,052 | 1 | 2544,052 | 2240,406 | p<0,001 |
| Groups | 11,006 | 2 | 5,503 | 4,846 | 0,013 |
| YearOfWork | 0,224 | 1 | 0,224 | 0,198 | 0,659 |
| Groups * YearOfWork | 1,03 | 2 | 0,515 | 0,454 | 0,638 |
| Error | 47,692 | 42 | 1,136 | ||
| Total | 2707,063 | 48 | |||
| Corrected Total | 61,239 | 47 | |||
| a R Squared = 0,221 (Adjusted R Squared = 0,128) | |||||
Table 26.
Group and smoking year interaction in ΔCt hsa-miR-130b-3p.
| Dependent Variable: ΔCt hsa-miR-130b-3p | |||||
|---|---|---|---|---|---|
| Source | Type III Sum of Squares | df | Mean Square | F | Sig. |
| Corrected Model | 17,363a | 5 | 3,473 | 3,324 | 0,013 |
| Intercept | 2521,983 | 1 | 2521,983 | 2414,175 | p<0,001 |
| Groups | 10,399 | 2 | 5,2 | 4,977 | 0,011 |
| Smoking | 3,102 | 1 | 3,102 | 2,969 | 0,092 |
| Groups * Smoking | 1,872 | 2 | 0,936 | 0,896 | 0,416 |
| Error | 43,876 | 42 | 1,045 | ||
| Total | 2707,063 | 48 | |||
| Corrected Total | 61,239 | 47 | |||
| a R Squared = 0,284 (Adjusted R Squared = 0,198) | |||||
Table 27.
Area under the curve values and their significance for aluminum.
| MiRNAs | AUC | Std. Error | Significance | 95%CI | |
|---|---|---|---|---|---|
| Lower Bound | Upper Bound | ||||
| hsa-miR-19a-3p | 0.764 | 0.084 | 0.011 | 0.599 | 0.929 |
| hsa-miR-19b-3p | 0.852 | 0.072 | 0.001 | 0.710 | 0.993 |
Table 28.
Sensitivity and specificity values of aluminum workers compared to the control group.
| MiRNAs | Positive if Greater Than or Equal To | Sensitivity | 1 - Specificity | Specificity | Sensitivity + Specificity |
|---|---|---|---|---|---|
| hsa-miR-19a-3p | 1,47 | 0,69 | 0,31 | 0,69 | 1,38 |
| 1,59 | 0,69 | 0,25 | 0,75 | 1,44 | |
| hsa-miR-19b-3p | 2,03 | 0,88 | 0,19 | 0,81 | 1,69 |
| 2,08 | 0,75 | 0,19 | 0,81 | 1,56 |
Table 29.
Area under the curve values and their significance.
| MiRNAs | Area AUC | Std. Error | Significance | 95%CI | |
|---|---|---|---|---|---|
| Lower Bound | Upper Bound | ||||
| hsa-miR-19a-3p | 0.773 | 0.084 | 0.008 | 0.608 | 0.939 |
| hsa miR-130b-3p | 0.898 | 0.055 | p<0.001 | 0.790 | 1.000 |
| hsa miR-92a-3p | 0.914 | 0.049 | p<0.001 | 0.817 | 1.000 |
| hsa miR-24-3p | 0.961 | 0.032 | p<0.001 | 0.898 | 1.000 |
Table 30.
Sensitivity and specificity values of welding workers compared to the control group.
| MiRNA | Positive if Greater Than or Equal To | Sensitivity | 1 - Specificity | Specificity | Sensitivity + Specificity |
|---|---|---|---|---|---|
| hsa miR- 19a-3p | 1.39 | 0.81 | 0.31 | 0.69 | 1.50 |
| 1,44 | 0,75 | 0,31 | 0,69 | 1,44 | |
| hsa-miR-130b-3p | 7.61 | 0.81 | 0.19 | 0.81 | 1.63 |
| 7.67 | 0.81 | 0.13 | 0.88 | 1.69 | |
| hsa-miR-92a-3p | 1.57 | 0.94 | 0.25 | 0.75 | 1.69 |
| 1.83 | 0.94 | 0.19 | 0.81 | 1.75 | |
| hsa-miR-24-3p | 6.39 | 0.69 | 0.25 | 0.75 | 1.44 |
| 6.46 | 0.63 | 0.25 | 0.75 | 1.38 |
Disclaimer/Publisher’s Note: The statements, opinions and data contained in all publications are solely those of the individual author(s) and contributor(s) and not of MDPI and/or the editor(s). MDPI and/or the editor(s) disclaim responsibility for any injury to people or property resulting from any ideas, methods, instructions or products referred to in the content. |
© 2025 by the authors. Licensee MDPI, Basel, Switzerland. This article is an open access article distributed under the terms and conditions of the Creative Commons Attribution (CC BY) license (http://creativecommons.org/licenses/by/4.0/).
Copyright: This open access article is published under a Creative Commons CC BY 4.0 license, which permit the free download, distribution, and reuse, provided that the author and preprint are cited in any reuse.


