
Submitted:
28 March 2025
Posted:
01 April 2025
You are already at the latest version
Abstract
The objective here is to study the effect of pre-strain on fatigue crack growth (FCG) in 2024-T351 aluminium alloy. Three pre-strain conditions were considered: without pre-strain, compressive and tensile permanent pre-strains of 4%. A numerical approach based on cumulative plastic strain at the crack tip was followed to predict FCG rate. The compressive pre-strain increased FCG rate, while the tensile pre-strain reduced the da/dN relatively to the situation without pre-strain. The influence of pre-strain was linked with plasticity induced crack closure. In fact, a linear trend was obtained between da/dN and DKeff for three crack lengths (a=16.184; a=15.048 mm and a=15.152 mm) and three pre-strain conditions. The increase of stress ratio from R=0.1 to R=0.5 and the elimination of the contact of crack flanks reduced significantly the effect of pre-strain, also pointing for the huge relevance of crack closure in this context. Finally, the effect of pre-strain on da/dN after an overload was also explained by crack closure variations.
Keywords:
fatigue crack growth
; AA2024-T351
; pre-strain
; crack closure
; CTOD
1. Introduction
Real structural components are submitted to plastic deformation during fabrication. Operations like blanking, trimming, stretching, bending and deep drawing are involved in structure fabrication. Sheet metal parts for automotive industry are produced by stamping [1], involving large plastic deformation. Material deformation can also be done to improve the mechanical properties, namely tensile strength and yield stress [2,3]. Plastic deformation resulting from fabrication affects material behaviour [4,5], so it must be included in the design of components and structures.
In laboratory testing or numerical simulation, the effect of pre-strain is studied loading a material up to the desired amount, so that it can experience deformation in the plastic strain regime, and then unload the material. The pre-strain increases the yield stress and tensile strength, while it decreases the ductility. In other words, the material becomes less ductile with pre-strain. This was observed by Ghosal et al. in dual-phase (DP590) steel [6,7], by Le et al. [8] in DP600 steel, by Fredriksson et al. [9] in DP400, DP600, HSLA steel (HSLA500) and a deep-drawing quality steel. Similar trends were also found by Wang et al. [10] for TWIP steel, Walker et al. [11] for DP and FB steels, Ji et al. [12] for different grades of DP steels, Wu et al. [13] for stainless steel (SUH660). These effects of pre-strain are explained by a substantial increase in dislocations [6], leading to localized alterations in lattice orientations. The increased dislocation density of the pre-strained material leads to significant work hardening.
In the high-cycle fatigue regime (HCF), fatigue strength can be defined as the specific stress amplitude below which a material can withstand an infinite number of cycles without failure. Ghosal et al. [6] and Le et al. [7] observed an increase of endurance limit with pre-strain in dual-phase steel. Wang et al. [10] studied AA2024-T3 and found a decrease in fatigue strength. Considering these opposite trends, the influence of tensile pre-strain on high-cycle fatigue life is expected to be material-dependent. In fact, Froustey et al. [14] studied AA5454 and AA2017. The AA2017 showed a considerable reduction in fatigue life, but the AA5454 revealed unaffected fatigue properties with increasing the tensile pre-straining magnitudes.
The effect of pre-strain on low-cycle fatigue (LCF) has also been widely studied. Le Roux et al. [15] studied 304L stainless steel subjected to uniaxial pre-strain. They found a decrease in fatigue life compared to the as-received condition, under strain-controlled cycling, which was attributed to the reduction in ductility. Gustavsson et al. [16] studied dual-phase (DP) steel subjected to uniaxial pre-strain. They also observed a reduction in the fatigue life under fully reversed strain-controlled fatigue loading. Parker et al. [17] investigated the effect of 40% balanced biaxial stretching on hot rolled low carbon steel SAE1008. They reported that fatigue resistance starts to degrade in the LCF region compared to the as-received condition due to the cyclic softening nature of the stretched material. The pre-straining decreases ductility, which can cause poor fatigue performance in the LCF region. In contrast, it was found that fatigue resistance improves in the HCF region. The same trends were observed in DP600 steel submitted to 12.5% uniaxial pre-strain [18]. Rex et al. [19] studied the 2024-T4 aluminium alloy. A considerable increase in fatigue life was found for uniaxial tensile pre-strained in comparison to the 0% prestrained condition at higher strain amplitude. Furthermore, equi-biaxial tensile pre-strained specimens showed a quite small increment in fatigue life compared to 0% pre-strained material. As-received specimens exhibit noticeable cyclic hardening at all the strain amplitude values. The pre-strained specimen shows an almost stable cyclic stress–strain response for each strain amplitude. Branco et al. [20] studied the effect of 4 and 8% tensile pre-strains on the LCF in AA7050-T6. They observed a reduction of fatigue life with pre-strain. Without pre-strain the dislocations tended to have a more homogeneous distribution, while under higher tensile pre-strains, the dislocations were mainly observed at the slip bands.
The effect on fatigue crack growth (FCG) has also been studied. Schijve [21] studied aluminium alloys and observed a substantial rise in FCG rate of 2024-T3 alloy after applying a 3% tensile pre-strain. He suggested that the elevated yield strength due to pre-straining leads to a smaller plastic zone size, intensifying tensile stresses and diminishing crack closure within the plastic zone near the crack tip, thereby accelerating crack propagation. Al-Rubaie et al. [22] studied AA7475-T7351 and found a limited effect of pre-straining in regimes I and II, but an effect in regime III associated with a loss of fracture toughness. Anandavijayan et al. [23] also found a limited effect in S355 steel submitted to pre-strains of 0, 5 and 10%. On the contrary, they found a great influence on high-cycle fatigue life. Tai Shan and Liu [24] observed an increase of FCG rate in AA2024-T351. Wasen et al. [25] found that pre-straining reduces FCG rate in dual-phase steel. Arora et al. [26] studied mild steel and observed a decrease of FCG rate in regime II. Radhakrishnan et al. [27] investigated the influence of pre-straining and stress ratio on FCG in mild and stainless steel. They observed that the FCG rate decreased by factors of 2.4 and 3.7 for 6% and 9% pre-strains and 1.4 and 2.4 for 9% and 14% pre-strains in mild and stainless steel, respectively. In contrast to earlier findings, Kim et al. [28] showed that FCG rate increases with higher pre-strain levels in the lower and intermediate ΔK regimes in PH steel. Leitner et al. [29] also found that increased plastic pre-deformation increases the FCG rate and ΔKth in pearlitic steel. The conclusions from the above literature demonstrate that the influence of plastic pre-strain on FCG response is greatly dependent on material. However, there is a lack of understanding of the mechanisms explaining the effect of pre-strain. Besides, the effect of compressive pre-strain on FCG has not been reported.
The objective of this research is to study the effect of pre-strain on FCG in 2024-T351 aluminium alloy. A numerical model was built to simulate the application of pre-strain and the subsequent propagation of a fatigue crack by node release. Tensile and compressive pre-strains of 4% were studied.
2. Numerical model
Figure 1a shows the CT specimens considered in the numerical study. These specimens had a width W=36 mm and an initial crack length a0=15 mm. Only 1/4 of CT specimen was modelled, as indicated in Figure 1b and Figure 1c, considering adequate boundary conditions. The cyclic load was applied in the upper point of the specimen hole, considering a nodal force. Rigid body movement is inhibited fixing the lower right corner, as indicated in Figure 1b. The contact of crack flanks was simulated using a rigid plane placed at the crack symmetry plane. A small thickness of 0.1 mm was considered for the specimen, in order to model a plane stress state. Simulations without contact between crack flanks were also run, to understand the effect of crack closure.
The material studied was the 2024-T351 aluminium alloy. The 2XXX series of aluminium alloys are widely used in aerospace applications owing to their high strength, good fracture toughness, and low density [30]. As a result of its high strength-to-weight ratio, the Al–Cu–Mg–Mn based AA2024 aluminium alloy is widely used for various engineering applications, including aircraft and transportation applications [31,32]. Typically, this material is used in the design of fuselage, wings, and lightweight components in the aerospace industry. Table 1 shows the chemical composition of the 2024-T351 aluminium alloy used in this research. The material properties of the 2024-T351 aluminium alloy without pre-strain, determined with a tensile test, are: Young modulus=73 GPa, Yield stress=325 MPa, Ultimate Tensile Strength (UTS)=470 MPa, Elongation at break=20% and Brinell Hardness=137.
The accurate modelling of material elastic-plastic behaviour is fundamental to obtain good quality numerical predictions of crack tip plastic deformation. The elastic behaviour is assumed isotropic and described by Hooke’s law. On the other hand, the plastic behaviour is characterised by the von Mises yield criterion and the Swift isotropic hardening law coupled with Lemaître-Chaboche kinematic hardening law under an associated flow rule. Swift hardening law [33] is described by:
where Y0, C and n are the material parameters and denotes the equivalent plastic strain. The Lemaître-Chaboche kinematic hardening law [34] is:
where CX and XSat are the material parameters of Lemaître-Chaboche law, is the equivalent stress and is the equivalent plastic strain rate. The material parameters, presented in Table 2, were identified using LCF fatigue curves obtained for Rε =-1 and Δε/2=1.5% in a previous research [35].
The numerical model was implemented using the in-house software DD3IMP (Three-Dimensional Elasto-Plastic Finite Element Code), originally developed for the simulation of deep-drawing [36]. An updated Lagrangian approach is used to describe the evolution of the deformation process, assuming a hypoelastic-plastic model. The numerical model considers large elastoplastic strains and rotations, while the elastic strains are assumed negligibly small. Figure 2 shows the finite element mesh considered, where the specimen was discretized with linear 8-node hexahedral finite elements, using a selective reduced integration technique to avoid volumetric locking. It was refined in the crack growth region, having elements with 8×8 μm2. In regions relatively distant from the propagation zone finite elements have larger dimensions, in order to reduce the total number of elements and thus the numerical effort. Only one layer of elements was considered along the thickness direction. The model comprises 14625 finite elements and 29756 nodes.
Crack propagation was numerically modelled by successive debonding of both current crack front nodes. This crack propagation is fundamental to generate a residual plastic and therefore to stabilize the crack closure level. The release occurs at minimum load to avoid convergence problems that may arise due to crack propagation at maximum load. The size of each crack increment corresponded to the finite element size in the refined region. The two crack front nodes were released when the accumulation of plastic strain reached the critical value of strain. This critical value was calibrated using one experimental value of da/dN, and a value of 110% was obtained in a previous study of the authors [37].
The pre-strain was applied by displacing a range of nodes along the entire width of the specimen. This displacement simulated what would experimentally be a distributed tensile or compressive load on the specimen. The region where plastic deformation was induced is indicated by the red rectangle in Figure 3. The region above it is free from pre-deformation. The displacements were adjusted to obtain plastic deformations of 4% in tension and compression (εps=-4, +4%). After the application of pre-deformation, a crack with a length a0=15 mm was simulated and submitted to cyclic loading and crack propagation by node release.
The CT specimen was submitted to constant amplitude loading with stress ratios R=0.1 and R=0.5. In the first case, the maximum and minimum forces were 41.67 N e 4.17 N, being 75 N and 37.5 N for a stress ratio R=0.5. Simulations of overloads were also considered. In the overload cycle the maximum and minimum loads were 79.17 N and 4.17, respectively, giving an overload ratio OLR=1.5, calculated according:
The baseline loading had Fmax=41.67 N and Fmin= 4.17 N, respectively. Table 3 presents all the load cases considered. Simulations without contact of crack flanks were also considered, as already mentioned.
3. Results
3.1. Effect of Pre-Strain on da/dN
Figure 4 shows the variation of FCG rate versus crack length, a, with and without pre-strain. The crack propagation started at a0=15 mm and ended at a=16.2 mm. This propagation is enough to stabilize the level of plastic induced crack closure.
The specimen without pre-strain presents an initial small increase of da/dN, followed by a progressive decrease to a minimum value, which occurs at about a=15.5 mm. This decrease is explained by the progressive increase of crack closure level with the formation of residual plastic wake. Above this transient regime there is a stable regime characterised by a progressive increase of da/dN, which is explained by the increase of crack tip fields with crack length.
The specimen with a tensile pre-strain of 4% presents a similar behaviour, but the variations are much smaller. There is a small increase of da/dN, followed by a smooth decrease to a minimum value which occurs at about a=15.2 mm. Finally, there is a progressive increase with crack propagation as a result of the increase of crack length.
The specimen submitted to a compressive pre-strain of 4% presents a small initial increase of da/dN, but without subsequent decrease. The slope of increase of da/dN with crack length is similar to that observed for the specimen without pre-strain. On the other hand, the specimen with tensile pre-strain has a lower rate of variation of da/dN in the stable regime. The FCG rate in the stable regime is higher for the compressive pre-strain, intermediate for the specimen without pre-strain, and lower for the tensile pre-strain. For a crack length of 16.184 mm, indicated by the vertical dashed line, da/dN has values of 0.95, 0.71 and 0.39 μm/cycle for εps=-4, 0 and +4%, respectively.
Figure 5 presents the CTOD versus load plots, which are particularly interesting to understand what is happening at the crack tip. The CTOD curves plotted were measured at the first node behind crack tip for a crack length a=16.184 mm, indicated by the vertical dashed line on the right-hand side of Figure 4. The load ranged between Fmin=4.17 N and Fmax=41.67 N, as can be seen in the horizontal axis. The crack is closed at the lower part of the load cycle, having a linear elastic behaviour after opening. At relatively high loads there is a departure from linearity, resulting from crack tip plastic deformation. The elastic and plastic CTOD ranges (δe and δp, respectively), are indicated for the compressive pre-strain.
The crack opening level is lower for the compressive pre-strain (Fopen≈10 N), and higher for the tensile pre-strain (Fopen≈20 N), having an intermediate value for the specimen without pre-strain (Fopen≈15 N). The crack opening level was quantified using:
The compressive pre-strain has U*=18.23%, the situation without pre-strain has U*=27.15%, and the tensile pre-strain has U*=42.53%. The increase of crack opening level decreases the effective load range, which reduces maximum CTOD, the elastic and plastic deformation ranges and the area of the loop (which is proportional of the dissipated energy). The sizes of monotonic plastic and reversed plastic zones are also expected to decrease. Therefore, a relation may be established between these non-linear parameters and da/dN values presented in Figure 4.
The relation between FCG rate and the effective stress intensity factor range, ΔKeff, was studied for three crack lengths (a=16.184; a=15.048 mm and a=15.152 mm) and three pre-strain conditions (εps=-4, 0, +4%). Figure 6 shows the results obtained, which indicate a well-defined correlation between da/dN and ΔKeff, although some scatter can be observed. The increase of ΔKeff increases da/dN, and a linear trend is obtained. This correlation clearly indicates that plasticity induced crack closure (PICC) is behind the variations of da/dN observed in Figure 4 and therefore behind the effect of pre-strain on FCG.
3.2. Influence of Stress Ratio on Pre-Strain Effect
Figure 7 presents results of da/dN versus crack length for a stress ratio R=0.5 and different pre-strain values (εps=-4, 0, +4%). The dashed lines indicate results obtained for R=0.1. The increase of R increased significantly da/dN, which means that the stress ratio has a major impact. The effect of R is usually associated with crack closure phenomenon, therefore the results in Figure 7 indicate that crack closure is affecting the results. The increase of FCG rate with stress ratio has been observed by different authors, namely Mehrzadi e Taheri [38] in a magnesium alloy and Seifi and Hosseini [39] in pure copper.
On the other hand, the effect of pre-strain is less evident for R=0.5 than it was for R=0.1. Note that linear scales are being used, instead of logarithmic scales. Anyway, the tensile pre-strain produces a slightly higher da/dN for the compressive pre-strain, while the pre-strain εps=0 has intermediate values. The slope, i.e., the rate of variation of da/dN with crack length, is similar for the different pre-strains. So, there is an inversion of the effects of tensile and compressive pre-strains, relatively to the results obtained for R=0.1.
Some oscillations were observed in all curves. In fact, the node release for the simulation of crack growth occurs at minimum load, when the accumulated plastic strain reaches the critical value (110%). Normally this critical value is reached in the middle of a load cycle. So, there is some inaccuracy in the predicted value of N, i.e., the number of load cycles between node release used to calculate da/dN. The problem becomes more relevant when N is relatively small, i.e., when the crack growth rate is relatively high. In this case, although the error is just a fraction of unit, it has some impact on da/dN. These oscillations are a numerical issue, which does not affect the global trend, therefore a smoothing strategy was used to remove them in Figure 7.
Figure 8 plots the variation of CTOD with applied load for a stress ratio R=0.5 and different pre-strain values (εps=-4, 0, +4%). Both the maximum and minimum loads increased relatively to the situation with R=0.1, which is represented by the dashed lines. The curves for R=0.5 are very similar, showing a limited effect of pre-strain. The compressive pre-strain presents a slightly lower value of opening load. The comparison with the dashed lines, indicate a great decrease of crack opening level, which has values of U* in the range 6-11%, while for R=0.1 it ranged from 18 to 40%. This reduction of U* increases the effective load range, which increases significantly the total CTOD range and the elastic and plastic components, δe e δp, respectively. The variation of U* also explains the increase of da/dN produced by the increase of R and the reduced effect of pre-strain at R=0.5. In fact, since the effect of pre-strain is associated with crack closure, and there is almost no crack closure at R=0.5, a minor effect of pre-strain on FCG may be expected.
3.3. Effect of Pre-Strain on Variable Amplitude Loading
The influence of pre-strain on the effect of an overload was also studied. The overload was applied at the load cycle number 1500, at a baseline stress ratio R=0.1 and considering an overload ratio of 1.5. Figure 9 compares the results of da/dN obtained without pre-strain and with a tensile pre-strain of 4%. These tests took a long time because FCG rate drops significantly after the overload.
The variation of da/dN is according to the typical behaviour observed after an overload [40,41]. Immediately after the overload, there is a sudden increase of da/dN followed by a fast decrease to a minimum value. Some crack extension is required to reach this minimum, which is named delayed retardation. After the minimum there is a progressive increase of FCG rate to the stable value, corresponding to constant amplitude loading. The increase of da/dN is due to crack tip blunting, which eliminates previous crack closure. The variations after blunting are due to the formation of a new residual plastic wake, stronger than that corresponding to constant amplitude loading. In fact, the overload increases the monotonic plastic zone, and this has an impact on crack closure, which is felt after some crack propagation. The two main mechanisms of plasticity induced crack closure are clearly visible in the overloads, i.e., the crack tip blunting and the effect of residual plastic wake.
Comparing the curves for the two pre-strain values (εps=0, +4%), significant differences are evident. The overload is applied at a shorter crack length for εps=+4% because the crack growth rate is lower while the number of load cycles is the same (1500). Besides, the variations of da/dN are much more pronounced for the case without pre-strain. The extent of propagation affected by the overload is also much higher for εps=0.
For a better understanding of the effect of pre-strain, Figure 10 plots CTOD curves. Figure 10a presents CTOD variation exactly in the overload cycle. For relatively low loads the crack is closed, i.e., the CTOD is zero. The crack opening occurs first for εps=0, as already observed in Figure 5. After crack opening, the CTOD increases first linearly and then non-linearly with the load (region II). The linear variation is a result of elastic deformation, while the non-linear variation is due to plastic deformation. The increase of the load above the baseline values, i.e., above Fmax,BL=41.67 N, produces a sudden change of the slope of the curve (region III). The material has not experienced such high loads before, therefore there is a strong plastic deformation, significantly higher than that observed in region II. Consequently, CTOD reaches relatively high values. The subsequent decrease of the load from FOL to Fmin reduces the blunting (region IV), initially linearly and then non-linearly. The CTOD at the minimum load is the crack tip blunting produced by the overload. The dashed line indicates the behaviour without overload.
Figure 10b shows the CTOD curves at the minimum values of da/dN, which occur at crack lengths of 16.336 mm and 15.448 mm for εps=0 and +4%, respectively. The dashed line indicates the behaviour without overload and without pre-strain. The crack closure is quite relevant, particularly for the tensile pre-strain, much more than observed under constant amplitude loading (Figure 5). U*=53.1% for the specimen without pre-strain and U*=71.0% for the tensile pre-strain, at the minimum da/dN after the overload. These high values of U* reduce the effective load range, and therefore the crack tip plastic deformation. This is particularly dramatic for εps=+4%, because there is no evidence of plastic CTOD, δp. This explains the very small value of da/dN in Figure 9. The slopes of the elastic regimes are very similar, which means that the elastic behaviour is not affected by the overload, as could be expected. Therefore, the minimum da/dN is linked to a peak of crack closure, as was observed by Baptista et al. [42].
4. Discussion
The first issue is the validity of the conclusions obtained using only numerical simulation. Naturally, it would be interesting to have experimental results to validate the numerical predictions. However, this is expensive, since it requires the preparation of specimens with pre-strain and their testing, and time consuming. On the other hand, the present numerical model has already proved to be competent and robust in the simulation of FCG. In fact, the numerical model based on cumulative plastic strain was able to predict the effect of ΔK [37], stress ratio [43], Superblock2020 load pattern [44], overloads [45], load blocks [46], and the effect of lateral holes [47]. These successive validations are also a clear indication that cyclic plastic deformation is the main mechanism responsible for FCG. Besides, numerical approaches are very interesting to develop parametric studies and to analyze the fundamental mechanisms. This is particularly important in the study of the effect of pre-strain, where the mechanisms are not completely understood.
The present results clearly indicate that plasticity induced crack closure is behind the effect of pre-strain. The decrease of ductility is expected to decrease the size of monotonic and reversed plastic zones. This reduces residual plastic deformations and therefore crack closure. On the other hand, there is a decrease of crack blunting which potentiates the effect of residual plastic wake. These mechanisms of opposite effect may explain the different trends observed for different materials, or, in other words, the dependence on material. Schijve [21] studied AA2024-T3 submitted to a pre-strain of 3%. He also linked the increase of da/dN with crack closure phenomenon.
The material hardening resulting from plastic deformation may also be expected to have a direct effect on crack tip damage. In fact, the cumulative damage will be lower in the hardened material. Therefore, a numerical study was developed without contact of crack flanks, which eliminates crack closure phenomenon from the results. Figure 11a presents da/dN versus crack length. The dashed lines indicate the predictions obtained with contact of crack flanks also for R=0.1. As can be seen, there is some effect of pre-strain, but significantly less than observed in the presence of contact of crack flanks. The tensile pre-strain now has a damaging effect, relatively to the situation without pre-strain. On the other hand, the compressive pre-strain reduces da/dN. The numerical oscillations which were eliminated in Figure 7, were not eliminated in here and are now clearly visible.
Figure 11b presents the CTOD curves versus load for a crack length a=16.048 mm. Negative values of CTOD can be observed, which means that the crack flanks are overlapping. The elimination of the contact is not physically correct, but is particularly interesting to isolate crack tip phenomena, from the influence of crack closure. The applied load range is now totally effective. In other words, the crack tip feels all load cycle without any protection from crack closure phenomenon. This produces an increase of elastic, plastic and total CTOD ranges.
The inversion of the effect of tensile and compressive pre-strain relatively to the situation with contact (Figure 4) is curious and deserved a closer look. Figure 12 shows the variation of accumulated plastic strain at the crack tip with time (i.e., with load cycling). There are two aspects that deserve special attention: the slope of the curves between node releases and the initial value of plastic strain after node release. The slope represents the rate of accumulation of damage, while the initial value is a consequence of the accumulation of damage in previous positions of crack tip. Figure 12a presents the results obtained for five load increments starting at a=15.952 mm, with contact of crack flanks activated. The slopes are clearly different, being higher for the compressive pre-strain. The initial value of accumulated strain is also higher for εps=-4%, which indicates larger monotonic and reversed plastic zones. Consequently, assuming 70 load cycles, there are 5 node releases for the compressive pre-strain while the tensile pre-strain only suffers two node releases. These trends are according to the results of Figure 4, i.e., explain the higher da/dN obtained for compressive strain. Figure 12b presents similar results, but without contact of crack flanks. Now, the tensile pre-strain has slightly higher values of initial plastic strain and rate of accumulation of plastic strain. This explains the slightly higher value of da/dN obtained for εps=+4% in Figure 11a.
5. Conclusions
The main objective here is to study the effect of pre-strain on FCG in AA2024-T351. A numerical model was created to predict FCG assuming that cyclic plastic deformation is the main damage mechanism and using the cumulative plastic strain at the crack tip as driving parameter. Two values of pre-strain were considered: a compressive pre-strain of 4%, a tensile pre-strain of 4%, which were compared with the situation without pre-strain (i.e., εps=-4, 0, +4%).
After stabilization of FCG rate, da/dN is higher for the compressive pre-strain, intermediate for the specimen without pre-strain, and lower for the tensile pre-strain. Values of U* of 18.23, 27.15 and 42.53% were obtained for εps=-4, 0 and +4%, respectively. The increase of crack opening level decreases the effective load range. A well-defined correlation was obtained between da/dN and ΔKeff for three crack lengths (a=16.184; a=15.048 mm and a=15.152 mm) and the three pre-strain conditions (εps=-4, 0, +4%). This clearly indicates that crack closure is explaining the variations of da/dN produced by the pre-strain. The increase of stress ratio from R=0.1 to R=0.5 reduced significantly the relevance of pre-strain, which is also explained by the reduction of crack closure phenomenon. The effect of pre-strain on da/dN after an overload was also explained by crack closure variations.
Author Contributions
Conceptualization, D.N. and F.A.; methodology, D.N.; formal analysis, A.A. and E.S.; investigation, A.A.; data curation, A.A.; writing—original draft preparation, F.A.; writing—review and editing, D.N. and E.S. All authors have read and agreed to the published version of the manuscript.
Funding
The authors gratefully acknowledge the financial support from the Portuguese Foundation of Science and Technology (FCT) under the projects UIDB/00285/2020 and LA/P/0112/2020. Edmundo Sérgio is also grateful to FCT for the PhD grant with reference 2022.11438.BD.
Data Availability Statement
Dataset available on request from the authors.
Conflicts of Interest
The authors declare no conflicts of interest.
Nomenclature
| a | Crack length |
| a0 | Initial crack length |
| AA | Aluminium alloy |
| CA | Constant amplitude |
| CT | Compact tension |
| CTOD | Crack tip opening displacement |
| da/dN | Fatigue crack growth rate |
| FCG | Fatigue crack growth |
| Fmax | Maximum force |
| Fmin | Minimum force |
| Fopen | Crack opening force |
| HCF | High-cycle fatigue |
| LCF | Low-cycle fatigue |
| OL | Overload |
| OLR | Overload ratio |
| R | Stress ratio |
| UTS | Ultimate tensile strength |
| U* | Crack opening level |
| W | Width of CT specimen |
| εps | Pre-strain deformation |
| ΔK | Range of stress intensity factor |
References
- Hariharan K, Prakash RV. Integrating effect of forming in fatigue life prediction: review of present scenario and challenges. In: Proceedings of the Institution of Mechanical Engineers, Part B: Journal of Engineering Manufacture; 2012. p. 967–79. [CrossRef]
- B. Wang, P. Zhang, Q.Q. Duan, Z.J. Zhang, H.J. Yang, J.C. Pang, Y.Z. Tian, X.W. Li, Z.F. Zhang, High-cycle fatigue properties and damage mechanisms of pre-strained fe-30Mn-0.9C twinning-induced plasticity steel, Mater. Sci. Eng. A 679 (2017) 258–271. [CrossRef]
- Y. Zhou, M. Lin, C. Liu, L. Wang, H. Chen, C. Dan, S. Ma, Z. Chen, H. Wang, Enhancing mechanical properties of uniformly distributed nano TiB2/2024 al composite rolling sheet by pre-stretch aging, J. Alloys Compd. 913 (2022) 165172. [CrossRef]
- J. hyun Baek, Y. pyo Kim, C. man Kim, W. sik Kim, C. sung Seok, Effects of pre-strain on the mechanical properties of API 5L X65 pipe, Mater. Sci. Eng. A 527 (2010) 1473–1479. [CrossRef]
- Mehmanparast, C.M. Davies, D.W. Dean, K. Nikbin, Effects of plastic pre-straining level on the creep deformation, crack initiation and growth behaviour of 316H stainless steel, Int. J. Press. Vessel. Pip. 141 (2016) 1–10. [CrossRef]
- . Ghosal, A. Raj, S.K. Paul, Influence of uniaxial and biaxial pre-straining on the low cycle fatigue performance of DP590 steel, Int. J. Fatigue 149 (2021) 106260. [CrossRef]
- Puja Ghosal, Surajit Kumar Paul, Abhishek Raj, Influence of uniaxial and biaxial pre-straining on the notch fatigue performance of DP590 steel, Theoretical and Applied Fracture Mechanics 115 (2021) 103072. [CrossRef]
- Le Q, Kang HT, Kridli G, Khosrovaneh AK, Yan B. Effect of prestrain paths on mechanical behavior of dual phase sheet steel. Int J Fatigue 2009;31(4):607–15. [CrossRef]
- Fredriksson K, Melander A, Hedman M. Influence of prestraining and ageing on fatigue properties of high-strength sheet steels. Int J Fatigue 1988;10(3):139–51. [CrossRef]
- Wang B, Zhang P, Duan QQ, Zhang ZJ, Yang HJ, Pang JC, et al. High-cycle fatigue properties and damage mechanisms of pre-strained Fe-30Mn-0.9 C twinninginduced plasticity steel. Mater Sci Eng, A 2017;679:258–71. [CrossRef]
- Walker J, Thomas DJ, Gao Y. Effects of shot peening and pre-strain on the fatigue life of dual phase Martensitic and Bainitic steels. J Manuf Processes 2017;26: 419–24. [CrossRef]
- Ji D, Zhang M, Zhu D, Luo S, Li L. Influence of microstructure and pre-straining on the bake hardening response for ferrite-martensite dual-phase steels of different grades. Mater Sci Eng, A 2017;708:129–41. [CrossRef]
- Wu H, Hamada S, Noguchi H. Pre-strain effect on fatigue strength characteristics of SUH660 plain specimens. Int J Fatigue 2013;55:291–8. [CrossRef]
- Froustey C, Lataillade JL. Influence of large pre-straining of aluminium alloys on their residual fatigue resistance. Int J Fatigue 2008;30:908–16. [CrossRef]
- Le Roux, J. C., Taheri, S., Sermage, J. P., Colin, J., & Fatemi, A. (2008, January). Cyclic deformation and fatigue behaviors of stainless steel 304L including mean stress and pre-straining effects. In ASME Pressure Vessels and Piping Conference, (Vol. 48265, pp. 411-420).
- Gustavsson A, Melander A. Variable-amplitude fatigue of a dual-phase sheet steel subjected to prestrain. Int J Fatigue 1994;16(7):503–9. [CrossRef]
- Parker TE, Montgomery GL. Effect of Balanced Biaxial Stretching on the Low Cycle Fatigue Behavior of SAE 1008 Hot Rolled Low Carbon Steel. SAE Trans 1975: 308–18. [CrossRef]
- Das B, Singh A, Paul SK. Low cycle fatigue performance of DP600 steel under various pre-straining paths. Int J Fatigue 2020;132:105331. [CrossRef]
- AV Rex, S K Paul, A Singh, The influence of equi-biaxial and uniaxial tensile pre-strain on the low cycle fatigue performance of the AA2024-T4 aluminium alloy, International Journal of Fatigue 173 (2023) 107699. [CrossRef]
- R. Branco, J.D. Costa, L.P. Borrego, S.C. Wu, X.Y. Long, F.V. Antunes, Effect of tensile pre-strain on low-cycle fatigue behaviour of 7050-T6 aluminium alloy, Engineering Failure Analysis 114, 2020, 104592. [CrossRef]
- J. Schjjve, THE EFFECT OF PRE-STRAIN ON FATIGUE CRACK GROWTH AND CRACK CLOSURE, Engineering Fracture Mechanics, 8, Issue 4, 1976, Pages 575-581. [CrossRef]
- Kassim S. Al-Rubaie, Emerson K.L. Barroso, Leonardo B. Godefroid, Fatigue crack growth analysis of pre-strained 7475–T7351 aluminum alloy, International Journal of Fatigue 28 (2006) 934–942. [CrossRef]
- Satya Anandavijayan, Ali Mehmanparast, Jarryd Braithwaite, Feargal Brennan, Amir Chahardehi, Material pre-straining effects on fatigue behaviour of S355 structural steel, Journal of Constructional Steel Research 183 (2021) 106707. [CrossRef]
- Tai Shan Kang, H.W. Liu, The effect of pre-stress cycles on fatigue crack growth-an analysis of crack growth mechanism, Eng. Fract. Mech. 6 (1974) 631–638. [CrossRef]
- J. Wasen, K. Hamberg, B. Karlsson, The influence of prestrain and ageing on fatigue crack growth in a Dual-Phase Steel, Scr. Metall. 18 (1984) 621–624. [CrossRef]
- P.R. Arora, M.R. Raghavan, Y.V.R.K. Prasad, Effect of prestrain on fatigue crack propagation in mild steel containing non-metallic inclusions, Eng. Fract. Mech. 29 (1988) 67–79. [CrossRef]
- V.M. Radhakrishnan, P.S. Baburamani, An investigation of the effect of pre-straining on fatigue crack growth, Mater. Sci. Eng. 17 (1975) 283–288. [CrossRef]
- S. Kim, T. Song, H. Sung, S. Kim, Effect of Pre-Straining on High Cycle Fatigue and Fatigue Crack Propagation Behaviors of Precipitation Hardened Steel, Met. Mater. Int. 27 (2021) 1383–1391. [CrossRef]
- T. Leitner, G. Trummer, R. Pippan, A. Hohenwarter, Influence of severe plastic deformation and specimen orientation on the fatigue crack propagation behavior of a pearlitic steel, Mater. Sci. Eng. A 710 (2018) 260–. [CrossRef]
- 270. [CrossRef]
- Ashkenazi D. How aluminum changed the world: A metallurgical revolution through technological and cultural perspectives. Technol Forecast Soc Change 2019;143:101–13. [CrossRef]
- Zhang X, Chen Y, Hu J. Recent advances in the development of aerospace materials. Prog Aerosp Sci 2018;97:22–34. [CrossRef]
- Dursun T, Soutis C. Recent developments in advanced aircraft aluminium alloys. Mater Des 2014;56:862–71. [CrossRef]
- Swift, H.W. Plastic instability under plane stress. J Mech Phys Solids 1952, 1, 1–18. [CrossRef]
- Lemaitre J, Chaboche JL. Mechanics of Solids Materials. Cambridge University Press, Cambridge, 1985.
- MF Borges; P Lopez-Crespo, FV Antunes; B Moreno; P Prates; D Camas; DM Neto, Fatigue crack propagation analysis in 2024-T351 aluminium alloy using nonlinear parameters, Int J Fatigue 153 (2021) 106478. [CrossRef]
- L.F. Menezes, C. Teodosiu, Three-dimensional numerical simulation of the deep drawing process using solid finite elements, J Mater Proc Technol 97 (2000) 100–106. [CrossRef]
- MF Borges, DM Neto, FV Antunes, Numerical simulation of fatigue crack growth based on accumulated plastic strain, Theoretical and Applied Fracture Mechanics 108 (2020) 102676. [CrossRef]
- M. Mehrzadi and F. Taheri, “The influence of negative and positive stress ratios on crack growth rate in AM60B magnesium alloy,” Materials Science and Engineering: A, vol. 545, pp. 20 May; 77. [CrossRef]
- R. Seifi and R. Hosseini, “Experimental study of fatigue crack growth in raw and annealed pure copper with considering cyclic plastic effects,” Theoretical and Applied Fracture Mechanics, vol. 94, pp. 1–9, Apr. 2018. [CrossRef]
- L. P. Borrego, J. M. Ferreira, and J. M. Costa, “Fatigue crack growth and crack closure in an AlMgSi alloy,” Fatigue Fract Eng Mater Struct, vol. 24, no. 4, pp. 255–265, Apr. 2001. [CrossRef]
- S. Zheng, Q. Yu, Z. Gao, and Y. Jiang, “Loading history effect on fatigue crack growth of extruded AZ31B magnesium alloy,” Eng Fract Mech, vol. 114, pp. 42–54, Dec. 2013. [CrossRef]
- JB Baptista, FV Antunes, L Correia, R Branco, A numerical study of the effect of single overloads on plasticity induced, Theoretical and Applied Fracture Mechanics 88 (2017) 51–63. [CrossRef]
- Neto DM, Borges MF, Antunes FV. Mechanisms of fatigue crack growth in single overloads. Theor Appl Fract Mech 2021;114:103024. [CrossRef]
- Neto DM, Borges MF, Antunes FV, Sunder R. Numerical analysis of SuperBlock2020 loading sequence. Engng Fract Mech 2022;260:108178. [CrossRef]
- D.M. Neto, J. Pedro, M.F. Borges, L.F.P. Borrego, E.R. Sérgio, FV Antunes, Numerical prediction of fatigue crack growth based on cumulative plastic strain versus experimental results for AA6082-T6, Int J Fract 240, 167–181 (2023. [CrossRef]
- D.M. Neto, E.R. Sérgio, M.F. Borges, L.P. Borrego, F.V. Antunes, Effect of load blocks on fatigue crack growth, International Journal of Fatigue 162 (2022) 107001. [CrossRef]
- D.M. Neto, N. Cavaleiro, E.R. Sérgio, J. Jesus, A. Camacho-Reyes, F.V. Antunes, Effect of crack flank holes on fatigue crack growth. International Journal of Fatigue. 2023, 170, 107505. [CrossRef]
- M.S. Rana, C. Makabe, G. Fujiwara, The effect of hole shape on the extent of fatigue life improvement by cold expansions, Eng Fail Anal. 16(2009)2081-2090. [CrossRef]
- T.N. Chakherlou, M. Shakouri, A.B. Aghdam, A. Akbari, Effect of cold expansion on the fatigue life of Al 2024-T3 in double shear lap joints : Experimental and numerical investigations, Mater Des. 33(2012)185-196. [CrossRef]
- Z. Semari, A. Aid, A. Benhamena, A. Amrouche, M. Benguediab, A. Sadok, N. Benseddiq, Effect of residual stresses induced by cold expansion on the crack growth in 6082 aluminum alloy, Eng Fract Mech. 99(2013)159-168. [CrossRef]
- H.D. Gopalakrishna, H.N.N. Murthy, M. Krishna, M.S. Vinod, A.V. Suresh, Cold expansion of holes and resulting fatigue life enhancement and residual stresses in Al 2024 T3 alloy - An experimental study, Eng Fail Anal. 17(2010)361-368. [CrossRef]
- Radhakrishnan VM, Baburamani PS. Initiation and propagation of fatigue crack in pre-strained material [J]. International Journal of Fracture. 1976. [CrossRef]
- Li HF, Wang ZB, Sun XJ, Qian CF. Experimental investigation of the strain-strengthen effect on the existed I+II mixed mode fatigue crack transformation propagation in an austenite stainless steel [C]. In: Proceedings of the ASME 2013 Pressure Vessels & Piping Division Conference. 2013, 7: 14-18. [CrossRef]
Figure 1.
(a) Geometry of CT specimen (dimensions in mm). (b) (c) Physical model.
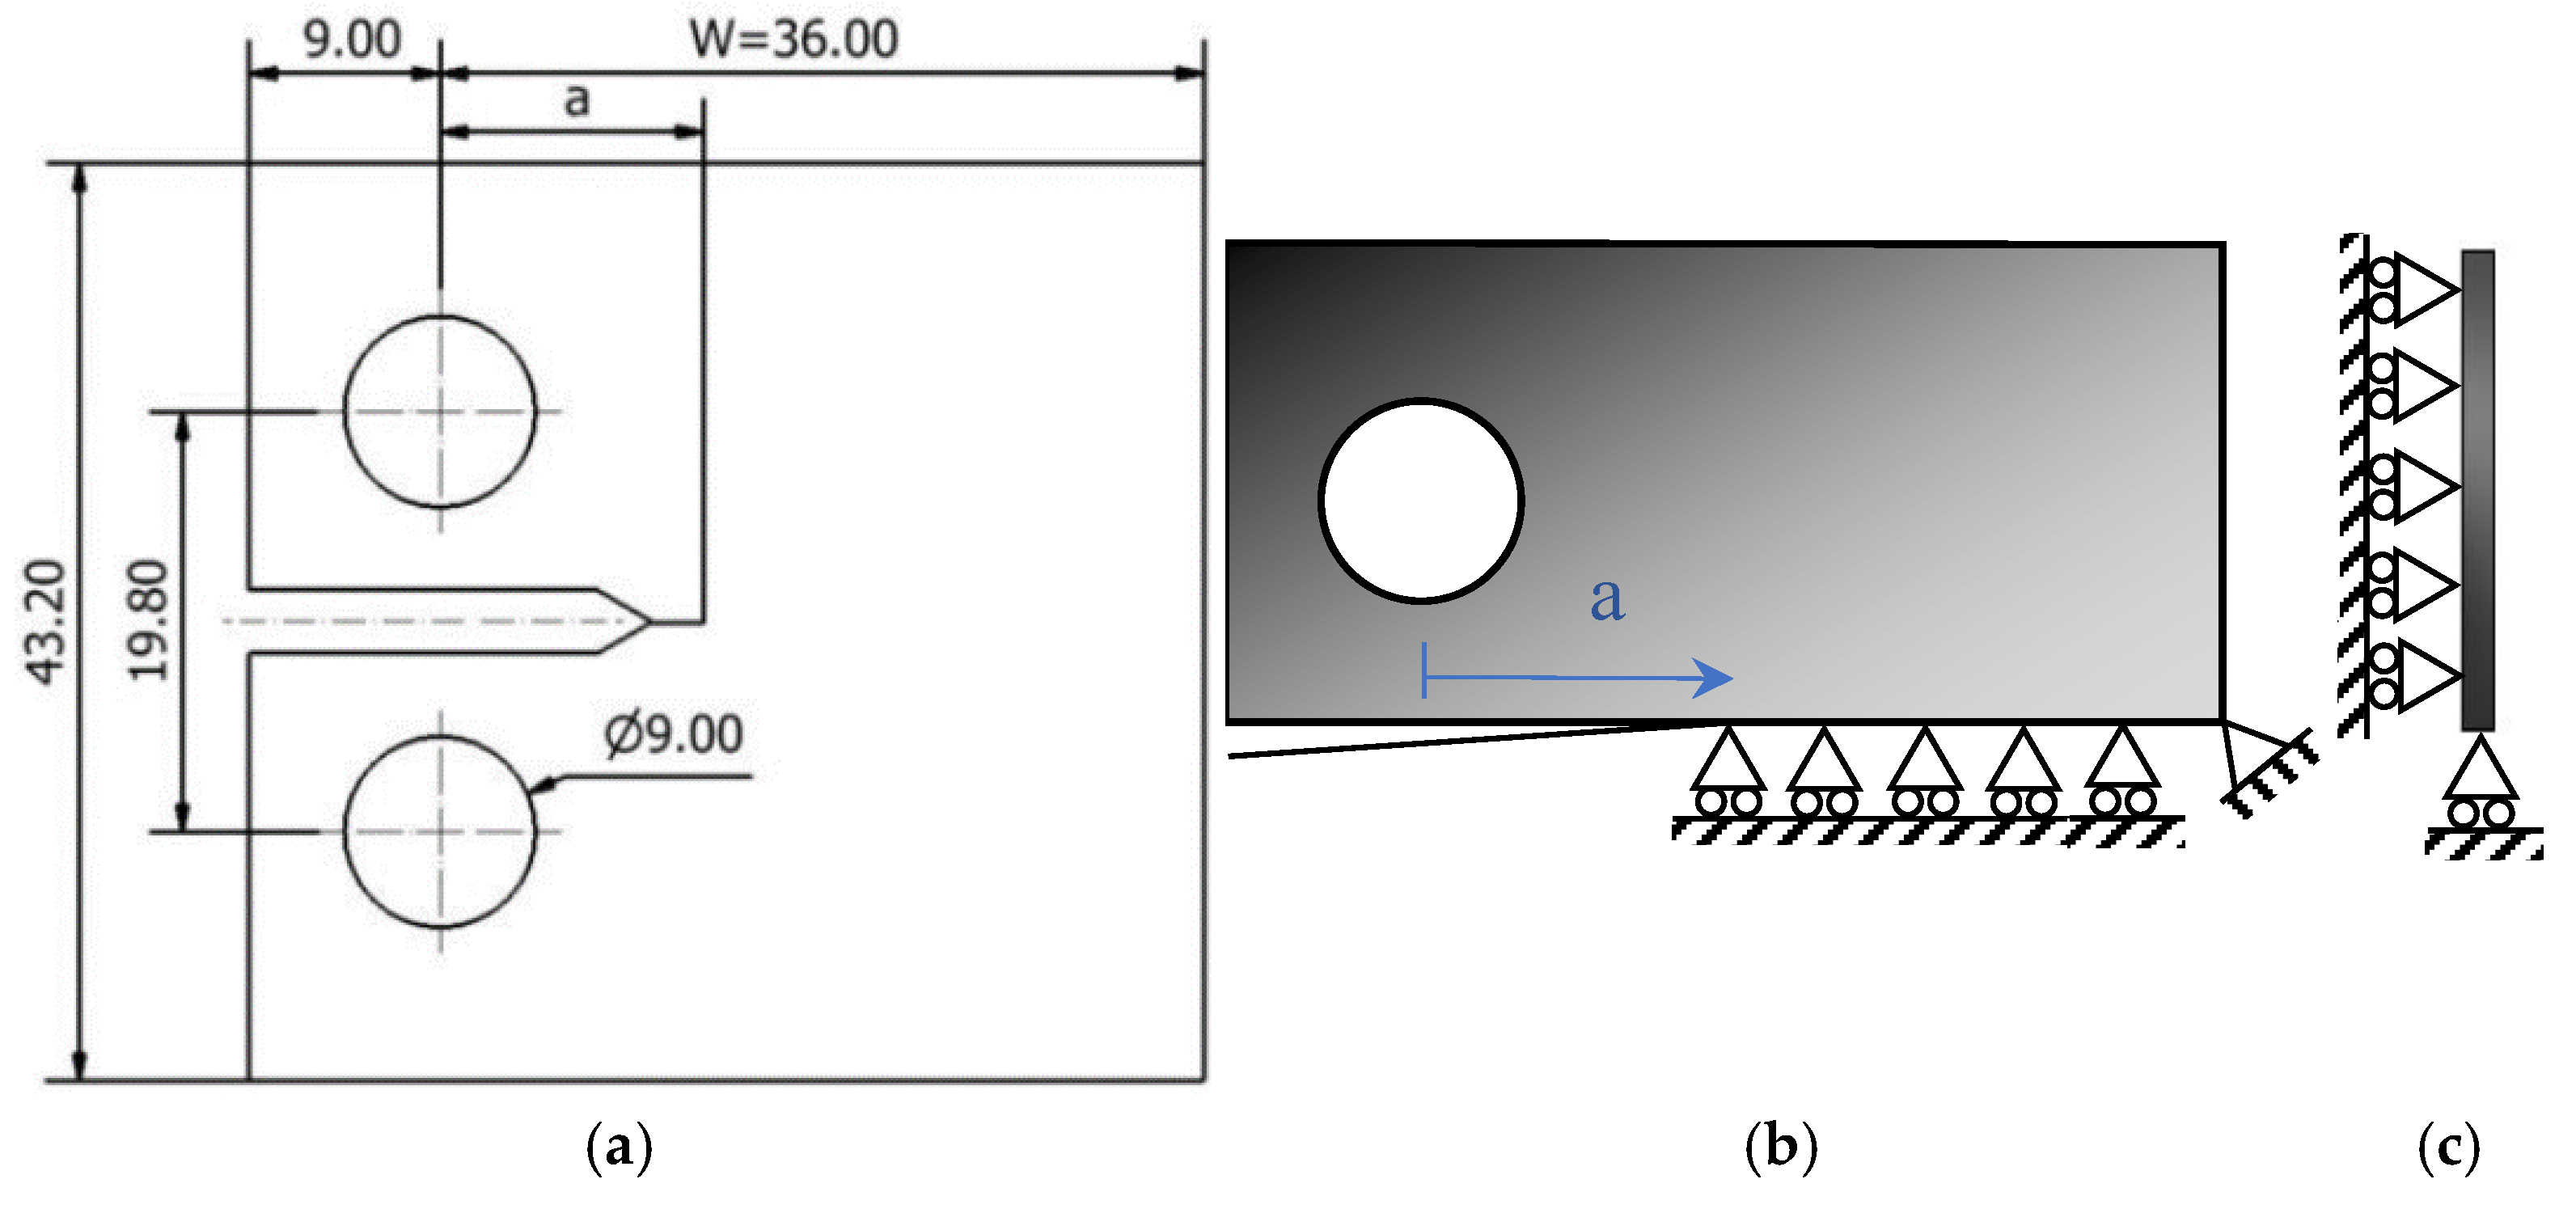
Figure 2.
Finite element mesh.
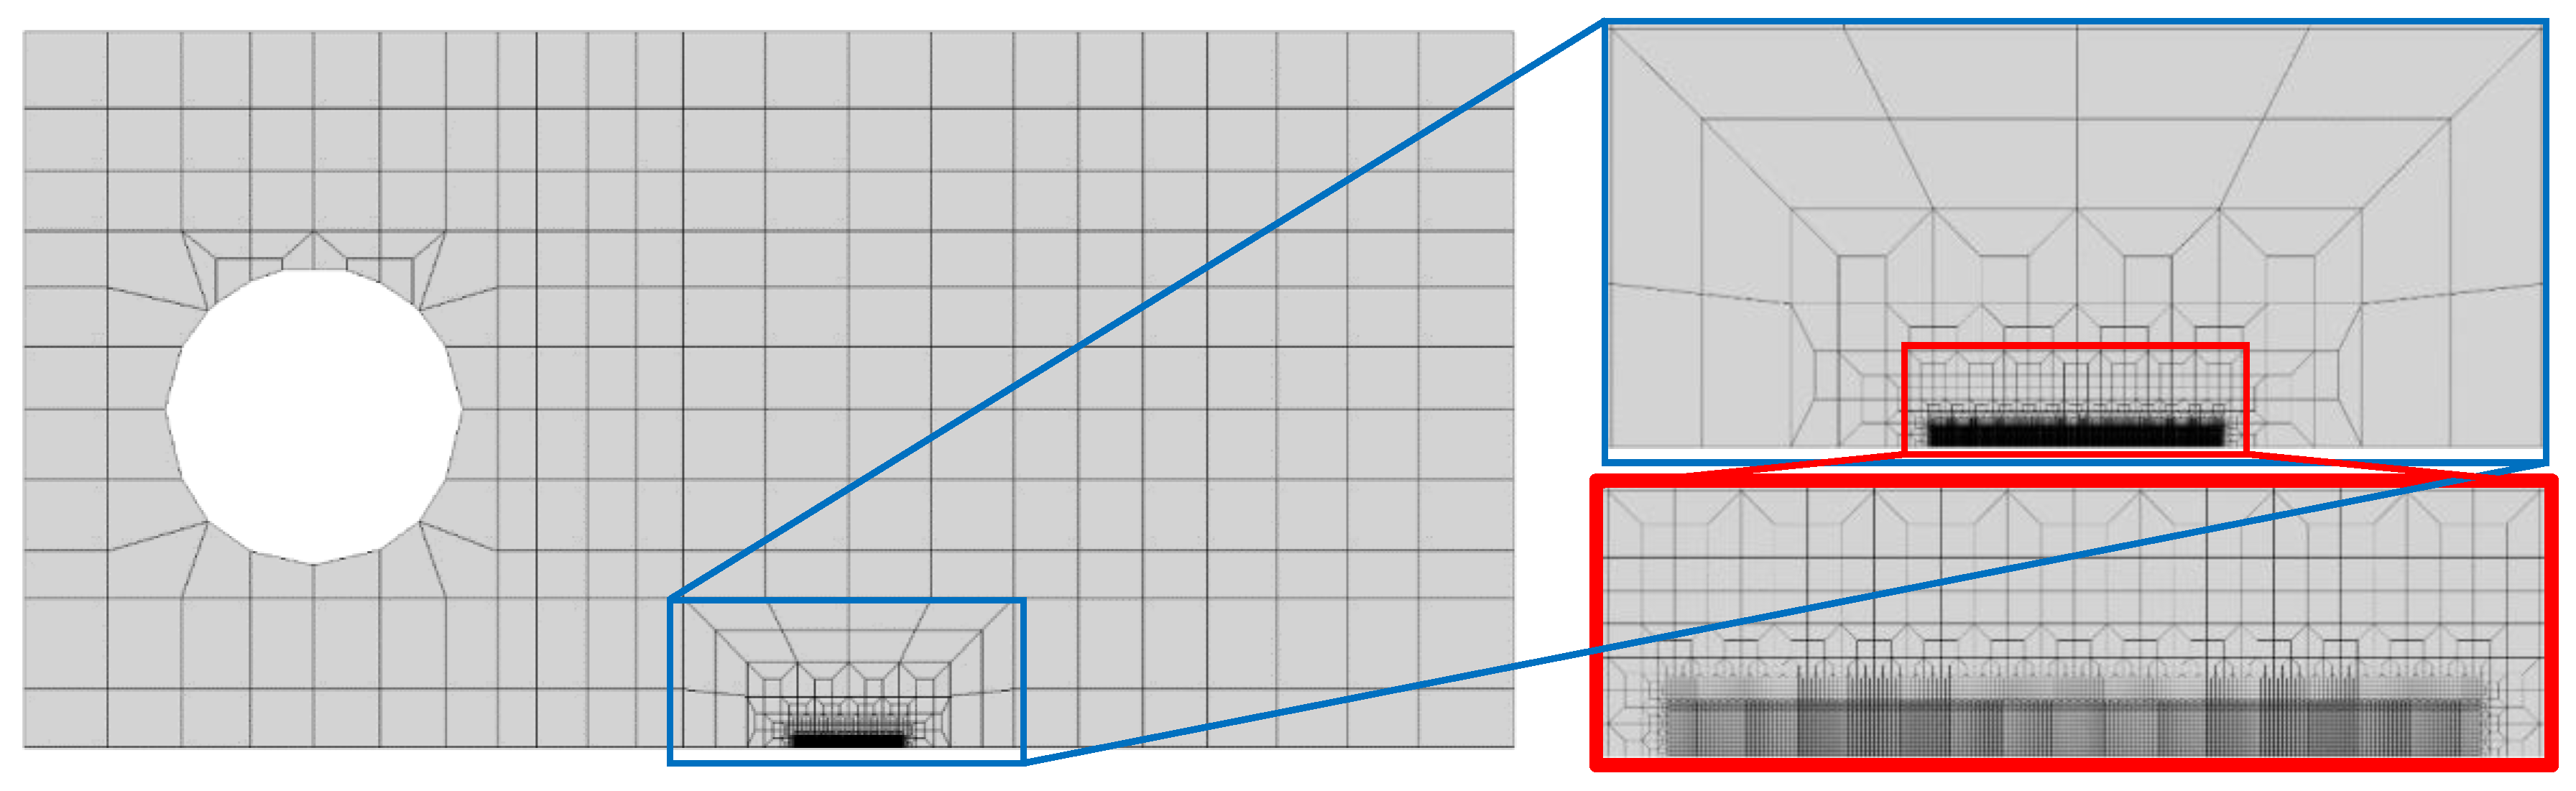
Figure 3.
Geometry of CT specimen (dimensions in mm). (b) Physical model.
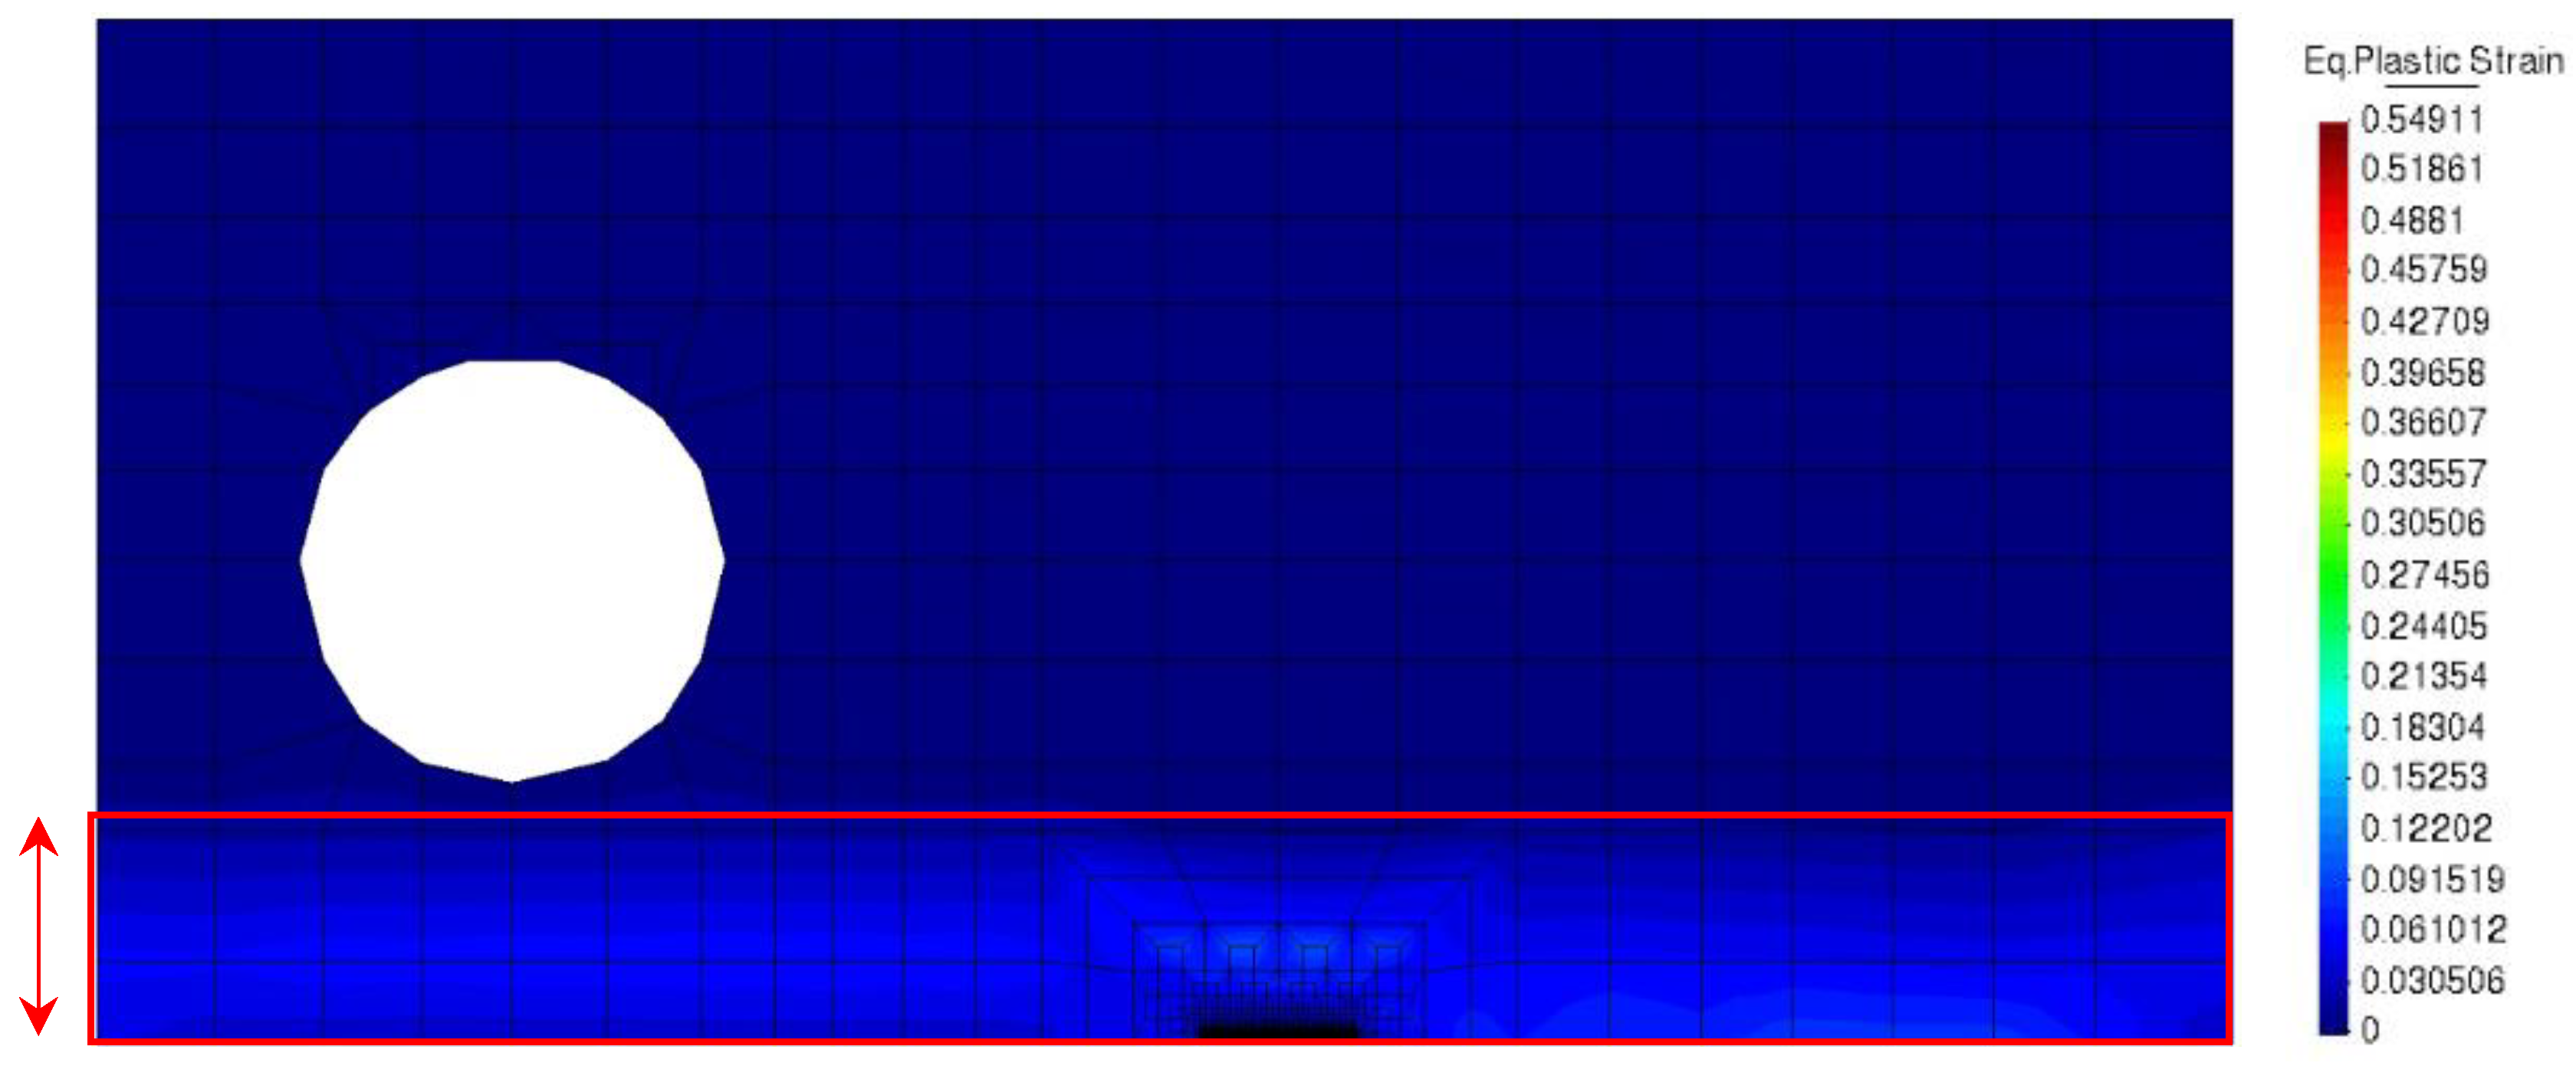
Figure 4.
Effect of pre-strain on FCG (Plane stress; R=0.1; Fmin=4.17 N; Fmax=41.67 N; with contact).
Figure 4.
Effect of pre-strain on FCG (Plane stress; R=0.1; Fmin=4.17 N; Fmax=41.67 N; with contact).
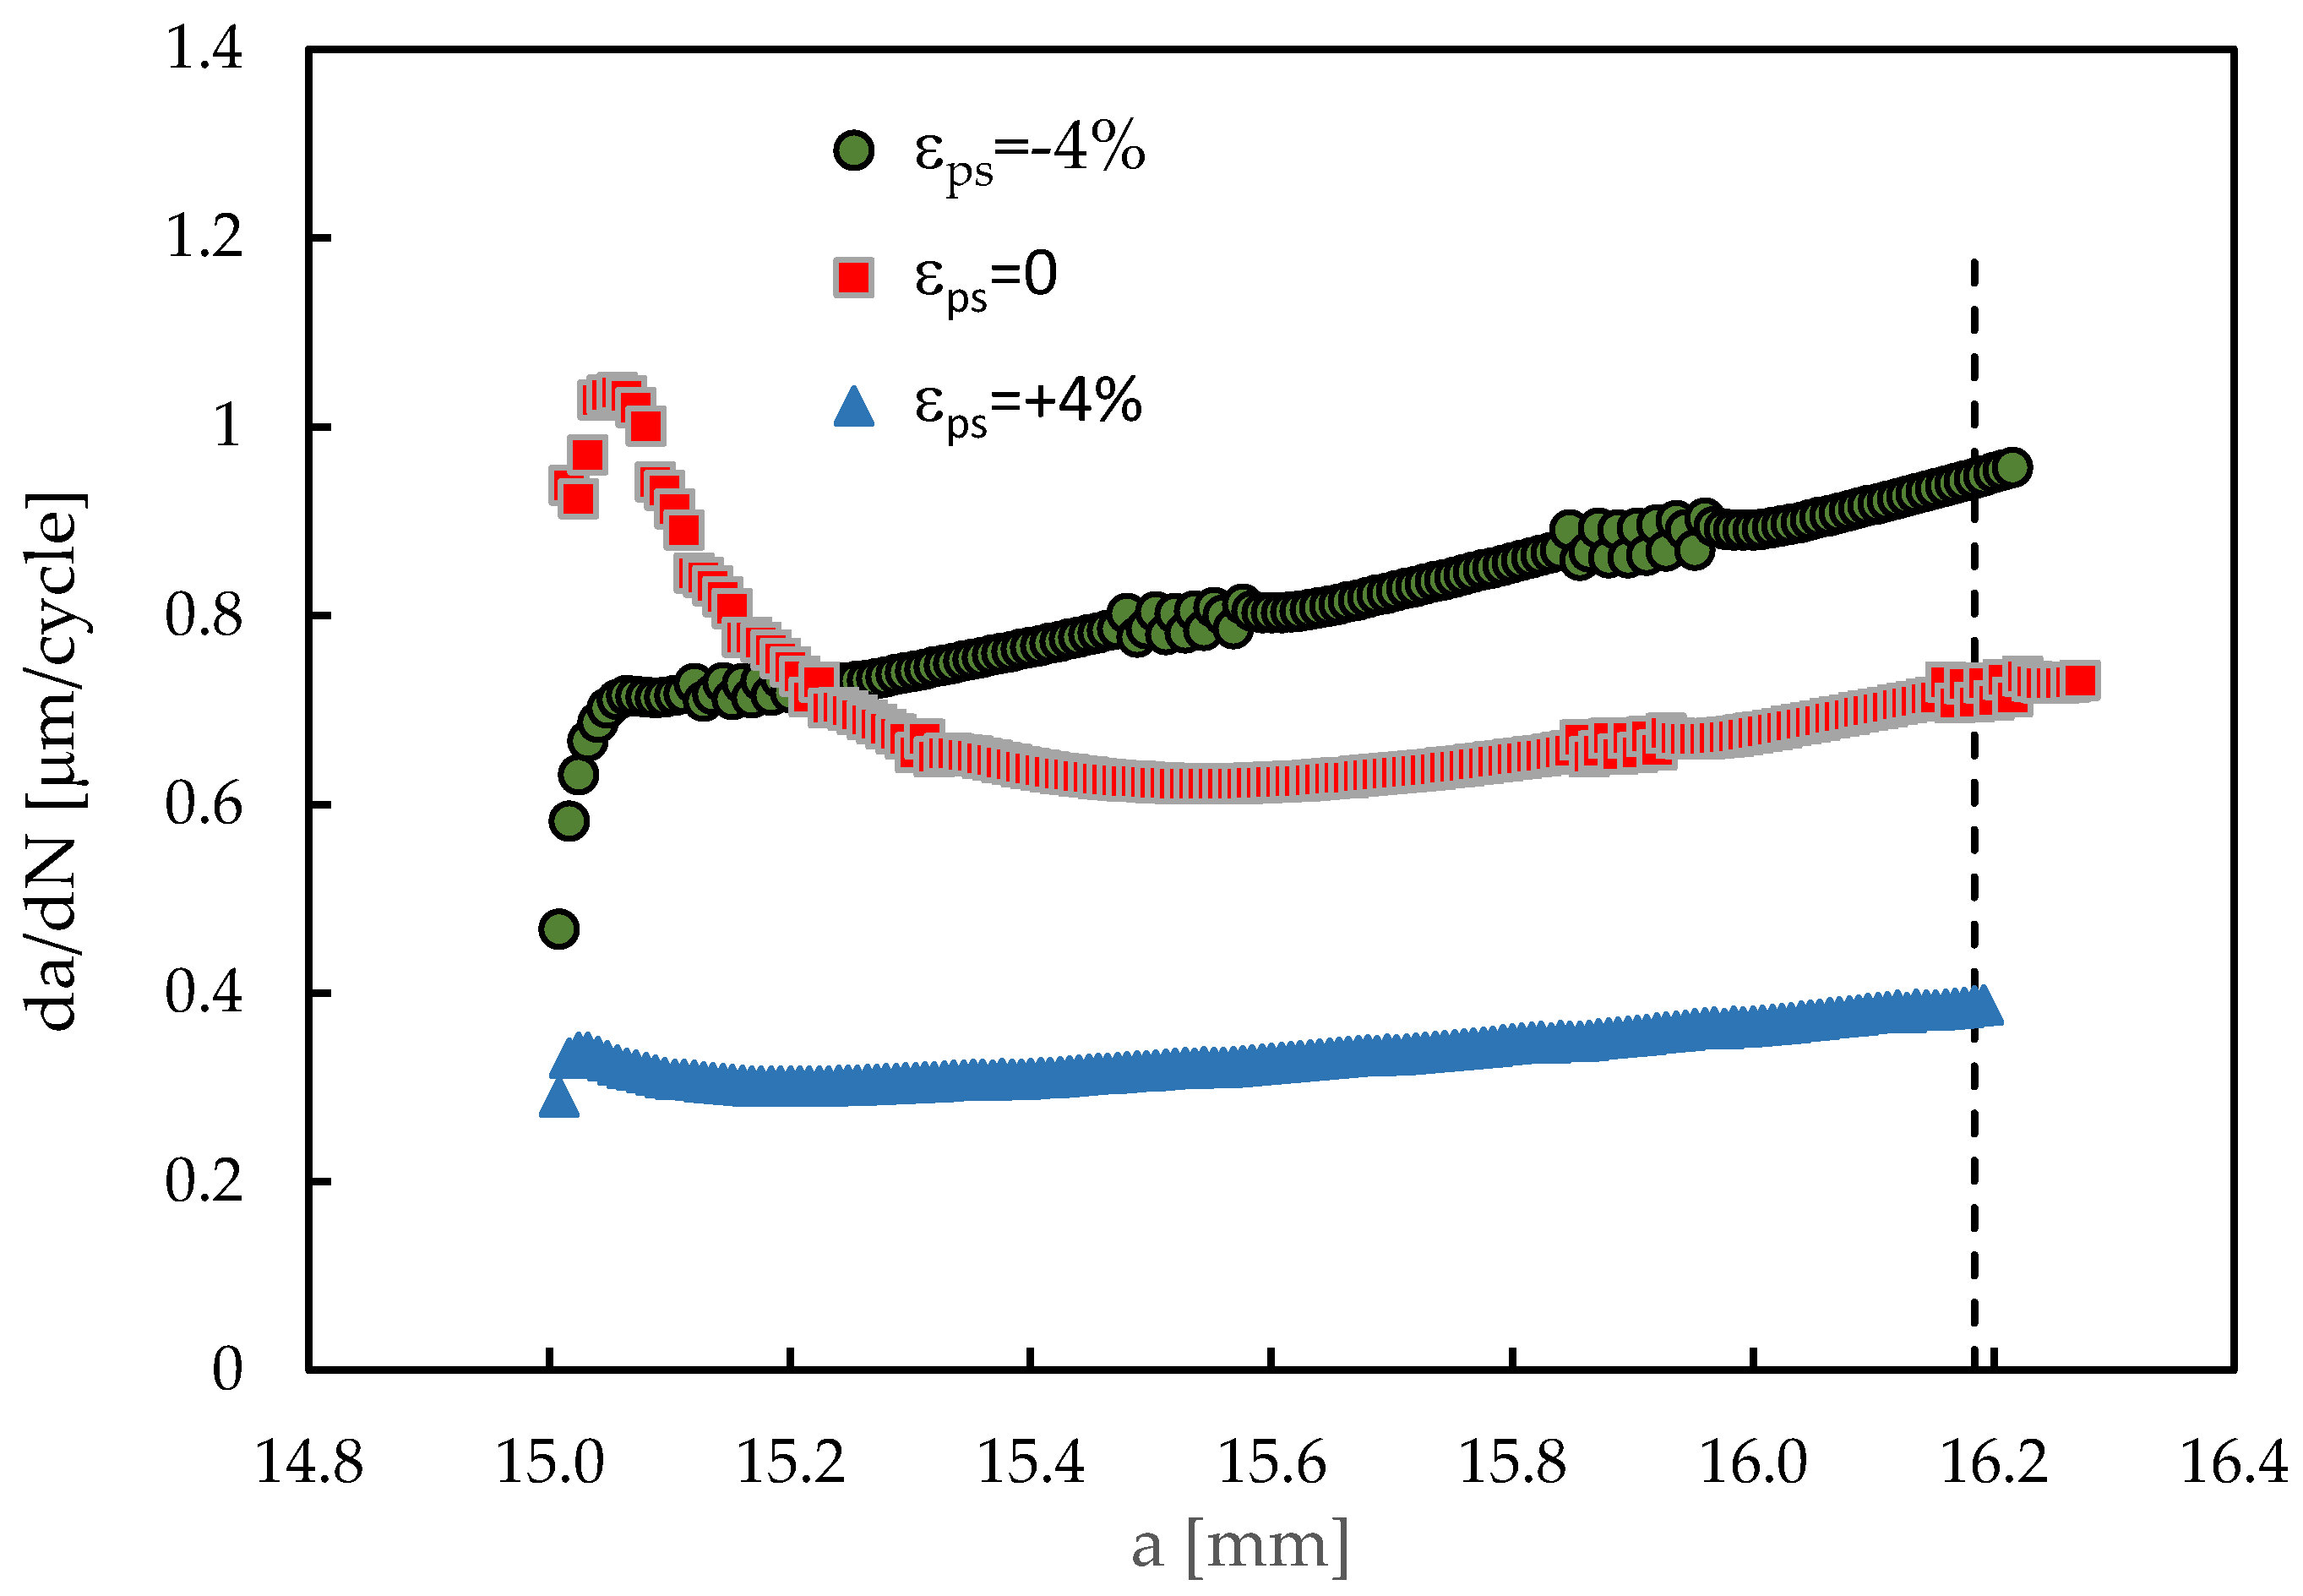
Figure 5.
Variation of Crack tip Opening Displacement (CTOD) with applied load (a=16.184 mm; Plane stress; R=0.1; Fmin=4.17 N; Fmax=41.67 N; with contact).
Figure 5.
Variation of Crack tip Opening Displacement (CTOD) with applied load (a=16.184 mm; Plane stress; R=0.1; Fmin=4.17 N; Fmax=41.67 N; with contact).
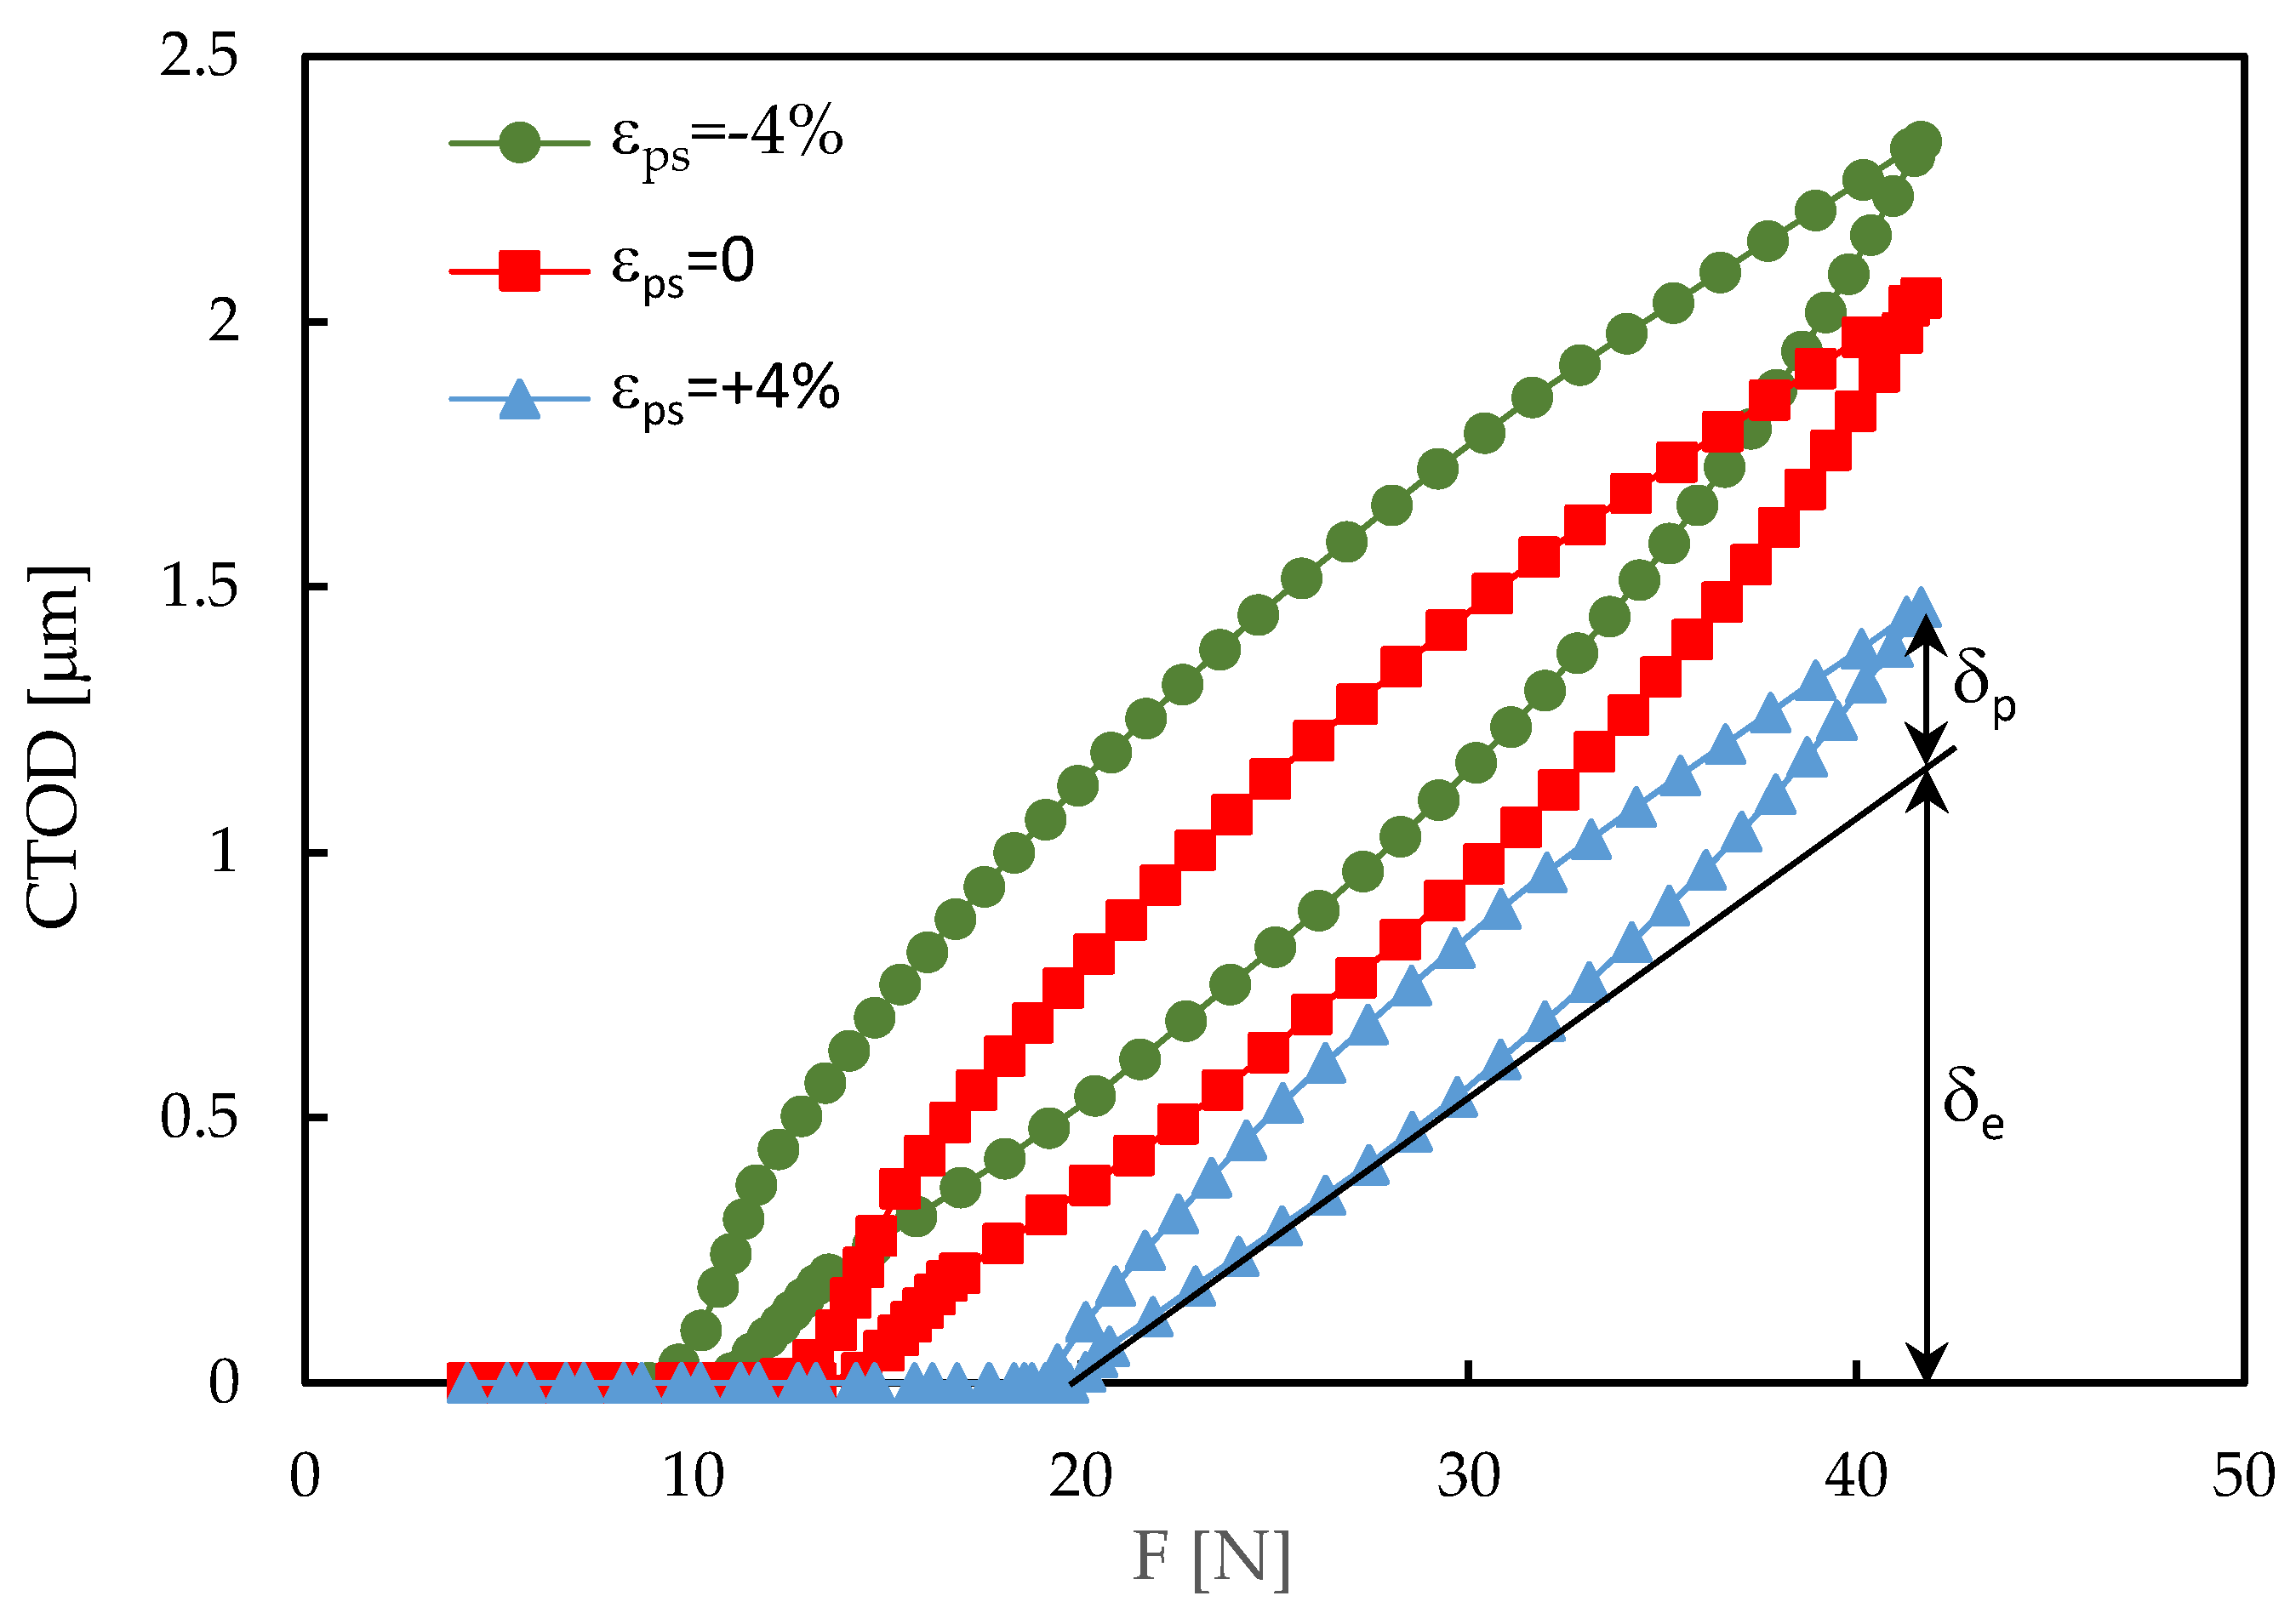
Figure 6.
FCG rate versus effective stress intensity factor range for three crack lengths (a=16.184; a=15.048 mm and a=15.152 mm) and three pre-strain conditions (εps=-4, 0, +4%). (Plane stress; R=0.1; Fmin=4.17 N; Fmax=41.67 N; with contact).
Figure 6.
FCG rate versus effective stress intensity factor range for three crack lengths (a=16.184; a=15.048 mm and a=15.152 mm) and three pre-strain conditions (εps=-4, 0, +4%). (Plane stress; R=0.1; Fmin=4.17 N; Fmax=41.67 N; with contact).
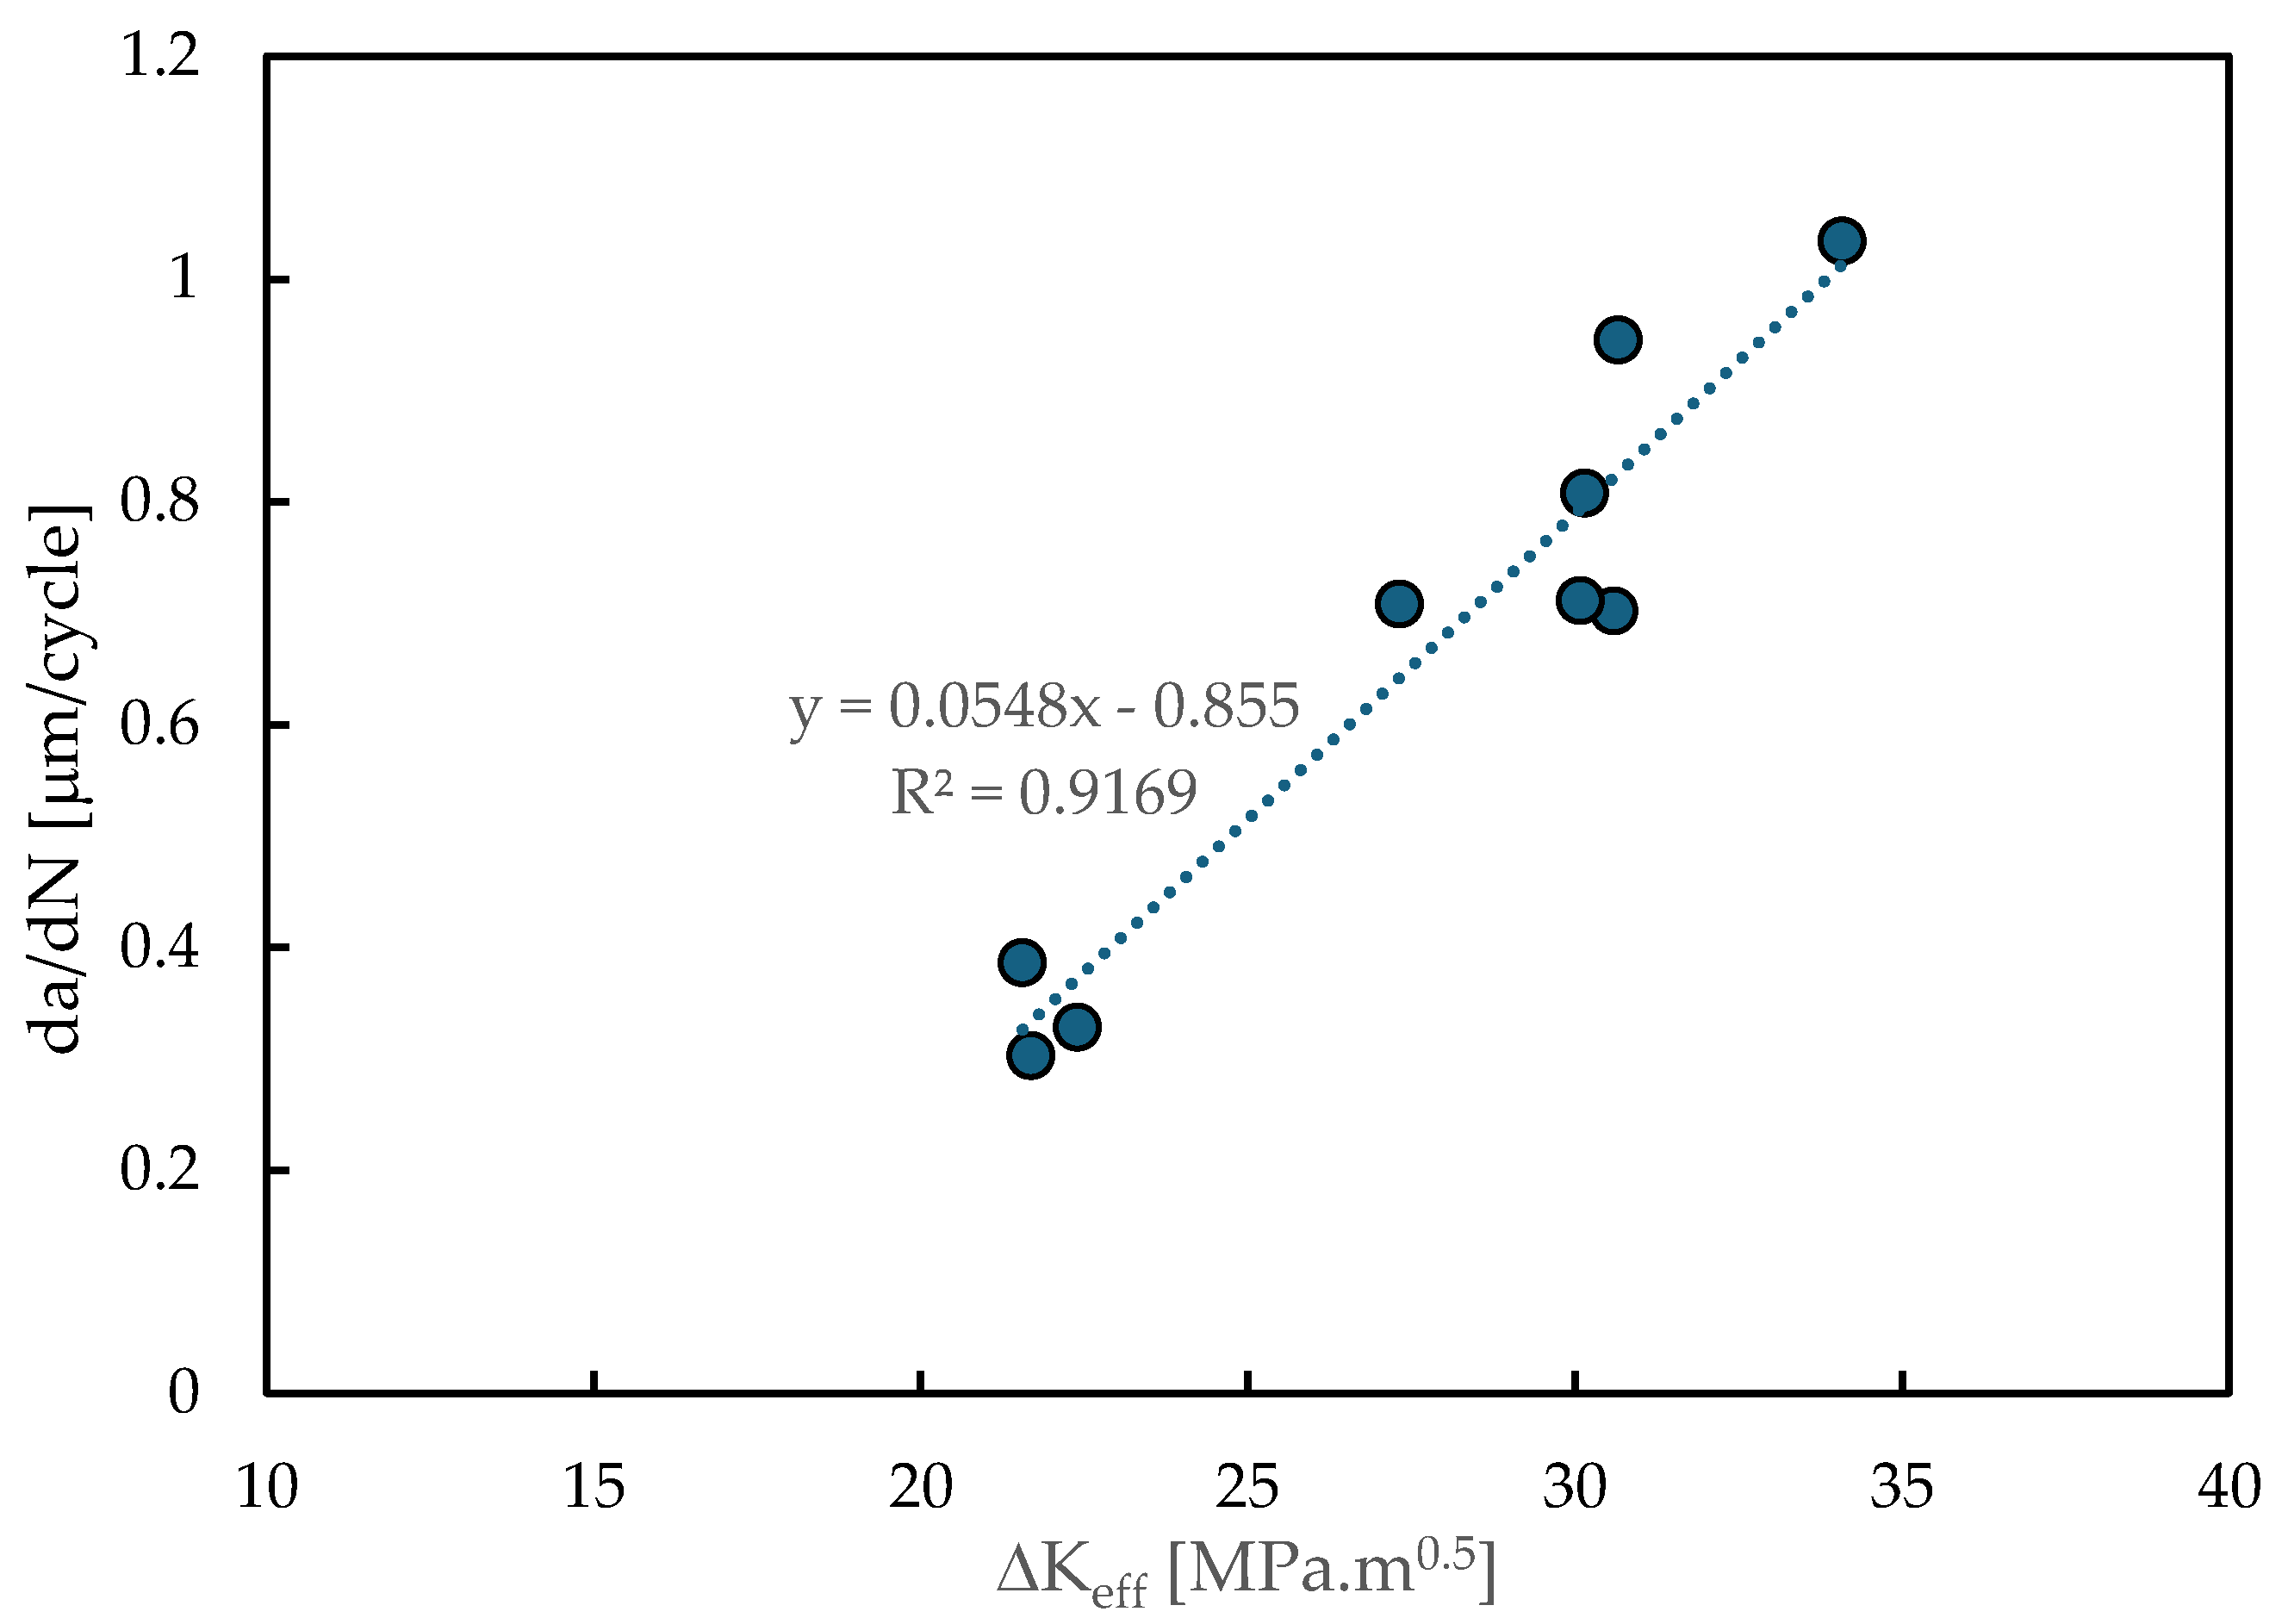
Figure 7.
Effect of stress ratio on FCG for different pre-strains (Plane stress; R=0.5, Fmin=4.17 N; Fmax=41.67 N; with contact). The dashed lines indicate the results for R=0.1.
Figure 7.
Effect of stress ratio on FCG for different pre-strains (Plane stress; R=0.5, Fmin=4.17 N; Fmax=41.67 N; with contact). The dashed lines indicate the results for R=0.1.
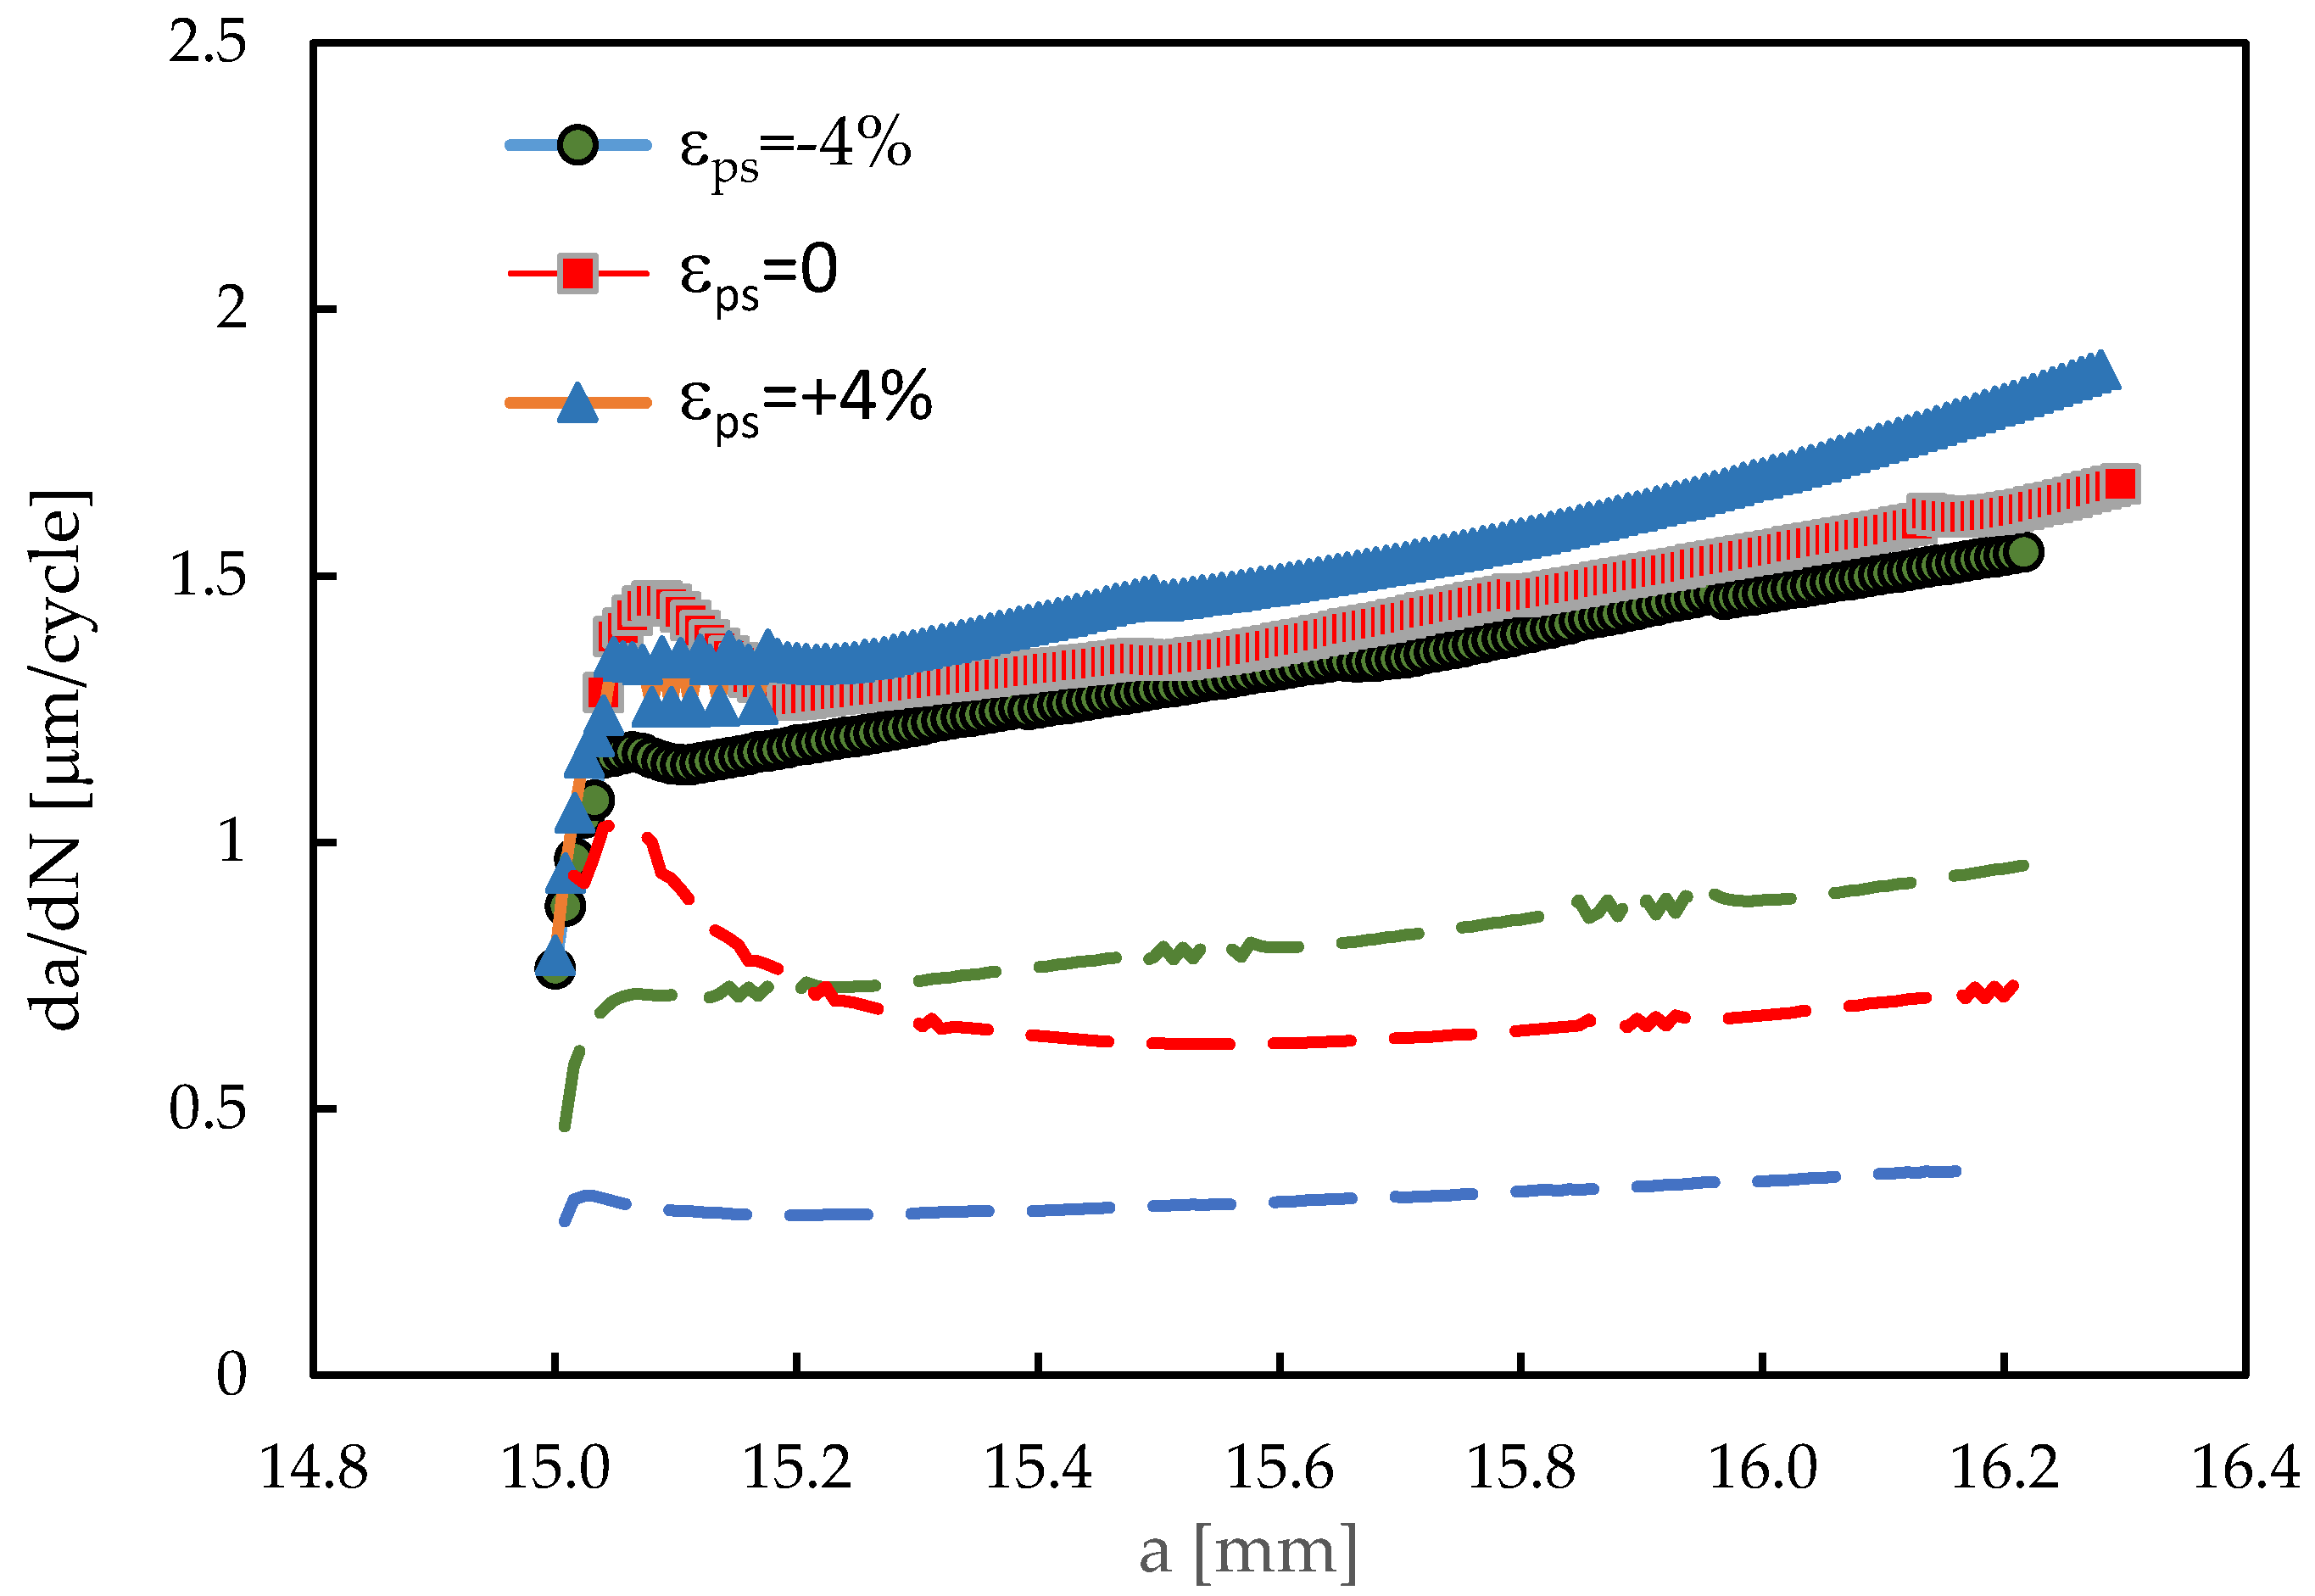
Figure 8.
CTOD versus load (a=16.184 mm; Plane stress; Fmin=37.5 N; Fmax=75 N; R=0.5; with contact). The dashed lines indicate the results for R=0.1.
Figure 8.
CTOD versus load (a=16.184 mm; Plane stress; Fmin=37.5 N; Fmax=75 N; R=0.5; with contact). The dashed lines indicate the results for R=0.1.
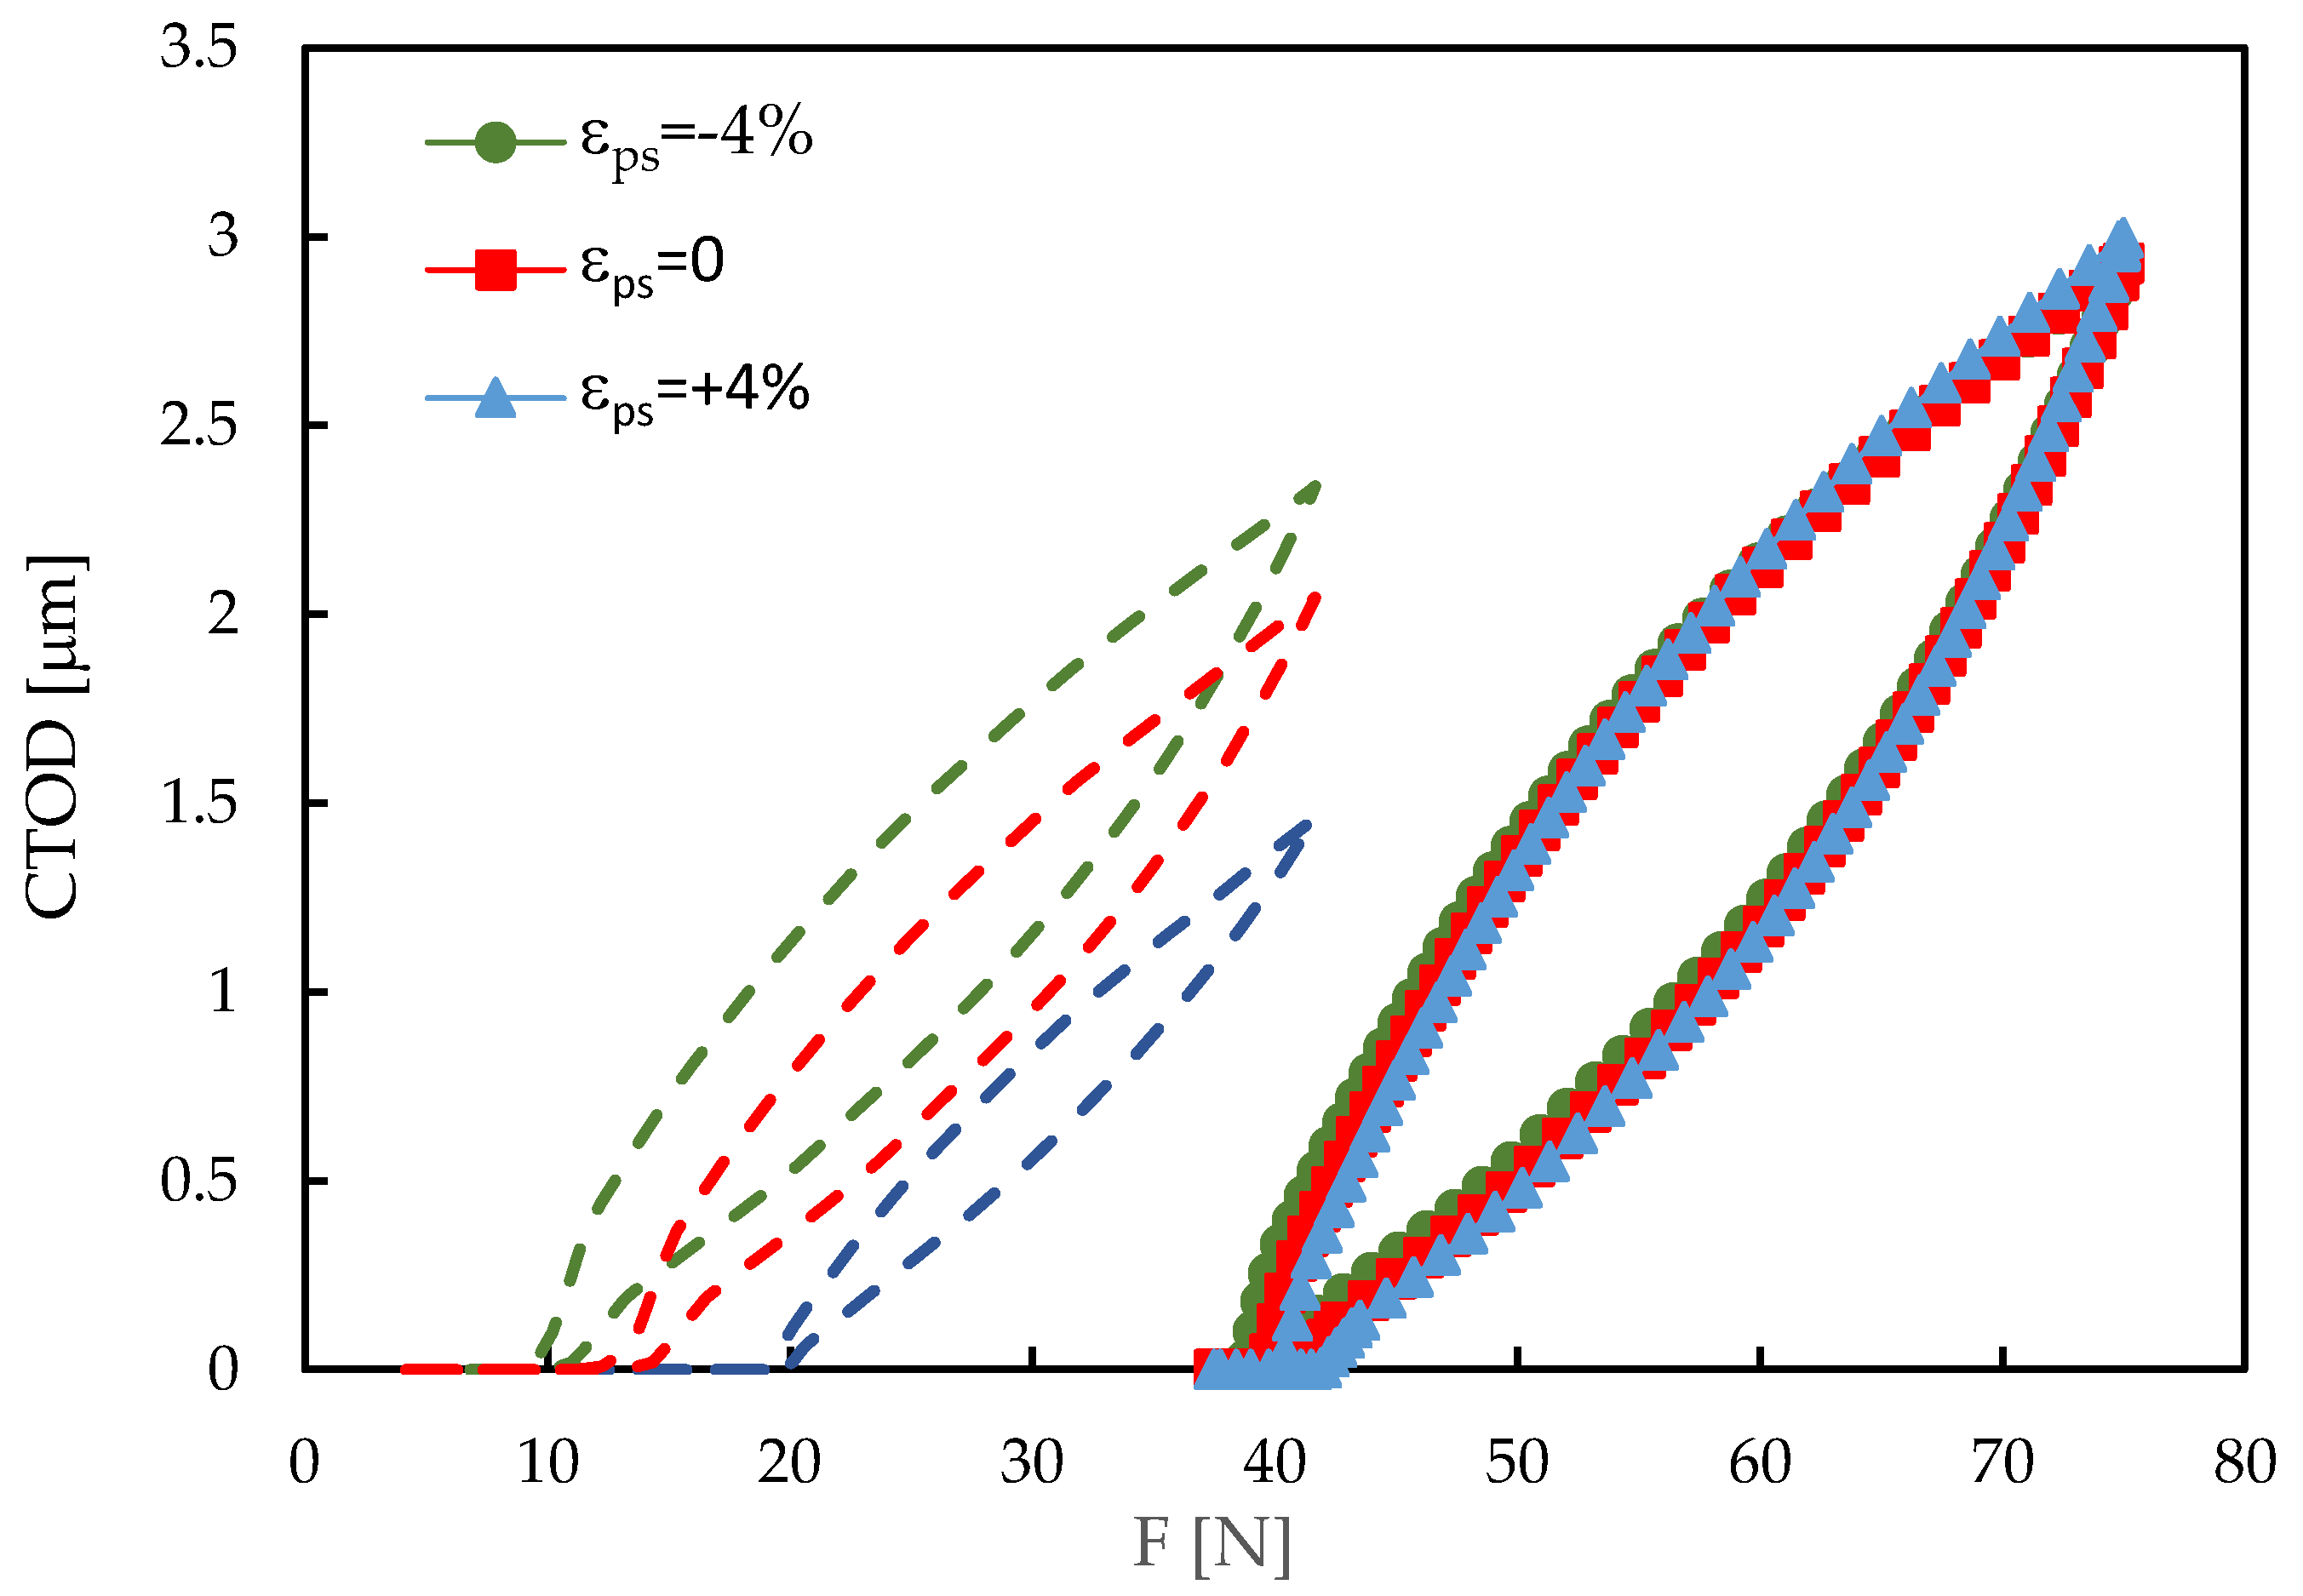
Figure 9.
Influence of pre-strain on the effect of overload (OLR=1.5; FOL=79.17 N; Plane stress; Fmin,BL=4.17 N; Fmax,BL=41.67 N; R=0.1; with contact).
Figure 9.
Influence of pre-strain on the effect of overload (OLR=1.5; FOL=79.17 N; Plane stress; Fmin,BL=4.17 N; Fmax,BL=41.67 N; R=0.1; with contact).
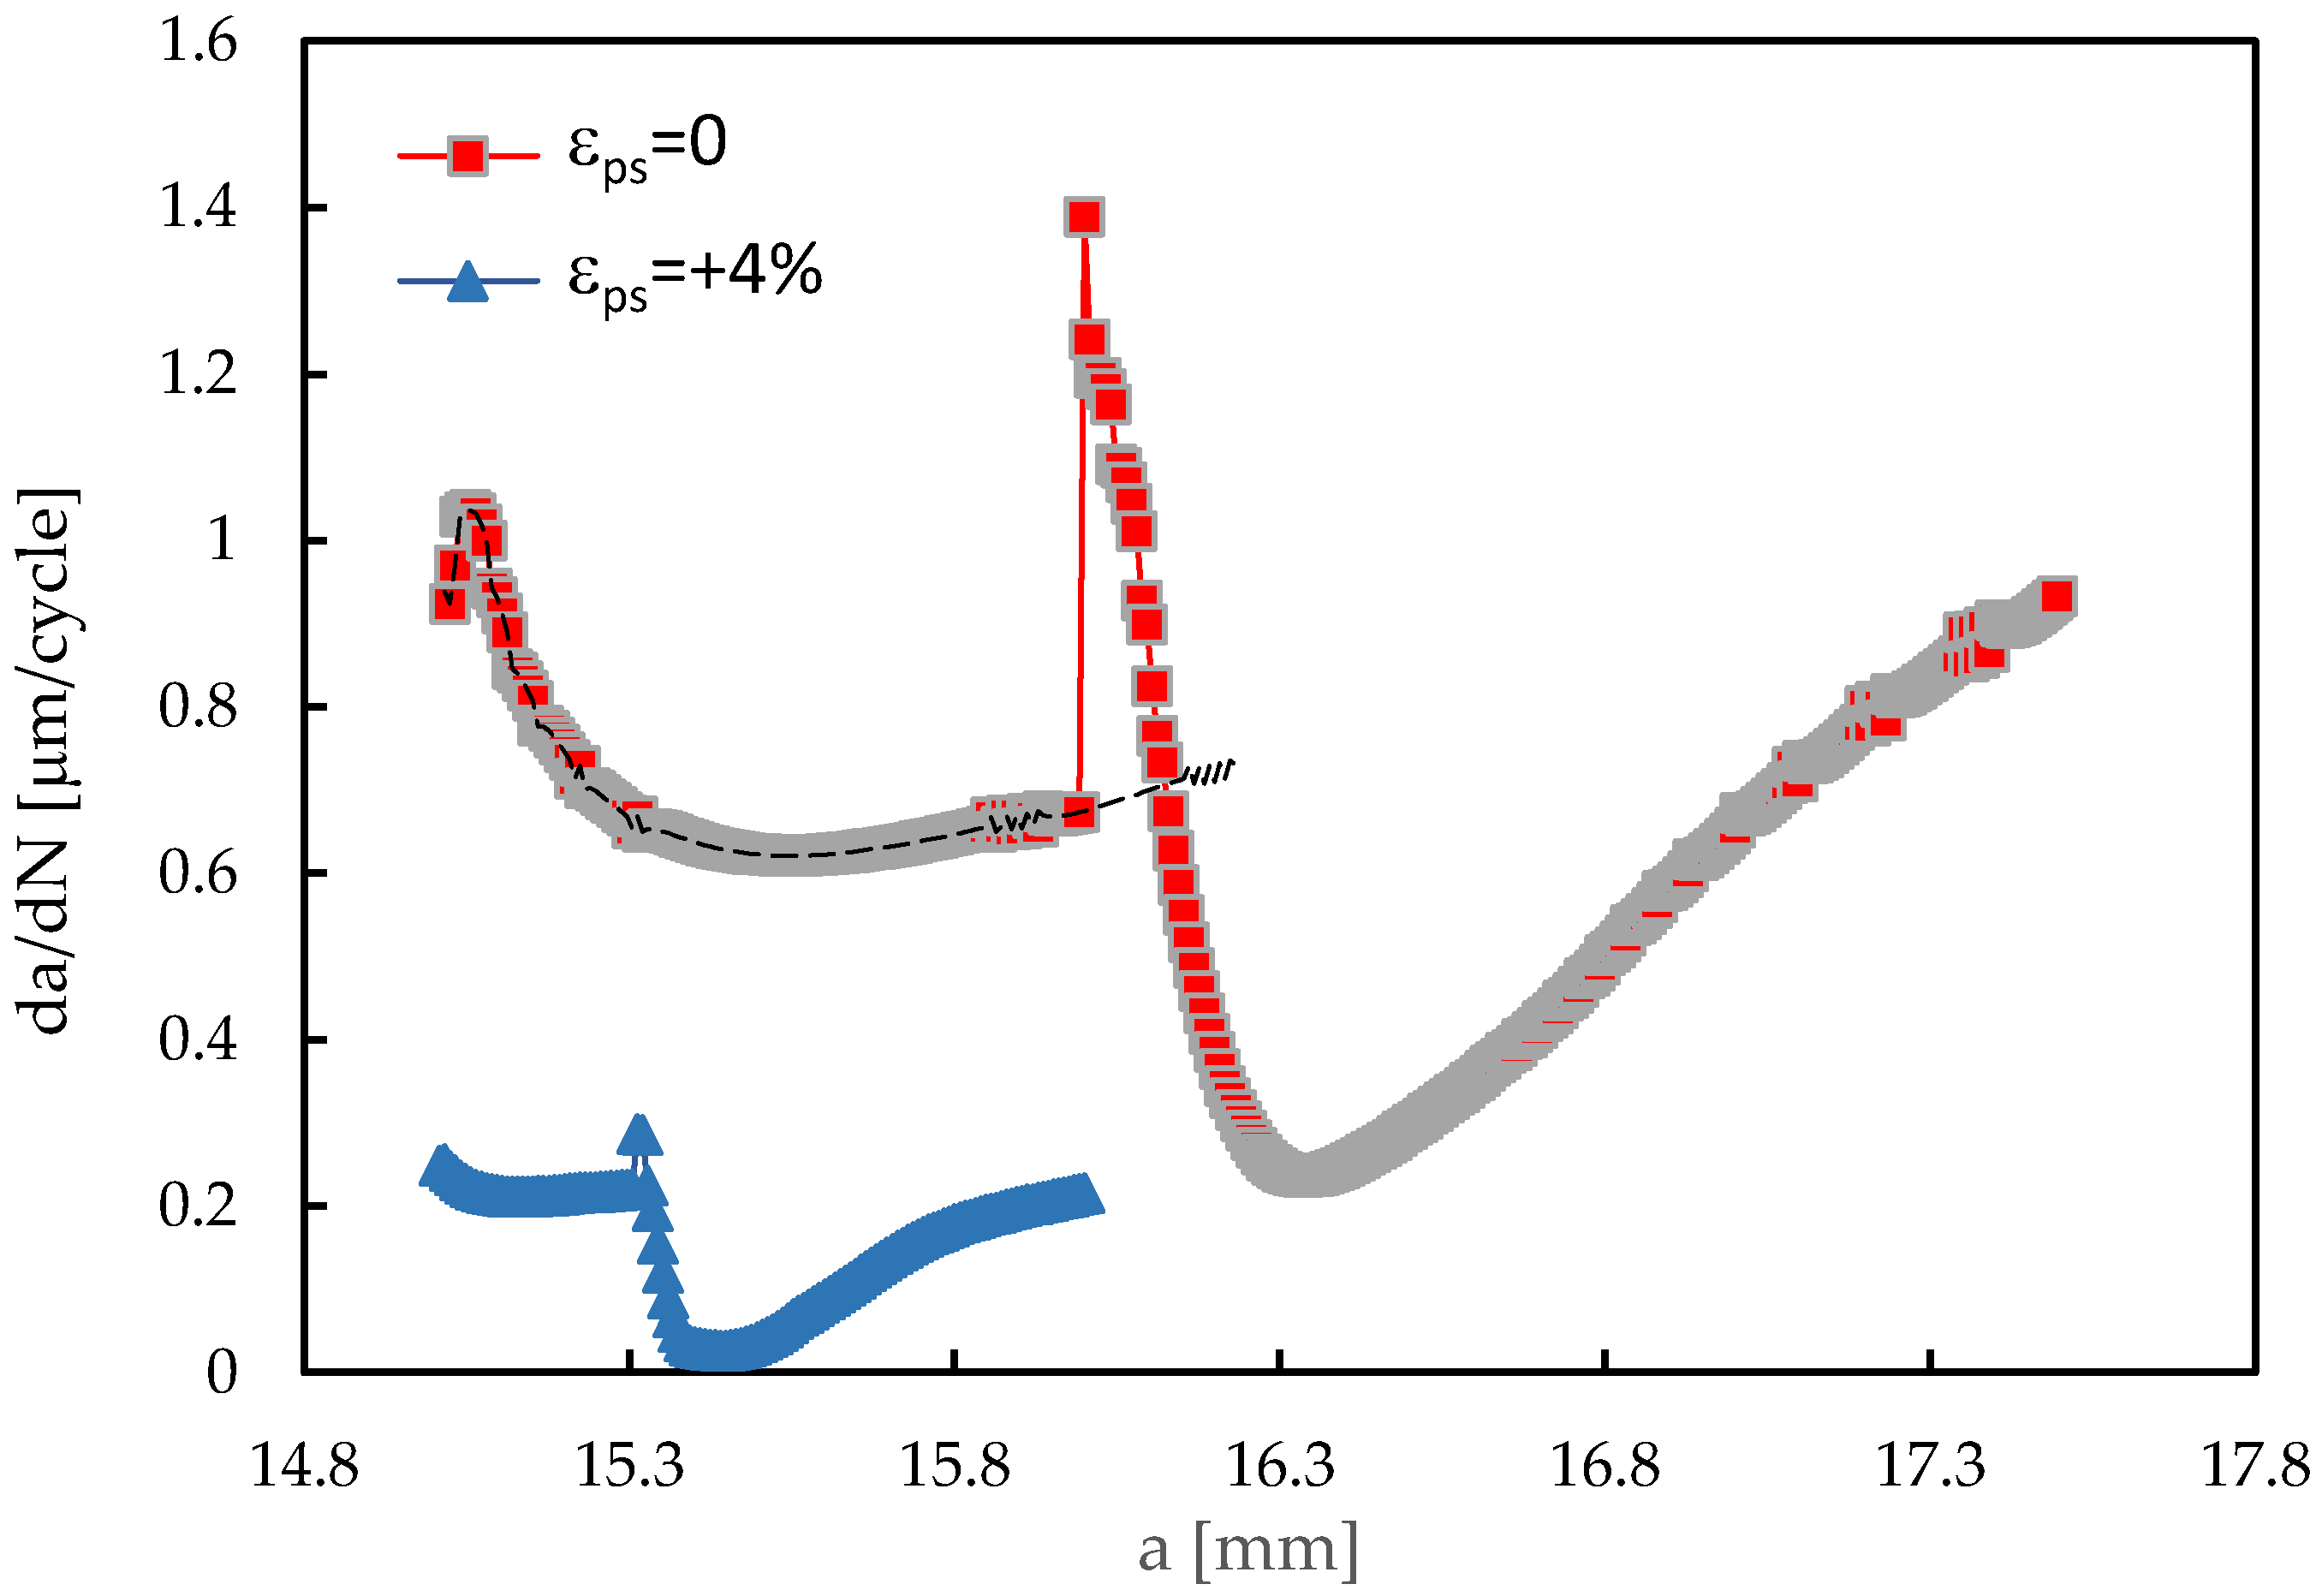
Figure 10.
CTOD versus applied load (OLR=1.5; FOL=79.17 N; Plane stress; Fmin,BL=4.17 N; Fmax,BL=41.67 N; R=0.1; with contact). (a) Overload cycle. (b) At minimum da/dN (a=16.336 mm and a=15.448 mm for εps=0 and 4%, respectively. The dashed lines indicate the behaviour without overload.
Figure 10.
CTOD versus applied load (OLR=1.5; FOL=79.17 N; Plane stress; Fmin,BL=4.17 N; Fmax,BL=41.67 N; R=0.1; with contact). (a) Overload cycle. (b) At minimum da/dN (a=16.336 mm and a=15.448 mm for εps=0 and 4%, respectively. The dashed lines indicate the behaviour without overload.
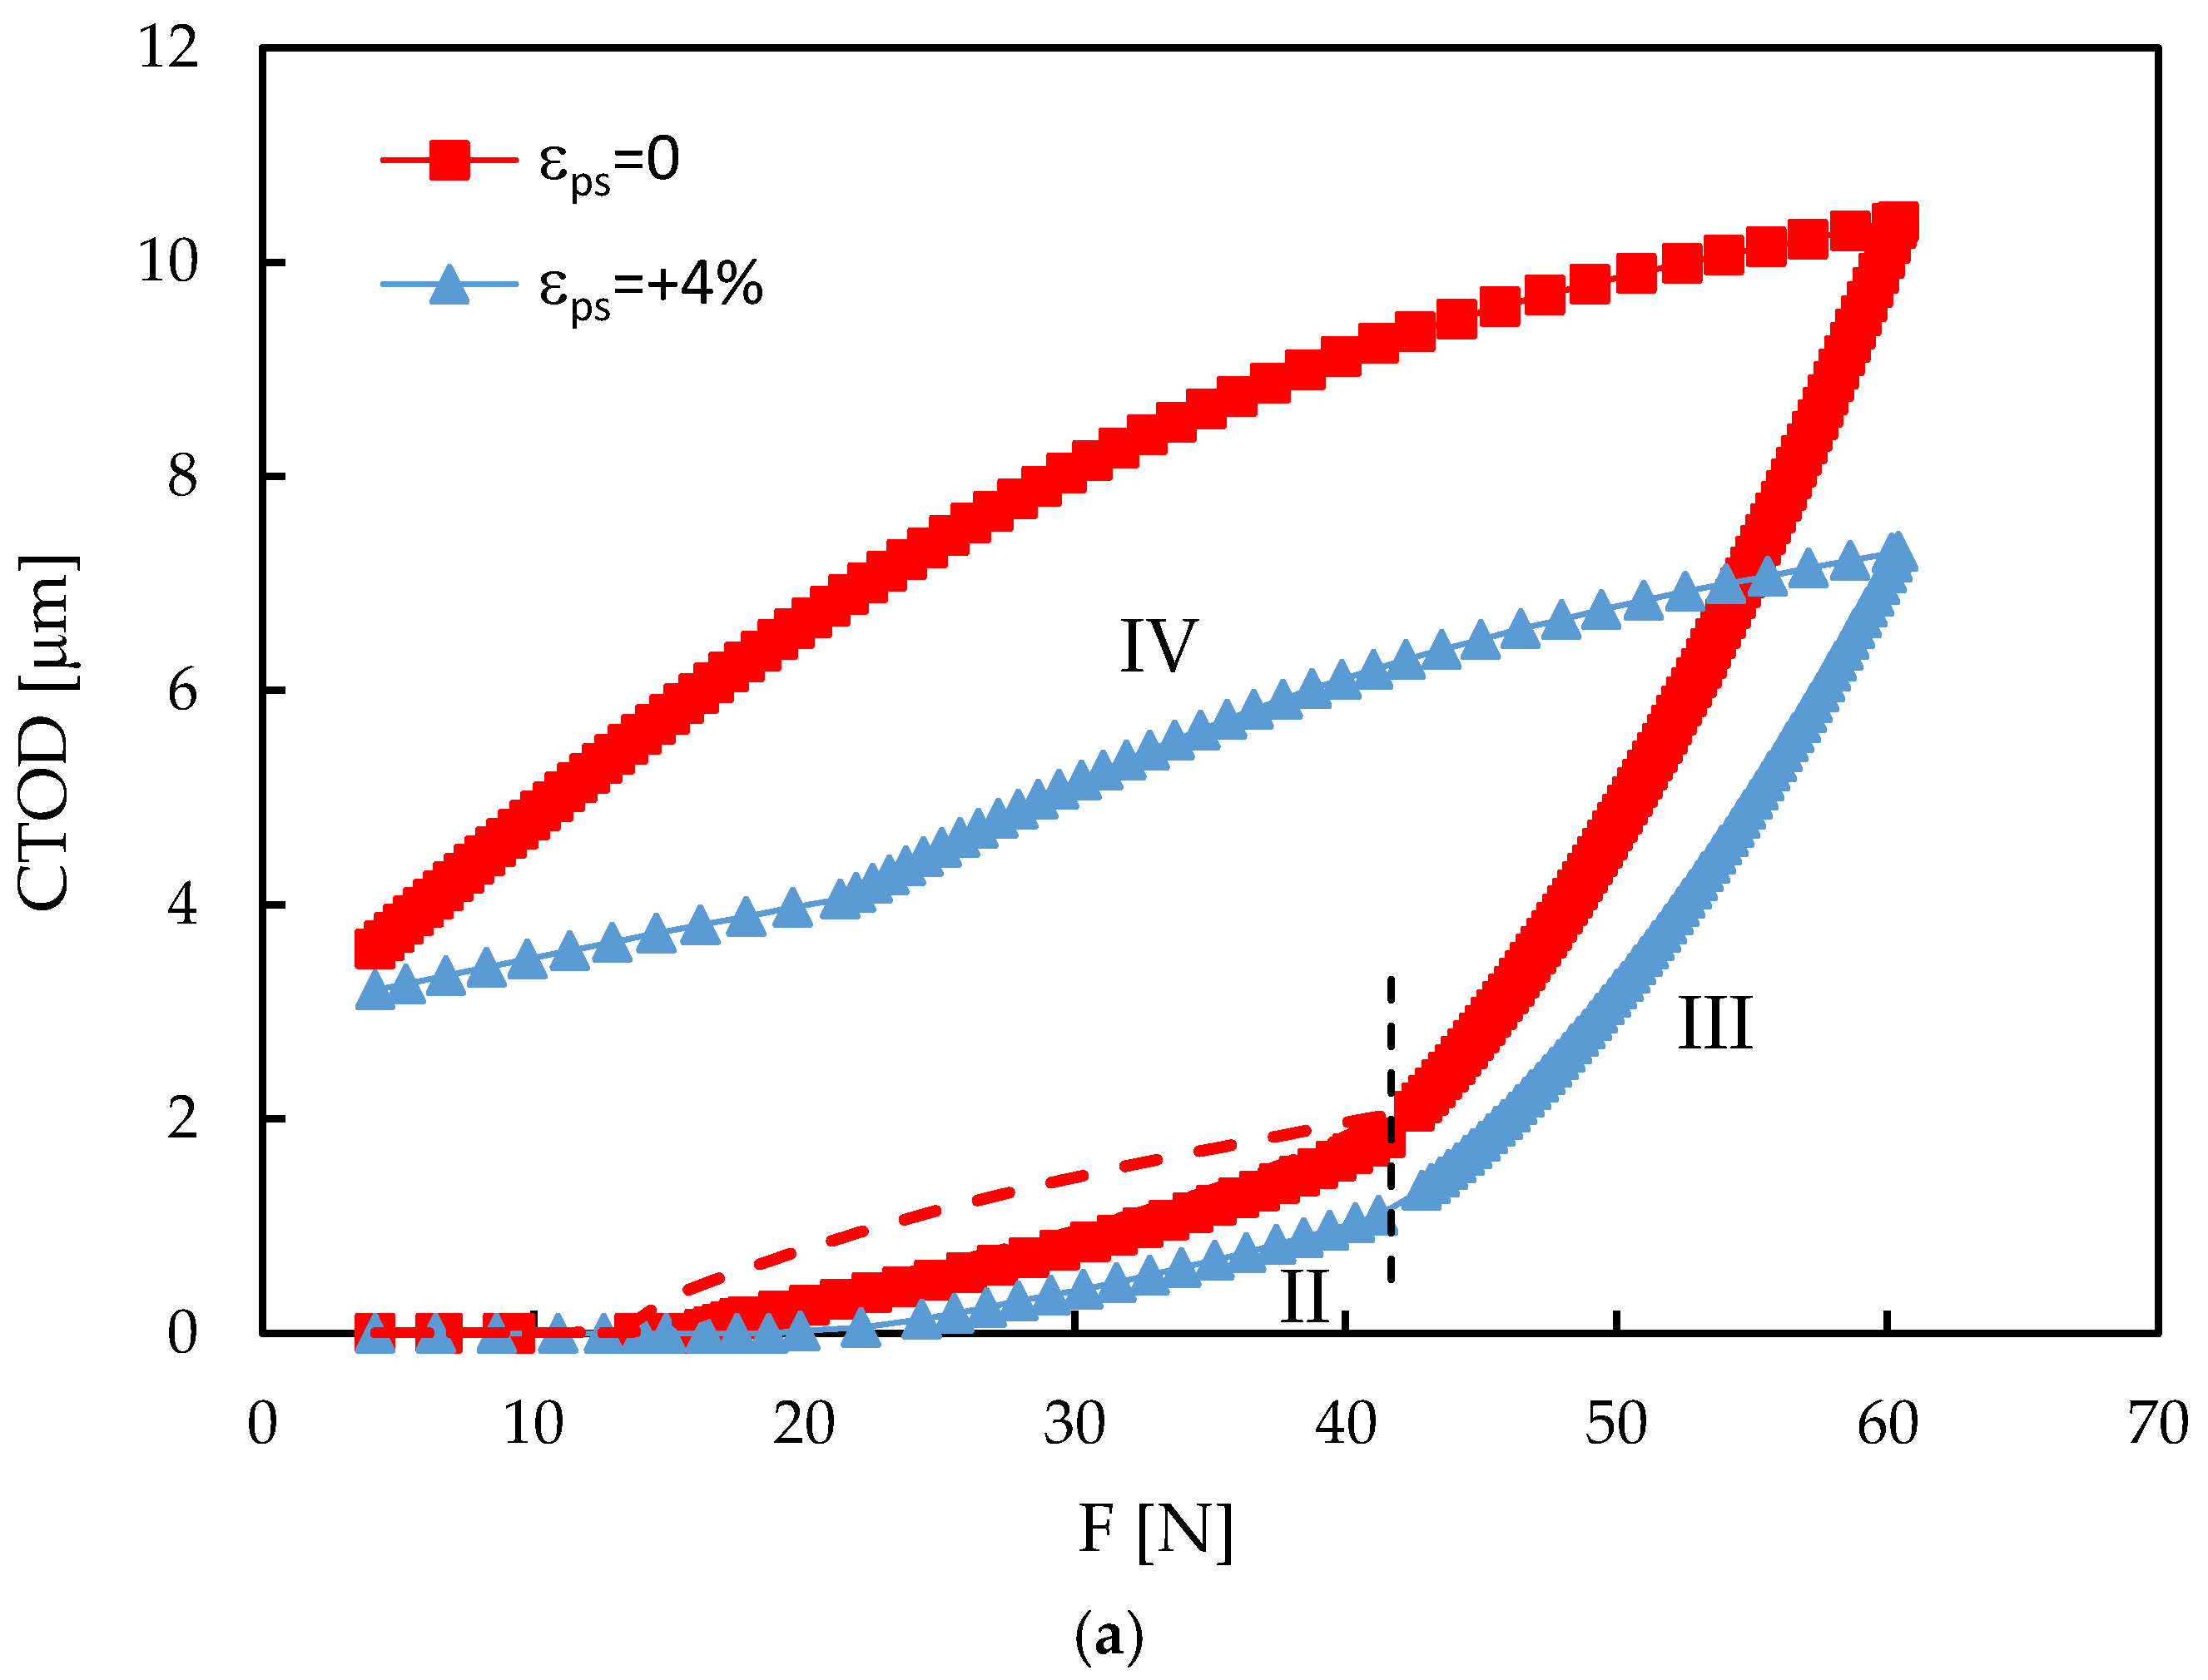
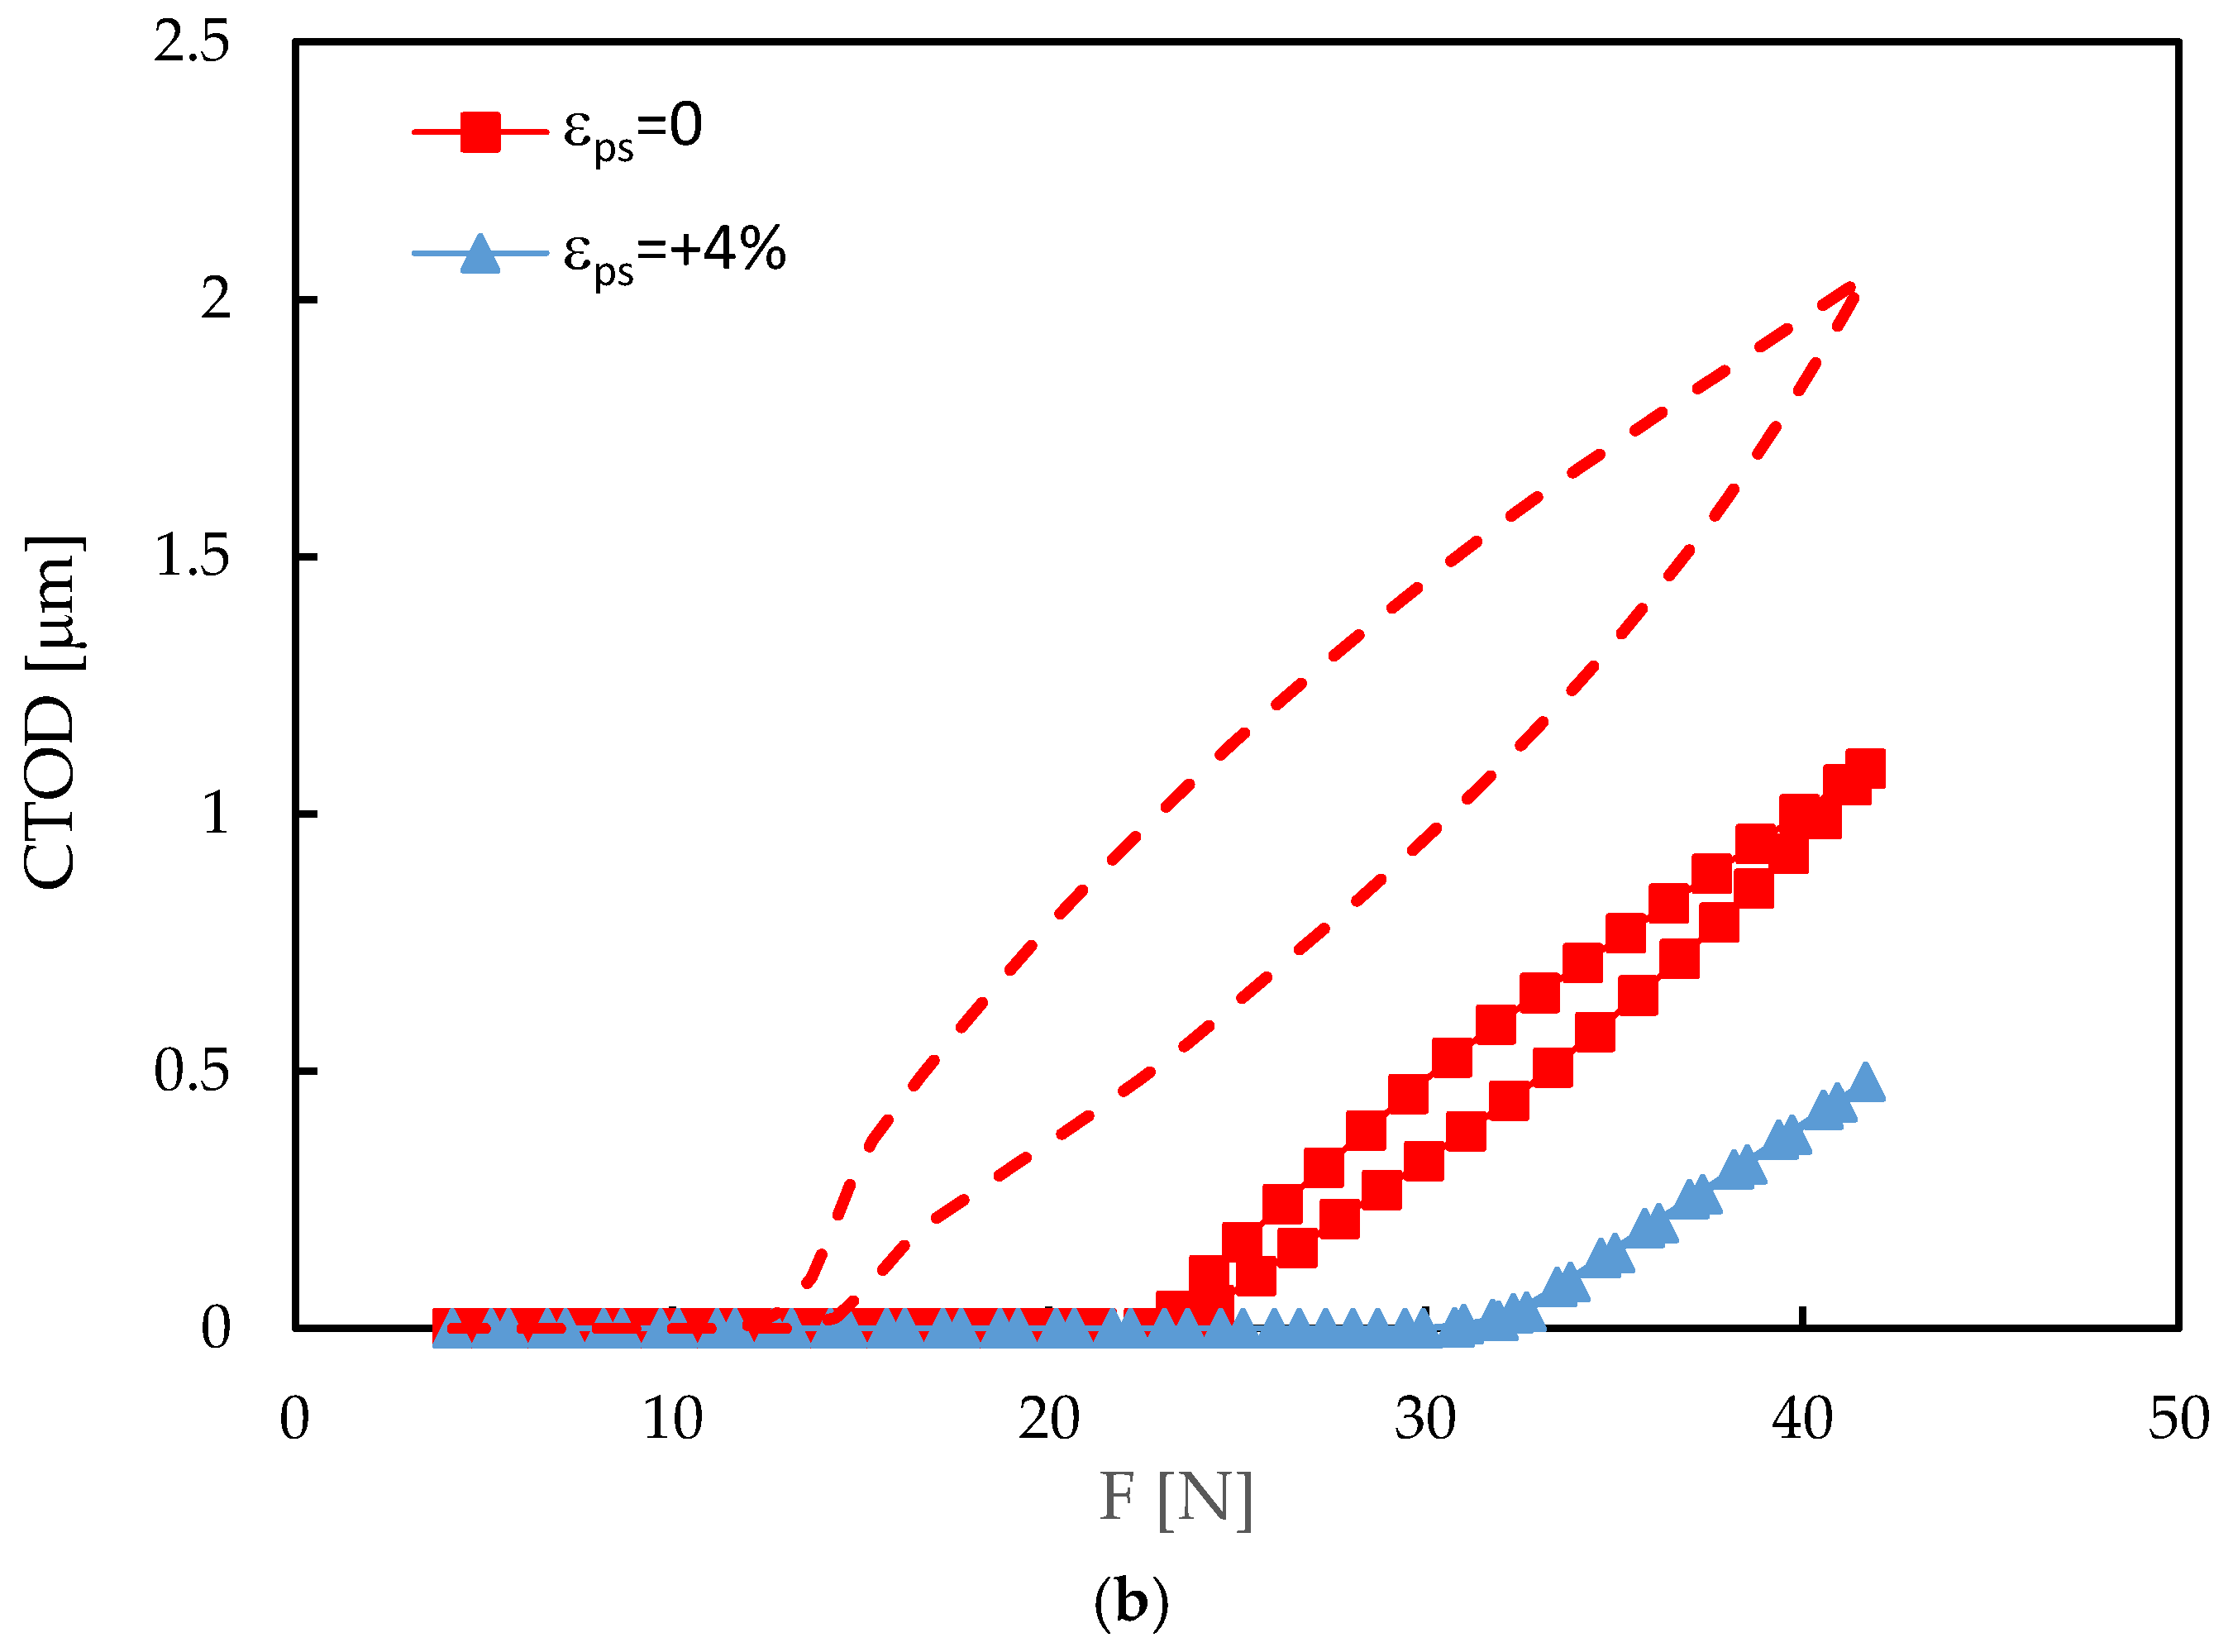
Figure 11.
(a) da/dN versus crack length. (b) CTOD versus load plots at a=16.048 mm (Plane stress; Fmin=4.17 N; Fmax=41.67 N; R=0.1; without contact).
Figure 11.
(a) da/dN versus crack length. (b) CTOD versus load plots at a=16.048 mm (Plane stress; Fmin=4.17 N; Fmax=41.67 N; R=0.1; without contact).
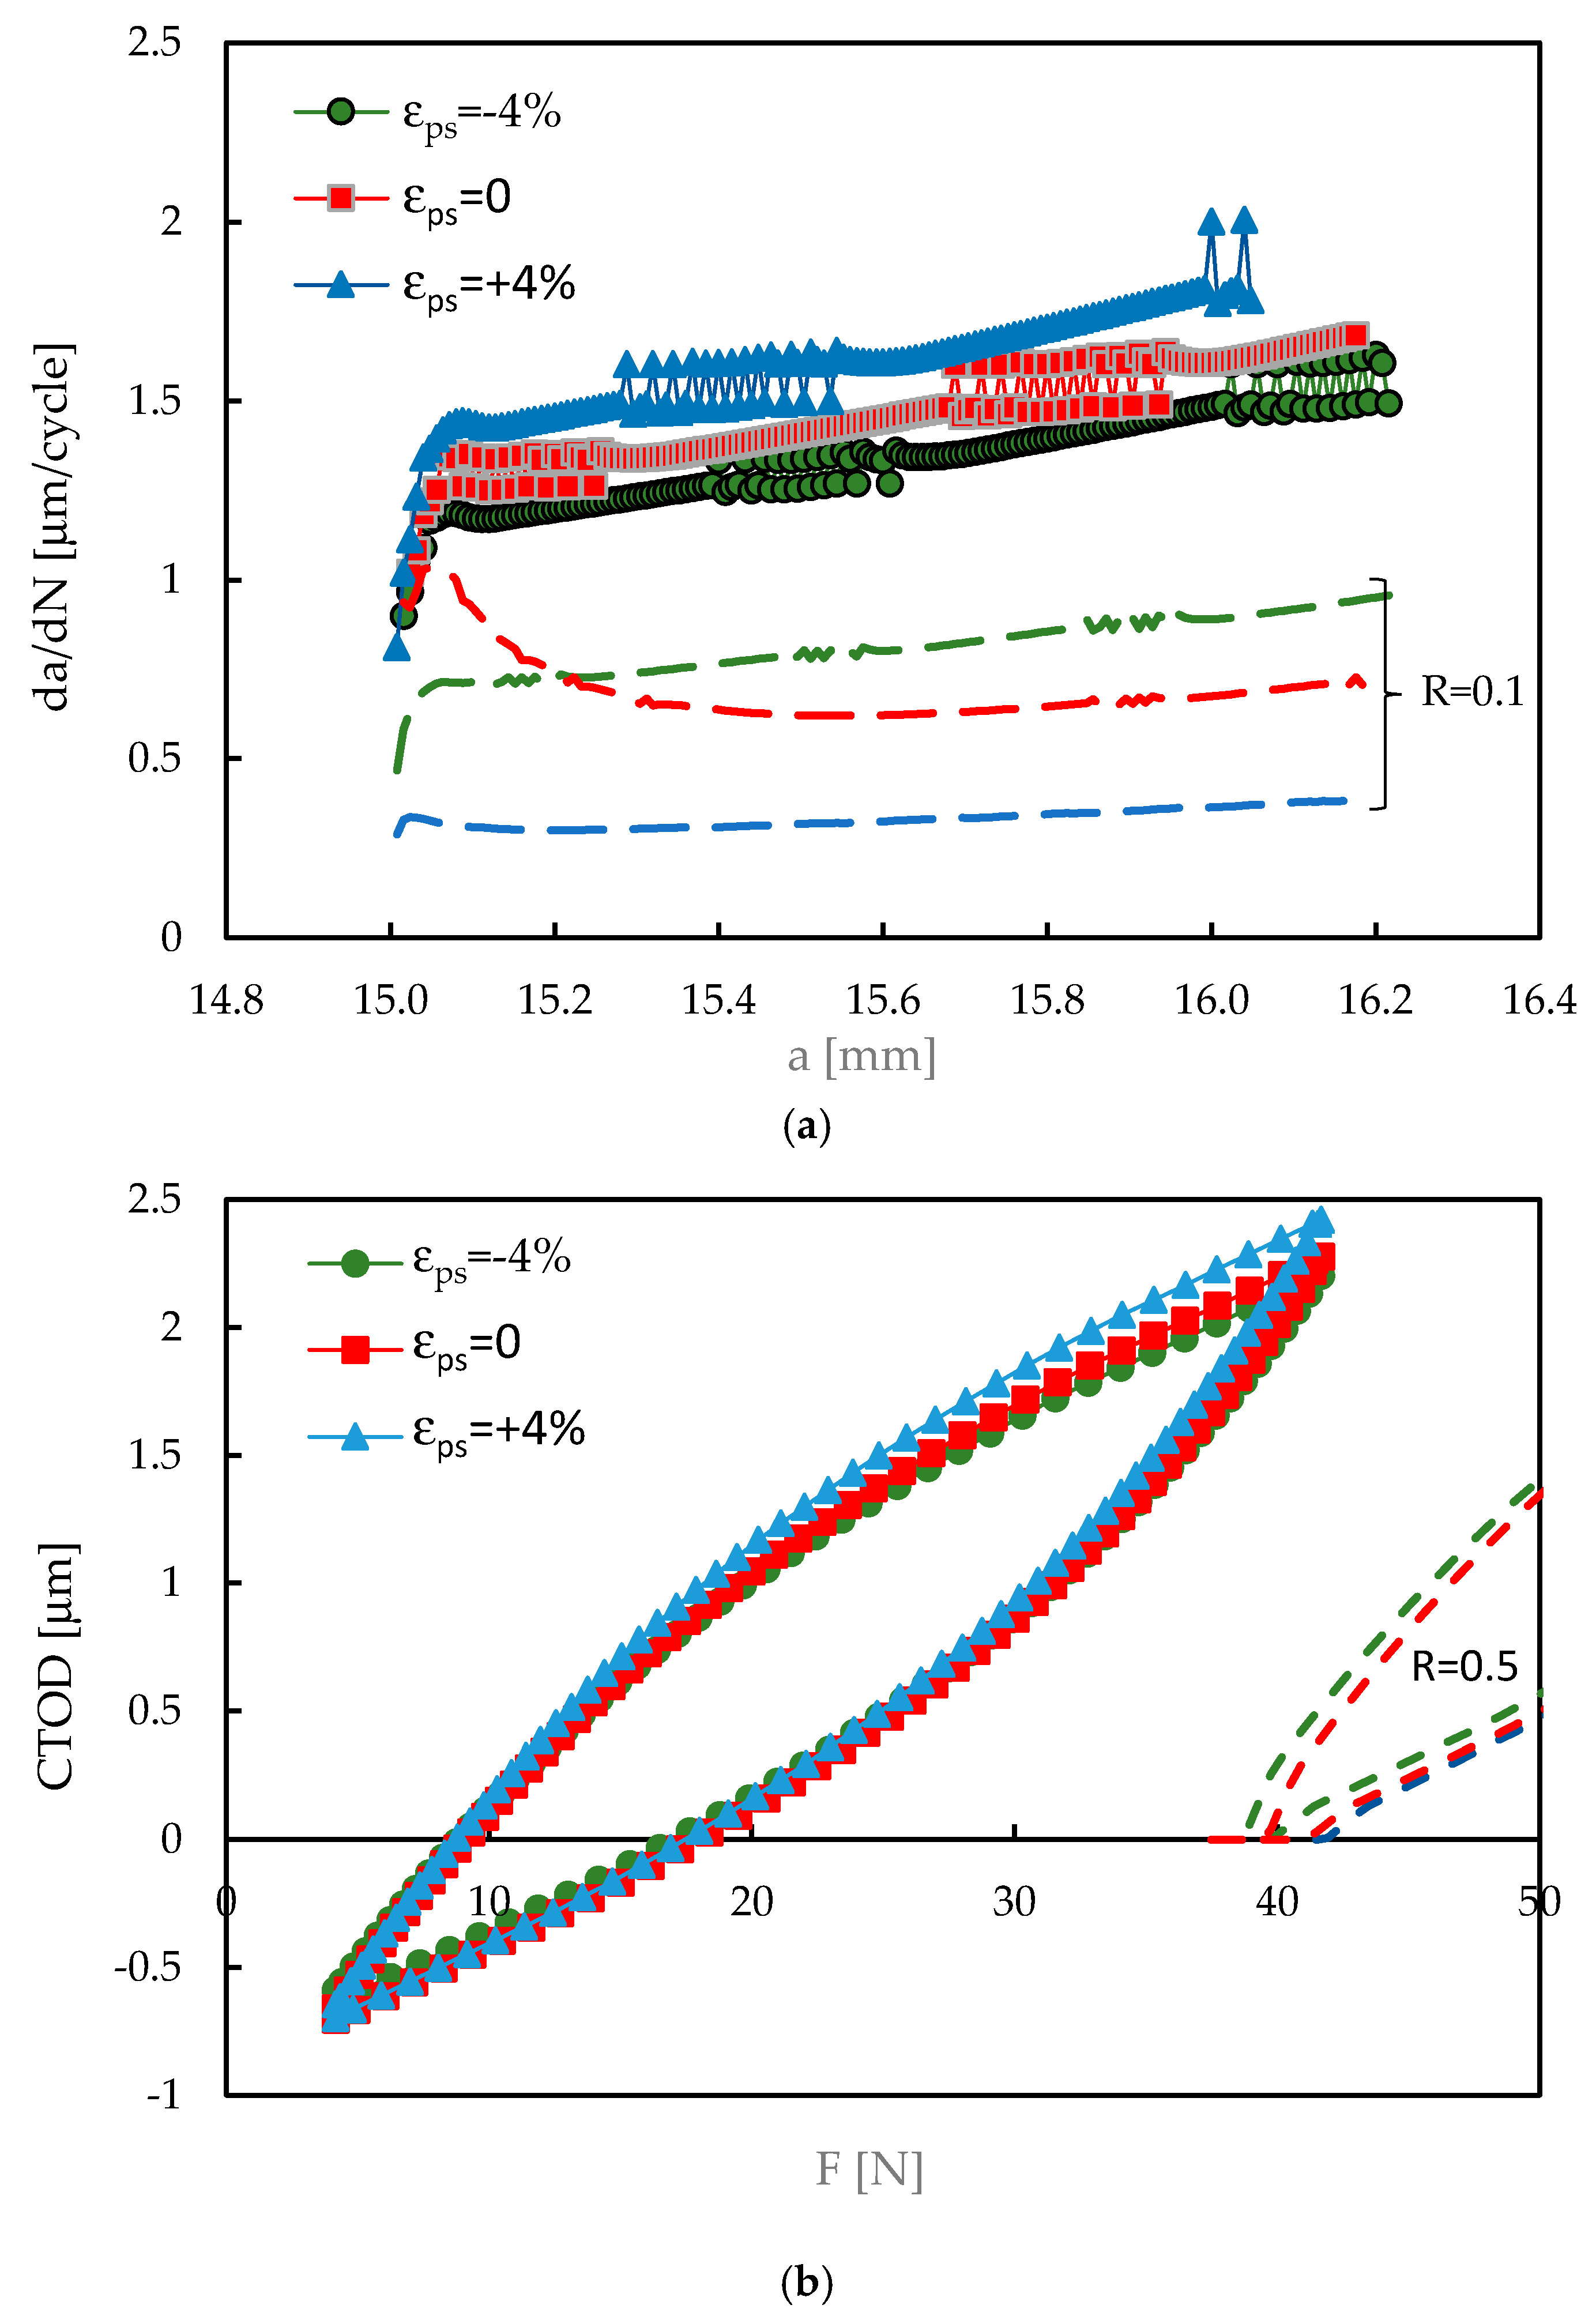
Figure 12.
Accumulation of plastic strain at the crack tip with cyclic loading. (a) With contact of crack flanks. (b) Without contact of crack flanks (Plane stress; Fmin=4.17 N; Fmax=41.67 N; R=0.1).
Figure 12.
Accumulation of plastic strain at the crack tip with cyclic loading. (a) With contact of crack flanks. (b) Without contact of crack flanks (Plane stress; Fmin=4.17 N; Fmax=41.67 N; R=0.1).
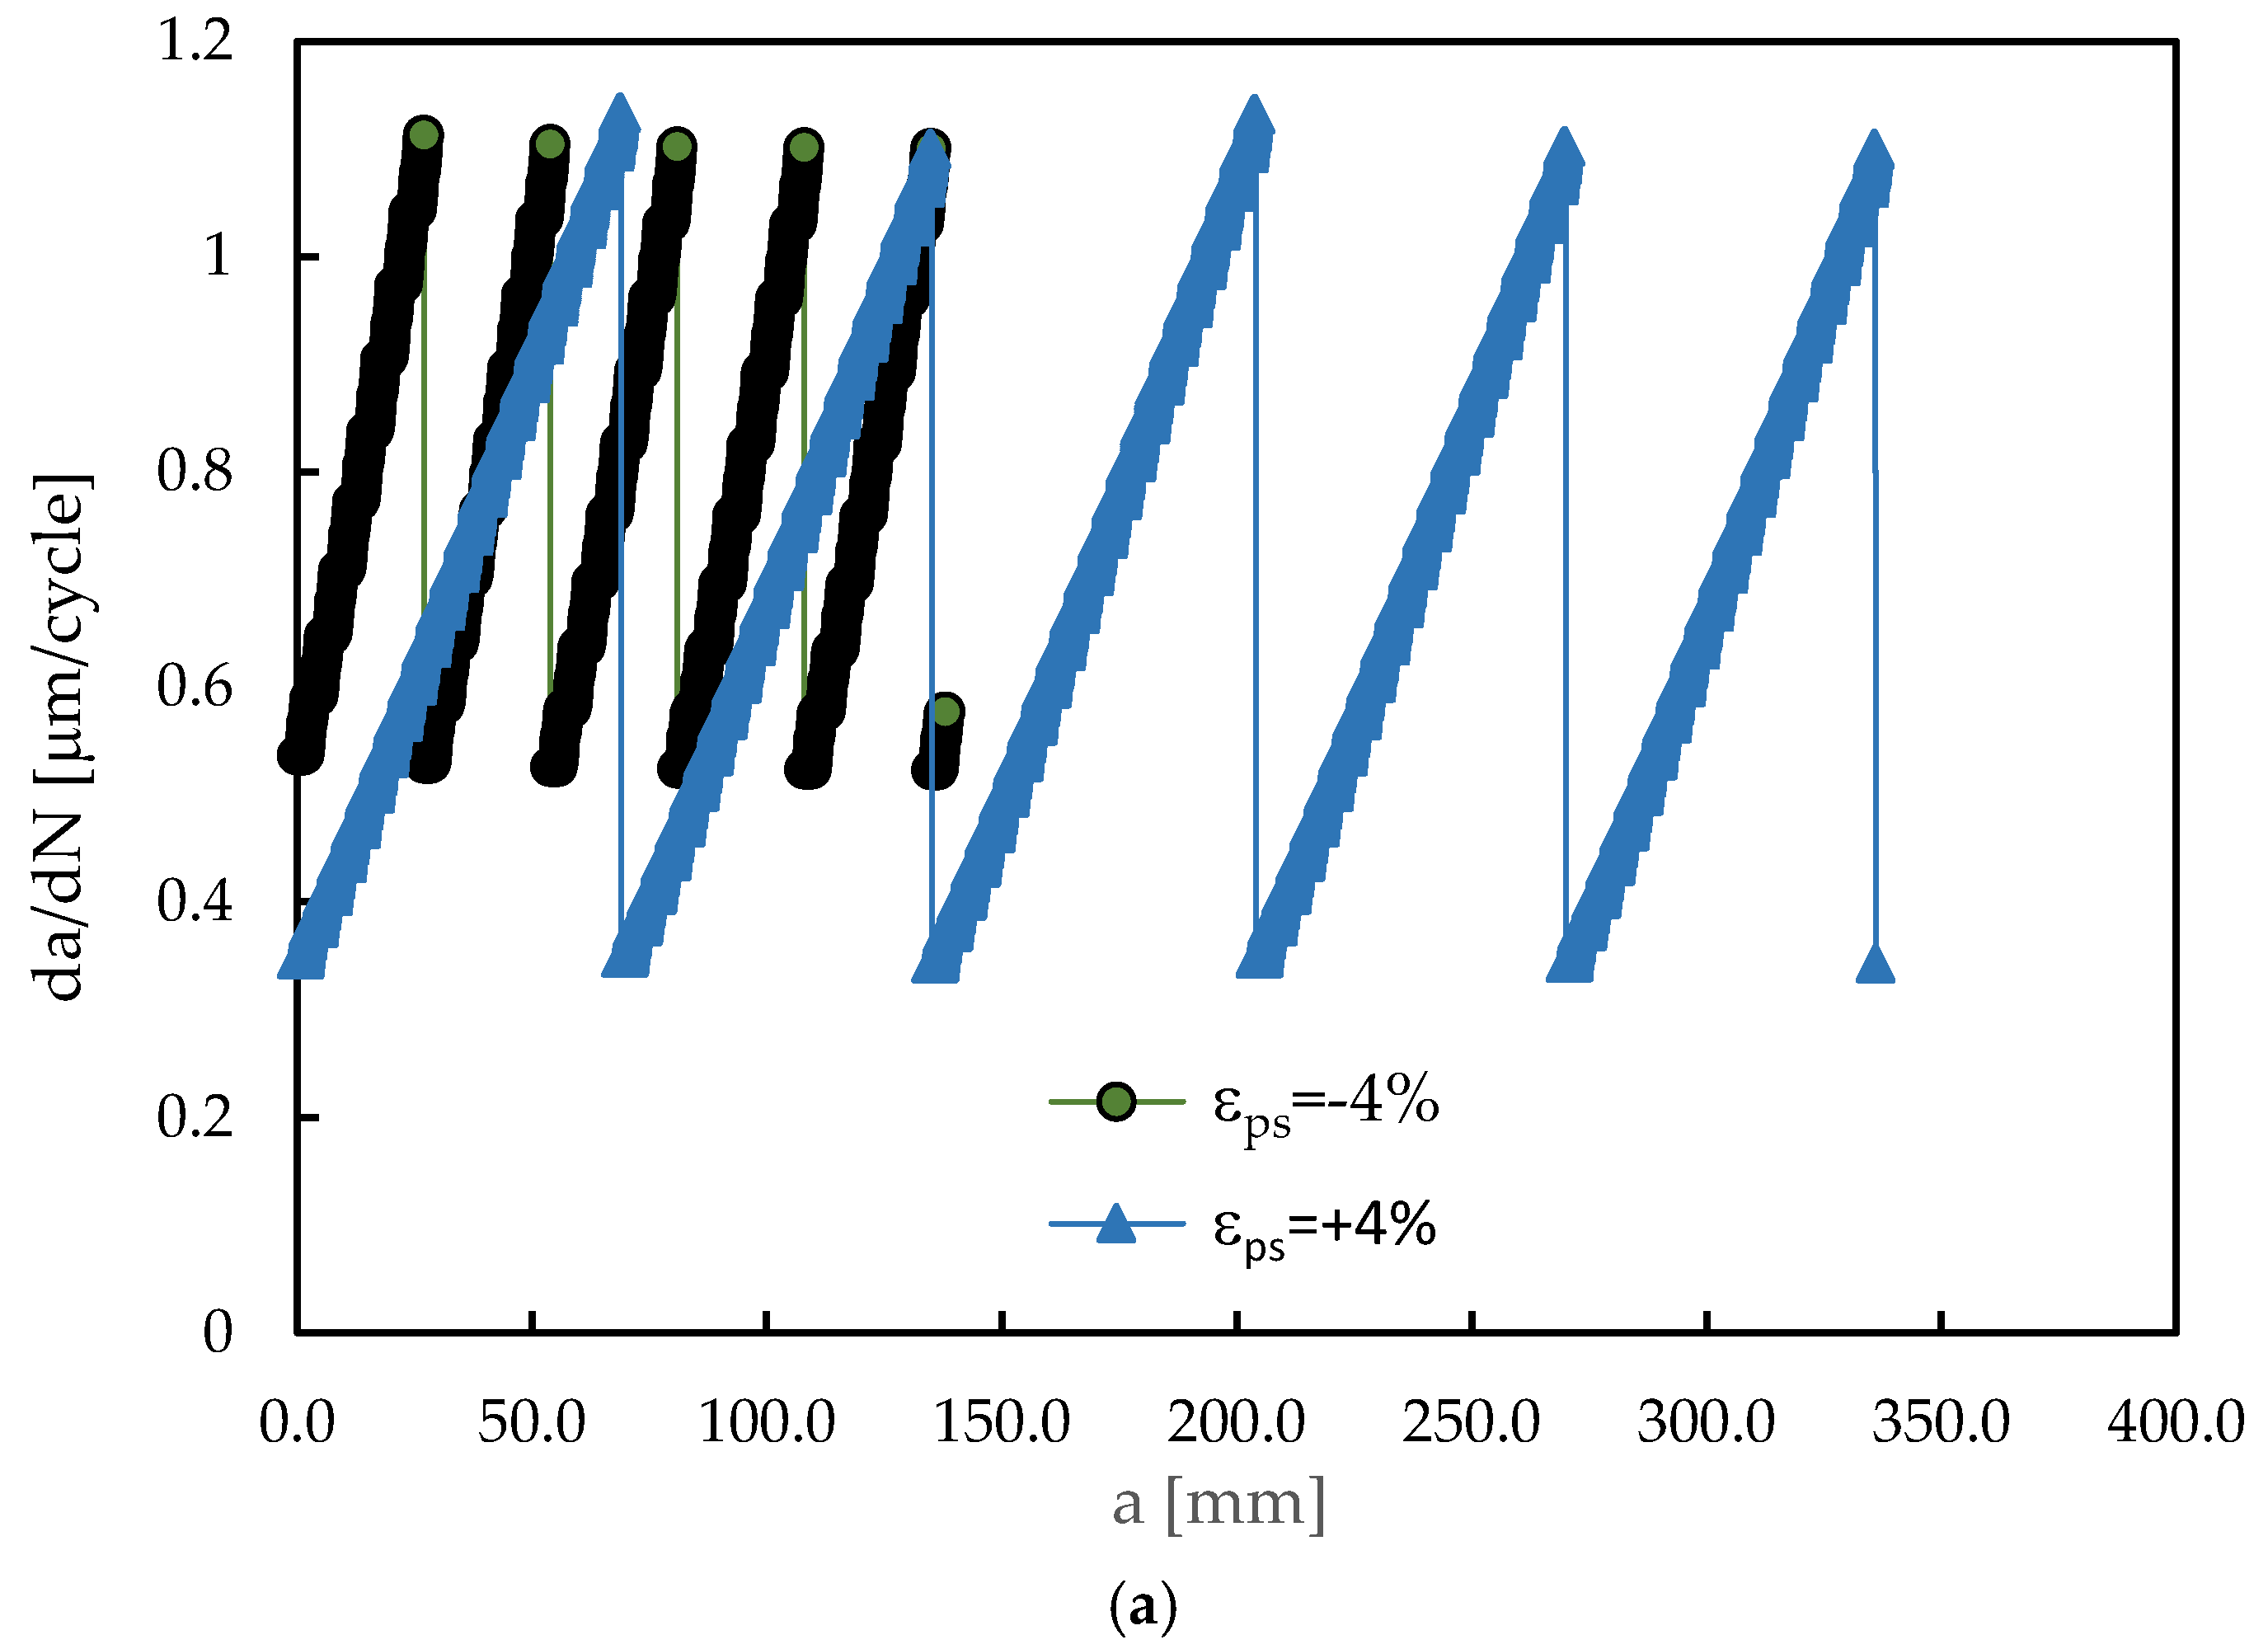
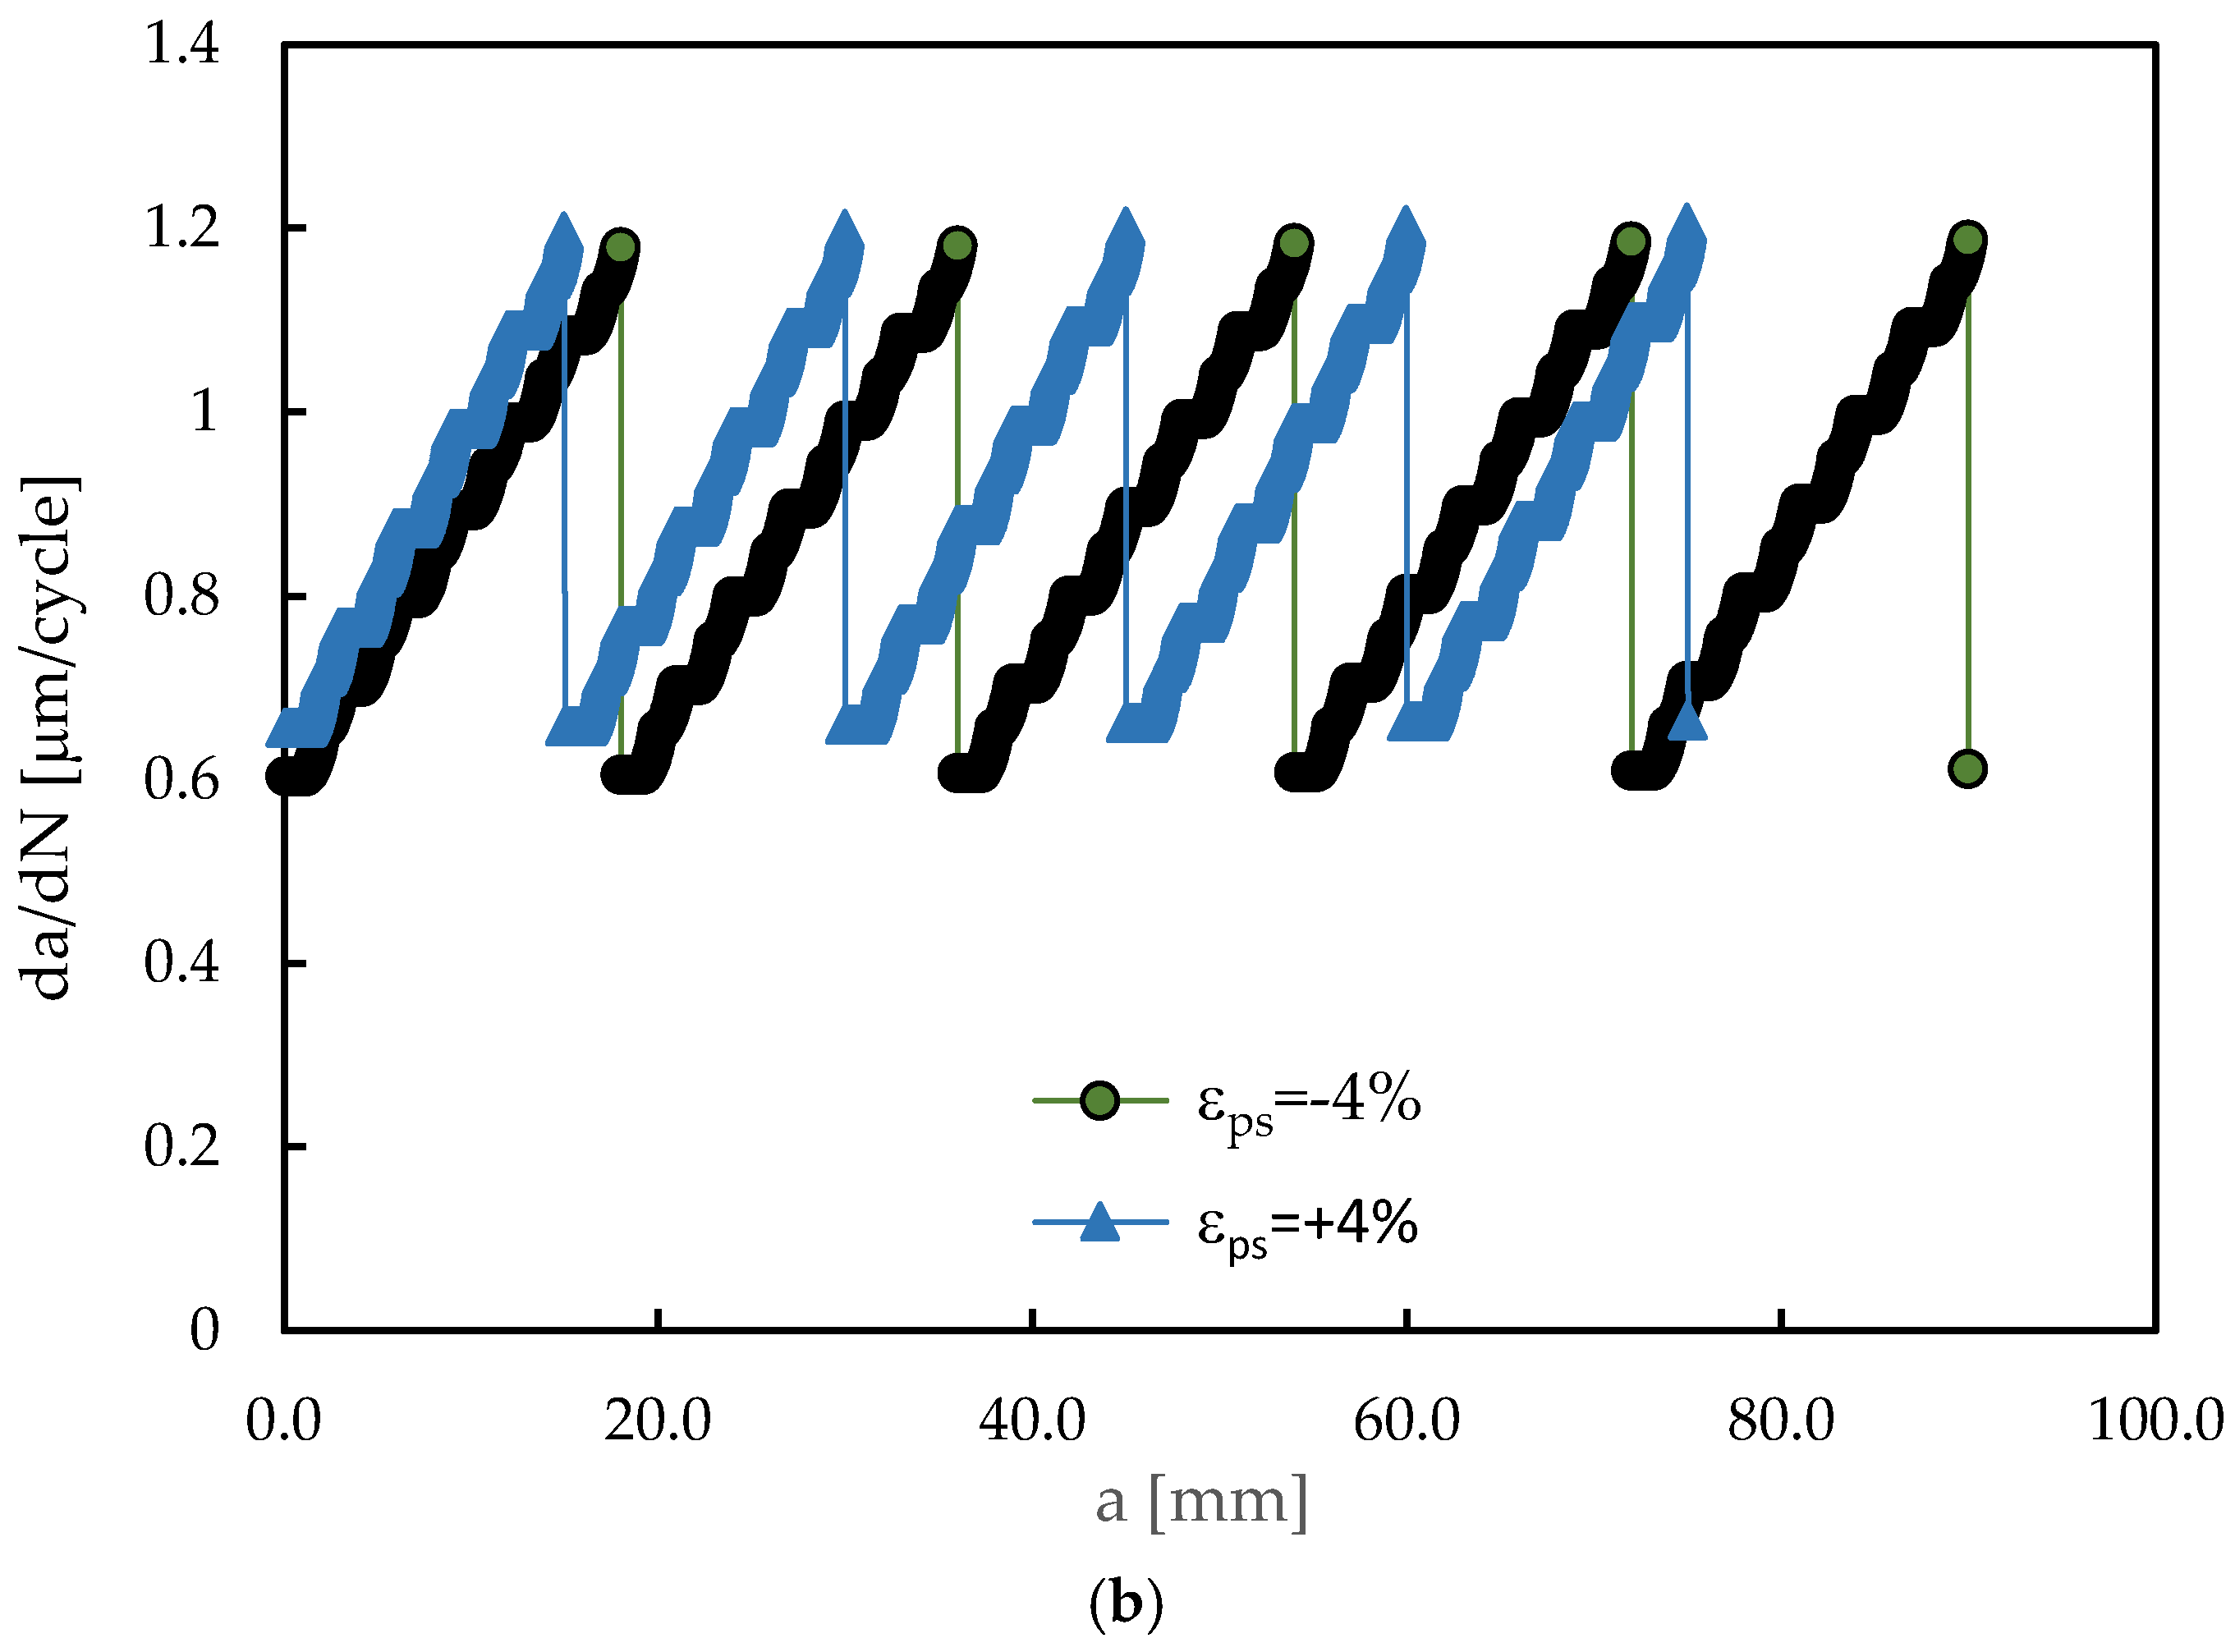

Table 1.
Chemical composition in weight % of 2024-T351 aluminium alloy. The balance is Al.
| Si | Fe | Cu | Mn | Mg | Cr | Zn | Ti |
|---|---|---|---|---|---|---|---|
| 0.50 | 0.50 | 3.8-4.9 | 0.3-0.9 | 1.2-1.8 | 0.10 | 0.25 | 0.15 |
Table 2.
List of material parameters involved in the Swift and Lemaître-Chaboche laws.
| Material | Y0 [MPa] | C [N] | n | Cx [mm] | XSat [MPa] |
|---|---|---|---|---|---|
| 2024-T351 | 288.96 | 389.00 | 0.056 | 138.80 | 111.84 |
Table 3.
Loading conditions (a0=15 mm; plane stress).
| Test | Loading | R | εps [%] | Contact |
|---|---|---|---|---|
| 1 | CA | 0.1 | 0 | Yes |
| 2 | CA | 0.1 | +4 | Yes |
| 3 | CA | 0.1 | -4 | Yes |
| 4 | CA | 0.1 | 0 | No |
| 5 | CA | 0.1 | +4 | No |
| 6 | CA | 0.1 | -4 | No |
| 7 | CA | 0.5 | 0 | Yes |
| 8 | CA | 0.5 | +4 | Yes |
| 9 | CA | 0.5 | -4 | Yes |
| 10 | OL | 0.1 (BL) 1 | 0 | Yes |
| 11 | OL | 0.1 (BL) | +4 | Yes |
1 BL- Baseline loading.
Disclaimer/Publisher’s Note: The statements, opinions and data contained in all publications are solely those of the individual author(s) and contributor(s) and not of MDPI and/or the editor(s). MDPI and/or the editor(s) disclaim responsibility for any injury to people or property resulting from any ideas, methods, instructions or products referred to in the content. |
© 2025 by the authors. Licensee MDPI, Basel, Switzerland. This article is an open access article distributed under the terms and conditions of the Creative Commons Attribution (CC BY) license (http://creativecommons.org/licenses/by/4.0/).
Copyright: This open access article is published under a Creative Commons CC BY 4.0 license, which permit the free download, distribution, and reuse, provided that the author and preprint are cited in any reuse.


