
Submitted:
01 April 2025
Posted:
02 April 2025
You are already at the latest version
Abstract
This study develops a landslide susceptibility zoning map for the Zipaquirá–Pacho road corridor in Cundinamarca, an area prone to frequent landslides. Two statistical methods—Weight of Evidence (WoE) and Information Value (IV)—were used alongside various causal factors to generate the map using GIS software. A landslide inventory with 101 points was compiled through fieldwork and Google Earth image analysis. Of these, 70% were used to build the models, while the remaining 30% were reserved for validation, ensuring spatial representativeness. The resulting susceptibility maps classified the area into five categories: "very high," "high," "moderate," "low," and "very low." For WoE, 19.62% of the area was classified as "very high" and 19.71% as "high," while for IV, the respective values were 17.57% and 26.55%. Notably, 88% of the identified landslides occurred in "high" and "very high" zones. Model validation using the AUC (Area Under Curve) metric yielded an efficiency of 81%, confirming the reliability of both methods for landslide prediction. The study's findings are essential for supporting mitigation strategies and serve as valuable input for local authorities and stakeholders involved in risk management and infrastructure planning.
Keywords:
landslide susceptibility zoning
; weight of evidence
; information value
; validation AUC
1. Introduction
Landslide susceptibility assessment and mapping are essential tools for landslide risk management and serve to support decision-makers in developing territorial planning strategies, risk mitigation measures, and the implementation of monitoring and warning systems [1,2,3,4].
Landslide susceptibility refers to the probability of landslides occurring in an area based on local terrain conditions [5], considering morphological, geological, land use, land cover, and local environmental and climatic characteristics, thereby providing an estimate of where such events are most likely to occur [6]. Note that landslide susceptibility does not consider the temporal occurrence or magnitude of expected landslides [7].
Several predictive models have been developed to assess and map landslide susceptibility, considering factors such as scale, study objectives, modeling approaches, and evaluation criteria [8,9]. These models include both qualitative and quantitative methods [10]. Qualitative methods typically provide a zonation of landslide susceptibility using weighted indices and relative categories (e.g., low, medium, high), which are suitable for local-scale and site-specific studies. In contrast, quantitative methods offer numerical estimates of landslide occurrence.
According to the United States Geological Survey (USGS), a landslide is defined as the downward movement of earth materials (such as rocks, debris, and soil) at velocities ranging from millimeters per year to meters per hour [11]. These landslides may be triggered by various natural factors—such as slope, geological faults, heavy rainfall, and earthquakes—or result from human activities [12], causing significant impacts in the affected areas.
Landslides vary in their characteristics, and understanding their causes and mechanisms is essential for effective mitigation [13]. In this context, the inventory of critical sites or event occurrence points, combined with the assessment of the resulting damage, plays a crucial role in landslide analysis [14,15]. These inventories also contribute to a more comprehensive spatio-temporal analysis of landslides; consequently, zoning—which is defined as the delineation of geographic areas where specific events occur—enables the identification of regions susceptible to landslides due to the interaction of various land instability factors [16].
Landslide Susceptibility Zoning classifies the territory based on the probability of landslide occurrence, utilizing different methods (including direct, heuristic, statistical, and process-based models) and tools [7]. International guidelines for landslide susceptibility zoning recommend that landslide mapping should include the following components: (a) landslide inventory mapping, which indicates the points or areas identified as having failed due to landslide processes; and (b) landslide susceptibility zoning, which involves the classification, extent, and spatial distribution of existing and potential landslides in the study area [3,17].
Landslide susceptibility mapping begins with the creation of a landslide inventory map [18]. Landslide inventory maps provide information on the location and distribution of landslides that have left noticeable features in an area [7]. Most landslide inventory maps are generated by visually integrating the interpretation of one or more sets of satellite imagery or aerial photographs, along with varying degrees of direct on-site observations. An inventory is essential for preparing a susceptibility map [19]. In addition, successful mapping requires the identification of optimal causal factors, which are generally selected based on an analysis of the types of landslides and the characteristics of the study area [20]. Consequently, landslide occurrence is influenced by the interaction of topographic, hydrologic, and geologic factors [21,22].
Identifying the factors that influence landslide occurrence is a complex task due to the lack of standardized criteria for selecting which factors to include or exclude [23]. The causal factors used for assessing and zoning landslide susceptibility are determined based on a comprehensive literature review and detailed field observations [18,24]. These causal factors are often effectively derived from satellite imagery and Digital Elevation Models (DEMs) [25]. Based on this, thirteen landslide causal factors were selected for this study: elevation, slope, aspect, flow length, flow accumulation, insolation, Sen2p, distance to faults, distance to folds, distance to rivers, ground cover, geology, and geomorphology.
As noted previously, various methods have been employed for landslide susceptibility assessment and zoning, typically focusing on empirical, statistical, and deterministic approaches [26,27]. Statistical approaches are the most commonly used for both landslide susceptibility and hazard zoning [8,28], although they have a general limitation: they do not propose mechanisms for controlling slope failure. Instead, it is assumed that the prediction of future landslide areas can be achieved by evaluating combinations of variables that contributed to past landslide occurrences [29]. The Weight of Evidence method (WoE) is widely used to predict areas that are potentially susceptible to landslides by employing the Bayesian probability model in a log-linear form. In this approach, each factor is linearly superimposed in the GIS environment based on its independent characteristics [30,31].
The WoE method calculates the weight of each landslide causal factor based on the presence or absence of landslides within the area. Its fundamental assumption is that future landslides will occur under conditions similar to those that contributed to past landslides [32].
By overlaying the landslide inventory map with each causal factor map, spatial statistical relationships can be derived to quantify the impact of various landslide-causing factors by assigning them positive or negative weights. This process evaluates the potential for future landslides based on the presence or absence of each causal factor class, Ei, using a pair of likelihood ratios as outlined in Equation (1) [33].
For calculating the weight of each causal factor contributing to landslide occurrence, Equations (3) and (4) have been employed [34]:
In these equations, Npix1 denotes the number of pixels where both landslides and landslide-contributing factors are present; Npix2 represents the number of pixels where landslides are present but the contributing factors are absent. Conversely, Npix3 indicates the presence of landslide-contributing factors without a landslide, and Npix4 signifies the absence of both landslides and contributing factors.
The final weight, expressed as Wc, is calculated using Equation (4):
Here, Wc is defined as the difference between W+ and W-. This formulation refines the spatial relationship between all contributing factors and landslides.
where i is the class of a factor whose values vary from 1 to n.
Another method that employs a bivariate statistical approach—widely applied by numerous authors [28,30,35,36,37,38] is the Information Value (IV) method. Based on information theory, the IV method measures the amount of information carried by an event [39] and is primarily used as a statistical predictive approach in environmental geological research, particularly for spatial predictions of landslides and slope stability [40]. It converts measured data of landslide triggers, such as elevation and slope, into information values that reflect landslide susceptibility, which can then be used to determine potential landslide occurrence areas [41]. Based on the presence or absence of the classes of causal factors within past landslides, information values can be determined [42].
where Nslpix is a number of landslide pixels in a given class, Ncpix is the number of pixels in a given class, Ntspix is a total number of landslide pixels in the study area, and Ntapix is a total number of pixels in the entire study area.
Regardless of the zoning method used, it is recommended to utilize descriptors or parameters associated with nominal scales to differentiate the magnitude and intensity of landslides [3] and to describe the degree of susceptibility to landslides [43]. When interpreting a landslide susceptibility map, different shades (colors) are employed, with the nomenclature reflecting actual field observations and descriptions of common scenarios [30] (see Table 1: Examples of Landslide Susceptibility Mapping Descriptors).
The purpose of this research is to develop a reliable landslide susceptibility zoning map for the Zipaquirá-Pacho road corridor, an area where emergencies have been reported, due to the presence of various triggering factors that decrease slope stability and increase the risk of landslides, especially in areas with steep slopes. This process will be generated through the application of bivariate statistical approaches -specifically, the Weights of Evidence (WoE) method and the Information Value (IV) method- supported by specialized GIS software.
This map is intended to evaluate and establish mitigation strategies for the impacted area. Effective assessment of landslide occurrence in an area that is already failing or susceptible to failure requires the identification of existing and past landslides (inventory), the determination of the contribution of predominant causal factors, and the generation of landslide susceptibility mapping and zoning [44,45]. Materials and Methods
2. Materials and Methods
The selection of an appropriate method for landslide assessment and zoning depends on the objective and scope of the investigation [33]. In this study, two bivariate statistical models—namely, the Information Value (IV) model and the Weight of Evidence (WoE) model—were used to generate a landslide susceptibility zoning map for the Zipaquirá-Pacho Road corridor. The methodology comprises a workflow that integrates data capture and collection; the identification and determination of causal factors; the creation of a raster geodatabase; normalization of these factors; extraction of weights through WoE analysis and the Information Value method; generation of the susceptibility map; and, finally, evaluation through the proposal of mitigation strategies based on observed events, affected areas, and incidence zones. From these steps, the landslide inventory map and the landslide susceptibility maps are produced, and the model is subsequently validated (see Figure 1: Workflow of Methodology Adopted in the Study).
2.1. Study Area
This study focuses on the Zipaquirá–Pacho road corridor, which connects the municipality of Zipaquirá (5.024107°, -74.014034°)—located 29 kilometers from Bogotá, Colombia’s capital and part of its metropolitan area—with the municipality of Pacho (5.133582°, -74.154024°), situated in the department of Cundinamarca, 88 kilometers from Bogotá and 35.93 kilometers from Zipaquirá. The region where the road corridor is located is an area where emergencies have been reported due to several factors that reduce slope stability and increase the risk of landslides, especially in areas with steep slopes.
2.2. Input Data
The data source and accuracy directly affect the results of landslide susceptibility evaluation. Primary data were collected through field observations using tools such as GPS and mobile applications with smart forms, which allowed for the collection of location data and the classification of events based on type. Additionally, data from satellite platforms—specifically Google Earth Pro—were utilized.
2.3. Landslide Inventory
It is essential to compile inventories to understand how landslides are distributed across a region, to identify the types of movements impacting certain areas, and to recognize patterns among the triggering factors. This information can then be used to estimate the frequency and potential severity of future landslides [46]. In the study area, 20 landslide events were identified through field inspections along the road corridor. These data were further supplemented by 81 points obtained from visual interpretation and digitization of landslides using images available on Google Earth Pro, captured between 2014 and 2022, bringing the total inventory to 101 critical points. The locations of these events were recorded, imported, and analyzed using the specialized software ArcGIS Pro 3.2.0, and are presented as georeferenced points using the Magna Sirgas – National Origin projection.
2.4. Landslide inventory Mapping
The inventory and distribution of landslides along the Zipaquirá – Pacho road corridor were developed through visual interpretation of Google Earth Pro images, detailed field assessments, and the implementation of a mobile application that faciliated the capture of both event locations and their typology based on the type of mass movement (landslide). This process resulted in a database with 101 landslide event records collected along the road corridor.
In this study, 71 (70%) of the landslides were used to train landslide susceptibility models, while the remaining 30 (30%) were used for model validation, as illustrated in Figure 2 (see figure 2: Landslide inventory map).
2.5. Causal Factors of Landslides
The identification of these factors is a critical step that significantly influences the application of the model. In this process, 13 conditioning factors were considered, allowing us to determine landslide susceptibility around the road corridor. These factors are based specifically on geo-environmental conditions and the Digital Elevation Model (DEM). They were converted to a raster format with a cell size of 12.5 × 12.5 meters. The datasets and their sub-classes are presented in Table 2 (see Table 2: Weights of Each Landslide Causal Factor and Its Sub-Classes by the WoE and IV Methods).
These conditioning factors are often effectively derived from satellite images and the DEM [23]. In this study, a DEM derived from Alos Palsar—one of the many cartographic resources available from the Japanese Aerospace Exploration Agency's ALOS satellite—with a spatial resolution of 12.5 meters was utilized.
2.6. Raster Geodatabase
The construction of geodatabases is a fundamental element in landslide susceptibility mapping [45]. As part of this process, a database was created encompassing all causal factors such as slope, aspect, curvature, and land cover (see Figure 3), along with field data collected via a mobile application supported by Survey 123 (ArcGIS Sur-vey123 is part of Esri’s geospatial cloud, based on smart XLSForm-based forms). This resulted in a landslide inventory map within the ArcGIS Pro GIS environment. The in-formation layers were referenced with the same projection system (Magna Sirgas, Na-tional Origin projection) and pixel size (12.5x12.5 meters) for the corresponding data analysis (see Figure 3: Layers of causal factors for assessment of susceptibility, Zipaquirá – Pacho: a) elevation; b) slope; c) aspect; d) flow lenght; e) flow accumulation; f) insolation; g) sen2p; h) distance to faults; i) distance to folds; j) distance to rivers; k) ground cover; l) geology; m) geomorphology).
3. Results
Using both methods—namely, the Weights of Evidence (WoE) method and the Information Value (IV) method—weight values were determined for each subclass, indicating their influence on landslide generation in the study area. Thirteen causal factors were considered for predicting and generating the zoning map. Table 1 outlines the parameters for each type of causal factor. The obtained weight values reflect the number of pixels associated with landslides and their distribution across each causal factor class. In this context, the calculated weights reveal that most factors exhibit ranges where landslide occurrence is probable, with a generally random distribution and specific concentrations within certain ranges (see Table 3: Weights of Each Landslide Causal Factor and Its Sub-Classes by the WoE and IV Methods).
3.1. Landslide Suceptibility Zoning Map
The objective of this mapping is to identify areas or zones that are susceptible to landslides. To create the map, a range of factors was considered to understand where landslides occur and to assess the extent of the problem. Additionally, potential causal factors—such as elevation, slope, and geology—were identified. Finally, both past and recent events were documented using available data sources. The map was generated using Esri’s ArcGIS Pro tool, with the spatial reference system Magna Sirgas – National Origin (see Figure 4: Landslide Susceptibility Zoning Map).
The zoning map was classified into five susceptibility zones: very low (rare), low (unlikely), moderate (possible), high (likely), and very high (almost certain). This classification was achieved by reclassifying the data using natural breaks, which established the aforementioned ranges (see Table 4: Description of the Zones of the Landslide Susceptibility Map).
As shown in the landslide susceptibility zoning map, the high and very high susceptibility zones, based on the raster units, represent 19.71% and 19.62% of the area, respectively, for the WoE model, and 26.55% and 17.57% for the IV model. Of the 101 landslide event records captured along the road corridor, the density distribution shows a gradual increase from the very low to the very high susceptibility zones. Only 5 event points fall within the low to very low susceptibility ranges for the WoE model, and only 1 for the IV model. Most events are concentrated in the high and very high susceptibility zones, with a total of 88 events for the WoE model and 90 for the IV model.
3.2. Mitigation and Risk Management Strategies in Landslide Suceptibility Zones
The zoning map highlights the areas affected by these events, indicating zones that are highly dangerous for users of the road corridor. In such areas, the establishment of settlements and urban development should be avoided. In zones where low or very low susceptibility is detected, the slopes are gentle, reducing the risk; however, mitigation measures—such as proper surface water management—are still required. In areas with moderate susceptibility, the slopes are more pronounced, increasing the risk of ground instability. Therefore, it is essential not only to manage surface water effectively but also to implement additional measures, such as slope stabilization, drainage works, revegetation, and bioengineering projects, to reduce the likelihood of failure. In zones marked with high and very high susceptibility, the steeper slopes further increase the risk of instability, necessitating the aforementioned measures along with specific protection and stabilization works—such as shotcrete and anchored walls—which should be designed based on prior geotechnical and geological studies.
4. Discussion
A landslide susceptibility map without validation is meaningless in the scientific community [47], making the validation process crucial for assessing model accuracy using various techniques [45]. In this study, 70% of the landslide events (71 events) were used to train the susceptibility model, while the remaining 30% (30 events) were reserved for validation, maintaining a random spatial distribution.
Validation of the landslide susceptible zones produced by the IV and WoE models was performed using the receiver operating characteristic (ROC) curve method—specifically, by calculating the area under the curve (AUC). This statistical tool is widely used to estimate the accuracy of presence/absence predictive models [48,49]. An AUC value between 0.9 and 1 indicates excellent performance; between 0.8 and 0.9, very good performance; between 0.7 and 0.8, good performance; between 0.6 and 0.7, average performance; and between 0.5 and 0.6—or equal to or less than 0.5—poor performance [45,50]. In this study, based on ROC curve analysis, the AUC values for both models exceeded 81%, indicating very good performance for landslide prediction (see Figure 5: Validation of the Methods Using the ROC Curve).
The landslide susceptibility zoning map for the Zipaquirá–Pacho road corridor in the department of Cundinamarca was prepared using both the Weight of Evidence (WoE) and the Information Value (IV) methods. This map incorporates a variety of causal factors related to the study area’s specific characteristics, such as geomorphology, geology, and elevation. When comparing these two GIS-based statistical models, it is evident that both are widely used for landslide susceptibility mapping and zoning, although each has limitations. For instance, Wubalem and Meten (2020) note that the Information Value method cannot determine the direct relationship between landslide factors and occurrences; while it provides insights into the influence of each factor class on landslide occurrence and predicts the probability of each class contributing to a landslide, it does not indicate which factor is most influential.
The accuracy of the two models demonstrates nearly equal predictive ability, with values of 81.21% for the WoE method and 81.79% for the IV method—suggesting that the IV method is slightly more effective. In this study, the success rate curve value for the IV method was 82.23%, while its prediction rate curve value was 81.79%. In comparison, the WoE method yielded a prediction rate curve value of 81.51% and a success rate curve value of 82.67%. The close similarity between the curves for both methods may be attributed to the use of the same dataset for both analyses. Ultimately, while our primary focus was on generating the susceptibility zoning map for the road corridor rather than solely on model accuracy, we recognize the importance of validation. Therefore, the Information Value model outperforms the logistic regression model in predicting the probability of landslide occurrences.
5. Conclusions
The landslide susceptibility zoning of the road corridor enabled the identification of areas potentially prone to landslides—an essential step for developing disaster prevention and mitigation plans in the study area. In this study, using two methods—the Weight of Evidence (WoE) method and the Information Value (IV) method—a GIS-based landslide susceptibility zoning map was developed for the Zipaquirá–Pacho road corridor in the department of Cundinamarca. The results indicate a direct relationship between landslide susceptibility and certain causal factors, such as soil conditions.
The landslide susceptibility zoning map was classified into five levels: very low, low, moderate, high, and very high. Overlay analysis of the test data revealed that the high and very high susceptibility zones encompassed more than 88% of the analyzed landslides for both methods. Validation using the area under the ROC curve (AUC) indicated that both models achieved AUC values above 81%, demonstrating very good predictive performance for landslide occurrence.
Overall, the study’s findings show that landslide susceptibility analysis and zoning have significant implications for disaster prevention and mitigation in the affected area. By predicting and identifying zones of high and very high susceptibility, local authorities can prioritize resource allocation to these critical areas and enhance monitoring and early warning systems for landslides. The high predictive accuracy demonstrated by both models provides robust scientific support for developing effective prevention strategies and for strengthening control and mitigation measures, particularly in high-risk zones.
Author Contributions
Project administration, investigation, data curation, and writing—original draft preparation, S.V.; software, formal analysis, and resources, S.V.; validation, and supervision, A.R., F.N.,M.R.; conceptualization, and visualization, S.V. M.R.; writing—review and editing, S.V, M.R..; methodology, S.V, A.R., M.R and F.N authors have read and agreed to the published version of the manuscript.
Funding
This research received no external funding.
Institutional Review Board Statement
Not applicable.
Informed Consent Statement
Not applicable.
Conflicts of Interest
The authors declare no conflicts of interest.
References
- F. C. Dai, C. F. Lee, and Y. Y. Ngai, ‘Landslide risk assessment and management: an overview’, Eng Geol, vol. 64, no. 1, pp. 65–87, Apr. 2002. [CrossRef]
- Hungr, R. Fell, R. Couture, and E. Erik, Landslide Risk Management. CRC Press, 2005. [CrossRef]
- J. Corominas et al., ‘Recommendations for the quantitative analysis of landslide risk’, Bulletin of Engineering Geology and the Environment, Nov. 2013. [CrossRef]
- Roccati, G. Paliaga, F. Luino, F. Faccini, and L. Turconi, ‘GIS-Based Landslide Susceptibility Mapping for Land Use Planning and Risk Assessment’, Land (Basel), vol. 10, no. 2, p. 162, Feb. 2021. [CrossRef]
- M. Rossi, F. Guzzetti, P. Reichenbach, A. C. Mondini, and S. Peruccacci, ‘Optimal landslide susceptibility zonation based on multiple forecasts’, Geomorphology, vol. 114, no. 3, pp. 129–142, Jan. 2010. [CrossRef]
- F. Guzzetti, P. F. Guzzetti, P. Reichenbach, F. Ardizzone, M. Cardinali, and M. Galli, ‘Estimating the quality of landslide susceptibility models’, Geomorphology, vol. 81, no. 1–2, pp. 166–184, Nov. 2006. [CrossRef]
- IRPI – Istituto Di Ricerca per La Protezione Idrogeologica, "Landslide susceptibility models and maps," Available online: https://www.irpi.cnr.it/en/focus/landslide-susceptibility/, accessed May 23, 2024.
- P. Reichenbach, M. Rossi, B. D. Malamud, M. Mihir, and F. Guzzetti, ‘A review of statistically-based landslide susceptibility models’, Earth Sci Rev, vol. 180, pp. 60–91, May 2018. [CrossRef]
- A Brenning, “Spatial prediction models for landslide hazards: review, comparison and evaluation”, Nat. Hazards Earth Syst. Sci., vol. 5, núm. 6, pp. 853–862, 2005.
- P. Reichenbach, M. Rossi, B. D. Malamud, M. Mihir, and F. Guzzetti, ‘A review of statistically-based landslide susceptibility models’, Earth Sci Rev, vol. 180, no. 2, pp. 60–91, May 2018. [CrossRef]
- USGS,– United States Geological Survey, "Landslide Hazards Program. What are landslides & how can they affect me?" Available online: https://www.usgs.gov/programs/landslide-hazards/what-a-landslide, accessed June 2, 2024.
- IDIGER – District Institute for Risk Management and Climate Change, "General Characterization of the Risk Scenario for Mass Movements in Bogotá," Available online: https://www.idiger.gov.co/rmovmasa, accessed April 2, 2024.
- NSTS, ‘Generalities about landslides. National Geological Service of El Salvador, Government of El Salvador.’ [Online]. Available: https://www.snet.gob.sv/Geologia/Deslizamientos/Info-basica/3-generalidades.htm#:~:text=Es la deformación que sufre,y la aparición de grietas.
- C. F. Barella, F. G. Sobreira, and J. L. Zêzere, ‘A comparative analysis of statistical landslide susceptibility mapping in the southeast region of Minas Gerais state, Brazil’, Bulletin of Engineering Geology and the Environment, vol. 78, no. 5, pp. 3205–3221, Jul. 2019. [CrossRef]
- K. Gaidzik and M. T. Ramírez-Herrera, ‘The importance of input data on landslide susceptibility mapping’, Sci Rep, vol. 11, no. 1, p. 19334, Sep. 2021. [CrossRef]
- S. Kanwal, S. Atif, and M. Shafiq, ‘GIS based landslide susceptibility mapping of northern areas of Pakistan, a case study of Shigar and Shyok Basins’, Geomatics, Natural Hazards and Risk, vol. 8, no. 2, pp. 348–366, Dec. 2017. [CrossRef]
- L. Cascini, ‘Applicability of landslide susceptibility and hazard zoning at different scales’, Eng Geol, vol. 102(3–4), 2008. [CrossRef]
- L. Ayalew and H. Yamagishi, ‘The application of GIS-based logistic regression for landslide susceptibility mapping in the Kakuda-Yahiko Mountains, Central Japan’, Geomorphology, vol. 65, no. 1–2, pp. 15–31, Feb. 2005. [CrossRef]
- L. Highland and P. Bobrowsky, ‘The landslide handbook – A guide to understanding landslides’, Reston, vol. Virginia, 2014. https://pubs.usgs.gov/circ/1325/pdf/C1325_508.pdf.
- J. Dou et al., ‘Optimization of Causative Factors for Landslide Susceptibility Evaluation Using Remote Sensing and GIS Data in Parts of Niigata, Japan’, PLoS One, vol. 10, no. 7, p. e0133262, Jul. 2015. [CrossRef]
- D. Costanzo, E. Rotigliano, C. Irigaray, J. D. Jiménez-Perálvarez, and J. Chacón, ‘Factors selection in landslide susceptibility modelling on large scale following the gis matrix method: application to the river Beiro basin (Spain)’, Natural Hazards and Earth System Sciences, vol. 12, no. 2, pp. 327–340, Feb. 2012. [CrossRef]
- J. Dou, T. Oguchi, Y. S. Hayakawa, S. Uchiyama, H. Saito, and U. Paudel, ‘GIS-Based Landslide Susceptibility Mapping Using a Certainty Factor Model and Its Validation in the Chuetsu Area, Central Japan’, in Landslide Science for a Safer Geoenvironment, Cham: Springer International Publishing, 2014, pp. 419–424. [CrossRef]
- Addis, ‘GIS-Based Landslide Susceptibility Mapping Using Frequency Ratio and Shannon Entropy Models in Dejen District, Northwestern Ethiopia’, Journal of Engineering, vol. 2023, pp. 1–14, Feb. 2023. [CrossRef]
- N. Getachew and M. Meten, ‘Weights of evidence modeling for landslide susceptibility mapping of Kabi-Gebro locality, Gundomeskel area, Central Ethiopia’, Geoenvironmental Disasters, vol. 8, no. 1, p. 6, Dec. 2021. [CrossRef]
- H. Khan, M. Shafique, M. A. Khan, M. A. Bacha, S. U. Shah, and C. Calligaris, ‘Landslide susceptibility assessment using Frequency Ratio, a case study of northern Pakistan’, The Egyptian Journal of Remote Sensing and Space Science, vol. 22, no. 1, pp. 11–24, Apr. 2019. [CrossRef]
- B. Neuhäuser and B. Terhorst, ‘Landslide susceptibility assessment using “weights-of-evidence” applied to a study area at the Jurassic escarpment (SW-Germany)’, Geomorphology, vol. 86, no. 1–2, pp. 12–24, Apr. 2007. [CrossRef]
- J. P. Londoño-Linares, Modelización de problemas ambientales en entornos urbanos: deslizamientos de tierra en ciudades andinas, Ph.D. dissertation, UPC, Institut Universitari de Recerca en Ciència i Tecnologies de la Sostenibilitat, 2016. Available: http://hdl.handle.net/2117/98123.
- F. Mengistu, K. V. Suryabhagavan, T. K. Raghuvanshi, and E. Lewi, ‘Landslide Hazard Zonation and Slope Instability Assessment using Optical and InSAR Data: A Case Study from Gidole Town and its Surrounding Areas, Southern Ethiopia’, Remote Sensing of Land, vol. 3, no. 1, pp. 1–14, Jan. 2019. [CrossRef]
- H. Omar, B. K. Huat, Z. M. Yusoff, M. Safaei, and V. Ghiasi, "Deterministic rainfall-induced landslide approaches, advantages and limitations," Electronic Journal of Geotechnical Engineering, vol. 16, no. U, pp. 1619–1650, 2011. ISSN: 1089-3032.
- L. Shano, T. K. Raghuvanshi, and M. Meten, ‘Landslide susceptibility evaluation and hazard zonation techniques – a review’, Geoenvironmental Disasters, vol. 7, no. 1, p. 18, Dec. 2020. [CrossRef]
- R. K. Dahal, S. Hasegawa, A. Nonomura, M. Yamanaka, T. Masuda, and K. Nishino, ‘GIS-based weights-of-evidence modelling of rainfall-induced landslides in small catchments for landslide susceptibility mapping’, Environmental Geology, vol. 54, no. 2, pp. 311–324, Mar. 2008. [CrossRef]
- P. Goyes-Peñafiel and A. Hernandez-Rojas, ‘Landslide susceptibility index based on the integration of logistic regression and weights of evidence: A case study in Popayan, Colombia’, Eng Geol, vol. 280, p. 105958, Jan. 2021. [CrossRef]
- Y. Cao, X. Wei, W. Fan, Y. Nan, W. Xiong, and S. Zhang, ‘Landslide susceptibility assessment using the Weight of Evidence method: A case study in Xunyang area, China’, PLoS One, vol. 16, no. 1, p. e0245668, Jan. 2021. [CrossRef]
- G. Rahman, A. U. Rahman, A. S. Bacha, S. Mahmood, M. F. U. Moazzam, and B. G. Lee, ‘Assessment of Landslide Susceptibility using Weight of Evidence and Frequency Ratio Model in Shahpur Valley, Eastern Hindu Kush’, Jul. 08, 2020. [CrossRef]
- Yalcin, ‘GIS-based landslide susceptibility mapping using analytical hierarchy process and bivariate statistics in Ardesen (Turkey): Comparisons of results and confirmations’, Catena (Amst), vol. 72, no. 1, pp. 1–12, Jan. 2008. [CrossRef]
- M.-L. Lin and C.-C. Tung, ‘A GIS-based potential analysis of the landslides induced by the Chi-Chi earthquake’, Eng Geol, vol. 71, no. 1–2, pp. 63–77, Jan. 2004. [CrossRef]
- J. L. Zêzere et al., ‘Integration of spatial and temporal data for the definition of different landslide hazard scenarios in the area north of Lisbon (Portugal)’, Natural Hazards and Earth System Sciences, vol. 4, no. 1, pp. 133–146, Mar. 2004. [CrossRef]
- S. Jade and S. Sarkar, ‘Statistical models for slope instability classification’, Eng Geol, vol. 36, no. 1–2, pp. 91–98, Nov. 1993. [CrossRef]
- L. Yu, Y. Wang, and B. Pradhan, ‘Enhancing landslide susceptibility mapping incorporating landslide typology via stacking ensemble machine learning in Three Gorges Reservoir, China’, Geoscience Frontiers, vol. 15, no. 4, p. 101802, Jul. 2024. [CrossRef]
- F. Hou, G. Wu, and S. Zhang, "Assessment of landslide susceptibility in the Jinsha River gorge section based on the information method," Sichuan Arch., vol. 39, pp. 147–150, 2019.
- J. Zhang, J. Qian, Y. Lu, X. Li, and Z. Song, ‘Study on Landslide Susceptibility Based on Multi-Model Coupling: A Case Study of Sichuan Province, China’, Sustainability, vol. 16, no. 16, p. 6803, Aug. 2024. [CrossRef]
- Laltanpuia, ‘Printed in India Bivariate statistical models for Landslide susceptibility mapping at local scale in the Aizawl municipal area, Mizoram, India.’, 2024.
- P. N. Flentje, A. Miner, G. Whitt, and R. Fell, "Guidelines for landslide susceptibility," Hazard and Risk Zoning for Land Use Planning, vol. 42, no. 1, 2007.
- P. K. Rai, K. C. Mohan, and V. K. Kumra, ‘Landslide hazard and its mapping using remte sensing and GIS’, 2014. [Online]. Available: https://api.semanticscholar.org/CorpusID:28488330.
- Wubalem, ‘Landslide susceptibility mapping using statistical methods in Uatzau catchment area, northwestern Ethiopia’, Geoenvironmental Disasters, vol. 8, no. 1, p. 1, Dec. 2021. [CrossRef]
- F. Castro-Venegas, E. Jaque, J. Quezada, J. L. Palma, and A. Fernández, ‘Multi-source landslide inventories for susceptibility assessment: a case study in the Concepción Metropolitan Area, Chile’, Front Earth Sci (Lausanne), vol. 13, Feb. 2025. [CrossRef]
- Wubalem and M. Meten, ‘Landslide susceptibility mapping using information value and logistic regression models in Goncha Siso Eneses area, northwestern Ethiopia’, SN Appl Sci, vol. 2, no. 5, p. 807, May 2020. [CrossRef]
- H. Shahabi and M. Hashim, ‘Landslide susceptibility mapping using GIS-based statistical models and Remote sensing data in tropical environment’, Sci Rep, vol. 5, no. 1, p. 9899, Apr. 2015. [CrossRef]
- H. Shahabi, S. Khezri, B. Bin Ahmad, and M. Hashim, ‘RETRACTED: Landslide susceptibility mapping at central Zab basin, Iran: A comparison between analytical hierarchy process, frequency ratio and logistic regression models’, Catena (Amst), vol. 115, pp. 55–70, Apr. 2014. [CrossRef]
- E. Yesilnacar and T. Topal, ‘Landslide susceptibility mapping: A comparison of logistic regression and neural networks methods in a medium scale study, Hendek region (Turkey)’, Eng Geol, vol. 79, no. 3–4, pp. 251–266, Jul. 2005. [CrossRef]
Figure 1.
Workflow of Methodology adopted in the study.

Figure 2.
Landslide inventory map.
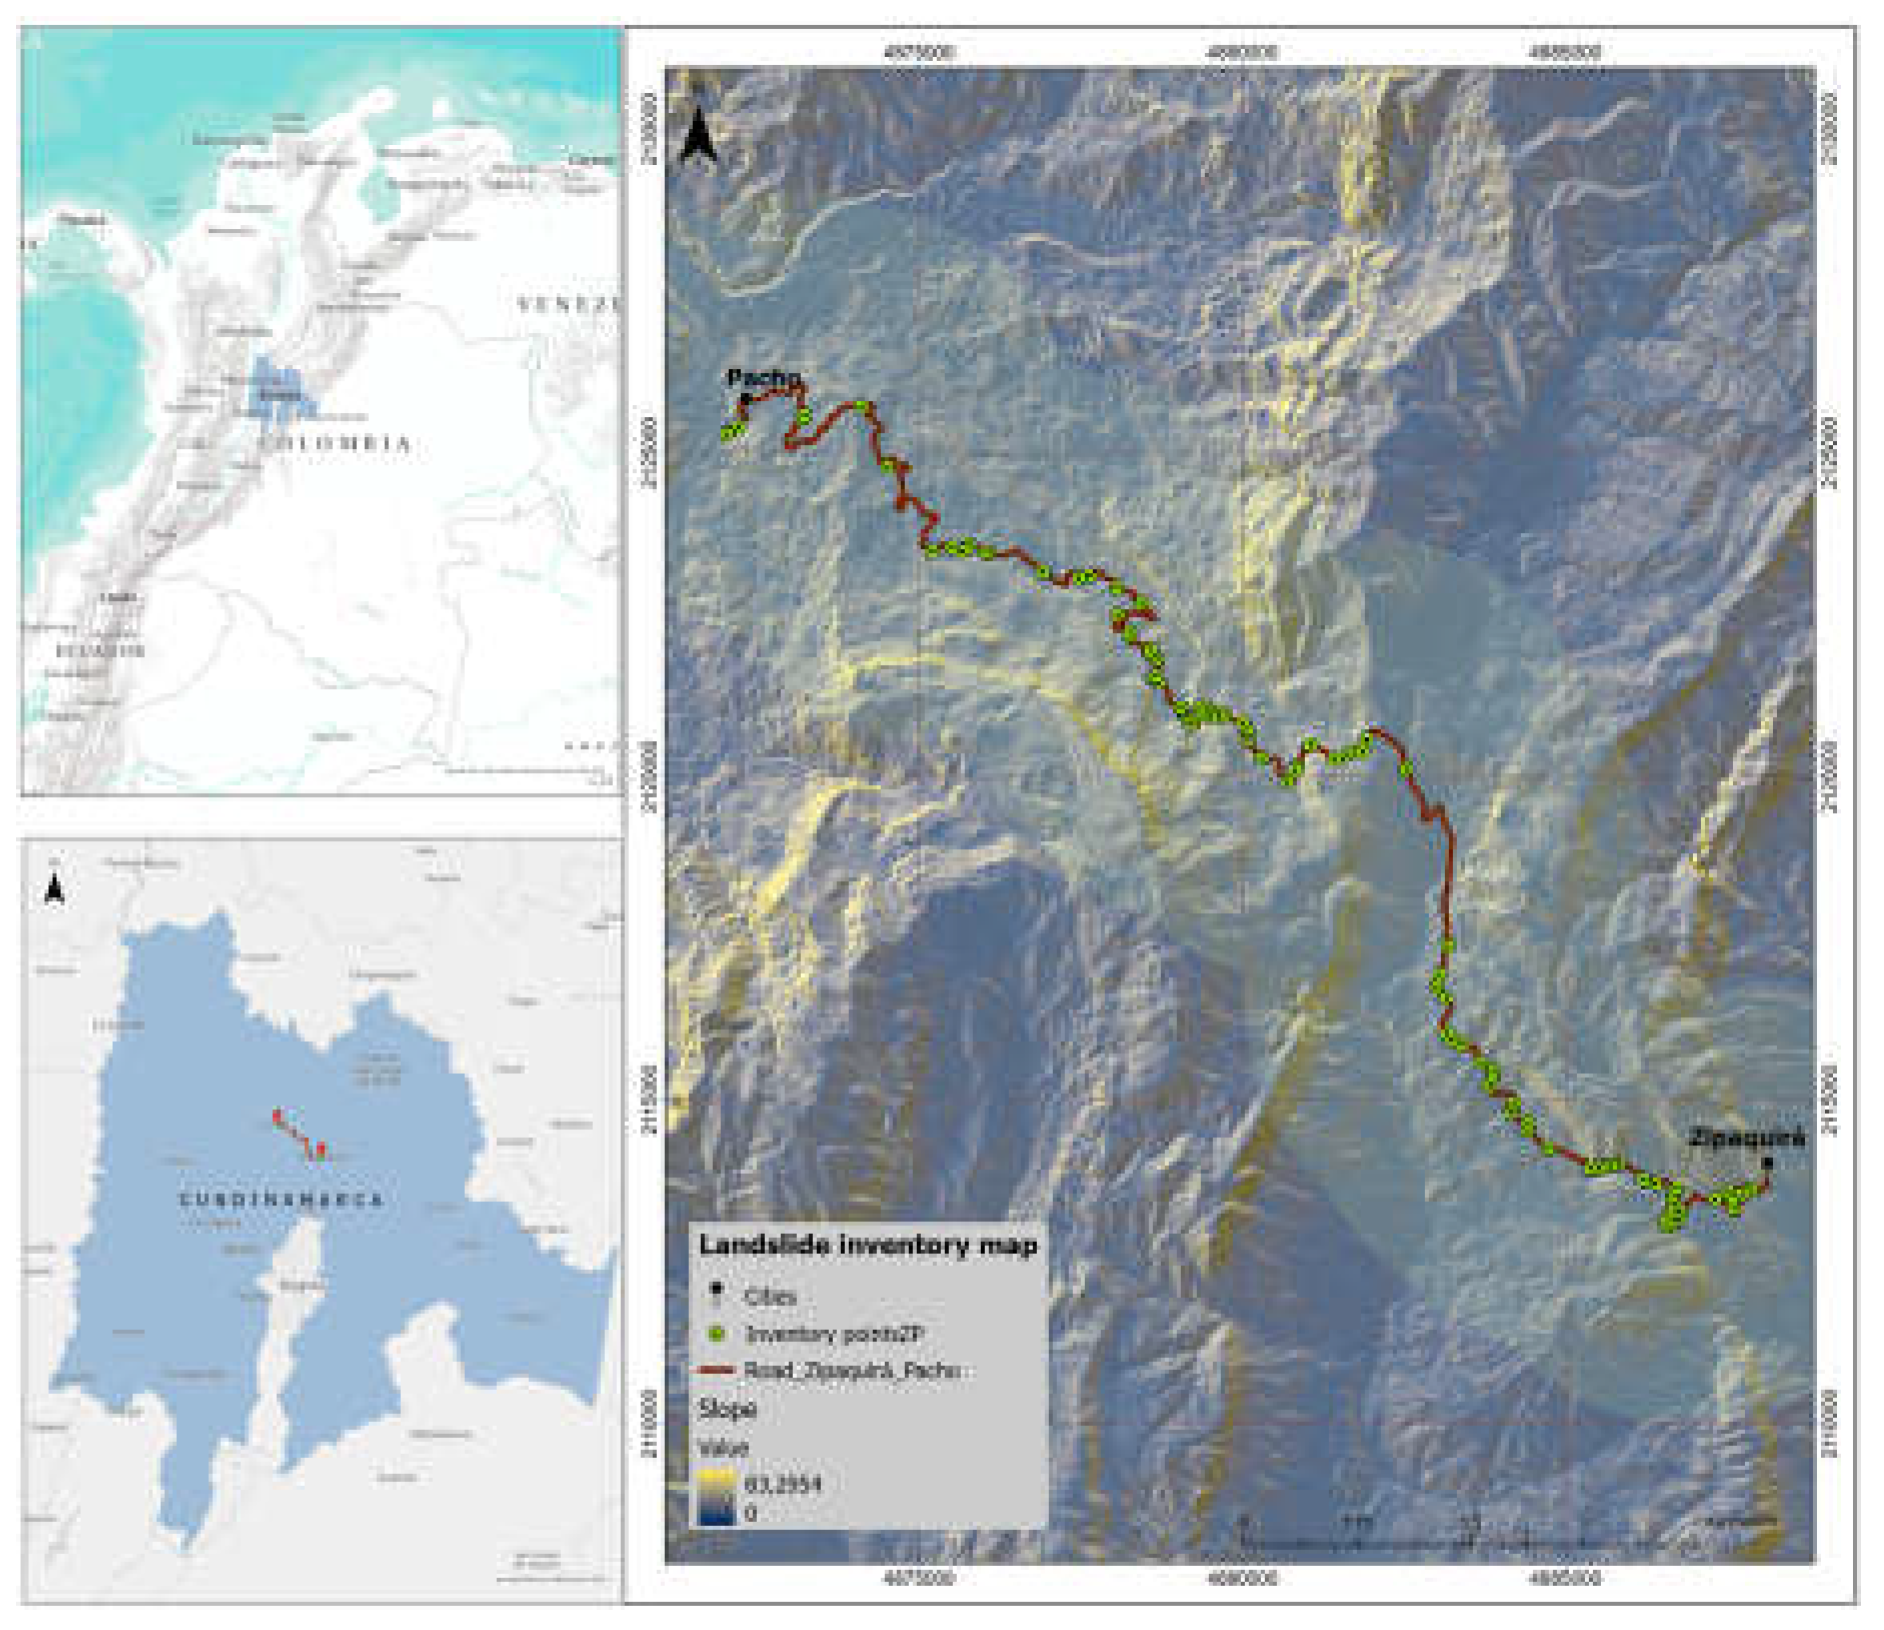
Figure 3.
Layers of causal factors for assessment of susceptibility, Zipaquirá – Pacho: a) elevation; b) slope; c) aspect; d) flow lenght; e) flow accumulation; f) insolation; g) sen2p; h) distance to faults; i) distance to folds; j) distance to rivers; k) ground cover; l) geology; m) geomorphology.
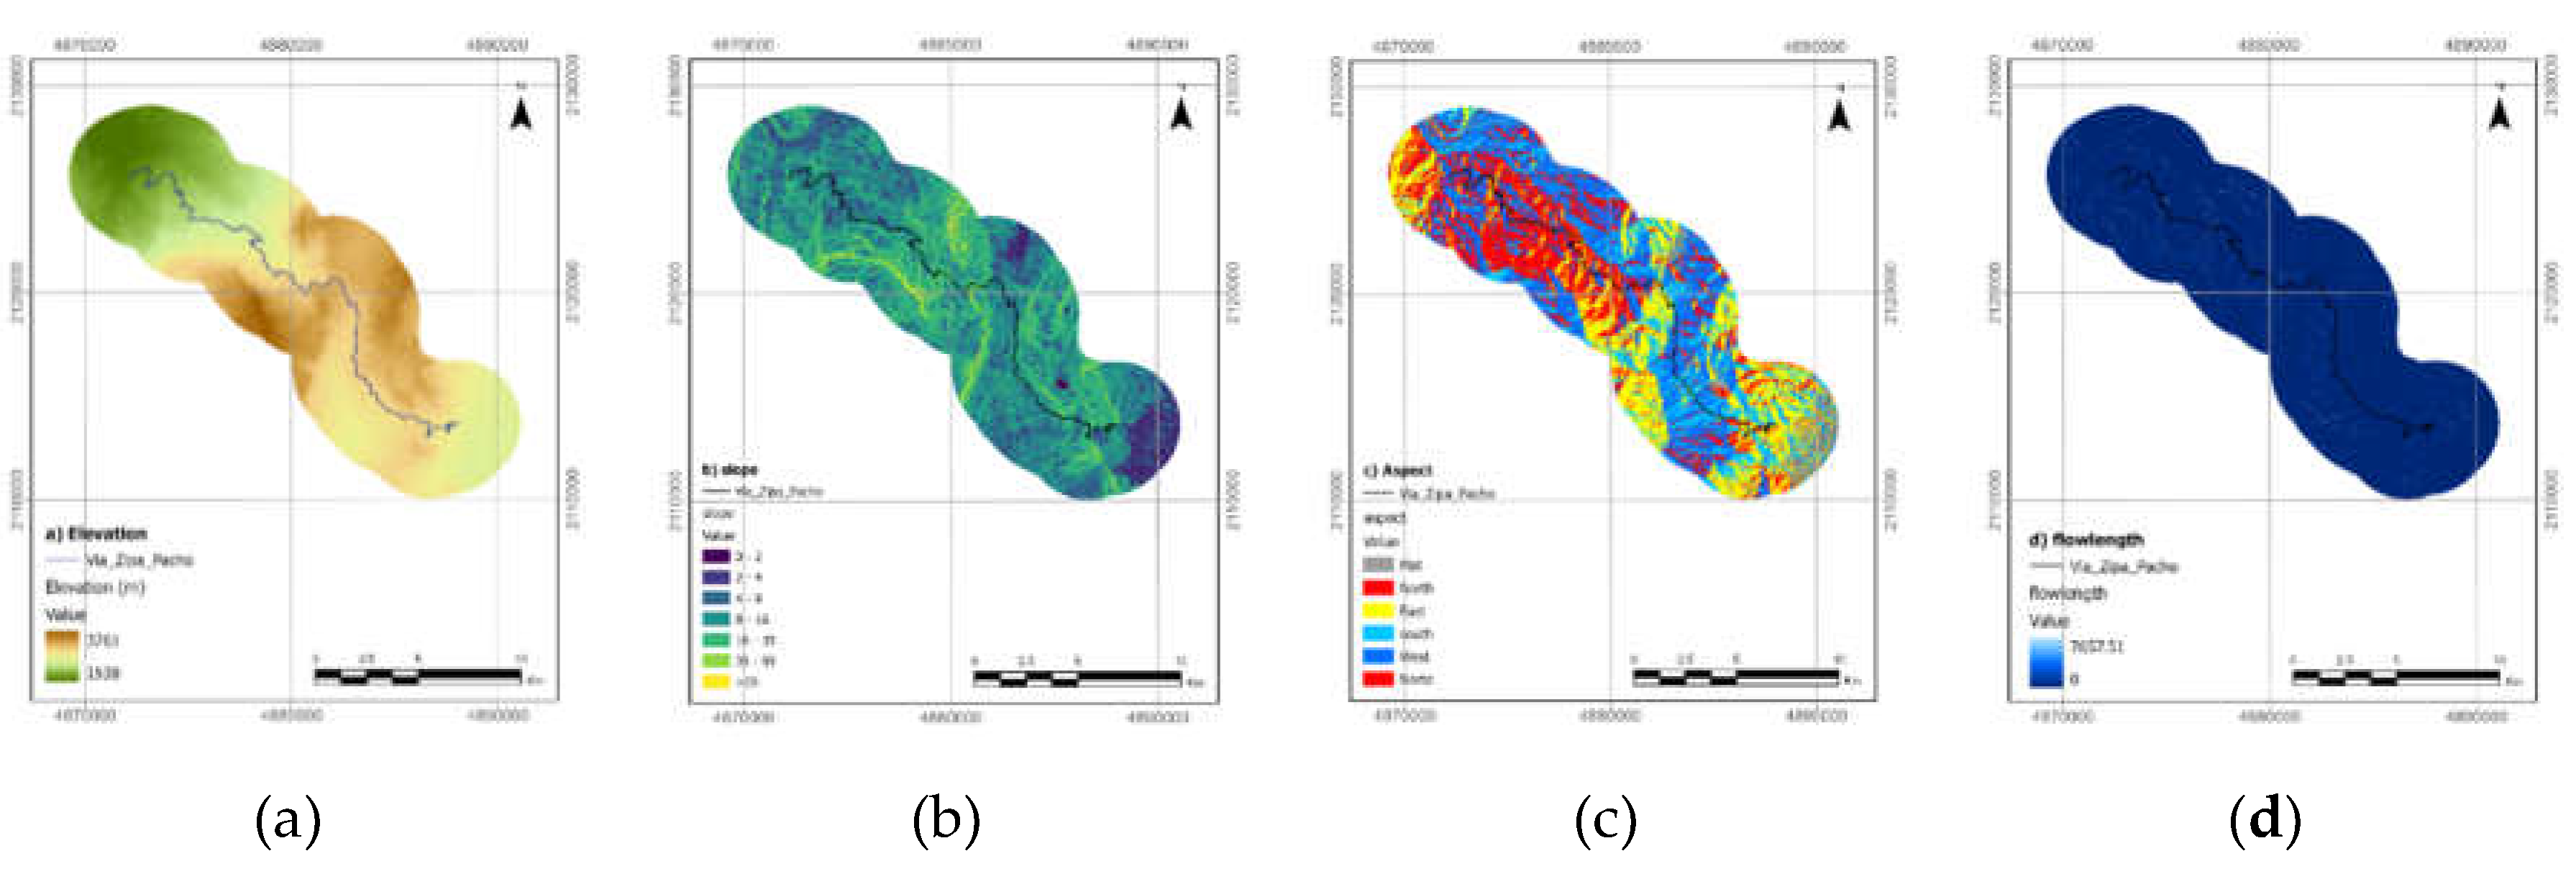
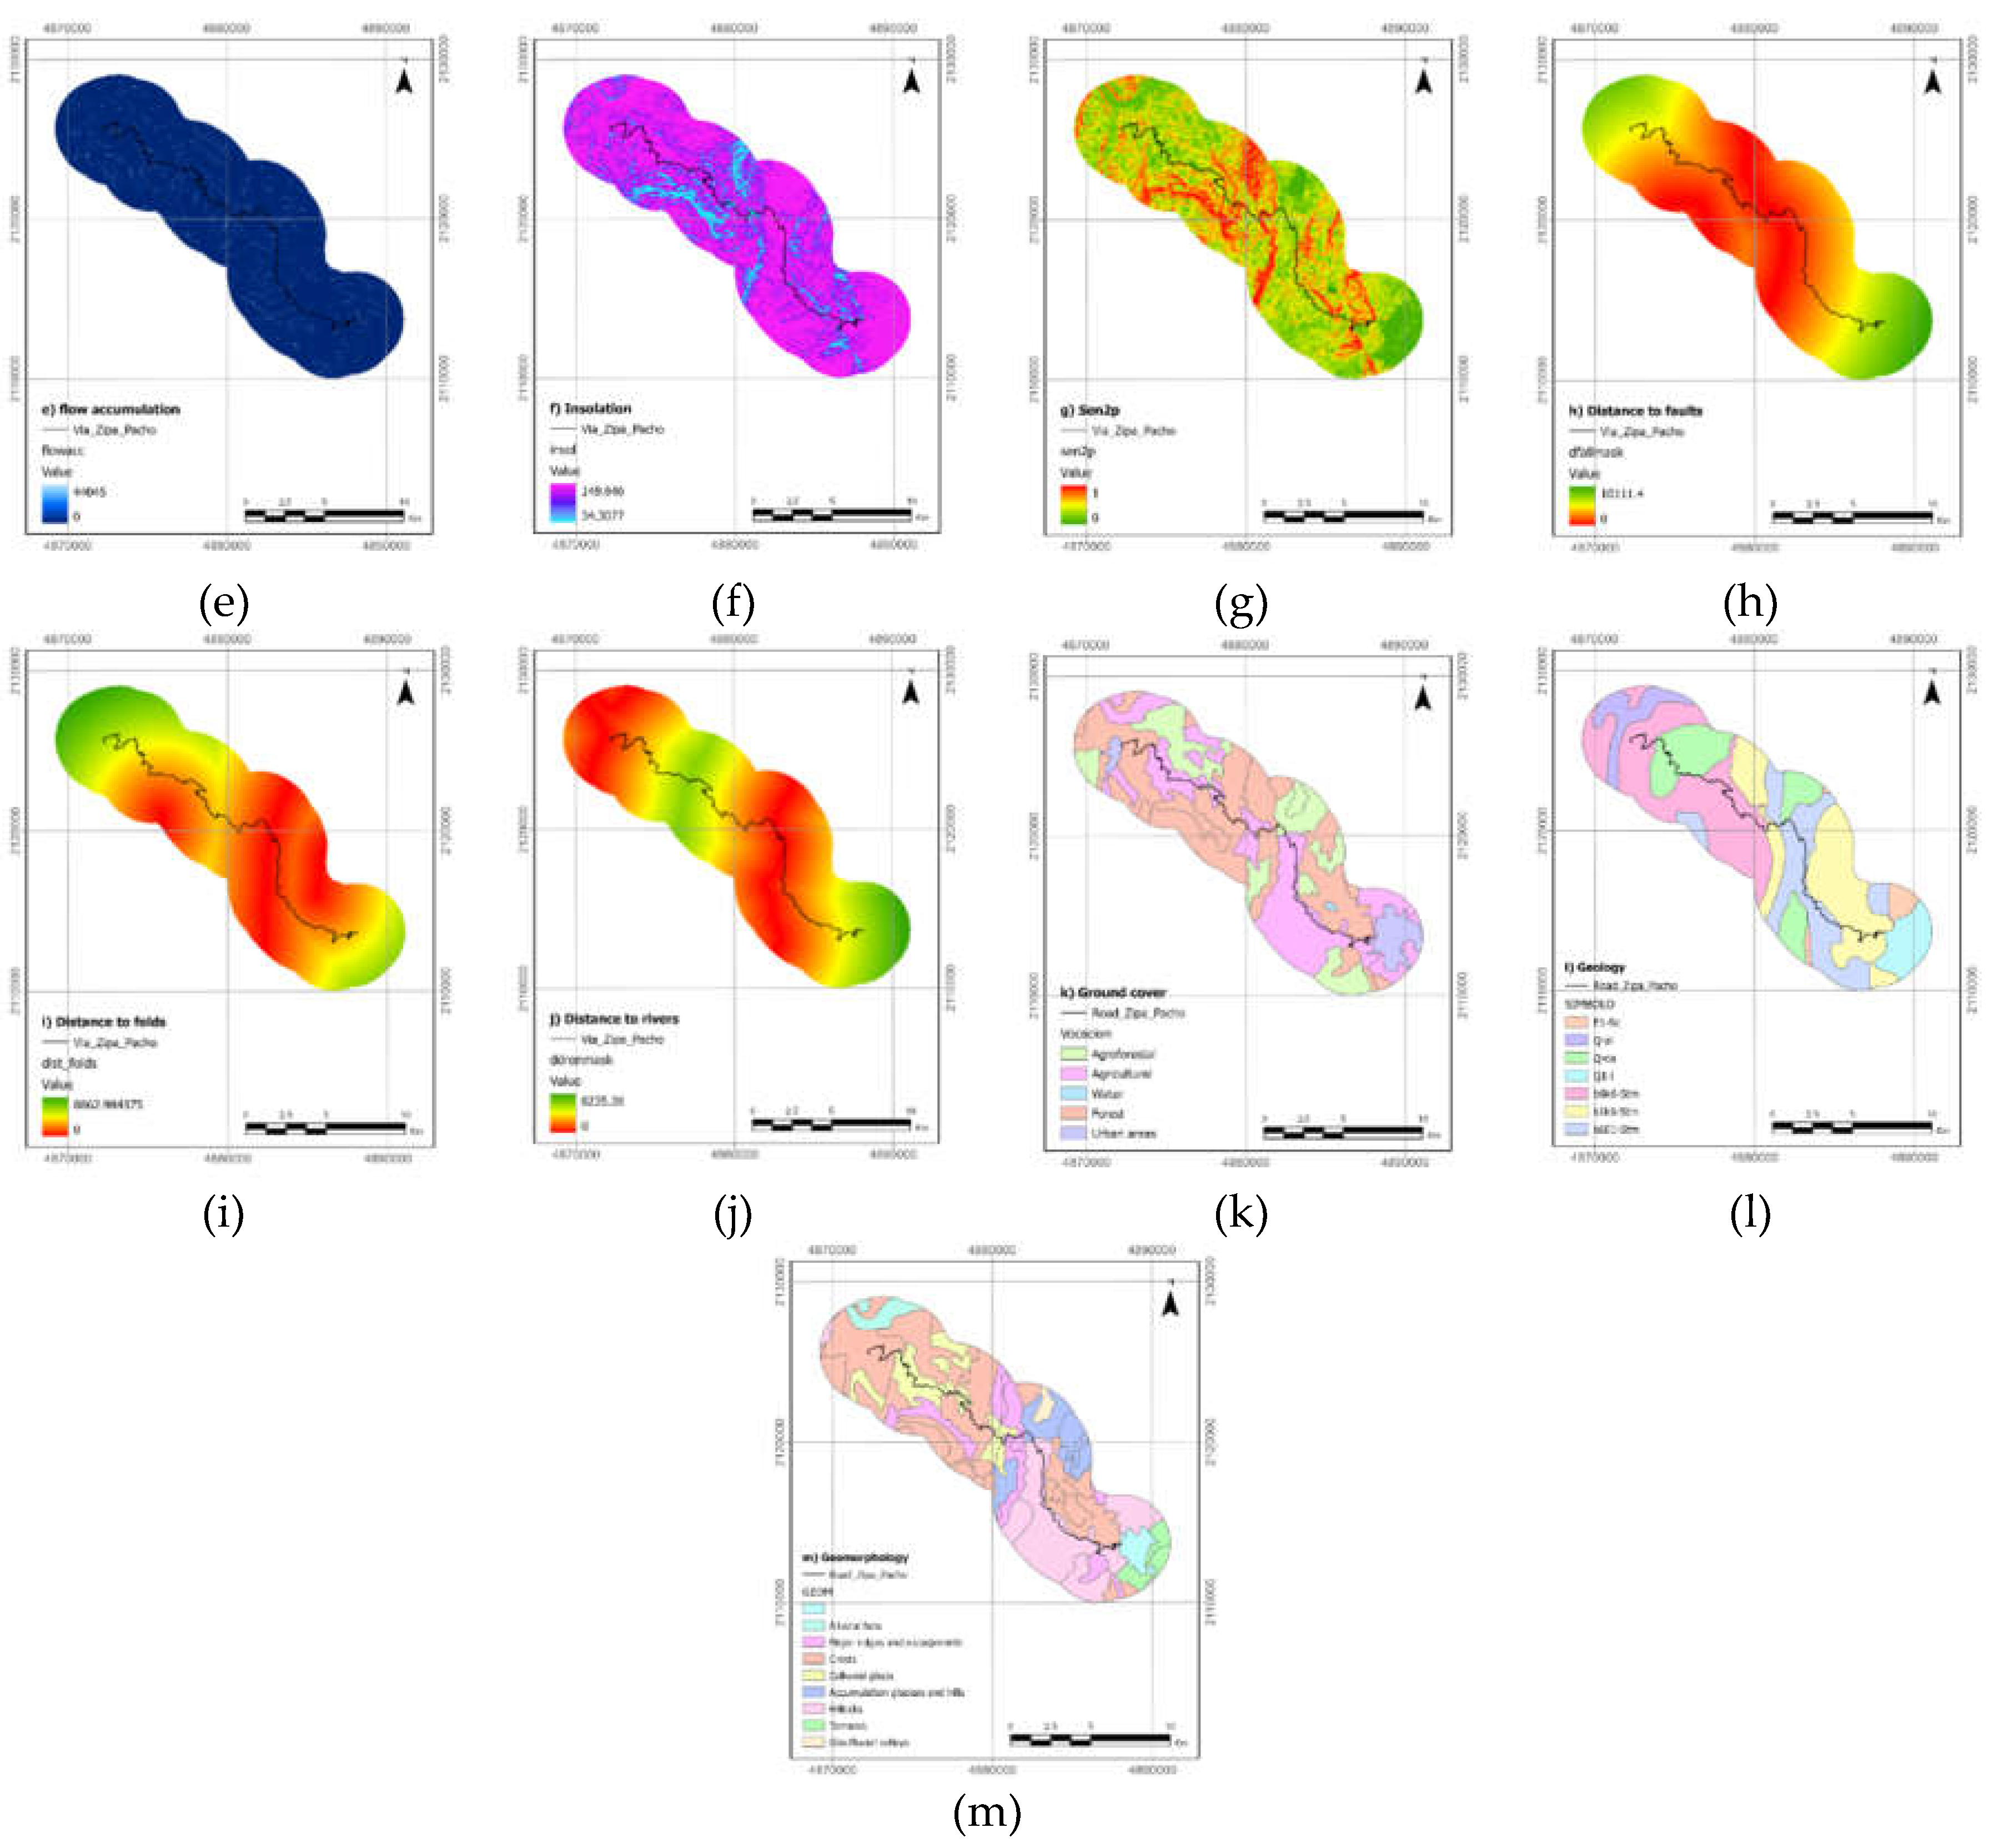
Figure 4.
Landslide susceptibility zoning map.
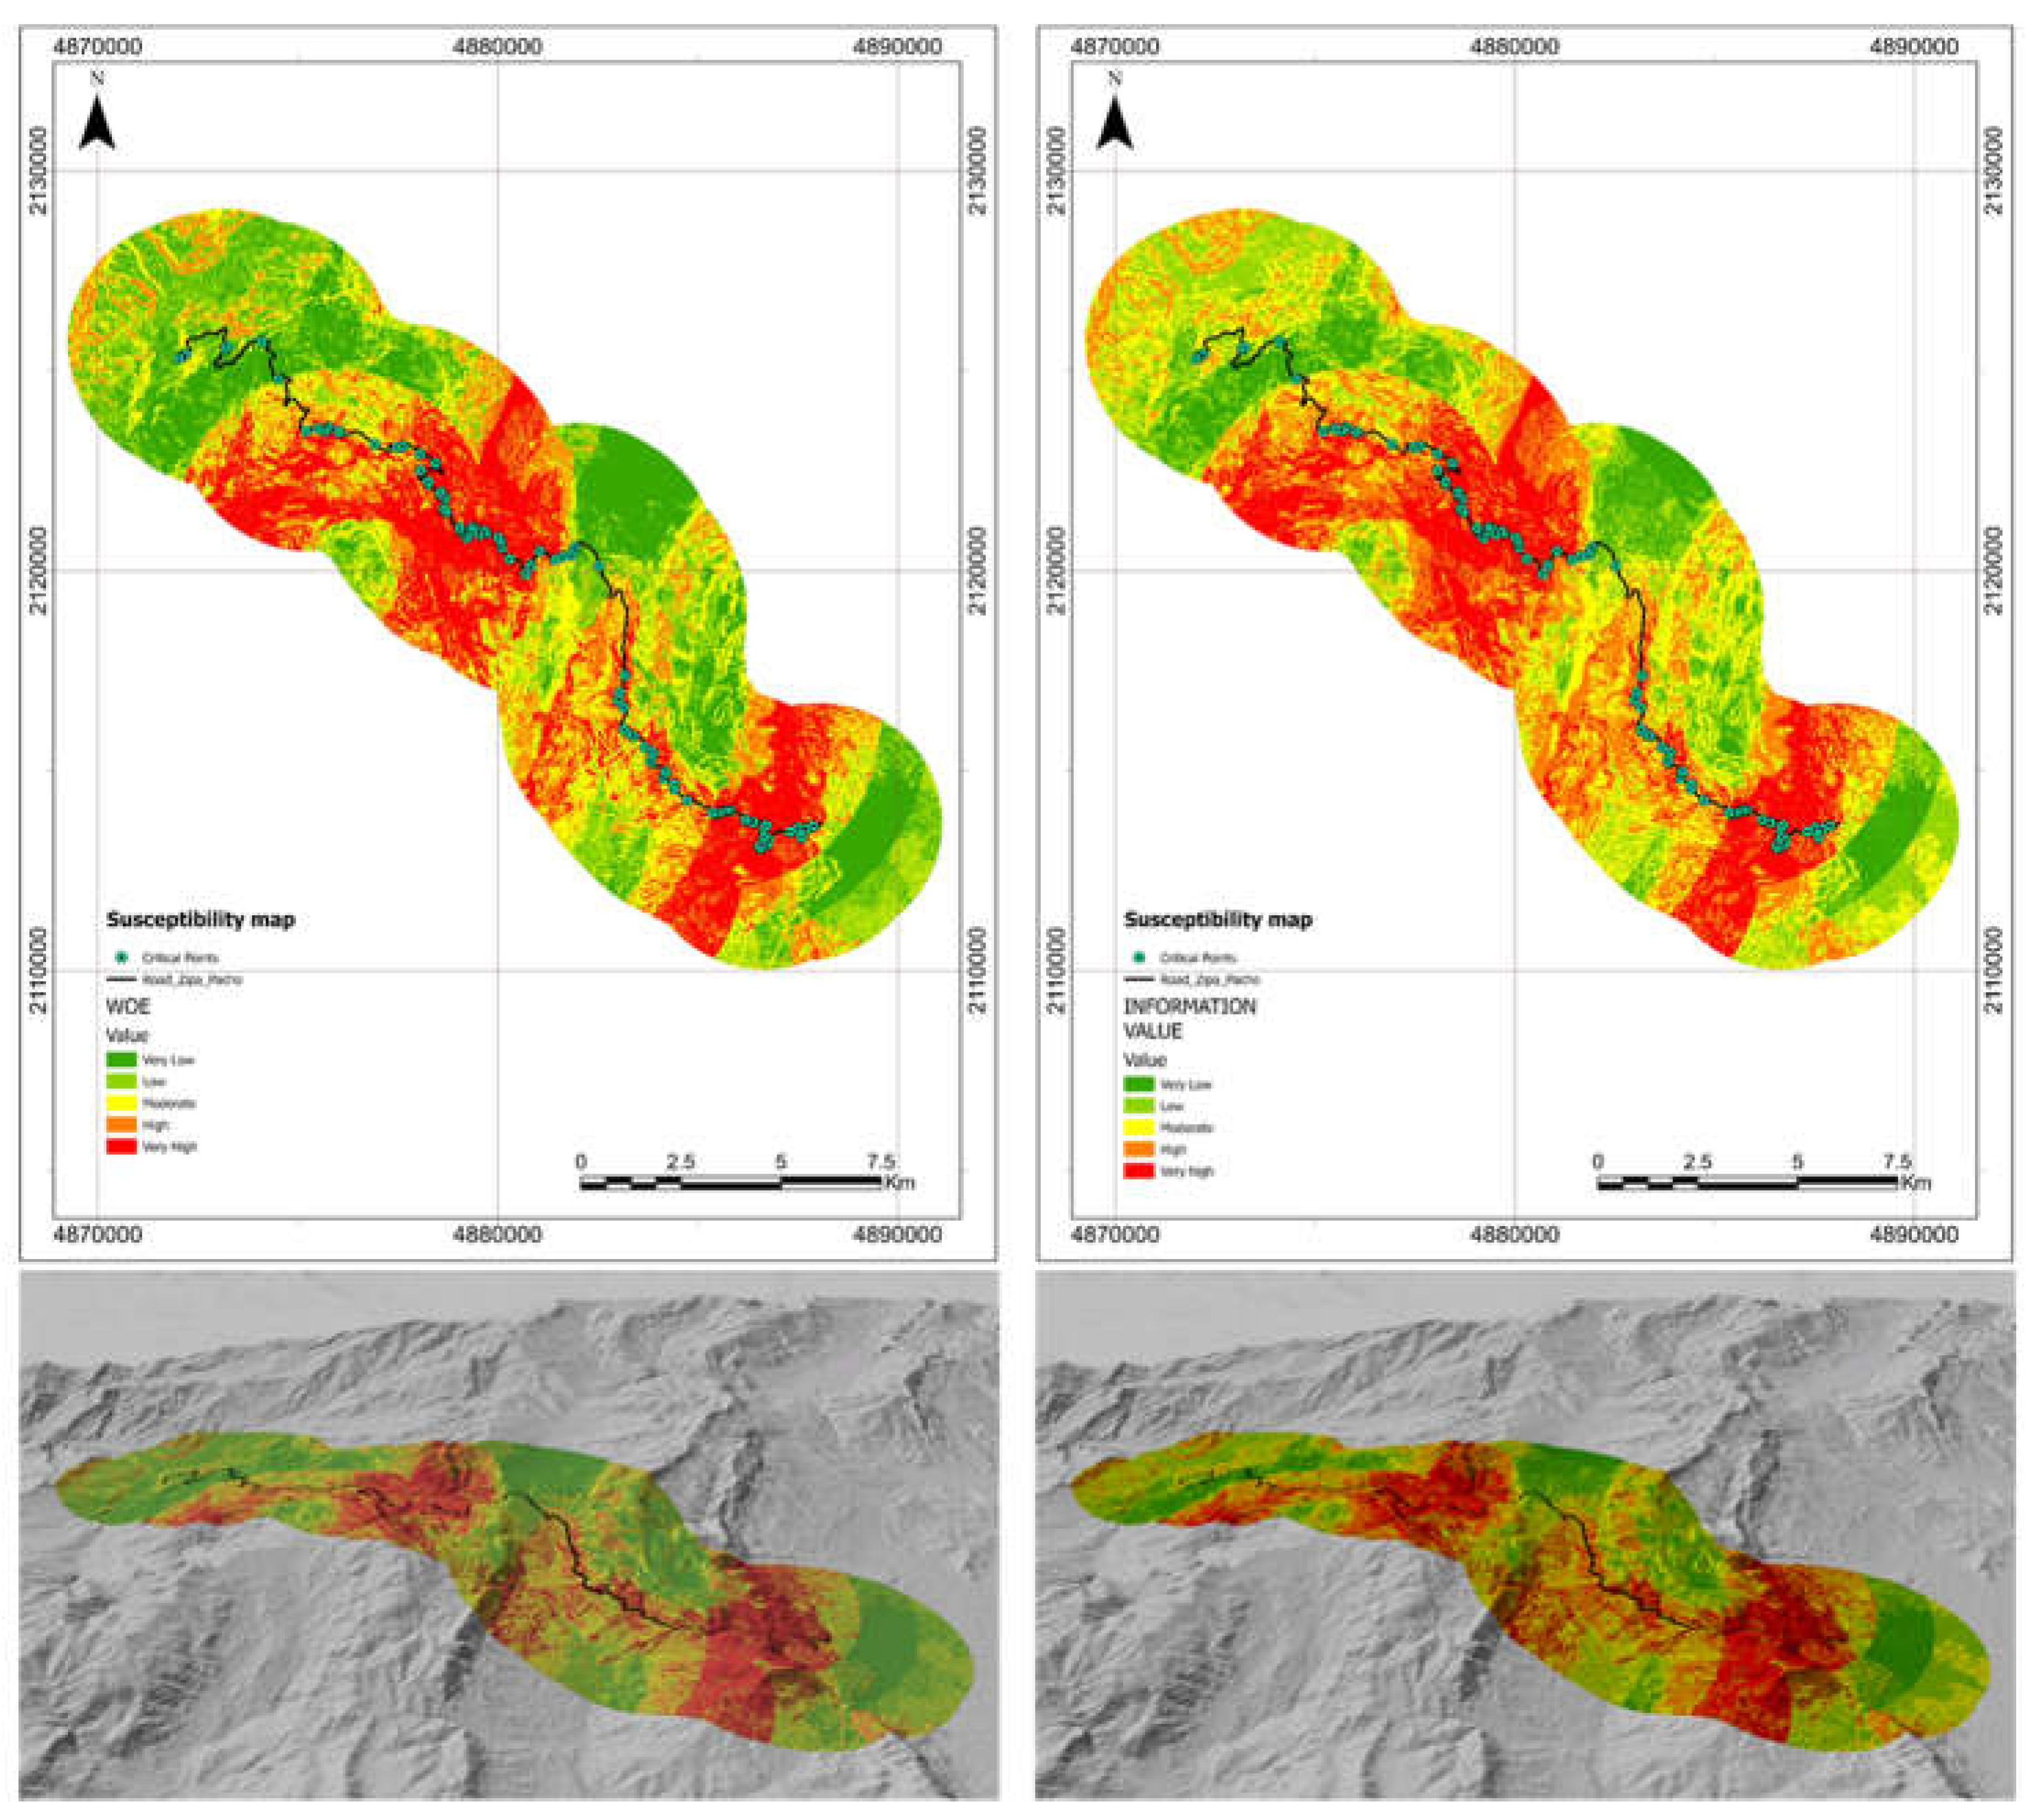
Figure 5.
Validation of the methods using the ROC curve.
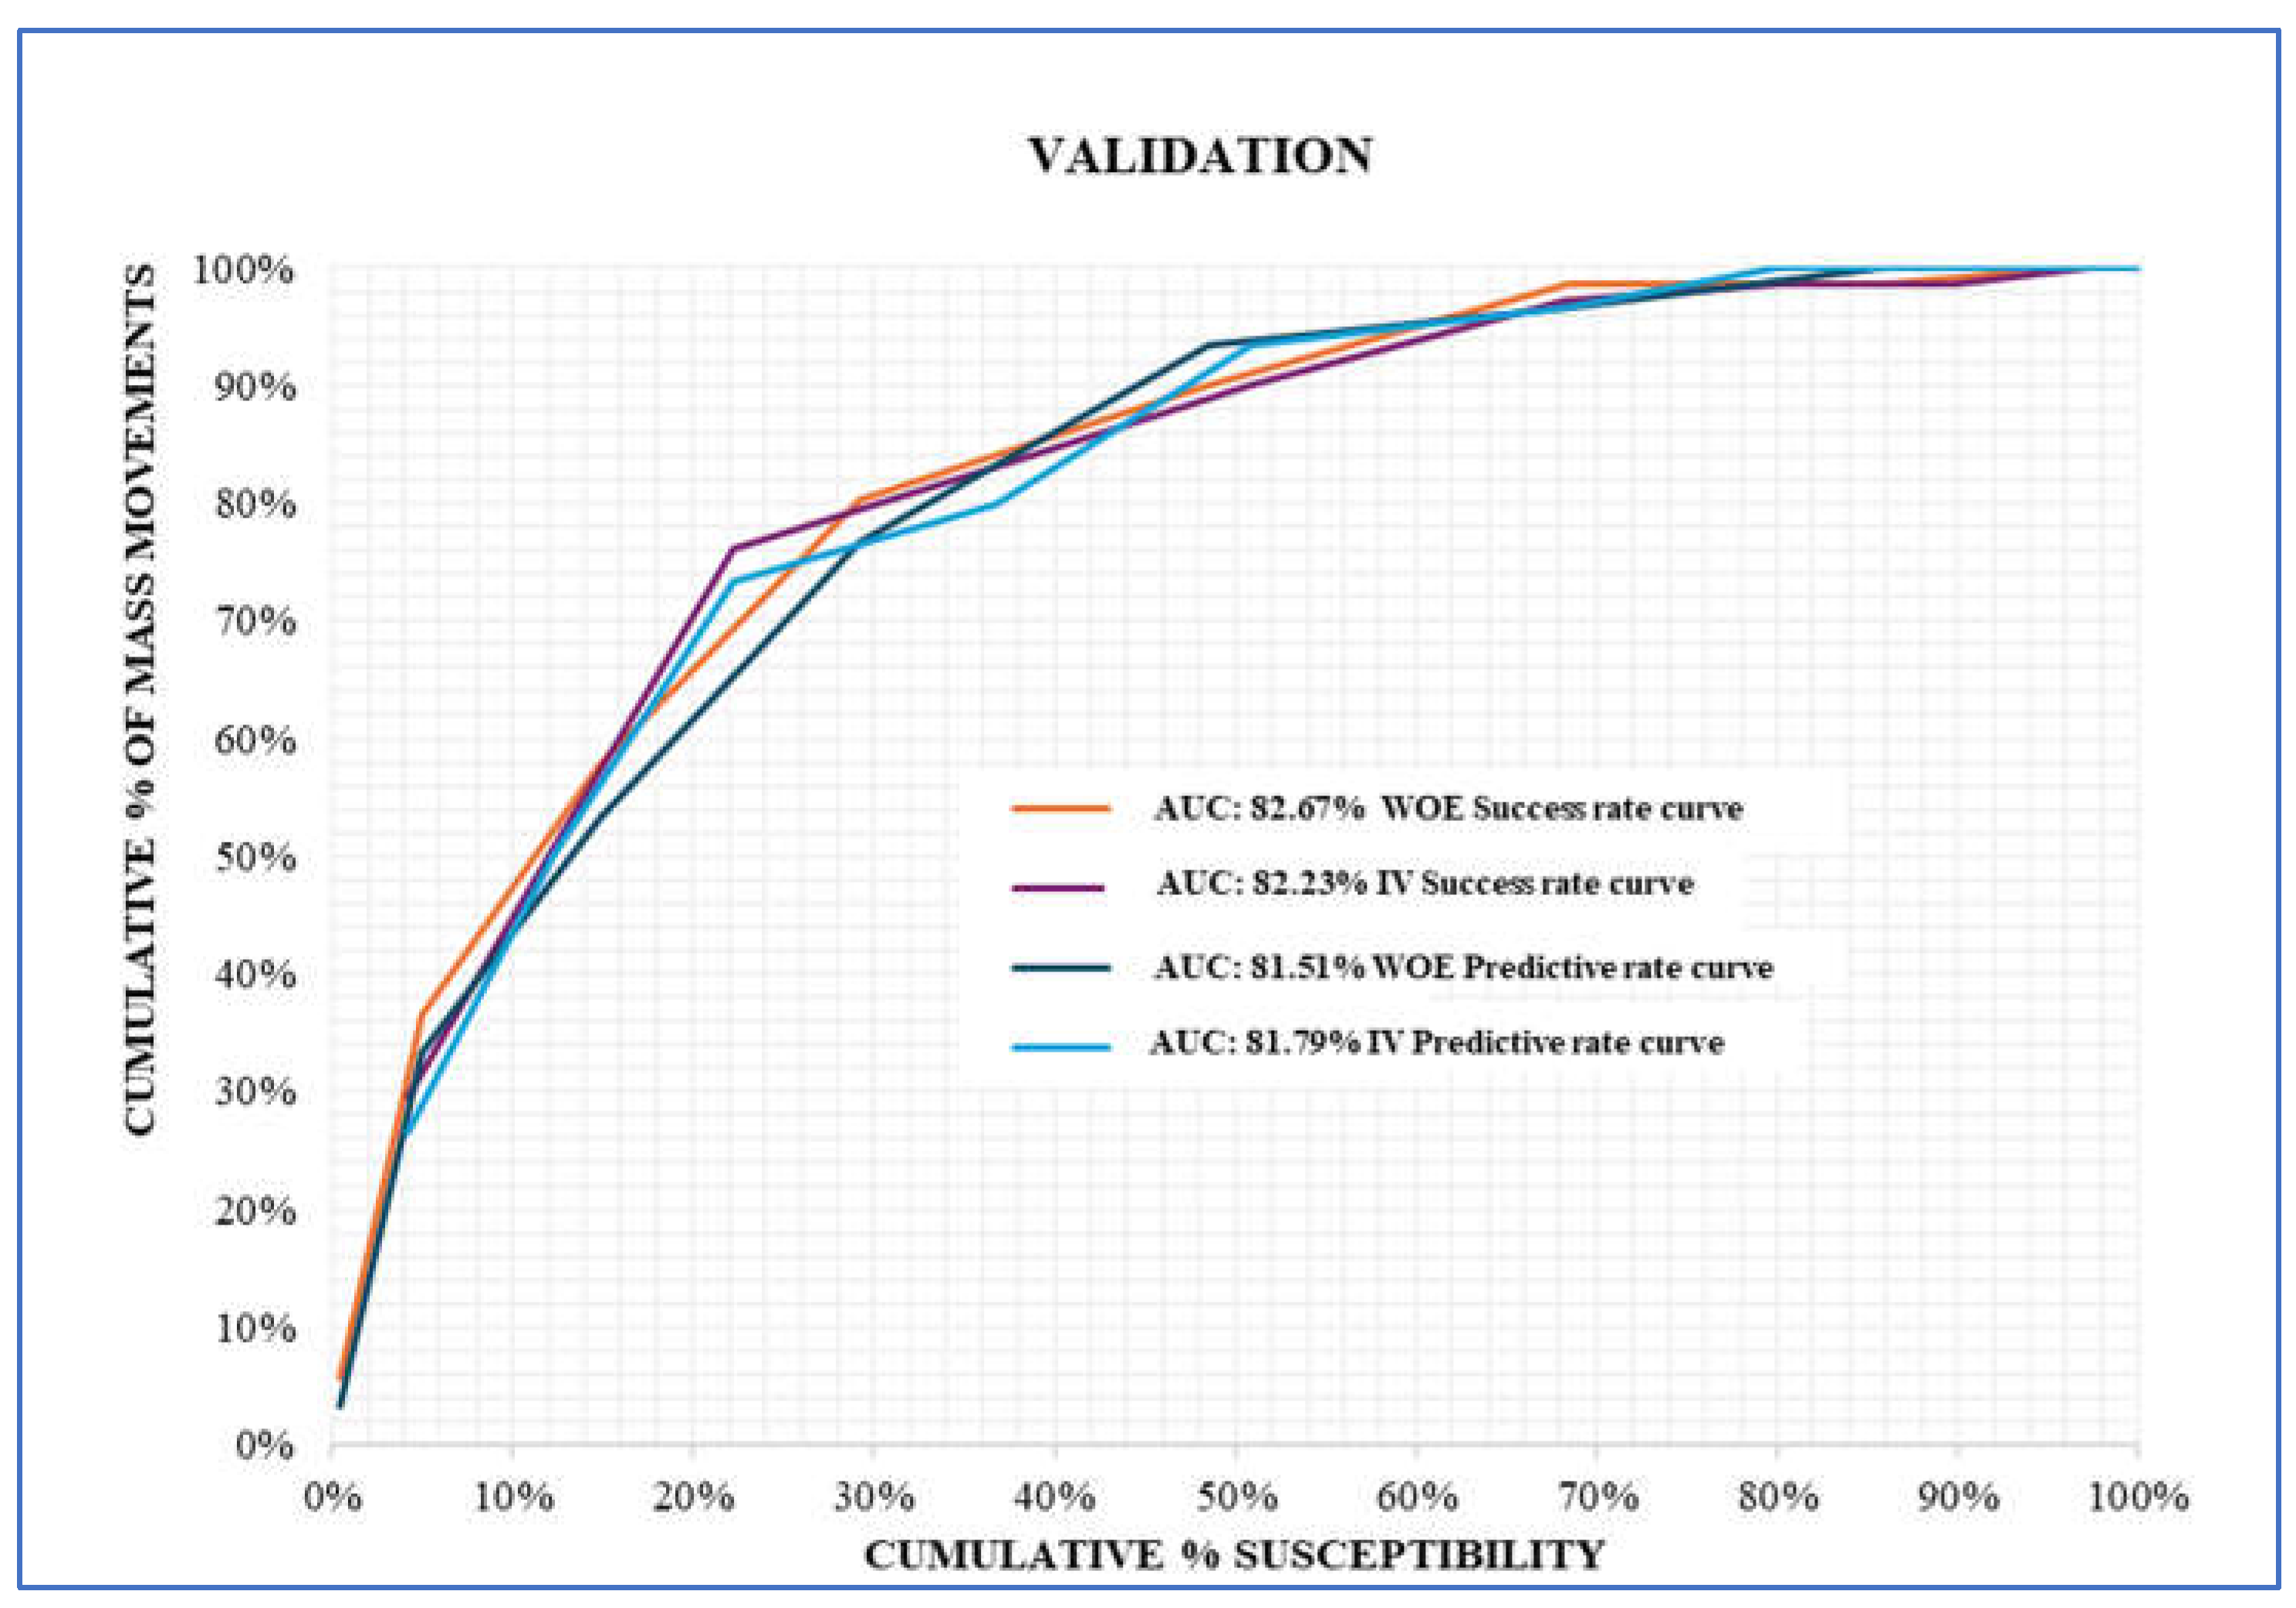

Table 1.
Examples of landslide susceptibility mapping descriptors.
| Descriptors | Frequency | Description |
| Very low | Rare | The event is conceivable, but only under exceptional circumstances. |
| Low | Unlikely | The event might occur under very adverse circumstances. |
| Moderate | Possible | The event could occur under adverse conditions. |
| High | Likely | The event will probably occur under adverse conditions. |
| Very high | Almost certain | The event is expected to occur. |
Table 2.
Weights of each landslide causal factor and its sub-classes by the WoE method.
| Causal factors | Sub-clases |
| Elevation (m) | 1538 – 1854; 1855 – 2172; 2173 – 2490; 2491 – 2807; 2808 – 3125; 3126 – 3443; 3444 - 3761 |
| Slope (degree) | 0 – 2; 2 – 4; 4 – 8; 8 – 16, 16 – 35; 35 – 55; 55 – 90 |
| Aspect (degree) | -1 – 0; 1 – 45; 45 – 135; 135 – 225; 225 – 315; 315 - 360 |
| Flow length | 0 – 694; 694 – 1090; 1090 – 1459; 1459 – 1884; 1884 – 2365; 2365 – 3084; 3084 – 7657 |
| Flow accumalate | 0 – 1009; 1009 – 2030; 2030 – 3135; 3135 – 4587; 4587 – 6638; 6638 – 10389; 10389 - 44045 |
| Insolation | 34.30 - 59.61; 59.62 - 75.53; 75.54 - 90.61; 90.62 - 105.53; 105.54 - 120.38; 120.39 - 135.15; 135.16 - 149.84 |
| Sen2P(slope) | 0 - 0.14; 0.15 - 0.28; 0.29 - 0.42; 0.43 - 0.57; 0.58 - 0.71; 0.72 - 0.85; 0.86 - 1 |
| Distance to faults | 0 – 1580; 1581 – 3005; 3006 – 4428, 4429 – 5850; 5851 – 7270; 7271 – 8689; 8690 - 10111 |
| Distance to rivers | 0 – 1308; 1309 – 2466; 2467 – 3623; 3624 – 4778; 4779 – 5932; 5933 – 7084; 7085 - 8235 |
| Distance to folds | 0 – 1399; 1400 – 2646; 2647 – 3892; 3893 – 5136; 5137 – 6379; 6380 – 7621; 7622 - 8862 |
| Ground cover | Agricultural; Agroforestry; Water body; Forest; Urban areas |
| Geology | b6k6-Stm; E1-Sc; k1k6-Stm; k6E1-Stm; Q-al; Q-ca; Q1-l |
| Geomorphology | Alluvial fans; Major ridges and scarps; Crestones, Colluvial glacis; Accumulation glacis and hills; Hills; Terraces; Glacifluvial valleys |
Table 3.
Weights of each landslide causal factor and its sub-classes by the WoE method and IV methods.
Table 3.
Weights of each landslide causal factor and its sub-classes by the WoE method and IV methods.
| Type of causal factor | Sub-classes | Number of pixels of each sub-class | Number pixels of landslides within sub-cl | Wc | IV |
| Elevation (m) | 1538 - 1854 | 75882 | 3 | -0.873 | -0.832 |
| 1855 - 2172 | 140394 | 4 | -1,254 | -1,160 | |
| 2173 - 2490 | 99974 | 8 | -0.139 | -0.127 | |
| 2491 - 2807 | 209604 | 19 | -0.003 | -0.002 | |
| 2808 - 3125 | 274427 | 61 | 1,538 | 0.895 | |
| 3126 - 3443 | 265962 | 6 | -1,605 | -1,393 | |
| 3444 - 3761 | 45498 | 0 | 0 | 0 | |
| Slope (degree) | 0 - 2 | 31924 | 0 | 0 | 0 |
| 2 - 4 | 67998 | 4 | -0.462 | -0.439 | |
| 4 - 8 | 209916 | 5 | -1,502 | -1,343 | |
| 8 - 16 | 407336 | 28 | -0.417 | -0.283 | |
| 16 - 35 | 341817 | 59 | 1,146 | 0.638 | |
| 35 - 55 | 44575 | 5 | 0.216 | 0.207 | |
| 55 - 90 | 3676 | 0 | 0 | 0 | |
| Aspect (degree) | -1 - 0 | 24789 | 1 | -0.829 | -0.816 |
| 1 - 45 | 140054 | 19 | 0.47 | 0.397 | |
| 45 - 135 | 269212 | 24 | -0.03 | -0.023 | |
| 135 - 225 | 199220 | 16 | -0.153 | -0.127 | |
| 225 - 315 | 327296 | 26 | -0.191 | -0.138 | |
| 315 - 360 | 146671 | 15 | 0.133 | 0.114 | |
| Flow length | 0 - 694 | 1088549 | 99 | 0.053 | 0.001 |
| 694 - 1090 | 11726 | 2 | 0.639 | 0.63 | |
| 1090 - 1459 | 4575 | 0 | 0 | 0 | |
| 1459 - 1884 | 2720 | 0 | 0 | 0 | |
| 1884 - 2365 | 1647 | 0 | 0 | 0 | |
| 2365 - 3084 | 1312 | 0 | 0 | 0 | |
| 3084 - 7657 | 1212 | 0 | 0 | 0 | |
| Flow accumalate | 0 - 1009 | 1097929 | 100 | 0.23 | 0.003 |
| 1009 - 2030 | 5601 | 1 | 0.681 | 0.676 | |
| 2030 - 3135 | 2875 | 0 | 0 | 0 | |
| 3135 - 4587 | 1752 | 0 | 0 | 0 | |
| 4587 - 6638 | 1364 | 0 | 0 | 0 | |
| 6638 - 10389 | 1165 | 0 | 0 | 0 | |
| 10389 - 44045 | 1055 | 0 | 0 | 0 | |
| Insolation | 34.30 - 59.61 | 149 | 0 | 0 | 0 |
| 59.62 - 75.53 | 412 | 0 | 0 | 0 | |
| 75.54 - 90.61 | 966 | 0 | 0 | 0 | |
| 90.62 - 105.53 | 2340 | 0 | 0 | 0 | |
| 105.54 - 120.38 | 9946 | 4 | 1,513 | 1,482 | |
| 120.39 - 135.15 | 52247 | 6 | 0.241 | 0.228 | |
| 135.16 - 149.84 | 1039101 | 91 | -0.547 | -0.043 | |
| Sen2P(slope) | 0 - 0.14 | 123382 | 4 | -1,112 | -1,034 |
| 0.15 - 0.28 | 214813 | 6 | -1,338 | -1,184 | |
| 0.29 - 0.42 | 224851 | 13 | -0.545 | -0.456 | |
| 0.43 - 0.57 | 212737 | 21 | 0.099 | 0.079 | |
| 0.58 - 0.71 | 141337 | 28 | 0.964 | 0.776 | |
| 0.72 - 0.85 | 100446 | 21 | 0.968 | 0.829 | |
| 0.86 - 1 | 89676 | 8 | -0.024 | -0.022 | |
| Distance to faults | 0 - 1580 | 340004 | 43 | 0.52 | 0.331 |
| 1581 - 3005 | 223550 | 20 | -0.019 | -0.015 | |
| 3006 - 4428 | 180219 | 4 | -1,546 | -1,409 | |
| 4429 - 5850 | 129473 | 21 | 0.689 | 0.58 | |
| 5851 - 7270 | 120866 | 13 | 0.192 | 0.169 | |
| 7271 - 8689 | 81404 | 0 | 0 | 0 | |
| 8690 - 10111 | 36225 | 0 | 0 | 0 | |
| Distance to rivers | 0 - 1308 | 325679 | 17 | -0.717 | -0.554 |
| 1309 - 2466 | 220204 | 17 | -0.199 | -0.163 | |
| 2467 - 3623 | 179049 | 26 | 0.591 | 0.469 | |
| 3624 - 4778 | 159248 | 33 | 1,066 | 0.825 | |
| 4779 - 5932 | 150536 | 8 | -0.599 | -0.536 | |
| 5933 - 7084 | 49427 | 0 | 0 | 0 | |
| 7085 - 8235 | 27598 | 0 | 0 | 0 | |
| Distance to folds | 0 - 1399 | 305264 | 14 | -0.855 | -0.684 |
| 1400 - 2646 | 237674 | 40 | 0.88 | 0.617 | |
| 2647 - 3892 | 203342 | 41 | 1,116 | 0.797 | |
| 3893 - 5136 | 149910 | 1 | -2,746 | -2,611 | |
| 5137 - 6379 | 114503 | 5 | -0.791 | -0.733 | |
| 6380 - 7621 | 62747 | 0 | 0 | 0 | |
| 7622 - 8862 | 38301 | 0 | 0 | 0 | |
| Ground cover | Agricultural | 348496 | 50 | 0.764 | 0.457 |
| Agroforestry | 214415 | 0 | 0 | 0 | |
| Water body | 1856 | 0 | 0 | 0 | |
| Forest | 485805 | 48 | 0.155 | 0.084 | |
| Urban areas | 61272 | 3 | -0.645 | -0.618 | |
| Geology | b6k6-Stm | 326957 | 37 | 0.328 | 0.22 |
| E1-Sc | 25779 | 0 | 0 | 0 | |
| k1k6-Stm | 265802 | 31 | 0.343 | 0.25 | |
| k6E1-Stm | 205836 | 22 | 0.204 | 0.163 | |
| Q-al | 62265 | 0 | 0 | 0 | |
| Q-ca | 160865 | 11 | -0.325 | -0.284 | |
| Q1-l | 64340 | 0 | 0 | 0 | |
| Geomorphology | Alluvial fans | 30327 | 0 | 0 | 0 |
| Major ridges and scarps | 114231 | 12 | 0.163 | 0 | |
| Crestones | 455026 | 39 | -0.097 | 0.145 | |
| Colluvial glacis | 110723 | 17 | 0.604 | -0.058 | |
| Accumulation glacis and hills | 94088 | 0 | 0 | 0.525 | |
| Hilllocks | 233719 | 33 | 0.601 | 0 | |
| Terraces | 35336 | 0 | 0 | 0.441 | |
| Glacifluvial valleys | 10994 | 0 | 0 | 0 | |
| Other | 27400 | 0 | 0 | 0 |
Table 4.
Description of the zones of landslide susceptibility map.
| Susceptibility classes | Descriptor | IV | WOE | Description | ||||
| # of pixels in each class | % area coverage | # of events in each category | # of pixels in each class | % area coverage | # of events in each category | |||
| Very low | Rare | 116.902 | 10,58 | 1 | 222.183 | 20,11 | 1 | Areas of alluvial fans and guadua formations that generally have slopes of less than 4°, as well as areas of limestone and chert with low slopes. The urban areas located in the flat part of the sector |
| Low | Unlikely | 220.464 | 19,95 | 0 | 225.503 | 20,41 | 4 | Areas of alluvial fans and Guaduas formation that generally have slopes of less than 8°, as well as areas of limestone and chert with low slopes. The urban areas are located in the flat part of the sector. |
| Moderate | Possible | 280.165 | 25,36 | 10 | 222.652 | 20,15 | 8 | Areas of alluvial fans and Guaduas formation that generally have slopes ranging from 8° to 16°. |
| High | Likely | 293.311 | 26,55 | 25 | 217.828 | 19,71 | 22 | Alluvial fans and colluvial deposits with slopes oriented to the north, covered by agriculture, claystones, shales, and limestones from the Guaduas formation. The slopes range from 16° to 55°. |
| Very hihg | Almost certain | 194.099 | 17,57 | 65 | 216.775 | 19,62 | 66 | Claystones, shales, and limestones from the Guaduas formation, with slopes between 8° and 35° and north-facing slopes. |
| Total pixel | 1.104.941 | 100 | 101 | 1.104.941 | 100 | 101 | ||
Disclaimer/Publisher’s Note: The statements, opinions and data contained in all publications are solely those of the individual author(s) and contributor(s) and not of MDPI and/or the editor(s). MDPI and/or the editor(s) disclaim responsibility for any injury to people or property resulting from any ideas, methods, instructions or products referred to in the content. |
© 2025 by the authors. Licensee MDPI, Basel, Switzerland. This article is an open access article distributed under the terms and conditions of the Creative Commons Attribution (CC BY) license (http://creativecommons.org/licenses/by/4.0/).
Copyright: This open access article is published under a Creative Commons CC BY 4.0 license, which permit the free download, distribution, and reuse, provided that the author and preprint are cited in any reuse.


