
Submitted:
01 April 2025
Posted:
02 April 2025
You are already at the latest version
Abstract
The equation of state (EOS) of metal nickel is theoretically studied up to 3000 K and concurrently 500 GPa by a direct integral approach to the partition function. The theoretical results agree very well with previous hydrostatic experiments at room temperature, and at high temperatures, the deviation between our calculated pressures and the latest hydrostatic experiments up to 109 GPa is less than 3.5%, 4.1%, and 4.6 % at 1000, 2000, and 3000 K, respectively. These results indicate our predictions at extreme conditions should be reliable. Furthermore, a universal model with only two parameters is developed to produce analytical EOS for general solids at high temperatures.
Keywords:
hydrostatic equation of state
; a direct integral approach to the partition function
; predictions for extreme conditions
; universal model for equation of state
1. Introduction
In the design of new materials, theoretical predicting the equation of state (EOS) without experimental data supporting is crucial to understand the thermodynamic properties. In fact, even for existing materials, the predictions are also necessary since experimental measurement of EOS still confronts some problems, especially at high pressures and high temperatures.
Taking nickel (Ni) as an example, it is one of the most abundant elements in the earth's core, where the temperature and pressure reaches 6000 K and 350 GPa, and Ni-based alloys have been widely applied in industries. However, rare experiments concern the EOS of Ni-based alloys, and even for the metal of pure Ni, hydrostatic measurements at room temperature are limited to 98 GPa [1] so far, and at high temperatures, there are only two sets of experiments with pulsed laser to heat the specimen, resulting in the uncertainty of the temperature measurements being as large as ~ 100 K above 1000 K [1,2], and the results of the two experiments are distinctly different.
According to the ensemble theory, the EOS and all the other thermodynamic properties of materials can be theoretically calculated from the partition function (PF) without any experimental measurement. However, this fundamental approach faces formidable computational challenges: for an N-atom system, a 3N-dimensional configuration integral is required to be solved, rendering it computationally intractable for realistic solids containing ~10²³ atoms. In spite of a century of research, this fundamental limitation persists in contemporary materials science.
The quasi-harmonic approximation (QHA) [3,4,5] has emerged as an effective compromise, achieving wide applications by simplifying lattice dynamics through harmonic vibrational modes. However, its inherent assumption of small atomic displacements becomes inadequate at elevated temperatures where anharmonic effects dominate. In fact, a recent study [6] has quantitatively demonstrated that the accuracy of QHA deteriorates progressively with both increasing temperature and atomic volume. Alternative approaches have also been developed to circumvent this limitation. The particle-in-a-cell model (PCM) [7,8,9] reduces the 3N- dimensional integral into a 3-fold one. Nevertheless, achieving the 3- dimensional integral at ab initio level remains a technical challenge. Moreover, PCM's validity is restricted to the conditions above the Debye temperature [10]. A more radical simplification appears in the classical mean field (CMF) [11,12,13,14] method, which reduces the 3-fold integral in PCM into a one-fold spherical approximation. This approach fundamentally assumes isotropic atomic interactions, a significant oversimplification that introduces substantial errors for most crystalline metals. The anisotropic nature of interatomic forces in crystalline systems, particularly along different crystallographic directions, renders CMF's spherical symmetry assumption physically inappropriate for accurate thermodynamic predictions.
In contrast to the methods mentioned above, a recently developed direct integral approach (DIA) [15] introduces a novel perspective by transforming the 3N-fold integration in PF into a 3N-dimensional effective volume, enabling the PF to be solved with ultra-high efficiency at ab initio level. Up to now, DIA has been successfully employed to calculate the EOS of several metals [15,16,17,18], argon [15], 2-D materials [19], and its success in reproducing the phase transitions of vanadium [20], zirconium [21] and aluminum [22] further highlights the accuracy of DIA. DIA without any empirical parameters works universally to any solids.
In the present work, DIA is applied to calculate the EOS of metal Ni up to 3000 K and simultaneously 500 GPa to further check the reliability of DIA and give theoretical predictions for the EOS at extreme conditions. In order to obtain an analytical EOS of the metal Ni, we applied the widely used Mie-Grüneisen-Debye (MGD) formalism [23,24,25] to fit our calculated results, which shows that one of the three parameters in the MGD model, the Debye temperature, could be removed without losing any accuracy of the fitting. Furthermore, a much more simplified and universal model is developed to produce analytical EOS for general solids.
2. Calculation Method
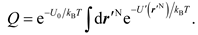
From the ensemble theory it is known that for a system containing N atoms occupying the spatial position rN = {r1, r2, …, rN}, the PF reads
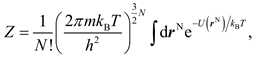 in which U(rN) is the interaction energy of the system, and m, h, kB is the atomic mass, Planck constant, and Boltzmann constant, respectively. If the configurational integral
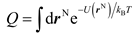 is solved, the pressure (P) as a function of V and T, i.e. the isothermal EOS could be obtained by
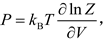 and all the other thermodynamic quantities can also be achieved without any experimental supporting.
To solve the 3N-dimentional integral in Eq. (2), an approach was developed recently by Ning et al. [15], and its essential framework is as follows.
For a crystal in an equilibrium state with the N atoms located at their ideal lattice sites RN = {R1, R2, …, RN} and the total energy of U0(RN), a transformation is firstly introaduced,
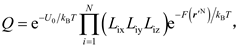
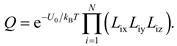
 so that r'N represents the displacements of atoms away from their equilibrium positions. Then, the Q in Eq. (2) is expressed as
Here, we define a function
 and then the 3N-fold integral in Eq. (5) turns into
 in which
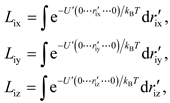 is defined as the effective length, and r'ix (r'iy or r'iz) is the x (y or z) coordinate of the ith atom away from its ideal lattice site with simultaneously the other two degrees of freedom and all the other atoms fixed at the ideal lattice sites.
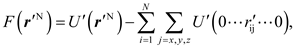
The Eq. (6) could be expanded by a Taylor series as
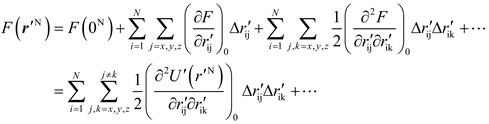
Clearly, if U'(r'N) changes slow enough with respect to r'N, ∂2U'(r'N)/∂r'ij∂r'ik and further F(r'N) would approach to zero, so that the Q of Eq. (7) is close to
To ensure Eq. (10) is a good approximation, the axes of a Cartesian coordinate system should be set as the direction along which U'(r'N) changes slowest.
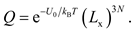
For face-centered cubic metal Ni, if the lattice orientations [100], [010] and [001] are selected as the axes of a Cartesian system, the variations of U'(r'N) along all the three axes are the slowest. Thus, Lx equals to Ly and Lz, so that
The PF calculations for Ni at specified atomic volumes is implemented through the following protocol. As illustrated in Figure 1, we constructed a perfect 3 × 3 × 3 supercell containing 27 atoms with an arbitrary volume and displaced an arbitrary atom along the [100] direction in increments of 0.05 Å until the U'(x') in Eq. (4) exceeded 3.5 eV, ensuring convergence of the effective length at 3000 K (<10-5). By varying volumes, PF as a function of V was obtained from Eqs. (1, 8, 11) and then P-V relationship could be derived from Eq. (3).
First-principles calculations were performed using the Vienna Ab initio Simulation Package (VASP) [26,27] to get the U'(x'), and the computational parameters were set as follows: (1) the projector augmented wave (PAW) pseudopotential [28,29] is used for describing the electron-ion interactions with 3d94s1 selected as the valence orbitals; (2) the Perdew-Burke-Ernzerhof (PBE) [30] exchange-correlation functional within the generalized gradient approximation (GGA) framework is employed to describe the electron-electron interactions; (3) electronic self-consistency criterion is set as 10-6 eV; (4) a Γ-centered 15 × 15 × 15 k-mesh generated via the Monkhorst-Pack method [31] is adopted to sample the Brillouin zone; (5) the tetrahedron method with Blöchl corrections [28] is used to determine the electron orbital partial occupancy with the plane-wave cutoff energy set as 400 eV. The convergence of all these parameters was verified across all the considered volumes with effective length fluctuating below 10-5 Å.
3. Results and Discussion
3.1. The Room-Temperature Isotherm
Based on DIA, the room-temperature P-V relationship of Ni up to 500 GPa is obtained and shown as the red solid line in Figure 2, which includes three sets of experimental data [1,2,32] and the results calculated by QHA [33]. It is roughly seen that the calculations of both QHA and DIA agree well with the experiments. To specifically inspect the feasibility of DIA, under the same volume, differences between the pressure calculated by DIA (PDIA), or QHA (PQHA) and the experimental measurement (PEXP) are conducted and presented in Figure 3.
As shown in Figure 3(a), most of PDIA agree well with the PEXP of Ref. [2] up to 61 GPa with the difference less than 1 GPa, but at PEXP of 13.1, 17.6, 21.4, and 22.1 GPa (in the green box in Figure 3(a)), PDIA presents a large relative deviation (|PDIA – PEXP| / PEXP) of 25.2, 13.2, 11.8 and 25.1%, respectively, which should be attributed to the accidental error in the experiments. Comparatively, QHA manifests a little worse than DIA with nearly all the PQHA smaller than the PEXP, resulting in an average difference (|PEXP - PQHA|) of 2.85 GPa. In 2015, Pigott et al. [1] performed a larger range of diamond anvil cells compressions of Ni up to 98 GPa. Compared with the experiment of Ref. [2], higher precision is taken in Ref. [1] in terms of zero uncertainty for the controlled room temperature and better hydrostatic conditions. As shown in Figure 3(b), the difference between PDIA and the PEXP of Ref. [1] fluctuates around zero in the whole compression condition with average |PEXP – PDIA| of 1.35 GPa, while nearly all the PQHA are larger than the PEXP with an average deviation of 2.59 GPa.
Recently, Hirao et al. [32] reported a set of volume measurements of Ni up to 368 GPa, but only the ones below 21 GPa are hydrostatic. As shown in Figure 3(c), PDIA agrees well with these hydrostatic measurements with an average difference of only 0.56 GPa, but most of the non-hydrostatic PEXP are smaller than PDIA, which qualitatively indicates the reliability of DIA since the pressures under non-hydrostatic conditions are recognized to be smaller than that under hydrostatic conditions. As the pressure calculated by QHA in Ref. [33] is just up to 180 GPa, comparisons between PQHA and the experiment of Ref. [32] is only within 0 - 180 GPa. Obviously, nearly all the PEXP are larger than PQHA.
The above discussions show that when compared to the experiments, DIA manifests better than QHA, but from the perspective of practical applications, the differences of the room-temperature isotherms supplied by the hydrostatic experiments Ref. [2], Ref. [1] and calculations of QHA and DIA could be neglected.
3.2. The High-Temperature Isotherms
On the P-V relationship of Ni at high temperatures (> 300 K), Campbell et al. [2] using a multi-anvil press and laser-heated diamond anvil cells (LHDAC) completed a group of measurements with the covered P, T reaching 2457 K and 66 GPa. Pigott et al. [1] using LHDAC achieved the volume measurements of Ni up to 109 GPa and 2941 K. Unfortunately, a large uncertainty of the manipulated temperature is noted in both the experiments of Ref. [2] and Ref. [1], so that the measured P-V-T data are isolated points instead of isotherms. To inspect the feasibility of DIA, we calculated the pressure at each pair of the experimentally measured (V, T) of the Ni sample in Ref. [2] and Ref. [1], and then performed specific comparisons with the experiments. To show the differences clearly, we arranged the experimental pressures in Ref. [2] and Ref. [1] in an ascending order mapped by the Arabic numerals shown as the blue symbols in Figure 4(a) and (b), where the red symbols are the corresponding calculated results by DIA. Error bars for our calculated pressures are obtained as follows. Taking the point indicated by the arrow in Figure 4(a) as an example, the experimentally measured V and T corresponding to this pressure is 9.806 ± 0.010 cm3/mol and 1976 ± 92 K, and based on DIA, at 1976 K, when the volume of Ni is 9.806 cm3/mol, our calculated pressure is 40.384 GPa. Making the calculated pressure 41.435 GPa at volume of (9.806 – 0.010) cm3/mol and temperature of (1976 + 92) K as the upper bound and 39.334 GPa at volume of (9.806 + 0.010) cm3/mol and temperature of (1976 – 92) K as the lower bound, the upper error for this calculated pressure (40.384 GPa) is ΔP+ = 1.051 GPa and the lower one is ΔP- = 1.050 GPa.
From Figure 4(a) and (b) as well as the respective insets, we can see that our calculated results agree well with the experiments of Ref. [2] and Ref. [1], especially better with the latter one. Considering the uncertainty, if the calculated pressure has an overlap with the experimentally measured result, we think they are consistent. By this way, the degree of the coincidence of our calculations with the experiment of Ref. [2] is 59.55%, and with Ref. [1] reaches 78.28%. The re-arranged experimental data of Ref. [2] and Ref. [1] along with the corresponding calculated pressures by DIA are listed in supplementary material, Table SI and SII, respectively.
For realistic applications, having a good command of the isotherms of Ni at high temperatures is demanded. In Ref. [2] and Ref. [1], the measured P-V-T data were fitted by the Mie-Grüneisen-Debye formalism (MGD) [23,24,25], and from the fitted parameters, the isotherms of Ni could be obtained. However, the results in Ref. [2] and Ref. [1] are effective just to 66 GPa, 2457 K, and 109 GPa, 2941 K, respectively. In the present work, we calculated the isotherms of Ni up to 3000 K and simultaneously 500 GPa, which are listed in Table 1. To discuss the differences among the high-temperature isotherms of Ni reported by different experiments and theoretical calculations, the P-V curves of Ni under 1000, 2000, and 3000 K from Ref. [2], Ref. [1], DIA and QHA are displayed in Figure 5(a) - (c). Since the largest calculated pressure in Ref. [33] is limited to 180 GPa, and according to Ref. [34], solid Ni exists above 7.5 GPa at 2000 K and 50.6 GPa at 3000 K, the comparisons and discussions in this section are just within these conditions. Under the same volume, the differences between PQHA, PEXP of Ref. [2], or Ref. [1] and PDIA at 1000, 2000, and 3000 K are correspondingly displayed in Figure 5(d) - (f), from which we can see that PQHA [33] is close to PEXP of Ref. [1] in the whole pressure and temperature range with the largest difference of less than 4.3 GPa. Whereas, both PQHA and PEXP of Ref. [1] are consistently smaller than PDIA. The deviation of PEXP in Ref. [1] from PDIA increases gradually with increasing pressure with the largest relative error ((PEXP – PDIA) / PDIA) of 3.5%, 4.1%, and 4.6 % at 1000, 2000, and 3000 K, respectively, while PQHA almost presents a constant relative deviation ((PQHA – PDIA) / PDIA) of 5.6% within the entire discussed conditions. It is noted that the pressures in the experiment of Ref. [2] were also determined based on the MGD model, but the derived isotherms are far away from the ones reported in Ref. [1], and also distinguish from the calculated results of QHA and DIA. As shown by the gray solid line in Figure 5(d) - (f), the largest relative difference between PEXP in Ref. [2] and PDIA reaches 17.1%, 17.2%, and 15.6% at 1000, 2000, and 3000 K, respectively.
The above discussions as well as those included in the section A show that our calculations agree better with the experiment of Ref. [1], in which the accuracy of the measurements should be higher than that of Ref. [2]. In addition, it is noted that QHA is rarely applied to such high temperatures up to 3000 K due to its effectiveness only to small atomic vibrations, but it should be appropriate for the Ni system because as confirmed by one of our investigations [6] that QHA would work well for the system with atomic volume smaller than 22 Å3/atom, and under the lower pressure limit for the solid Ni [34], its atomic volume calculated by DIA at 300, 1000, 2000, and 3000 K is 10.95, 11.31, 11.33, and 9.74 Å3/atom, respectively. Thus, it is reasonable that the isotherms of Ni calculated by QHA distinguish little from that by DIA with a nearly constant relative error of only 5.6% in a large temperature range from 300 up to 3000 K. As the accuracy of DIA increases with decreasing volume of the material [19], the predictions for the isotherms of Ni up to 3000 K and simultaneously 500 GPa should be reliable.
3.3. The Analytical EOS
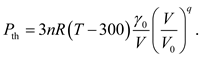
For practical application of metal Ni, it is necessary to obtain an analytical isothermal EOS based on the calculated results of DIA to determine the pressure for arbitrary volume V and temperature T. For this purpose, the MGD model [23,24,25] should be a good choice since it has been applied successfully to fit experimental data to obtain analytical EOS at high temperatures [1,2]. In this model, the total pressure P is considered to be the summation of thermal pressure Pth and the room-temperature one P300K. Pth as a function of V and T is determined by three parameters via the following equations,
 and
and
 where R is the gas constant and n is the mole number of atoms confined within volume V. The Grüneisen parameter γ and Debye temperature θ are regarded to be only volume dependent via
 and
and
 in which the quantities with subscript 0 represent the corresponding values at 300 K and one atmospheric pressure. γ0, q and θ0 are the three parameters to be decided. The P300K can be described by the third-order Birch-Murnaghan (BM) [35] EOS
 with K0 and K´0 the bulk modulus and its pressure derivative at one atmospheric pressure.
Although K0 and K0´ could be easily obtained by fitting experimental data via Eq. (16), determining γ0, q and θ0 will cost too much computer hours because an integral equation (Eq. (13)) is involved in the MGD model. Actually, in previous applications of the model [1,2], the parameter θ0 measured by other experiment was pre-introduced. For example, Ref. [1] employed MGD model fitting the experimental P-V-T data of metal Ni with θ0 of 415 K [36], and γ0 and q were then determined to be 1.98 and 1.3. In fact, the fitted results are insensitive to θ0. When we varied the value of θ0 from 1 to 500 K without changing the value of γ0 and q, the obtained pressures deviate from the original ones with θ0 of 415 K by no more than 0.45 GPa (Figure 6), which is significantly smaller than the uncertainty of the experimental measurements.
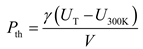
It is notable that the internal energy expressed by Eq. (13) is based on the harmonic approximation, and tends to be UT = 3nRT when the temperature T is larger than the Debye temperature. It is a fact that the Debye temperature for most solids is in the range of 200 - 400 K, and therefore the internal energy at temperature above 300 K should be independent of volume and can be simplified as 3nRT. Accordingly, the expression of the thermal pressure Pth can be simplified as
Thus, the MGD model is reduced to a simplified one without parameter θ0 and the integral equation Eq. (13). We apply this simplified model to calculate the pressure of metal Ni with parameter γ0 and q taken as 1.98 and 1.3 determined in Ref. [1], the results deviate from the predictions under MGD model by no more than 0.42 GPa [Figure 6], which is significantly smaller than the uncertainty of the experimental measurements. Furthermore, we obtained an analytical EOS of metal Ni by fitting the calculated results (Table 1) of DIA via the simplified model, showing that the fitted pressure deviates from the original one by no more than 1 GPa, which is smaller than the precision of DIA calculations [Figure 7]. As shown in Table 2, the parameters of the EOS determined by DIA present some difference from the ones determined by fitting experimental data under MGD model reported in Ref. [2] or Ref. [1]. Relatively, our theoretical parameters are closer to the latter ones.
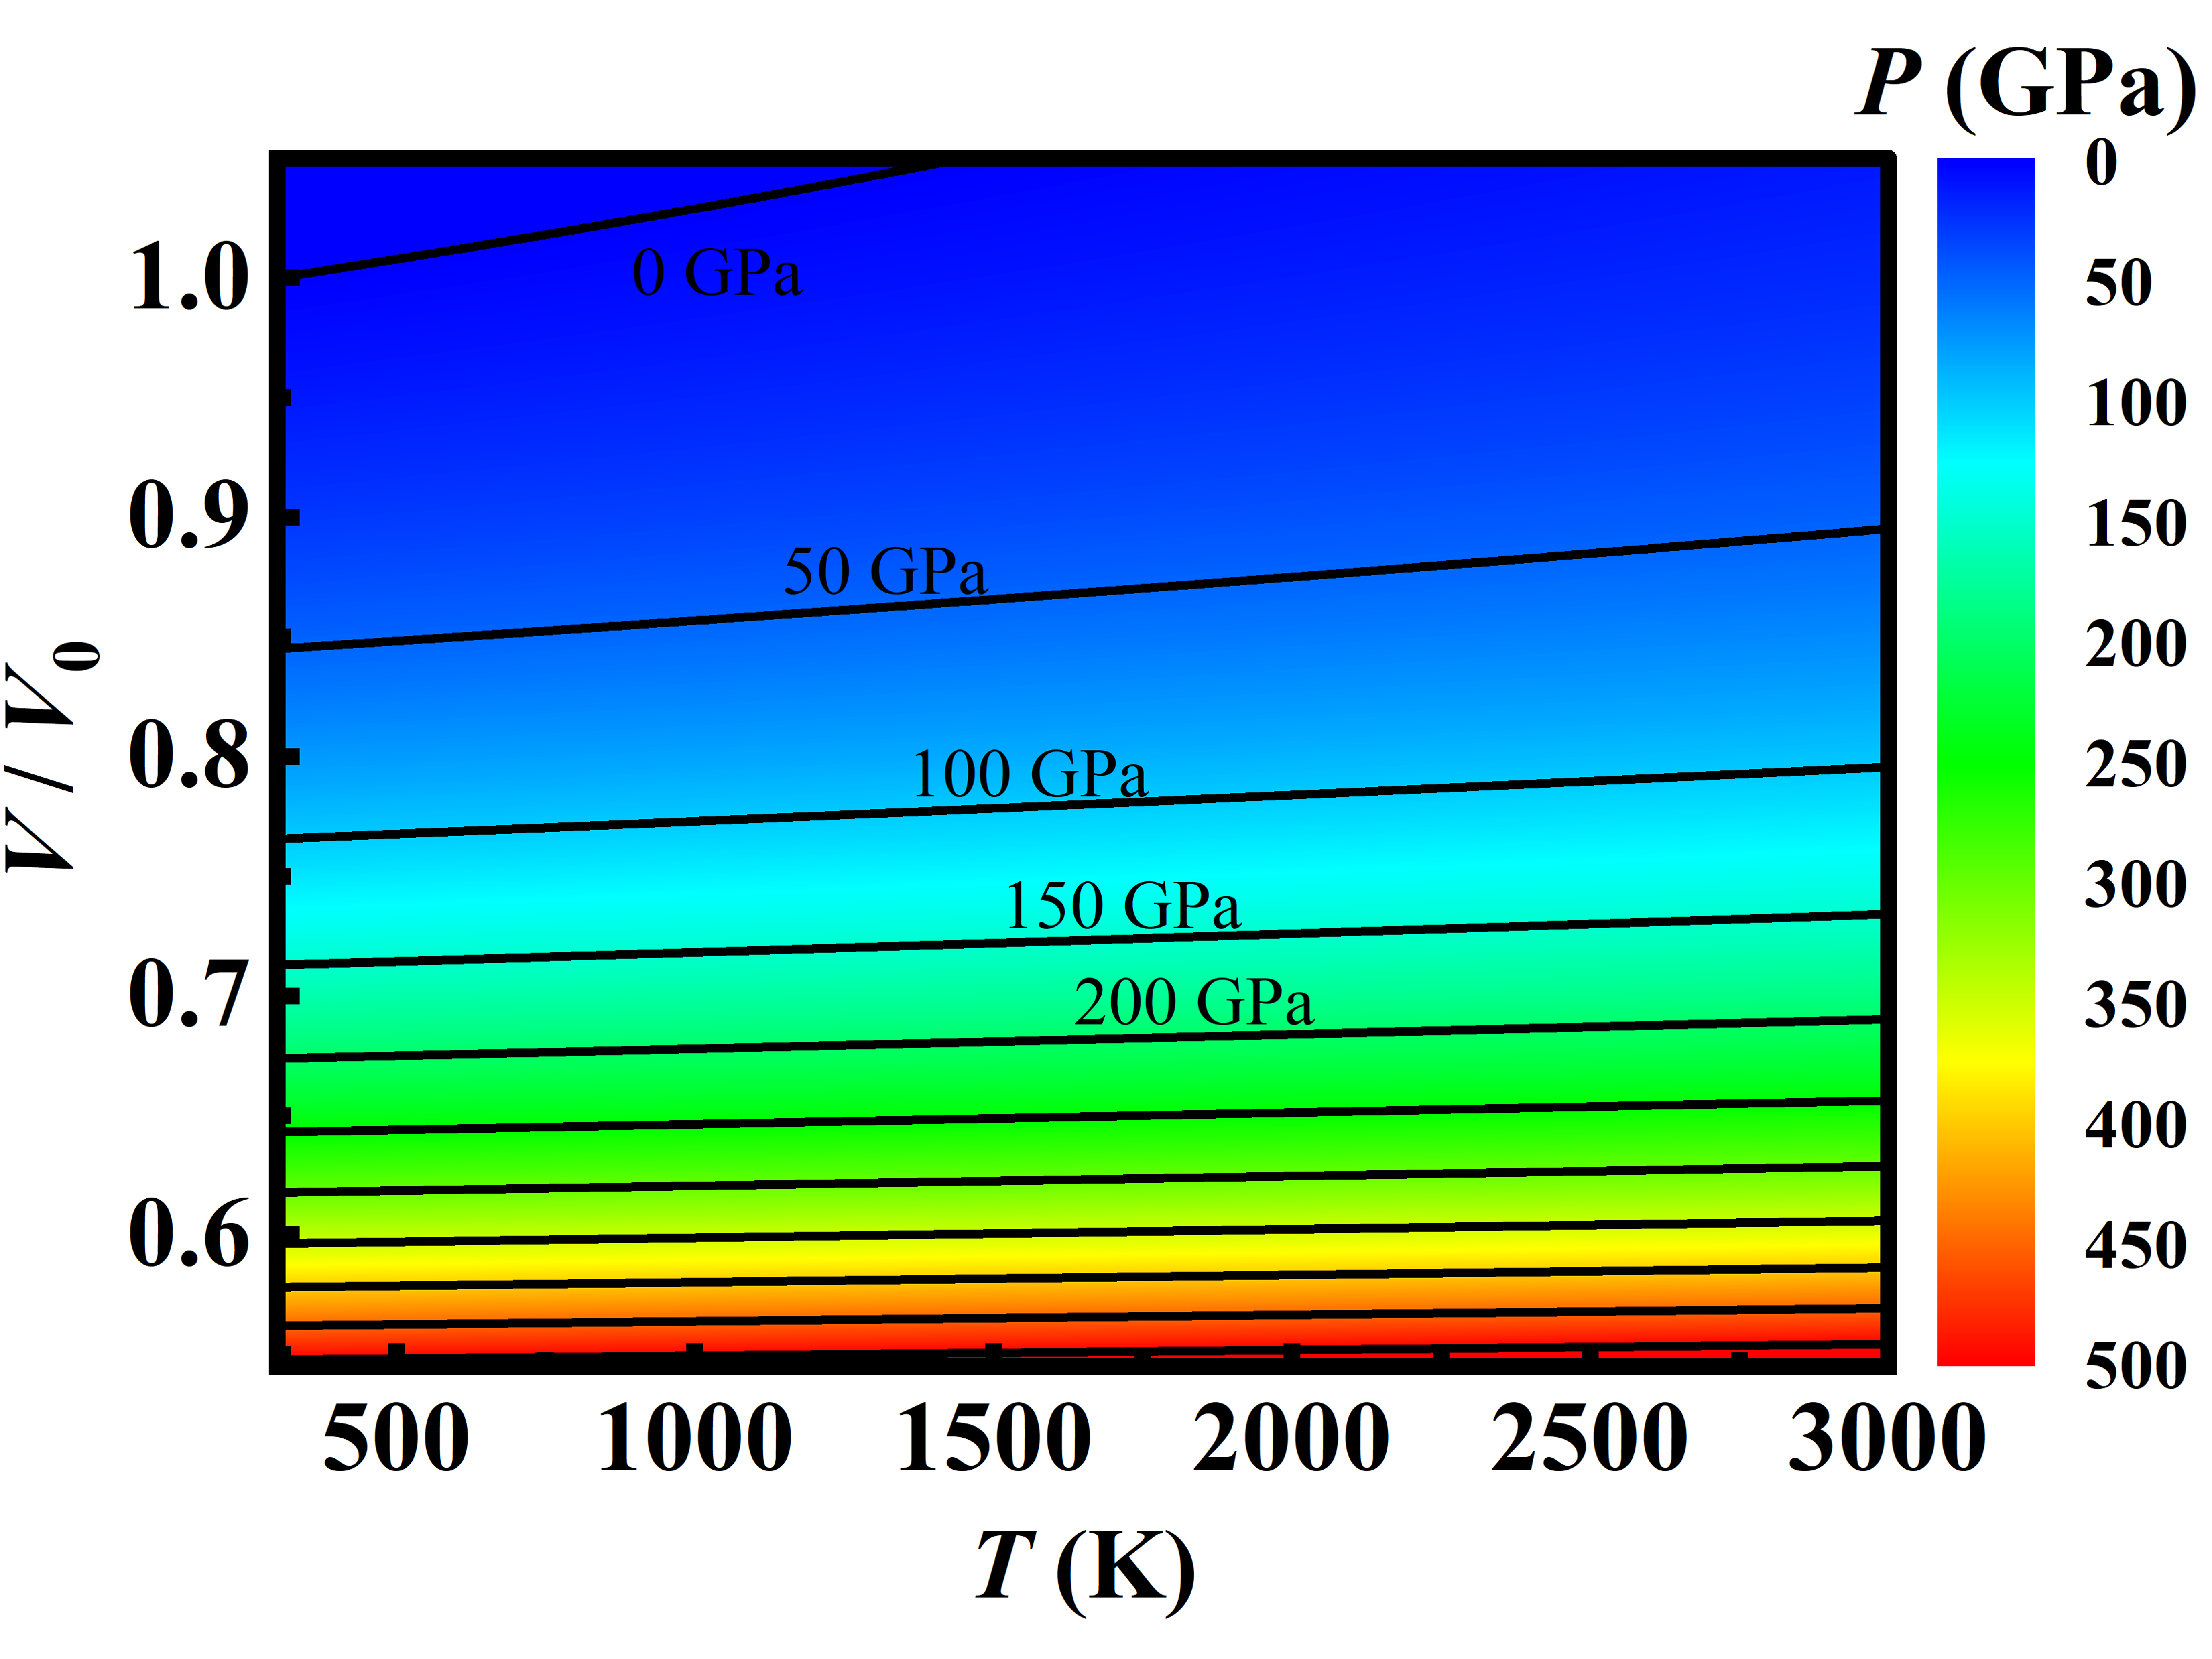
Applying the analytical EOS of metal Ni, we obtained a map of pressure distribution over T-V plan shown in Figure 8(a), which is similar to the empirical predications (Figure 8(b)) based on the MGD fitting experimental data [1]. The isobars in Figure 8(a) and (b) indicate clearly that the pressure depends mainly upon the volume instead of the temperature varied from 300 to 3000 K. For given pressure, the volume expends linearly with the temperature and the expansion rate gets slower and slower with increasing pressure. When the pressure is larger than 400 GPa, the volume keeps nearly unchanged even if the temperature increases from 300 to 3000 K. For arbitrary volume (or pressure) and temperature, the pressure (or the volume) can be easily read from this pressure map.
The difference between our theoretical predictions and the empirical ones take place mainly in the high-pressure region. As shown in Figure 8(c), there exists a T-V curve along which our theoretical prediction is the same as the ones of the empirical prediction, and the theoretical pressure is larger than the empirical one by 5 GPa when the pressure is 150 GPa. As the pressure increases to 500 GPa, the pressure difference gets larger and larger up to 35 GPa, which can be understood in consideration of the fact that the empirical predictions using MGD model is based on the experimental data below 109 GPa.
4. Conclusions
In this work, we applied DIA at ab initio level to study the EOS of metal Ni up to 3000 K and simultaneously 500 GPa, and proposed an analytical expression of the EOS. The theoretical results are in good agreement with available hydrostatic experiments, suggesting that the predications under extreme conditions will be reliable. The simplified model developed to produce analytical EOS of solid should be universal and will find its vast applications for obtaining analytical EOS of various solids by fitting limited experimental or theoretical data.
Supplementary Materials
The following supporting information can be downloaded at the website of this paper posted on Preprints.org, Table S1; Table S2.
Author Contributions
Conceptualization S.-H.W., Y.-Y.T., B.-Y.N., H.-F.Z. and X.-J.N.; Data curation S.-H.W., H.-F.Z. and X.-J.N.; Formal analysis S.-H.W., Y.-Y.T., H.-F.Z. and X.-J.N.; Investigation S.-H.W., Y.-Y.T., B.-Y.N., H.-F.Z. and X.-J.N.; Methodology B.-Y.N. and X.-J.N.; Project administration X.-J.N.; Supervision X.-J.N.; Visualization S.-H.W., H.-F.Z. and X.-J.N.; Writing – original draft S.-H.W.; Writing – review & editing S.-H.W., Y.-Y.T., B.-Y.N., H.-F.Z. and X.-J.N.. All authors have read and agreed to the published version of the manuscript.
Funding
This research received no external funding.
Data Availability Statement
The original contributions presented in this study are included in the article/supplementary material. Further inquiries can be directed to the corresponding authors.
Conflicts of Interest
The authors have no conflicts of interest.
References
- Pigott, J.S.; Ditmer, D.A.; Fischer, R.A.; Reaman, D.M.; Hrubiak, R.; et al. High-pressure, high-temperature equations of state using nanofabricated controlled-geometry Ni/SiO2/Ni double hot-plate samples. Geophys. Res. Lett. 2015, 42, 10. [Google Scholar] [CrossRef]
- Campbell, A.J.; Danielson, L.; Righter, K.; Seagle, C.T.; Wang, Y.; et al. High pressure effects on the iron–iron oxide and nickel–nickel oxide oxygen fugacity buffers. Earth Planet. Sci. Lett. 2009, 286, 556. [Google Scholar] [CrossRef]
- Karki, B.; Wentzcovitch, R.M.; De Gironcoli, S.; Baroni, S. High-pressure lattice dynamics and thermoelasticity of MgO. Phys. Rev. B 2000, 61, 8793. [Google Scholar] [CrossRef]
- Togo, A.; Tanaka, I. First principles phonon calculations in materials science. Scr. Mater. 2015, 108, 1. [Google Scholar] [CrossRef]
- Hoja, J.; Reilly, A.M.; Tkatchenko, A. First-principles modeling of molecular crystals: structures and stabilities, temperature and pressure. Wiley Interdiscip. Rev.: Comput. Mol. Sci. 2017, 7, e1294. [Google Scholar] [CrossRef]
- Gong, L.-C.; Ning, B.-Y.; Ming, C.; Weng, T.-C.; Ning, X.-J. How accurate for phonon models to predict the thermodynamics properties of crystals. J. Phys.: Condens. Matter 2020, 33, 085901. [Google Scholar] [CrossRef]
- Wasserman, E.; Stixrude, L.; Cohen, R.E. Thermal properties of iron at high pressures and temperatures. Phys. Rev. B 1996, 53, 8296. [Google Scholar] [CrossRef]
- Cohen, R.E.; Gülseren, O. Thermal equation of state of tantalum. Phys. Rev. B 2001, 63, 224101. [Google Scholar] [CrossRef]
- Gannarelli, C.; Alfe, D.; Gillan, M. The particle-in-cell model for ab initio thermodynamics: implications for the elastic anisotropy of the Earth’s inner core. Phys. Earth Planet. Inter. 2003, 139, 243. [Google Scholar] [CrossRef]
- Xiang, S.; Xi, F.; Bi, Y.; Xu, J.A.; Geng, H.; et al. Ab initio thermodynamics beyond the quasiharmonic approximation: W as a prototype. Phys. Rev. B 2010, 81, 014301. [Google Scholar] [CrossRef]
- Wang, Y. Classical mean-field approach for thermodynamics: Ab initio thermophysical properties of cerium. Phys. Rev. B 2000, 61, R11863. [Google Scholar] [CrossRef]
- Wang, Y.; Chen, D.; Zhang, X. Calculated equation of state of Al, Cu, Ta, Mo, and W to 1000 GPa. Phys. Rev. Lett. 2000, 84, 3220. [Google Scholar] [CrossRef] [PubMed]
- Wang, Y.; Ahuja, R.; Johansson, B. Reduction of shock-wave data with mean-field potential approach. J. Appl. Phys. 2002, 92, 6616. [Google Scholar] [CrossRef]
- Preston, Y.W.Z.-K.L.L.-Q.C.L.B.D.; et al. Mean-field potential calculations of shock-compressed porous carbon. Phys. Rev. B 2005, 71, 054110. [Google Scholar]
- Ning, B.-Y.; Gong, L.-C.; Weng, T.-C.; Ning, X.-J. Efficient approaches to solutions of partition function for condensed matters. J. Phys.: Condens. Matter 2020, 33, 115901. [Google Scholar] [CrossRef]
- Han, J.; Shi, L.-Q.; Wang, N.; Zhang, H.-F.; Peng, S.-M. Equation of state of Iridium: from insight of ensemble theory. J. Phys.: Condens. Matter 2022, 34, 465702. [Google Scholar] [CrossRef]
- Tian, Y.-Y.; Ning, B.-Y.; Zhang, H.-F.; Ning, X.-J. Equation of state for tungsten obtained by direct solving the partition function. J. Appl. Phys. 2024, 135. [Google Scholar] [CrossRef]
- Tian, Y.-Y.; Ning, B.-Y.; Zhang, H.-F.; Ning, X.-J. Hydrostatic Equation of State of bcc Bi by Directly Solving the Partition Function. Metals 2024, 14, 601. [Google Scholar] [CrossRef]
- Liu, Y.-P.; Ning, B.-Y.; Gong, L.-C.; Weng, T.-C.; Ning, X.-J. A New model to predict optimum conditions for growth of 2D materials on a substrate. Nanomaterials 2019, 9, 978. [Google Scholar] [CrossRef]
- Ning, B.-Y.; Ning, X.-J. Pressure-induced structural phase transition of vanadium: A revisit from the perspective of ensemble theory. J. Phys.: Condens. Matter 2022, 34, 425404. [Google Scholar] [CrossRef]
- Ning, B.-Y. Pressure-induced structural phase transitions of zirconium: an ab initio study based on statistical ensemble theory. J. Phys.: Condens. Matter 2022, 34, 505402. [Google Scholar] [CrossRef] [PubMed]
- Ning, B.-Y.; Zhang, L.-Y. An ab initio study of structural phase transitions of crystalline aluminium under ultrahigh pressures based on ensemble theory. Comput. Mater. Sci 2023, 218, 111960. [Google Scholar] [CrossRef]
- Fei, Y.; Mao, H.-K.; Shu, J.; Hu, J. P-V-T equation of state of magnesiowüstite (Mg0.6Fe0.4)O. Phys. Chem. Miner. 1992, 18, 416. [Google Scholar] [CrossRef]
- Jackson, I.; Rigden, S.M. Analysis of P-V-T data:constraints on the thermoelastic properties of high-pressure minerals. Phys. Earth Planet. Inter. 1996, 96, 85. [Google Scholar] [CrossRef]
- Dewaele, A.; Loubeyre, P.; Occelli, F.; Mezouar, M.; Dorogokupets, P.I.; et al. Quasihydrostatic equation of state of iron above 2 Mbar. Phys. Rev. Lett. 2006, 97, 215504. [Google Scholar] [CrossRef]
- Kresse, G.; Furthmüller, J. Efficiency of ab-initio total energy calculations for metals and semiconductors using a plane-wave basis set. Comput. Mater. Sci 1996, 6, 15. [Google Scholar] [CrossRef]
- Kresse, G.; Furthmüller, J. Efficient iterative schemes for ab initio total-energy calculations using a plane-wave basis set. Phys. Rev. B 1996, 54, 11169. [Google Scholar] [CrossRef]
- Blöchl, P.E. Projector augmented-wave method. Phys. Rev. B 1994, 50, 17953. [Google Scholar] [CrossRef]
- Kresse, G.; Joubert, D. From ultrasoft pseudopotentials to the projector augmented-wave method. Phys. Rev. B 1999, 59, 1758. [Google Scholar] [CrossRef]
- Perdew, J.P.; Burke, K.; Ernzerhof, M. Generalized gradient approximation made simple. Phys. Rev. Lett. 1996, 77, 3865. [Google Scholar] [CrossRef]
- Monkhorst, H.J.; Pack, J.D. Special points for Brillouin-zone integrations. Phys. Rev. B 1976, 13, 5188. [Google Scholar] [CrossRef]
- Hirao, N.; Akahama, Y.; Ohishi, Y. Equations of state of iron and nickel to the pressure at the center of the Earth. Matter Radiat. Extremes 2022, 7. [Google Scholar] [CrossRef]
- Zeng, Z.-Y.; Hu, C.-E.; Cai, L.-C.; Jing, F.-Q. Ab initio study of lattice dynamics and thermal equation of state of Ni. Physica B 2012, 407, 330. [Google Scholar] [CrossRef]
- Boccato, S.; Torchio, R.; Kantor, I.; Morard, G.; Anzellini, S.; et al. The Melting Curve of Nickel Up to 100 GPa Explored by XAS. J. Geophys. Res.: Solid Earth 2017, 122, 9921. [Google Scholar] [CrossRef]
- Birch, F. Elasticity and constitution of the Earth's interior. J. Geophys. Res. 1952, 57, 227. [Google Scholar] [CrossRef]
- Knacke, O.; Kubaschewski, O.; Hesselmann, K. , Thermochemical Properties of Inorganic Substances, 2nd ed. ed. (Springer-Verlag, Berlin, 1991).
Figure 1.
(color online) A 3 × 3 × 3 supercell of Ni with the lattice vectors α1 = a0(0.5, 0.5, 0), α2 = a0(0, 0.5, 0.5) and α3 = a0(0.5, 0, 0.5), in which an arbitrary atom in the red circle is moved away along [100] direction step by step.
Figure 1.
(color online) A 3 × 3 × 3 supercell of Ni with the lattice vectors α1 = a0(0.5, 0.5, 0), α2 = a0(0, 0.5, 0.5) and α3 = a0(0.5, 0, 0.5), in which an arbitrary atom in the red circle is moved away along [100] direction step by step.
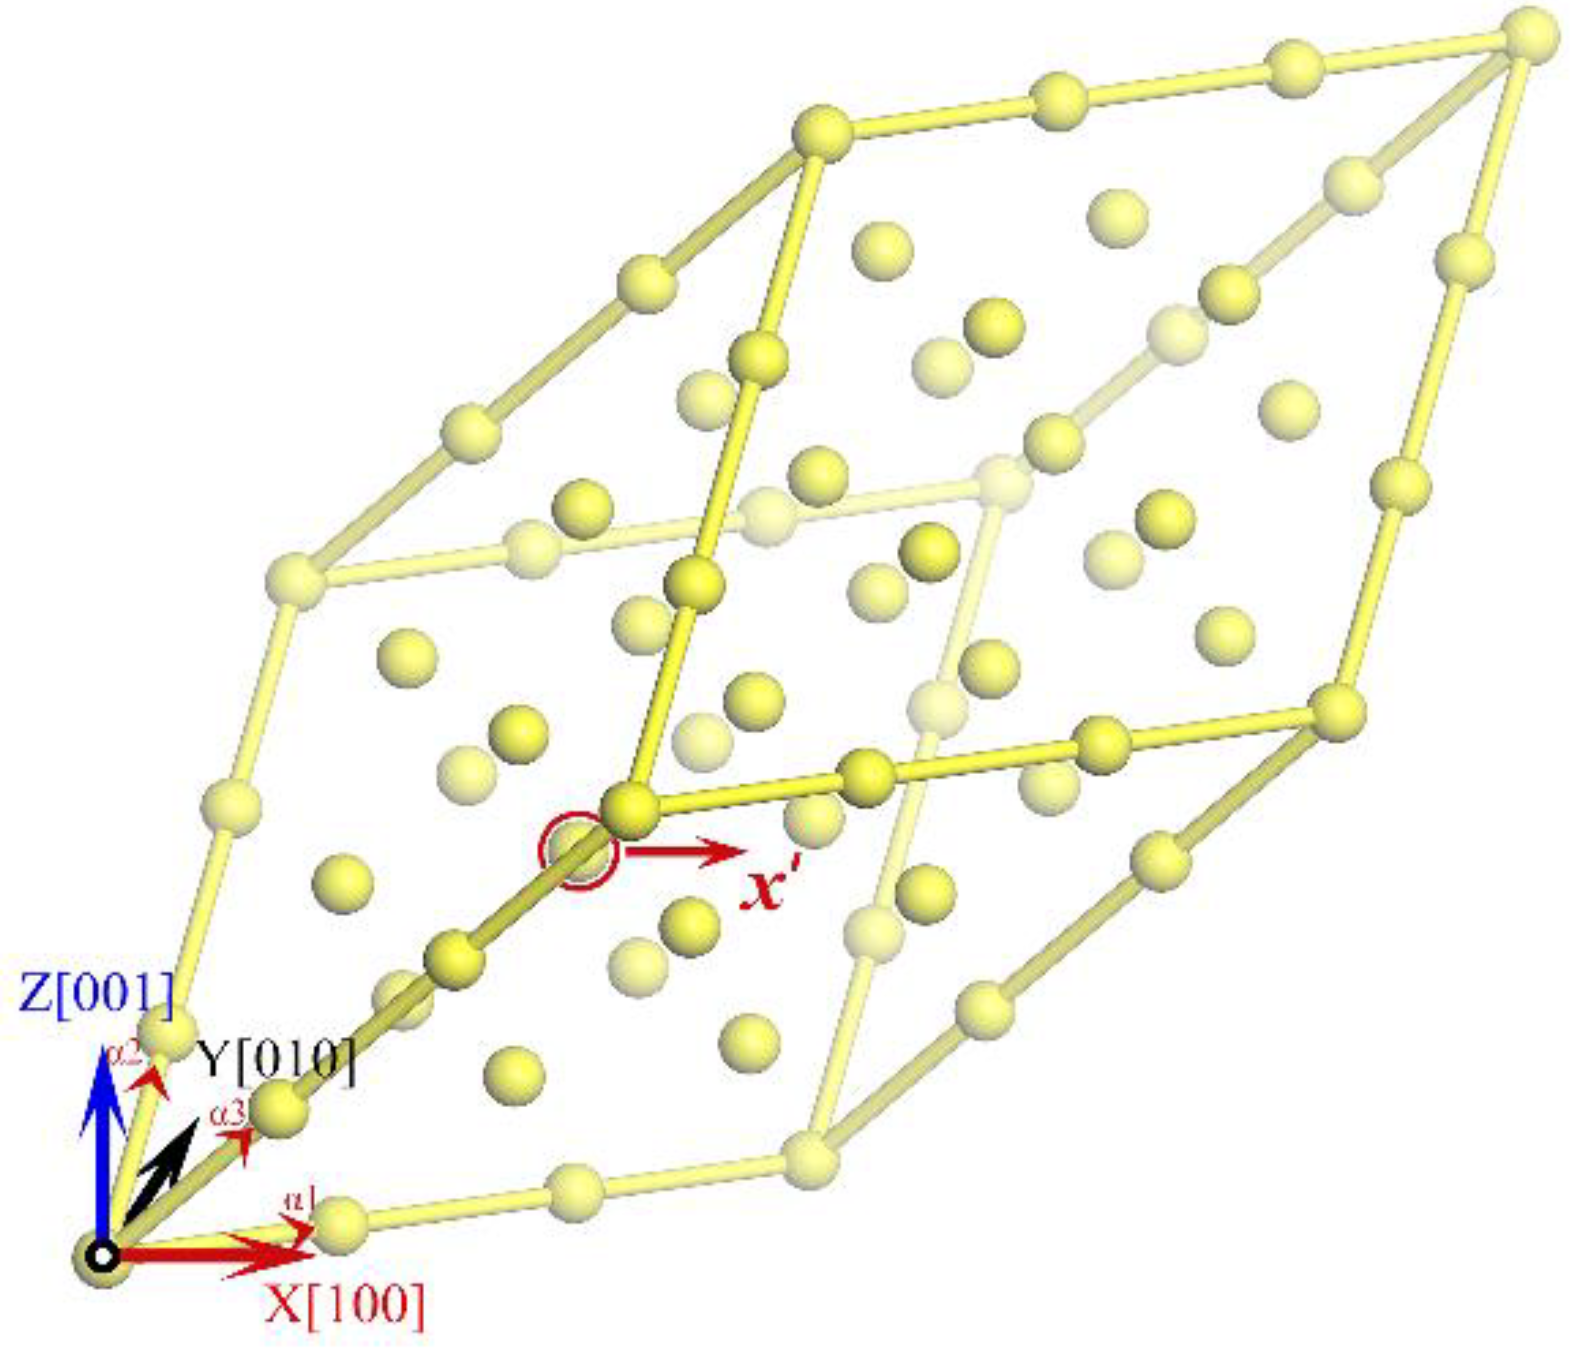
Figure 2.
(color line) The room-temperature (300 K) P-V relationship of Ni calculated from DIA (red solid line) and QHA [33] (yellow dashed line). The scattered points are experimental measurements by Campbell et al. [2] (magenta squares), Pigott et al. [1] (black fork symbols), and Hirao et al. [32] (olive stars).
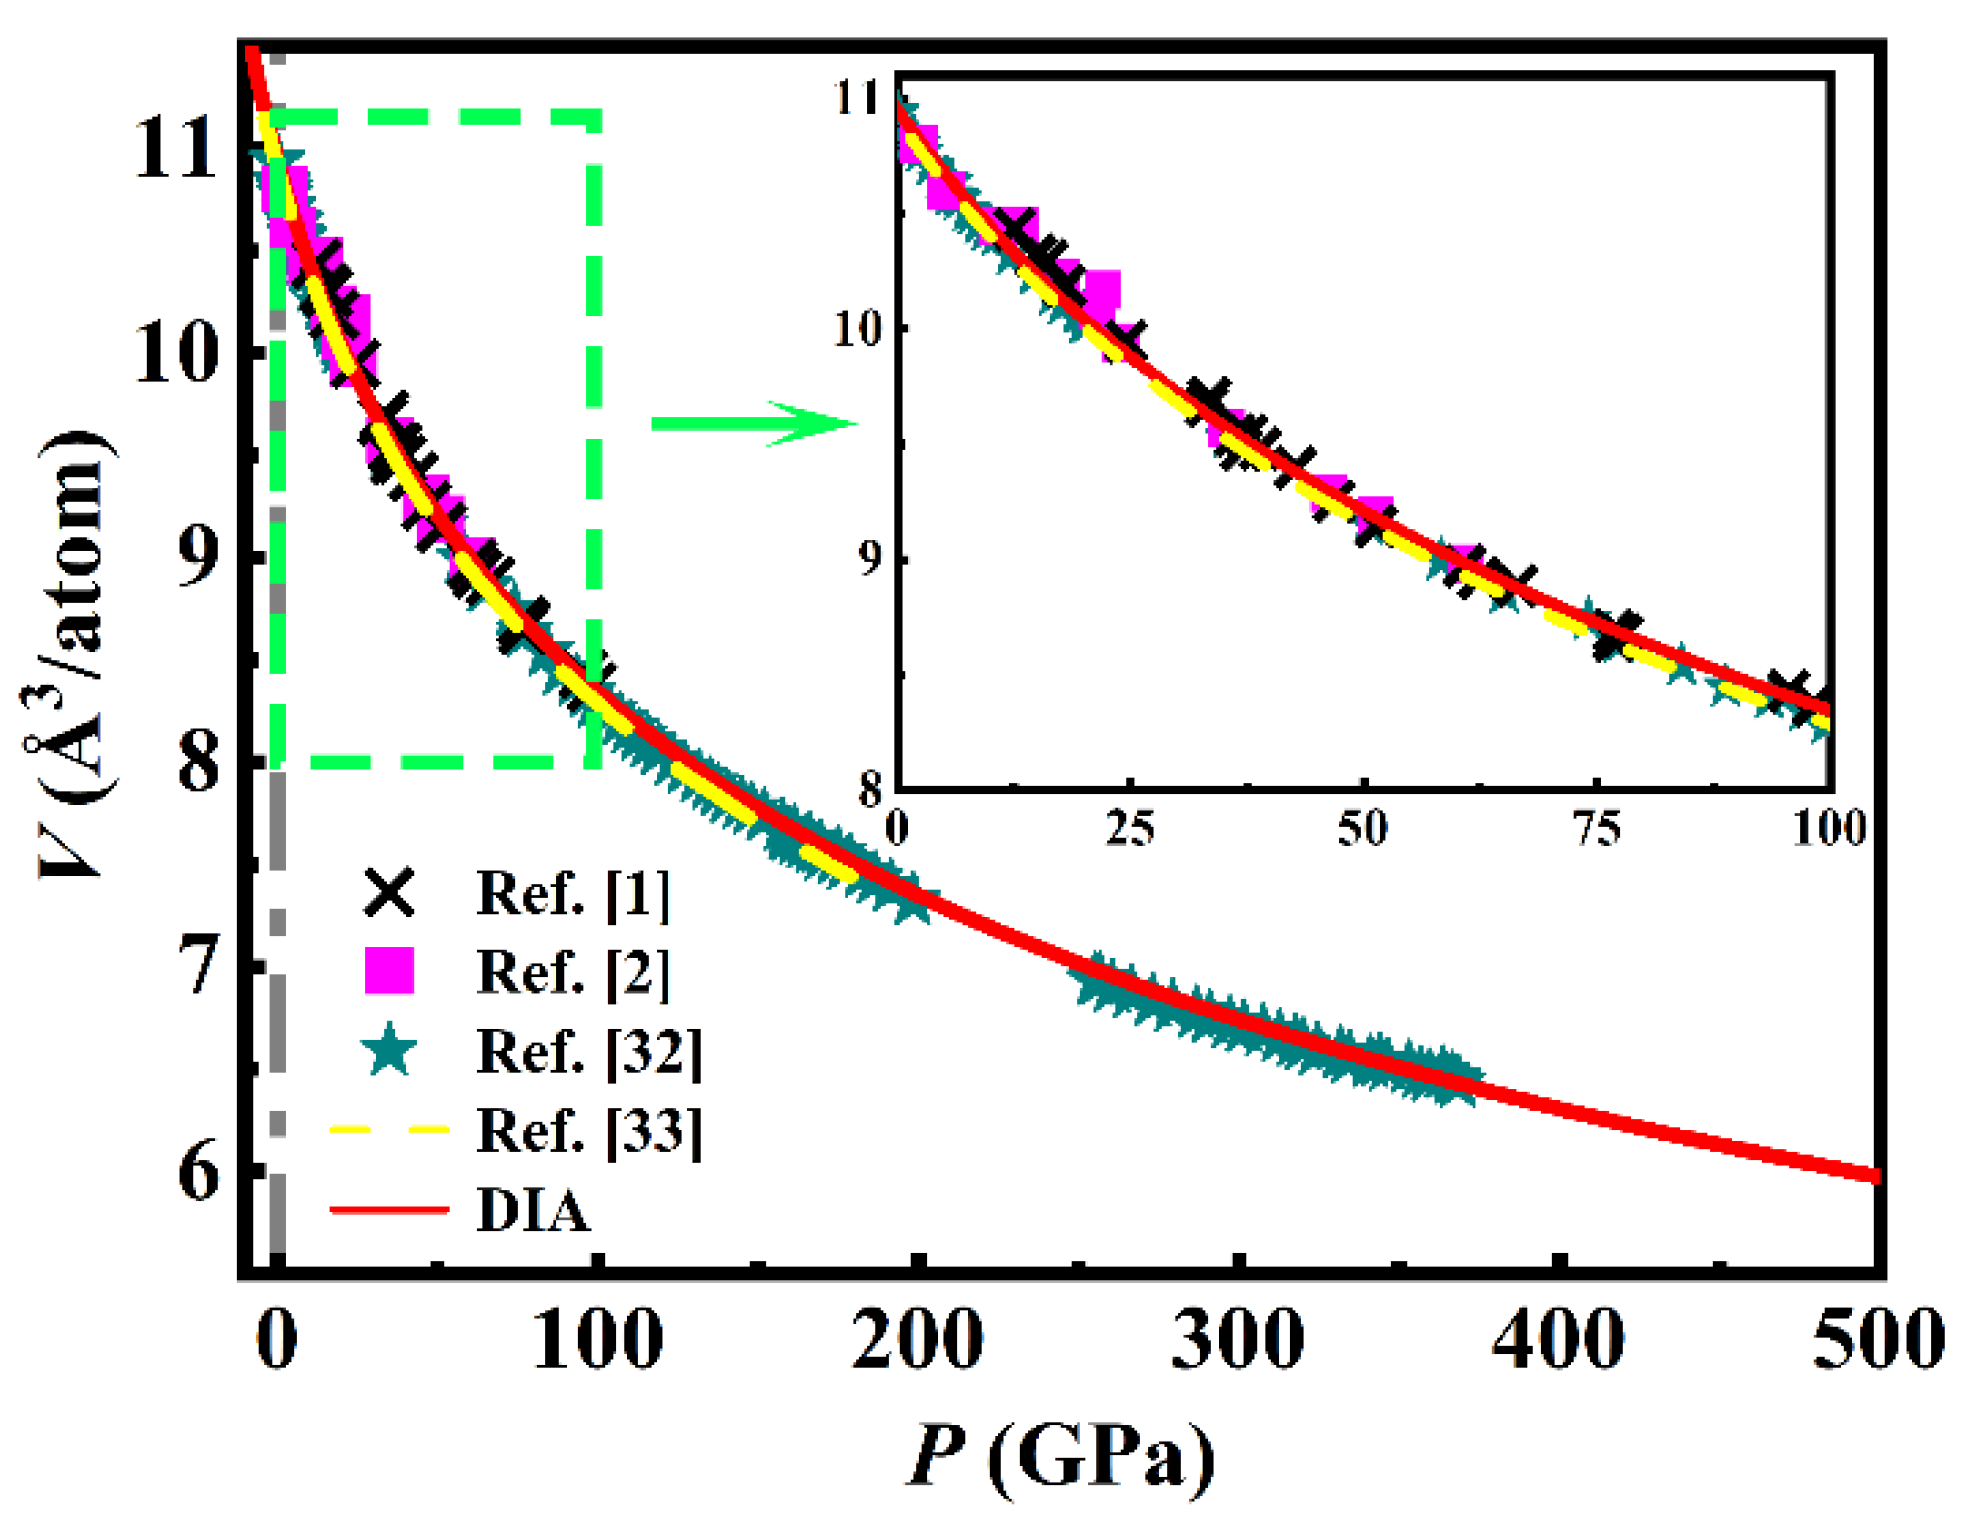
Figure 3.
(color online) Under the same volume, deviation of the calculated pressure PDIA or PQHA [33] from the experimental measurements PEXP of Ref. [2] (a), Ref. [1] (b), and Ref. [32] (c). Values of PEXP - PDIA and PEXP - PQHA are displayed as the red squares and blue circles, respectively.
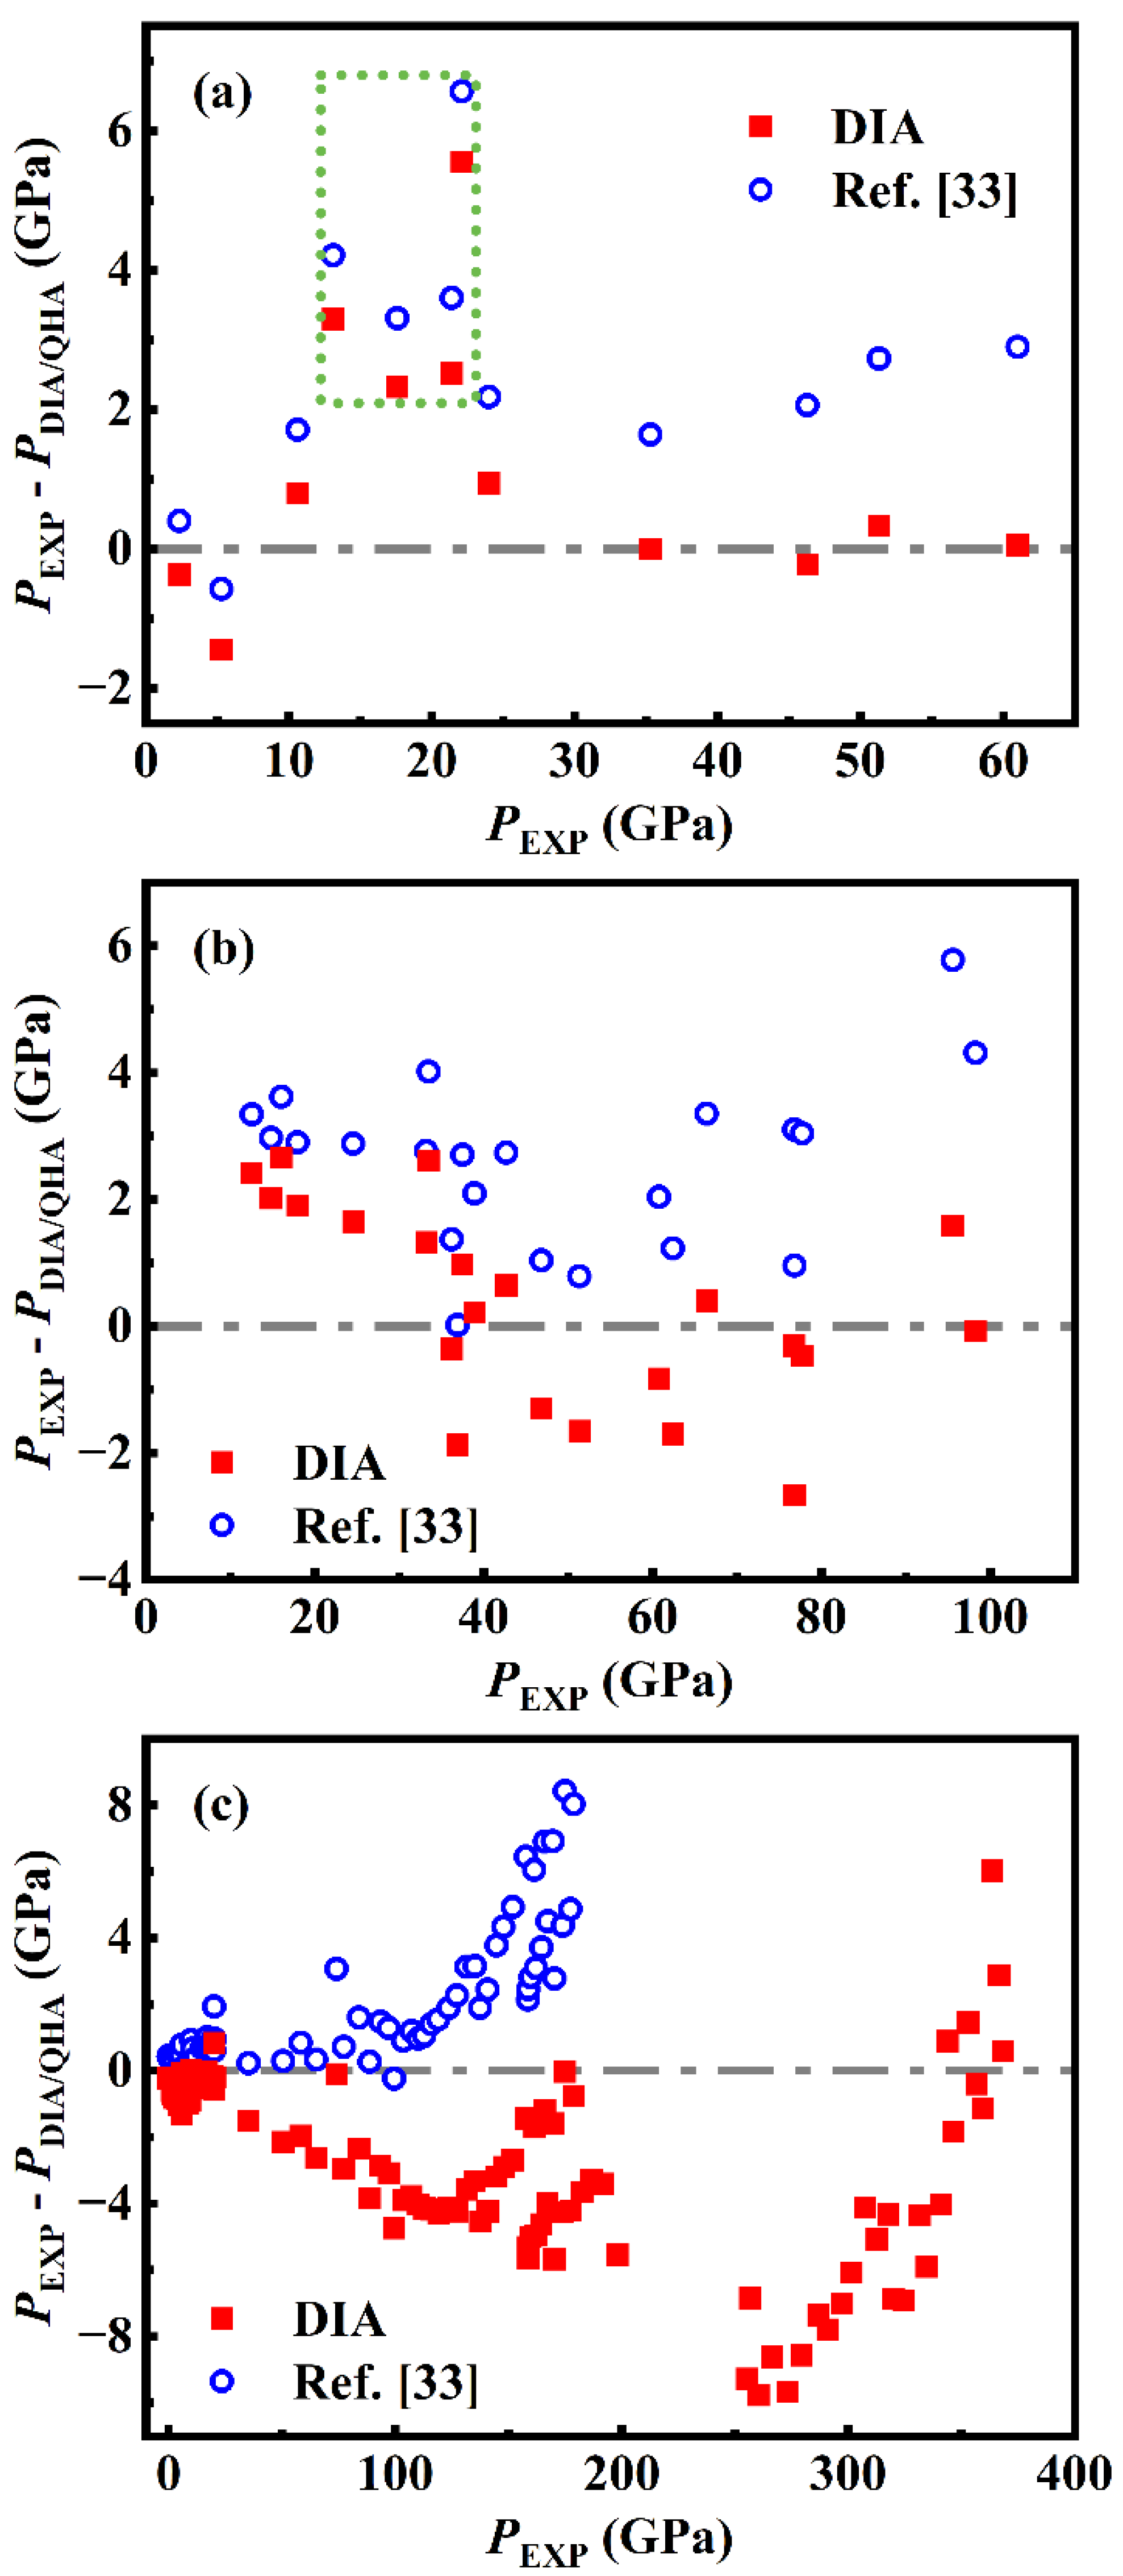
Figure 4.
(color online) The experimental pressures (blue symbols) in Ref. [2] (a) and Ref. [1] (b) are arranged in an ascending order and mapped by the Arabic numerals. Under each experimentally measured (V, T) of the Ni sample, the calculated pressures from DIA are correspondingly shown as the red squares.
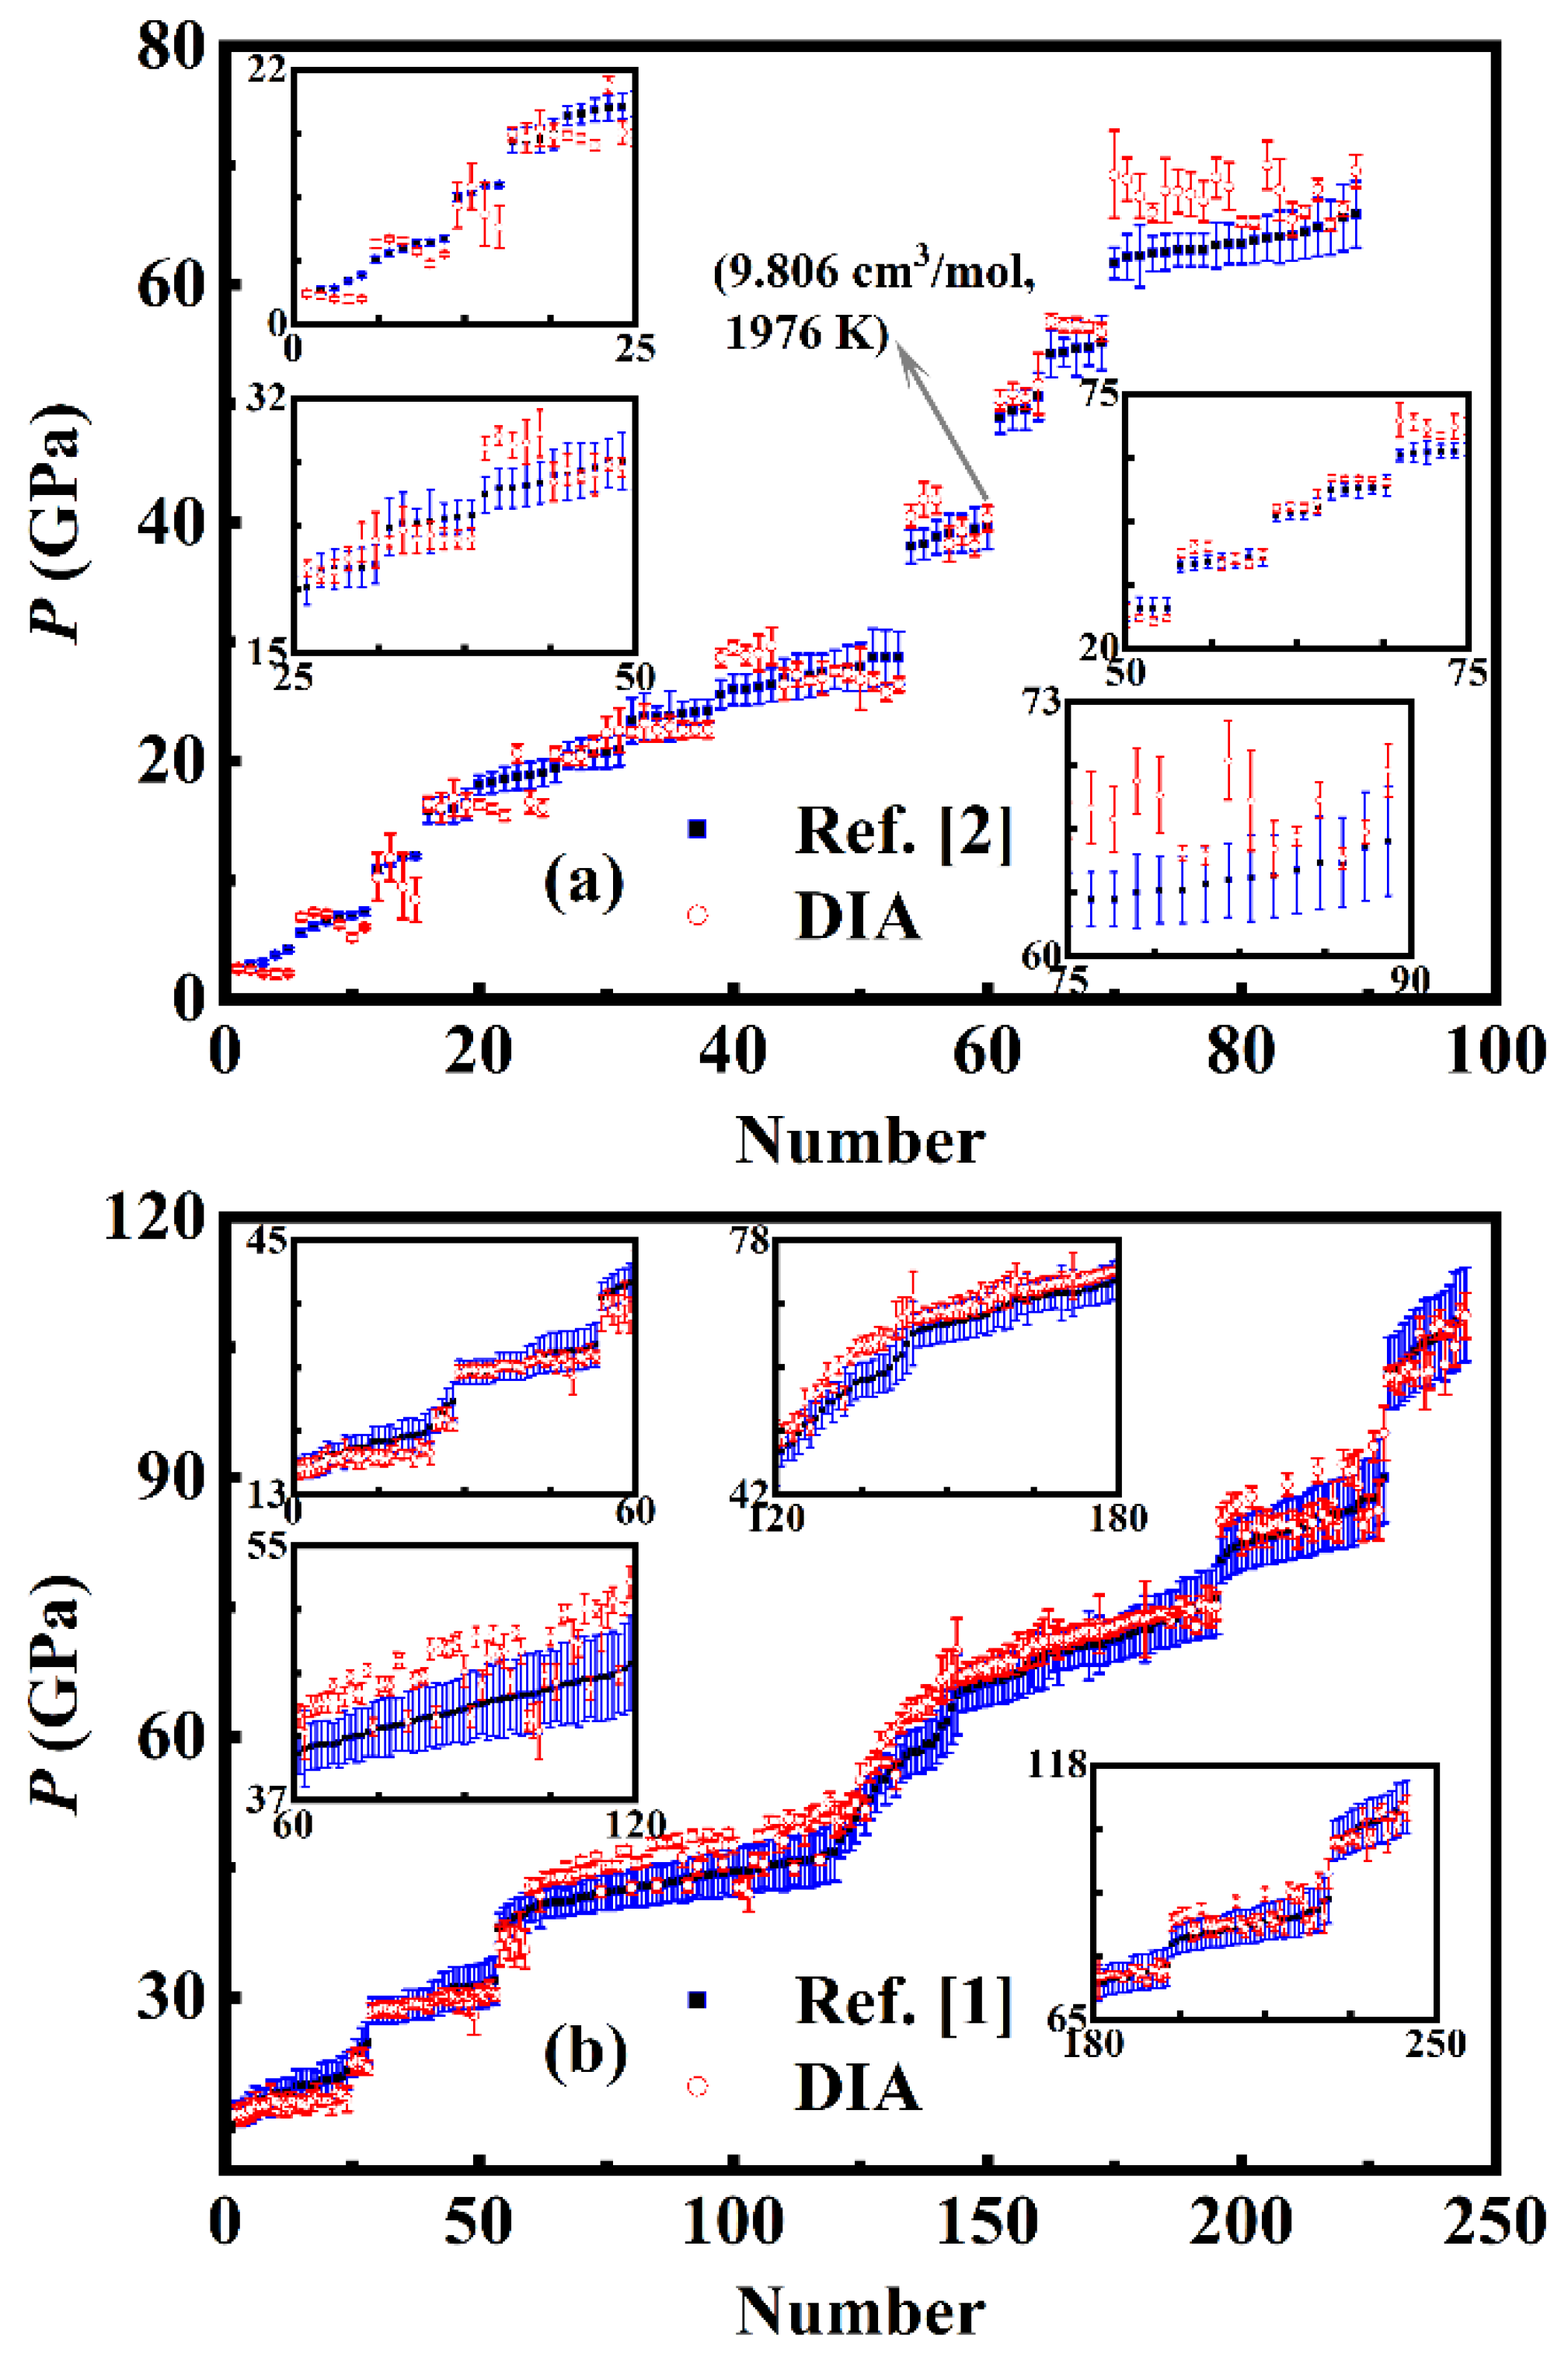
Figure 5.
(color online) Isothermal P-V relationship of Ni at 1000 (a), 2000 (b), and 3000 K (c), reported in Ref. [2] (olive dash dot dot line) and Ref. [1] (magenta solid line), and calculated by QHA [33] (black short dashed line) and DIA (red dashed line). Under the same volume, the pressure differences between the values in Ref. [2], Ref. [1], or Ref. [33] and those calculated by DIA are correspondingly shown in (d), (e), and (f).
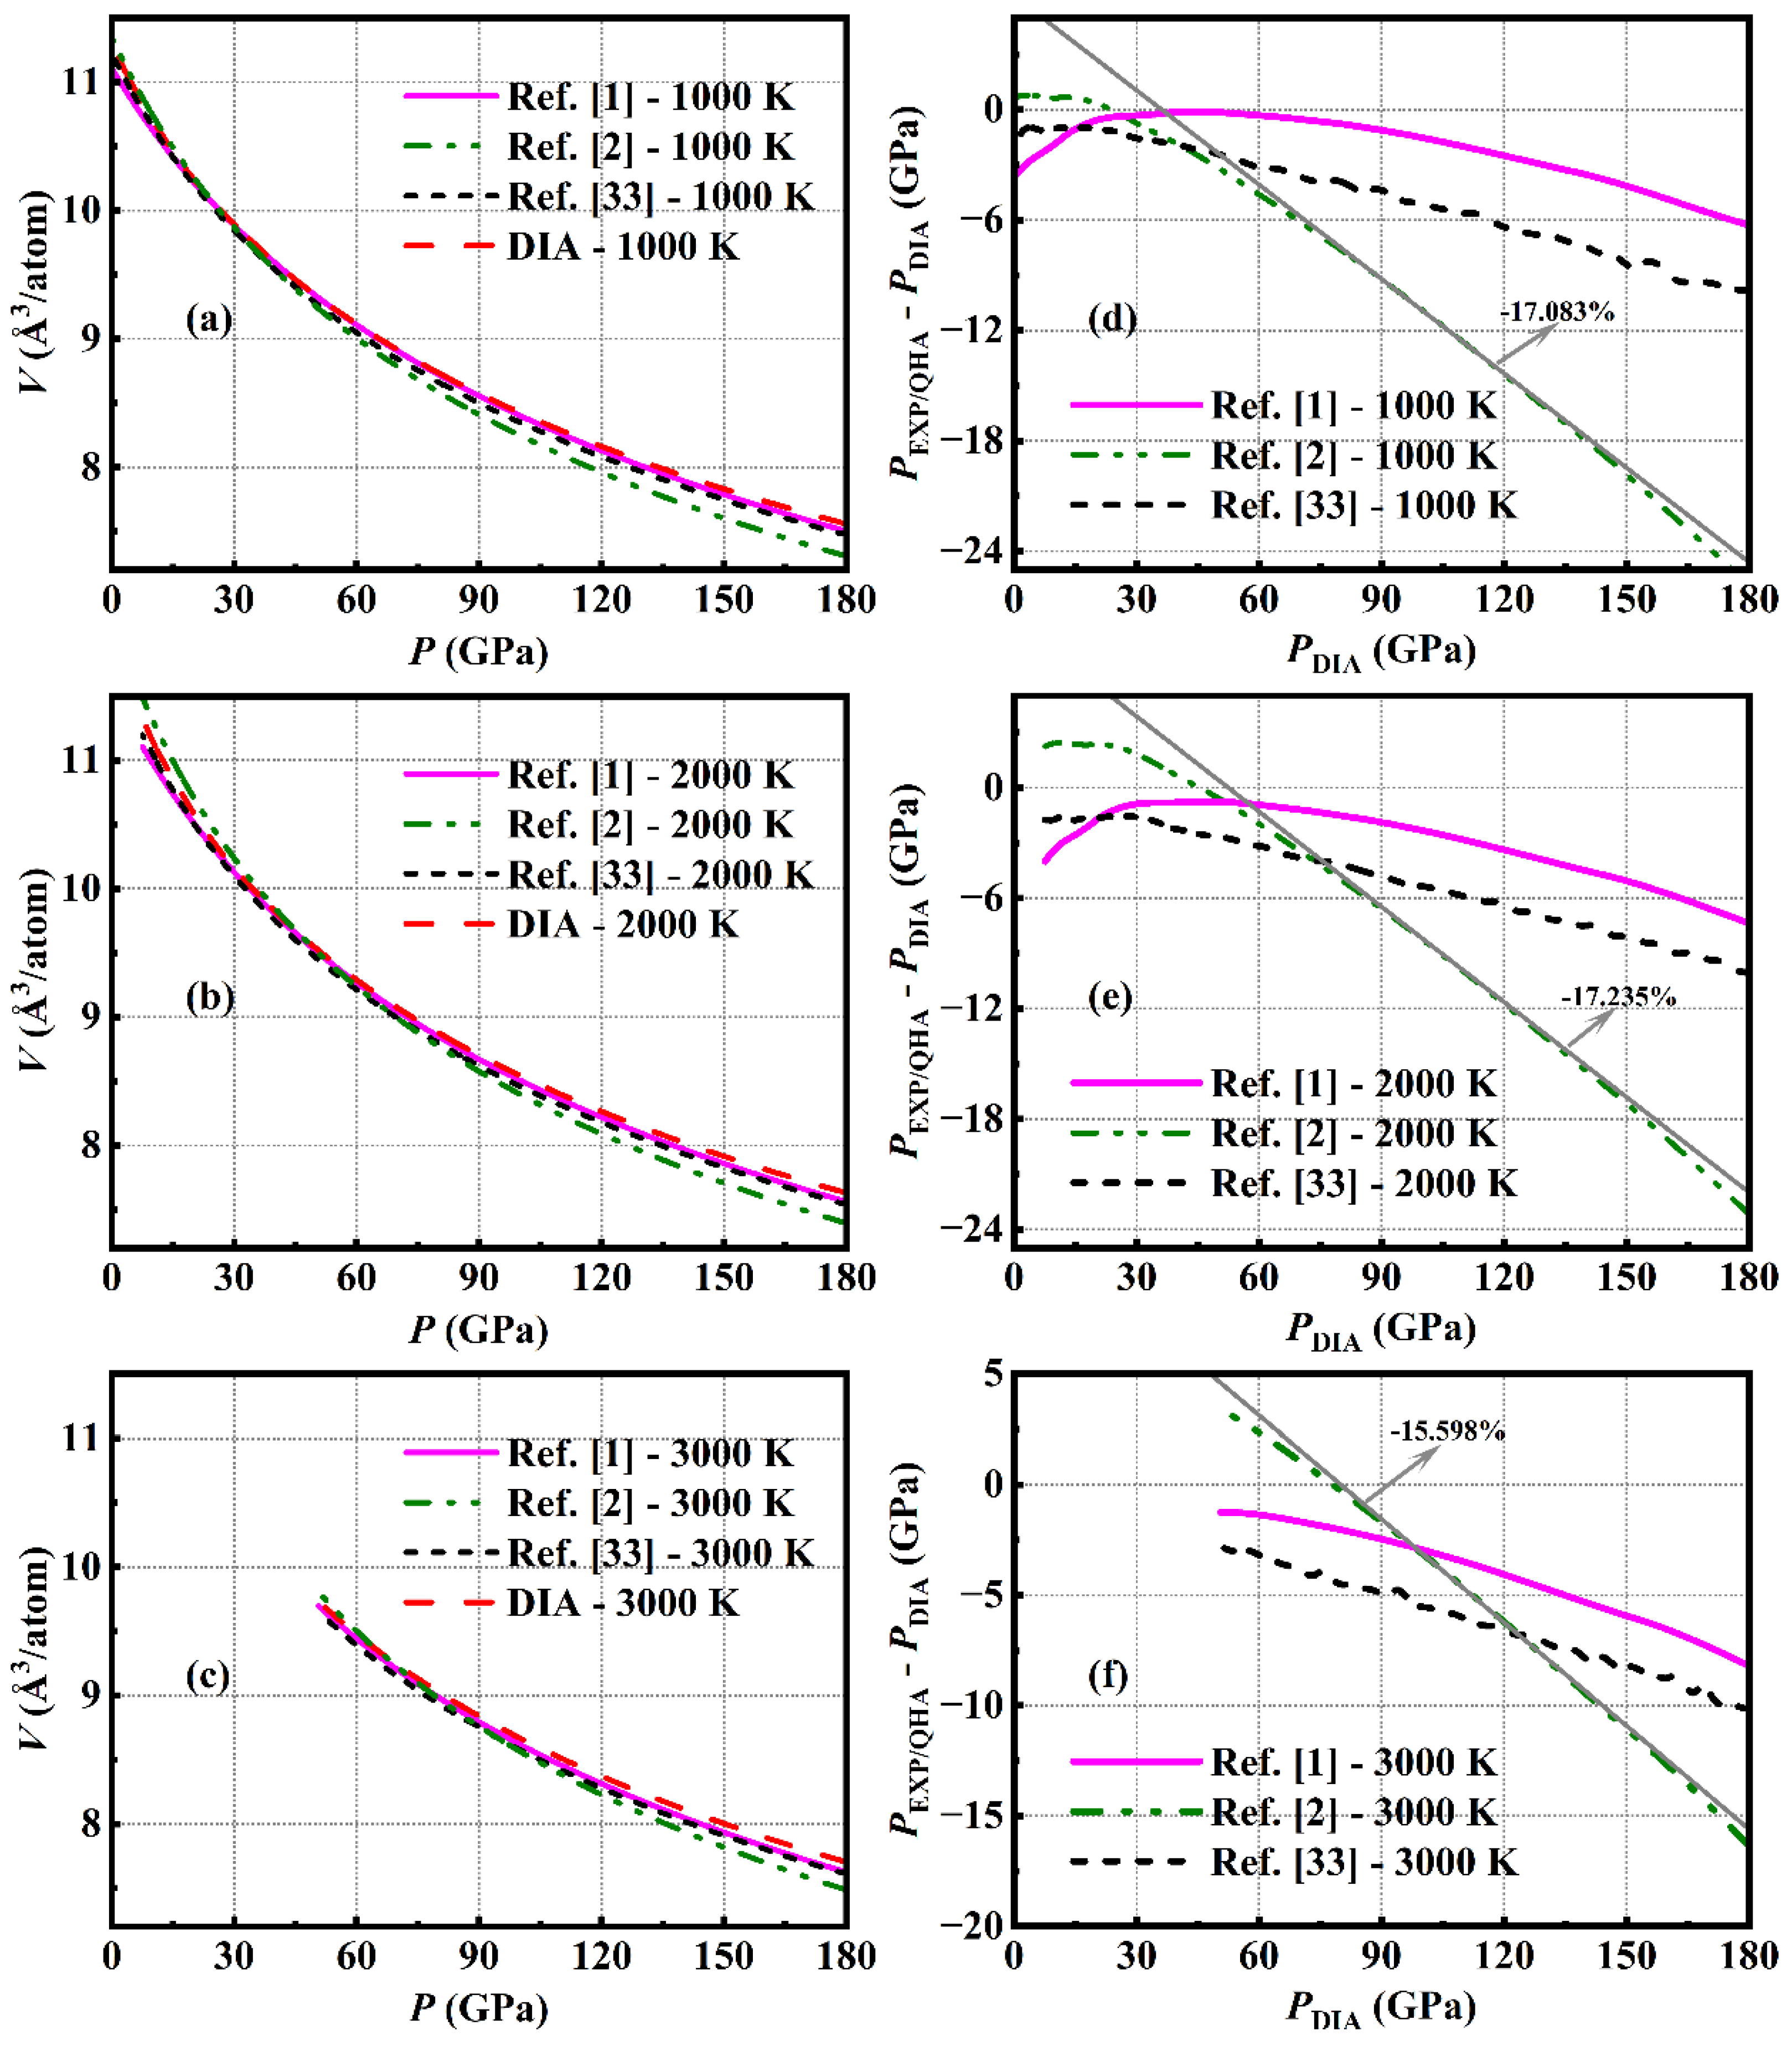
Figure 6.
(color online) The pressure difference (ΔP) between the results of MGD model with θ0 of 415 K and the ones with different value of θ0 (solid line), or the results of the simplified model (black short dot line) as a function of pressure P at 1000 K (a), 2000 K (b) and 3000 K (c).
Figure 6.
(color online) The pressure difference (ΔP) between the results of MGD model with θ0 of 415 K and the ones with different value of θ0 (solid line), or the results of the simplified model (black short dot line) as a function of pressure P at 1000 K (a), 2000 K (b) and 3000 K (c).
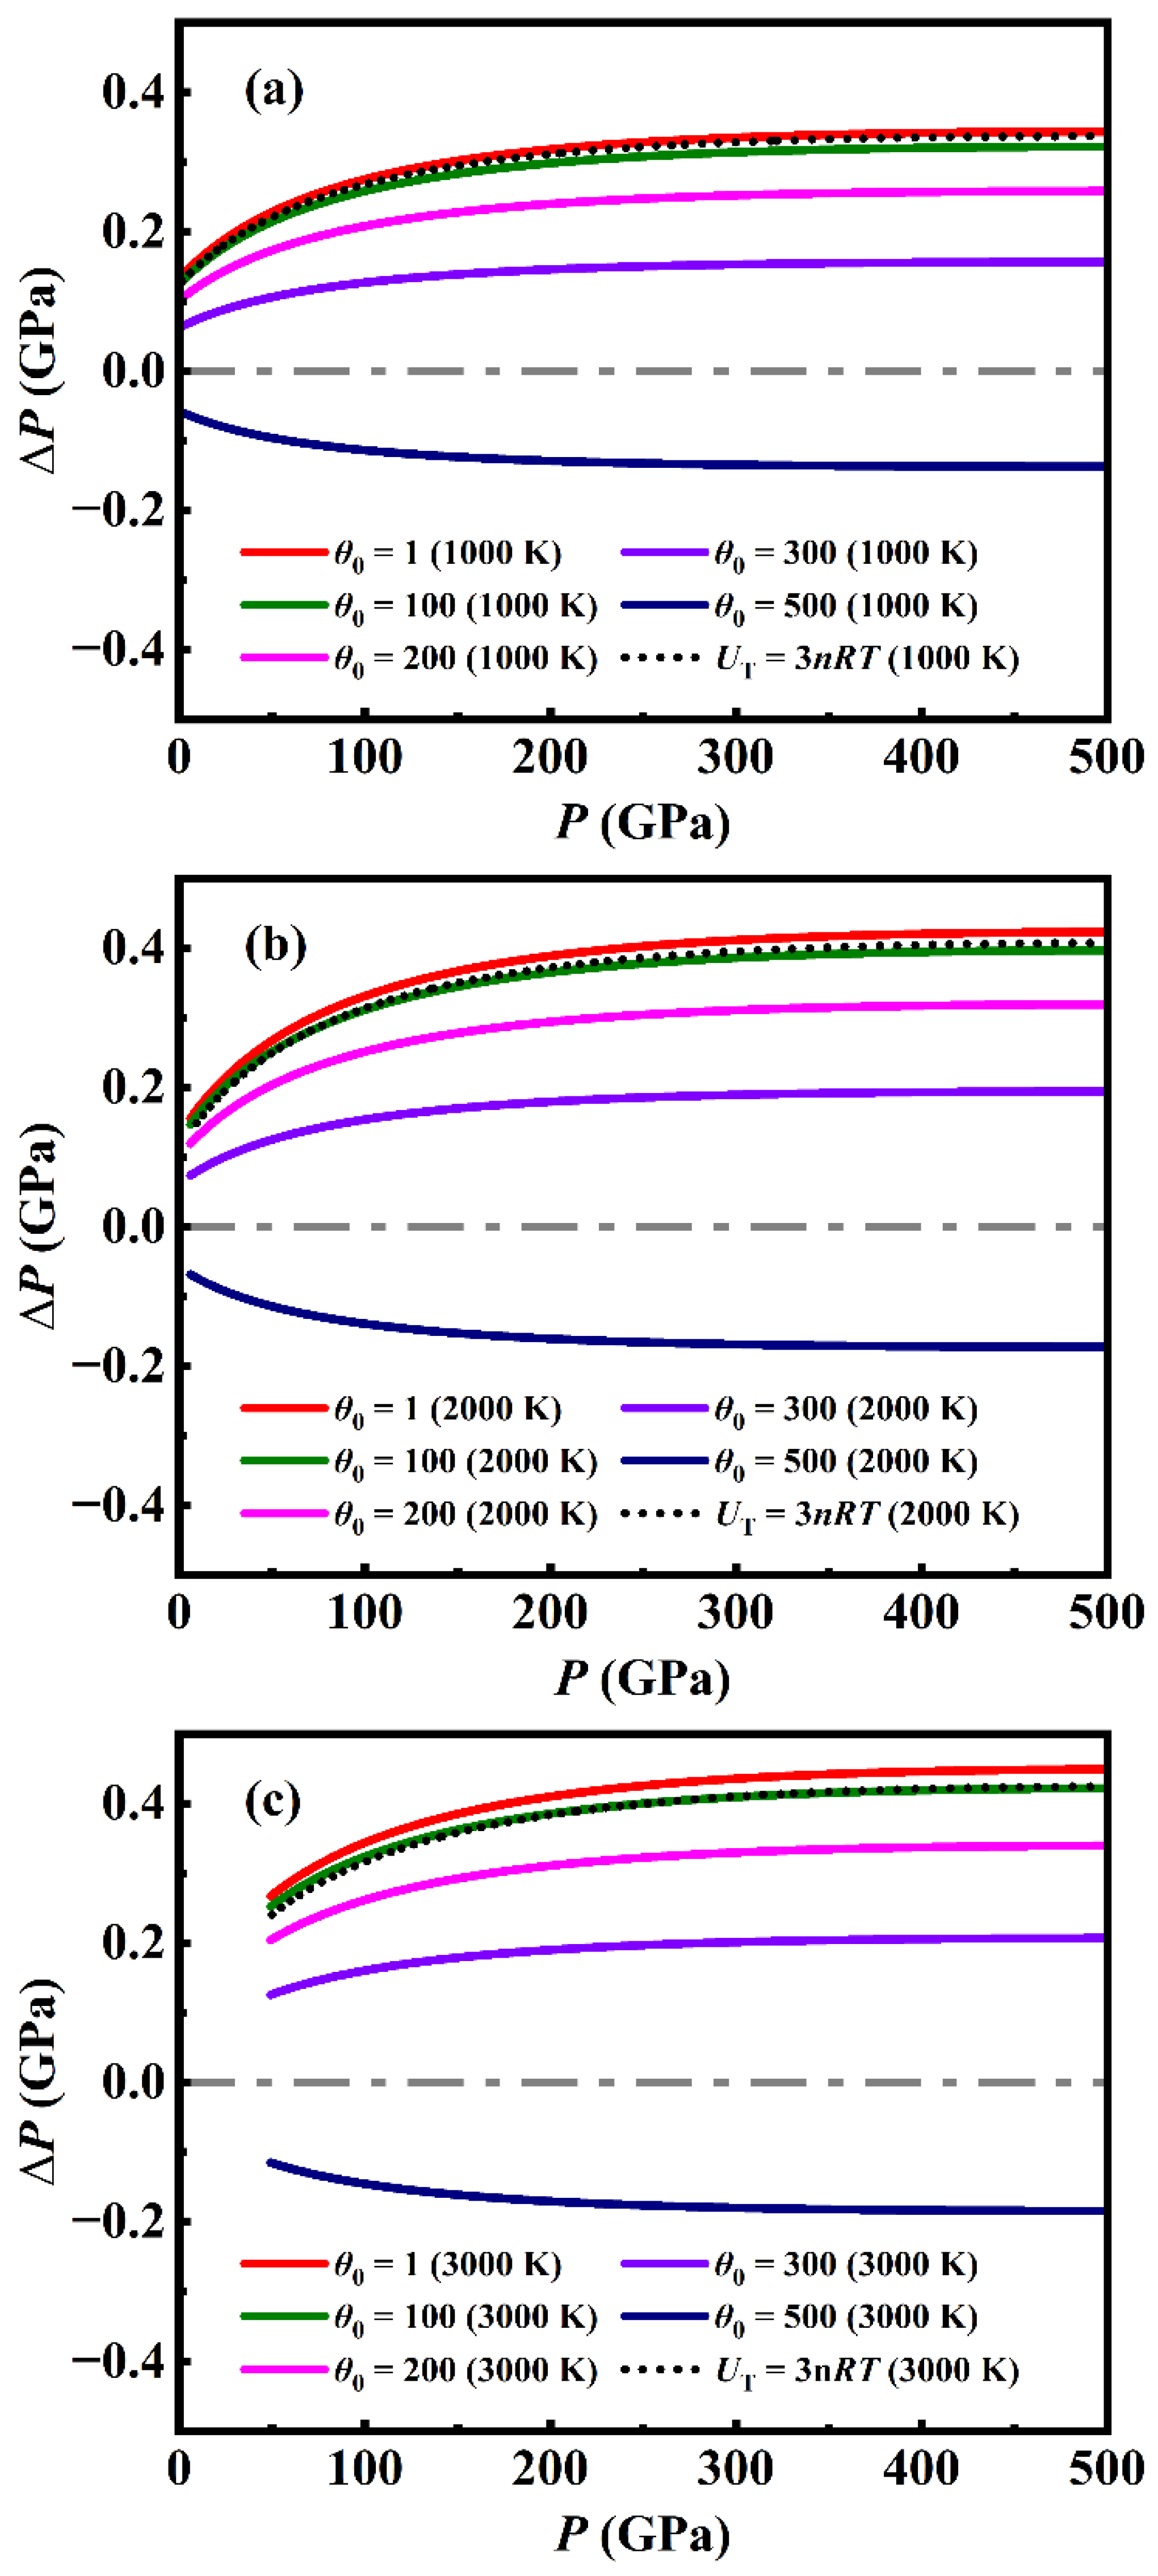
Figure 7.
(color online) The difference of pressure (ΔP) between the analytical EOS prediction and the original results of DIA as a function of pressure P for different temperatures.
Figure 7.
(color online) The difference of pressure (ΔP) between the analytical EOS prediction and the original results of DIA as a function of pressure P for different temperatures.
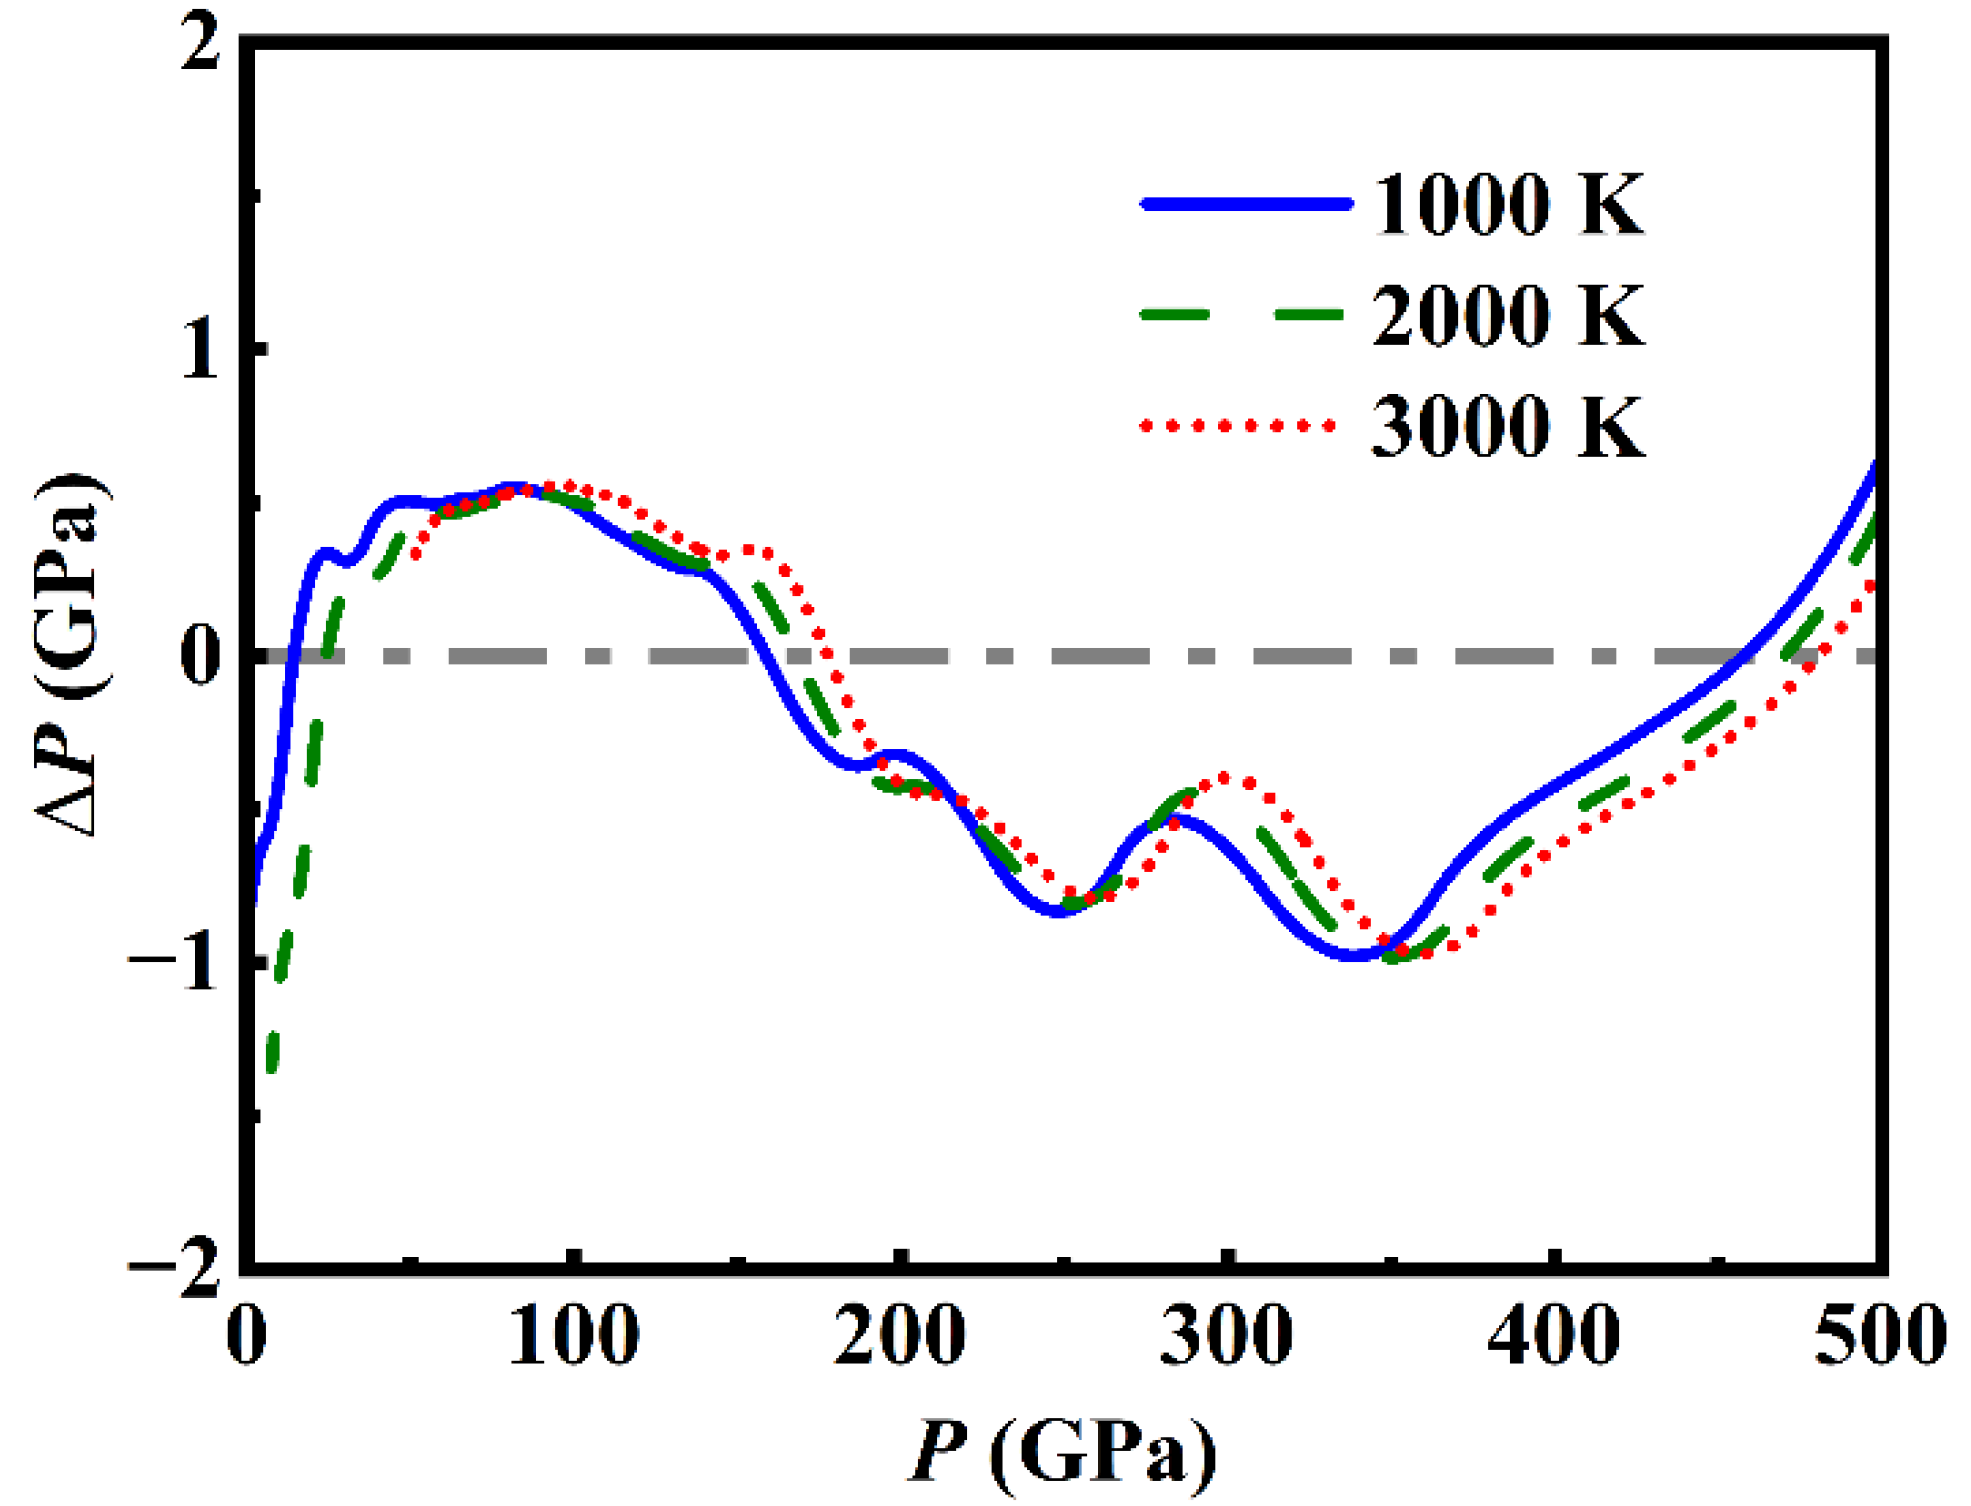
Figure 8.
(color online) Map of the pressure distribution over T-V plane obtained by the simplified model fitting the DIA results (a), and (b) from the MGD model based on the experimental results of Ref. [1]. The solid lines are the isobars separated by 50 GPa.
Figure 8.
(color online) Map of the pressure distribution over T-V plane obtained by the simplified model fitting the DIA results (a), and (b) from the MGD model based on the experimental results of Ref. [1]. The solid lines are the isobars separated by 50 GPa.
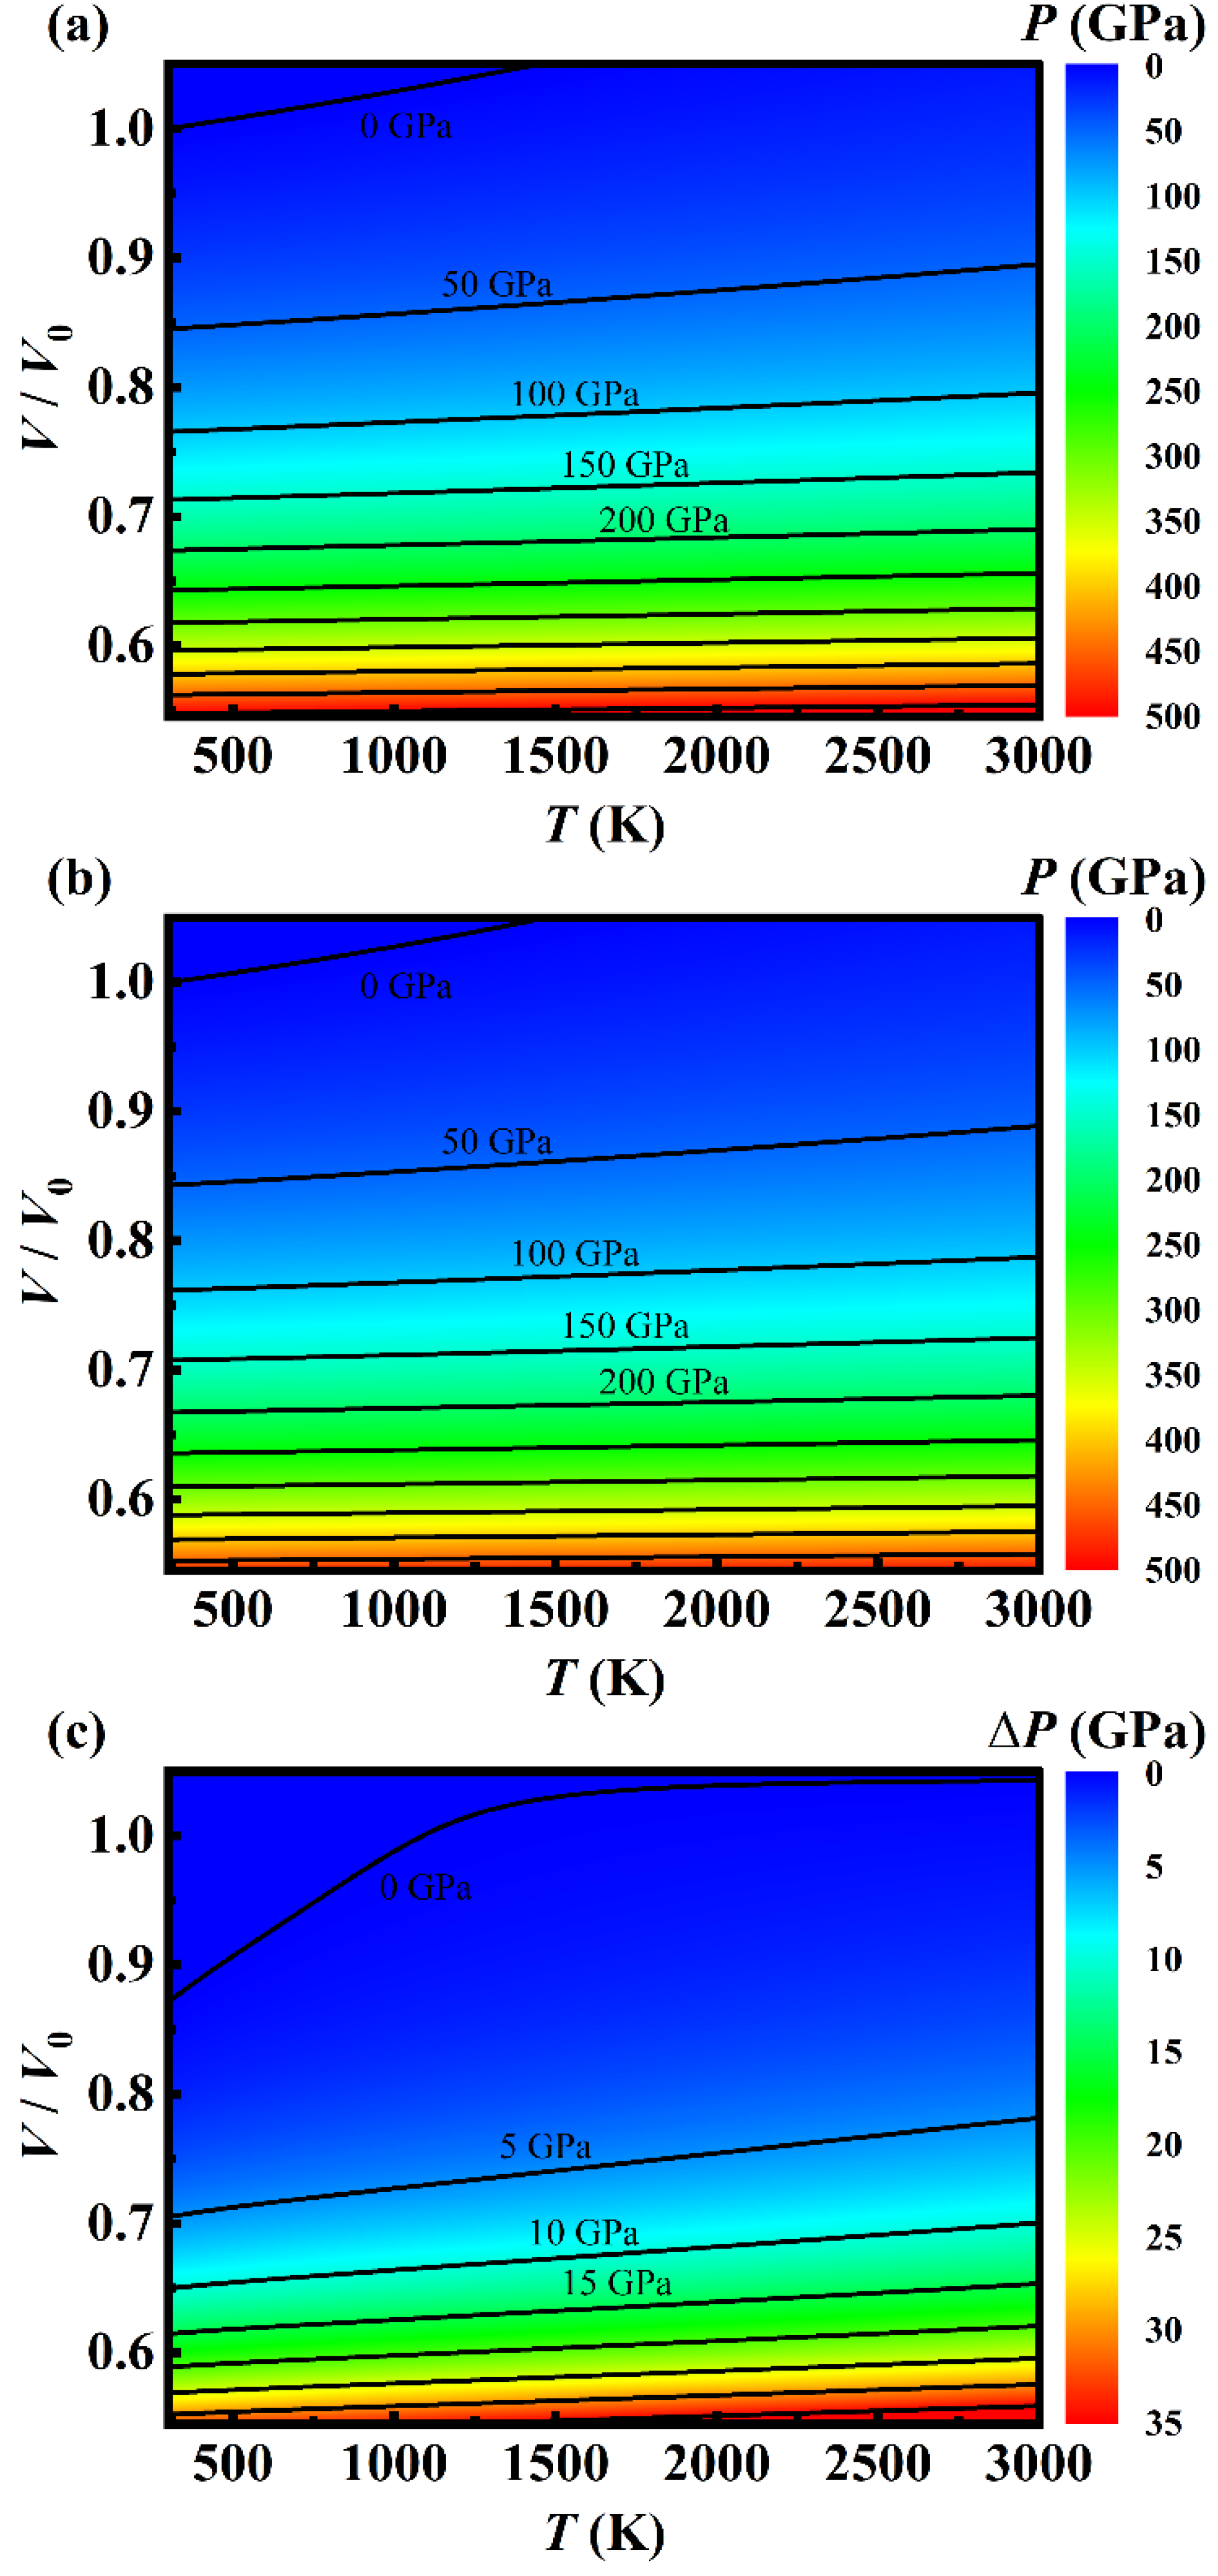

Table 1.
Based on DIA, the calculated volume (Å3/atom) of Ni as a function of the temperature and pressure.
Table 1.
Based on DIA, the calculated volume (Å3/atom) of Ni as a function of the temperature and pressure.
| P (GPa) | 300 K | 500 K | 1000 K | 1500 K | 2000 K | 2500 K | 3000 K |
|---|---|---|---|---|---|---|---|
| 0.0001 | 10.9524 | 11.046 | 11.3055 | 11.6181 | - | - | - |
| 10 | 10.4413 | 10.5118 | 10.7087 | 10.9196 | 11.1518 | - | - |
| 20 | 10.0454 | 10.1001 | 10.2462 | 10.4083 | 10.5905 | - | - |
| 30 | 9.7252 | 9.7727 | 9.8944 | 10.022 | 10.1592 | 10.3093 | - |
| 40 | 9.4478 | 9.4888 | 9.5948 | 9.7067 | 9.8236 | 9.9458 | - |
| 50 | 9.2108 | 9.2467 | 9.3388 | 9.4348 | 9.5355 | 9.6418 | - |
| 60 | 9.0012 | 9.0332 | 9.1153 | 9.2004 | 9.2888 | 9.3809 | 9.4773 |
| 70 | 8.8128 | 8.8418 | 8.9158 | 8.9923 | 9.0716 | 9.1539 | 9.2391 |
| 80 | 8.6424 | 8.6687 | 8.736 | 8.8057 | 8.8775 | 8.9516 | 9.0282 |
| 90 | 8.4875 | 8.5117 | 8.5735 | 8.6369 | 8.7023 | 8.7698 | 8.8395 |
| 100 | 8.3459 | 8.3682 | 8.425 | 8.4834 | 8.5435 | 8.6053 | 8.6688 |
| 110 | 8.2153 | 8.236 | 8.2887 | 8.3428 | 8.3981 | 8.455 | 8.5135 |
| 120 | 8.0941 | 8.1133 | 8.1623 | 8.2127 | 8.2643 | 8.3171 | 8.3712 |
| 130 | 7.9808 | 7.9987 | 8.0445 | 8.0917 | 8.14 | 8.1894 | 8.24 |
| 140 | 7.8748 | 7.8914 | 7.9341 | 7.9783 | 8.0238 | 8.0702 | 8.1177 |
| 150 | 7.7756 | 7.7913 | 7.8313 | 7.8725 | 7.9148 | 7.9583 | 8.0031 |
| 160 | 7.6821 | 7.6973 | 7.7353 | 7.7741 | 7.8137 | 7.8542 | 7.8957 |
| 170 | 7.5932 | 7.608 | 7.6446 | 7.6816 | 7.7191 | 7.7573 | 7.7962 |
| 180 | 7.5083 | 7.5226 | 7.5581 | 7.5937 | 7.6297 | 7.6662 | 7.7032 |
| 190 | 7.427 | 7.4407 | 7.4752 | 7.5096 | 7.5443 | 7.5794 | 7.615 |
| 200 | 7.3501 | 7.3632 | 7.3959 | 7.429 | 7.4625 | 7.4964 | 7.5306 |
| 210 | 7.2779 | 7.2901 | 7.3212 | 7.3526 | 7.3844 | 7.4167 | 7.4496 |
| 220 | 7.2092 | 7.2208 | 7.2502 | 7.2801 | 7.31 | 7.3412 | 7.3724 |
| 230 | 7.1434 | 7.1545 | 7.1826 | 7.211 | 7.24 | 7.2693 | 7.2991 |
| 240 | 7.0798 | 7.0905 | 7.1174 | 7.1448 | 7.1726 | 7.2007 | 7.2293 |
| 250 | 7.0181 | 7.0284 | 7.0543 | 7.0808 | 7.1076 | 7.1348 | 7.1624 |
| 260 | 6.9582 | 6.9681 | 6.9932 | 7.0188 | 7.0448 | 7.0711 | 7.0978 |
| 270 | 6.9005 | 6.9099 | 6.9339 | 6.9587 | 6.9839 | 7.0095 | 7.0353 |
| 280 | 6.8454 | 6.8543 | 6.8773 | 6.9009 | 6.925 | 6.9497 | 6.9748 |
| 290 | 6.7924 | 6.8011 | 6.8232 | 6.8458 | 6.8689 | 6.8924 | 6.9164 |
| 300 | 6.7415 | 6.7499 | 6.7713 | 6.7931 | 6.8152 | 6.8378 | 6.8607 |
| 310 | 6.6923 | 6.7005 | 6.7213 | 6.7424 | 6.7638 | 6.7855 | 6.8076 |
| 320 | 6.6445 | 6.6527 | 6.6731 | 6.6936 | 6.7143 | 6.7353 | 6.7566 |
| 330 | 6.5981 | 6.6061 | 6.6261 | 6.6462 | 6.6664 | 6.6869 | 6.7075 |
| 340 | 6.5528 | 6.5607 | 6.5803 | 6.6 | 6.6198 | 6.6398 | 6.6599 |
| 350 | 6.5087 | 6.5164 | 6.5357 | 6.555 | 6.5744 | 6.5939 | 6.6135 |
| 360 | 6.4657 | 6.4732 | 6.4921 | 6.511 | 6.53 | 6.5491 | 6.5684 |
| 370 | 6.424 | 6.4313 | 6.4496 | 6.468 | 6.4866 | 6.5054 | 6.5242 |
| 380 | 6.3836 | 6.3907 | 6.4085 | 6.4264 | 6.4445 | 6.4627 | 6.4811 |
| 390 | 6.3444 | 6.3513 | 6.3686 | 6.386 | 6.4036 | 6.4213 | 6.4392 |
| 400 | 6.3063 | 6.313 | 6.3299 | 6.3469 | 6.364 | 6.3812 | 6.3986 |
| 410 | 6.2693 | 6.2758 | 6.2922 | 6.3088 | 6.3255 | 6.3423 | 6.3592 |
| 420 | 6.2331 | 6.2395 | 6.2555 | 6.2717 | 6.288 | 6.3044 | 6.3209 |
| 430 | 6.1979 | 6.2041 | 6.2198 | 6.2355 | 6.2514 | 6.2674 | 6.2836 |
| 440 | 6.1635 | 6.1696 | 6.1849 | 6.2003 | 6.2158 | 6.2314 | 6.2472 |
| 450 | 6.1299 | 6.1359 | 6.1508 | 6.1659 | 6.181 | 6.1963 | 6.2117 |
| 460 | 6.0971 | 6.103 | 6.1176 | 6.1323 | 6.1471 | 6.1621 | 6.1771 |
| 470 | 6.065 | 6.0707 | 6.085 | 6.0994 | 6.1139 | 6.1286 | 6.1433 |
| 480 | 6.0336 | 6.0391 | 6.0531 | 6.0672 | 6.0815 | 6.0958 | 6.1103 |
| 490 | 6.0027 | 6.0082 | 6.0219 | 6.0357 | 6.0496 | 6.0637 | 6.0779 |
| 500 | 5.9725 | 5.9778 | 5.9912 | 6.0048 | 6.0185 | 6.0323 | 6.0462 |
Table 2.
The parameters in MGD model (or the simplified one) determined by experimental data (or DIA calculations).
Table 2.
The parameters in MGD model (or the simplified one) determined by experimental data (or DIA calculations).
| DIA | Campbell et al. [2] | Pigott et al. [1] | |
|---|---|---|---|
| V0 (Å3/atom) | 10.909 | 10.939 | 10.926 |
| K0 (GPa) | 200.402 | 179(3) | 201(6) |
| K0´ | 4.637 | 4.3(0.2) | 4.4(0.3) |
| θ0 (K) | / | 415 | 415 |
| γ0 | 2.025 | 2.50(0.06) | 1.98(0.08) |
| q | 0.772 | 1 | 1.3(0.2) |
Disclaimer/Publisher’s Note: The statements, opinions and data contained in all publications are solely those of the individual author(s) and contributor(s) and not of MDPI and/or the editor(s). MDPI and/or the editor(s) disclaim responsibility for any injury to people or property resulting from any ideas, methods, instructions or products referred to in the content. |
© 2025 by the authors. Licensee MDPI, Basel, Switzerland. This article is an open access article distributed under the terms and conditions of the Creative Commons Attribution (CC BY) license (http://creativecommons.org/licenses/by/4.0/).
Copyright: This open access article is published under a Creative Commons CC BY 4.0 license, which permit the free download, distribution, and reuse, provided that the author and preprint are cited in any reuse.


