Submitted:
01 April 2025
Posted:
02 April 2025
Read the latest preprint version here
Abstract
Urban flooding in economically and environmentally vulnerable areas—such as alleyways, lowlands, and semi-basement residences—poses serious threats to lives and property. Existing flood detection research has largely relied on aerial or satellite-based distant-view imagery. While some studies have explored ground-level images, datasets specifically focused on flood-vulnerable areas remain scarce. To address this gap, we introduce AlleyFloodNet, a ground-level image dataset designed to support rapid and accurate flood classification in high-risk urban environments. The dataset reflects a variety of real-world conditions, enabling deep learning models to better recognize floods in complex urban settings. We fine-tuned classification models using AlleyFloodNet and compared their performance to models fine-tuned on FloodNet, a widely used UAV-based dataset. Results show that models trained on AlleyFloodNet significantly outperform those trained on FloodNet when applied to ground-level flood images. This demonstrates the importance of viewpoint-specific data in improving detection accuracy for localized flooding. By constructing a dataset tailored to economically and flood-vulnerable areas, this study contributes to the development of practical flood detection systems that aim to reduce disaster impacts and enhance protection for at-risk communities.
Keywords:
flood detection
; image classification
; computer vision
; ground-level imagery
1. Introduction
Globally, flood damage caused by heavy rainfall has been increasing significantly due to climate change [1,2,3,4]. Areas such as semi-basement residential zones, narrow alleyways, underpasses, and lowlands with inadequate drainage infrastructure are particularly vulnerable to flooding, often inhabited by economically vulnerable populations, leading to substantial financial losses and challenging recovery efforts [5,6,7]. They are exposed to greater risks, as they face relative difficulties in emergency evacuation and have limited capacity to respond swiftly during flood events [8,9].
In 2022, unusually heavy rainfall in Seoul, South Korea, flooded semi-basement residential areas, resulting in the deaths of residents who were unable to evacuate in time. In 2023 as well, the underground roadway in Osong, South Korea, was flooded, resulting in numerous casualties. In 2024, a flash flood also occurred in Valencia, Spain, resulting in multiple fatalities reported in narrow alleyways. These cases indicate that the risks of heavy rainfall and flooding induced by climate change are steadily increasing on a global scale, and that existing disaster prevention systems are insufficient to effectively prevent or respond to all flood-related damages [10,11].
Thus far, research on deep learning-based flood detection and prediction has primarily focused on data from areas near rivers or large-scale inundation zones [12,13]. Moreover, most existing studies have relied on data collected from a distance or on aerial data obtained through unmanned aerial vehicles (UAVs) [14,15,16]. While such approaches may be effective in detecting large-scale river flooding or widespread inundation, they have limitations in accurately identifying localized flood-vulnerable areas within urban environments, such as narrow alleyways or semi-basement residential zones [16,17]. Although some studies have utilized ground-level imagery to analyze flooding, the images were not specifically tailored to flood-vulnerable areas such as narrow alleyways or semi-basement dwellings [17,18]. In particular, while UAV-based data can provide high-resolution imagery, it is often difficult to achieve immediate detection and response in rapidly evolving flood situations.[19] Therefore, there is a growing need for data collection and analysis specifically focused on flood-vulnerable areas.
Previous studies have not adequately considered the socio-economic vulnerability of flood-vulnerable areas, indicating a pressing need for research in this domain. The development of customized flood detection and response systems is essential for addressing the needs of flood-vulnerable areas. To address this issue, this study constructs a specialized ground-level image dataset, AlleyFloodNet, designed to accurately predict and alert flood impacts in flood-vulnerable areas such as narrow alleyways, lowlands, and semi-basement residential spaces. Unlike previous studies, this research conducts ground-level image analysis specifically tailored to flood-vulnerable areas such as narrow alleyways. The primary objective of this study is to overcome the limitations of prior research and enable practical responses in real-world disaster situations.
In this study, various deep learning-based image classification models will be fine-tuned using the constructed dataset, and their performance will be evaluated using metrics such as accuracy, precision, recall, and F1-score. Misclassifications will also be explored to better understand challenging conditions in flood-vulnerable areas. Furthermore, deep learning models were fine-tuned separately using FloodNet and AlleyFloodNet, and their performance was compared on the AlleyFloodNet test set. This study aims to support the improvement of image classification algorithms and the refinement of AlleyFloodNet. The overall workflow of this study is summarized in Figure 1.
2. Related Works
Rahnemoonfar et al. addressed the limitations of conventional flood datasets, which primarily relied on low-resolution satellite imagery with infrequent updates, making rapid and efficient damage assessment difficult. To overcome this, the authors employed high-resolution UAV imagery, enabling access to hard-to-reach areas and facilitating more detailed scene analysis. In addition, the proposed FloodNet dataset provides pixel-level annotations for semantic segmentation tasks, including classification of flooded and non-flooded regions [16].
Zhao et al. highlighted the limitations of traditional remote sensing technologies, which, despite their ability to cover wide areas, struggle to provide real-time, localized flood monitoring due to spatiotemporal resolution constraints. In particular, accurate detection under low-light conditions, such as nighttime or heavy rainfall, remains a persistent challenge due to the complex and dynamic characteristics of inundated areas. To address these challenges, the authors leveraged urban surveillance cameras and proposed a deep learning-based framework that incorporates specialized imaging models tailored to low-light flood scenarios and robust feature extraction techniques resilient to various environmental changes [18].
Munawar et al. developed an automated flood detection system utilizing Unmanned Aerial Vehicles (UAVs) to overcome the limitations of satellite-based approaches, which suffer from low spatial resolution and delayed response times in disaster scenarios. The proposed method employs aerial imagery captured by UAVs to determine flood occurrence, enabling rapid and localized assessment. To this end, Haar cascade classifiers were applied to detect landmarks such as buildings and roads in UAV images, which served as the basis for training a deep learning model for flood classification [20].
Stateczny et al. proposed a flood detection framework using satellite imagery, which integrates median filtering for image preprocessing and a K-means clustering algorithm enhanced by cubic chaotic map-based weighting to segment inundated areas. Subsequently, multiple vegetation indices such as DVI, NDVI, MTVI, GVI, and SAVI were extracted to characterize the landscape and enhance analytical precision. For flood prediction, the authors constructed a hybrid deep learning model (DHMFP) by combining CNN and deep ResNet architectures, aiming to capture both local and global features. To optimize model performance, the Combined Harris Hawks Shuffled Shepherd Optimization (CHHSSO) algorithm was introduced for fine-tuning model weights [21].
Munawar et al. proposed a methodology that utilizes UAV-based aerial imagery and Convolutional Neural Networks (CNNs) to automatically extract flood-affected features and assess infrastructure damage in disaster-vulnerable areas. The study focused on flood-vulnerable regions along the Indus River in Pakistan, where pre- and post-disaster UAV images were collected to support the analysis. A total of 2,150 image patches were generated for model training, enabling the CNN to effectively learn flood-related spatial patterns [22].
Yoo et al. proposed a U-Net-based flooding region segmentation model for detecting inundation in urban underpasses using near-field image data. To train and evaluate the model, near-field images were collected from urban underpasses in Daejeon, South Korea, to construct a dedicated dataset. The proposed model achieved Dice coefficients of 98.8%, 94.03%, and 93.85%, respectively, across the three locations, demonstrating high segmentation performance [23].
Zhong et al. employed the YOLOv4 object detection model to estimate flood depth by identifying submerged objects—such as pedestrians’ legs and vehicle exhaust pipes—in flood imagery. The method achieved a mean average precision (mAP) of 89.29% on a dataset of 1,177 flood images, with vehicle-based reference showing higher accuracy than human-based estimation. This approach enables real-time flood depth estimation using existing traffic camera footage, offering a cost-effective and immediately deployable solution without the need for additional sensors [24].
Vo et al. investigated the potential of utilizing street view imagery to identify building-level indicators of flood vulnerability, such as the presence of basements or semi-basements, in support of urban flood risk assessment. The study focuses on identifying visual features that indicate basement structures, evaluating the availability and suitability of image data sources, and applying computer vision algorithms to automatically detect relevant features [25].
Witherow et al. [26] proposed an image processing pipeline for detecting roadway flooding using images captured by mobile devices such as smartphones. To address challenges arising from the varying resolution, lighting conditions, and environmental noise in crowdsourced data—as well as dynamic elements like vehicles and pedestrians—the pipeline incorporates preprocessing techniques such as water edge detection, image inpainting, and contrast enhancement. In addition, the method utilizes R-CNN for vehicle detection and removal, SIFT for image alignment, and specialized techniques for flood boundary detection and reflection elimination [26].
Zeng et al. proposed a deep learning-based flood detection system that automatically identifies the extent and location of urban flooding using surveillance camera footage. The system employed the DeepLabv3+ model, which outperformed Mask R-CNN in segmentation accuracy and was further enhanced using a Super-Resolution GAN (SRGAN). Experimental results demonstrated high detection performance, with a precision of 84%, recall of 91%, and mean Intersection over Union (mIoU) of 85.8% [27].
Manaf et al. [28] constructed a new flood image dataset by integrating benchmark datasets and collecting additional images from the web to improve classification performance across regions and resolutions. A comparative analysis of CNN-based deep learning models revealed that MobileNet and Xception outperformed ResNet-50, VGG-16, and Inception(v3), achieving an accuracy of 98% and an F1-score of 92%. The study contributes to enhancing the generalizability of flood image classification models and improving the processing of low-resolution imagery [28].
3. Materials and Methods
3.1. Data Development and Preprocessing
In this study, we constructed a dataset named AlleyFloodNet, composed of flood and non-flood images, to identify the occurrence of flooding using a binary classification approach. The dataset primarily consists of images from South Korea, and it was developed by collecting photographs of flood-vulnerable areas such as alleyways, semi-basement residences, and lowlands around the world, taken via CCTV and smartphones, from Google and YouTube.
AlleyFloodNet was developed by taking into account various types of floods that occur in flood-vulnerable areas. Floods can take different forms, such as rapidly flowing and rising water or stagnant and gradually rising water. Depending on the form of the flood, the color of the water can also vary—appearing brown due to mixed soil or remaining relatively clear. Furthermore, the visual characteristics of the water change according to the time of day, as the amount of light varies, and floods tend to cause more damage under lower lighting conditions. To account for the diverse characteristics of floods mentioned earlier, AlleyFloodNet was developed to classify flood situations effectively across a wide range of conditions, including flood types, water color, and visual changes over time.
AlleyFloodNet was developed by collecting not only photographs of flooding situations taken in alleys and lowlands, but also images captured under non-flooding conditions, to perform binary classification of flooding versus non-flooding. Compared to existing datasets, it was designed to enable precise detection of flooding in alleys, narrow roads, and areas near semi-basement windows by including close-range images captured from relatively low positions. This allows the deep learning models to quickly detect situations in which water rapidly accumulates, and to accurately assess the actual risk of flooding rather than simply determining the presence of rainfall. Moreover, both flooding and non-flooding data include various objects such as people and vehicles, allowing the model to be trained effectively under diverse environmental conditions. Based on this design, AlleyFloodNet is structured to support effective model training in various flood-prone areas and is expected to contribute to flooding detection in vulnerable regions.
A total of 971 images were collected for use in this study. The size of AlleyFloodNet was determined with reference to the training set size (637 images) of FloodNet Track1, a well-known dataset for flooding and non-flooding classification. All images were preprocessed using the ImageNet mean and standard deviation and resized to 224×224 pixels. The entire dataset was evenly divided across classes into a training set and a test set at a ratio of 8:2. Additionally, the training set was further split into a training and validation set at a ratio of 8:2, maintaining class balance. As a result, the dataset was divided as follows: the training set consisted of 454 flooding and 322 non-flooding images; the test set included 114 flooding and 81 non-flooding images; and the validation set contained 92 flooding and 63 non-flooding images. Figure 2 shows example images from the flood class, while Figure 3 presents example images from the non-flood class in the AlleyFloodNet dataset.
3.2. Models
3.2.1. AlexNet
AlexNet is a representative deep Convolutional Neural Network (CNN)-based model that gained significant attention for its outstanding performance in the 2012 ImageNet Large Scale Visual Recognition Challenge (ILSVRC). This model features a deeper and more complex architecture compared to earlier shallow CNNs such as LeNet, consisting of five convolutional layers and three fully connected layers. One of the key characteristics of AlexNet is its use of the Rectified Linear Unit (ReLU) activation function, which accelerates training compared to traditional Sigmoid or Hyperbolic Tangent (Tanh) functions. In addition, it employs the Dropout technique to prevent overfitting and applies Local Response Normalization (LRN) to suppress excessive activation of specific neurons. Furthermore, the model significantly improved training speed by optimizing parallel computation on GPUs. AlexNet demonstrated excellent performance on large-scale datasets such as ImageNet and played a pivotal role in the advancement of CNN-based deep learning models. However, despite its relatively deep architecture, it has the drawback of requiring more computational resources and memory compared to more recent models such as VGGNet and ResNet. Nevertheless, AlexNet remains widely used in various studies as a foundational model for CNN-based image classification [29].
3.2.2. VGG-19
VGG-19 is one of the models in the VGGNet family and is characterized by a deep neural network architecture comprising 19 layers. This model gained attention for its outstanding performance in the 2014 ILSVRC and was designed to enable sophisticated pattern learning by incorporating deeper convolutional layers compared to traditional CNN architectures. A key feature of VGG-19 is its use of small 3×3 convolutional filters applied consecutively, which allows for computational efficiency even in a deep network. These small filters introduce more non-linearity, thereby enhancing the model’s representational capacity and enabling effective learning of complex features. In addition, max pooling layers are employed to control the size of the feature maps, and final classification is performed through two fully connected layers, each containing 4096 neurons. Although VGG-19 has a relatively simple architecture, it delivers high performance, with the drawback of increased computational cost as the network depth increases. As the network depth increases, the risk of gradient vanishing becomes more pronounced, and techniques such as batch normalization are sometimes employed to mitigate this issue. Nevertheless, VGG-19 remains a powerful model that continues to demonstrate high performance in various image classification and object detection tasks [30].
3.2.3. ResNet-50
ResNet (Residual Network) is a model that introduces the residual learning technique to address the gradient vanishing problem that arises as neural networks become deeper. ResNet-50 features a deep neural network architecture consisting of 50 layers and employs blocks that follow a 1×1, 3×3, 1×1 bottleneck structure to optimize computational efficiency. The most important characteristic of ResNet is its introduction of skip connections (also known as shortcut connections). In conventional CNNs, deeper networks may suffer from information loss or distortion, but ResNet is designed to preserve information by directly adding the output of a previous layer to a subsequent layer, thereby facilitating stable training even in very deep networks. Owing to these characteristics, ResNet-50 maintains high performance on large-scale datasets such as ImageNet, and enables stable learning even in deeper networks compared to traditional CNN-based models. Moreover, it is widely applied in various vision tasks such as object detection and segmentation, and is regarded as one of the leading neural network models due to its high performance and strong generalization capabilities [31].
3.2.4. DenseNet-121
DenseNet-121 (Dense Convolutional Network-121) is a neural network architecture in which each layer receives as input the outputs of all preceding layers, differing from conventional CNN models. This dense connectivity improves information flow and mitigates the gradient vanishing problem. While consisting of 121 layers, it adopts a computationally efficient architecture in which direct connections between all layers enable more effective feature propagation and enhance training efficiency. Furthermore, it employs bottleneck layers using 1×1 convolutions and applies global average pooling (GAP) to reduce redundant computation and the number of parameters, while maintaining high performance. DenseNet-121 demonstrates strong generalization performance, particularly in environments with limited datasets, and is effectively applied in various fields such as medical image analysis, object recognition, and image classification. Compared to models such as VGGNet and ResNet, DenseNet-121 maintains excellent performance while requiring significantly fewer parameters. In particular, it is regarded as a powerful CNN model due to its ability to support deep network training with reduced memory consumption [32].
3.2.5. ViT (Vision Transformer)
ViT (Vision Transformer) is an image classification model that utilizes a Transformer-based architecture instead of a CNN, applying the self-attention mechanism originally developed for natural language processing (NLP) to visual tasks. ViT divides an input image into fixed-size patches, linearly projects each patch into an embedding, and then learns features using a Transformer encoder. This architecture enables more effective learning of long-range dependencies than CNNs, and outperforms CNN-based models on large-scale datasets. However, Transformer-based models require large amounts of data and high computational resources, and may underperform compared to CNNs on smaller datasets. These limitations can be addressed through transfer learning using pre-trained models, and recently, hybrid architectures combining CNNs and Transformers have emerged.
3.2.6. ConvNeXt
ConvNeXt is a modernized convolutional neural network (CNN) architecture built upon ResNet, while incorporating design elements inspired by recent Transformer-based models such as the Swin Transformer. To overcome limitations of traditional CNNs and enhance competitiveness with Transformer-based models, ConvNeXt applies various optimization techniques including improved normalization strategies, deeper network architectures, and the use of depthwise separable convolutions. It introduces layer normalization and large 7×7 convolutional kernels to ensure a broader receptive field. While preserving the advantages of CNNs, ConvNeXt integrates structural refinements aligned with modern deep learning practices, achieving high computational efficiency and strong performance across various computer vision tasks such as object detection, image classification, and semantic segmentation. Notably, ConvNeXt challenges the perception that CNNs are inferior to Transformer models in terms of representational capacity and performance and demonstrates that CNN-based architectures remain highly relevant in contemporary deep learning research.
3.3. Experimental Setup
In this study, experiments were conducted using PyTorch in a Google Colab environment equipped with an NVIDIA A100 GPU to evaluate the performance of image classification models. Input images were resized to 224 × 224 pixels and normalized using the mean (0.485, 0.456, 0.406) and standard deviation (0.229, 0.224, 0.225) of the ImageNet dataset to enhance model generalization. The data were loaded in batches of size 32 for training, validation, and testing. For model training, BCEWithLogitsLoss—commonly used for binary classification tasks—was employed as the loss function, and the Adam optimizer was used to effectively update model weights. In consideration of training stability and convergence speed, the learning rate was set to 0.0001. Based on the experimental setup and hyperparameter configuration, the model was trained and validated, and its performance was subsequently evaluated.
3.4. Evaluation Metrics
To comprehensively evaluate model performance, accuracy, recall, precision, and F1-score were employed as the primary evaluation metrics. Accuracy represents the proportion of correctly classified samples out of the total samples and serves as a useful indicator of overall model performance. However, in the presence of class imbalance, accuracy alone may be insufficient for performance assessment; thus, additional metrics were analyzed in conjunction. Recall indicates the proportion of actual positive samples that are correctly predicted and is particularly important in domains such as medical diagnosis or anomaly detection, where false negatives can have critical consequences. In contrast, precision measures the proportion of predicted positive samples that are truly positive and is particularly relevant in tasks such as financial fraud detection or spam filtering, where reducing false positives is crucial. astly, the F1-score considers the balance between precision and recall by computing their harmonic mean, enabling an unbiased evaluation that does not favor either metric. n this study, these evaluation metrics were collectively analyzed to compare the predictive performance of the models and to identify the most optimal model.
3.5. Average Fine-Tuning Time per Epoch and Single Image Inference Time
To compare the training speed and real-time detection capability of each model, the average training time per epoch and single image inference time were measured. The average fine-tuning time per epoch was measured by recording the fine-tuning time for each epoch using the AlleyFloodNet dataset and calculating the mean. This enabled analysis of the differences in training speed across models. Single image inference time was calculated by averaging the prediction times for 224×224-sized images from the test set after model training was completed. This was used to evaluate the extent to which each model can process data in real-time within a flood detection system
3.6. Comparative Analysis of Flood Datasets and Misclassification Patterns
This study conducted comparative experiments with the existing FloodNet dataset to evaluate the usefulness of the newly built AlleyFloodNet dataset. FloodNet Track 1 is designed for binary classification tasks for flood detection within the FloodNet dataset, primarily containing flood and non-flood images captured from a distance. In contrast, AlleyFloodNet is a dataset designed to more accurately detect flood-vulnerable areas within urban settings, including flood and non-flood images taken in alleys, semi-basement building entrances, and lowlands. Most of the data consists of near-field images captured by ground-based cameras such as CCTV and smartphones.
In the comparative experiments, we analyzed two cases separately: fine-tuning a pre-trained model using FloodNet Track1 and fine-tuning a pre-trained model using AlleyFloodNet. Both models were configured with the same architecture, and identical train-validation split ratios and hyperparameters were applied during training to ensure a fair comparison. Subsequently, the performance of both models was evaluated using the test set of AlleyFloodNet, and performance metrics such as accuracy, precision, recall, and F1-score were compared. Through these experiments, we compared which dataset—FloodNet, a conventional UAV-based flood detection dataset, or AlleyFloodNet—was more suitable for detecting flood-prone areas. This study aims to quantitatively evaluate the performance of the two models and determine which dataset is more appropriate for effective detection in flood-vulnerable areas such as narrow alleys. In addition, misclassified images from the fine-tuned model with the best performance are analyzed to identify potential improvements for both the dataset and the model in the future.
4. Results and Discussion
4.1. Comparison of Model Performance: Accuracy, Precision, Recall, and F1 Score
In this study, we conducted experiments using six deep learning models—AlexNet, ResNet, VGG19, Vision Transformer (ViT), DenseNet121, and ConvNeXt-Large—to compare their performance in flood detection. The evaluation of model performance was based on accuracy, precision, recall, and F1 score.
According to the performance analysis, the ConvNeXt-Large model achieved the highest accuracy of 0.9590, followed by the Vision Transformer (ViT) model with an accuracy of 0.9487. Notably, the ConvNeXt-Large model achieved the highest precision (0.9740) and F1 score (0.9494), while the ViT model attained the highest recall value (0.9753). ResNet, VGG19, and DenseNet121 also demonstrated relatively strong performance, whereas AlexNet showed comparatively lower accuracy (0.8872) and F1 score (0.8690), indicating inferior performance compared to the other models. These results suggest that the superior performance of the ConvNeXt-Large and ViT models in flood detection can be attributed to their advanced feature extraction capabilities enabled by state-of-the-art network architectures.
To further investigate model behavior, training and validation loss/accuracy curves were plotted (Figure 4), demonstrating rapid convergence with relatively stable validation trends. In addition, a confusion matrix (Figure 5) was used to analyze classification errors, revealing that ConvNeXt-Large correctly classified 112 flood and 75 non-flood images, with only minimal misclassifications (2 false negatives and 6 false positives). These findings reinforce the advantage of advanced architectures like ViT and ConvNeXt-Large for flood detection in complex urban scenarios.

Table 1.
Comparison of Model Performance.
| Model Name | Accuracy | Precision | Recall | F1 Score |
|---|---|---|---|---|
| AlexNet ResNet50 VGG19 ViT DenseNet121 |
0.8872 0.9436 0.9333 0.9487 0.9385 |
0.8391 0.9487 0.9048 0.9080 0.9259 |
0.9012 0.9136 0.9383 0.9753 0.9259 |
0.8690 0.9308 0.9212 0.9405 0.9259 |
| ConvNeXt-Large | 0.9590 | 0.9740 | 0.9259 | 0.9494 |
4.2. Results of Average Fine-Tuning Time per Epoch and Single Image Inference Time
To evaluate the training speed and real-time applicability of each model, we measured the average fine-tuning time per epoch and single image inference time. AlexNet and ResNet exhibited the fastest training speeds, with an average fine-tuning time of approximately 5 to 6 seconds per epoch, whereas ConvNeXt-Large required the longest time at 17.48 seconds per epoch. This can be attributed to the increased computational complexity of the ConvNeXt-Large model, which employs a more intricate neural network architecture. In terms of single image inference time, the ViT model demonstrated the fastest speed at 0.007917 seconds, followed by AlexNet with a relatively fast inference time of 0.009549 seconds. Conversely, DenseNet121 showed the slowest inference speed at 0.113015 seconds, and ConvNeXt-Large also exhibited relatively high computational cost with an inference time of 0.021080 seconds. Taken together, although the ConvNeXt-Large model demonstrated the highest performance, its prolonged training time and relatively slow inference speed may serve as limitations. The ViT model, offering both fast inference speed and strong performance, may be considered a suitable candidate for real-time flood detection systems.
4.3. Results Comparative Analysis of Flood Datasets and Misclassification Patterns
Models fine-tuned using the AlleyFloodNet generally demonstrated high performance, with ConvNeXt-Large achieving the most outstanding results (Accuracy: 0.9590, F1 Score: 0.9494). In contrast, models fine-tuned on FloodNet Track1 and evaluated on the AlleyFloodNet test set exhibited a marked decline in performance (Accuracy: 0.3385–0.5128). This suggests that due to the domain discrepancy between FloodNet and AlleyFloodNet, models trained on FloodNet failed to generalize to narrow alleyways and semi-basement environments. In other words, datasets based solely on distant-view images (such as FloodNet) are insufficient for effectively detecting flood-vulnerable micro-urban areas (e.g., alleyways, semi-basements), underscoring the necessity of specialized datasets like AlleyFloodNet. The ConvNeXt model fine-tuned on AlleyFloodNet, which achieved the best performance, demonstrated reliable classification even in low-light conditions.
Misclassifications primarily occurred in environments with very low illumination, where even high-performance models struggled to achieve accurate classification due to insufficient visual information. In particular, when dim or distant streetlights illuminated only parts of the scene, the model had difficulty distinguishing between wet surfaces reflecting light and actual flooded areas. Examples of such misclassifications can be seen in Figure 6. Thus, despite the current dataset encompassing diverse environments, its limitation in adequately representing low-light or nighttime flooding scenarios has become apparent. To address these issues, future studies should consider enhancing model robustness through increased collection of nighttime images, data augmentation simulating low-light conditions, or the incorporation of multimodal information such as thermal or infrared imagery.
5. Conclusions
The significance of this study lies in the construction of a specialized, close-range image dataset—AlleyFloodNet—that precisely reflects flood-vulnerable areas such as narrow alleyways and semi-basement residences, and in the experimental validation of deep learning-based flood classification models tailored to these environments. AlleyFloodNet was designed to effectively capture and learn flood patterns in narrow and structurally complex urban environments, which are difficult to observe using conventional satellite- or UAV-based distant-view datasets. Experimental results confirmed its superior detection performance in such regions. Although previous studies have utilized images captured from low viewpoints—such as those from CCTV or Google Street View—for flood detection, the distinctiveness of this study lies in the development of the AlleyFloodNet using images from flood-vulnerable areas and applying it specifically to image classification. Furthermore, this study extends beyond a purely technical approach by focusing its analysis on areas densely populated by economically vulnerable groups, which are repeatedly affected by flooding due to climate change. In doing so, it aims to establish a practical foundation for protecting the lives and property of these at-risk communities.
Future research will focus on expanding AlleyFloodNet to accommodate diverse environmental factors—such as urban structures, climatic conditions, lighting levels, and time of day—in order to enhance model performance under a wider range of real-world scenarios. In particular, misclassified images will be utilized to augment the dataset, enabling deep learning models to learn from a broader spectrum of visual patterns. Additionally, analysis of these misclassified images revealed that, in order to reliably detect flooding in situations such as during dark nighttime conditions, appropriate lighting is necessary to discern the presence of stagnant water. Moreover, to ensure practical deployment of the fine-tuned deep learning models in real-world disaster response systems, it is essential to achieve real-time performance through model compression and computational optimization techniques. Building upon the findings of this study, it will be possible to develop an integrated flood response platform encompassing flood depth prediction, risk visualization, and evacuation route guidance. These follow-up studies are expected to contribute significantly to enhancing the field applicability and societal effectiveness of disaster response technologies, while providing a technological foundation for protecting flood-prone areas and vulnerable populations repeatedly affected by climate change.
Acknowledgments
This work was supported by the research fund of Hanyang University(HY-201700000000816).
References
- Rising Waters: Leveraging VIIRS for Enhanced Global Flood Preparedness and Response. National Environmental Satellite, Data, and Information Service (NESDIS). Available online: https://www.nesdis.noaa.gov/news/rising-waters-leveraging-viirs-enhanced-global-flood-preparedness-and-response (accessed on 28 March 2025).
- Tabari H. (2020). Climate change impact on flood and extreme precipitation increases with water availability. Scientific Reports, 10(1), 13768. [CrossRef]
- Ruan, X.; Sun, H.; Shou, W.; Wang, J. The Impact of Climate Change and Urbanization on Compound Flood Risks in Coastal Areas: A Comprehensive Review of Methods. Appl. Sci. 2024, 14, 10019. [CrossRef]
- United Nations Environment Programme. How climate change is making record-breaking floods the new normal. UNEP. Available online: https://www.unep.org/news-and-stories/story/how-climate-change-making-record-breaking-floods-new-normal (accessed on 19 March 2025).
- Ro, B.; Park, H. The Impact of Anthropogenic Changes on Socioeconomically Marginalized Population in Urban Areas: A Case Study of Flood Risk in Seoul, South Korea. In Proceedings of the EGU General Assembly 2024, Vienna, Austria, 14–19 April 2024. https://doi.org/10.5194/egusphere-egu24-17950.
- Braun, B., & Aßheuer, T. (2011). Floods in megacity environments: Vulnerability and coping strategies of slum dwellers in Dhaka/Bangladesh. Natural Hazards, 58(3), 771–787. [CrossRef]
- Vuong Tai, C.; Kim, D.; Kronenberg, R.; Vorobevskii, I.; Luong, T.T. Beneath the Surface: Exploring Relationship between Pluvial Floods and Income Disparities for Residential Basements in Seoul, South Korea. Preprint 2024. [CrossRef]
- Butters, O.; Dawson, R.J. Flood Evacuation in Informal Settlements: Application of an Agent-Based Model to Kibera Using Open Data. Urban Sci. 2025, 9, 12. [CrossRef]
- Shiwomeh, D.N.; Kantoush, S.A.; Sumi, T.; Nguyen, B.Q.; Abdrabo, K.I. Holistic mapping of flood vulnerability in slums areas of Yaounde city, Cameroon through household and institutional surveys. Int. J. Disaster Risk Reduct. 2024, 114, 104947. [CrossRef]
- Franca, M.; Valero, D.; Bayon, A.; Martínez-Gomariz, E.; Russo, B. October 2024 floods in the Valencia region, Eastern Spain: One example too many of hazardous debris. EGU Hydrological Sciences Blog. Available online: https://blogs.egu.eu/divisions/hs/2024/11/06/floods-valencia-hazardous-debris/ (accessed on 19 March 2025).
- Galvez-Hernandez, P.; Dai, Y.; Muntaner, C. The DANA disaster: Unraveling the political and economic determinants for Valencia’s floods devastation. Int. J. Equity Health 2025, 24, 64. [CrossRef]
- D'Ayala, D.; Wang, K.; Yan, Y.; Smith, H.; Massam, A.; Filipova, V.; Pereira, J.J. Flood vulnerability and risk assessment of urban traditional buildings in a heritage district of Kuala Lumpur, Malaysia. Nat. Hazards Earth Syst. Sci. 2020, 20, 2221–2241. [CrossRef]
- Nelson-Mercer, B.; Kim, T.; Tran, V.N.; et al. Pluvial flood impacts and policyholder responses throughout the United States. npj Nat. Hazards 2025, 2, 8. [CrossRef]
- Bentivoglio, R.; Isufi, E.; Jonkman, S.N.; Taormina, R. Deep learning methods for flood mapping: A review of existing applications and future research directions. Hydrol. Earth Syst. Sci. 2022, 26, 4345–4378. [CrossRef]
- Tan, W.; Qin, N.; Zhang, Y.; McGrath, H.; Fortin, M.; Li, J. A rapid high-resolution multi-sensory urban flood mapping framework via DEM upscaling. Remote Sens. Environ. 2024, 301, 113956. [CrossRef]
- Rahnemoonfar, M.; Chowdhury, T.; Sarkar, A.; Varshney, D.; Yari, M.; Murphy, R. FloodNet: A high-resolution aerial imagery dataset for post-flood scene understanding. arXiv 2020, arXiv:2012.02951. [CrossRef]
- Alizadeh Kharazi, B.; Behzadan, A.H. Flood depth mapping in street photos with image processing and deep neural networks. Comput. Environ. Urban Syst. 2021, 88, 101628. [CrossRef]
- Zhao, J.; Wang, X.; Zhang, C.; Hu, J.; Wan, J.; Cheng, L.; Shi, S.; Zhu, X. Urban Waterlogging Monitoring and Recognition in Low-Light Scenarios Using Surveillance Videos and Deep Learning. Water 2025, 17, 707. [CrossRef]
- Hashemi-Beni, L.; Jones, J.; Thompson, G.; Johnson, C.; Gebrehiwot, A. Challenges and Opportunities for UAV-Based Digital Elevation Model Generation for Flood-Risk Management: A Case of Princeville, North Carolina. Sensors 2018, 18, 3843. [CrossRef]
- Munawar, H.S.; Ullah, F.; Qayyum, S.; Heravi, A. Application of Deep Learning on UAV-Based Aerial Images for Flood Detection. Smart Cities 2021, 4, 1220–1242. [CrossRef]
- Stateczny, A.; Praveena, H.D.; Krishnappa, R.H.; Chythanya, K.R.; Babysarojam, B.B. Optimized Deep Learning Model for Flood Detection Using Satellite Images. Remote Sens. 2023, 15, 5037. [CrossRef]
- Munawar, H.S.; Ullah, F.; Qayyum, S.; Khan, S.I.; Mojtahedi, M. UAVs in Disaster Management: Application of Integrated Aerial Imagery and Convolutional Neural Network for Flood Detection. Sustainability 2021, 13, 7547. [CrossRef]
- Yoo, J.; Lee, J.; Jeung, S.; Jung, S.; Kim, M. Development of a Deep Learning-Based Flooding Region Segmentation Model for Recognizing Urban Flooding Situations. Sustainability 2024, 16, 11041. [CrossRef]
- Zhong, P.; Liu, Y.; Zheng, H.; Zhao, J. Detection of urban flood inundation from traffic images using deep learning methods. Water Resour. Manag. 2024, 38, 287–301. [CrossRef]
- Vo, A.V.; Bertolotto, M.; Ofterdinger, U.; Laefer, D.F. In Search of Basement Indicators from Street View Imagery Data: An Investigation of Data Sources and Analysis Strategies. Künstl. Intell. 2023, 37, 41–53. [CrossRef]
- Witherow, M.A.; Sazara, C.; Winter-Arboleda, I.M.; Elbakary, M.I.; Cetin, M.; Iftekharuddin, K.M. Floodwater detection on roadways from crowdsourced images. Comput. Methods Biomech. Biomed. Eng. Imaging Vis. 2018, 7, 529–540. [CrossRef]
- Zeng, Y.-F.; Chang, M.-J.; Lin, G.-F. A novel AI-based model for real-time flooding image recognition using super-resolution generative adversarial network. J. Hydrol. 2024, 638, 131475. [CrossRef]
- Manaf, A.; Mujtaba, G.; Mughal, N.; Talpur, K.R.; Talpur, S.R.; Talpur, B.A. Aerial image classification in post-flood scenarios using robust deep learning and explainable artificial intelligence. IEEE Access 2025, https://doi.org/. [CrossRef]
- Krizhevsky, A.; Sutskever, I.; Hinton, G.E. ImageNet classification with deep convolutional neural networks. In Advances in Neural Information Processing Systems 2012, 25, 1097–1105. Available online: https://papers.nips.cc/paper_files/paper/2012/file/c399862d3b9d6b76c8436e924a68c45b-Paper.pdf (accessed on 28 March 2025).
- Simonyan, K.; Zisserman, A. Very deep convolutional networks for large-scale image recognition. In Proceedings of the International Conference on Learning Representations (ICLR) 2015. [CrossRef]
- He, K.; Zhang, X.; Ren, S.; Sun, J. Deep residual learning for image recognition. In Proceedings of the IEEE Conference on Computer Vision and Pattern Recognition (CVPR), 2016, 770–778. [CrossRef]
- Huang, G.; Liu, Z.; Van Der Maaten, L.; Weinberger, K.Q. Densely connected convolutional networks. In Proceedings of the IEEE Conference on Computer Vision and Pattern Recognition (CVPR), 2017, 4700–4708. [CrossRef]
- Dosovitskiy, A.; Beyer, L.; Kolesnikov, A.; Weissenborn, D.; Zhai, X.; Unterthiner, T.; Dehghani, M.; Minderer, M.; Heigold, G.; Gelly, S.; Uszkoreit, J.; Houlsby, N. An image is worth 16×16 words: Transformers for image recognition at scale. In Proceedings of the International Conference on Learning Representations (ICLR) 2021. [CrossRef]
- Liu, Z.; Mao, H.; Wu, C.-Y.; Feichtenhofer, C.; Darrell, T.; Xie, S. A convnet for the 2020s. In Proceedings of the IEEE/CVF Conference on Computer Vision and Pattern Recognition (CVPR), 2022, 11976–11986. [CrossRef]
Figure 1.
Workflow of the proposed study using AlleyFloodNet for flood image classification and dataset comparison.
Figure 1.
Workflow of the proposed study using AlleyFloodNet for flood image classification and dataset comparison.
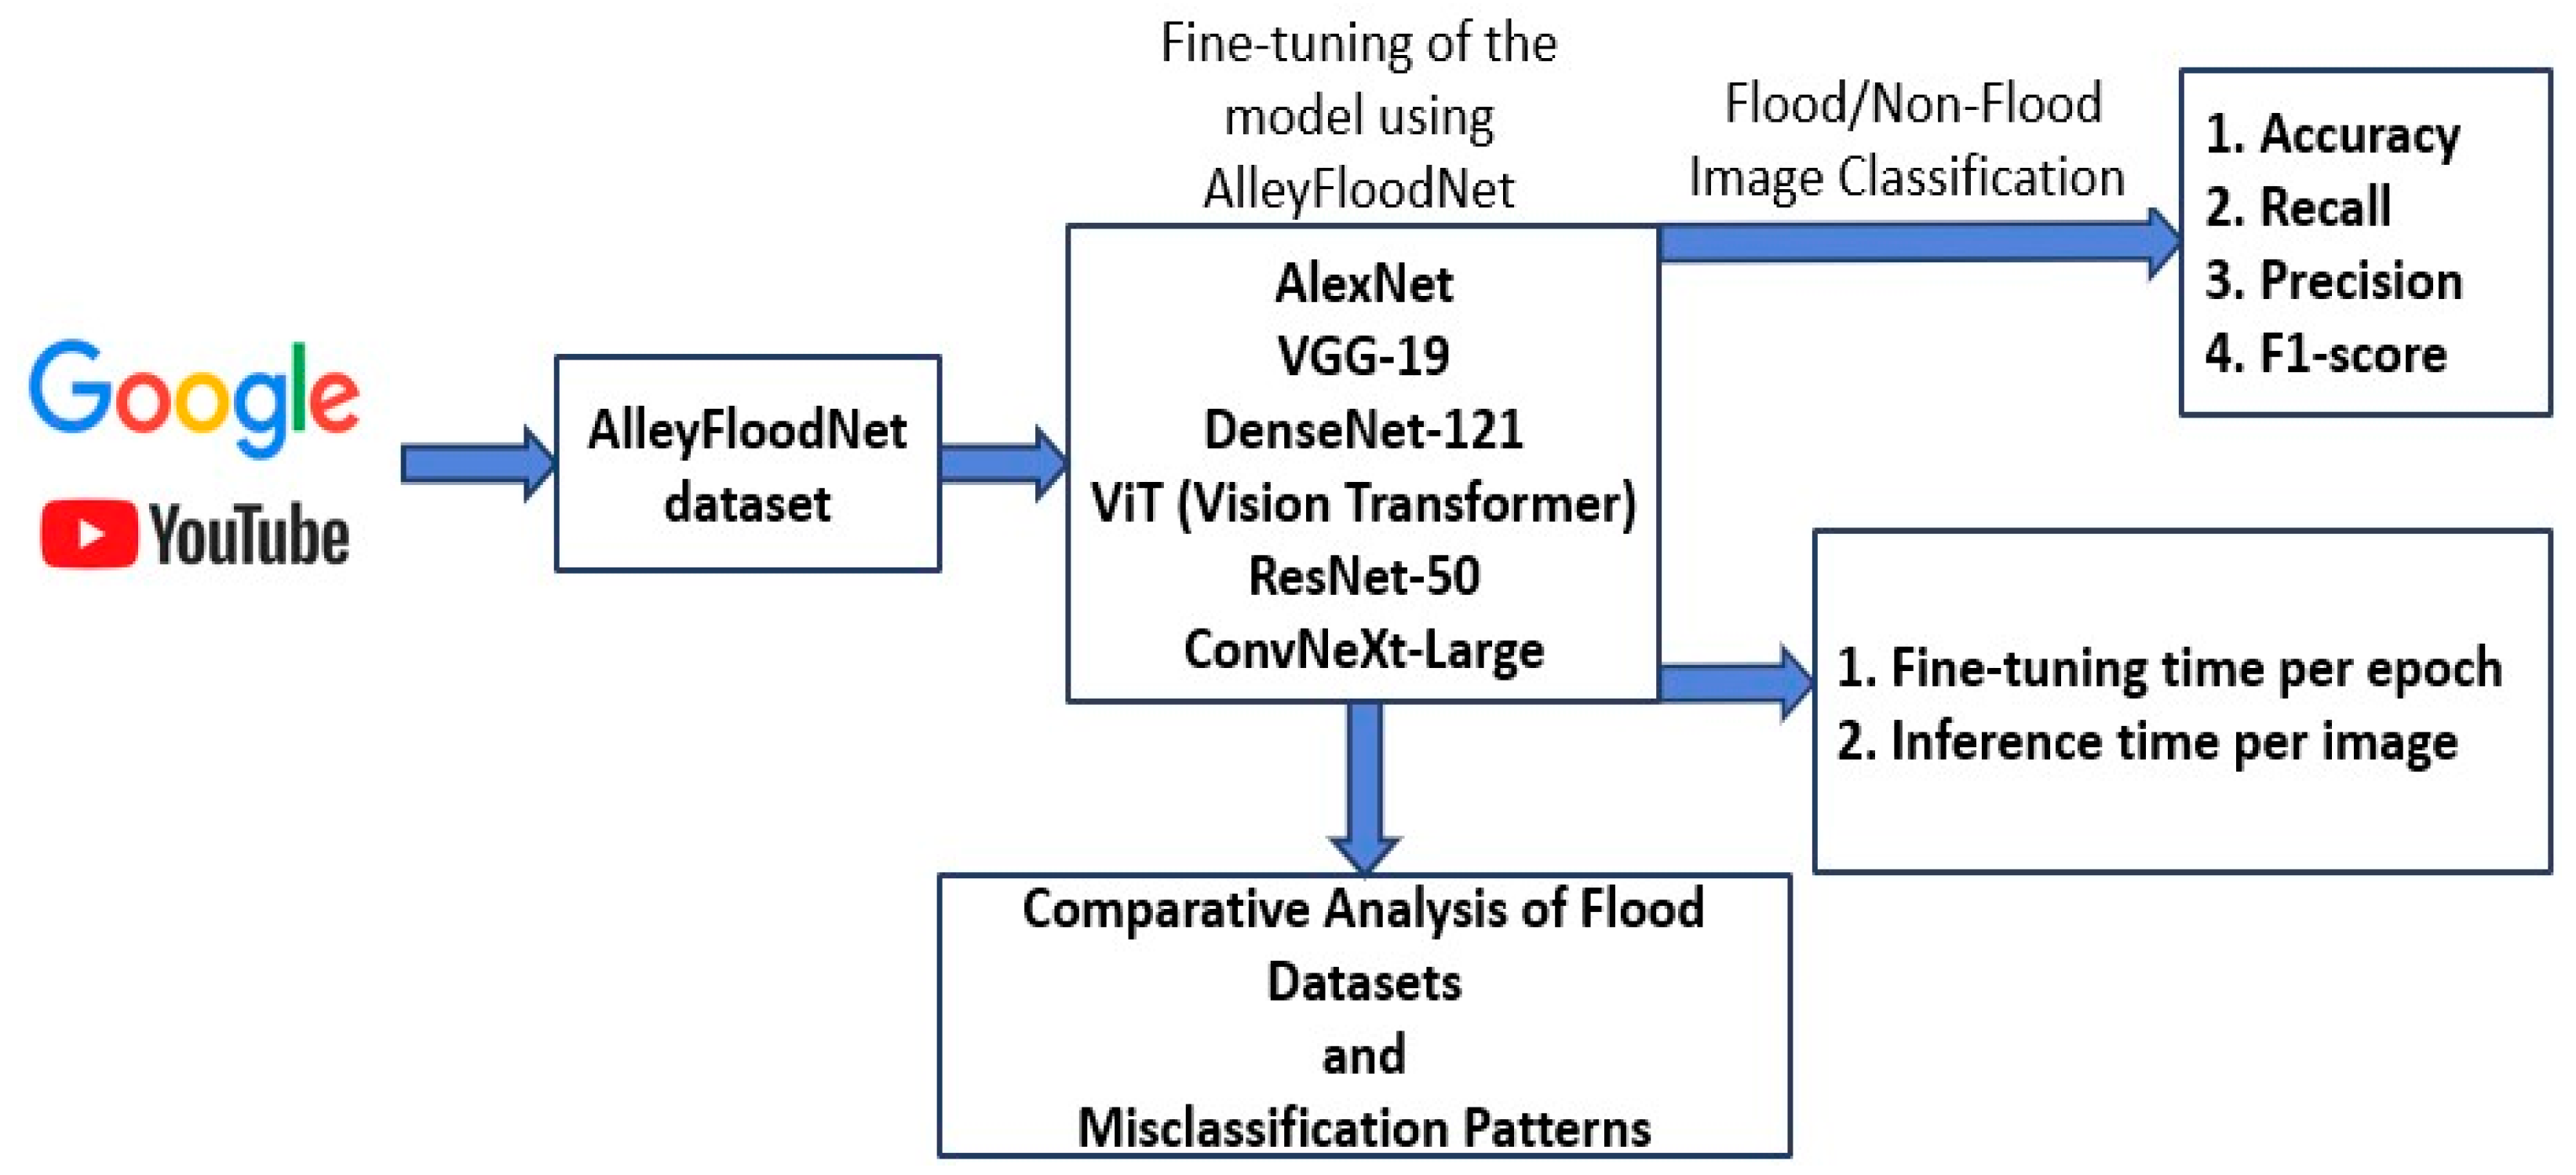
Figure 2.
example images from the flooding class.
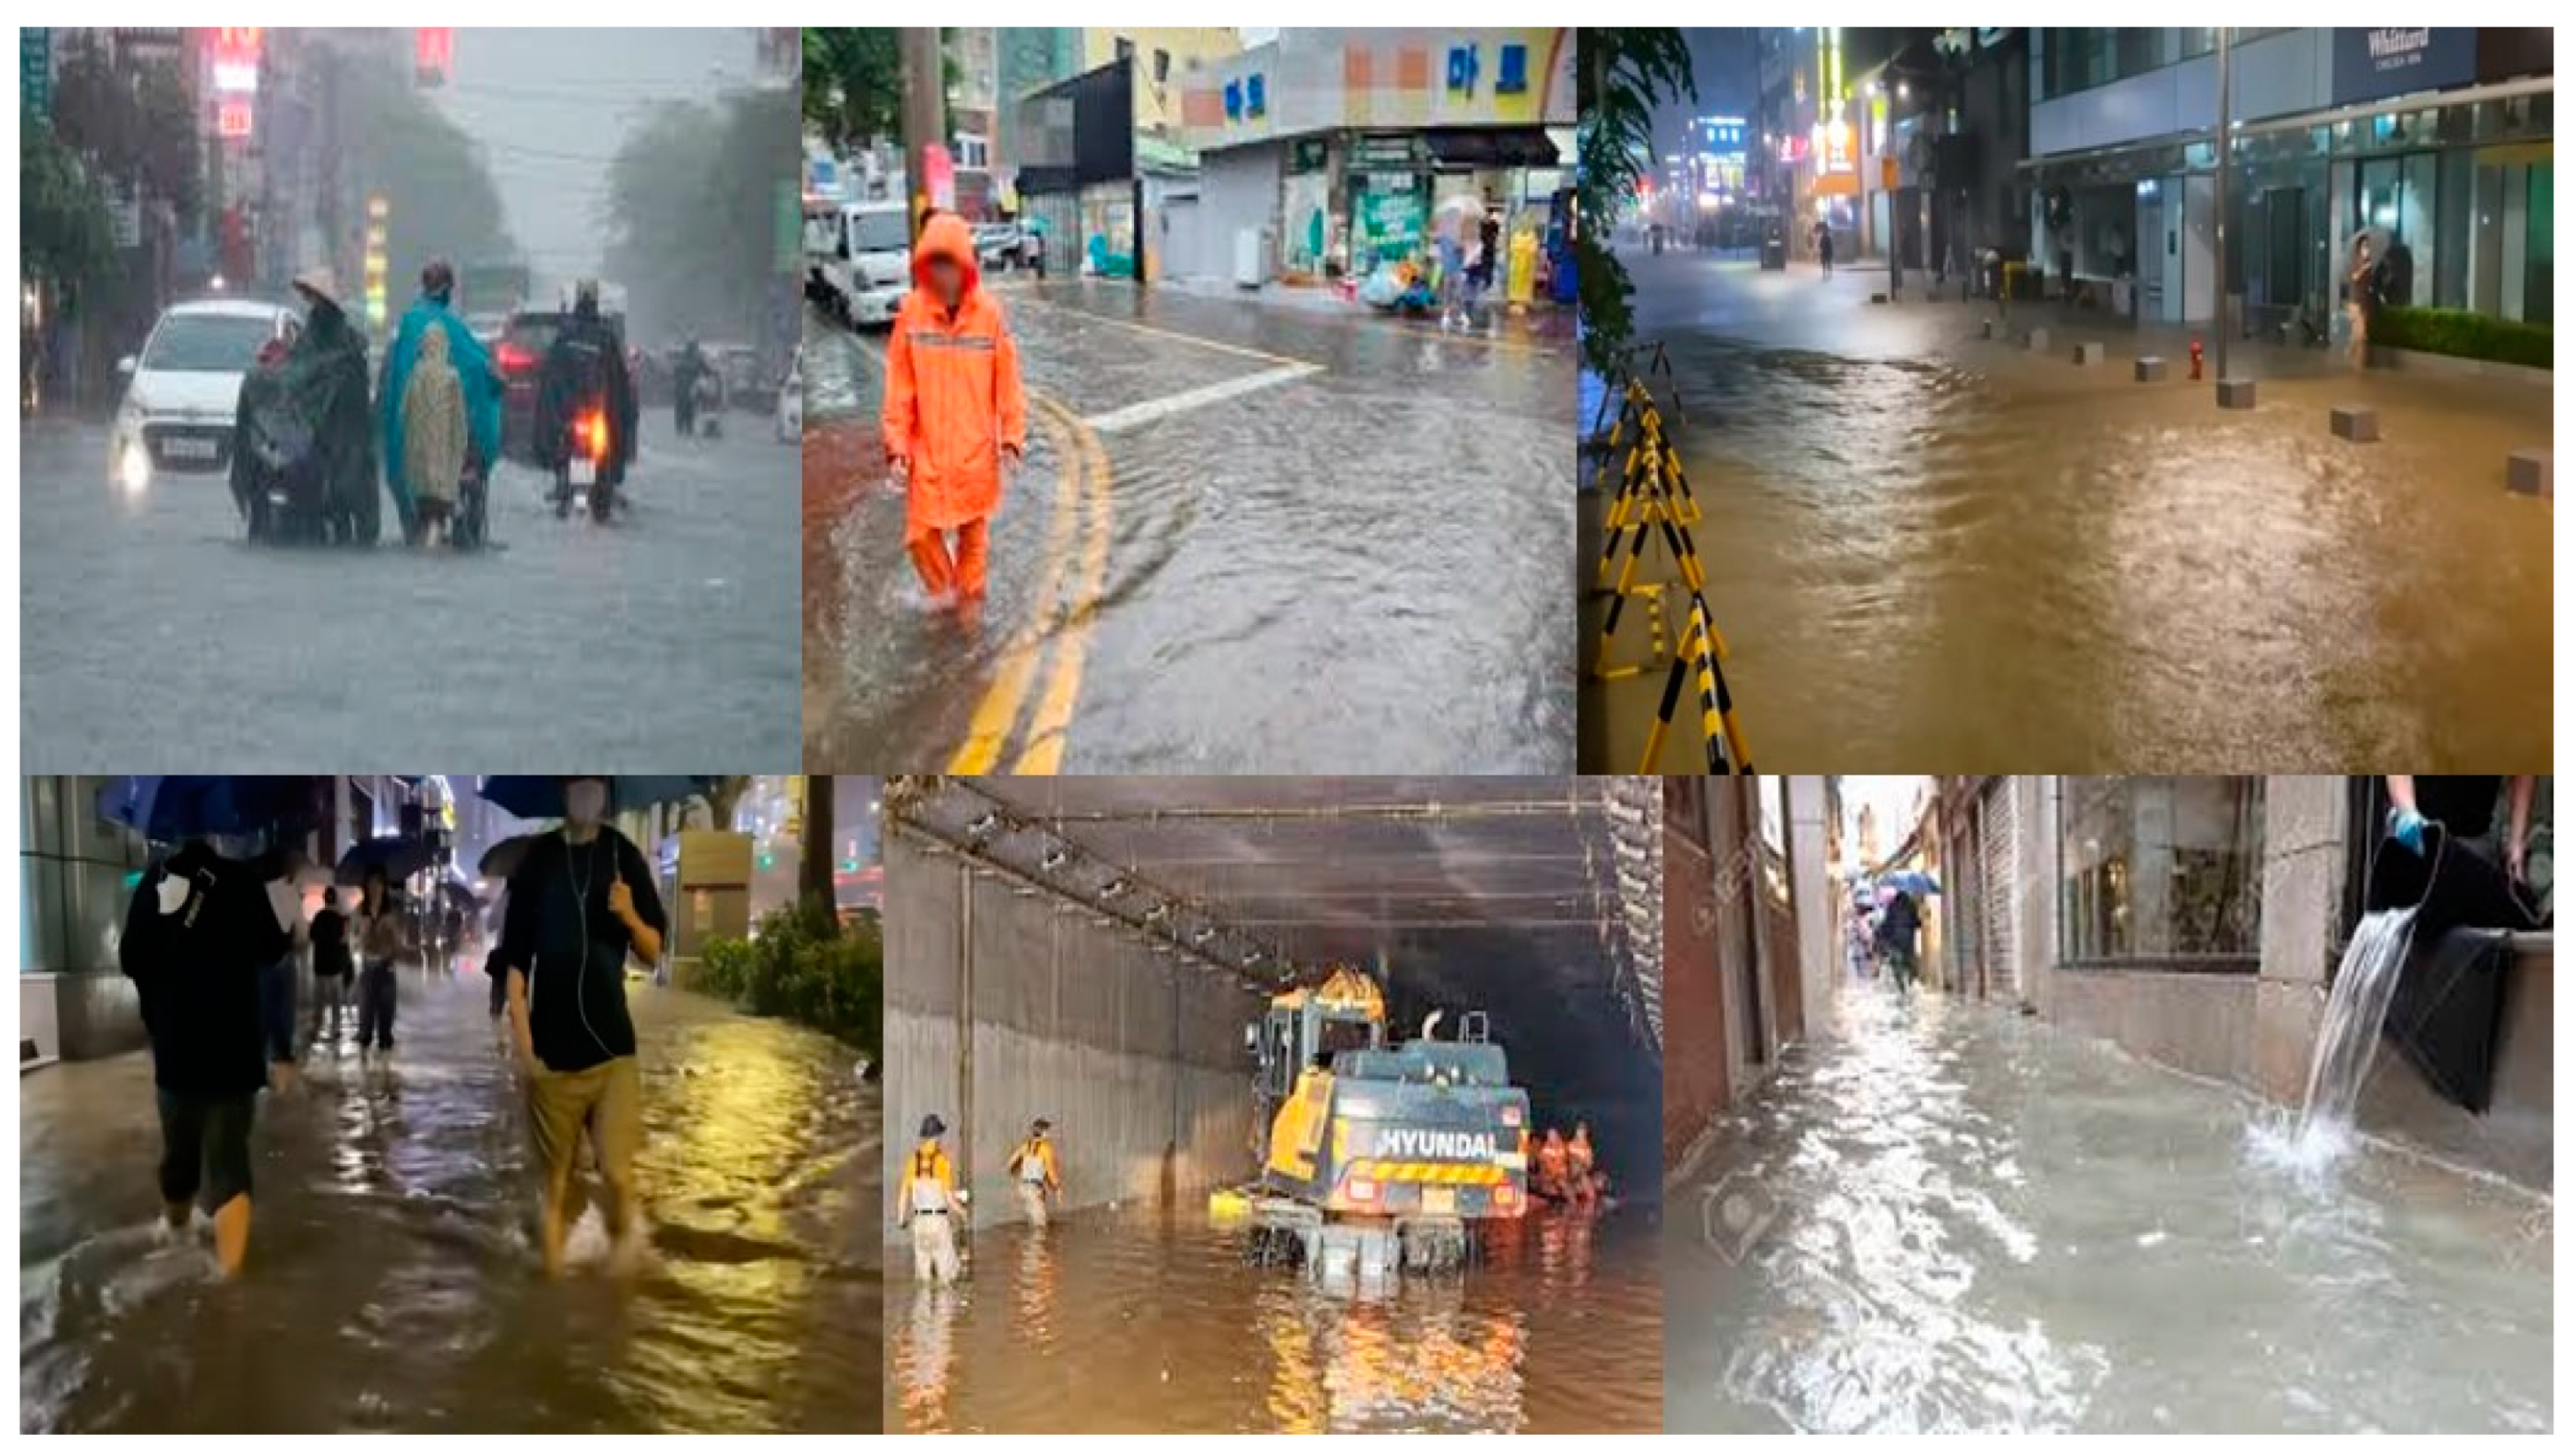
Figure 3.
example images from the non-flooding class.
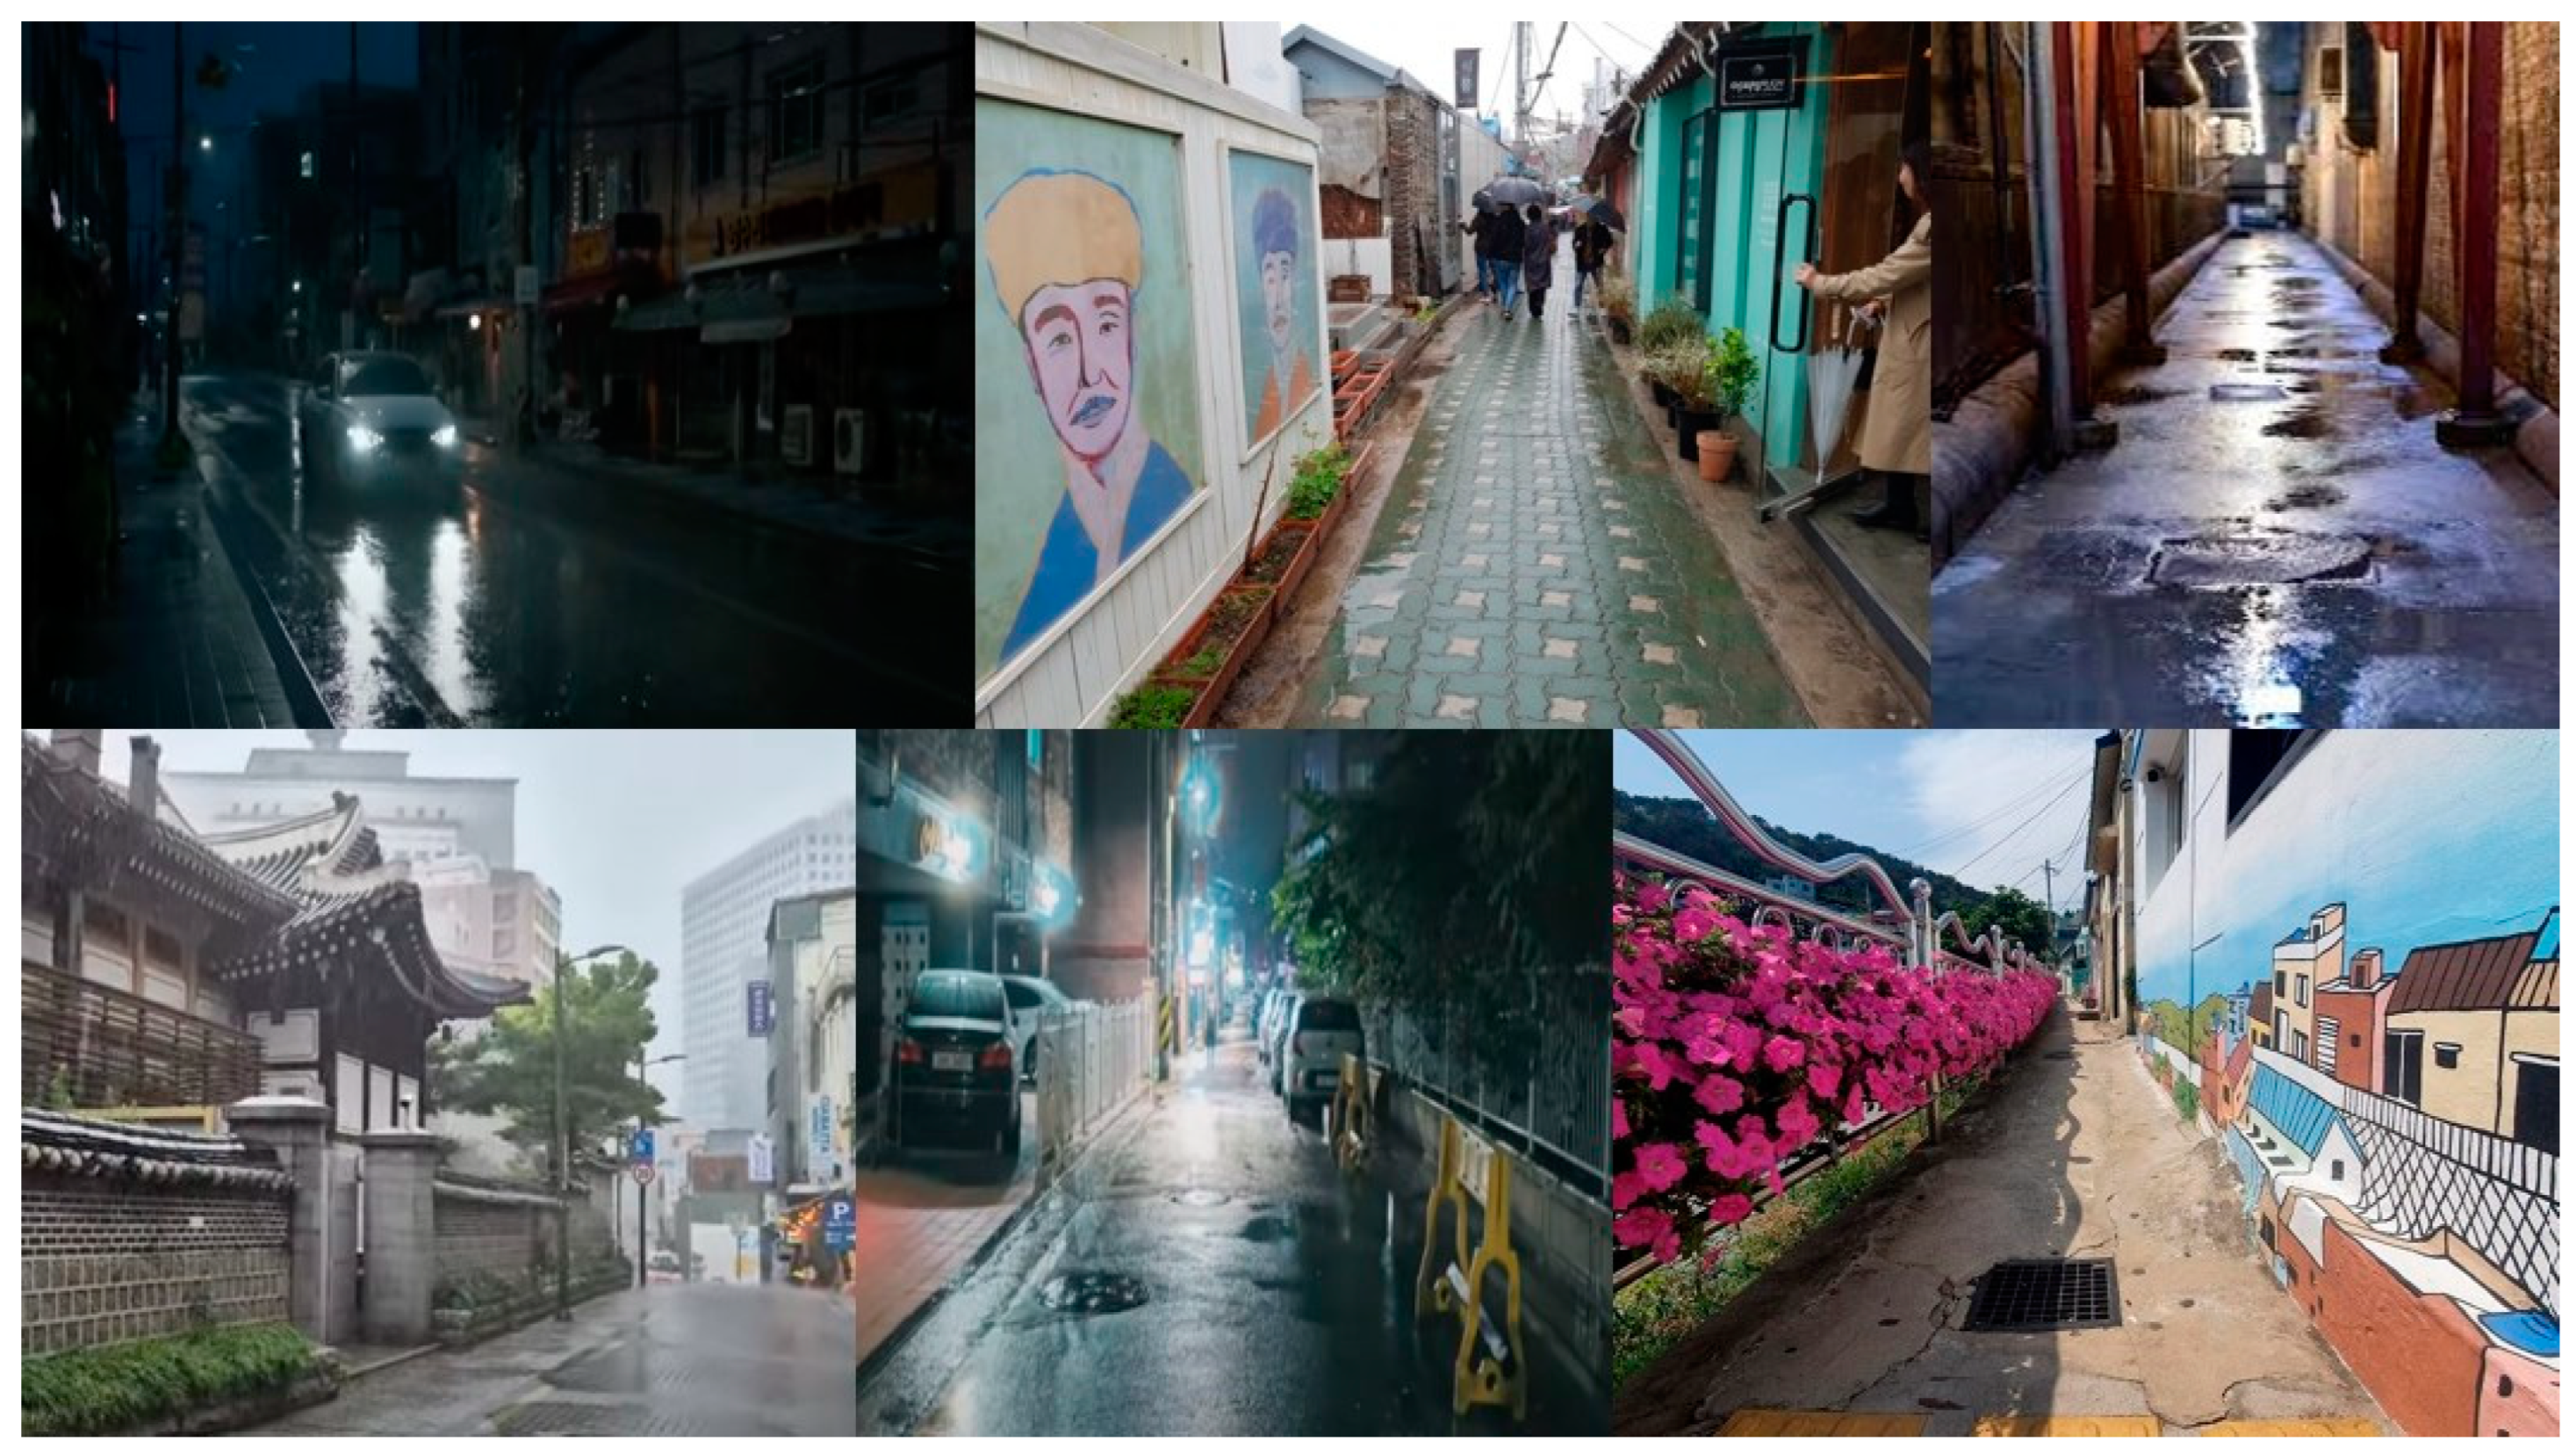
Figure 4.
training and validation loss/accuracy curves.
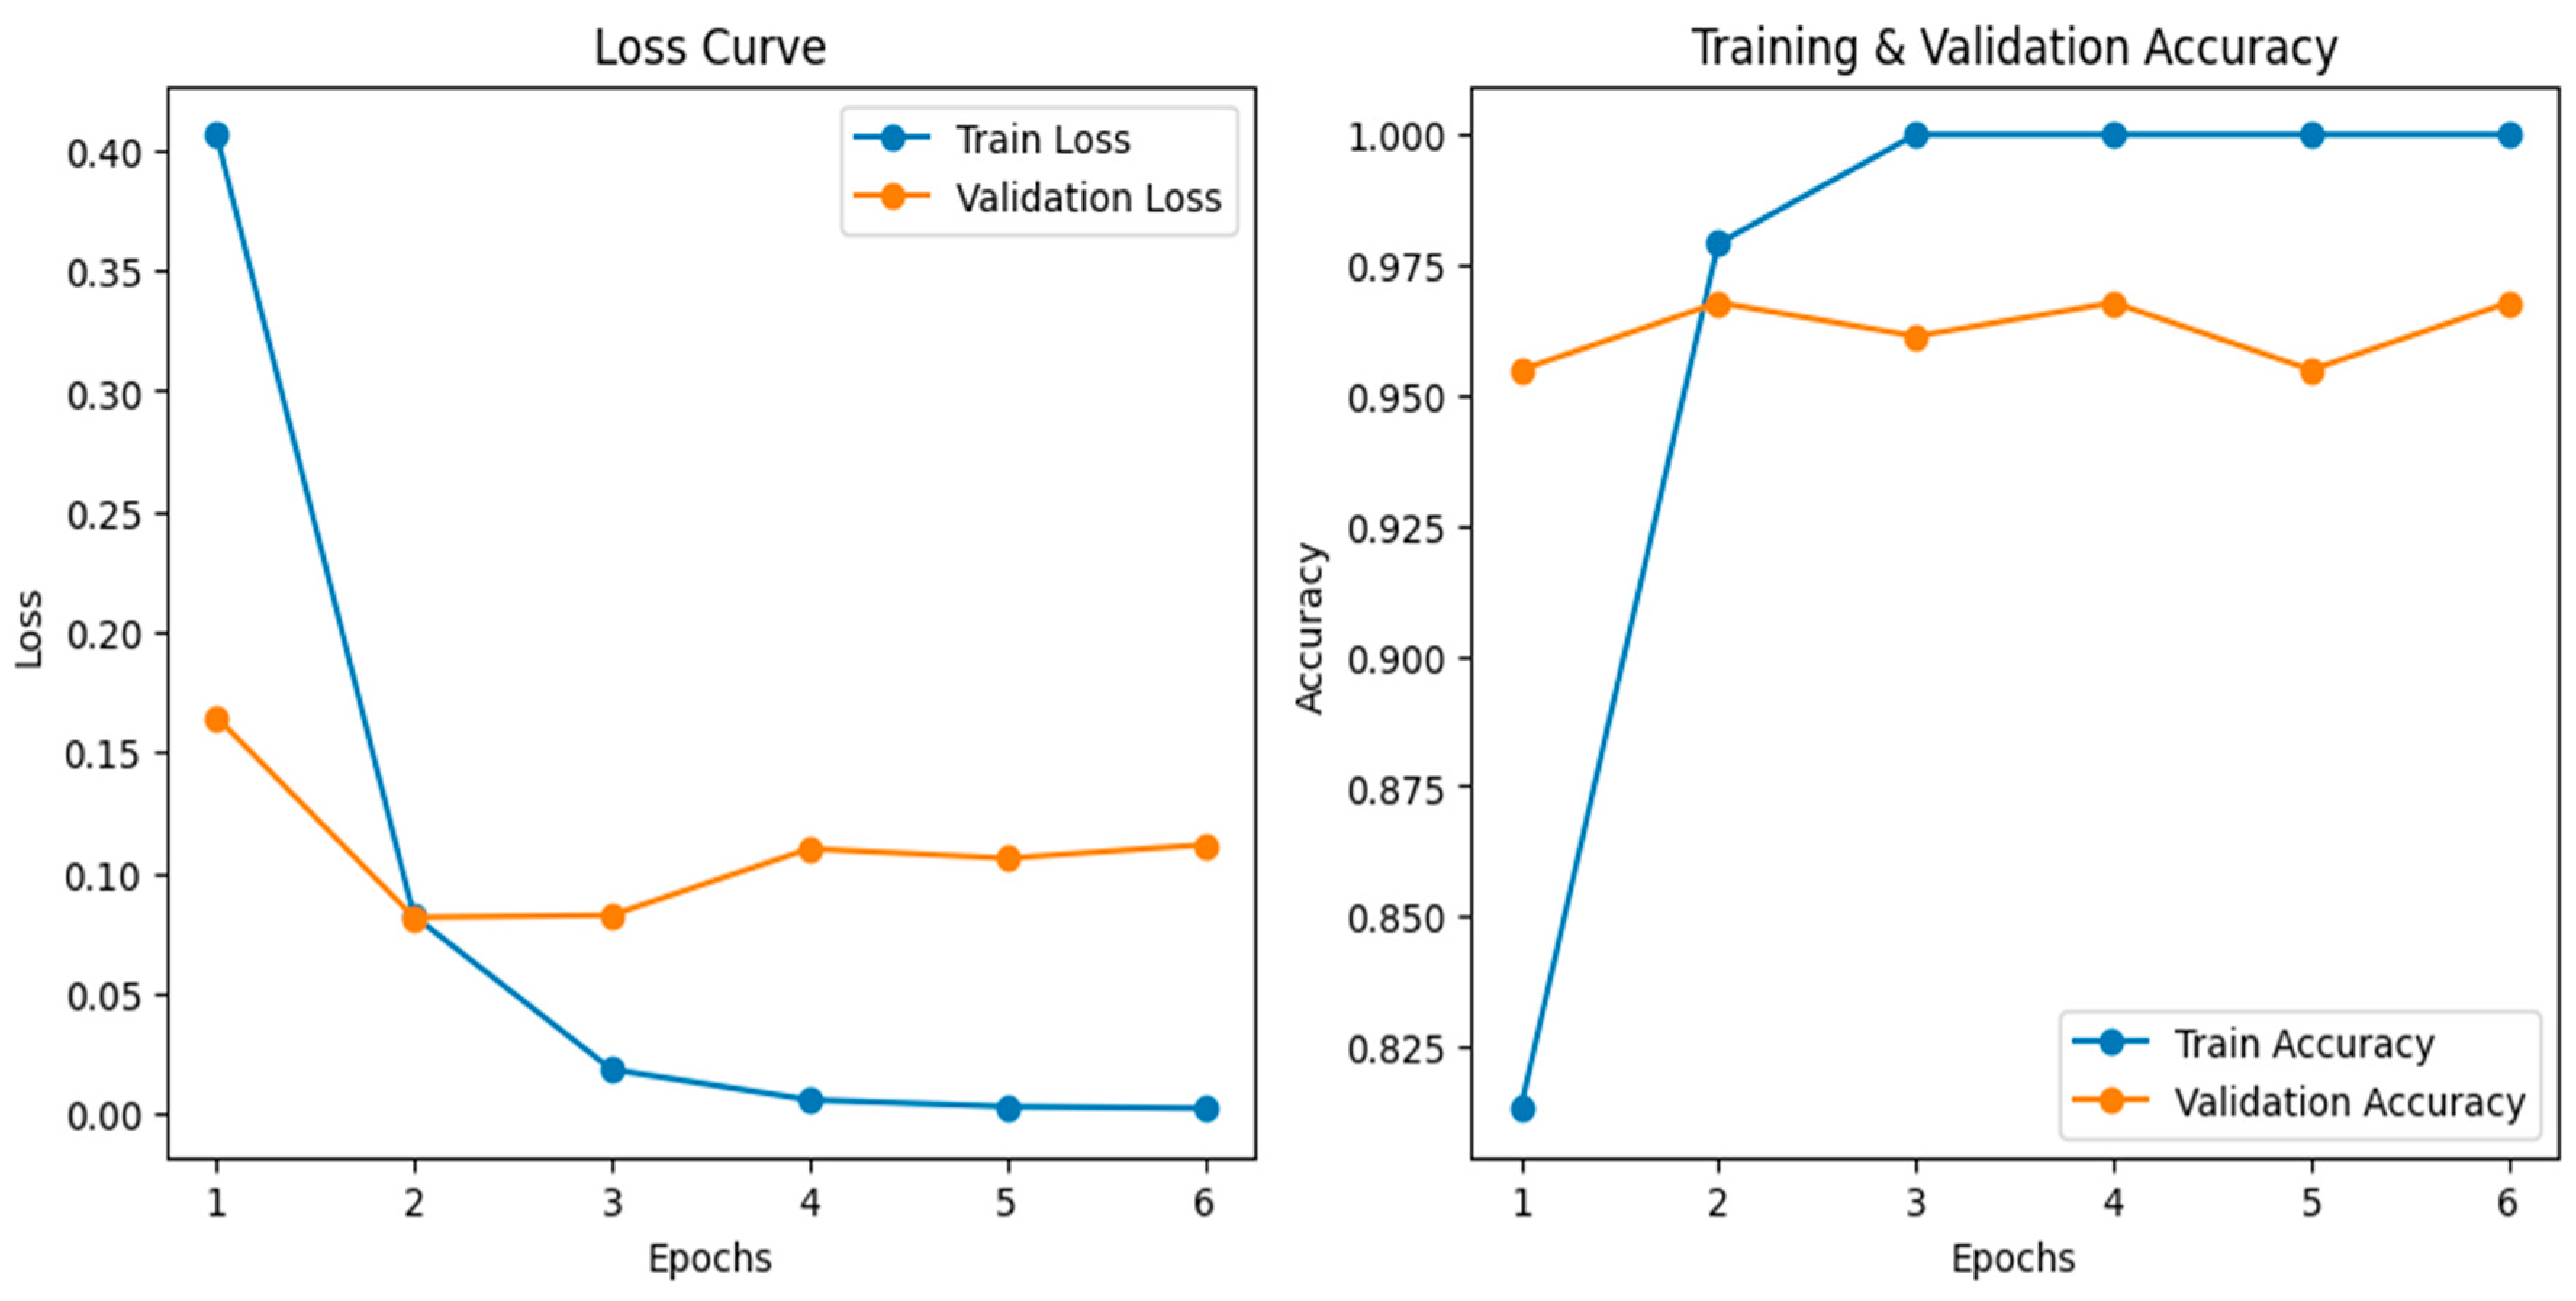
Figure 5.
Confusion matrix results of the ConvNeXt-Large.
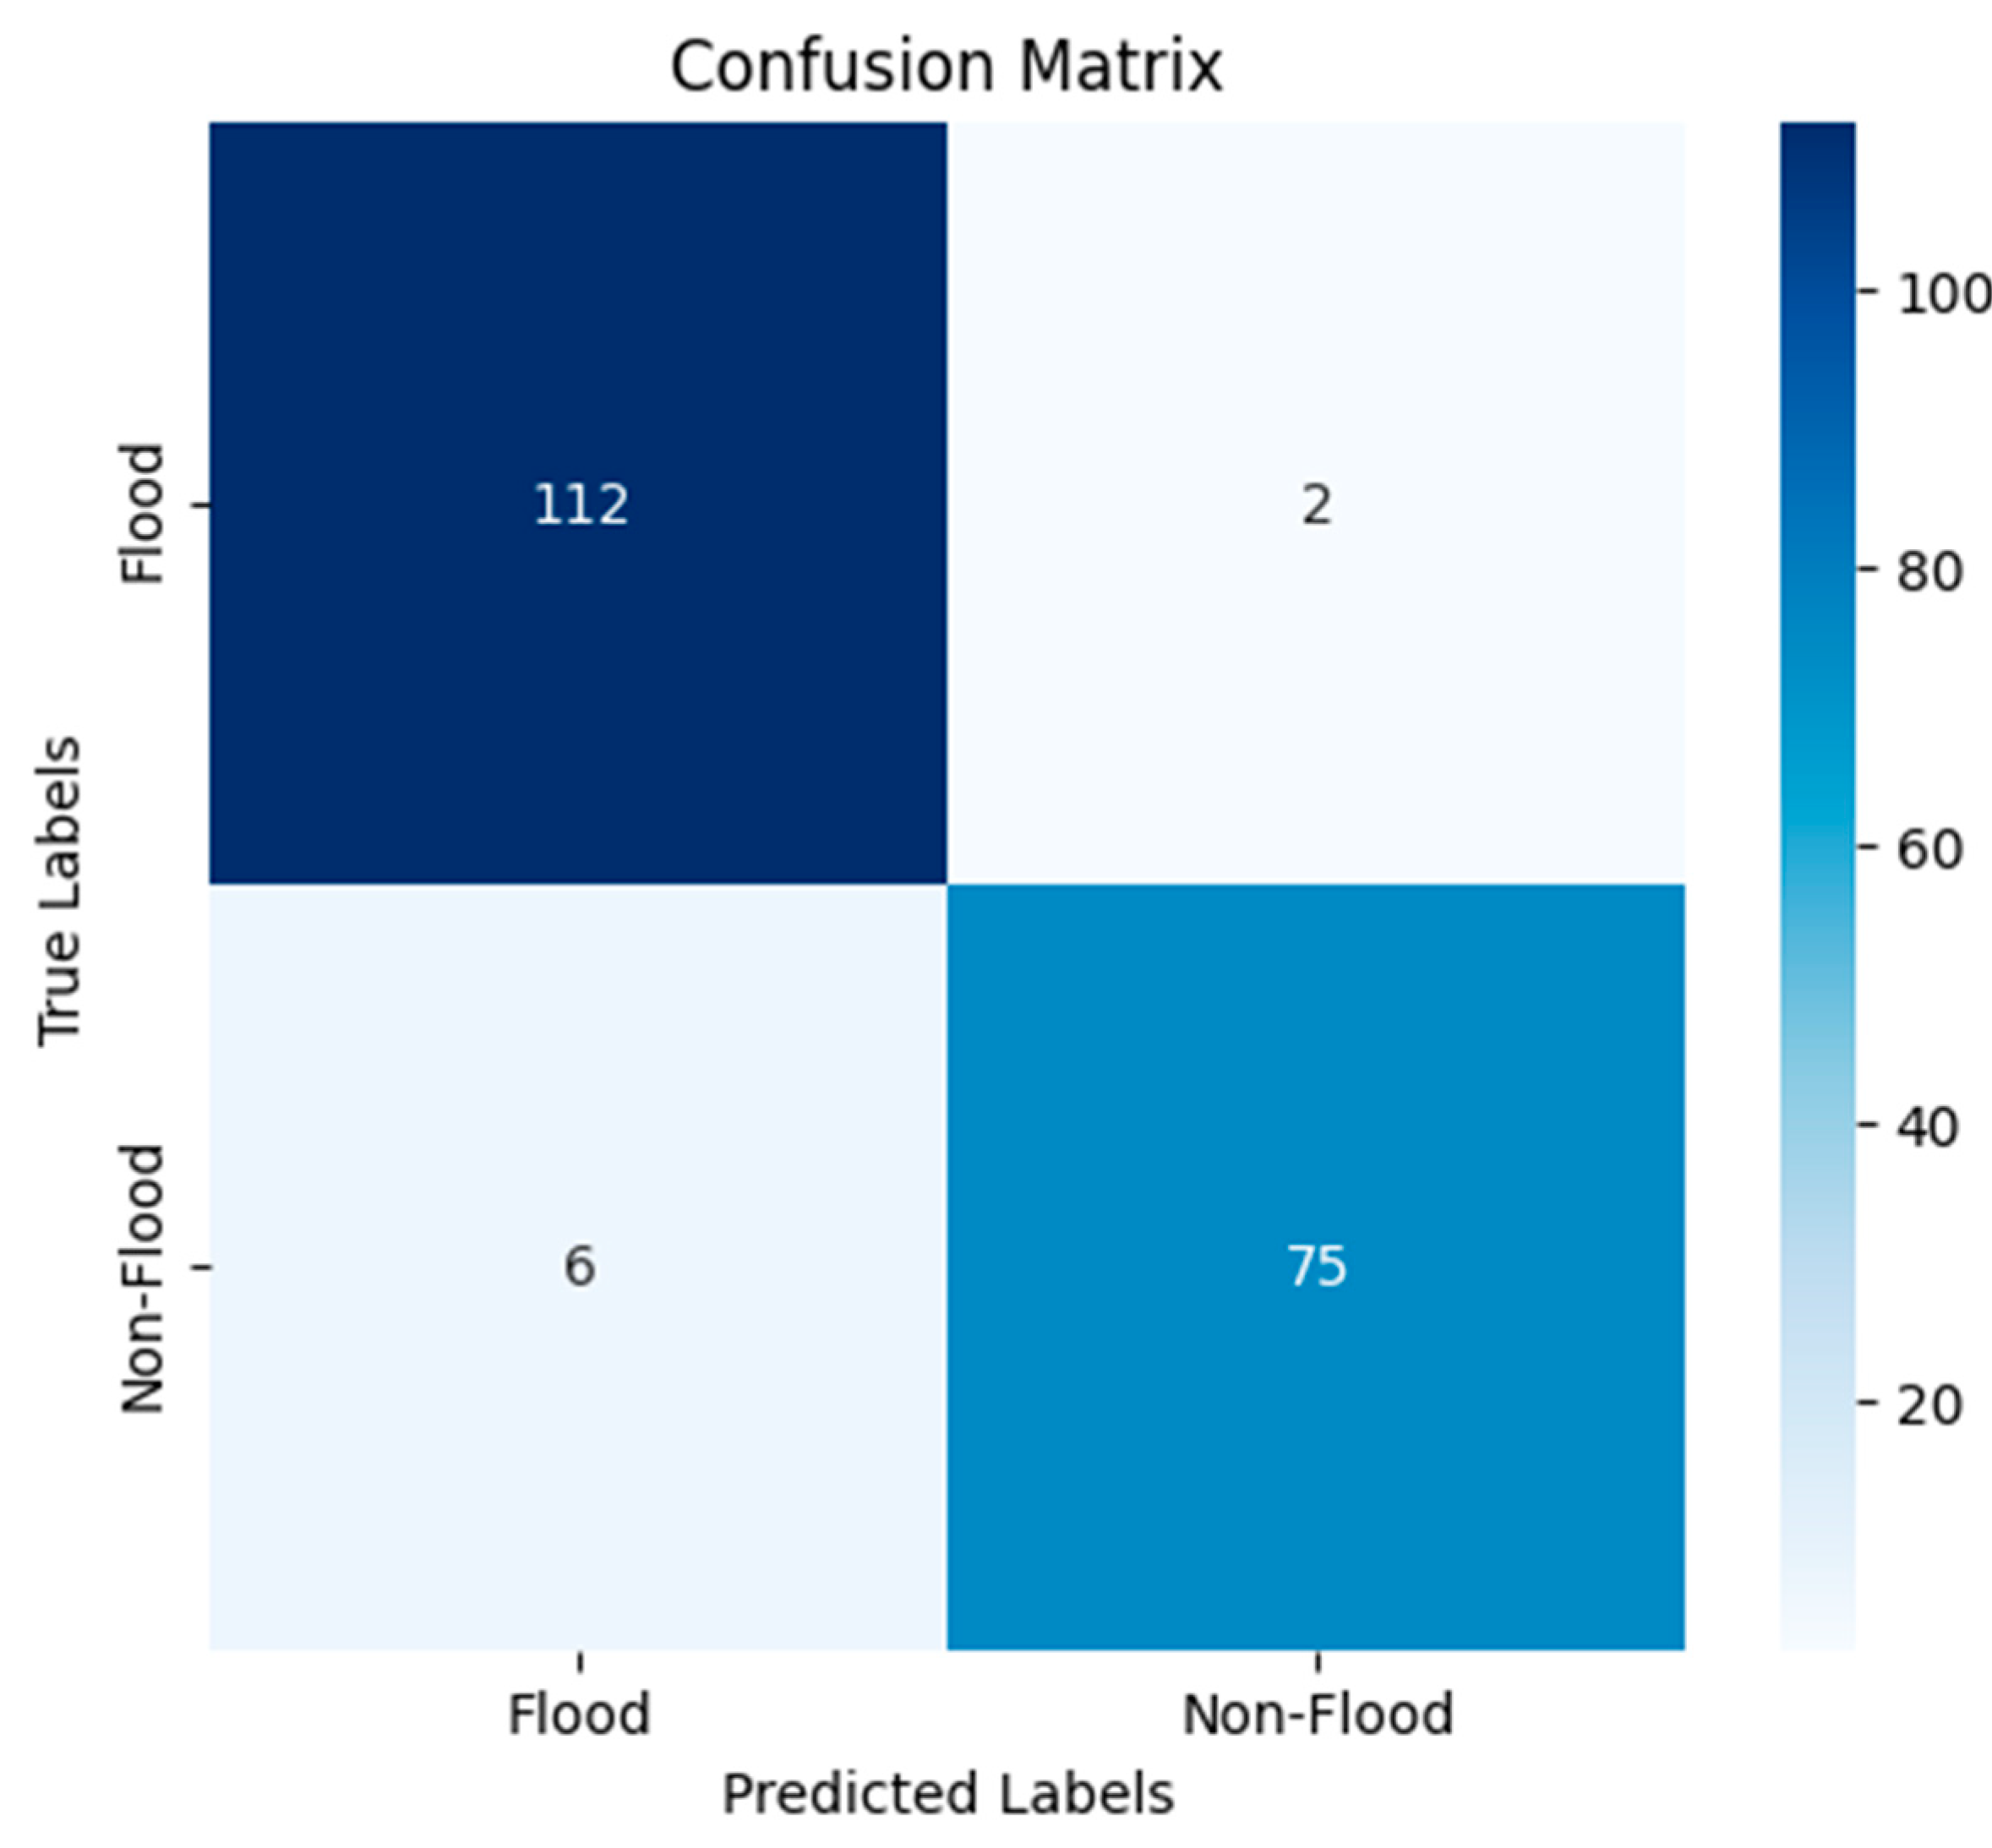
Figure 6.
Examples of misclassified images.
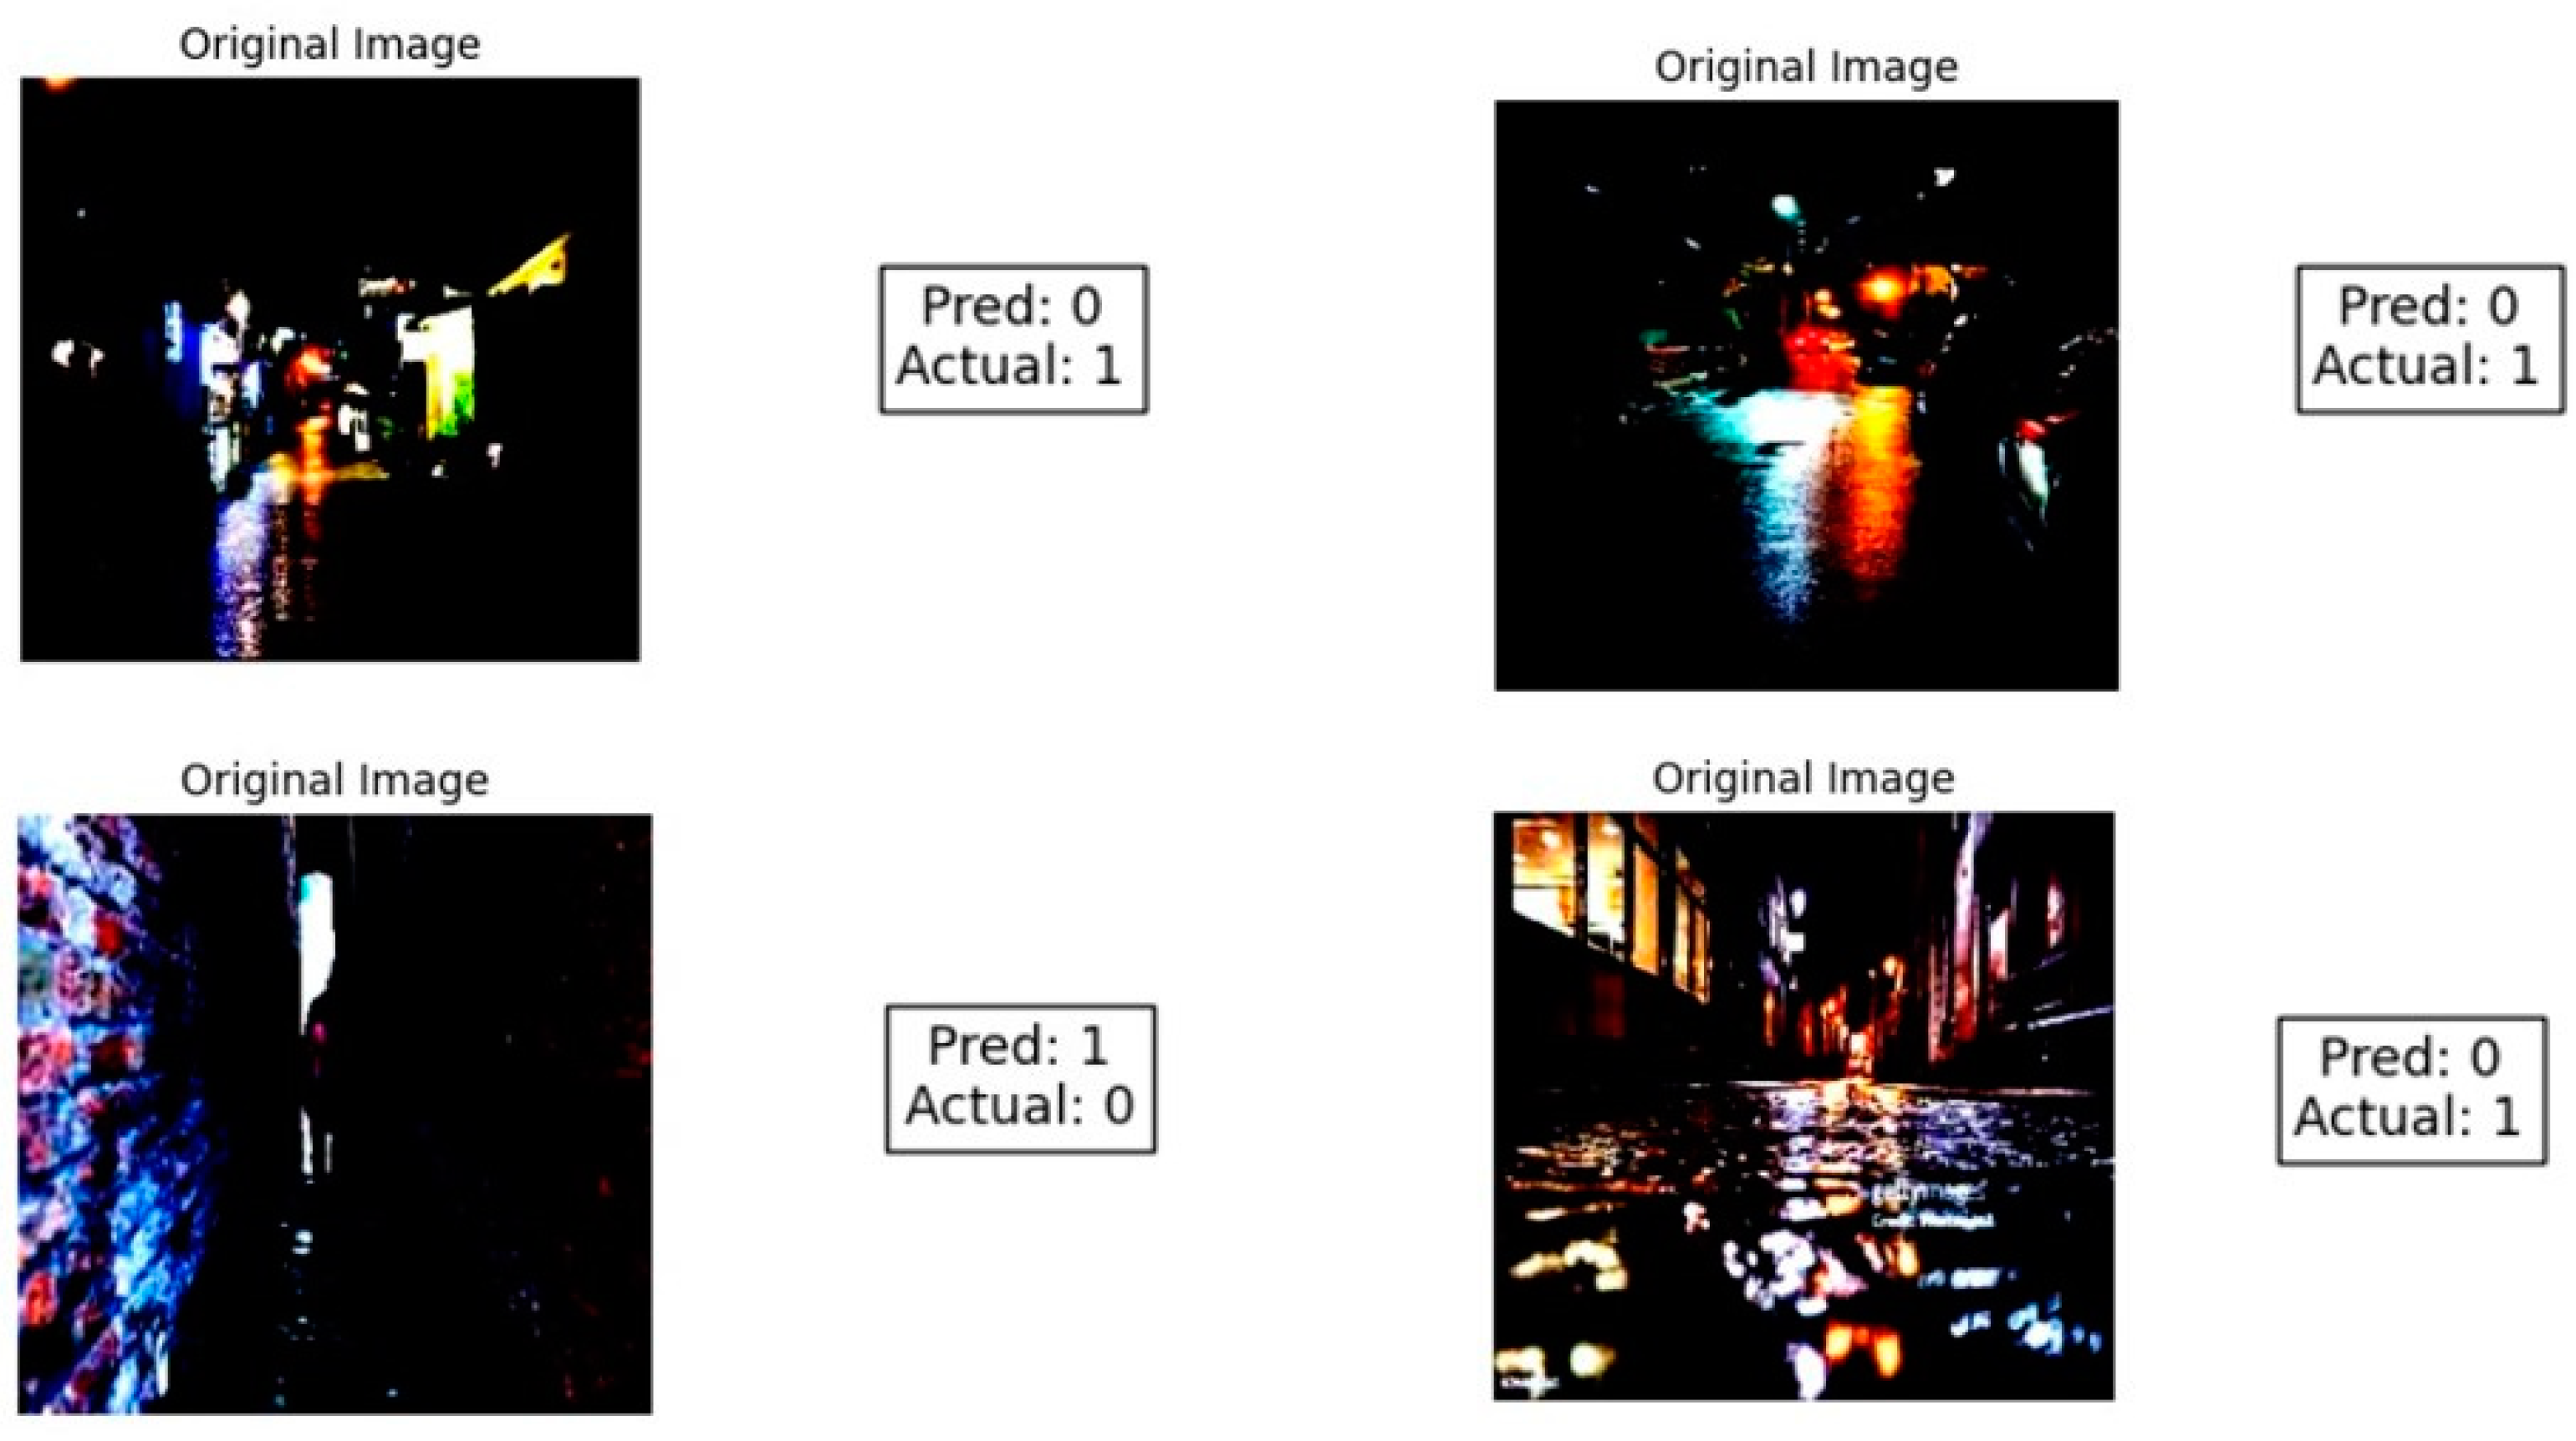
Table 2.
Comparison of Average Fine-tuning Time per Epoch and Single Image Inference Time.
| Model Name | Avg. Training Time per Epoch (s) | Inference Time per Image (s) |
|---|---|---|
| AlexNet ResNet50 VGG19 ViT DenseNet121 |
5.36 5.59 6.66 9.42 6.42 |
0.009549 0.035457 0.017241 0.007917 0.113015 |
| ConvNeXt-Large | 17.48 | 0.020000 |
Disclaimer/Publisher’s Note: The statements, opinions and data contained in all publications are solely those of the individual author(s) and contributor(s) and not of MDPI and/or the editor(s). MDPI and/or the editor(s) disclaim responsibility for any injury to people or property resulting from any ideas, methods, instructions or products referred to in the content. |
© 2025 by the authors. Licensee MDPI, Basel, Switzerland. This article is an open access article distributed under the terms and conditions of the Creative Commons Attribution (CC BY) license (http://creativecommons.org/licenses/by/4.0/).
Copyright: This open access article is published under a Creative Commons CC BY 4.0 license, which permit the free download, distribution, and reuse, provided that the author and preprint are cited in any reuse.


