
Submitted:
01 April 2025
Posted:
02 April 2025
You are already at the latest version
Abstract
As the attention to using hydrogen as a potential energy storage medium for power generation and mobility increases, hydrogen production, storage, and transportation safety should be considered. For instance, hydrogen's extreme physical and chemical properties and the wide range of flammable concentrations raise many concerns about the current safety measures in processing other flammable gases. Hydrogen cloud accumulation in case of leakage in confined spaces can lead to reaching the hydrogen lower flammability limit (LFL) within seconds if the hydrogen is not properly evacuated from space. At Jülich Research Centre, hydrogen mixed with natural gas is foreseen to be used as a fuel for the central heating system of the campus. In this work, the release, dispersion, formation, and spread of the hydrogen cloud in case of hydrogen leakage inside the central utility building of the campus are numerically simulated using the OpenFOAM-based containmentFOAM CFD codes. Additionally, different ventilation scenarios are simulated to investigate the behavior of the hydrogen cloud. The results show that locating exhaust openings close to the ceiling and the potential leakage source can be the most effective way to evacuate hydrogen from the building safely. Improper placement of the exhaust outlets can significantly decrease the effectiveness of the forced ventilation system, even lower than the effectiveness of natural ones. These results can be used as a guide to the locations of the ventilation outlets for closed spaces with hydrogen systems. Also, these simulations can be used in the future to study the effect of hydrogen sensor locations on the response of the ventilation system and, accordingly, on the hydrogen-combustible cloud volume inside the space.
Keywords:
Hydrogen safety
; CFD simulation
; OpenFOAM
; containmentFOAM
1. Introduction
The international commitment to limit the global temperature rise to and the Net Zero Emissions (NZE) scenario by 2050 raised global interest in renewable energies and energy storage technologies. Such a scenario could only be achieved by replacing hydrocarbon fuels with another energy storage source with minimal carbon emission during its life cycle. Hydrogen has different physical properties; its higher gravimetric energy density than natural gas, for instance, makes it a possible energy storage medium and an alternative fuel. Therefore, hydrogen research and infrastructure investments surged during the last decade, hoping to achieve the NZE by 2050. The global hydrogen demand is expected to reach 210 Mt by 2030 to cover the increasing transition towards the zero-emission target. This demand is expected to reach 390 Mt by 2040 and 530 Mt by 2050 ([1]).
Accordingly, this surge in hydrogen demand increases global hydrogen production, transportation, and usage in industrial and residential buildings. The extreme physical and chemical properties of hydrogen compared to other gaseous fuels raise different safety concerns about the prevention and handling of accidental leakage of hydrogen in both confined and open spaces. Therefore, hydrogen safety research gained much attention from industry, academia, and governments to ensure the safe usage of hydrogen.
Ref. [2] compared the capabilities of Reynolds-Averaged Navier-Stokes (RANS), Large Eddy Simulations (LES), and laminar flow CFD approaches to simulate helium release with low Reynolds number in a closed facility. By comparing the CFD and experimental results, they concluded that LES and RANS predicted well the gas distribution inside the facility. At the same time, the laminar flow approach managed to simulate the stratification. Ref. [3] simulated hydrogen release in a semi-closed facility representing an underground tunnel. Their study simulated hydrogen release from different nozzle sizes and ventilation rates. After comparing experimental results, they concluded that such simulations can agree with experiments and be used to determine the different safety scenarios of hydrogen release.
One of the widely studied applications is the behavior of hydrogen leakage in tunnels. Ref. [4] compared the results of simulating hydrogen release in a scaled tunnel with the experimental results and used the validated boundary conditions to simulate the same tunnel under different wind speeds. Their study showed a methodology to calculate the threshold hydrogen wind speed in the tunnel, after which a significant change in the behavior of the hydrogen cloud occurs. Ref. [5] studied the hydrogen jet dispersion below and around a car when hydrogen leaks from its tank inside a tunnel. Their study numerically simulated hydrogen leakage from a typical 700-bar tank inside a 7.1 m-high tunnel. The simulations showed that within two seconds, the hydrogen-filled the space below the car and started moving upwards to the tunnel’s ceiling, and different flow phenomena were observed. Also, [6] studied the hydrogen dispersion in the tunnel in case of hydrogen leakage from a fuel cell vehicle (FCV). The authors studied the effect of the different ventilation flow rates and different configurations of tunnels. They have concluded that the configuration of tunnels, like their slopes and fan rooms, can significantly influence the hydrogen distribution and concentrations in the tunnel. Ref. [7] also studied the effect of the layout of tunnels in case of hydrogen leakage from cars and buses. Their simulations showed that the probability of a worst-case scenario explosion is much lower in the cases studied than in previous studies.
Another important application of hydrogen safety for FCVs is the study of hydrogen dispersion in underground garages. Ref. [8] have simulated hydrogen dispersion after leakage from different locations inside the car park for different leakage times and ventilation outlets’ layouts. The simulations showed that leakage locations near the corners of the building caused larger concentrations near these corners. However, this did not affect the far-field hydrogen concentration. They also found that locating ventilation openings near the corners can lead to a faster evacuation of hydrogen from the space. Ref. [9] studied the effect of the height of cross beams in the ceiling of underground car parks on hydrogen dispersion. They showed that the height of the beams can play an important role in the safe design of underground garages since it can block hydrogen distribution along the ceiling and, hence, form locations with high hydrogen concentrations. For residential garages, [10] studied the effect of leakage location, duration, and mass flow rate on hydrogen concentration accumulated near the ceiling of a residential garage with a prismatic ceiling configuration. They concluded that when the leakage was located at the center of the garage, the formed hydrogen layer showed more stability in stratification. Also, longer leakage times can result in higher hydrogen concentrations accumulating near the ceiling. Ref. [11] studied three different geometries of ventilation openings near the ceiling of the same garage in the former study. They have also studied four different aspect ratios for the rectangular ventilation openings. They concluded that the transverse rectangular ventilation opening showed the highest hydrogen extraction rates.
Besides FCVs, another promising application of hydrogen in transportation is in the maritime sector. Since cargo ships are the backbone of world trade and their warehouses are responsible for about 3% of the global carbon emissions ([12]), using hydrogen in such application is a great opportunity to cut this carbon emissions. Ref. [13] studied the hydrogen distribution inside a fuel cell ship in case of hydrogen leakage. They also studied different distributions of natural and mechanical ventilation openings and their effects on hydrogen distribution. They concluded that mechanical ventilation showed better evacuation performance for hydrogen, depending on the vents’ distribution and locations. Also, they found that hydrogen accumulates near walls and corners, which were the best locations to locate sensors. Ref. [14] also studied the effects of ventilation rates, hydrogen leakage diameters, and room temperatures on the hydrogen diffusion in a ship’s engine room. Their study found that higher ventilation rates can help decrease the hydrogen concentration. Also, they concluded that higher room temperature enhances the vertical stratification of hydrogen. Ref. [15] studied the effects of hydrogen pipe diameters and hydrogen detectors’ locations to develop some concepts for safe ship design. In their work, they simulated hydrogen leakage in a fuel cell room of a ship using CFD. Their study concluded that smaller pipe diameters can lower the risk of reaching flammable hydrogen concentrations. Additionally, they have noted that the location of hydrogen sensors is affected by the location of hydrogen leakage and the obstacles between the hydrogen source and the sensor.
From the state-of-the-art research summarized, it is clear that hydrogen dispersion due to leakage in complex, large-scale facilities, like factories, was not well studied. Because of the high potential of using hydrogen in industrial applications, such a study should be important to ensure the safe application of hydrogen in such buildings. Therefore, this study aims to simulate hydrogen cloud dispersion inside the Central Utility Building at Jülich Research Centre with details like overhead piping and mechanical equipment. It should be noted here that the building is not originally designed to contain hydrogen pipes and equipment. Therefore, different leakage and ventilation scenarios are shown in this work to understand the behavior of hydrogen clouds in each case and to analyze the effectiveness of each ventilation strategy.
The following sections show the theoretical background of the CFD simulations applied in this work and describe the CFD setup and the grid used in the analysis. Then, the results of the CFD simulation are shown and analyzed, and conclusions are explained.
2. Numerical Models and Setup
The literature introduces many turbulence models to simulate and capture the different turbulent flow phenomena. However, the turbulence models should be modified to enable the simulation of buoyancy-driven, low-density gases like hydrogen and helium. Hydrogen flows turbulently during its leakage from high-pressure vessels of pipes. Accordingly, the turbulent CFD models should correctly capture the hydrogen flow’s different turbulent flow features, like turbulent mixing and buoyancy. The applied turbulence models and their corrections to simulate the buoyancy of hydrogen are introduced. Also, the numerical setup of the CFD solution case is shown.
2.1. The containmentFOAM PACKAGE
The containmentFOAM simulation libraries are implemented, validated, and maintained by the Reactor Safety research group at Jülich Research Centre. The primary usage of these libraries is to analyze gas transport, like hydrogen, during nuclear power plant accidents. Based on OpenFOAM® v9 ([16]), containmentFOAM benefits from all features of the open-source CFD software in addition to other libraries and solvers designed for the nuclear and hydrogen safety applications. The containmentFOAM libraries were extensively validated and verified against experimental results for modeling and simulations of nuclear applications, like in [17], and for hydrogen applications in [18].
2.2. Solution for Unsteady Multi-Species Gas Mixture
CFD simulations are based on solving the mass, momentum, and energy conservation equations. Fluid species should also be conserved in case of simulating multi-gas fluid. The mass conservation equation reads:
and the momentum conservation equation reads:
where the shear stress tensor () takes the form
where is the turbulent eddy viscosity, is the kinematic viscosity, and is the Kronecker delta.The species transport equation reads:
where is the mass fraction of species i, and is the diffusion mass flux calculated from Fick’s law as
Here is the turbulent Schmidt number, and is the molecular diffusivity of species i. The energy conservation equations, in this case, read:
where is the total enthalpy and the potential energy represented by the term .
2.3. k- SST Turbulence Model and Its Modification for Buoyancy
Since the case studied in this work involves hydrogen flow around complex structures, treating the flow near the walls is vital in simulating such a flow. SST turbulence model is used in this work to properly model turbulence near the wall using wall functions. Also, many validation simulations, like in the work of [20,21], have shown the importance of the buoyancy-induced turbulence effects to simulate the stratified gas layers. Because of the large difference in density between the air and hydrogen, the buoyancy effect is crucial during the simulation. Accordingly, the SST turbulence model can be modified with turbulence production terms added to become ([22]):
The variables in Equations (7) and (8) are shown in detail in [22]. By using the simple gradient diffusion hypothesis (SGDH), the production terms and take the form:
where is the turbulent Schmidt number and is the dissipation coefficient.
2.4. Computational Setup
The central utility building with all its components is modeled using CAD software to generate the computational grid representing the void inside the structure shown in Figure 1 where air and the leaked hydrogen can flow. The grid is generated such that it takes into account all relevant equipment and pipes inside the building to enable the correct simulation of the flow. The following section discusses the generated grid, the hydrogen leakage parameters, and the simulated cases in this work.
2.4.1. Numerical Grid
Because of the complexity of the computational domain, a body-fitted cartesian grid with proper boundary layer cells is generated to fit the CAD model of the building. A grid section showing the base cell size and the refined cells is shown in Figure 2. The base grid consists of cubic cells fitted to the geometry of the building and its internal structures. The base cubic cells of the grid have 0.5 m sides, as concluded from a detailed grid independence study explained in [18]. Additional refinement levels are applied directly above the leakage point and below the ceiling to enhance the accuracy of calculations of hydrogen concentrations and turbulence parameters in these areas. Such refinements were added according to the recommendations of the best practice guidelines (BPG) for CFD simulations for hydrogen safety ([23]). Additionally, fine boundary-layer cells are added near the external and internal walls of the domain to ensure correct simulation of near-wall values of all fields.
In the case of natural ventilation scenarios explained later, the flow domain is extended about 15 m above the ventilation windows in the ceiling. This extension is applied to avoid any numerical effects of the boundaries representing the open atmosphere on the flow inside the building. Such a technique was applied in many other literature like [24,25] and recommended by the BPG we referred to previously.
2.4.2. Hydrogen Leakage Parameters
The hydrogen leakage from the pipe is assumed to occur at the indicated location in Figure 1. This pipe hole is assumed to be oriented 21.8o above the horizontal line. From the technical data of the building presented by the building operator, a hydrogen pipe with an 80 mm nominal diameter passes through the building and transports hydrogen to the boilers at . This means the absolute pressure inside this pipe is . The total length of the pipe running through the building is 89.7 m. Assuming that there is only one emergency shutdown valve (ESDV) at the pipe inlet to the building, the total volume of hydrogen inside the pipe running through the building is 0.436 . Also, assuming that the leakage diameter is and treating the hydrogen pipe in case of leakage after the closure of the ESDV as a leaking tank with the same volume and pressure as the pipe, the leakage parameters can be calculated using the methodology explained by [26,27]. The leakage model used here shows that the complete charge of hydrogen, in this case, is wholly leaked after 0.245s after the ESDV closure with an initial flow rate of 0.12423 . From the leakage model mentioned earlier, the leakage density is 0.9591 , and the temperature is 255.87 at the leakage location.
2.4.3. Boundary Conditions
All solid boundaries, i.e., pipes and mechanical equipment inside and the external walls are treated as walls. This means these boundaries have non-slip conditions for velocity, fixed value temperatures, and zero-gradient for pressure. The external sides of the extended region explained in Section 2.4.1 are considered outlet-inlet boundaries. This outlet-inlet condition treats the boundary as zero-gradient in the case of outlet flow and with a fixed zero value in the case of inlet flow. The hydrogen flow is introduced to the domain using the volumetric source term approach explained in [28] to increase the required time step of the simulations at a Courant-Friedrichs-Lewy number (CFL) = 1 and hence significantly reduce the computational time of the simulation.
2.5. Studied Cases and Scenarios
Different leakage scenarios are simulated in this work to study the behavior of the hydrogen cloud. From the parameters mentioned in the former section, the time needed for the pipe to stop leaking and the change in the flow rate during the discharge is calculated. Knowing these parameters, four different scenarios are studied:
- Scenario 1 (Extreme scenario): it is assumed that the hydrogen leakage from leakage point P1 is not detected, and the hydrogen continues its leak inside the building without ventilation. This case is studied as a worst-case scenario (WCS) where no automatic action is taken to mitigate hydrogen leakage or accumulation.
- Scenario 2 (Natural ventilation): the hydrogen leaks from P1 and is detected after 10 seconds from the beginning of the leakage, which results in an emergency shutdown of the hydrogen supply to the building. The roof ventilation windows are also opened to evacuate the hydrogen-air mixture from the building. The windows are assumed to be fully opened.
-
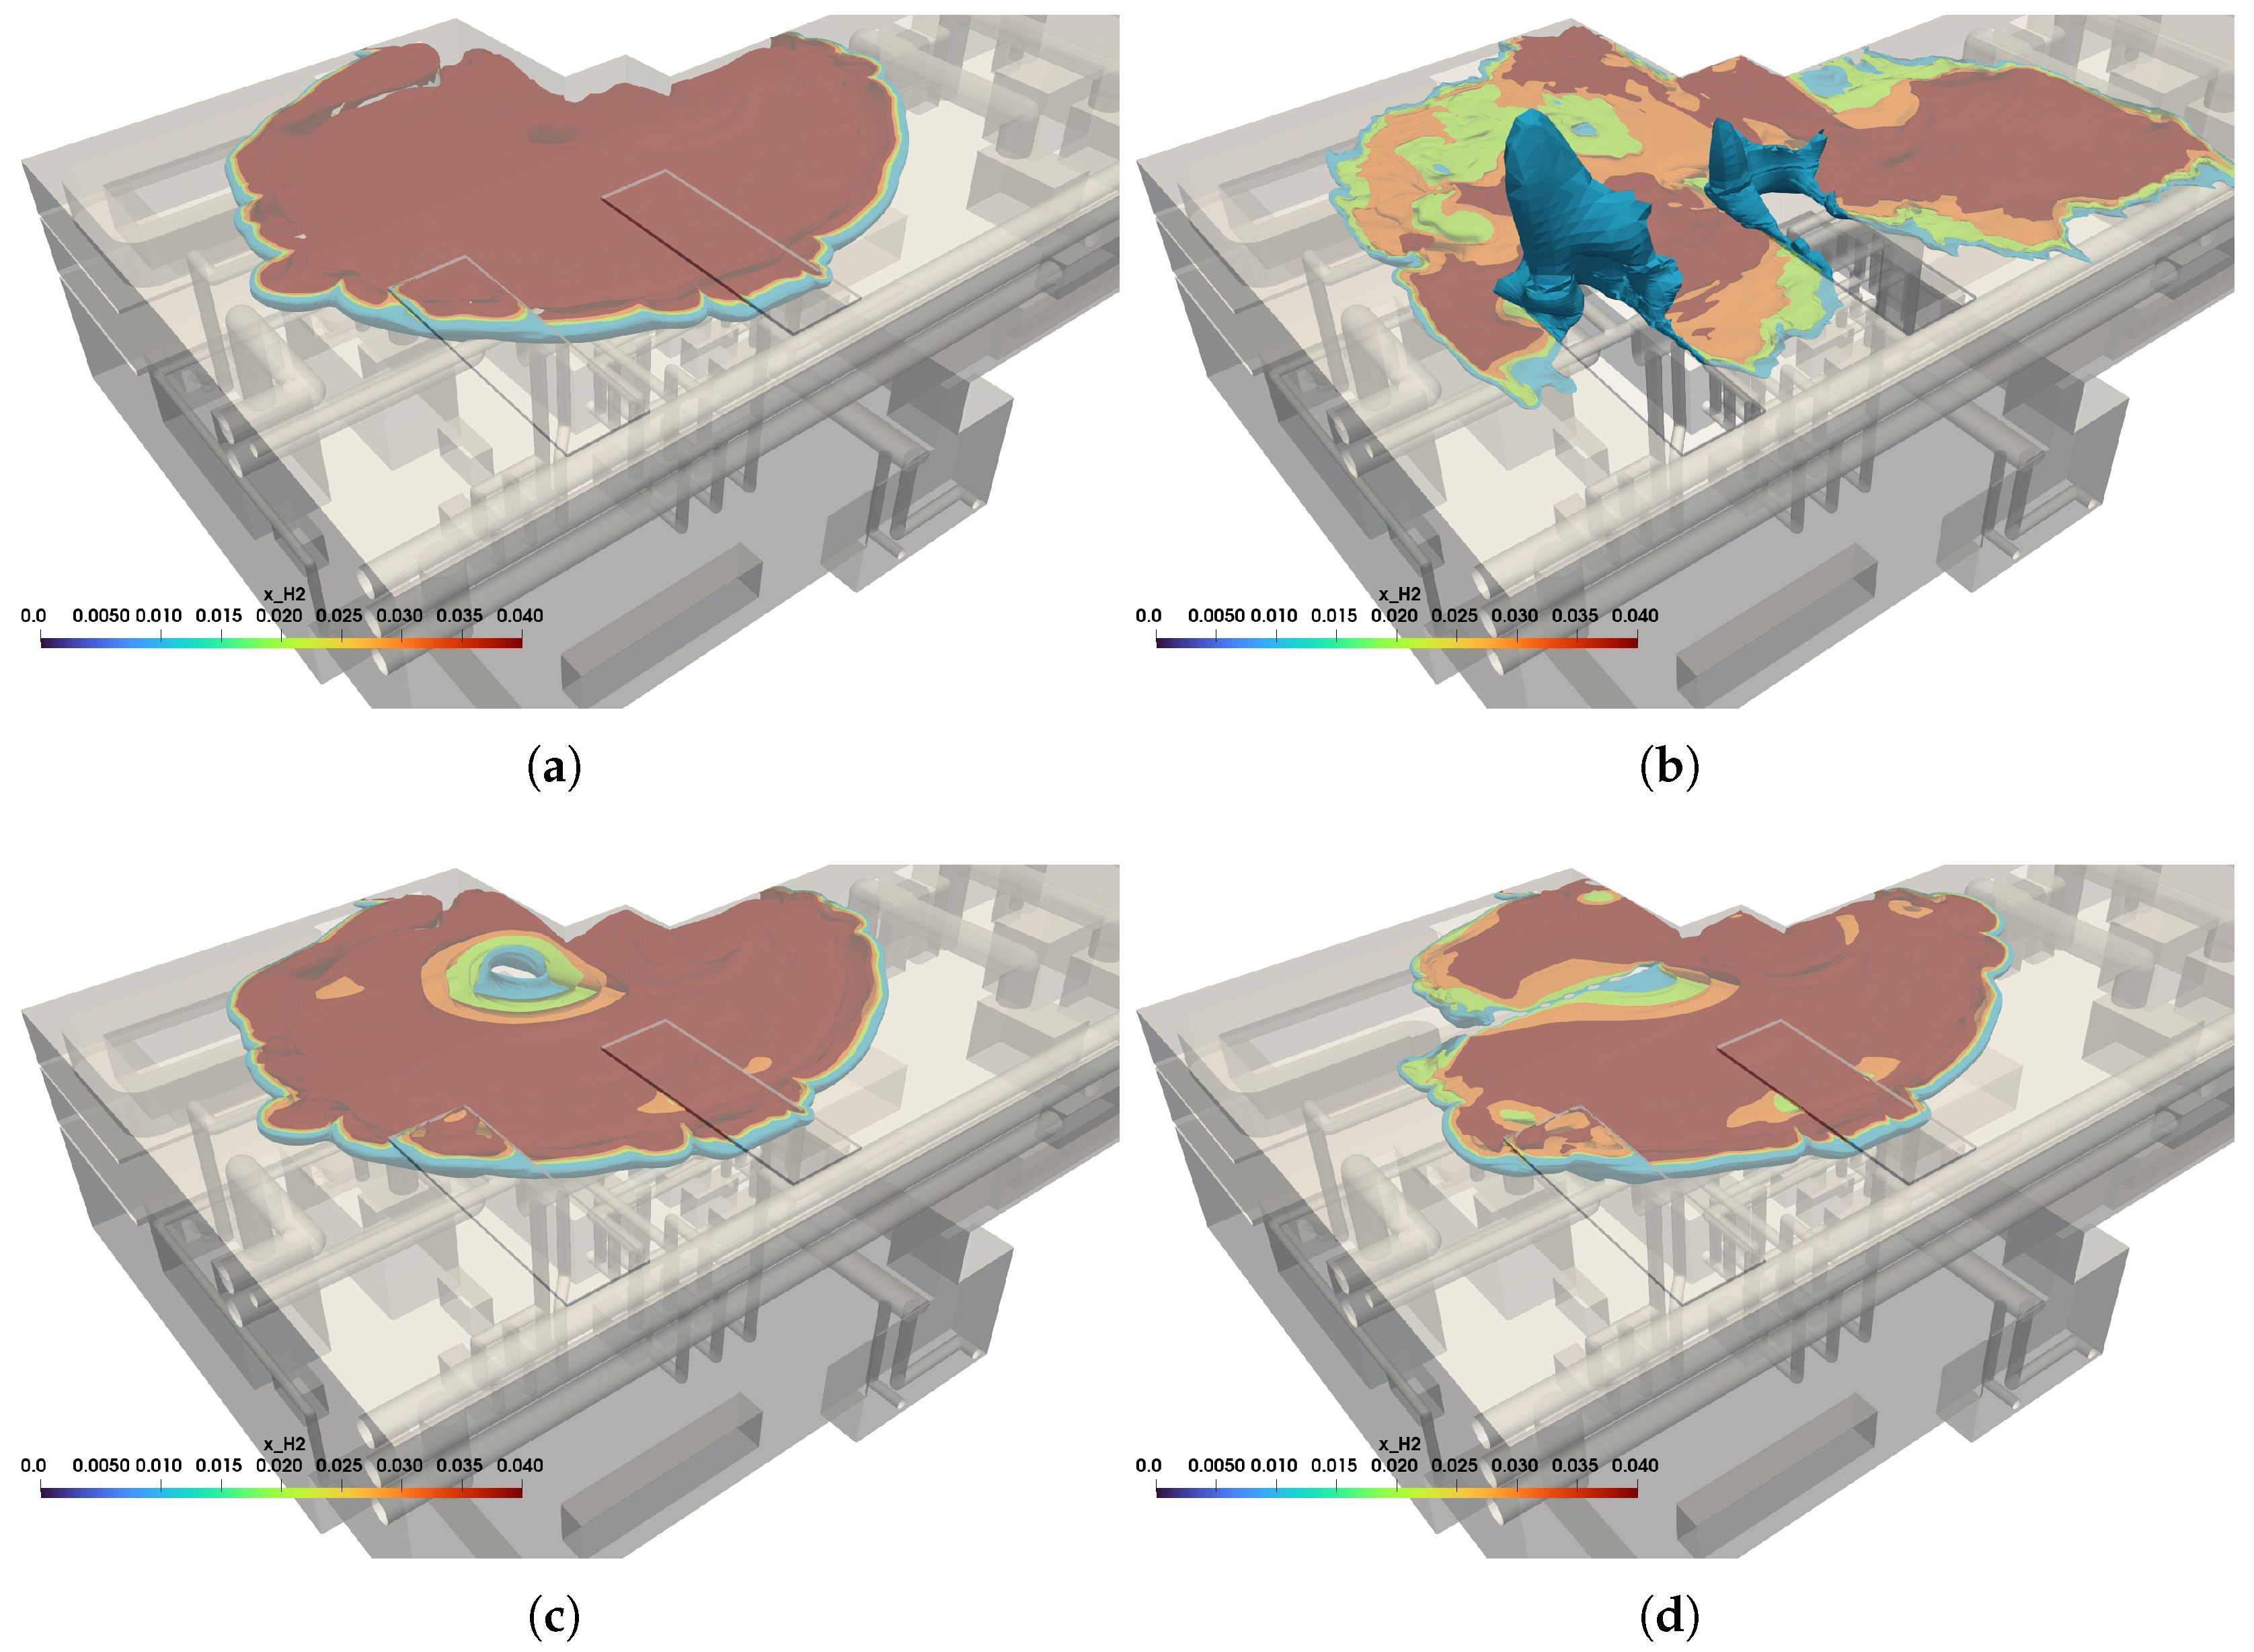
Scenario 3 (Mechanical ventilation): the leakage from P1 is detected after 10 seconds, and the hydrogen evacuation outside the building is started. However, in this scenario, the existing ventilation fan in the building is assumed to be used to evacuate the hydrogen-air mixture. Before the detection of hydrogen, i.e., after 10 s from the start of the leakage, the total volume flow rate of exhaust air is assumed to be 0.03 as recommended by the National Fire Protection Association (NFPA): Hydrogen Technology Code ([29]). The total ventilation flow is calculated to be 4.371 .Figure 3. Hydrogen cloud distribution inside the central utility building after 21 s from the start of the leakage for: a) Scenario 1, b) Scenario 2, c) Scenario 3-a, and d) Scenario 4Figure 3. Hydrogen cloud distribution inside the central utility building after 21 s from the start of the leakage for: a) Scenario 1, b) Scenario 2, c) Scenario 3-a, and d) Scenario 4
 After the detection, two sub-scenarios are studied: Scenario 3-a, where the ventilation rate is increased to 13.888 , which equals about 5 air-changes per hour (ACH). This flow rate is the maximum capacity of the installed ventilation fans in the building. In scenario 3-b, five times the ventilation flow rate, i.e., 25 ACH recommended by FM Global Property Loss Prevention Data Sheet [30], is evacuated from the building. This flow is calculated to be 69.44 .
 - Scenario 4 (Ceiling ventilation): assuming the same parameters as in Scenario 3-a. The only difference is that the exhaust outlets are located on the ceiling of the machine room. The primary purpose of this scenario is to study the effect of the location of the exhaust outlets on the size of the hydrogen cloud in the building.
- Scenario 5 (leakage with obstacles): assuming the same parameters as in Scenario 3-a with the leakage point P2 indicated in Figure 1.
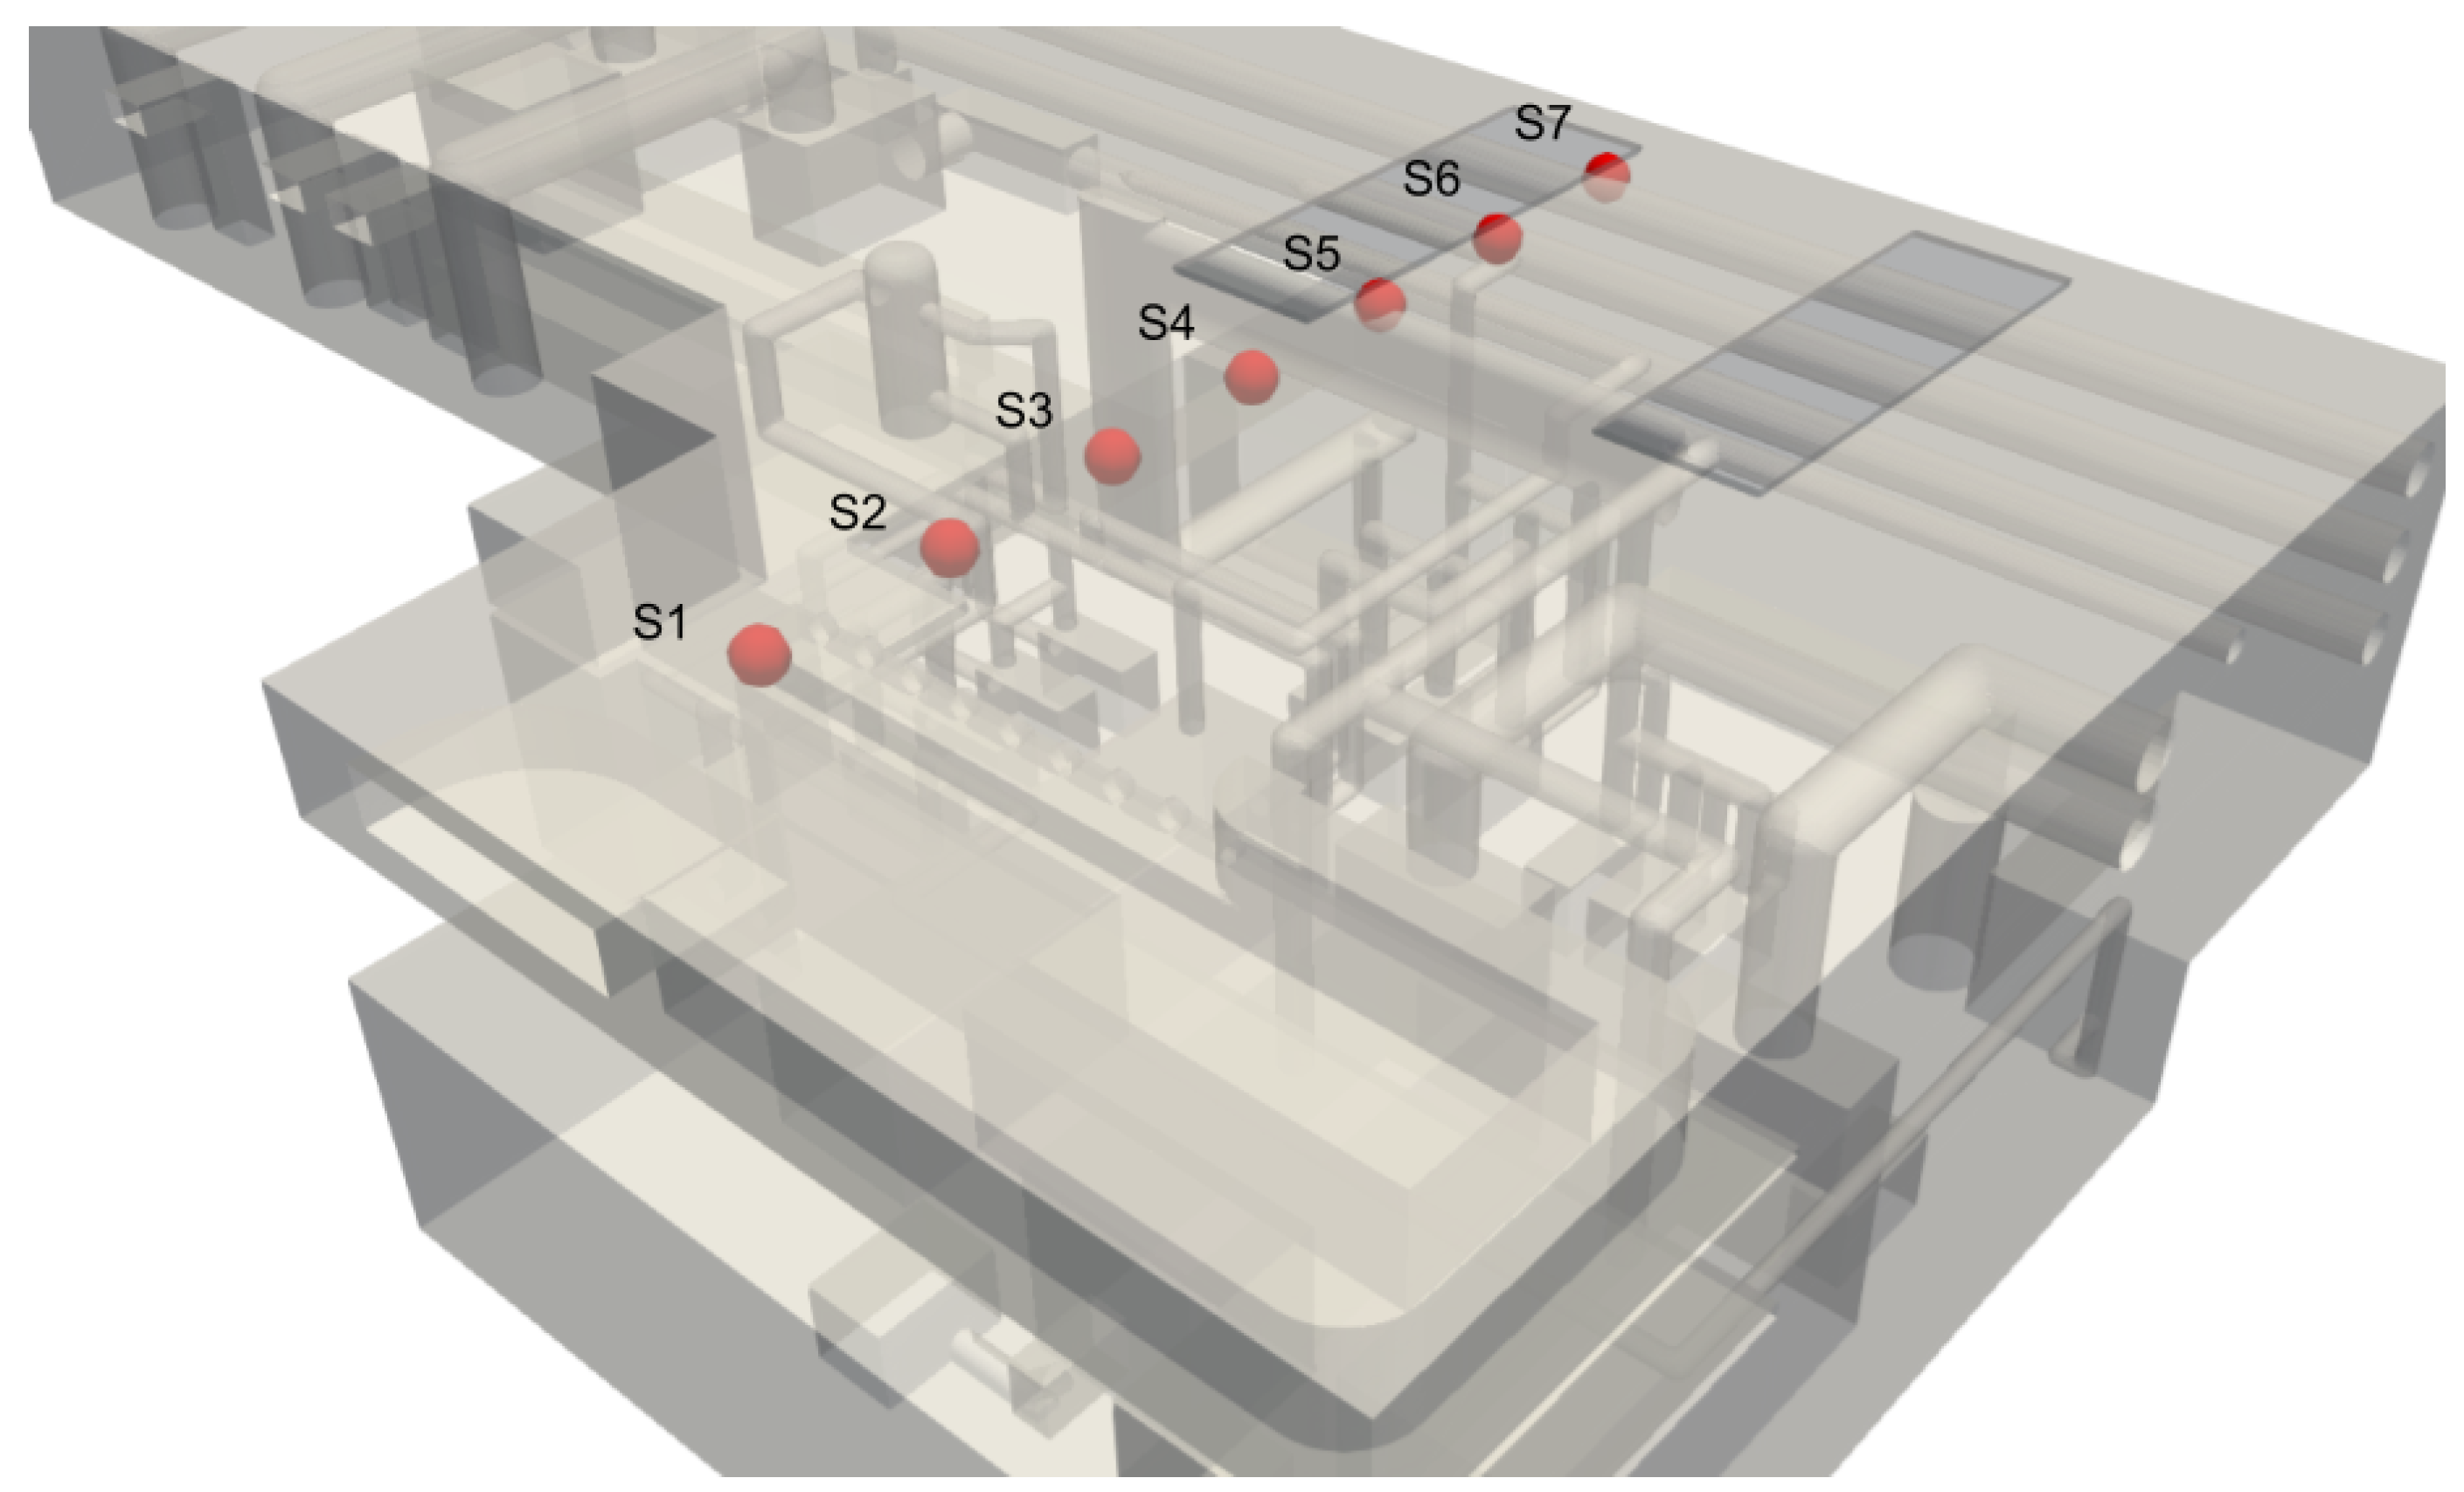
In each scenario, hydrogen concentrations were calculated at seven different measurement points to quantitatively study the behavior of hydrogen inside the building. Figure 6 shows the locations of the hydrogen calculation points.
3. Simulations and Results
Comparing the scenarios explained in the last section leads to a deeper understanding of the hydrogen cloud behavior and a better assessment of risks resulting from hydrogen leakage. This section compares the hydrogen concentration values at specific locations in the building and the combustible hydrogen cloud volume to give an idea about the proper ventilation strategy.
3.1. Scenario 1: No-Ventilation, no-Detection
In this extreme scenario, the hydrogen continues to flow into the space without any outlet outside the building, which leads to its continuous accumulation. Figure 3(a) shows the contour surfaces of the concentrations 1%, 2%, 3%, and 4% of hydrogen within the building after 21 s of continuous hydrogen leakage. A thick hydrogen cloud accumulates below the ceiling, and the thickness of this cloud increases near the corners due to buoyancy and stratification.
It should be noted that this scenario is extreme and should not occur in practical cases since different safety measures have already been applied in the existing hydrogen pipeline in the building. One of the existing safety systems is the ESDV, whose operation is discussed in the following scenarios.
3.2. Scenario 2: Natural Ventilation
In the case of natural ventilation of the building shown in Figure 3(b), the hydrogen cloud spreads horizontally below the ceiling until it meets the ventilation windows in the ceiling shown in Figure 1. As soon as the hydrogen reaches the openings, it starts to flow outside the building driven by the buoyancy forces as shown in Figure 3(b). A rapid dilution of the hydrogen concentration near the ceiling occurs after shutting down the hydrogen flow in the pipeline.
A significant drop in hydrogen concentration and cloud thickness near the ceiling can be seen, especially in the areas covered with the ceiling windows. This is clear from the comparison of Figure 3(a) and Figure 3(b) where the contour surfaces show less 4% concentration areas. Nevertheless, the ventilation openings influence parts of the hydrogen cloud flow outside the area.
3.3. Scenario 3: Forced Ventilation
Figure 3(c) shows that the hydrogen cloud spreads rapidly near the ceiling despite active ventilation. By analyzing the formed hydrogen cloud in this case, it is found that the hydrogen cloud accumulates above the exhaust outlets. The outlets are located about 2.5 m below the ceiling of the machine hall, while the hydrogen cloud accumulates less than 1 m below the ceiling, as shown in Figure 4. Even in the simulations of Scenario 3-b, i.e., the exhaust flow rate is 25 ACH, the exhaust system is still not as effective as expected. This shows the importance of correctly locating the exhaust openings to prevent hydrogen dispersion in case of leakage.
3.4. Scenario 4: Forced Ventilation from Ceiling
The proposed exhaust openings in this scenario have the same number, diameters, and flow rates as in scenario 3-a. The only difference between this scenario and Scenario 3-a is the location of the openings, which is, in this case, on the ceiling. Figure 3(d) shows a significant improvement in the evacuation of the hydrogen cloud from the building only by changing the location of the outlets and their direction, especially around the openings, as seen in this figure.
Another result from the simulation of this scenario is the limited area of effect of these outlets. The outlets are only effective in the surrounding area because they are concentrated in a small area compared to the cloud. Once the cloud disperses out of this area, the hydrogen-air mixture can no longer be evacuated from the building with the same effectiveness. Similar to the previously discussed scenario, the location of the openings plays a crucial role in their effectiveness and, hence, in the hydrogen evacuation rates.
3.5. Scenario 5: Leakage with Obstacles
The simulation of the spread of hydrogen cloud when leaking from point P2 shown in Figure 1 shows different behavior of hydrogen. The hydrogen gas rises towards the ceiling driven by buoyancy force. After impinging with the intermediate floor between the ground and the top roof of the building, the cloud is split into two volumes: one continues rising towards the top ceiling, and the other remains trapped below the intermediate floor. Consequently, the trapped volume of hydrogen accumulates rapidly under the intermediate floor. Figure 5 shows the contour surfaces for hydrogen concentration below the top ceiling and the intermediate floor. After the hydrogen leakage from the pipe stops, i.e., after 10 seconds, the trapped hydrogen cloud starts to leak slowly towards the top roof. This happens due to the buoyancy force and the diffusion from high to low hydrogen concentrations that continuously forces hydrogen to flow around the edge of the intermediate floor in the upward direction. This eventually leads to the depletion of the combustible hydrogen cloud from below the floor at a much slower rate than in other scenarios.
3.6. Hydrogen Concentrations
To quantitatively assess the hydrogen concentration change in different locations in the building, its change over time is monitored at the measuring locations shown in Figure 6. Figure 7(a) shows hydrogen concentrations in case of applying mechanical ventilation, i.e., Scenario 3-a, in solid lines, compared to the no-ventilation scenario, i.e., Scenario 1, in dashed lines. The same colors in this figure represent the same measuring point. The hydrogen cloud behaves almost the same for about 15 s by comparing the mechanical ventilation and no-ventilation scenarios. After this period, hydrogen concentrations tend to drop in the case of mechanical ventilation, while the concentrations increase in the case of no ventilation. Such behavior is expected since the hydrogen cloud takes a few seconds to reach the exhaust outlets near the ceiling and flow outside the building. The continuous hydrogen leakage from the pipe and the lack of an exhaust opening from the building in Scenario 1 lead to a constant build-up of hydrogen inside the building.
Figure 6.
Concentration calculation points (mimicking sensors) directly below the ceiling of the building.
Figure 6.
Concentration calculation points (mimicking sensors) directly below the ceiling of the building.
On the other hand, Figure 7(b) compares Scenario 3-a in solid lines with the natural ventilation scenario, i.e., Scenario 2 in dashed lines. The figure shows a significant advantage of natural ventilation over forced ventilation in the rapid discharge of hydrogen outside the building. This occurs due to the buoyancy forces driving hydrogen toward the ceiling and through the openings. Also, the large area of the ceiling openings plays an essential role in facilitating hydrogen evacuation through them.
3.7. Hydrogen Combustible Cloud
Another method to compare the effectiveness of ventilation systems is by comparing the combustible hydrogen cloud volumes in different scenarios, as shown in Figure 9. In the no-ventilation case, the size of the hydrogen cloud continuously increases since there is no outlet for hydrogen to flow outside the building. Furthermore, Scenario 3-a is the least effective among the scenarios where the leakage occurs at point P1, even after increasing the exhaust rate in Scenario 3-b to five times the maximum fan capacity, i.e., 25 ACH. This occurs due to the exhaust outlets’ location, about 2.5 m below the ceiling, as explained in Section 3.3. Therefore, changing the location of the outlets to be on the ceiling, as in Scenario 4, significantly improves the effectiveness of the exhaust system despite having the same flow rate as in Scenario 3-a. Also, locating exhaust outlets on the ceiling in Scenario 4 reduces the peak volume of the cloud by almost one-third of the other Scenario 3-a. On the other hand, the effectiveness of the ceiling ventilation drops after about 20 s after the start of the leakage. This drop occurs because the ceiling outlets are only effective in the area close to these outlets. As the cloud disperses inside the building, the hydrogen cloud flows far from the outlets and evacuates almost-pure air from the building instead of a hydrogen-rich mixture.
Scenario 5, where the leakage point is assumed at P2 in Figure 1 under the intermediate floor, shows a different behavior than the other scenarios. First, the peak cloud volume is reached after about 10 seconds from the start of the leakage; however, it is lower than the previous scenarios illustrated. After reaching the peak volume, the volume of the combustible hydrogen cloud starts to decrease at a lower rate compared to other scenarios until it vanishes completely after about 82 seconds.
This scenario shows that the presence of an obstacle between the leakage point and the exhaust outlets hinders the free motion of hydrogen and traps the cloud in other pockets, depending on the geometry of the obstacle. In the studied scenario, the intermediate floor redistributes the combustible cloud volume over a longer time. This means a lower peak volume with a longer time of the flammable cloud inside the building, which enhances the hydrogen combustion risk.
4. Conclusions
This work shows a numerical simulation study of hydrogen cloud dispersion inside a large-scale building not originally designed to contain hydrogen pipes and equipment. Realistic hydrogen flow and leakage parameters are considered in this study to investigate the concentration change with time and the effect of different ventilation strategies. In this study, five different scenarios were considered: no ventilation, natural ventilation, forced ventilation from side openings, and forced ventilation from ceiling openings were considered.
Under the explained leakage parameters, the main driving force for the hydrogen cloud is the buoyancy force. Therefore, natural ventilation is more effective than forced ventilation from side openings. However, placing the ventilation outlets on the ceiling of the space leads to the effective evacuation of hydrogen, which almost matches the effectiveness of natural ventilation. Additionally, once the hydrogen cloud moves away from the effectiveness area of the outlet, the hydrogen keeps diffusing away to the rest of the building. In the case of hydrogen leakage located below other structures inside the building, the hydrogen cloud was partially trapped below these structures, which led to a redistribution of the combustible cloud in different locations and accordingly increased the risk of combustion.
From these simulation results, it is concluded that the ventilation openings should be located as close as possible to the ceiling of the area where hydrogen is expected to leak. These exhaust openings should also be placed above the potential hydrogen leakage locations and at other locations to ensure enough area in the ceiling to evacuate hydrogen effectively. Another conclusion from this work is to design buildings that contain hydrogen sources with no obstacles between the potential hydrogen leakage locations and the ventilation outlets. Such a design should lead to avoiding combustible hydrogen cloud redistribution and forming multiple combustible pockets below these obstacles. Finally, the simulations show the importance of studying the effectiveness of the exhaust system rather than focusing only on the exhaust flow rate.
Potential future work is to analyze other hydrogen mitigation techniques, such as passive auto-catalytic recombines (PARs), on hydrogen concentrations. Also, the optimization of sensors’ locations that are used to detect hydrogen after a time delay short enough to avoid any combustible hydrogen levels in the building.
Author Contributions
K.Y.: Writing—Original Draft, Conceptualization, Methodology, Investigation, Visualization. S.K.: Conceptualization, Software, Resources, Writing - Review & Editing, Supervision, Funding acquisition. E-A.R.: Conceptualization, Methodology, Writing - Review & Editing, Supervision, Project administration, Funding acquisition.
Funding
The Living Lab Energy Campus (LLEC) Power to Gas (PtG++) project is funded by the German Federal Ministry of Education and Research (BMBF) project No.:03SF0573.
Acknowledgments
The authors gratefully acknowledge computing time on the supercomputer JURECA ([31]) at Forschungszentrum Jülich under grant name cfrun.
Conflicts of Interest
The authors declare no conflicts of interest.
Abbreviations
The following abbreviations are used in this manuscript:
| ACH | Air Change per Hour |
| BPG | Best Practice Guidelines |
| CAD | Computer-Aided Design |
| ESDV | Emergency Shut Down Valve |
| FCV | Fuel Cell Vehicle |
| LES | Large Eddy Simulation |
| LFL | Lower Flammability Limit |
| NFPA | National Fire Protection Association |
| NZE | Net Zero Emissions |
| PAR | Passive Auto-catalytic Recombiner |
| RANS | Reynolds-Averaged Navier-Stokes |
| SGDH | Simple Gradient Diffusion Hypothesis |
| SST | Shear Stress Tensor |
| Subscripts and superscripts | |
| i | species index |
| k | related to the turbulence kinetic energy |
| t | turbulence value |
| related to the specific rate of turbulence dissipation | |
References
- IEA. Global Hydrogen Review 2022; OECD Publishing, 2022.
- Giannissi, S.G.; Tolias, I.C.; Melideo, D.; Baraldi, D.; Shentsov, V.; Makarov, D.; Molkov, V.; Venetsanos, A.G. On the CFD modelling of hydrogen dispersion at low-Reynolds number release in closed facility. International Journal of Hydrogen Energy 2021, 46, 29745–29761. [CrossRef]
- Malakhov, A.; Avdeenkov, A.; Du Toit, M.; Bessarabov, D. CFD simulation and experimental study of a hydrogen leak in a semi-closed space with the purpose of risk mitigation. International Journal of Hydrogen Energy 2020, 45, 9231–9240. [CrossRef]
- Ismail, I.; Tsukikawa, H.; Kanayama, H. Modelling Considerations in the Simulation of Hydrogen Dispersion within Tunnel Structures. Journal of Applied Mathematics 2012, 2012, 846517. [CrossRef]
- Koutsourakis, N.; Tolias, I.C.; Giannissi, S.G.; Venetsanos, A.G. Numerical Investigation of Hydrogen Jet Dispersion Below and Around a Car in a Tunnel. Energies 2023, 16, 6483. [CrossRef]
- Suzuki, J.; Oyakawa, K.; Watanabe, S.; Mukai, S.; Mitsuishi, H. CFD simulation on diffusion of leaked hydrogen caused by vehicle accident in tunnels. Technical report, Hydrogen Knowledge Centre, 2005.
- Middha, P.; Hansen, O.R. CFD simulation study to investigate the risk from hydrogen vehicles in tunnels. International Journal of Hydrogen Energy 2009, 34, 5875–5886. 2nd International Conference on Hydrogen Safety, . [CrossRef]
- Huang, T.; Zhao, M.; Ba, Q.; Christopher, D.M.; Li, X. Modeling of hydrogen dispersion from hydrogen fuel cell vehicles in an underground parking garage. International Journal of Hydrogen Energy 2022, 47, 686–696. [CrossRef]
- Li, Y.; Jiang, J.; Yu, Y.; Zhang, Q. Numerical simulation of dispersion and distribution behaviors of hydrogen leakage in the garage with a crossbeam. Simulation 2019, 95, 1229–1238. [CrossRef]
- Hajji, Y.; Jouini, B.; Bouteraa, M.; Elcafsi, A.; Belghith, A.; Bournot, P. Numerical study of hydrogen release accidents in a residential garage. International Journal of Hydrogen Energy 2015, 40, 9747–9759. [CrossRef]
- Hajji, Y.; Bouteraa, M.; Elcafsi, A.; Bournot, P. Green hydrogen leaking accidentally from a motor vehicle in confined space: A study on the effectiveness of a ventilation system. International Journal of Energy Research 2021, 45, 18935–18943. [CrossRef]
- IMO. Fourth IMO GHG study 2020. International Maritime Organization London, UK 2020.
- Li, F.; Yuan, Y.; Yan, X.; Malekian, R.; Li, Z. A study on a numerical simulation of the leakage and diffusion of hydrogen in a fuel cell ship. Renewable and Sustainable Energy Reviews 2018, 97, 177–185. [CrossRef]
- Xie, Y.; Liu, J.; Qin, J.; Xu, Z.; Zhu, J.; Liu, G.; Yuan, H. Numerical simulation of hydrogen leakage and diffusion in a ship engine room. International Journal of Hydrogen Energy 2024, 55, 42–54. [CrossRef]
- Guan, W.; Chen, J.; Chen, L.; Cao, J.; Fan, H. Safe Design of a Hydrogen-Powered Ship: CFD Simulation on Hydrogen Leakage in the Fuel Cell Room. Journal of Marine Science and Engineering 2023, 11, 651. [CrossRef]
- Greenshields, C.; Weller, H. Notes on Computational Fluid Dynamics: General Principles; CFD Direct Ltd: Reading, UK, 2022.
- Kelm, S.; Kampili, M.; Kumar, G.V.; Sakamoto, K.; Liu, X.; Kuhr, A.; Druska, C.; Prakash, K.A.; Allelein, H. Development and first validation of the tailored CFD solver ‘containmentFoam’for analysis of containment atmosphere mixing. In Proceedings of the Proceedings of the 18th International Topical Meeting on Nuclear Reactor Thermal Hydraulics (NURETH-18), Portland, OR, USA, 2019, pp. 18–23.
- Yassin, K.; Kelm, S.; Kampili, M.; Reinecke, E.A. Validation and Verification of containmentFOAM CFD Simulations in Hydrogen Safety. Energies 2023, 16, 5993. [CrossRef]
- Kelm, S.; Kampili, M.; Liu, X.; George, A.; Schumacher, D.; Druska, C.; Struth, S.; Kuhr, A.; Ramacher, L.; Allelein, H.J.; et al. The Tailored CFD Package ‘containmentFOAM’ for Analysis of Containment Atmosphere Mixing, H2/CO Mitigation and Aerosol Transport. Fluids 2021, 6. [CrossRef]
- Abe, S.; Ishigaki, M.; Sibamoto, Y.; Yonomoto, T. RANS analyses on erosion behavior of density stratification consisted of helium–air mixture gas by a low momentum vertical buoyant jet in the PANDA test facility, the third international benchmark exercise (IBE-3). Nuclear Engineering and Design 2015, 289, 231–239. [CrossRef]
- Kampili, M.; Kumar, G.V.; Kelm, S.; Prakash, K.A.; Allelein, H.J. Validation of multicomponent species transport solver-impact of buoyancy turbulence in erosion of a stratified light gas layer. 14th OpenFOAM Workshop 2019.
- Menter, F.; Esch, T. Elements of industrial heat transfer predictions. In Proceedings of the 16th Brazilian Congress of Mechanical Engineering (COBEM), 2001, Vol. 109, p. 650.
- Tolias, I.; Giannissi, S.; Venetsanos, A.; Keenan, J.; Shentsov, V.; Makarov, D.; Coldrick, S.; Kotchourko, A.; Ren, K.; Jedicke, O.; et al. Best practice guidelines in numerical simulations and CFD benchmarking for hydrogen safety applications. International Journal of Hydrogen Energy 2019, 44, 9050–9062. [CrossRef]
- Giannissi, S.; Hoyes, J.; Chernyavskiy, B.; Hooker, P.; Hall, J.; Venetsanos, A.; Molkov, V. CFD benchmark on hydrogen release and dispersion in a ventilated enclosure: Passive ventilation and the role of an external wind. International Journal of Hydrogen Energy 2015, 40, 6465–6477. [CrossRef]
- Matsuura, K.; Kanayama, H.; Tsukikawa, H.; Inoue, M. Numerical simulation of leaking hydrogen dispersion behavior in a partially open space. International Journal of Hydrogen Energy 2008, 33, 240–247. [CrossRef]
- Molkov, V.V.; Saffers, J.B. Introduction to hydrogen safety engineering. Technical report, Hydrogen Knowledge Centre, 2011.
- Schefer, R.; Houf, W.; San Marchi, C.; Chernicoff, W.; Englom, L. Characterization of leaks from compressed hydrogen dispensing systems and related components. International Journal of Hydrogen Energy 2006, 31, 1247–1260. [CrossRef]
- Kotchourko, A.; Baraldi, D.; Bénard, P.; Jordan, T.; Keßler, A.; LaChance, J.; Steen, M.; Tchouvelev, A.V.; Wen, J.X. State-of-the-art and research priorities in hydrogen safety. Technical report, Hydrogen Knowledge Centre, 2013.
- NFPA 2. NFPA 2: Hydrogen technology code; National Fire Protection Assoc, 2016.
- FM Global. FM Global Property Loss Prevention Data Sheet 7-91: Hydrogen. Technical report, FM Global, 2020.
- Jülich Supercomputing Centre. JURECA: Data Centric and Booster Modules implementing the Modular Supercomputing Architecture at Jülich Supercomputing Centre. Journal of large-scale research facilities 2021, 7. [CrossRef]
Figure 1.
3D CAD model of the central utility building at Jülich Research Centre with its different components and the leakage location.
Figure 1.
3D CAD model of the central utility building at Jülich Research Centre with its different components and the leakage location.
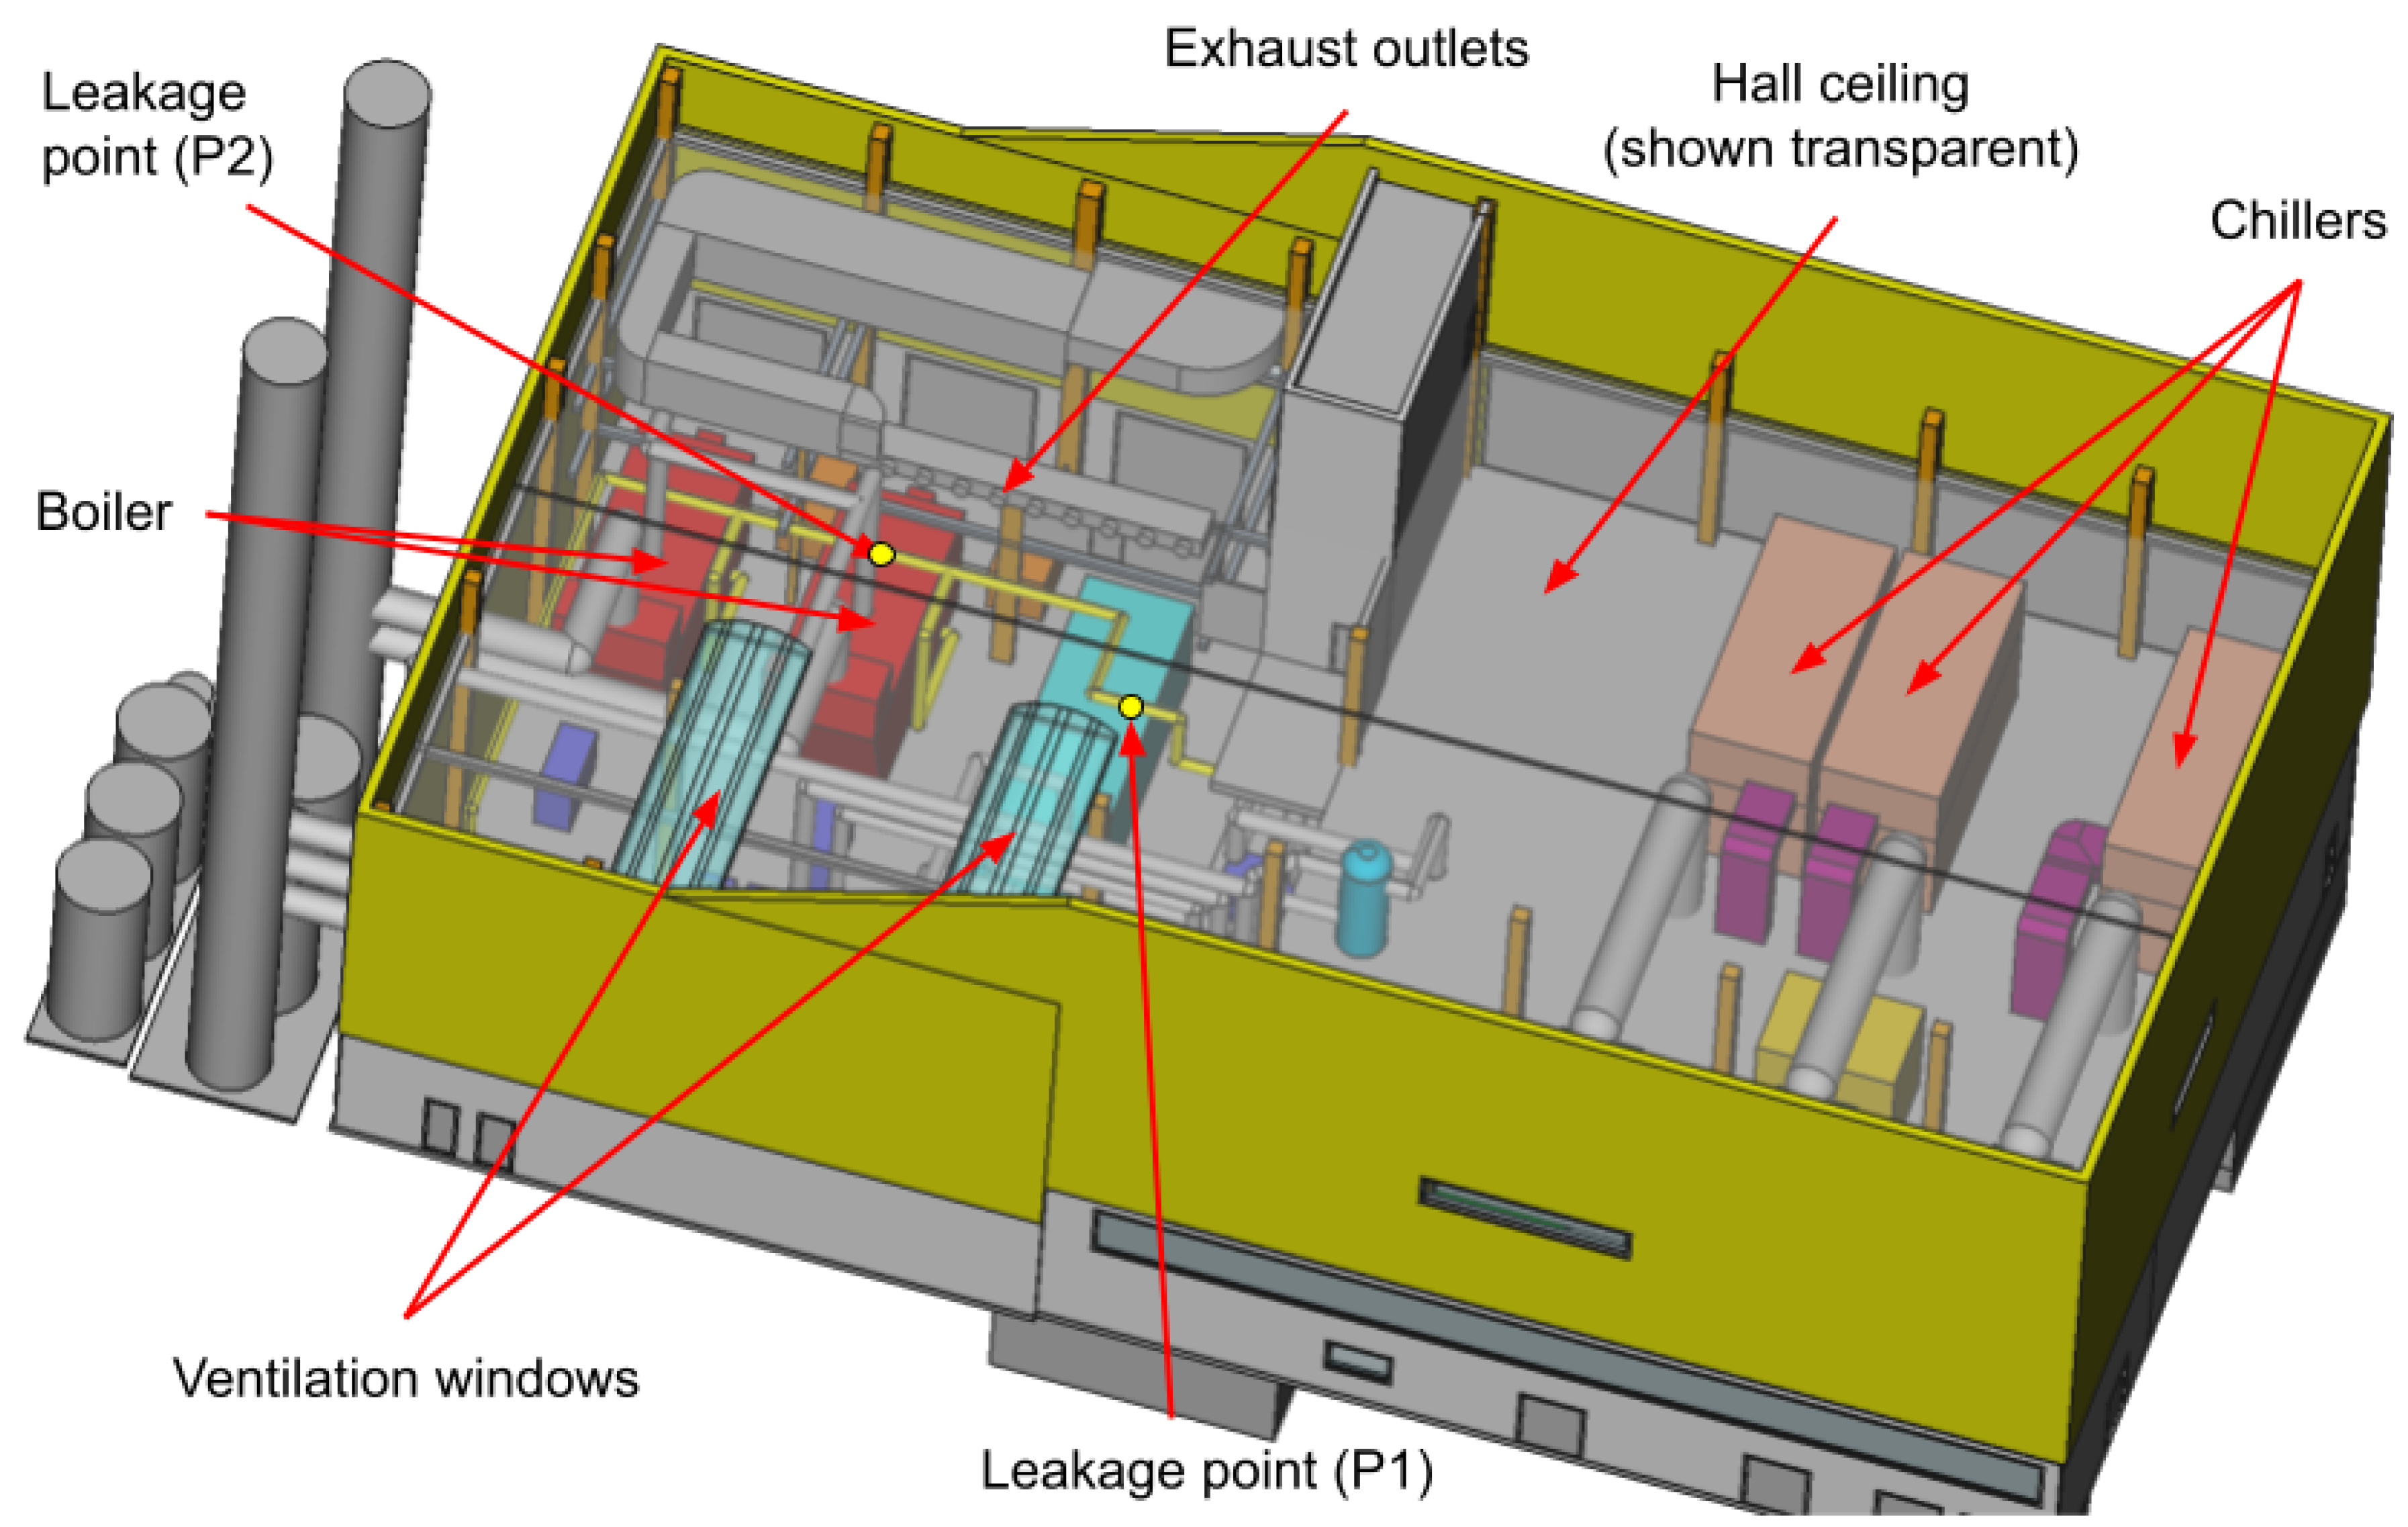
Figure 2.
Section in the computational grid used in this work showing the different refinement levels and the domain extension above the ventilation windows.
Figure 2.
Section in the computational grid used in this work showing the different refinement levels and the domain extension above the ventilation windows.
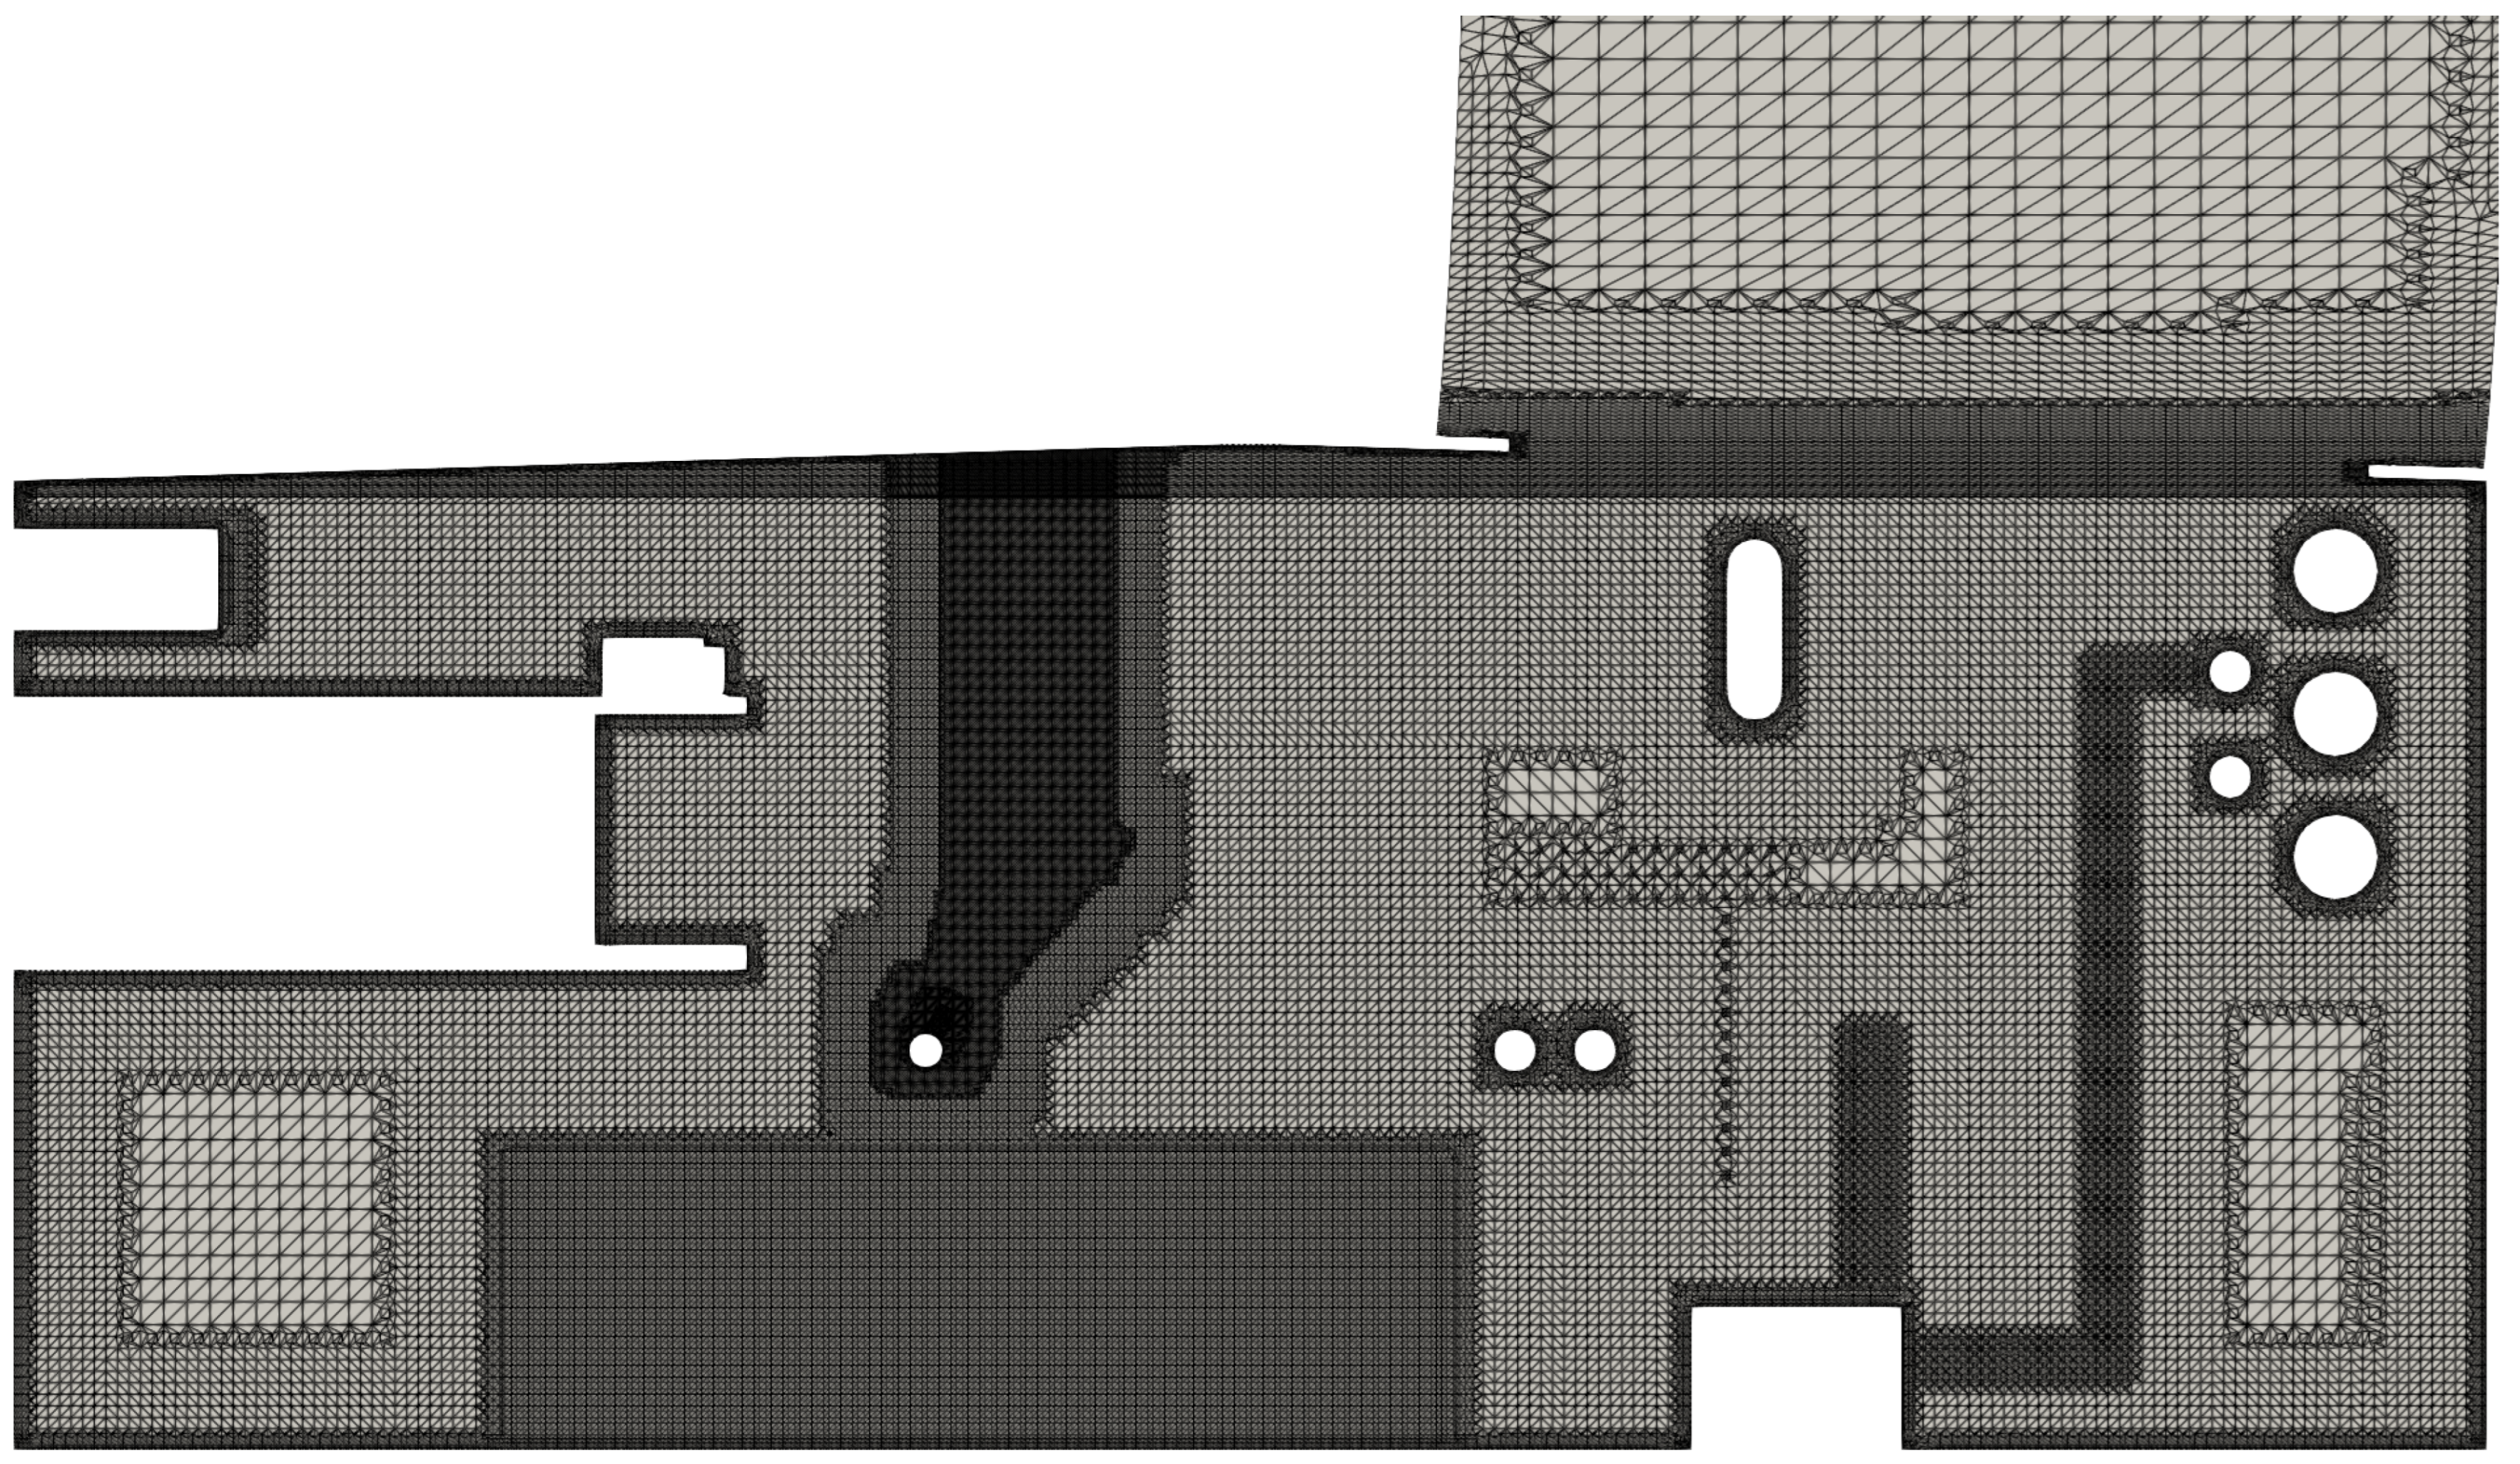
Figure 4.
Section of the simulated building showing the depth of the hydrogen cloud compared to the gap between the ceiling and the exhaust outlets.
Figure 4.
Section of the simulated building showing the depth of the hydrogen cloud compared to the gap between the ceiling and the exhaust outlets.
Figure 5.
Hydrogen concentration contours for Scenario 5 viewing the building from a) the back side and b) the front side.
Figure 5.
Hydrogen concentration contours for Scenario 5 viewing the building from a) the back side and b) the front side.
Figure 7.
Hydrogen volumetric concentrations of a) mechanical vs. extreme and b) natural vs. mechanical scenarios
Figure 7.
Hydrogen volumetric concentrations of a) mechanical vs. extreme and b) natural vs. mechanical scenarios
Figure 8.
Concentration calculation points (mimicking sensors) below the intermediate floor.
Figure 9.
Comparison of the hydrogen combustible cloud volume change with time for the different scenarios.
Figure 9.
Comparison of the hydrogen combustible cloud volume change with time for the different scenarios.
Disclaimer/Publisher’s Note: The statements, opinions and data contained in all publications are solely those of the individual author(s) and contributor(s) and not of MDPI and/or the editor(s). MDPI and/or the editor(s) disclaim responsibility for any injury to people or property resulting from any ideas, methods, instructions or products referred to in the content. |
© 2025 by the authors. Licensee MDPI, Basel, Switzerland. This article is an open access article distributed under the terms and conditions of the Creative Commons Attribution (CC BY) license (http://creativecommons.org/licenses/by/4.0/).
Copyright: This open access article is published under a Creative Commons CC BY 4.0 license, which permit the free download, distribution, and reuse, provided that the author and preprint are cited in any reuse.


