
Submitted:
02 April 2025
Posted:
03 April 2025
You are already at the latest version
Abstract
Background/objectives: Gluten-free diets have become very popular in recent years and unjustified exclusion of gluten happens extremely frequently. There are isolated reports which warn that symptoms of psoriasis, atopic dermatitis or chronic urticaria can be aggravated by the supply of gluten in the patient's diet. The aim of the study was (i) to assess the prevalence of antibodies typical for gluten-dependent enteropathy in patients with the above-mentioned skin diseases and in the comparison group; (ii) to assess the relationship between the declared diet in patients with selected dermatoses and the presence of antibodies typical for gluten-dependent enteropathy; (iii) to assess the occurrence of IgE specific to selected allergens, including wheat and rye flours, in the studied groups; (iv) to assess dietary behaviour in patients with selected skin diseases and in the comparison group. Methods: An interviewer-supervised auditory questionnaire was used to obtain information on the health status of the subjects. Their individual gluten intake was assessed by means of one of the retrospective dietary assessment methods. The method of consumption frequency was applied. Antibodies directed against smooth muscle endomysium, tissue transglutaminase and gliadin were detected in the patients and in the comparison group. The tests were performed using ready-made kits according to the manufacturer's recommended test instructions. In addition, blood allergy tests were performed in all the subjects in the study and control groups. Results: Based on the study, the diagnosis of visceral disease and gluten allergy was ruled out in all the subjects. However, significant differences were shown regarding the intake of certain foods. Conclusions: In patients with autoimmune diseases with associated gastrointestinal symptoms, a full diagnostic workup for gluten-dependent enteropathy and gluten intolerance is necessary. Patients who report gastrointestinal symptoms should not implement a gluten-free diet without appropriate diagnostics and consultation with their doctor.
Keywords:
psoriasis
; atopic dermatitis
; chronic urticaria
; coeliac disease
; gluten
1. Introduction
A gluten-free diet is a diet excluding gluten: a complex of proteins, mainly gliadins and glutenins, which are contained in the germs of wheat grains as well as in other cereals, including those in the form of avenins in oats, secalins in rye, and hordeins in barley [1]. Several disorders associated with the consumption of foods that are sources of gluten have been described; these may be autoimmune or immunological disorders. Coeliac disease (CD), gluten/wheat allergy (WA) or non-celiac gluten sensitivity (NCGS) are the so-called gluten-dependent diseases known as gluten intolerance. The common and main treatment of these is a gluten-free diet. The symptomatology of these disorders may be similar. However, efforts should be made to differentiate them correctly as each has different complications and prognosis [2].
According to ESPGHAN guidelines, individuals who are at risk of coeliac disease, even without symptoms suggestive of the disease, should be systematically screened for CD [3]. Given the gradual increase in the prevalence of atypical coeliac disease, it should be diagnosed not only in children with typical symptoms but also in adults, including the elderly [4].
According to the CD diagnostic guidelines, tests detecting 3 types of antibodies are therefore used: antibodies against tissue transglutaminase type 2 (anti-tTG2); antibodies against endomysial smooth muscle (EMA); antibodies against deamidated gliadin peptides (anti-DPG).
The scientific literature often concludes that the presence of one autoimmune disease is associated with an increased risk of another one, including CD [5].
Psoriasis is a chronic inflammatory skin disease [6]. Atopic dermatitis (AD) is also a chronic, recurrent condition [7], and urticaria is one of the most common allergic diseases [8]. These diseases greatly reduce the quality of life of patients, who often seek a solution to their health problem in their daily diet.
Given the need to confirm the presence of CD in order to implement a gluten-free diet, it seems appropriate to confirm the presence of IgAEmA, anti-tTG2 and anti-DPG antibodies in disease entities other than CD. This would deepen the knowledge of the pathogenesis of selected skin diseases and indicate the possibility of broadening therapeutic recommendations.
Taking into account the abovementioned assumptions, the aim of this study was to assess the prevalence of antibodies typical for gluten-dependent enteropathy (directed against tissue transglutaminase, smooth muscle endomysium and gliadin) in patients with psoriasis, chronic urticaria and AD and in a comparison group of healthy subjects. In addition, it was important to assess the association between the declared diet in the patients with the selected skin diseases and the presence of antibodies typical of gluten-dependent enteropathy. We also aimed at checking the prevalence of IgE specific to selected allergens, including wheat and rye flours, in the study groups. To assess the presence of antibodies fully, we had to check, through questionnaires, the dietary behaviour in the patients with the selected skin diseases and in the comparison group.
2. Materials and Methods
The study group consisted of 117 subjects including: 35 patients with psoriasis vulgaris (20 women and 15 men); 26 patients with AD (18 women and 8 men); and 21 patients with chronic nettle (18 women and 3 men). The comparison group consisted of 35 healthy subjects (25 women and 10 men).
The research itself and the questionnaires have been approved by the Ethics Committee of the Medical University of Lodz (RNN/42/13/KE). Informed consent was obtained from all subjects involved in the study.
An interviewer-supervised auditory questionnaire was used to obtain information on the health status of the subjects. The questionnaire was distributed among the patients during their 2019-2020 hospitalisation at the Department of Dermatology and Venereology of Medical University of Lodz, and among the comparison subjects who came to the outpatient clinic for routine dermoscopic examinations.
Their individual gluten intake was assessed by means of one of the retrospective dietary assessment methods. The method of consumption frequency was applied, and the research tool was the researchers’ original questionnaire created on the basis of ‘Division of Food Products Based on Their Gluten Content’ proposed by the Polish Association of People with Coeliac Disease and on Gluten-Free Diets [9]. The respondents answered questions on how often they consumed the foods and dishes listed in the questionnaire.
Antibodies directed against smooth muscle endomysium, tissue transglutaminase and gliadin were detected in the patients and in the comparison group. The test material consisted of sera collected according to standard procedures. The tests were performed using ready-made kits according to the manufacturer's recommended test instructions. The concentration of the antibodies directed against smooth muscle endomysium was determined using a ready-to-use kit for in vitro testing of IgA autoantibodies against endomysium and gliadin in human serum [EUROPLUS Liver (Monkey)/Gliadin (GAF-3X)/Gut (Monkey) (IgA) (Euroimmun, Lübeck, Germany)]. The concentration of tissue transglutaminase antibodies was determined using ready-to-use in vitro tissue transglutaminase and gliadin (GAF-3X) autoantibody test kits in human serum or plasma [EUROLINE Profile Celiac IgA and EUROLINE Profile Celiac IgG] (Euroimmune, Lubeck, Germany).
In addition, blood allergy tests were performed in all the subjects in the study and control groups. An IgE inhalant allergy test and an IgE test for food allergies were performed by immunoblotting (Euroimmune, Lübeck, Germany).
Statistical analyses were carried out using the PQStat statistical package (version 1.8.2.238). The distribution of medical data scores and dichotomous survey responses were compared between the study groups using the chi^2 correlation test, with Fisher's exact test correction applied if the Cochran condition was not met. The distribution of individual food product consumption scores between the groups was compared using the Kruskal-Wallis test and the post-hoc Dunn's test with the Bonferroni correction. The cluster analysis was performed using the K-means and gradation methods, and the resulting clusters were contrasted with the groups in terms of diagnosis using the chi^2 correlation test. Statistical analyses were performed using the PQStat statistical package (version 1.8.2.230). A test probability of p<0.05 was considered significant, and a test probability of p<0.01 was considered highly significant.
3. Results
3.1. Clinical Characteristics of the Respondents
The majority of the respondents were female. However, there was no significant correlation between gender (Table 1) or age (Table 2) and diagnosis.
A highly significant correlation was found between the study groups and the occurrence of gastrointestinal complaints (Table 3).
3.2. Dietary Assessment
On the basis of the declared intake, it was shown that all the subjects consumed products which were sources of gluten on a daily basis. Statistically significant differences were noted regarding the frequency of consumption of some of the investigated food products.
The subjects with psoriasis declared the most frequent consumption of gluten-free bread. The patients with urticaria were significantly more likely to report using gluten-free flours. Patients with AD and psoriasis declared significantly less frequent consumption of gluten-free pasta compared to the control group. The control group declared significantly more frequent consumption of confectionery bread and cakes (Table 4).
Significant differences were found in the frequency of consumption of milk and several dairy products among the subjects (Table 5). The patients with psoriasis declared that they drank milk less frequently. The respondents with urticaria were significantly more likely to report that they did not eat yellow cheese. The patients in the study groups were significantly more likely to eat natural curds compared to the control group. Consumption of flavoured yoghurts and processed cheese in the AD and psoriasis groups was lower than in the healthy subjects.
The majority of the subjects declared meat consumption, but the control group reported significantly more frequent consumption of meat and prepared meats. Significant differences were also found between the groups regarding the use of coatings which were sources of gluten. The use of such coatings was more frequent in the control group than in the psoriasis and urticaria groups (Table 6).
No significant differences were found regarding the frequency of consumption of beer or the use of mustard, ketchup, ready-made sauces, seasoning mixes and stock cubes (Table 7).
Gradational analysis and cluster analysis were carried out. They mainly come in the form of a visual presentation of the results in graphs (Figure 1 and Figure 2). Due to the fact that there were many scales analysed and some had long names, they were coded in Table 8.
On the basis of the gradational analysis, 5 groups of products were distinguished (Table 9). These are clusters containing products consumed with similar frequency (correlated with each other). This means that if there are products in a cluster, they are consumed with similar frequency by the respondents.
At the same time, 4 groups/clusters of respondents were distinguished:
- The first one are those who consumed products from the first four groups relatively frequently and products from group 5 rarely.
- The second one were those who consumed products from group 1 less frequently, still ate products from groups 2, 3 and 4, but still rarely ate products from group 5.
- The third one are those who rarely consumed products from groups 1 and 2, but frequently consumed products from groups 3 and 4, and relatively more often ate products from group 5.
- The fourth one are those who rarely ate products from groups 1 and 2 (especially rarely from group 1), often ate products from groups 3 and 4, and most often of all the clusters ate products from group 5.
In addition, a highly significant (Chi^2=62.45, df=9, p<0.0001) correlation was found between the clusters of patients determined in the gradational analysis and the diagnosis (Table 10).
On the basis of the gradational analysis, it was found that the people with the skin diseases significantly less frequently eat the following highly processed products: confectionery, cakes, cheese-like products, dumplings, cold foods, flavoured yoghurts, ready-made sauces and hamburger, hot dog or casserole buns (fast food) (Table 11 and Figure 2).
A highly significant correlation was found between the clusters of patients determined by the K-means analysis and the diagnosis (Table 12). All the subjects in the patient groups surveyed declared:
- -
- less frequent use of mustard, ketchup, ready-made sauces, seasoning mixes, stock cubes, bread crumbs;
- -
- less frequent consumption of meat, ready-made cold cuts, offal products, cold foods and fish.
3.3. Laboratory Tests
Serum antibodies typical of gluten-dependent enteropathy, which include antibodies against tissue transglutaminase and against smooth muscle endomysium, and anti-gliadin antibodies were not found in the study and control groups.
Based on the allergy tests performed, there was no IgE-dependent allergy to wheat and rye flour in the study and control groups.
4. Discussion
Studies indicate that in Poland CD is diagnosed, on average, 7.3 years after the onset of the symptoms [10]. The ratio of diagnosed patients to undiagnosed patients varies from 1:2 to 1:20 depending on the country [11]. The disease can occur at any age, and currently the average age of diagnosis is around 45 years [12]. Some patients go undiagnosed for many years due to their atypical symptoms. These may include skin lesions [13].
Our study attempted to assess the prevalence of antibodies typical of gluten-dependent enteropathy in the patients with psoriasis, chronic urticaria and AD, and to diagnose the coexisting CD in the comparison group. In the study groups, a highly significant correlation was found between the occurrence of gastrointestinal complaints and the diagnosis of skin diseases in the study subjects. In order to interpret the serological result, it was necessary to assess the gluten intake in the patients' diet. If gluten exposure had been too short or a gluten-free diet had been used, the test result would not have been reliable [14].
Based on the declared frequency of consumption of selected foods, it was concluded that the respondents were not following a gluten-free diet at the time of the study. Their serum did not show the presence of antibodies typical of gluten-dependent enteropathy. The presence of CD could therefore be ruled out.
There are studies regarding patients with psoriasis that are consistent with our findings [15,16]. Nevertheless, certain findings which differ from ours have also been released, indicating a more frequent co-occurrence of psoriasis and CD, especially with the latent form [17,18].
The coexistence of CD and AD was not confirmed in our study group, which is consistent with the conclusion of Greco et al. [19]. However, there are reports in the scientific literature that contradict our findings [20,21], as well as those that confirm the influence of WA on the course of atopic eczema [22,23].
Some scientific literature data also indicate an increased incidence of chronic urticaria in patients diagnosed with CD [24,25]. A case of a woman with urticaria and WA has also been reported [26]. Still, our findings are consistent with the data obtained in an epidemiological study presented by Gabrielli et al. [27], who did not show an increased risk of CD in a population of adult patients with idiopathic chronic urticaria.
Taking into account the abovementioned studies and case reports indicating the co-occurrence of WA in patients with AD and chronic urticaria, additional allergy tests were performed in the study and control groups. No allergy to wheat and rye was found in any of the subjects.
The available research on the evaluation of eating habits among patients with psoriasis and AD confirm that patients make some dietary modifications to improve their skin condition. One of the most common changes made is gluten exclusion or restriction [28,29]. In our study group, it was noted that patients with AD, psoriasis and chronic urticaria used gluten-free products statistically more frequently than the comparison group, and less frequently consumed products that are or may be a source of gluten (including sliced meats, flavoured yoghurts) and highly processed foods. Nevertheless, in the study group, patients complained statistically more frequently about gastrointestinal symptoms so, after excluding CD and WA, this could suggest the presence of, for instance, NCGS. However, the diagnosis of this disease entity is very difficult mainly due to the lack of validated diagnostic criteria [30].
It is also worth noting that the scientific literature describes studies supporting the hypothesis that gluten and other wheat components may also cause irritable bowel syndrome (IBS) symptoms. The complaints described statistically more frequently by the patients involved in our study, such as abdominal pain, bloating, diarrhoea or constipation, could therefore be the result of this disorder [31]. Hill et al. [32] highlight that patients with IBS-like symptoms, in whom CD and WA have been ruled out, are defined as suffering from NCGS.
National Psoriasis Foundation recommendations advise against a gluten-free diet in patients, except for those with clinical or serological evidence of gluten sensitivity [33]. Also, guidelines for the management of AD do not recommend elimination diets in the absence of clinically significant food allergies [34]. The available data suggest that only patients with antibodies specific for gluten-dependent enteropathy or gluten intolerance may benefit from the use of a gluten-free diet. Such recommendations are confirmed by the study in question, in which no one was found to have CD or WA.
Despite many differences in the declared food intake between the study groups, it can be concluded that the patients did not follow gluten-free diets, which is important because an improperly balanced diet, once gluten cereal-based foods are excluded, may be associated with nutrient deficiencies. Traditional grains are rich sources of carbohydrates, dietary fibre, protein, minerals (zinc, selenium, iron) or B vitamins, while commonly available gluten-free products tend to be deficient in these and other components, so their deficiencies could exacerbate health problems [35].
5. Conclusions
In patients with autoimmune diseases who present with accompanying gastrointestinal symptoms, a comprehensive diagnostic evaluation for gluten-sensitive enteropathy and gluten intolerance is essential. It is important that individuals experiencing gastrointestinal complaints refrain from initiating a gluten-free diet without undergoing appropriate diagnostic procedures and consulting a physician. Patients with dermatologic conditions are more likely than the general population to independently alter their diet and restrict the intake of certain foods without adequate diagnostic confirmation of necessity. Therefore, further research involving large patient cohorts is required to definitively determine the relevance and therapeutic value of a gluten-free diet in inflammatory and autoimmune disorders in the absence of confirmed gluten-sensitive enteropathy. Additionally, providing education on evidence-based dietary recommendations to patients with skin diseases is strongly recommended.
Author Contributions
Conceptualization, K.R. and A.Ż.; methodology, K.R. and A.Ż.; formal analysis, K.R. and A.Ż., investigation, K.R., data curation, K.R., writing-original draft preparation, K.R.; writing-review and editing, M.K. and A.Ż.; supervision, A.Ż., project administration, K.R., M.K. and A.Ż.; funding acquisition, A.Ż. All authors have read and agreed to the published version of the manuscript.
Funding
This research was funded by the research projects of Medical University of Lodz - No 503/1-152-01/503-11-002 and Collegium Medicum, Mazovian University in Plock.
Institutional Review Board Statement
The study was conducted according to the guidelines of the Declaration of Helsinki. The research itself and the questionnaires have been approved by the Ethics Committee of the Medical University of Lodz (RNN/42/13/KE).
Informed Consent Statement
Informed consent was obtained from all subjects involved in the study.
Data Availability Statement
The datasets generated and/or analyzed during the present study are not publicly available due to privacy but are available from the corresponding author on reasonable request.
Conflicts of Interest
The authors declare no conflicts of interest.
References
- Jonsson, I.M.; Moller, G.L.; Paerregaard, A. Gluten free- diet is for some a neccessity, for others lifestyle. Ugeskr Laeger. 2017, 179, V09160636. [Google Scholar] [PubMed]
- Rymarczyk, B.; Glück, J.; Rogala, B. Częstość występowania celiakii u chorych z niecharakterystycznymi objawami sugerującymi nadwrażliwość pokarmową. Alerg Astma Immun. 2019, 24, 143–150. [Google Scholar]
- Husby, S.; Koletzko, S.; Korponay-Szabó, I.R.; et al. European Society for Pediatric Gastroenterology, Hepatology, and Nutrition guidelines for the diagnosis of coeliac disease. J Pediatr Gastroenterol Nutr. 2012, 54, 136–160. [Google Scholar] [CrossRef] [PubMed]
- Bai, J.C.; Ciacci, C. World Gastroenterology Organisation Global Guidelines on celiac disease. J Clin Gastroenterol. 2017, 51, 755–768. [Google Scholar] [CrossRef]
- Jiang, Y.; Jarr, K,; Layton, C.; et al. Therapeutic Implications of Diet in Inflammatory Bowel Disease and Related Immune-Mediated Inflammatory Diseases. Nutrients. 2021, 13, 890. [CrossRef]
- Nestle, F.O.; Kaplan, D.H.; Barker, J. Psoriasis . N Engl J Med. 2009, 361, 496–509. [Google Scholar] [CrossRef]
- Ständer, S. Atopic Dermatitis. N Engl J Med. 2021, 384, 1136–1143. [Google Scholar] [CrossRef]
- Zuberbier, T.; Latiff, A.H.A.; Abuzakouk, M.; et al. The international EAACI/GA²LEN/EuroGuiDerm/APAAACI guideline for the definition, classification, diagnosis, and management of urticaria. Allergy. 2022, 77, 734–766. [Google Scholar] [CrossRef]
- Konińska, G.; Marczewska, A.; Sobak-Huzior, P.; Źródlak M. Celiakia i dieta bezglutenowa. Praktyczny poradnik. Efekt s.j.: Warszawa, Poland, 2017, ISBN: 978-83-931335-5-0.
- Majsiak, E.; Choina, M,; Cukrowska, B.; et al. The impact of symptoms on quality of life before and after diagnosis of celiac disease: the results from a Polish population survey and comparison with the results from the United Kingdom. BMC Gastroenerol. 2021, 21, 99.
- Cukrowska, B.; Majsiak, E. Zróżnicowany obraz kliniczny celiakii u dzieci jako przyczyna trudności diagnostycznych. Alergia. 2018, 3, 37–40. [Google Scholar]
- Durazzo, M.; Ferro, A.; Brascugli, I.; et al. Extra-Intestinal Manifestations of Celiac Disease: What Should We Know in 2022? J Clin Med. 2022, 11, 258. [Google Scholar] [CrossRef] [PubMed]
- Jericho, H.; Sansotta, N.; Guandalini, S. Extraintestinal manifestations of celiac disease: effectiveness of the gluten-free diet. J Pediatr Gastroenterol Nutrition. 2017, 65, 75–79. [Google Scholar] [CrossRef] [PubMed]
- Bierła, J.B.; Trojanowska, I.; Konopka, E.; et al. Diagnostyka celiakii i badania przesiewowe w grupach ryzyka. Diagn Lab. 2016, 52, 205–210. [Google Scholar]
- Sultan, S.J.; Ahmad, Q.M.; Sultan, S.T. Antigliadin antibodies in psoriasis. Australas J Dermatol. 2010, 51, 238–242. [Google Scholar] [CrossRef]
- Zamani, F.; Alizadeh, S.; Amiri, A.; et al. Psoriasis and coeliac disease: is there any relationship? Acta Derm Venereol. 2010, 90, 295–296. [Google Scholar] [CrossRef]
- Ungprasert, P.; Wijarnpreecha, K.; Kittanamongkolchai, W. Psoriasis and Risk of Celiac Disease: A Systematic Review and Meta-analysis. Indian J Dermatol. 2017, 62, 41–46. [Google Scholar] [CrossRef]
- Acharya, P.; Mathur, M. ; Association between psoriasis and celiac disease: A systematic review and meta-analysis. J Am Acad Dermatol. 2020, 82, 1376–1385. [Google Scholar] [CrossRef]
- Greco, L.; de Seta, L.; D'Adamo, G.; et al. Atopy and coeliac disease:bias or true relation? Acta Paediatr Scand. 1990, 79, 670–674. [Google Scholar] [CrossRef]
- Ivert, L.U.; Wahlgren, C.F.; Lindelöf, B.; et al. Association between atopic dermatitis and autoimmune diseases: a population-based case–control study. Br J Dermatol. 2021, 185, 335–342. [Google Scholar] [CrossRef]
- Kauppi, S.; Jokelainen, J.; Timonen, M.; et al. Atopic Dermatitis Is Associated with Dermatitis Herpetiformis and Celiac Disease in Children. J Invest Dermatol. 2021, 141, 191–193. [Google Scholar] [CrossRef]
- Varjonena, E,; Vainio, E.; Kalimo, K. Antigliadin IgE – indicator of wheat allergy in atopic dermatitis. Allergy. 2008, 55, 386–391.
- Čelakovskáa, J.; Ettlerováb, K.; Ettlera, K.; et al. The Effect of Wheat Allergy on the Course of Atopic Eczema in Patients over 14 Years of Age. Acta Medica. 2011, 54, 157–162. [Google Scholar] [CrossRef]
- Ludvigsson, J.F.; Lindelof, B.; Rashtak, S.; et al. Does urticaria risk increase in patients with celiac disease? A large population-based cohort study. Eur J Dermatol. 2013, 23, 681–687. [Google Scholar] [CrossRef]
- Confino-Cohen, R.; Chodick, G.; Shalev, V.; et al. Chronic urticaria and autoimmunity: Associations found in a large population study. J Allergy Clin Immunol. 2012, 129, 1307–1313. [Google Scholar] [CrossRef]
- Mingomataj, E.C.; Gjata, E.; Bekiri, A.; et al. Gliadin allergy manifested with chronic urticaria, headache and amonorrhea. BMJ Case Rep. 2011, 5, bcr1020114907. [Google Scholar] [CrossRef]
- Gabrielli, M.; Candelli, M.; Cremonini, F.; et al. Idiopathic chronic urticaria and celiac disease. Dig Dis Sci. 2005, 50, 1702–1704. [Google Scholar] [CrossRef]
- Afifi, L.; Danesh, M.J.; Lee, K.M.; et al. Dietary Behaviors in Psoriasis: Patient-Reported Outcomes from a U. S. National Survey. Dermatol Ther (Heidelb). 2017, 7, 227–242. [Google Scholar] [CrossRef]
- Nosrati, A.; Afifi, L.; Danesh, M.J.; et al. Dietary modifications in atopic dermatitis: patient-reported outcomes. JDermatol Treat. 2017, 28, 523–538. [Google Scholar] [CrossRef]
- Reese, I,; Schäfer, C.; Kleine-Tebbe, J.; et al. Non-celiac gluten/wheat sensitivity (NCGS)—a currently undefined disorder without validated diagnostic criteria and of unknown prevalence. Allergo J Int. 2018, 27, 147–151. [CrossRef]
- Catassi, C.; Alaedini, A.; Bojarski, C.; et al. The Overlapping Area of Non-Celiac Gluten Sensitivity (NCGS) and Wheat-Sensitive Irritable Bowel Syndrome (IBS): An Update. Nutrients. 2017, 9, 1268. [Google Scholar] [CrossRef]
- Hill, P.; Muir, J.G.; Gibson, P.R. Controversies and Recent Developments of the Low-FODMAP Diet. Gastroenterol Hepatol (NY). 2017, 13, 36–45. [Google Scholar]
- Ford, A.R.; Siegel, M,; Bagel, J.; et al. Dietary Recommendations for Adults With Psoriasis or Psoriatic Arthritis From the Medical Board of the National Psoriasis Foundation: A Systematic Review. JAMA dermatol. 2018, 154, 934–950. [CrossRef] [PubMed]
- Sidbury, R.; Tom, W.L.; Bergman, J.N.; et al. Guidelines of care for the management of atopic dermatitis: Section 4. Prevention of disease flares and use of adjunctive therapies and approaches. J Am Acad Dermatol. 2014, 71, 1218–1233. [Google Scholar] [CrossRef]
- Wild, D.; Robins, G.G.; Burley, V.J.; Howdle, P.D. ; Evidence of high sugar intake, and low fibre and mineral intake, in the gluten-free diet. Aliment Pharmacol Ther. 2010, 32, 573–558. [Google Scholar] [CrossRef]
Figure 1.
Distribution of results after gradational analysis with distinguished clusters.
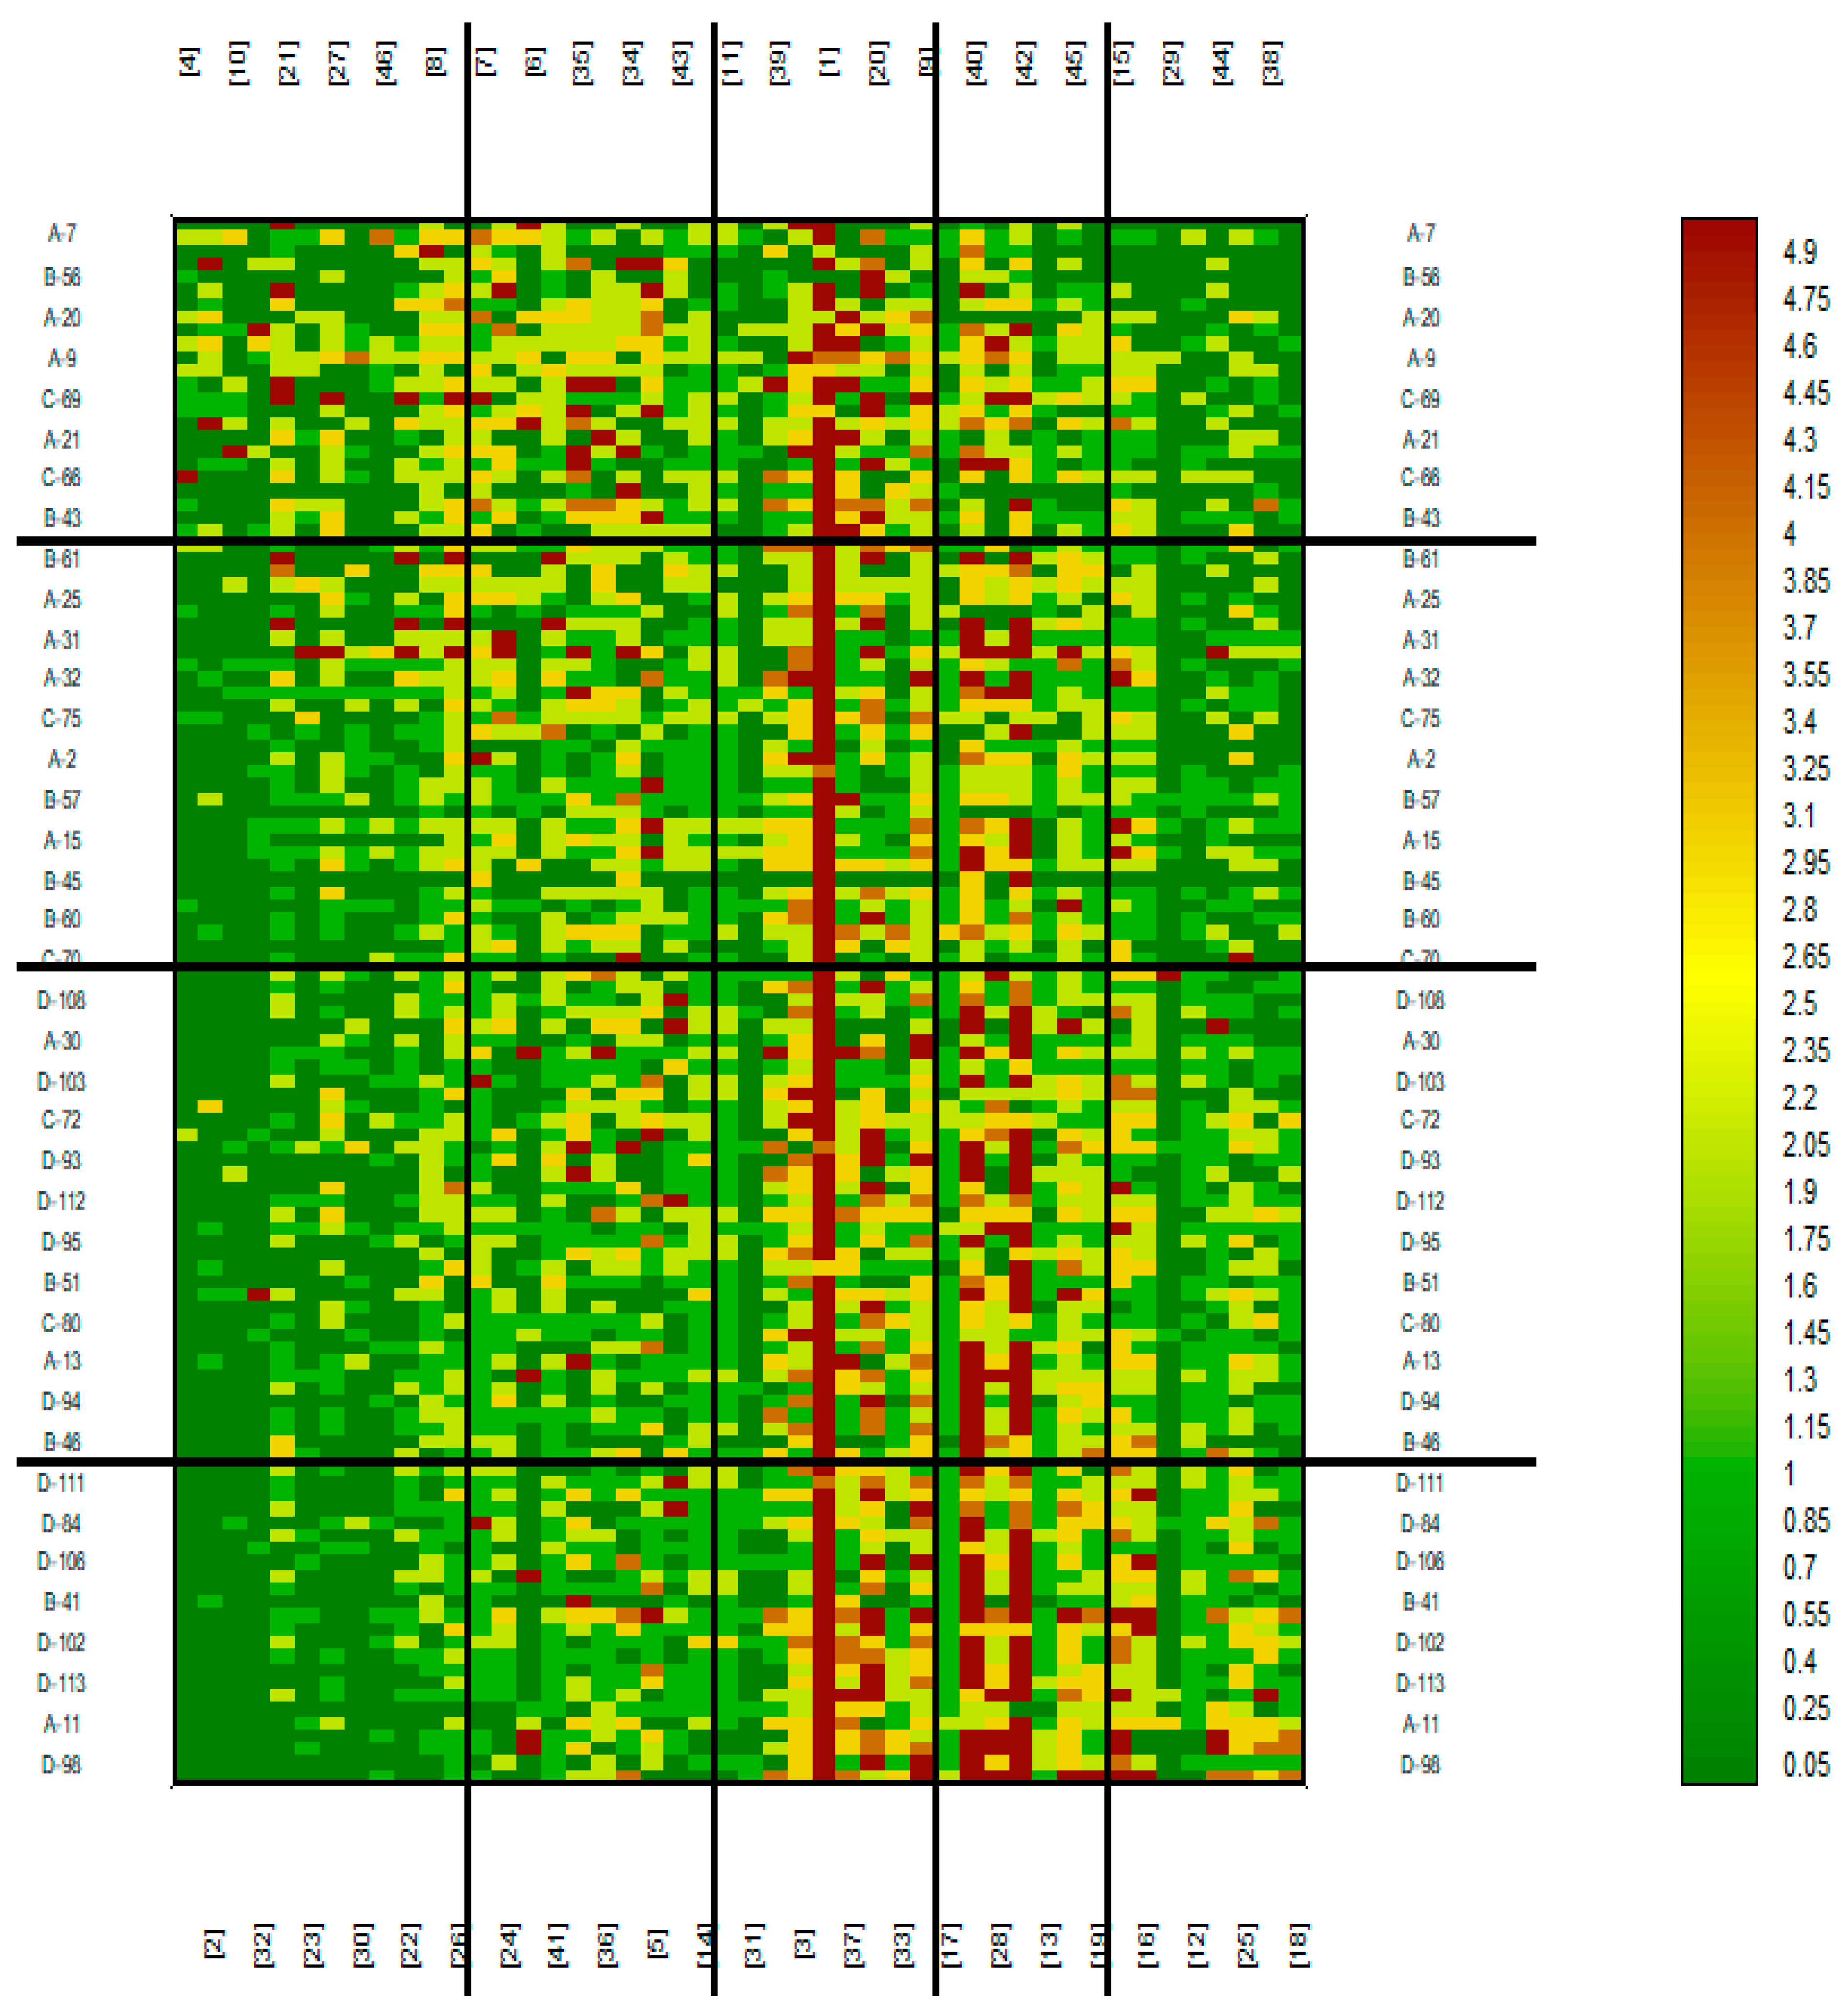
Figure 2.
Consumption of food products in the four clusters of respondents determined by the K-means method.
Figure 2.
Consumption of food products in the four clusters of respondents determined by the K-means method.
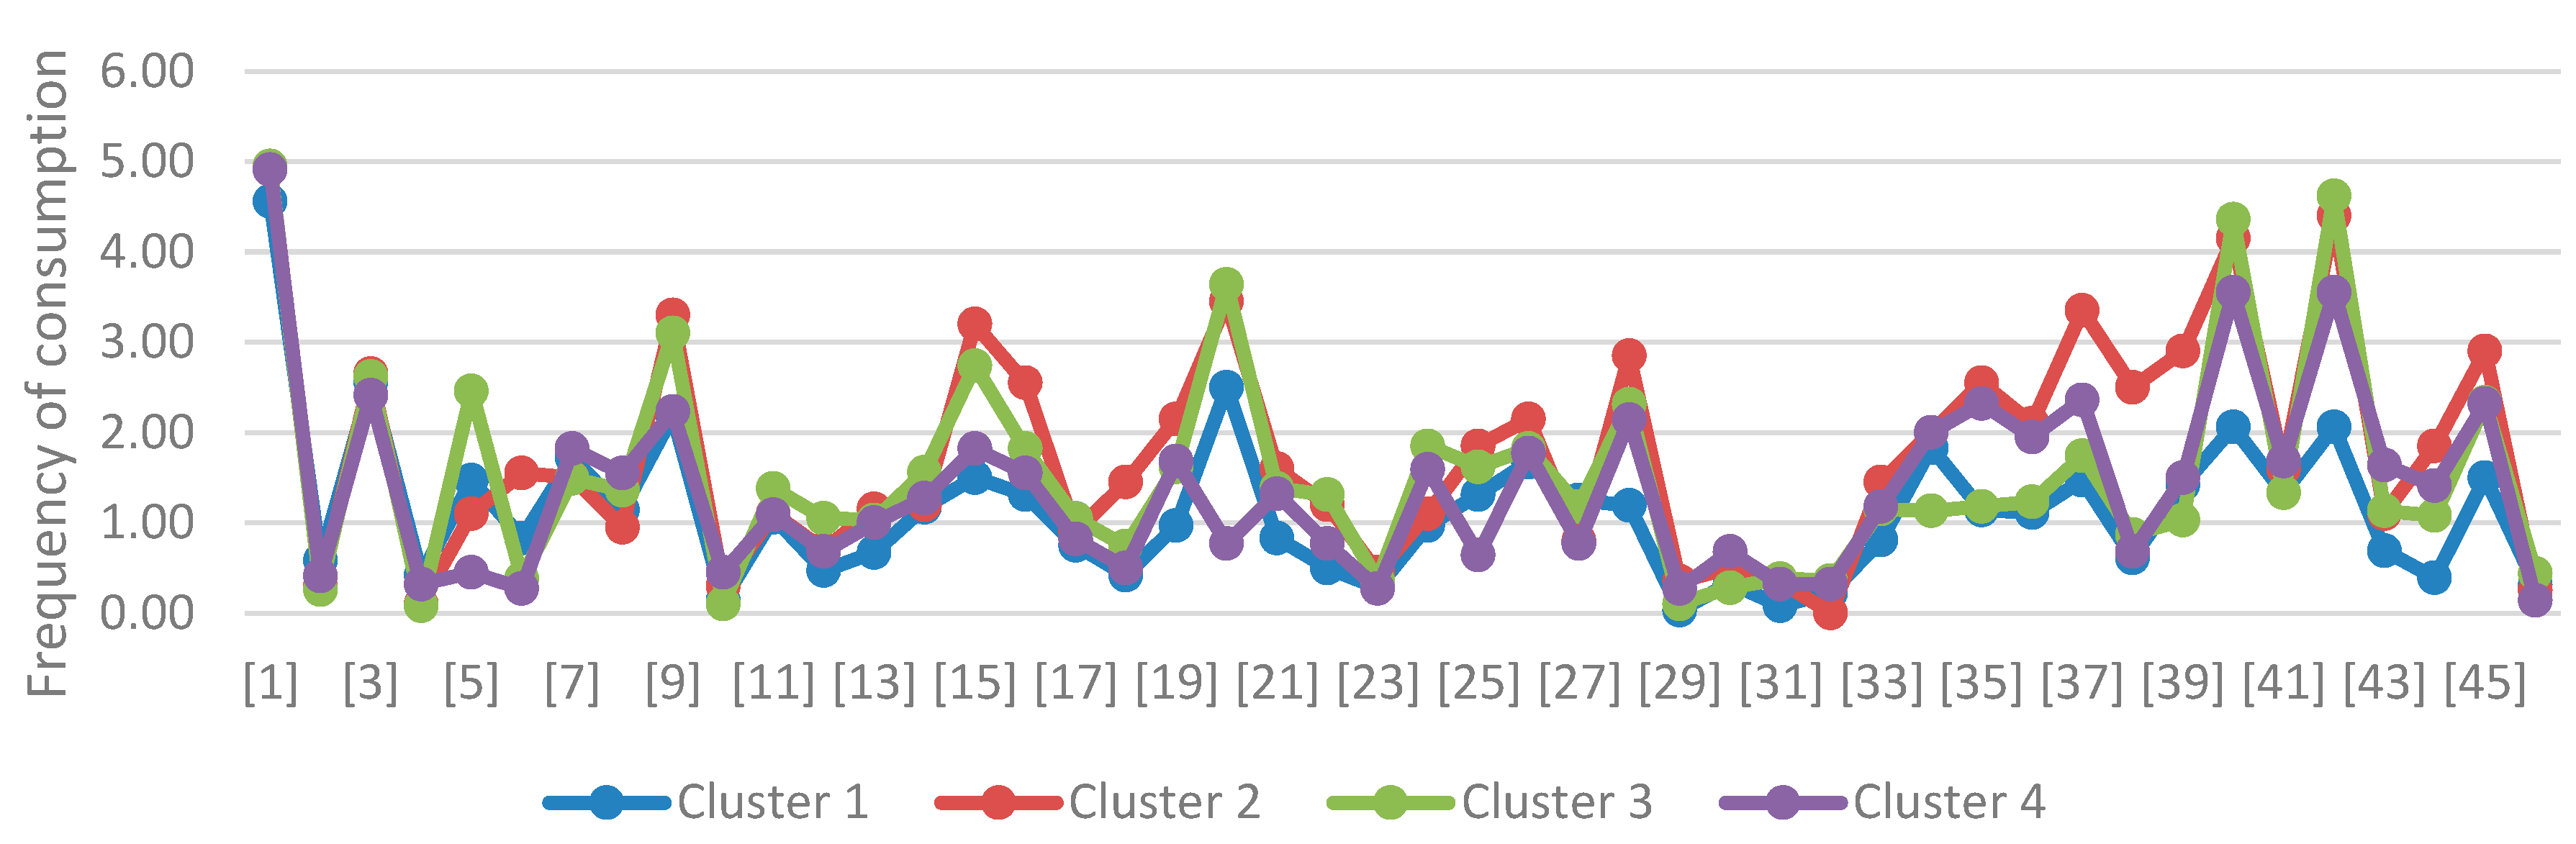

Table 1.
Gender in the study groups.
| Gender | Diagnosis | |||||||
| Control | AD | Psoriasis | Urticaria | |||||
| N | % | N | % | N | % | N | % | |
| Famale | 25 | 71,43% | 18 | 69,23% | 20 | 57,14% | 18 | 85,71% |
| Male | 10 | 28,57% | 8 | 30,77% | 15 | 42,86% | 3 | 14,29% |
| chi^2 correlation test | Chi^=5,16, df=3, p=0,1605 | |||||||
Table 2.
Age in the study groups.
| Age | Diagnosis | |||||||
| Control | AD | Psoriasis | Urticaria | |||||
| N | % | N | % | N | % | N | % | |
| <18 | 1 | 2,86% | 0 | 0% | 3 | 8,57% | 0 | 0% |
| 18-30 | 6 | 17,14% | 11 | 42,31% | 7 | 20% | 3 | 14,29% |
| 31-40 | 6 | 17,14% | 6 | 23,08% | 11 | 31,43% | 8 | 38,1% |
| 41-50 | 13 | 37,14% | 3 | 11,54% | 2 | 5,71% | 6 | 28,57% |
| >50 | 9 | 25,71% | 6 | 23,08% | 12 | 34,29% | 4 | 19,05% |
| Fisher's exact test | p=0,1199 | |||||||
Table 3.
Gastrointestinal complaints in the surveyed groups (results with statistical significance are marked in red).
Table 3.
Gastrointestinal complaints in the surveyed groups (results with statistical significance are marked in red).
| Do you suffer from digestive complaints? | Diagnosis | ||||||||
| Control | AD | Psoriasis | Urticaria | ||||||
| N | % | N | % | N | % | N | % | ||
| No | 35 | 100% | 12 | 46,15% | 23 | 65,71% | 18 | 85,71% | |
| Yes | 0 | 0% | 14 | 53,85% | 12 | 34,29% | 3 | 14,29% | |
| chi^2 correlation test | Chi^=2625, df=3, p<0,0001 | ||||||||
Table 4.
Results of cereal product consumption (results with statistical significance are marked in red).
Table 4.
Results of cereal product consumption (results with statistical significance are marked in red).
| Food Product | Diagnosis | Arithmetic Mean | Median | Standard Deviation | Minimum | Maximum | Lower Quartile | Upper Quartile |
Kruskal-Wallis Test |
Homogenous Groups | POST-HOC (Dunn Bonferroni) | |||
| Control | AD | Psoriasis | Urticaria | |||||||||||
| Bread with gluten | Control | 4,9 | 5,0 | 0,4 | 3,0 | 5,0 | 5,0 | 5,0 |
H=2,6320 p=0,4519 |
a | 1 | 1 | 1 | |
| AD | 4,8 | 5,0 | 1,0 | 0,0 | 5,0 | 5,0 | 5,0 | a | 1 | 0,9327 | 1 | |||
| Psoriasis | 4,7 | 5,0 | 0,8 | 2,0 | 5,0 | 5,0 | 5,0 | a | 1 | 0,9327 | 1 | |||
| Urticaria | 5,0 | 5,0 | 0,2 | 4,0 | 5,0 | 5,0 | 5,0 | a | 1 | 1 | 1 | |||
| Bread without gluten | Control | 0,0 | 0,0 | 0,2 | 0,0 | 1,0 | 0,0 | 0,0 | H=15,2366 p=0,0016 |
a | 0,9183 | 0,0007 | 0,3383 | |
| AD | 0,2 | 0,0 | 0,5 | 0,0 | 2,0 | 0,0 | 0,0 | ab | 0,9183 | 0,1943 | 1 | |||
| Psoriasis | 0,8 | 0,0 | 1,2 | 0,0 | 5,0 | 0,0 | 1,0 | b | 0,0007 | 0,1943 | 0,9008 | |||
| Urticaria | 0,5 | 0,0 | 1,2 | 0,0 | 5,0 | 0,0 | 0,0 | ab | 0,3383 | 1 | 0,9008 | |||
| Flour with gluten | Control | 2,5 | 3,0 | 1,1 | 0,0 | 4,0 | 2,0 | 3,0 | H=2,2119 p=0,5296 |
a | 1 | 1 | 1 | |
| AD | 2,4 | 2,0 | 1,4 | 0,0 | 5,0 | 1,0 | 3,8 | a | 1 | 1 | 1 | |||
| Psoriasis | 2,5 | 2,0 | 1,2 | 0,0 | 5,0 | 2,0 | 3,0 | a | 1 | 1 | 1 | |||
| Urticaria | 2,9 | 3,0 | 1,3 | 0,0 | 5,0 | 2,0 | 4,0 | a | 1 | 1 | 1 | |||
| Flour without gluten | Control | 0,0 | 0,0 | 0,0 | 0,0 | 0,0 | 0,0 | 0,0 | H=15,0883 p=0,0017 |
a | 0,6175 | 0,5118 | 0,0006 | |
| AD | 0,2 | 0,0 | 0,5 | 0,0 | 2,0 | 0,0 | 0,0 | ab | 0,6175 | 1 | 0,1608 | |||
| Psoriasis | 0,2 | 0,0 | 0,6 | 0,0 | 2,0 | 0,0 | 0,0 | ab | 0,5118 | 1 | 0,1002 | |||
| Urticaria | 0,7 | 0,0 | 1,2 | 0,0 | 5,0 | 0,0 | 1,0 | b | 0,0006 | 0,1608 | 0,1002 | |||
| Flakes with gluten | Control | 1,9 | 2,0 | 1,4 | 0,0 | 5,0 | 1,0 | 3,0 | H=9,7805 p=0,0205 |
b | 0,0336 | 0,2832 | 1 | |
| AD | 1,0 | 0,0 | 1,5 | 0,0 | 5,0 | 0,0 | 1,8 | a | 0,0336 | 1 | 0,1711 | |||
| Psoriasis | 1,4 | 1,0 | 1,8 | 0,0 | 5,0 | 0,0 | 2,5 | ab | 0,2832 | 1 | 0,8849 | |||
| Urticaria | 1,8 | 2,0 | 1,5 | 0,0 | 5,0 | 1,0 | 2,0 | ab | 1 | 0,1711 | 0,8849 | |||
| Flakes without gluten | Control | 0,8 | 0,0 | 1,8 | 0,0 | 5,0 | 0,0 | 0,0 | H=3,1238 p=0,3729 |
a | 1 | 1 | 1 | |
| AD | 0,3 | 0,0 | 0,7 | 0,0 | 2,0 | 0,0 | 0,0 | a | 1 | 0,8968 | 1 | |||
| Psoriasis | 0,9 | 0,0 | 1,5 | 0,0 | 5,0 | 0,0 | 2,0 | a | 1 | 0,8968 | 1 | |||
| Urticaria | 0,6 | 0,0 | 0,8 | 0,0 | 3,0 | 0,0 | 1,0 | a | 1 | 1 | 1 | |||
| Groats with gluten | Control | 1,4 | 1,0 | 1,1 | 0,0 | 5,0 | 1,0 | 1,0 | H=6,1787 p=0,1032 |
a | 1 | 0,195 | 0,2318 | |
| AD | 1,5 | 1,0 | 0,8 | 0,0 | 3,0 | 1,0 | 2,0 | a | 1 | 1 | 1 | |||
| Psoriasis | 1,7 | 2,0 | 1,1 | 0,0 | 5,0 | 1,0 | 2,0 | a | 0,195 | 1 | 1 | |||
| Urticaria | 2,0 | 1,0 | 1,2 | 1,0 | 5,0 | 1,0 | 3,0 | a | 0,2318 | 1 | 1 | |||
| Groats without gluten | Control | 0,9 | 1,0 | 0,8 | 0,0 | 2,0 | 0,0 | 2,0 | H=5,4126 p=0,144 |
a | 0,5708 | 0,1917 | 0,7769 | |
| AD | 1,3 | 1,0 | 0,8 | 0,0 | 3,0 | 1,0 | 2,0 | a | 0,5708 | 1 | 1 | |||
| Psoriasis | 1,5 | 2,0 | 1,2 | 0,0 | 5,0 | 0,0 | 2,0 | a | 0,1917 | 1 | 1 | |||
| Urticaria | 1,3 | 1,0 | 0,7 | 0,0 | 3,0 | 1,0 | 2,0 | a | 0,7769 | 1 | 1 | |||
| Pasta with gluten | Control | 3,4 | 3,0 | 1,2 | 1,0 | 5,0 | 3,0 | 4,0 | H=21,3519 p=0,0001 |
b | 0,0001 | 0,0072 | 0,3421 | |
| AD | 2,0 | 2,0 | 0,8 | 0,0 | 3,0 | 2,0 | 2,8 | a | 0,0001 | 0,9383 | 0,2146 | |||
| Psoriasis | 2,5 | 2,0 | 1,0 | 1,0 | 5,0 | 2,0 | 3,0 4,0 |
a | 0,0072 | 0,9383 | 1 | |||
| Urticaria | 2,8 | 2,0 | 1,0 | 1,0 | 5,0 | 2,0 | ab | 0,3421 | 0,2146 | 1 | ||||
| Pasta without gluten | Control | 0,1 | 0,0 | 0,2 | 0,0 | 1,0 | 0,0 | 0,0 | H=3,6768 p=0,2985 |
a | 0,6989 | 1 | 0,6777 | |
| AD | 0,3 | 0,0 | 0,6 | 0,0 | 2,0 | 0,0 | 0,0 | a | 0,6989 | 1 | 1 | |||
| Psoriasis | 0,1 | 0,0 | 0,4 | 0,0 | 2,0 | 0,0 | 0,0 | a | 1 | 1 | 1 | |||
| Urticaria | 0,5 | 0,0 | 1,3 | 0,0 | 5,0 | 0,0 | 0,0 | a | 0,6777 | 1 | 1 | |||
| Dumplings (Pierogi) | Control | 1,3 | 1,0 | 0,7 | 0,0 | 3,0 | 1,0 | 2,0 | H=4,2366 p=0,237 |
a | 0,7257 | 1 | 1 | |
| AD | 1,0 | 1,0 | 0,6 | 0,0 | 2,0 | 1,0 | 1,0 | a | 0,7257 | 1 | 0,3367 | |||
| Psoriasis | 1,1 | 1,0 | 0,6 | 0,0 | 2,0 | 1,0 | 1,5 | a | 1 | 1 | 1 | |||
| Urticaria | 1,3 | 1,0 | 0,6 | 0,0 | 2,0 | 1,0 | 2,0 | a | 1 | 0,3367 | 1 | |||
| Dumplings (Pyzy) | Control | 1,2 | 1,0 | 0,6 | 0,0 | 2,0 | 1,0 | 2,0 | H=28,3973 p<0,0001 |
b | 0,0177 | <0,0001 | 0,1206 | |
| AD | 0,7 | 1,0 | 0,6 | 0,0 | 2,0 | 0,0 | 1,0 | a | 0,0177 | 0,3325 | 1 | |||
| Psoriasis | 0,3 | 0,0 | 0,5 | 0,0 | 1,0 | 0,0 | 1,0 | a | <0,0001 | 0,3325 | 0,1427 | |||
| Urticaria | 0,8 | 1,0 | 0,7 | 0,0 | 2,0 | 0,0 | 1,0 | ab | 0,1206 | 1 | 0,1427 | |||
| Dumplings (Kopytka) | Control | 1,2 | 1,0 | 0,5 | 0,0 | 2,0 | 1,0 | 2,0 | H=20,6354 p=0,0001 |
b | 0,6409 | 0,0001 | 1 | |
| AD | 1,0 | 1,0 | 0,7 | 0,0 | 2,0 | 0,3 | 1,0 | ab | 0,6409 | 0,0813 | 1 | |||
| Psoriasis | 0,5 | 1,0 | 0,6 | 0,0 | 2,0 | 0,0 | 1,0 | a | 0,0001 | 0,0813 | 0,0278 | |||
| Urticaria | 1,0 | 1,0 | 0,6 | 0,0 | 2,0 | 1,0 | 1,0 | b | 1 | 1 | 0,0278 | |||
| Pancakes | Control | 1,3 | 1,0 | 0,7 | 0,0 | 3,0 | 1,0 | 2,0 | H=1,9833 p=0,5759 |
a | 1 | 1 | 1 | |
| AD | 1,2 | 1,0 | 0,7 | 0,0 | 3,0 | 1,0 | 2,0 | a | 1 | 1 | 1 | |||
| Psoriasis | 1,4 | 1,0 | 0,6 | 0,0 | 2,0 | 1,0 | 2,0 | a | 1 | 1 | 1 | |||
| Urticaria | 1,3 | 1,0 | 0,6 | 0,0 | 2,0 | 1,0 | 2,0 | a | 1 | 1 | 1 | |||
| Confectionery | Control | 3,0 | 3,0 | 1,1 | 1,0 | 5,0 | 2,0 | 4,0 | H=14,5824 p=0,0022 |
b | 0,0092 | 0,0134 | 0,0333 | |
| AD | 1,8 | 2,0 | 1,3 | 0,0 | 5,0 | 1,0 | 3,0 | a | 0,0092 | 1 | 1 | |||
| Psoriasis | 2,0 | 2,0 | 1,3 | 0,0 | 5,0 | 1,0 | 3,0 | a | 0,0134 | 1 | 1 | |||
| Urticaria | 2,0 | 1,0 | 1,5 | 0,0 | 5,0 | 1,0 | 3,0 | a | 0,0333 | 1 | 1 | |||
| Cakes |
Control | 2,3 | 2,0 | 1,3 | 0,0 | 5,0 | 2,0 | 2,5 | H=11,17 p=0,0108 |
b | 0,0262 | 0,0533 | 0,1048 | |
| AD | 1,4 | 1,0 | 1,0 | 0,0 | 4,0 | 1,0 | 2,0 | a | 0,0262 | 1 | 1 | |||
| Psoriasis | 1,5 | 2,0 | 1,0 | 0,0 | 3,0 | 1,0 | 2,0 | ab | 0,0533 | 1 | 1 | |||
| Urticaria | 1,6 | 1,0 | 1,0 | 0,0 | 4,0 | 1,0 | 2,0 | ab | 0,1048 | 1 | 1 | |||
| Pizza | Control | 1,0 | 1,0 | 0,2 | 0,0 | 2,0 | 1,0 | 1,0 | H=4,8097 p=0,1863 |
a | 0,1733 | 1 | 1 | |
| AD | 0,7 | 1,0 | 0,5 | 0,0 | 2,0 | 0,0 | 1,0 | a | 0,1733 | 1 | 1 | |||
| Psoriasis | 0,9 | 1,0 | 0,8 | 0,0 | 3,0 | 0,0 | 1,0 | a | 1 | 1 | 1 | |||
| Urticaria | 0,9 | 1,0 | 0,6 | 0,0 | 2,0 | 1,0 | 1,0 | a | 1 | 1 | 1 | |||
| Hamburger buns/hotdogs/sausage rolls | Control | 1,1 | 1,0 | 1,2 | 0,0 | 4,0 | 0,5 | 1,0 | H=10,5797 p=0,0142 |
b | 0,8958 | 0,0076 | 0,4619 | |
| AD | 0,7 | 1,0 | 0,6 | 0,0 | 2,0 | 0,0 | 1,0 | ab | 0,8958 | 0,7516 | 1 | |||
| Psoriasis | 0,4 | 0,0 | 0,7 | 0,0 | 2,0 | 0,0 | 1,0 | a | 0,0076 | 0,7516 | 1 | |||
| Urticaria | 0,6 | 1,0 | 0,7 | 0,0 | 3,0 | 0,0 | 1,0 | ab | 0,4619 | 1 | 1 | |||
Table 5.
Results of dairy product consumption (results with statistical significance are marked in red).
Table 5.
Results of dairy product consumption (results with statistical significance are marked in red).
| Food Product | Diagnosis | Arithmetic Mean | Median | Standard Deviation | Minimum | Maximum | Lower Quartile | Upper Quartile |
Kruskal-Wallis Test |
Homogenous Groups | POST-HOC (Dunn Bonferroni) | |||
| Control | AD | Psoriasis | Urticaria | |||||||||||
| Milk | Control | 3,6 | 4,0 | 1,3 | 1,0 | 5,0 | 3,0 | 5,0 | H=12,7773 p=0,0051 |
b | 0,107 | 0,0032 | 0,7123 | |
| AD | 2,4 | 2,0 | 2,2 | 0,0 | 5,0 | 0,0 | 5,0 | ab | 0,107 | 1 | 1 | |||
| Psoriasis | 2,1 | 2,0 | 1,6 | 0,0 | 5,0 | 0,5 | 3,0 | a | 0,0032 | 1 | 0,8996 | |||
| Urticaria | 2,8 | 4,0 | 1,8 | 0,0 | 5,0 | 1,0 | 4,0 | ab | 0,7123 | 1 | 0,8996 | |||
| Kefir (kind of buttermilk) |
Control | 1,0 | 1,0 | 0,9 | 0,0 | 3,0 | 0,0 | 2,0 | H=3,2058 p=0,361 |
a | 1 | 1 | 1 | |
| AD | 1,0 | 0,0 | 1,3 | 0,0 | 5,0 | 0,0 | 2,0 | a | 1 | 0,5065 | 1 | |||
| Psoriasis | 1,5 | 1,0 | 1,5 | 0,0 | 5,0 | 0,0 | 2,0 | a | 1 | 0,5065 | 1 | |||
| Urticaria | 1,4 | 1,0 | 1,5 | 0,0 | 5,0 | 1,0 | 1,0 | a | 1 | 1 | 1 | |||
| Buttermilk |
Control | 1,0 | 1,0 | 0,8 | 0,0 | 2,0 | 0,0 | 2,0 | H=1,8665 p=0,6006 |
a | 1 | 1 | 1 | |
| AD | 1,0 | 0,0 | 1,5 | 0,0 | 5,0 | 0,0 | 1,8 | a | 1 | 1 | 1 | |||
| Psoriasis | 0,9 | 1,0 | 1,2 | 0,0 | 5,0 | 0,0 | 1,5 | a | 1 | 1 | 1 | |||
| Urticaria | 0,9 | 1,0 | 1,2 | 0,0 | 5,0 | 0,0 | 1,0 | a | 1 | 1 | 1 | |||
| Flavoured kefir | Control | 0,3 | 0,0 | 0,5 | 0,0 | 2,0 | 0,0 | 0,5 | H=0,2531 p=0,9686 |
a | 1 | 1 | 1 | |
| AD | 0,4 | 0,0 | 1,1 | 0,0 | 5,0 | 0,0 | 0,0 | a | 1 | 1 | 1 | |||
| Psoriasis | 0,3 | 0,0 | 0,6 | 0,0 | 2,0 | 0,0 | 0,0 | a | 1 | 1 | 1 | |||
| Urticaria | 0,3 | 0,0 | 0,8 | 0,0 | 3,0 | 0,0 | 0,0 | a | 1 | 1 | 1 | |||
| Yoghurt | Control | 1,3 | 1,0 | 0,9 | 0,0 | 3,0 | 1,0 | 2,0 | H=0,8434 p=0,8391 |
a | 1 | 1 | 1 | |
| AD | 1,5 | 1,5 | 1,3 | 0,0 | 5,0 | 0,0 | 2,0 | a | 1 | 1 | 1 | |||
| Psoriasis | 1,5 | 1,0 | 1,5 | 0,0 | 5,0 | 0,0 | 2,0 | a | 1 | 1 | 1 | |||
| Urticaria | 1,2 | 1,0 | 1,2 | 0,0 | 4,0 | 0,0 | 2,0 | a | 1 | 1 | 1 | |||
| Flavoured yoghurt | Control | 2,0 | 2,0 | 1,0 | 0,0 | 4,0 | 1,0 | 3,0 | H=17,8345 p=0,0005 |
b | 0,0003 | 0,0197 | 0,1875 | |
| AD | 0,8 | 0,0 | 1,1 | 0,0 | 3,0 | 0,0 | 1,0 | a | 0,0003 | 1 | 0,7444 | |||
| Psoriasis | 1,2 | 1,0 | 1,1 | 0,0 | 3,0 | 0,0 | 2,0 | a | 0,0197 | 1 | 1 | |||
| Urticaria | 1,4 | 2,0 | 1,4 | 0,0 | 5,0 | 0,0 | 2,0 | ab | 0,1875 | 0,7444 | 1 | |||
| Cottage cheese (twaróg) | Control | 1,5 | 1,0 | 0,7 | 1,0 | 3,0 | 1,0 | 2,0 | H=15,9367 p=0,0012 |
a | 1 | 0,2151 | 0,0011 | |
| AD | 1,6 | 2,0 | 1,6 | 0,0 | 5,0 | 0,0 | 2,0 | a | 1 | 0,9932 | 0,0147 | |||
| Psoriasis | 1,9 | 2,0 | 1,1 | 0,0 | 5,0 | 1,5 | 3,0 | ab | 0,2151 | 0,9932 | 0,3289 | |||
| Urticaria | 2,5 | 3,0 | 1,0 | 0,0 | 5,0 | 2,0 | 3,0 | b | 0,0011 | 0,0147 | 0,3289 | |||
| Cottage cheese (twarożki) | Control | 0,4 | 0,0 | 0,6 | 0,0 | 2,0 | 0,0 | 1,0 | H=18,4001 p=0,0004 |
a | 0,3163 | 0,0041 | 0,0008 | |
| AD | 1,0 | 1,0 | 1,2 | 0,0 | 5,0 | 0,0 | 2,0 | ab | 0,3163 | 1 | 0,3564 | |||
| Psoriasis | 1,3 | 2,0 | 1,2 | 0,0 | 3,0 | 0,0 | 2,0 | b | 0,0041 | 1 | 1 | |||
| Urticaria | 1,7 | 2,0 | 1,4 | 0,0 | 5,0 | 0,0 | 3,0 | b | 0,0008 | 0,3564 | 1 | |||
| Yellow cheese | Control | 2,3 | 2,0 | 1,3 | 0,0 | 5,0 | 2,0 | 3,0 | H=7,0665 p=0,0698 |
a | 1 | 1 | 0,055 | |
| AD | 2,2 | 2,0 | 1,8 | 0,0 | 5,0 | 0,3 | 3,0 | a | 1 | 1 | 0,3477 | |||
| Psoriasis | 2,1 | 2,0 | 1,5 | 0,0 | 5,0 | 1,0 | 3,0 | a | 1 | 1 | 0,3057 | |||
| Urticaria | 1,3 | 1,0 | 1,4 | 0,0 | 5,0 | 0,0 | 2,0 | a | 0,055 | 0,3477 | 0,3057 | |||
| Cheese-based products | Control | 0,1 | 0,0 | 0,2 | 0,0 | 1,0 | 0,0 | 0,0 | H=2,4358 p=0,487 |
a | 1 | 1 | 1 | |
| AD | 0,3 | 0,0 | 1,1 | 0,0 | 5,0 | 0,0 | 0,0 | a | 1 | 1 | 1 | |||
| Psoriasis | 0,2 | 0,0 | 0,6 | 0,0 | 3,0 | 0,0 | 0,0 | a | 1 | 1 | 1 | |||
| Urticaria | 0,0 | 0,0 | 0,2 | 0,0 | 1,0 | 0,0 | 0,0 | a | 1 | 1 | 1 | |||
| Processed cheese | Control | 0,1 | 0,0 | 0,6 | 0,0 | 3,0 | 0,0 | 0,0 | H=15,2738 p=0,0016 |
a | 0,0217 | 0,0023 | 1 | |
| AD | 0,5 | 0,0 | 0,7 | 0,0 | 2,0 | 0,0 | 1,0 | b | 0,0217 | 1 | 0,8422 | |||
| Psoriasis | 0,7 | 0,0 | 1,0 | 0,0 | 4,0 | 0,0 | 1,0 | b | 0,0023 | 1 | 0,3376 | |||
| Urticaria | 0,2 | 0,0 | 0,4 | 0,0 | 1,0 | 0,0 | 0,0 | ab | 1 | 0,8422 | 0,3376 | |||
| Milk products containing cereals | Control | 0,3 | 0,0 | 0,5 | 0,0 | 1,0 | 0,0 | 1,0 | H=4,0427 p=0,2569 |
a | 0,2827 | 1 | 1 | |
| AD | 0,1 | 0,0 | 0,3 | 0,0 | 1,0 | 0,0 | 0,0 | a | 0,2827 | 1 | 1 | |||
| Psoriasis | 0,3 | 0,0 | 0,7 | 0,0 | 2,0 | 0,0 | 0,0 | a | 1 | 1 | 1 | |||
| Urticaria | 0,3 | 0,0 | 0,6 | 0,0 | 2,0 | 0,0 | 0,0 | a | 1 | 1 | 1 | |||
Table 6.
Results of meat product consumption (results with statistical significance are marked in red).
Table 6.
Results of meat product consumption (results with statistical significance are marked in red).
| Food Product | Diagnosis | Arithmetic Mean | Median | Standard Deviation | Minimum | Maximum | Lower Quartile | Upper Quartile |
Kruskal-Wallis Test |
Homogenous Groups | POST-HOC (Dunn Bonferroni) | |||
| Control | AD | Psoriasis | Urticaria | |||||||||||
| Meat | Control | 4,7 | 5,0 | 0,6 | 3,0 | 5,0 | 5,0 | 5,0 |
H=46,9575 p<0,0001 |
b | 0,0006 | <0,0001 | <0,0001 | |
| AD | 3,3 | 3,0 | 1,3 | 0,0 | 5,0 | 3,0 | 5,0 | a | 0,0006 | 1 | 0,0903 | |||
| Psoriasis | 3,0 | 3,0 | 1,5 | 0,0 | 5,0 | 2,0 | 4,0 | a | <0,0001 | 1 | 0,4892 | |||
| Urticaria | 2,3 | 2,0 | 1,1 | 0,0 | 4,0 | 2,0 | 3,0 | a | <0,0001 | 0,0903 | 0,4892 | |||
| Fish | Control | 1,2 | 1,0 | 0,6 | 0,0 | 3,0 | 1,0 | 1,5 | H=3,7966 p=0,2843 |
a | 0,8226 | 0,4334 | 1 | |
| AD | 1,6 | 1,5 | 1,1 | 0,0 | 5,0 | 1,0 | 2,0 | a | 0,8226 | 1 | 1 | |||
| Psoriasis | 1,6 | 2,0 | 1,1 | 0,0 | 5,0 | 1,0 | 2,0 | a | 0,4334 | 1 | 1 | |||
| Urticaria | 1,4 | 2,0 | 0,7 | 0,0 | 2,0 | 1,0 | 2,0 | a | 1 | 1 | 1 | |||
| Ready-made sliced meats | Control | 4,7 | 5,0 | 0,6 | 3,0 | 5,0 | 5,0 | 5,0 | H=29,4656 p<0,0001 |
b | 0,0723 | <0,0001 | <0,0001 | |
| AD | 3,7 | 4,5 | 1,5 | 1,0 | 5,0 | 3,0 | 5,0 | ab | 0,0723 | 0,6319 | 0,1652 | |||
| Psoriasis | 3,0 | 3,0 | 1,8 | 0,0 | 5,0 | 2,0 | 5,0 | a | <0,0001 | 0,6319 | 1 | |||
| Urticaria | 2,7 | 3,0 | 1,6 | 0,0 | 5,0 | 2,0 | 3,0 | a | <0,0001 | 0,1652 | 1 | |||
| Offal products | Control | 1,2 | 1,0 | 1,6 | 0,0 | 5,0 | 0,0 | 1,0 | H=0,7377 p=0,8643 |
a | 1 | 1 | 1 | |
| AD | 1,1 | 1,0 | 1,1 | 0,0 | 5,0 | 0,0 | 1,8 | a | 1 | 1 | 1 | |||
| Psoriasis | 1,1 | 1,0 | 0,9 | 0,0 | 3,0 | 0,0 | 2,0 | a | 1 | 1 | 1 | |||
| Urticaria | 1,0 | 1,0 | 1,0 | 0,0 | 3,0 | 0,0 | 2,0 | a | 1 | 1 | 1 | |||
| Delicatessen products | Control | 1,5 | 1,0 | 1,3 | 0,0 | 5,0 | 1,0 | 1,0 | H=10,0727 p=0,0180 |
a | 0,0517 | 0,1937 | 0,0558 | |
| AD | 0,9 | 1,0 | 1,4 | 0,0 | 5,0 | 0,0 | 1,0 | a | 0,0517 | 1 | 1 | |||
| Psoriasis | 0,9 | 1,0 | 1,0 | 0,0 | 3,0 | 0,0 | 2,0 | a | 0,1937 | 1 | 1 | |||
| Urticaria | 0,7 | 0,0 | 0,8 | 0,0 | 2,0 | 0,0 | 1,0 | a | 0,0558 | 1 | 1 | |||
| Coating with gluten flour | Control | 2,7 | 3,0 | 1,0 | 1,0 | 5,0 | 2,0 | 3,0 | H=16,3096 p=0,0010 |
b | 0,4763 | 0,0027 | 0,0059 | |
| AD | 2,3 | 2,0 | 1,6 | 0,0 | 5,0 | 1,3 | 3,0 | ab | 0,4763 | 0,8247 | 0,7261 | |||
| Psoriasis | 1,8 | 2,0 | 1,0 | 0,0 | 3,0 | 1,0 | 2,0 | a | 0,0027 | 0,8247 | 1 | |||
| Urticaria | 1,7 | 2,0 | 1,1 | 0,0 | 3,0 | 1,0 | 2,0 | a | 0,0059 | 0,7261 | 1 | |||
| Coating with gluten-free flour | Control | 0,3 | 0,0 | 0,5 | 0,0 | 1,0 | 0,0 | 1,0 | H=3,3199 p=0,3449 |
a | 1,3873 | 0,9049 | 0,3594 | |
| AD | 0,2 | 0,0 | 0,6 | 0,0 | 3,0 | 0,0 | 0,0 | a | 1,3873 | 0,5519 | 1,5624 | |||
| Psoriasis | 0,3 | 0,0 | 0,6 | 0,0 | 2,0 | 0,0 | 0,0 | a | 0,9049 | 0,5519 | 1,1431 | |||
| Urticaria | 0,6 | 0,0 | 1,1 | 0,0 | 4,0 | 0,0 | 1,0 | a | 0,3594 | 1,5624 | 1,1431 | |||
Table 7.
Results of consumption of condiments.
| Food Product | Diagnosis | Arithmetic Mean | Median | Standard Deviation | Minimum | Maximum | Lower Quartile | Upper Quartile |
Kruskal-Wallis Test |
Homogenous Groups | POST-HOC (Dunn Bonferroni) | |||
| Control | AD | Psoriasis | Urticaria | |||||||||||
| Mixtures of spices | Control | 1,2 | 1,0 | 1,3 | 0,0 | 5,0 | 0,0 | 2,0 |
H=4,9147 p=0,1782 |
a | 1 | 1 | 0,1924 | |
| AD | 1,8 | 1,5 | 1,8 | 0,0 | 5,0 | 0,0 | 3,0 | a | 1 | 1 | 1 | |||
| Psoriasis | 1,6 | 1,0 | 1,6 | 0,0 | 5,0 | 0,0 | 3,0 | a | 1 | 1 | 1 | |||
| Urticaria | 2,1 | 2,0 | 1,6 | 0,0 | 5,0 | 1,0 | 3,0 | a | 0,1924 | 1 | 1 | |||
| Mustard |
Control | 1,4 | 1,0 | 1,0 | 0,0 | 5,0 | 1,0 | 2,0 | H=3,163 p=0,3672 |
a | 1 | 1 | 1 | |
| AD | 1,3 | 1,0 | 1,1 | 0,0 | 4,0 | 1,0 | 2,0 | a | 1 | 0,9357 | 1 | |||
| Psoriasis | 1,7 | 2,0 | 1,2 | 0,0 | 5,0 | 1,0 | 2,0 | a | 1 | 0,9357 | 0,8353 | |||
| Urticaria | 1,4 | 1,0 | 1,3 | 0,0 | 5,0 | 1,0 | 2,0 | a | 1 | 1 | 0,8353 | |||
| Ketchup | Control | 2,2 | 2,0 | 1,2 | 0,0 | 5,0 | 1,0 | 3,0 | H=3,2578 p=0,3536 |
a | 1 | 1 | 0,9957 | |
| AD | 1,8 | 2,0 | 1,4 | 0,0 | 5,0 | 1,0 | 2,8 | a | 1 | 1 | 1 | |||
| Psoriasis | 2,3 | 2,0 | 1,7 | 0,0 | 5,0 | 1,0 | 3,5 | a | 1 | 1 | 1 | |||
| Urticaria | 1,7 | 2,0 | 1,3 | 0,0 | 5,0 | 1,0 | 2,0 | a | 0,9957 | 1 | 1 | |||
| Ready-made sauces | Control | 1,4 | 1,0 | 1,2 | 0,0 | 4,0 | 1,0 | 2,0 | H=6,9643 p=0,073 |
a | 0,1292 | 0,1735 | 0,7776 | |
| AD | 0,8 | 0,0 | 1,2 | 0,0 | 5,0 | 0,0 | 2,0 | a | 0,1292 | 1 | 1 | |||
| Psoriasis | 0,8 | 1,0 | 1,0 | 0,0 | 3,0 | 0,0 | 1,5 | a | 0,1735 | 1 | 1 | |||
| Urticaria | 1,0 | 1,0 | 1,1 | 0,0 | 4,0 | 0,0 | 1,0 | a | 0,7776 | 1 | 1 | |||
| Broth cubes | Control | 1,5 | 1,0 | 1,5 | 0,0 | 5,0 | 0,0 | 2,0 | H=7,0401 p=0,0706 |
a | 1 | 1 | 1 | |
| AD | 1,1 | 1,0 | 1,2 | 0,0 | 4,0 | 0,0 | 2,0 | a | 1 | 0,1375 | 0,1751 | |||
| Psoriasis | 1,7 | 2,0 | 1,0 | 0,0 | 4,0 | 1,0 | 2,5 | a | 1 | 0,1375 | 1 | |||
| Urticaria | 2,0 | 2,0 | 1,5 | 0,0 | 5,0 | 1,0 | 3,0 | a | 1 | 0,1751 | 1 | |||
Table 8.
Coded foods and study groups for the gradational and cluster analyses.
| Food products | Study groups |
| 1 - Bread with gluten 2 - Bread without gluten 3 - Flour with gluten 4 - Flour without gluten 5 - Flakes with gluten 6 - Flakes without gluten 7 - Groats with gluten 8 - Groats without gluten 9 - Pasta with gluten 10 - Pasta without gluten 11 - Dumplings 12 - Dumplings 13 - Dumplings 14 - Pancakes 15 - Confectionery 16 - Cakes 17 - Pizza 18 - Hamburger buns/hotdogs/sausage rolls 19 - Breadcrumbs 20 - Milk 21 - Kefir (kind of buttermilk) 22 - Buttermilk 23 - Flavoured kefir 24 - Yoghurt 25 - Flavoured yoghurt 26 - Cottage cheese 27 - Cottage cheese 28 - Yellow cheese 29 - Cheese-based products 30 - Processed cheese 31 - Milk products containing cereals 32 - Cereal coffee 33 - Beer 34 - Ready-made condiments 35 - Mixtures of spices 36 - Mustard 37 - Ketchup 38 - Ready-made sauces 39 - Broth cubes 40 - Meat 41 - Fish 42 - Ready-made sliced meats 43 - Offal products 44 - Cold foods (Delicatessen products) 45 - Coating with gluten flour 46 - Coating with gluten-free flour |
A - Psoriasis B - AD C - Urticaria D - Control |
Table 9.
Clusters of food products consumed with similar frequency.
| Cluster 1 | Cluster 2 | Cluster 3 | Cluster 4 | Clusters 5 |
| 4 - Flour without gluten 2 - Bread without gluten 10 - Pasta without gluten 32 - Cereal coffee 21 - Kefir (kind of buttermilk) 23 - Flavoured kefir 30 - Processed cheese 27 - Cottage cheese (twarożki) 22 - Buttermilk 46 - Coating with gluten-free flour 26 - Cottage cheese (twarogi) 8 - Groats without gluten |
7 - Groats with gluten 24 - Yoghurt 6 - Flakes without gluten 41 - Fish 34 - Ready-made condiments 35 - Mixtures of spices 36 - Mustard 5 - Flakes with gluten 43 - Offal products 14 - Pancakes |
11 – Dumplings (pierogi) 31 - Milk products containing cereals 39 - Broth cubes 3 - Flour with gluten 1 - Bread with gluten 37 - Ketchup 20 – Milk 33 - Beer 9 - Pasta with gluten |
17 - Pizza 40 - Meat 28 - Yellow cheese 42 - Ready-made sliced meats 13 – Dumplings (kopytka) 45 - Coating with gluten flour 19 -Breadcrumbs |
15 - Confectionery 16 - Cakes 29 - Cheese-based products 12 - Dumplings (pyzy) 44 - Cold foods (Delicatessen products) 25 - Flavoured yoghurt 38 - Ready-made sauces 18 - Hamburger buns/hotdogs/sausage rolls |
Table 10.
Correlation between clusters of patients determined in the gradational analysis and the diagnosis.
Table 10.
Correlation between clusters of patients determined in the gradational analysis and the diagnosis.
| Diagnosis | GRAD clustering | ||||
| 1 | 2 | 3 | 4 | ||
| Size | A - Psoriasis | 13 | 15 | 5 | 2 |
| B - AD | 4 | 9 | 10 | 3 | |
| C - Urticaria | 7 | 8 | 6 | 0 | |
| D - Control | 0 | 0 | 16 | 19 | |
| 1 | 2 | 3 | 4 | ||
| verse % | A - Psoriasis | 37,14% | 42,86% | 14,29% | 5,71% |
| B - AD | 15,38% | 34,62% | 38,46% | 11,54% | |
| C - Urticaria | 33,33% | 38,1% | 28,57% | 0% | |
| D - Control | 0% | 0% | 45,71% | 54,29% | |
| 1 | 2 | 3 | 4 | ||
| column % | A - Psoriasis | 54,17% | 46,88% | 13,51% | 8,33% |
| B - AD | 16,67% | 28,13% | 27,03% | 12,5% | |
| C - Urticaria | 29,17% | 25% | 16,22% | 0% | |
| D - Control | 0% | 0% | 43,24% | 79,17% | |
Table 11.
Consumption of food products in the four clusters of respondents determined by the K-means method (results with statistical significance are marked in red).
Table 11.
Consumption of food products in the four clusters of respondents determined by the K-means method (results with statistical significance are marked in red).
| Produkt | Cluster 1 | Cluster 2 | Cluster 3 | Cluster 4 | ANOVA (p) | ||||
| X | sd | x | sd | X | sd | x | sd | ||
| [1] | 4,56 | 1,13 | 4,95 | 0,22 | 4,95 | 0,22 | 4,91 | 0,43 | 0,0499 |
| [2] | 0,58 | 1,18 | 0,30 | 1,13 | 0,26 | 0,55 | 0,41 | 0,80 | 0,4683 |
| [3] | 2,56 | 1,50 | 2,65 | 0,81 | 2,62 | 1,23 | 2,41 | 1,05 | 0,9157 |
| [4] | 0,42 | 0,69 | 0,10 | 0,31 | 0,08 | 0,35 | 0,32 | 1,13 | 0,1161 |
| [5] | 1,47 | 1,48 | 1,10 | 1,33 | 2,46 | 1,67 | 0,45 | 0,91 | <0,0001 |
| [6] | 0,83 | 1,21 | 1,55 | 2,19 | 0,38 | 0,99 | 0,27 | 0,63 | 0,0044 |
| [7] | 1,72 | 1,19 | 1,50 | 1,36 | 1,49 | 1,00 | 1,82 | 0,73 | 0,5996 |
| [8] | 1,14 | 1,02 | 0,95 | 0,89 | 1,36 | 0,81 | 1,55 | 1,01 | 0,1545 |
| [9] | 2,19 | 0,98 | 3,30 | 0,98 | 3,10 | 1,27 | 2,23 | 0,81 | 0,0001 |
| [10] | 0,14 | 0,54 | 0,30 | 0,66 | 0,10 | 0,31 | 0,45 | 1,18 | 0,2079 |
| [11] | 1,06 | 0,58 | 1,10 | 0,64 | 1,38 | 0,59 | 1,09 | 0,61 | 0,0806 |
| [12] | 0,47 | 0,56 | 0,70 | 0,66 | 1,05 | 0,69 | 0,68 | 0,65 | 0,0018 |
| [13] | 0,67 | 0,59 | 1,15 | 0,59 | 1,03 | 0,71 | 1,00 | 0,62 | 0,0245 |
| [14] | 1,17 | 0,61 | 1,20 | 0,70 | 1,56 | 0,68 | 1,27 | 0,63 | 0,0466 |
| [15] | 1,50 | 1,11 | 3,20 | 1,28 | 2,74 | 1,33 | 1,82 | 1,10 | <0,0001 |
| [16] | 1,31 | 0,86 | 2,55 | 1,54 | 1,82 | 0,94 | 1,55 | 1,14 | 0,0008 |
| [17] | 0,75 | 0,65 | 0,90 | 0,64 | 1,05 | 0,39 | 0,82 | 0,73 | 0,1627 |
| [18] | 0,42 | 0,50 | 1,45 | 1,43 | 0,74 | 0,68 | 0,50 | 0,67 | 0,0001 |
| [19] | 0,97 | 0,70 | 2,15 | 1,09 | 1,62 | 0,85 | 1,68 | 0,84 | <0,0001 |
| [20] | 2,50 | 1,63 | 3,45 | 1,67 | 3,64 | 1,37 | 0,77 | 1,11 | <0,0001 |
| [21] | 0,83 | 1,06 | 1,60 | 1,67 | 1,38 | 1,21 | 1,32 | 1,32 | 0,1262 |
| [22] | 0,50 | 0,77 | 1,20 | 1,54 | 1,31 | 1,20 | 0,77 | 0,97 | 0,012 |
| [23] | 0,28 | 0,70 | 0,45 | 0,69 | 0,36 | 0,90 | 0,27 | 0,70 | 0,8446 |
| [24] | 0,97 | 1,13 | 1,10 | 1,12 | 1,85 | 1,20 | 1,59 | 1,33 | 0,01 |
| [25] | 1,31 | 1,35 | 1,85 | 1,27 | 1,62 | 1,11 | 0,64 | 0,85 | 0,0047 |
| [26] | 1,67 | 1,17 | 2,15 | 1,27 | 1,82 | 1,12 | 1,77 | 1,15 | 0,524 |
| [27] | 1,25 | 1,16 | 0,80 | 1,01 | 1,18 | 1,37 | 0,77 | 0,92 | 0,3071 |
| [28] | 1,19 | 1,06 | 2,85 | 1,69 | 2,31 | 1,34 | 2,14 | 1,70 | 0,0002 |
| [29] | 0,03 | 0,17 | 0,35 | 0,81 | 0,10 | 0,38 | 0,27 | 1,08 | 0,213 |
| [30] | 0,33 | 0,48 | 0,50 | 0,95 | 0,28 | 0,76 | 0,68 | 0,89 | 0,203 |
| [31] | 0,08 | 0,28 | 0,35 | 0,59 | 0,38 | 0,67 | 0,32 | 0,57 | 0,0921 |
| [32] | 0,22 | 0,48 | 0,00 | 0,00 | 0,36 | 1,14 | 0,32 | 0,78 | NA |
| [33] | 0,81 | 0,98 | 1,45 | 1,10 | 1,15 | 0,87 | 1,18 | 1,18 | 0,1318 |
| [34] | 1,83 | 1,32 | 2,00 | 1,41 | 1,13 | 1,26 | 2,00 | 1,38 | 0,0259 |
| [35] | 1,14 | 1,27 | 2,55 | 1,57 | 1,18 | 1,35 | 2,32 | 1,81 | 0,0003 |
| [36] | 1,11 | 1,06 | 2,10 | 1,45 | 1,23 | 0,78 | 1,95 | 1,09 | 0,0009 |
| [37] | 1,47 | 1,44 | 3,35 | 1,14 | 1,74 | 1,07 | 2,36 | 1,33 | <0,0001 |
| [38] | 0,61 | 0,87 | 2,50 | 1,19 | 0,87 | 0,86 | 0,68 | 0,78 | <0,0001 |
| [39] | 1,42 | 1,11 | 2,90 | 1,21 | 1,03 | 1,11 | 1,50 | 1,34 | <0,0001 |
| [40] | 2,06 | 1,17 | 4,15 | 1,14 | 4,36 | 0,99 | 3,55 | 1,10 | <0,0001 |
| [41] | 1,33 | 0,99 | 1,60 | 1,31 | 1,33 | 0,70 | 1,68 | 0,65 | 0,3695 |
| [42] | 2,06 | 1,60 | 4,40 | 0,88 | 4,62 | 0,78 | 3,55 | 1,22 | <0,0001 |
| [43] | 0,69 | 0,89 | 1,10 | 0,64 | 1,13 | 1,51 | 1,64 | 1,09 | 0,028 |
| [44] | 0,39 | 0,73 | 1,85 | 1,63 | 1,08 | 0,81 | 1,41 | 1,22 | <0,0001 |
| [45] | 1,50 | 1,25 | 2,90 | 1,17 | 2,33 | 1,08 | 2,32 | 0,95 | 0,0001 |
| [46] | 0,31 | 0,79 | 0,25 | 0,44 | 0,44 | 0,79 | 0,14 | 0,47 | 0,4182 |
Table 12.
Correlation between the patient clusters determined by the K-means analysis and the diagnosis.
Table 12.
Correlation between the patient clusters determined by the K-means analysis and the diagnosis.
| Diagnosis | GRAD clustering | ||||
| 1 | 2 | 3 | 4 | ||
| Size | A - Psoriasis | 15 | 6 | 6 | 8 |
| B - AD | 8 | 2 | 6 | 10 | |
| C - Urticaria | 13 | 2 | 4 | 2 | |
| D - Control | 0 | 10 | 23 | 2 | |
| 1 | 2 | 3 | 4 | ||
| verse % | A - Psoriasis | 42,86% | 17,14% | 17,14% | 22,86% |
| B - AD | 30,77% | 7,69% | 23,08% | 38,46% | |
| C - Urticaria | 61,9% | 9,52% | 19,05% | 9,52% | |
| D - Control | 0% | 28,57% | 65,71% | 5,71% | |
| 1 | 2 | 3 | 4 | ||
| column % | A - Psoriasis | 41,67% | 30% | 15,38% | 36,36% |
| B - AD | 22,22% | 10% | 15,38% | 45,45% | |
| C - Urticaria | 36,11% | 10% | 10,26% | 9,09% | |
| D - Control | 0% | 50% | 58,97% | 9,09% | |
Disclaimer/Publisher’s Note: The statements, opinions and data contained in all publications are solely those of the individual author(s) and contributor(s) and not of MDPI and/or the editor(s). MDPI and/or the editor(s) disclaim responsibility for any injury to people or property resulting from any ideas, methods, instructions or products referred to in the content. |
© 2025 by the authors. Licensee MDPI, Basel, Switzerland. This article is an open access article distributed under the terms and conditions of the Creative Commons Attribution (CC BY) license (http://creativecommons.org/licenses/by/4.0/).
Copyright: This open access article is published under a Creative Commons CC BY 4.0 license, which permit the free download, distribution, and reuse, provided that the author and preprint are cited in any reuse.


