
Submitted:
05 April 2025
Posted:
08 April 2025
You are already at the latest version
Abstract
Hydrogen and some of its derivatives (such as e-methanol, e-methane, and e-ammonia) are promising energy carriers that have the potential to replace conventional fuels, thereby eliminating their harmful environmental impacts. An innovative use of hydrogen as a zero-emission fuel is being a source of weakly-ionized plasma through seeding its combustion products with a small amount of an alkali metal vapor (cesium or potassium). This plasma can be used as the working fluid in supersonic open-cycle magnetohydrodynamic (OCMHD) power generators. In such OCMHD generators, direct-current (DC) electricity is generated directly without moving turbogenerators. In the current study, we quantitatively and qualitatively explore the levels of electric conductivity and the resultant volumetric electric output power density in a typical OCMHD supersonic channel, where thermal equilibrium plasma is accelerated at a Mach number of two (Mach 2) while being subject to a strong applied magnetic field (applied magnetic-field flux density) of five teslas (5 T), and with the assumption of an isothermal temperature of 2,300 K (2,026.85 °C). We varied the total pressure of the pre-ionization seeded gas mixture between 1/16 atm and 16 atm. We varied the seed level between 0.0625% and 16% (pre-ionization mole fraction). We varied the seed type between cesium and potassium. We varied the oxidizer type between air (oxygen-nitrogen mixture, 21%-79% by mole) and pure oxygen. Our results suggest that the ideal power density can reach exceptional levels beyond 1,000 MW/m3 (or 1 kW/cm3). The power density can be enhanced using any of the following techniques: (1) lower total pressures, (2) using cesium instead of potassium for seeding, and (3) using air instead of oxygen as an oxidizer (if the temperature is unchanged). A seed level between 1% and 4% (pre-ionization mole fraction) is recommended (much lower or much higher seed levels are harmful to the OCMHD performance). The seed level that maximizes the electric power is not necessarily the same seed level that maximizes the electric conductivity due to additional thermochemical changes caused by the additive seed.
Keywords:
magnetohydrodynamic
; hydrogen
; electric conductivity
; power density
; plasma
; alkali metal seed
; OCMHD
; H2MHD
1. Introduction
1.1. Background
Hydrogen is the lightest element in the periodic table but it is the most plentiful element in the universe [1,2] (while oxygen is the most abundant element in the earth’s crust by mass [3,4]). Hydrogen is an important building block in several chemical processes and power systems [5,6], as listed in Table 1.
Hydrogen facilitates the transition to a low-emission economy [55,56,57], taking advantage of the absence of released carbon dioxide (CO2) due to the consumption of hydrogen [58,59,60,61]. The production of green hydrogen is based on water electrolysis powered by electricity generated from renewable energy sources (such as solar energy [62,63,64] and wind energy [65,66,67,68]), and thus it does not involve the release of greenhouse gases (GHG) [69,70,71], making it an attractive way to mitigate GHG emissions without resorting to carbon capture technologies as needed in the case of blue hydrogen [72,73,74,75] that is originating from fossil fuels.
In an earlier study, we proposed a novel use for hydrogen (either green hydrogen or blue hydrogen) in open-cycle magnetohydrodynamic (OCMHD) power generators [76], in which direct power extraction (DPE) is realized with the aid of the Lorentz force. In this concept, hot gases formed as combustion products of hydrogen are seeded with a small amount of an alkali metal (either cesium “Cs” or potassium “K”) [77,78,79], which allows for an appreciable level of thermal ionization leading to a suitable electric conductivity of the weakly-ionized plasma gas, which is accelerated through a linear channel [80,81,82]. The high-speed plasma loses part of its energy in reaction to an applied magnetic field, where an induced electric field allows collecting an induced electric current to power an external electric load [83,84,85]. This concept of hydrogen-powered magnetohydrodynamic power generation, which we refer to here as (H2MHD), can be combined with a classical power cycle [86,87,88] for better utilization of the input heat released from the zero-emission hydrogen combustion through a dual-cycle power plant, comprised of a higher-temperature open-cycle MHD (OCMHD) generator and either a lower-temperature closed-cycle Rankine system or a lower-temperature open-cycle Brayton system [89,90,91]. A triple combined cycle that incorporates the open-cycle MHD (OCMHD) generator as a topping layer (high temperature) with an intermediate layer having an open-cycle Brayton gas turbine (intermediate temperature) and then a layer of a closed-cycle steam turbine (low temperature) is also possible, to recover part of the rejected heat containing in the still-hot plasma gas leaving the MHD generator [92,93,94]. Introducing an even lower-temperature refrigerant-based organic Rankine cycle [95,96,97] as an additional terminal downstream level (very low temperature) was proposed, yielding a quadruple combined cycle [98].
Figure 1 depicts how the proposed hydrogen magnetohydrodynamic (H2MHD) topping cycle operates. The plasma velocity vector is designated by the symbol (), the applied magnetic field vector (applied magnetic-field flux density vector) is designated by the symbol (), and the electric current-density vector is designated by the symbol (). Hydrogen is combusted with an oxidizer, which is either air (in the case of the conventional air-combustion mode) or oxygen (in the case of the intensified oxy-combustion mode). Oxy-combustion (the combustion of HHO or Brown’s gas) offers the advantage of elevating the combustion temperature due to the absence of diluent nitrogen [99,100,101]. A small amount of solid alkali salt, such as potassium carbonate (K2CO3) [102] is added in the form of an aqueous solution that is introduced as a fine spray by atomization, to serve as the source of the vapor alkali metal after combustion [103,104]. Either potassium element or cesium element is readily vaporized well below the combustion temperature. Potassium (K) vaporizes at 760 °C only [105], while cesium (Cs) vaporizes at a lower boiling point of 671 °C [106]. The hot-seeded hydrogen-combustion products are accelerated to supersonic speeds using a de Laval nozzle (convergent-divergent nozzle or CD nozzle) [107,108,109]. The term “channel” or “linear channel” here refers to the portion of the divergent section of the convergent-divergent nozzle where an external magnetic field is applied perpendicular to the plasma’s direction of bulk motion, and an induced electric emf (electromotive force) is produced; thus, an electric current-density can be collected through electrodes (positive cathode and negative anode) to be delivered to an external load. Like solar photovoltaic (PV) modules [110,111] and thermoelectric generators (TEG) [112,113], MHD generators operate on the principle of direct power conversion (from input energy to electricity in a single step), without an intermediate turbogenerator [114,115], and without reciprocating or rotary parts [116,117]. This is a remarkable feature in MHD generators.
The power density (or volumetric power density) is a performance metric for power generation units, describing the power output per unit volume occupied. This metric quantifies the effective utilization of space. For MHD generators, the intensive high-temperature and high rate of power extraction from the plasma gives this technology a unique favorable characteristic when compared to other power technologies. For example, the Sakhalin MHD pulsed power generator experimentally demonstrated a temporary power density of about 90.7 MW/m3 (computed as an electric power output of 510 MW divided by an MHD linear channel volume of 5.625 m3) [118,119,120]. Another shock-tunnel MHD generator experimentally demonstrated a high power density of 140 MW/m3 [121]. These power densities are much higher than typical values of automotive engines (around 15 MW/m3, the volume here refers to the displacement volume [122,123]), permanent magnet (PM) synchronous motors (SM) (around 7.5 MW/m3 [124]), and triboelectric nanogenerator (TENG) energy harvesting units (up to about 5 MW/m3 [125]), and microbial fuel cells (MFCs) (between 1 × 10⁻⁶ MW/m3 and 5 × 10⁻⁵ MW/m3 [126,127,128]). Numerical two-dimensional modeling of a hypothetical MHD channel with methane (CH4) combustion suggested a lower power density of 17.9 MW/m3 (computed through dividing an electric power of 31.4 MW by a volume of 1.75 m3) [129]. This is not remarkably high, but it is still encouraging.
There is another metric for expressing the effective utilization of a power system, which is the specific power of gravimetric power density (W/kg). However, this is more challenging to estimate compared to the volumetric power density; because estimating the specific power requires more detailed and precise knowledge about the particular power system and its components, including the minor auxiliary ones if they largely affect the weight [130,131]. The specific power (or the power-to-weight ratio [132,133]) is of particular importance in aeronautical and space propulsion systems [134,135,136]; which are outside the scope of this study that is concerned with terrestrial power systems. Thus, the volumetric power density is adopted here. The specific energy or the gravimetric energy density metric (Wh/kg) [137,138], and the energy density or volumetric energy density metric (Wh/L) [139,140] pertain more to energy storage units (such as batteries), and thus are not used in our study.
1.2. Goal of the Study
Because the proposed H2MHD concept is a new technology for utilizing hydrogen, there is a need for extensive investigations regarding the technological feasibility of this technology. This study aims to partly fill this huge knowledge gap through estimating the volumetric power density of an ideal H2MHD channel, at a representative value for the applied magnetic field (the applied magnetic-field flux density), a reasonable supersonic Mach number (the ratio of the plasma speed to the speed of sound), and a suitable temperature representative of hydrogen combustion.
The performance of the volumetric power density is estimated for a wide range of operational conditions, with different total pressures, different levels of seeding, two types of the seed metal, and two types of the oxidizer.
The results of this study provide several insights into the use of OCMHD in general, rather than H2MHD solely because some of the generic findings reported here can actually be applicable to other OCMHD systems with fuels other than hydrogen. Thus, this study is considered useful for MHD power generators in general, and for hydrogen use in these power generators in particular.
2. Research Method
2.1. Assumptions
The current study is centered around zero-dimensional computational modeling (point modeling or system-level modeling) of a hypothetical supersonic H2MHD (hydrogen magnetohydrodynamic) channel. Therefore, no exact geometry is defined; instead, the analysis assumes uniform local properties everywhere. Despite losing boundary effects and temporal transience [141,142,143,144,145] that can be captured using computational fluid dynamics (CFD) methods [146,147,148], our simplifying assumption is important to allow having a closed-form expression for the power density, which is conveniently applied to estimate theoretical upper bounds. In addition, our assumption is useful in generalizing the outcomes of this study, making them broadly valid, rather than being limited to a specific H2MHD channel.
In addition, due to the large number of variables involved in the H2MHD problem, we need to fix some variables at reasonable values while changing others to explore their impact. Therefore, three quantities are fixed in the current study, and these fixed quantities are (1) the temperature, (2) the applied magnetic-field flux density, and (3) the Mach number. These fixed parameters are set to the values listed in Table 2. The significance of these fixed parameters lies also in the fact they are the same values assumed in our previous work mentioned earlier in which we proposed the H2MHD concept (but the term “M2HHD” is coined here for the first time).
2.2. Mathematical Equations
For a plasma speed (), an applied magnetic-field flux density magnitude (), and an electric conductivity (σ); the theoretical upper limit for the volumetric electric power density () that can be extracted from the moving plasma gas is [159]
This power density is restricted to ideal conditions, where the external load is matched (optimized) such that its electric resistance is equal to the equivalent internal electric resistance of the MHD generator [160,161,162].
The plasma speed () can be expressed in terms of the speed of sound () and the Mach number () as [163]
Using Equation (2) in Equation (1) allows the expressing of the power density () in a different form as
The plasma electric conductivity () in our study is computed according to an algorithm we described and verified in detail in a previous study [164], which is based on the robust Frost’s two-conductivity approximation that takes into account the scattering of electrons by neutrals as well as the scattering of electrons by charged particles (ions and other electrons) [165], and thus interpolates the electric conductivity for the partially-ionized plasma in OCMHD channels between the two extreme values for which an exact solution is known (namely, the extreme case of very weakly-ionized plasma, and the extreme case of fully-ionized plasma) [166,167,168]. In our algorithm, the plasma’s electric conductivity depends on the total static pressure () (the term “total” here means the sum of partial pressures of involved gaseous species, not the stagnation zero-speed pressure, and not the gauge pressure [169]), the absolute temperature (), and the pre-ionization mole fractions (, where is an index referring to each involved gaseous species in the gaseous mixture formed after adding the seed alkali metal vapor to the hydrogen combustion products). Since the temperature is fixed in the current study at 2,300 K; practically, the electric conductivity depends only on the total static pressure () and the mole fractions (). Therefore, we can symbolically represent the electric conductivity () as () to emphasize its functional dependence on these plasma properties.
The speed of sound in the pre-ionization plasma () is modeled here using the ideal gas approximation, making it a function of the absolute temperature () and the mole fractions () only [170,171,172]. This speed of sound can be expressed as
where () is the specific heat capacity at constant pressure of the gas mixture after seeding but before ionization, and () is the specific gas constant for this gas mixture. The pre-ionization mixture’s specific heat capacity () is computed from the specific heat capacities of the individual gaseous species ( for the species with the index ) that make up the pre-ionization gas mixture, and these individual specific heat capacities are described according to the updated nine-coefficient edition of NASA (United States National Aeronautics and Space Administration) nonlinear fitting functions for computing thermodynamic properties [173,174,175,176]. Therefore, we can analytically express the speed of sound () as () to emphasize its functional dependence on the plasma properties () and ().
The nondimensional quantity () in Equation (4) is called the specific heat ratio or the adiabatic index, and it is assigned here the symbol (). Therefore, the previous equation for the speed of sound () can be rewritten as [177]
The gas constant () for each gaseous species having the index is obtained using
where () is the universal (molar) gas constant, and () is the molecular weight of the species with an index (). In the current study, we have [178,179,180]
The molecular weights of the gaseous species that appear in the current study are listed in Table 3. These were taken values from the NIST (United States National Institute of Standards and Technology) individual gaseous species Chemistry WebBook database [181,182,183].
The molecular weight of the gas mixture () is computed as [188]
where () is the number of gaseous species in the pre-ionization gas mixture. We have () when the oxidizer is pure oxygen (oxy-hydrogen combustion), while () when the oxidizer is air (air-hydrogen combustion). In the case of oxy-combustion, the pre-ionization mixture is treated here as a mixture of water vapor (H2O) and the vaporized alkali metal (either Cs or K). In the case of air-hydrogen combustion, the pre-ionization mixture is treated here as a mixture of water vapor (H2O), excess nitrogen (N2), and the vaporized alkali metal (either Cs or K).
After obtaining (), the specific gas constant of the pre-ionization gas mixture () can be computed as
Then, the mass fraction of each individual species () can be computed as [189]
Then, the specific heat capacity of the mixture is computed from the specific heat capacities of the individual species through mass-weighted averaging as
The NASA nonlinear fitting function for estimating () has the following general structure, with seven terms:
It should be noted that the fitting coefficients ( to b7,i) in the previous equation correspond to the higher-temperature range (from 1,000 K to 6,000 K); where there is another set of fitting coefficients for a lower-temperature range (from 200 K to 1,000 K), but these are irrelevant in our study (too cold to be of interest).
The combustion of hydrogen with air is approximated as a complete stoichiometric reaction of molecular hydrogen (H2) with a mixture having mole fractions of 79% for molecular nitrogen (N2) and 21% for molecular oxygen (O2) [190,191,192]. Therefore, the combustion products are idealized as having only water vapor (H2O) and excess non-reacting molecular nitrogen (N2) according to the following reaction equation [193,194]:
Vapor seed metal (either cesium or potassium) is then added to the hydrogen combustion products with a predetermined target mole fraction. This seeded mixture is then analyzed under thermal equilibrium to obtain the electrochemical properties of the post-ionization plasma (such as its electric conductivity and mole fractions of ions).
The combustion of hydrogen with oxygen is approximated as a complete stoichiometric reaction of molecular hydrogen (H2) with molecular oxygen (O2), resulting in pure water vapor (H2O) as the single combustion product. This is described by the following reaction equation:
Vapor seed metal (either cesium or potassium) is then added to this combustion product water vapor with a predetermined target mole fraction. This seeded mixture is then analyzed under thermal equilibrium to obtain the electrochemical properties of the post-ionization plasma.
We conclude the current mathematical description of the modeling methodology by presenting a customized version of the expression governing the ideal volumetric power density in Equation (3), by setting the Mach number to (M = 2), and the magnitude of the applied magnetic-field flux density to (). This gives the following special expression pertaining to our study:
To conveniently express the values of the power density (), the larger unit of (MW/m3) is adopted rather than the basic SI unit of (W/m3), thus the previous equation is modified to
While the speed of sound () in the above equation should correspond to the post-ionization plasma condition (taking into account the small changes in the gaseous mixture because of the partial ionization of some alkali seed atoms), we use the pre-ionization value that corresponds to an all-neutral (no ions, no electrons) seeded gas mixture. This establishes consistency with the reported total pressure values as a controllable variable, where these pressures correspond to the pre-ionization condition. This matter is practically negligible because only a small portion of the seeded alkali metal can be thermally ionized at the fixed temperature of 2,300 K; causing the mole fraction of either the alkali ions or the free electrons to be below 0.1% in all cases we cover, and even much less than this in many of the analyzed cases.
2.3. Varied Conditions
In Table 5, we list the quantities to be varied in the current study while estimating the ideal volumetric power density () for a magnetohydrodynamic (MHD) generator channel, as well as the values assigned to these varied quantities. These quantities are
- (1)
- the total absolute pressure () after the vaporous seed alkali metal is mixed with the hydrogen combustion gases. The unit is the standard atmosphere (1 atm = 101,325 Pa = 1.01325 bar). Nine values are assigned to this continuous variable, sampling it between a very low value of 1/16 atm (6332.812 Pa or 6.332812 kPa) to a high value of 16 atm (1.6212 MPa or 1,621.2 kPa). These values allow exploring the impact of this variable over a wide range. The nine selected pressures form a geometric sequence with a multiplicative progression constant of two.
- (2)
- the mole fraction () of the vaporous seed alkali metal after it is mixed with the hydrogen combustion gases. This fraction is expressed as a percentage. Five values are assigned to this continuous variable, sampling it between a very low value of 0.0625% or (1/16)% to a high value of 16%. These values allow exploring the impact of this variable over a wide range. The five selected seed mole fractions form a geometric sequence with a multiplicative progression constant of four.
- (3)
- The type of the vaporous seed alkali metal to be added to the hydrogen combustion gases. This is a binary variable, and it can be either cesium (Cs) or potassium (K). These two particular chemical elements are chosen here as the possible seed metal that serves as the source of electrons due to their easy thermal ionization compared to the combustion products gases (H2O or N2). The ionization energy of cesium (Cs, atomic number 55; located in the alkali metal group IA or group 1 and period 6 in the periodic table of chemical elements) is 3.893 eV/particle (375.6 kJ/mol), and this is the lowest value among all chemical elements in the periodic table [195,196,197]. We point out here that 1 eV/particle (electronvolt per particle) is equivalent to 96.49 kJ/mol (kilojoule per mole) [198,199,200]. The ionization energy of potassium (K, atomic number 19; located in the alkali metal group IA or group 1 and period 4 in the periodic table of chemical elements) is 4.34 eV/particle (419 kJ/mol), and this is the fourth lowest value among all chemical elements in the periodic table [201,202,203]. Although francium (Fr, atomic number 87; located in the alkali metal group IA or group 1 and period 7 in the periodic table) has a lower ionization energy of (3.9 eV/particle or 376 kJ/mol) than potassium [204,205]; francium is radioactive and very stable (has no practical uses) due to its small half-life of only 22 minutes [206,207,208]. Although rubidium (Rb, atomic number 37; located in the alkali metal group IA or group 1 and period 5 in the periodic table) has a lower ionization energy of (4.177 eV/particle or 403.0 kJ/mol) than potassium [209,210]; rubidium is a rare element, and its use is typically limited to scientific research [211,212,213]. The ionization energy of molecular nitrogen (N2) is very large, being 15.6 eV/particle (1,505 kJ/mol) approximately [214,215]. The ionization energy of atomic nitrogen (N) is also large, being 14.5 eV/particle (1,399 kJ/mol) approximately [216,217]. The dissociation energy of molecular nitrogen (N2) into two atoms is also much lower (9.76 eV/mole or 942 kJ/mol) [218,219], but it is still higher than the ionization energy of either potassium or cesium. The ionization energy of the water molecules (H2O) is very large, being 12.6 eV/particle (1,216 kJ/mol) approximately [220]. The dissociation energy of the water molecules (H2O) into a hydrogen atm (H) atm and a hydroxyl radical (OH) radical is approximately 5.16 eV/particle (498 kJ/mol) [221], making this dissociation less probable than the ionization of either potassium or cesium.
- (4)
- The type of oxidizer to be used in the combustion of hydrogen. This is a binary variable, and it can be either air or pure oxygen (O2).
Therefore, there is a total of 180 conditions (data points) to be computationally represented in the current study (because there are nine pressures, five seed mole fractions, two seed types, and two oxidizer types).

Table 5.
Varied quantities in the current study.
| Counter | Varied Quantity | |||
|---|---|---|---|---|
| [atm] | [%] | Seed metal | Oxidizer | |
| 1. | 0.0625 | 0.0625%, (1/16)% | Cesium (Cs) | Air (79% N2, 21% O2) |
| 2. | 0.125 | 0.25% | Potassium (K) | Oxygen (100% O2) |
| 3. | 0.25 | 1% | ||
| 4. | 0.5 | 4% | ||
| 5. | 1 | 16% | ||
| 6. | 2 | |||
| 7. | 4 | |||
| 8. | 8 | |||
| 9. | 16 | |||
2.4. Power Density Criterion
In our study, it can be sufficient to estimate the volumetric electric power density output under the various operational conditions for the H2MHD (hydrogen magnetohydrodynamic) concept, as a primary goal for our study and as it major contribution. However, the value of our study is boosted when a criterion for this power density is also recommended, to help in judging the feasibility of the H2MHD concept and the preferred set of conditions suitable for it.
To justify such a criterion (a power density threshold), we consider that a mid-size power plant has a power capacity on the order of 600 MW [222,223,224,225]. If an H2MHD power density of 50 MW/m3 is possible, then this 600 MW power capacity can be accomplished with a compact space of only 12 m3 in the case of a properly operated H2MHD generator. This small volume can be formed for example as a divergent channel with a width of 1 m, a length of 6 m, and a mean height of 2 m [226,227,228,229]. To account for the assumptions made in the current study, and the losses ignored in our system-level approach, we set our threshold to twice this value, making it 100 MW/m3. This means that 100 MW/m3 in our analysis may actually be reduced to half of this value in reality. To show the gigantic amount of power delineated by this criterion, it is helpful to compare this threshold (100 MW/m3) with the typical area power density of photovoltaic (PV) solar panels under good sunshine, which is only about 200 W/m2 (0.0002 MW/m2) [230,231,232].
We emphasize that this suggested criterion of 100 MW/m3 here is not a precise value, but involves some arbitrariness. However, it is considered a reasonable rough guide for assessing the suitability of H2MHD power generation.
3. Results
This results section is divided into four subsections, which are mapped with the four possibilities arising from the two binary variables (namely, two alkali seed types and two oxidizer types). For each case of these four conditions, we present first the variation of the plasma electric conductivity () after thermal equilibrium, as a function of the total pre-ionization absolute pressure () with the mole fraction of the neutral alkali seed metal () being a parameter. Thus, the variation of () is visualized versus () as five curves (one curve per ), and this visualization is presented four times (for two seed types and two oxidizer types). Similarly, the estimated ideal volumetric power density () is visualized as a function of () four times in the four coming subsections, at five values of () in each () plot.
To aid in interpreting the electric conductivity, it is voluntarily expressed as a multiple of the typical seawater electric conductivity, which is assigned here a value of 5 S/m [233,234,235]. The secondary (right) vertical axis in the electric conductivity () plots is utilized for this purpose, while the primary (left) vertical axis is utilized for expressing the absolute (unscaled) value of (), expressed in the SI unit of S/m.
Regarding the pre-ionization speed of sound (), and thus the plasma speed (); because () is independent of the total pressure, it does not need to be visualized as a dependent variable of (). Instead, we only tabulate its values for the five values of () at the beginning of each of the four coming subsections, along with other thermochemical properties that are also independent of the total absolute pressure (such as the pre-ionization mixture’s molecular weight).
In addition to the visualized curves, we also list the numerical values for the variations in () and (). This is useful for the sake of precision, as well as for subsequent utilization of these values by interested readers in external quantitative analysis or comparisons conducted by themselves.
For effective contrast and use of the plots, the ranges of the axes are retained the same regardless of the actual range of the data being visualized. This allows for quick identification of the relative size of the data visualized in different figures, which correspond to different operational cases or the H2MHD channel.
For effective identification of the individual influence of the seed type and the oxidizer type, we intentionally order the four coming subsections such that in the transition from one subsection to the next, only one change is made. This change is either altering the seed type or altering the oxidizer type (but not altering both of them at once; which makes it difficult to separate the influence of each alteration from the other).
3.1. Cesium Seed and Air Oxidizer
The first set of results corresponds to the condition of using cesium vapor as the ionizable gas, and using air as the oxidizer for the hydrogen combustion.
In Table 6, we provide our computed thermochemical characteristics for the seeded gas mixture before ionization, according to the mathematical model presented in the previous section.
It is noticed that as the mole fraction of cesium increases, the mixture’s gas constant () decreases (because the mixture’s molecular weight increases). This is justified by the heavier molecular weight of cesium (Cs) compared to either water vapor (H2O) or molecular nitrogen (N2). One mole of cesium (Cs) is 4.744 times heavier than one mole of molecular nitrogen (N2), and 7.377 times heavier than one mole of water (H2O). One of the implications of the decline in the mixture’s gas constant () is a decline in the speed of sound (), and thus the plasma’s bulk speed (given that it is always twice the speed of sound in the current study). However, these influences of the additive cesium remain marginal up to a mole fraction of 1%. The remarkable changes at the large mole fraction of 16% are quite virtual, because practically it is not expected to have such a big portion of the seed.
Despite the seed content, the mole fraction ratio () is always 1.881, as implied by the stoichiometry reaction in Equation (13), which stipulates that this ratio should be in the cases of air-hydrogen combustion.
Figure 2 shows how the electric conductivity of the hydrogen plasma drops monotonically and nonlinearly as the total pre-ionization absolute pressure increases. This trend is identical for the five seed levels of cesium vapor. This drop in the electric conductivity can be explained by the larger number density of neutral heavy particles (atoms and molecules) in the plasma at higher pressures, which retards the directional movement of the liberated electrons from the ionized cesium atoms due to more frequent collisions with these neutral particles [236,237,238].
Unlike the effect of the pressure, the effect of the cesium additive is non-monotonic. Starting from a small level of (Cs), adding more (Cs) initially improves the electric conductivity. This boost slows down and reaches a peak near a cesium mole fraction of , and then the electric conductivity starts to drop as more cesium vapor is added in place of water vapor and nitrogen. This peaking behavior of the electric conductivity () can be attributed to the presence of two factors that impact the electric conductivity due to the free electrons produced by the ionization of a fraction of the cesium atoms. The first factor is the large number density of electrons, due to more cesium atoms; this improves the electric conductivity as more cesium is added. The other factor is the electron-ion interaction (attraction) and electron-electron interaction (repulsion) due to their electric charges. As the number of electrons (and thus the number of cesium ions) increases beyond an appreciable level, the attenuating effect on the electric conductivity caused by these interactions (Coulomb scattering) [239,240,241] overpowers the accentuating effect on the electric conductivity caused by the electrons’ number density; and thus the electric conductivity declines after reaching a peak value. This explains why the electric conductivity with a higher cesium mole fraction of 16% is less than the electric conductivity with a lower cesium mole fraction of 4%. From the shown figure, it may be inferred qualitatively that a pre-ionization cesium mole fraction of 1% or 2% is preferred, because the weak increase in the electric conductivity beyond these levels does not seem to justify such additions of cesium content.
Table 7 lists the numerical values of the plasma electric conductivity as visualized in the previous figure. We also add in the table the electric conductivity values at a pre-ionization cesium mole fraction of , which approximately corresponds to the maximized electric conductivity for this case (air-hydrogen combustion plasma with cesium seed).
Considering the five selected seed levels (0.0625%, 0.25%, 1%, 4%, and 16%), the highest obtained electric conductivity is (at and ), and this is about 11 times the electric conductivity of seawater. At the higher (and the same total pressure of 0.0625 atm), the electric conductivity is slightly lower, with a value of 51.7766 S/m; while at the lower (and the same total pressure of 0.0625 atm), the electric conductivity is mildly lower, with a value of 42.2099 S/m. If we take a total pressure of 1 atm (atmospheric MHD channel) as a reference, one can see that the electric conductivity can exceed 10 S/m (twice the conductivity of seawater) with only 1% cesium level.
Using the presented values of the speed of sound (see Table 6) and the values of the electric conductivity (see Table 7) in Equation (16) gives the corresponding ideal volumetric power densities () for the current H2MHD case of cesium seeding and air oxidizer. The () results are visualized in Figure 3, and listed in Table 8. We also add in the table the power density values at a pre-ionization cesium mole fraction of , which approximately corresponds to the maximized power density for this case (air-hydrogen combustion plasma with cesium seed).
Like the electric conductivity, the power density declines monotonically and nonlinearly as the total pressure increases. Also, like the electric conductivity, the power density exhibits a peak when the cesium level increases, and then it starts to decrease. However, unlike the case of the electric conductivity (), the cesium level for maximizing the power density () has shifted down from being close to 6% to being close to 3%. This shift is explained by the simultaneous decline in the speed of sound as the cesium level increases. This added effect of the speed of sound (which quadratically affects the power density) favors lower cesium values for maximizing the power density.
The tabulated data is helpful in quantifying potential ranges of the power density in the current case of cesium seed and air oxidizer. Considering the five selected seed levels (0.0625%, 0.25%, 1%, 4%, and 16%); the best obtained power density is 1,139.332 MW/m3 (at 4% cesium and 0.0625 atm); and the worst obtained power density is 23.854 MW/m3 (at 0.0625% cesium and 16 atm). At an atmospheric pressure, a promising power density of 362.806 MW/m3 is attainable with 4% cesium, and an attractive power density of 298.752 MW/m3 is attainable with only 1% cesium. Even with 0.25% cesium, a power density of 177.106 MW/m3 can be achieved at atmospheric combustion. These are favorably intense power densities, and all of them exceed well our voluntary threshold criterion of 100 MW/m3; which we found to require a minute amount of cesium seed (at 1 atm) that is not more than 0.08% Cs (at which ).
3.2. Potassium Seed and Air Oxidizer
The second set of results corresponds to the condition of using potassium vapor as the ionizable gas, and using air as the oxidizer for the hydrogen combustion. Thus, compared to the previous set of results in the preceding subsection, the only change made here is changing the seed type from cesium to potassium.
Before presenting the results of this change, it is useful to mention here that due to the higher ionization energy of potassium compared to cesium; potassium is harder to lose its valence electron in its outermost orbital (4s1) [242,243,244] upon heating compared to cesium, whose outermost valence electron is in (6s1) [245,246,247]. Therefore, it is expected that this change is accompanied by a drop in the H2MHD performance, primarily because of a decline in the electric conductivity. However, due to the nonlinearity of the problem and the present influence from other factors (particularly the speed of sound), the exact effect of this change in the seed type is not easy to predict analytically. Thus, our computational modeling becomes valuable in understanding quantitatively and qualitatively the implications of this single change.
In Table 9, we provide our computed thermochemical characteristics for the seeded gas mixture before ionization. Similar to the case of cesium seeding, the mixture’s gas constant () decreases (and the mixture’s molecular weight increases) as the level of potassium increases. However, this decrease in the case of potassium additive is much weaker than in the case of cesium additive due to the weaker difference in the molecular weight between potassium (K) and either molecular nitrogen (N2) or water vapor (H2O). One mole of potassium (K) is only 1.396 times heavier than one mole of molecular nitrogen (N2), and 2.170 times heavier than one mole of water (H2O).
As a reference; the molecular weight of the combustion products without any seeding (34.710170% H2O and 65.289830% N2 by mole) is 24.54304 kg/kmol; the unseeded-mixture’s gas constant is 338.7707 J/(kg.K); the unseeded-mixture’s specific heat ratio is 1.243900; and the unseeded-mixture’s speed of sound (at 2,300 K) is 984.486 m/s.
Figure 4 shows how the electric conductivity of the hydrogen plasma monotonically and nonlinearly drops as the total pre-ionization absolute pressure increases. This is qualitatively similar to what was observed when cesium was the additive seed. Also, the existence of a peak electric conductivity at a certain level of potassium seed is similar to what was observed in the case of cesium. This potassium level that maximizes the electric conductivity is again (as was the case in the cesium case) approximately near 6%. It is noticeable that the electric conductivity (or any given level of seeding) dropped strongly when the seed is changed from cesium to potassium. For example, the maximum obtained electric conductivity in the case of cesium was 55.0610 S/m (at and 0.0625 atm) is 2.55 times the maximum obtained electric conductivity in the case of potassium, which is 21.6201 S/m (at and 0.0625 atm).
Table 10 lists the numerical values of the plasma electric conductivity as visualized in the previous figure. We also add in the table the electric conductivity values at a pre-ionization cesium mole fraction of , which approximately corresponds to the maximized electric conductivity for this case (air-hydrogen combustion plasma with potassium seed).
Considering the five selected seed levels (0.0625%, 0.25%, 1%, 4%, and 16%), the highest obtained electric conductivity is (at and ). At the higher (and the same total pressure of 0.0625 atm), the electric conductivity is slightly lower, with a value of 19.7671 S/m; while at the lower (and the same total pressure of 0.0625 atm), the electric conductivity is mildly lower, with a value of 16.0343 S/m. If we take a total pressure of 1 atm (atmospheric MHD channel) as a reference, one can see that the electric conductivity is restricted to 6 S/m.
The ideal volumetric power densities () for the current H2MHD case of potassium seeding and air oxidizer are visualized in Figure 5, and listed in Table 11. We also add in the table the power density values at a pre-ionization cesium mole fraction of , which approximately corresponds to the maximized power density for this case (air-hydrogen combustion plasma with potassium seed).
Unlike the case of cesium seeding, the peak power density with potassium seeding occurs near a seed level of 5% (not 3%), which is close to the potassium seeding level that maximizes the electric conductivity. This similarity of the potassium seed level () that maximizes the electric conductivity and the one that maximizes the power density is related to the near-neutral influence of the seed level on the speed of sound for the case of potassium seed (much weaker influence than the case of cesium seed). A nonlinear monotonic decline in the power density () as the total pressure () increases is noted for any potassium level, and this behavior resembles the one found earlier for the case of cesium seeding.
The power density with potassium seeding is clearly smaller than the one with cesium seeding (when other settings are kept the same). For example; considering the five selected seed levels (0.0625%, 0.25%, 1%, 4%, and 16%), the largest obtained power density at 1 atm in the case of potassium seeding is 141.808 MW/m3 (with ). This is 2.56 times the power density at 1 atm and , which was 362.806 MW/m3. Although potassium seeding is associated with higher speeds of sound compared to cesium seeding, this small advantage for potassium seeding is largely counteracted by the big penalty in the electric conductivity due to changing the seed vapor from cesium to potassium.
Despite the drop in the power density in the case of potassium seeding, the power density can still exceed 100 MW/m3 at 1 atm, with as small potassium levels as 1%. Thus, the H2MHD concept is still viable.
3.3. Potassium Seed and Oxygen Oxidizer
The third set of results corresponds to the condition of using potassium vapor as the ionizable gas, and using pure oxygen as the oxidizer for the hydrogen combustion. Thus, compared to the previous set of results in the preceding subsection, the only change made here is changing the oxidizer type from air (oxygen-nitrogen mixture) to pure oxygen.
Before presenting the results of this change, it is useful to mention here that due to the absence of nitrogen from the combustion products, hydrogen combustion results in pure water vapor (H2O). Water vapor has a relatively low molecular weight and thus has a relatively high specific gas constant. Therefore, the speed of sound in the current case of oxy-combustion of hydrogen is higher than the speed of sound in the previous case of air-combustion of hydrogen (for the same level of potassium seed). Therefore, it is expected that the change of the oxidizer (from air to oxygen) improves the speed of sound, and thus the plasma speed (given its fixed relation to the speed of sound in our study). It is thus the change in the electric conductivity that determines how eventually the power density is affected by the change of the oxidizer (from air to oxygen). This is difficult to predict without numerical simulations as done in our study. This emphasizes the value and contribution made by our study to the field of MHD power generation, through quantitatively and qualitatively investigating the influence of the oxidizer on the MHD power generation process.
In Table 12, we provide our computed thermochemical characteristics for the seeded gas mixture before ionization. As mentioned earlier, the specific gas constant and the speed of sound in the current case of oxy-hydrogen combustion are higher than their values in the previous case of air-hydrogen combustion. For example, with 1% potassium seed; the speed of sound with oxy-hydrogen combustion (1,114.801 m/s) is 1.135 times the speed of sound with air-hydrogen combustion (982.178 m/s) with the same level of potassium seeding. Due to the larger molecular weight of potassium compared to water waver; the more the added potassium, the higher the mixture’s molecular weight and thus the lower the mixture’s gas constant and the lower the speed of sound in that mixture of water vapor and potassium vapor. The mixture’s specific gas constant () increases as the potassium level increases, but the decrease in the mixture’s gas constant () is stronger; and thus, ultimately the speed of sound decreases when the potassium level increases.
Figure 6 shows the profiles of the electric conductivity of the hydrogen plasma. The monotonic and nonlinear drop as the total pre-ionization absolute pressure increases is retained, similar to the previous case of air-hydrogen combustion. However, there are two remarkable changes that can be observed from the figure when compared to its counterpart in the previous subsection of air-hydrogen combustion (with the same potassium seeding).
The first change worthy of attention is the overall suppression of the electric conductivity. This can be attributed to the larger effective electron-neutral momentum transfer collision cross-section for water vapor compared to molecular nitrogen [248,249,250,251]. Thus, when the molecular nitrogen in the combustion products is replaced with water vapor, the electrons mobility is retarded, and this suppresses the electric conductivity of the plasma.
The second change worthy of attention is that now with oxy-hydrogen combustion, the electric conductivity with 16% potassium is larger than the electric conductivity with 4% potassium. In the previous case of air-hydrogen combustion, the electric conductivity with 16% potassium was smaller than the electric conductivity with 4% potassium, due to the detrimental effect of over-seeding. In fact, while the electric conductivity with 16% potassium is larger than the electric conductivity with 4% potassium in the current case of oxy-hydrogen combustion, the peak electric conductivity has been already passed at . This means that this peaking phenomenon of the electric conductivity is actually still present in the current case of oxy-hydrogen plasma. The main difference is that this peak was easy to notice in the previous electric conductivity figure corresponding to air-hydrogen plasma with potassium seeding (in the previous subsection) because the potassium mole fraction () that maximized the electric conductivity was closer to the intermediate value of 4% than the terminal value of 16%. Changing the oxidizer from air to oxygen causes this particular () of maximized electric conductivity () to shift to a larger position, becoming closer to the terminal value of 16% (but below it; located nearly at ). Despite the gain in the electric conductivity when the potassium seed mole fraction () is increased from 4% to 16% (or 13%), the gain is too small to justify the need for exceeding the seed level beyond 4%.
Table 13 lists the numerical values of the plasma electric conductivity as visualized in the previous figure. We also add in the table the electric conductivity values at a pre-ionization potassium mole fraction of , which approximately corresponds to the maximized electric conductivity for this case (oxy-hydrogen combustion plasma with potassium seed).
Considering the five selected seed levels (0.0625%, 0.25%, 1%, 4%, and 16%), the highest obtained electric conductivity is (at and ). At the lower (and the same total pressure of 0.0625 atm), the electric conductivity is mildly lower, with a value of 13.9154 S/m. If we take a total pressure of 1 atm as a reference, one can see that the electric conductivity is below 5 S/m (the approximate electric conductivity of seawater) regardless of the seeding level.
The ideal volumetric power densities () for the current H2MHD case of potassium seeding and oxygen oxidizer are visualized in Figure 7, and listed in Table 14. We also add in the table the power density values at a pre-ionization cesium mole fraction of , which approximately corresponds to the maximized power density for this case (oxy-hydrogen combustion plasma with potassium seed).
The electric conductivity () at a potassium seed level () was found to be larger than the electric conductivity at (). Similarly, the volumetric power density () at a potassium seed level () is larger than the power density at (). However; because the speed of sound (and thus the plasma speed) at () is larger than its value at (), the gap in () is diminished when the seed levels of 4% and 16% are compared.
When comparing the range of () here with those in the previous subsection (air-combustion instead of oxy-combustion); we notice that although the power density dropped, this drop is not large. For example, at 1 atm and 4% potassium, the power density here with oxy-combustion is 111.573 MW/m3, while it was 141.808 MW/m3 in the previous case of air-combustion. The difference (30.2350 MW/m3) is 23.9% of the average of both values (126.6905 MW/m3).
For exceeding the threshold power density of 100 MW/m3, the potassium seed level should not be below 3% (at which we found that and ; thus, )
3.4. Cesium Seed and Oxygen Oxidizer
The fourth (and final) set of results corresponds to the condition of using cesium vapor as the ionizable gas, and using pure oxygen as the oxidizer for the hydrogen combustion. Thus, compared to the previous set of results in the preceding subsection, the only change made here is changing the seed type from potassium to cesium.
In Table 15, we provide our computed thermochemical characteristics for the seeded gas mixture before ionization. The speed of sound drops faster with the cesium fraction compared to the previous case of potassium seeding, due to the large influence of cesium on the mixture’s gas constant compared to potassium; this is because the cesium atom is 3.399 times heavier than the potassium atom. For example; at the same mole fraction of 4%, the speed of sound in the case of cesium seeding is 1,002.552 m/s, which was larger (1,097.826 m/s) in the case of potassium seeding. For comparison purposes, the speed of sound in pure water vapor (at 2,300 K) is 1,120.682 m/s. Thus, introducing a fraction of 4% cesium vapor causes a relative drop in this original speed of sound (1,120.682 m/s) by 118.130 m/s or 10.54%. On the other hand, introducing a fraction of 4% potassium vapor causes a relative drop in the original speed of sound (1,120.682 m/s) by only 22.856 m/s or 2.04%.
In addition, it may be useful to add that for unseeded water vapor (H2O), the specific gas constant is 461.5223 J/(kg.K), and the specific heat ratio is 1.183162.
Figure 8 shows how the variation of the electric conductivity of the hydrogen plasma with the total absolute pressure at the five selected cesium levels. The variations show a monotonical nonlinear drop as observed in all previous cases (the three preceding subsections). However, compared to the previous subsection particularly, the electric conductivity is largely boosted here after replacing the seed from potassium (the previous subsection) to cesium (the current subsection). For example, at 1 atm and , the electric conductivity () here is 11.0877 S/m. But in the previous case, at 1 atm and , this electric conductivity was 3.7030 S/m. The ratio of the two values of () is 2.99.
Also, as in the previous set of results (oxy-hydrogen combustion with potassium seeding), the seeding level at which the electric conductivity is maximized is larger than that level in the case of air-hydrogen combustion. That seeding level of maximum () is approximately 13% in the current case of oxy-hydrogen combustion with cesium seeding (while it was near 6% in the case of air-hydrogen combustion with cesium seeding).
Table 16 lists the numerical values of the plasma electric conductivity as visualized in the previous figure. We also add in the table the electric conductivity values at a pre-ionization cesium mole fraction of , which approximately corresponds to the maximized electric conductivity for this case (oxy-hydrogen combustion plasma with cesium seed).
Considering the five selected seed levels (0.0625%, 0.25%, 1%, 4%, and 16%), the highest obtained electric conductivity is (at and ). At the lower (and the same total pressure of 0.0625 atm), the electric conductivity is mildly lower, with a value of 37.7620 S/m (thus, 13.36% of the value of 43.5831 S/m at 16% cesium is lost). If we take a total pressure of 1 atm as a reference, an electric conductivity of 10 S/m is achievable with a cesium mole fraction of 3% (at which the electric conductivity is 10.2333 S/m).
The ideal volumetric power densities () for the current H2MHD case of cesium seeding and oxygen oxidizer are visualized in Figure 9, and listed in Table 17. We also add in the table the power density values at a pre-ionization cesium mole fraction of , which approximately corresponds to the maximized power density for this case (oxy-hydrogen combustion plasma with cesium seed).
Like the case of cesium seeding with air-hydrogen combustion, but unlike the previous case of potassium seeding and oxy-hydrogen combustion; the power density here with 4% Cs is larger than the power density with 16% seed. This is a combined effect of how the electric conductivity () and the speed of sound () respond to changes in the cesium mole fraction (); which is different from their responses to changes in the potassium mole fraction ().
The power density with cesium seeding (the current subsection) is clearly larger than the one with potassium seeding (the previous subsection).
A power density of 100 MW/m3 or more is easily attainable at 1 atm, requiring a small mole fraction of cesium seed such as 0.25% only. Even with , we obtain .
4. Conclusions
In the current study, we reported novel results about our proposed concept of hydrogen magnetohydrodynamic (H2MHD) power generation, particularly results about potential volumetric electric power densities under different operational conditions. We forecast the performance of a Mach-two supersonic channel, operating with hydrogen-combustion plasma at a uniform temperature of 2,300 K. The influence of the pressure, seed level, seed type, and oxidizer type was presented graphically and numerically.
The following findings can be stated:
- Hydrogen magnetohydrodynamic (H2MHD) direct power extraction is an innovative technology for large-scale commercial electricity generation. It has a major environmental advantage of zero greenhouse gas (GHG) emissions, unlike any fossil hydrocarbons.
- H2MHD generators permit concentrated power generation, with theoretical power densities as high as 300 MW/m3 under a controlled condition of 1 atm and 1% cesium seeding (mole fraction), while using air as a conventional oxidizer.
- Using cesium vapor as a seeding alkali metal for producing free electrons (as the main charge carriers in the plasma) is highly advantageous compared to potassium. The gain can be more than doubling the output power.
- Using air as an oxidizer is preferred to using oxygen in terms of the plasma electric conductivity and the output power. However, it should be noted that this preference for air as an oxidizer does not mean preferring an air-combustion process over an oxy-combustion process. The reason is that we here assumed that the temperature remains the same when the oxidizer is changed from air to oxygen. However, practically oxy-combustion leads to elevated temperatures [252,253,254], which strongly boosts the electric plasma conductivity, and thus the electric power output. Therefore, favoring air as an oxidizer is an outcome we found based on its influence on the chemical composition of the combustion products only, while factoring out its influence on the temperature of these combustion products. When the influence of the temperature due to oxy-fuel combustion is factored in, then the use of pure oxygen becomes preferred, because the large gain in the electric conductivity due to the increase in temperature is more important than the small decline in the electric conductivity due to the altered chemical composition of the plasma.
- Increasing the total static pressure monotonically decreases the electric conductivity and thus decreases the power density and performance of the H2MHD generator.
- Increasing the alkali metal vapor seed amount monotonically increases the mixture’s molecular weight, and thus monotonically decreases the mixture’s specific gas density and in turn monotonically decreases the speed of sound in the mixture.
- Increasing the alkali metal vapor seed amount increases the electric conductivity up to a certain level, where a peak electric conductivity is reached and then it declines with further seeding.
- With air-hydrogen combustion and cesium seeding; the electric conductivity is maximized at a pre-ionization seeding mole fraction near 6%, while the power density is maximized (with a fixed Mach number) at a lower mole fraction near 3%.
- With air-hydrogen combustion and potassium seeding; the electric conductivity is maximized at a pre-ionization seeding mole fraction near 6%, while the power density is maximized (with a fixed Mach number) at a lower mole fraction near 5%.
- With oxy-hydrogen combustion and potassium seeding; the electric conductivity is maximized at a pre-ionization seeding mole fraction near 13%, while the power density is maximized (with a fixed Mach number) at a lower mole fraction near 9%.
- With oxy-hydrogen combustion and cesium seeding; the electric conductivity is maximized at a pre-ionization seeding mole fraction near 13%, while the power density is maximized (with a fixed Mach number) at a lower mole fraction near 5%.
Supplementary Materials
The following supporting information can be downloaded at the website of this paper posted on Preprints.org.
Funding
Not applicable (this research received no funding).
Data Availability Statement
Supplementary data files related to the data reported in this research article are provided as four computer files, corresponding to the four main cases presented here (air-hydrogen combustion with cesium seeding, air-hydrogen combustion with potassium seeding, oxy-hydrogen combustion with potassium seeding, and oxy-hydrogen combustion with cesium seeding). Respectively, these data files are: airCs.csv, airK.csv, oxyK.csv, and oxyCs.csv.
Conflicts of Interest
The author declares that they have no known competing financial interests or personal relationships that could have appeared to influence the work reported in this paper.
References
- D. Field, The most popular element in the universe, Phys. World 8 (1995) 24. [CrossRef]
- V.V. Goncharuk, D.K. Goncharuk, Water is Everywhere. It Holds Everything, Even a Key to Understanding the Universe. D. I. Mendeleev’s Law is the Prototype of the Universe Constitution, J. Water Chem. Technol. 41 (2019) 341–346. [CrossRef]
- U. Barayeu, T. Sawa, M. Nishida, F.-Y. Wei, H. Motohashi, T. Akaike, Supersulfide biology and translational medicine for disease control, British Journal of Pharmacology n/a (n.d.). [CrossRef]
- R.E. Krebs, The History and Use of Our Earth’s Chemical Elements: A Reference Guide, Greenwood Press, Westport, Connecticut, USA, 2006. Available online: https://books.google.com.om/books?id=D7LOEAAAQBAJ (accessed on 4 April 2025).
- Y.H. Ma, Palladium Membranes for Hydrogen Separation, in: K.-V. Peinemann, S.P. Nunes (Eds.), Membranes for Energy Conversion, John Wiley & Sons, Weinheim, Germany, 2008: pp. 245–261. Available online: https://books.google.com.om/books?id=KCTyy64_IO8C (accessed on 30 March 2025).
- O.A. Marzouk, Performance analysis of shell-and-tube dehydrogenation module, International Journal of Energy Research 41 (2017) 604–610. [CrossRef]
- M. Sarkarzadeh, M. Farsi, M.R. Rahimpour, Modeling and optimization of an industrial hydrogen unit in a crude oil refinery, International Journal of Hydrogen Energy 44 (2019) 10415–10426. [CrossRef]
- I. Moradpoor, S. Syri, A. Santasalo-Aarnio, Green hydrogen production for oil refining – Finnish case, Renewable and Sustainable Energy Reviews 175 (2023) 113159. [CrossRef]
- J.J. Alves, G.P. Towler, Analysis of Refinery Hydrogen Distribution Systems, Ind. Eng. Chem. Res. 41 (2002) 5759–5769. [CrossRef]
- Y.H. Li, S.S. Choi, S. Rajakaruna, An analysis of the control and operation of a solid oxide fuel-cell power plant in an isolated system, IEEE Transactions on Energy Conversion 20 (2005) 381–387. [CrossRef]
- O.A. Marzouk, Compilation of Smart Cities Attributes and Quantitative Identification of Mismatch in Rankings, Journal of Engineering 2022 (2022) 5981551. [CrossRef]
- L. Sun, G. Wu, Y. Xue, J. Shen, D. Li, K.Y. Lee, Coordinated Control Strategies for Fuel Cell Power Plant in a Microgrid, IEEE Transactions on Energy Conversion 33 (2018) 1–9. [CrossRef]
- S. Sun, Q. Jiang, D. Zhao, T. Cao, H. Sha, C. Zhang, H. Song, Z. Da, Ammonia as hydrogen carrier: Advances in ammonia decomposition catalysts for promising hydrogen production, Renewable and Sustainable Energy Reviews 169 (2022) 112918. [CrossRef]
- A. Klerke, C.H. Christensen, J.K. Nørskov, T. Vegge, Ammonia for hydrogen storage: challenges and opportunities, J. Mater. Chem. 18 (2008) 2304–2310. [CrossRef]
- O.A. Marzouk, Levelized cost of green hydrogen (LCOH) in the Sultanate of Oman using H2A-Lite with polymer electrolyte membrane (PEM) electrolyzers powered by solar photovoltaic (PV) electricity, E3S Web of Conferences 469 (2023) 00101. [CrossRef]
- J. Amorim, G. Baravian, G. Sultan, Absolute density measurements of ammonia synthetized in N2–H2 mixture discharges, Applied Physics Letters 68 (1996) 1915–1917. [CrossRef]
- M. Reuß, P. Dimos, A. Léon, T. Grube, M. Robinius, D. Stolten, Hydrogen Road Transport Analysis in the Energy System: A Case Study for Germany through 2050, Energies 14 (2021) 3166. [CrossRef]
- O.A. Marzouk, Toward More Sustainable Transportation: Green Vehicle Metrics for 2023 and 2024 Model Years, in: A.K. Nagar, D.S. Jat, D.K. Mishra, A. Joshi (Eds.), Intelligent Sustainable Systems, Springer Nature Singapore, Singapore, 2024: pp. 261–272. [CrossRef]
- G.D. Marin, G.F. Naterer, K. Gabriel, Rail transportation by hydrogen vs. electrification – Case study for Ontario, Canada, II: Energy supply and distribution, International Journal of Hydrogen Energy 35 (2010) 6097–6107. [CrossRef]
- O.A. Marzouk, Growth in the Worldwide Stock of E-Mobility Vehicles (by Technology and by Transport Mode) and the Worldwide Stock of Hydrogen Refueling Stations and Electric Charging Points between 2020 and 2022, in: Construction Materials and Their Processing, Trans Tech Publications Ltd., 2023: pp. 89–96. [CrossRef]
- T. Galimova, M. Fasihi, D. Bogdanov, C. Breyer, Impact of international transportation chains on cost of green e-hydrogen: Global cost of hydrogen and consequences for Germany and Finland, Applied Energy 347 (2023) 121369. [CrossRef]
- O.A. Marzouk, Recommended LEED-Compliant Cars, SUVs, Vans, Pickup Trucks, Station Wagons, and Two Seaters for Smart Cities Based on the Environmental Damage Index (EDX) and Green Score, in: M. Ben Ahmed, A.A. Boudhir, R. El Meouche, İ.R. Karaș (Eds.), Innovations in Smart Cities Applications Volume 7, Springer Nature Switzerland, Cham, Switzerland, 2024: pp. 123–135. [CrossRef]
- P. Galindo Cifre, O. Badr, Renewable hydrogen utilisation for the production of methanol, Energy Conversion and Management 48 (2007) 519–527. [CrossRef]
- N. Monnerie, P.G. Gan, M. Roeb, C. Sattler, Methanol production using hydrogen from concentrated solar energy, International Journal of Hydrogen Energy 45 (2020) 26117–26125. [CrossRef]
- F. Dalena, A. Senatore, A. Marino, A. Gordano, M. Basile, A. Basile, Chapter 1 - Methanol Production and Applications: An Overview, in: A. Basile, F. Dalena (Eds.), Methanol, Elsevier, 2018: pp. 3–28. [CrossRef]
- Y. Elmeknassi, W. He, A. Adam, J. Deng, Z. Lou, C. Wang, L. Chen, Performance Analysis of Hydrogen-Powered Gas Turbine Engines: A Parametric Study, in: 2024 7th International Conference on Renewable Energy and Power Engineering (REPE), 2024: pp. 379–385. [CrossRef]
- P. Chiesa, G. Lozza, L. Mazzocchi, Using Hydrogen as Gas Turbine Fuel, Journal of Engineering for Gas Turbines and Power 127 (2005) 73–80. [CrossRef]
- E. Stefan, B. Talic, Y. Larring, A. Gruber, T.A. Peters, Materials challenges in hydrogen-fuelled gas turbines, International Materials Reviews (2022). Available online: https://journals.sagepub.com/doi/abs/10.1080/09506608.2021.1981706 (accessed on 30 March 2025).
- Z. Song, J. Zhao, Research on the Integrated Development of Nuclear Energy and Aviation Industry under the Background of “Dual Carbon” Goals, E3S Web Conf. 573 (2024) 03008. [CrossRef]
- O.A. Marzouk, Subcritical and supercritical Rankine steam cycles, under elevated temperatures up to 900°C and absolute pressures up to 400 bara, Advances in Mechanical Engineering 16 (2024) 1–18. [CrossRef]
- L.S. Pacheco, L.E. Hernández-Gutiérrez, Advancing Direct Air Capture Technologies: From Carbon Removal to Sustainable Aviation Fuels, Copernicus Meetings, 2025. [CrossRef]
- R. Gao, C. Zhang, K.-W. Jun, S.K. Kim, H.-G. Park, T. Zhao, L. Wang, H. Wan, G. Guan, Transformation of CO2 into liquid fuels and synthetic natural gas using green hydrogen: A comparative analysis, Fuel 291 (2021) 120111. [CrossRef]
- Y. Gao, C. Jausseme, Z. Huang, T. Yang, Hydrogen-Powered Aircraft: Hydrogen–electric hybrid propulsion for aviation, IEEE Electrification Magazine 10 (2022) 17–26. [CrossRef]
- P. Gunasekar, S. Manigandan, P.K. T.R, Hydrogen as the futuristic fuel for the aviation and aerospace industry – review, Aircraft Engineering and Aerospace Technology 93 (2020) 410–416. [CrossRef]
- O.A. Marzouk, A two-step computational aeroacoustics method applied to high-speed flows, Noise Control Engineering Journal 56 (2008) 396. [CrossRef]
- R.V.V. Petrescu, A. Machín, K. Fontánez, J.C. Arango, F.M. Márquez, F.I.T. Petrescu, Hydrogen for aircraft power and propulsion, International Journal of Hydrogen Energy 45 (2020) 20740–20764. [CrossRef]
- A. Contreras, S. Yiğit, K. Özay, T.N. Veziroğlu, Hydrogen as aviation fuel: A comparison with hydrocarbon fuels, International Journal of Hydrogen Energy 22 (1997) 1053–1060. [CrossRef]
- A. Rukini, M.A. Rhamdhani, G.A. Brooks, A. Van den Bulck, Metals Production and Metal Oxides Reduction Using Hydrogen: A Review, J. Sustain. Metall. 8 (2022) 1–24. [CrossRef]
- A. Boretti, The perspective of hydrogen direct reduction of iron, Journal of Cleaner Production 429 (2023) 139585. [CrossRef]
- A. Heidari, N. Niknahad, M. Iljana, T. Fabritius, A Review on the Kinetics of Iron Ore Reduction by Hydrogen, Materials 14 (2021) 7540. [CrossRef]
- D. Spreitzer, J. Schenk, Reduction of Iron Oxides with Hydrogen—A Review, Steel Research International 90 (2019) 1900108. [CrossRef]
- T. Ho, V. Karri, Basic tuning of hydrogen powered car and artificial intelligent prediction of hydrogen engine characteristics, International Journal of Hydrogen Energy 35 (2010) 10004–10012. [CrossRef]
- K. Wróbel, J. Wróbel, W. Tokarz, J. Lach, K. Podsadni, A. Czerwiński, Hydrogen Internal Combustion Engine Vehicles: A Review, Energies 15 (2022) 8937. [CrossRef]
- M.R. Swain, J.M. Pappas, R.R. Adt, W.J.D. Escher, Hydrogen-Fueled Automotive Engine Experimental Testing to Provide an Initial Design-Data Base, in: SAE International Congress and Exposition, SAE International, Warrendale, Pennsylvania, USA, 1981: p. 810350. [CrossRef]
- M. Suban, J. Tušek, M. Uran, Use of hydrogen in welding engineering in former times and today, Journal of Materials Processing Technology 119 (2001) 193–198. [CrossRef]
- Q. Zhao, H. Li, J. Lv, X. Liu, F. Zhang, S. Jiang, L. Ma, C. Wang, J. Ni, G. Peng, Adhesive-free bonding fiber optic Fabry–Perot pressure sensor based on oxy-hydrogen flame welding and spiral tube, Optics Communications 476 (2020) 126307. [CrossRef]
- J. Attah, L. Mohammed, A. Nyamful, P. Donkor, A. Asamoah, M.N. Zainudeen, J. Adjah, C.K. Klutse, S.A. Birikorang, F. Agyemang, O. Gyampo, Oxy-hydrogen gas as a sustainable fuel for the welding industry: Alternative for oxy-acetylene gas, Cleaner Energy Systems 9 (2024) 100160. [CrossRef]
- A. Keçebaş, M. Kayfeci, Chapter 1 - Hydrogen properties, in: F. Calise, M.D. D’Accadia, M. Santarelli, A. Lanzini, D. Ferrero (Eds.), Solar Hydrogen Production, Academic Press, 2019: pp. 3–29. [CrossRef]
- R.R. Allen, Hydrogenation, Journal of the American Oil Chemists’ Society 58 (1981) 166–169. [CrossRef]
- D. Jovanovic, R. Radovic, L. Mares, M. Stankovic, B. Markovic, Nickel hydrogenation catalyst for tallow hydrogenation and for the selective hydrogenation of sunflower seed oil and soybean oil, Catalysis Today 43 (1998) 21–28. [CrossRef]
- I.D. Anikina, V.V. Sergeyev, N.T. Amosov, M.G. Luchko, Use of heat pumps in turbogenerator hydrogen cooling systems at thermal power plant, International Journal of Hydrogen Energy 42 (2017) 636–642. [CrossRef]
- S. Hara, Y. Iwami, R. Kawasaki, T. Matsumoto, Y. Shirai, M. Shiotsu, H. Kobayashi, Y. Naruo, S. Nonaka, Y. Inatani, M. Ishii, S. Yoshinaga, T. Tanaka, Development of Liquid Hydrogen Cooling System for a Rotor of Superconducting Generator, IEEE Transactions on Applied Superconductivity 31 (2021) 1–5. [CrossRef]
- D.S. Snell, The hydrogen-cooled turbine generator, Electrical Engineering 59 (1940) 35–50. [CrossRef]
- R.F. Gray, L. Montgomery, R. Nelson, J. Pipkin, S. Joki-Korpel, F. Caguiat, Designing the cooling systems for the world’s most powerful turbogenerator - Olkiluoto unit 3, in: 2006 IEEE Power Engineering Society General Meeting, 2006: p. 5 pp.-. [CrossRef]
- O.A. Marzouk, Expectations for the Role of Hydrogen and Its Derivatives in Different Sectors through Analysis of the Four Energy Scenarios: IEA-STEPS, IEA-NZE, IRENA-PES, and IRENA-1.5°C, Energies 17 (2024) 646. [CrossRef]
- K. Espegren, S. Damman, P. Pisciella, I. Graabak, A. Tomasgard, The role of hydrogen in the transition from a petroleum economy to a low-carbon society, International Journal of Hydrogen Energy 46 (2021) 23125–23138. [CrossRef]
- O.A. Marzouk, Portrait of the Decarbonization and Renewables Penetration in Oman’s Energy Mix, Motivated by Oman’s National Green Hydrogen Plan, Energies 17 (2024) 4769. [CrossRef]
- O.A. Marzouk, Radiant Heat Transfer in Nitrogen-Free Combustion Environments, International Journal of Nonlinear Sciences and Numerical Simulation 19 (2018) 175–188. [CrossRef]
- E.D. Frank, A. Elgowainy, K. Reddi, A. Bafana, Life-cycle analysis of greenhouse gas emissions from hydrogen delivery: A cost-guided analysis, International Journal of Hydrogen Energy 46 (2021) 22670–22683. [CrossRef]
- O.A. Marzouk, Zero Carbon Ready Metrics for a Single-Family Home in the Sultanate of Oman Based on EDGE Certification System for Green Buildings, Sustainability 15 (2023) 13856. [CrossRef]
- T. Xie, P. Wang, Analysis of NO formation in counter-flow premixed hydrogen-air flame, Trans. Can. Soc. Mech. Eng. 37 (2013) 851–859. [CrossRef]
- O.A. Marzouk, Tilt sensitivity for a scalable one-hectare photovoltaic power plant composed of parallel racks in Muscat, Cogent Engineering 9 (2022) 2029243. [CrossRef]
- M. R. Shaner, H. A. Atwater, N. S. Lewis, E. W. McFarland, A comparative technoeconomic analysis of renewable hydrogen production using solar energy, Energy & Environmental Science 9 (2016) 2354–2371. [CrossRef]
- O.A. Marzouk, Lookup Tables for Power Generation Performance of Photovoltaic Systems Covering 40 Geographic Locations (Wilayats) in the Sultanate of Oman, with and without Solar Tracking, and General Perspectives about Solar Irradiation, Sustainability 13 (2021) 13209. [CrossRef]
- A. Mostafaeipour, M. Khayyami, A. Sedaghat, K. Mohammadi, S. Shamshirband, M.-A. Sehati, E. Gorakifard, Evaluating the wind energy potential for hydrogen production: A case study, International Journal of Hydrogen Energy 41 (2016) 6200–6210. [CrossRef]
- O.A. Marzouk, Wind Speed Weibull Model Identification in Oman, and Computed Normalized Annual Energy Production (NAEP) From Wind Turbines Based on Data From Weather Stations, Engineering Reports 7 (2025) e70089. [CrossRef]
- M. Rezaei, N. Naghdi-Khozani, N. Jafari, Wind energy utilization for hydrogen production in an underdeveloped country: An economic investigation, Renewable Energy 147 (2020) 1044–1057. [CrossRef]
- O.A. Marzouk, Energy Generation Intensity (EGI) of Solar Updraft Tower (SUT) Power Plants Relative to CSP Plants and PV Power Plants Using the New Energy Simulator “Aladdin,” Energies 17 (2024) 405. [CrossRef]
- O.A. Marzouk, Summary of the 2023 (1st edition) Report of TCEP (Tracking Clean Energy Progress) by the International Energy Agency (IEA), and Proposed Process for Computing a Single Aggregate Rating, E3S Web of Conferences 601 (2025) 00048. [CrossRef]
- R.R. Beswick, A.M. Oliveira, Y. Yan, Does the Green Hydrogen Economy Have a Water Problem?, ACS Energy Lett. 6 (2021) 3167–3169. [CrossRef]
- O.A. Marzouk, Chronologically-Ordered Quantitative Global Targets for the Energy-Emissions-Climate Nexus, from 2021 to 2050, in: 2022 International Conference on Environmental Science and Green Energy (ICESGE), IEEE [Institute of Electrical and Electronics Engineers], Virtual, 2022: pp. 1–6. [CrossRef]
- O.A. Marzouk, Dataset of total emissivity for CO2, H2O, and H2O-CO2 mixtures; over a temperature range of 300-2900 K and a pressure-pathlength range of 0.01-50 atm.m, Data in Brief (2025) 111428. [CrossRef]
- O.A. Marzouk, 2030 Ambitions for Hydrogen, Clean Hydrogen, and Green Hydrogen, Engineering Proceedings 56 (2023) 14. [CrossRef]
- W. George Davies, S. Babamohammadi, Y. Yang, S. Masoudi Soltani, The rise of the machines: A state-of-the-art technical review on process modelling and machine learning within hydrogen production with carbon capture, Gas Science and Engineering 118 (2023) 205104. [CrossRef]
- M. Riemer, V. Duscha, Carbon capture in blue hydrogen production is not where it is supposed to be - Evaluating the gap between practical experience and literature estimates, Applied Energy 349 (2023) 121622. [CrossRef]
- O.A. Marzouk, Hydrogen Utilization as a Plasma Source for Magnetohydrodynamic Direct Power Extraction (MHD-DPE), IEEE Access 12 (2024) 167088–167107. [CrossRef]
- A. Sigel, H. Sigel, R.K.O. Sigel, eds., The Alkali Metal Ions: Their Role for Life, Springer International Publishing, Cham, 2016. [CrossRef]
- J.W. Akitt, The Alkali and Alkaline Earth Metals, in: J. Mason (Ed.), Multinuclear NMR, Springer US, Boston, MA, 1987: pp. 189–220. [CrossRef]
- J.J. Kennedy, The Alkali Metal Cesium and Some of its Salts., ACS Publications (2002). [CrossRef]
- H.K. Messerle, Magnetohydrodynamic Electrical Power Generation, Wiley, Chichester, England, UK, 1995.
- S.W. Angrist, Direct energy conversion, 4. ed, Allyn and Bacon, Boston, Massachusetts, USA, 1982.
- O.A. Marzouk, Multi-Physics Mathematical Model of Weakly-Ionized Plasma Flows, American Journal of Modern Physics 7 (2018) 87–102. [CrossRef]
- R. Bünde, H. Muntenbruch, J. Raeder, R. Volk, G. Zankl, MHD power generation: selected problems of combustion MHD generators, Springer, Berlin, 1975.
- O.A. Marzouk, Combined Oxy-fuel Magnetohydrodynamic Power Cycle, in: Conference on Energy Challenges in Oman (ECO’2015), DU [Dhofar University], Salalah, Dhofar, Oman, 2015. [CrossRef]
- V.H. Blackman, M.S. Jones Jr., A. Demetriades, MHD power generation studies in rectangular channels, in: Proceedings of the 2nd Symposium on the Engineering Aspects of Magnetohydrodynamics (EAMHD-2), Columbia University Press, New York and London, Philadelphia, Pennsylvania, USA, 1961: pp. 180–210.
- N. Kayukawa, Open-cycle magnetohydrodynamic electrical power generation: a review and future perspectives, Progress in Energy and Combustion Science 30 (2004) 33–60. [CrossRef]
- O.A. Marzouk, Condenser Pressure Influence on Ideal Steam Rankine Power Vapor Cycle using the Python Extension Package Cantera for Thermodynamics, Engineering, Technology & Applied Science Research 14 (2024) 14069–14078. [CrossRef]
- [Westinghouse Advanced Energy Systems Division] WAESD, MHD Advanced Power Train, Westinghouse, Pittsburgh, Pennsylvania, USA, 1985.
- M.E. Nimvari, A. Hadidi, A. Jafarian, N. Garjasi, Analysis of triple combined cycle with MHD generator as a topping cycle, in: The 3rd Conference on Thermal Power Plants, 2011: pp. 1–5. Available online: https://ieeexplore.ieee.org/abstract/document/6576978 (accessed on 31 March 2025).
- L.D. Nichols, Combined Turbine-magnetohydrodynamic Brayton Cycle Power System for Space and Ground Use, NASA [United States National Aeronautics and Space Administration], Cleveland, Ohio, USA, 1971. Available online: https://books.google.com.om/books?id=WiOTIe5zvBkC (accessed on 31 March 2025).
- S.P. Cicconardi, A. Perna, Performance Analysis of Integrated Systems based on MHD Generators, Energy Procedia 45 (2014) 1305–1314. [CrossRef]
- S. Khalili, A. Jafarian Dehkordi, M.H. Giahi, Investigating the effect of channel angle of a subsonic MHD (Magneto-Hydro-Dynamic) generator on optimum efficiency of a triple combined cycle, Energy 85 (2015) 543–555. [CrossRef]
- M.A. Esmaeilzadehazimi, M.H.K. Manesh, B.B. Heleyleh, H.V. Modabbaer, 4E Analysis of Integrated MHD-Combined Cycle, International Journal of Thermodynamics 22 (2019) 219–228. [CrossRef]
- E.M. Murray, Time Fluctuations of Temperature in a Magnetohydrodynamic Plasma, Union Carbide Corporation, Nuclear Division, Oak Ridge, Tennessee, USA, 1972. Available online: https://www.osti.gov/servlets/purl/4722548 (accessed on 4 April 2025).
- B.-S. Park, M. Usman, M. Imran, A. Pesyridis, Review of Organic Rankine Cycle experimental data trends, Energy Conversion and Management 173 (2018) 679–691. [CrossRef]
- Z. Miao, J. Xu, X. Yang, J. Zou, Operation and performance of a low temperature organic Rankine cycle, Applied Thermal Engineering 75 (2015) 1065–1075. [CrossRef]
- Z. He, Y. Zhang, S. Dong, H. Ma, X. Yu, Y. Zhang, X. Ma, N. Deng, Y. Sheng, Thermodynamic analysis of a low-temperature organic Rankine cycle power plant operating at off-design conditions, Applied Thermal Engineering 113 (2017) 937–951. [CrossRef]
- M.A. Esmaeilzadehazimi, M.H. Khoshgoftar Manesh, M. Majidi, M. Nourpour, Evaluation of a Novel Quadruple Combined Cycle With the Magnetohydrodynamic Generator Based on 6E Analysis, Journal of Energy Resources Technology 143 (2021). [CrossRef]
- O.A. Marzouk, Adiabatic Flame Temperatures for Oxy-Methane, Oxy-Hydrogen, Air-Methane, and Air-Hydrogen Stoichiometric Combustion using the NASA CEARUN Tool, GRI-Mech 3.0 Reaction Mechanism, and Cantera Python Package, Engineering, Technology & Applied Science Research 13 (2023) 11437–11444. [CrossRef]
- T. Nabil, M.M. Khairat Dawood, Enabling efficient use of oxy-hydrogen gas (HHO) in selected engineering applications; transportation and sustainable power generation, Journal of Cleaner Production 237 (2019) 117798. [CrossRef]
- J. Paparao, S. Murugan, Oxy-hydrogen gas as an alternative fuel for heat and power generation applications - A review, International Journal of Hydrogen Energy 46 (2021) 37705–37735. [CrossRef]
- [National Center for Biotechnology Information] NCBI, PubChem │ Compound Summary for CID 11430, Potassium Carbonate, (2025). Available online: https://pubchem.ncbi.nlm.nih.gov/compound/11430 (accessed on 31 March 2025).
- N.S. Dixit, N. Venkatramani, V.K. Rohatgi, Measurement of temperature, electrical conductivity and ion density of seeded combustion plasmas, Energy Conversion and Management 27 (1987) 103–109. [CrossRef]
- K.A. Avdeev, V.S. Aksenov, V.S. Ivanov, S.N. Medvedev, S.M. Frolov, F.S. Frolov, I.O. Shamshin, Magnetohydrodynamic effects of heterogeneous spray detonation, Russ. J. Phys. Chem. B 9 (2015) 637–643. [CrossRef]
- K.-T. Lee, S. Gabriela, W.-H. Chen, H.C. Ong, S. Rajendran, K.-Q. Tran, Co-torrefaction and synergistic effect of spent coffee grounds and tea waste for sustainable waste remediation and renewable energy, Renewable Energy 233 (2024) 121181. [CrossRef]
- F. Tepper, A. Murchison, J. Zelenak, Thermophysical Properties of Rubidium and Cesium, in: R.L. Adamczak (Ed.), Proceedings of the USAF Aerospace Fluids and Lubricants Conference, Aeronautical Systems Division, Air Force Systems Command, USA, 1964: pp. 368–387. Available online: https://books.google.com.om/books?id=UWRUAAAAYAAJ (accessed on 31 March 2025).
- Q. Liao, Z. Tan, Numerical investigations of cold gas dynamic spray with a novel convergent-divergent nozzle, AIP Conference Proceedings 1558 (2013) 2333–2336. [CrossRef]
- O.A. Marzouk, The Sod gasdynamics problem as a tool for benchmarking face flux construction in the finite volume method, Scientific African 10 (2020) e00573. [CrossRef]
- O.N. Deshpande, N. Narappanawar, Space optimization through the use of de-laval nozzle and bell nozzle and its theory, in: IAENG Transactions on Engineering Sciences, WORLD SCIENTIFIC, 2016: pp. 432–445. [CrossRef]
- T.N. Kanhukamwe, P.N. Zincume, Global Landscape of Photovoltaic Module Manufacturing: A Systematic Literature Review, in: 2024 IEEE International Conference on Engineering, Technology, and Innovation (ICE/ITMC), 2024: pp. 1–7. [CrossRef]
- O.A. Marzouk, Facilitating Digital Analysis and Exploration in Solar Energy Science and Technology through Free Computer Applications, Engineering Proceedings 31 (2022) 75. [CrossRef]
- O.A. Marzouk, Thermoelectric generators versus photovoltaic solar panels: Power and cost analysis, Edelweiss Applied Science and Technology 8 (2024) 406–428. [CrossRef]
- G. Li, Y. Fan, Q. Li, Y. Zheng, D. Zhao, S. Wang, S. Dong, W. Guo, Y. Tang, A review on micro combustion powered thermoelectric generator: History, state-of-the-art and challenges to commercialization, Renewable and Sustainable Energy Reviews 207 (2025) 114897. [CrossRef]
- J.S. Chundawat, A. Kumar, M. Saini, Applications of institutionstic and dual hesitant fuzzy numbers in the reliability evaluation of turbogenerators in thermal power plants, Int. j. Inf. Tecnol. (2025). [CrossRef]
- O.A. Marzouk, Energy Generation Intensity (EGI) for Parabolic Dish/Engine Concentrated Solar Power in Muscat, Sultanate of Oman, IOP Conference Series: Earth and Environmental Science 1008 (2022) 012013. [CrossRef]
- O.A. Marzouk, A.H. Nayfeh, A Study of the Forces on an Oscillating Cylinder, in: ASME 2007 26th International Conference on Offshore Mechanics and Arctic Engineering (OMAE 2007), ASME [American Society of Mechanical Engineers], San Diego, California, USA, 2009: pp. 741–752. [CrossRef]
- O.A. Marzouk, One-way and two-way couplings of CFD and structural models and application to the wake-body interaction, Applied Mathematical Modelling 35 (2011) 1036–1053. [CrossRef]
- V.P. Panchenko, Preliminary Analysis of the “Sakhalin” World Largest Pulsed MHD Generator, in: 33rd Plasmadynamics and Lasers Conference, AIAA [American Institute of Aeronautics and Astronautics], Maui, Hawaii, USA, 2002: p. AIAA-2002-2147. [CrossRef]
- V.P. Panchenko, 55. Preliminary analysis of the “Sakhalin” world largest pulsed MHD generator, in: 4th Workshop on Magnetoplasma Aerodynamics for Aerospace Applications, Moscow, Russia, 2002: pp. 322–331.
- E.P. Velikhov, V.D. Pismenny, O.G. Matveenko, V.P. Panchenko, A.A. Yakushev, A.V. Pisakin, A.G. Blokh, B.G. Tkachenko, N.M. Sergienko, B.B. Zhukov, E.F. Zhegrov, Yu.P. Babakov, V.A. Polyakov, V.A. Glukhikh, G.Sh. Manukyan, V.A. Krylov, V.A. Vesnin, V.A. Parkhomenko, E.M. Sukharev, Ya.I. Malashko, Pulsed MHD power system “Sakhalin” - The world largest solid propellant fueled MHD generator of 500MWe electric power output, in: 13th International Conference on MHD Electrical Power Generation and High Temperature Technologies, Beijing, China, 1999: pp. 387–398.
- A. Veefkind, J.W.M.A. Houben, J.H. Blom, L.H.T. Rietjens, High-power density experiments in a shock-tunnel MHD generator, AIAA Journal 14 (1976) 1118–1122. [CrossRef]
- A.T. Kirkpatrick, Energy Flows in Engines, (2025). https://www.engr.colostate.edu/~allan/heat_trans/page3/page3.html (accessed March 31 2025).
- H. Hiereth, P. Prenninger, Charging the Internal Combustion Engine, Springer Science & Business Media, Vienna (Wien), Austria, 2007.
- H. Chen, C.H.T. Lee, Parametric Sensitivity Analysis and Design Optimization of an Interior Permanent Magnet Synchronous Motor, IEEE Access 7 (2019) 159918–159929. [CrossRef]
- J. Li, L. Cheng, N. Wan, J. Ma, Y. Hu, J. Wen, Hybrid harvesting of wind and wave energy based on triboelectric-piezoelectric nanogenerators, Sustainable Energy Technologies and Assessments 60 (2023) 103466. [CrossRef]
- X. Zhang, S. Cheng, X. Wang, X. Huang, B.E. Logan, Separator Characteristics for Increasing Performance of Microbial Fuel Cells, Environ. Sci. Technol. 43 (2009) 8456–8461. [CrossRef]
- X. Kong, Y. Sun, L. Li, Y. Li, Z. Yuan, X. Kong, Electricity Generation Comparison of Two-Chamber Microbial Fuel Cells with Different Membranes, in: 2010 4th International Conference on Bioinformatics and Biomedical Engineering, 2010: pp. 1–4. [CrossRef]
- U. Karra, S.S. Manickam, J.R. McCutcheon, N. Patel, B. Li, Power generation and organics removal from wastewater using activated carbon nanofiber (ACNF) microbial fuel cells (MFCs), International Journal of Hydrogen Energy 38 (2013) 1588–1597. [CrossRef]
- C.A. Borghi, A. Massarini, G. Mazzanti, Multidimensional models for the analysis of linear MHD generator channel plasma flows, IEEE Transactions on Plasma Science 20 (1992) 473–476. [CrossRef]
- W. Xue, L. Miao, L. Qie, C. Wang, S. Li, J. Wang, J. Li, Gravimetric and volumetric energy densities of lithium-sulfur batteries, Current Opinion in Electrochemistry 6 (2017) 92–99. [CrossRef]
- T. Zhai, X. Lu, H. Wang, G. Wang, T. Mathis, T. Liu, C. Li, Y. Tong, Y. Li, An Electrochemical Capacitor with Applicable Energy Density of 7.4 Wh/kg at Average Power Density of 3000 W/kg, Nano Lett. 15 (2015) 3189–3194. [CrossRef]
- M. Janovec, V. Babčan, B. Kandera, K. Šajbanová, F. Škultéty, Ľ. Halvoň, Performance and Weight Parameters Calculation for Hydrogen- and Battery-Powered Aircraft Concepts, Aerospace 10 (2023) 482. [CrossRef]
- V.N. Blinov, I.S. Vavilov, V.V. Kositsin, A.I. Lukyanchik, V.I. Ruban, V.V. Shalay, Study of power-to-weight ratio of the electrothermal propulsion system of nanosatellite maneuvering satellite platform, J. Phys.: Conf. Ser. 944 (2018) 012020. [CrossRef]
- O.A. Marzouk, Aerial e-mobility perspective: Anticipated designs and operational capabilities of eVTOL urban air mobility (UAM) aircraft, Edelweiss Applied Science and Technology 9 (2025) 413–442. [CrossRef]
- Y. Ma, S. Karpuk, A. Elham, Conceptual design and comparative study of strut-braced wing and twin-fuselage aircraft configurations with ultra-high aspect ratio wings, Aerospace Science and Technology 121 (2022) 107395. [CrossRef]
- G. Cinar, Y. Cai, I. Chakraborty, D.N. Mavris, Sizing and Optimization of Novel General Aviation Vehicles and Propulsion System Architectures, in: 2018 Aviation Technology, Integration, and Operations Conference, AIAA [American Institute of Aeronautics and Astronautics], Atlanta, Georgia, USA, 2018: p. AIAA 2018-3974. [CrossRef]
- Y. Mikhaylik, I. Kovalev, J. Xu, R. Schock, Rechargeable Li2S Battery with Specific Energy 350 Wh/kg and Specific Power 3000 W/kg., ECS Trans. 13 (2008) 53. [CrossRef]
- Y. Yang, M.T. McDowell, A. Jackson, J.J. Cha, S.S. Hong, Y. Cui, New Nanostructured Li2S/Silicon Rechargeable Battery with High Specific Energy, Nano Lett. 10 (2010) 1486–1491. [CrossRef]
- Y. Son, H. Cha, C. Jo, A.S. Groombridge, T. Lee, A. Boies, J. Cho, M. De Volder, Reliable protocols for calculating the specific energy and energy density of Li-Ion batteries, Materials Today Energy 21 (2021) 100838. [CrossRef]
- J.O. Park, M. Kim, J.-H. Kim, K.H. Choi, H.C. Lee, W. Choi, S.B. Ma, D. Im, A 1000 Wh kg−1 Li–Air battery: Cell design and performance, Journal of Power Sources 419 (2019) 112–118. [CrossRef]
- O.A. Marzouk, A.H. Nayfeh, Characterization of the flow over a cylinder moving harmonically in the cross-flow direction, International Journal of Non-Linear Mechanics 45 (2010) 821–833. [CrossRef]
- H. Sugita, T. Matsuo, Y. Inui, M. Ishikawa, Two-dimensional behavior of gas-particle two-phase flow under strong MHD interaction, in: 13th International Conference on MHD Electrical Power Generation and Higth Temperature Technologies, Beijing, China, 1999: pp. 453–462.
- O.A. Marzouk, Direct Numerical Simulations of the Flow Past a Cylinder Moving With Sinusoidal and Nonsinusoidal Profiles, Journal of Fluids Engineering 131 (2009) 121201. [CrossRef]
- T. Matsuo, H. Sugita, M. Ishikawa, V.A. Zeigarnik, Boundary-layer separation and generator performance of self-excited pulsed MHD channel with strong MHD interaction, in: 13th International Conference on MHD Electrical Power Generation and Higth Temperature Technologies, Beijing, China, 1999: pp. 399–408.
- O.A. Marzouk, Contrasting the Cartesian and polar forms of the shedding-induced force vector in response to 12 subharmonic and superharmonic mechanical excitations, Fluid Dynamics Research 42 (2010) 035507. [CrossRef]
- H. Sugita, T. Matsuo, Y. Inui, M. Ishikawa, Two-dimensional analysis of gas-particle two phase flow in pulsed MHD channel, in: 30th Plasmadynamic and Lasers Conference, American Institute of Aeronautics and Astronautics, Norfolk, Virginia, USA, 1999: p. AIAA-99-3483. [CrossRef]
- O.A. Marzouk, Flow control using bifrequency motion, Theoretical and Computational Fluid Dynamics 25 (2011) 381–405. [CrossRef]
- T. Hardianto, N. Sakamoto, N. Harada, Three-Dimensional Flow Analysis in a Faraday-Type MHD Generator, IEEE Transactions on Industry Applications 44 (2008) 1116–1123. [CrossRef]
- A.J. Hynes, M. Steinberg, K. Schofield, The chemical kinetics and thermodynamics of sodium species in oxygen-rich hydrogen flames, The Journal of Chemical Physics 80 (1984) 2585–2597. [CrossRef]
- O.A. Marzouk, Technical review of radiative-property modeling approaches for gray and nongray radiation, and a recommended optimized WSGGM for CO2/H2O-enriched gases, Results in Engineering 25 (2025) 103923. [CrossRef]
- T.S. Cheng, Y.-C. Chao, C.-Y. Wu, Y.-H. Li, Y. Nakamura, K.-Y. Lee, T. Yuan, T.S. Leu, Experimental and numerical investigation of microscale hydrogen diffusion flames, Proceedings of the Combustion Institute 30 (2005) 2489–2497. [CrossRef]
- M. Aoyagi, S. Ito, H. Hashizume, T. Muroga, MHD pressure drop characteristics in a three-surface-multi-layered channel under a strong magnetic field, Fusion Engineering and Design 85 (2010) 1181–1184. [CrossRef]
- X. Huang, Y. Cao, J. Li, W. Yi, Y. Qu, Enhanced reversible magnetocaloric effect in Ni-Co-Mn-Sb-based magnetic shape memory alloy achieved by Ti substitution for Ni, Journal of Alloys and Compounds 1010 (2025) 178112. [CrossRef]
- M.E. Hurley, R.K. Bollineni, A.M. Donald, S. Flynn, J.J. Hamlin, M.S. Kesler, M.V. Manuel, M.W. Meisel, L. Li, V.M. Miller, Microstructural Evolution of Steel During Magnetic Field-Assisted Processing, JOM (2025). [CrossRef]
- V.A. Bityurin, C.A. Borghi, P.L. Ribani, High enthalpy extraction numerical experiment in a plasma vane MHD generator, IEEE Transactions on Plasma Science 23 (1995) 844–851. [CrossRef]
- M. Ishikwa, M. Yuhara, T. Fujino, Three-dimensional computation of magnetohydrodynamics in a weakly ionized plasma with strong MHD interaction, Journal of Materials Processing Technology 181 (2007) 254–259. [CrossRef]
- M. Ishikawa, Y. Koshiba, T. Matsushita, Effects of induced magnetic field on large scale pulsed MHD generator with two phase flow, Energy Conversion and Management 45 (2004) 707–724. [CrossRef]
- M. Ishikawa, Y. Koshiba, 52. Preliminary analysis of large pulsed MHD generator, in: 3th Workshop on Magnetoplasma Aerodynamics for Aerospace Applications, Moscow, Russia, 2001: pp. 276–281. https://apps.dtic.mil/sti/pdfs/ADA407842.pdf.
- O.A. Marzouk, Detailed and simplified plasma models in combined-cycle magnetohydrodynamic power systems, International Journal of Advanced and Applied Sciences 10 (2023) 96–108. [CrossRef]
- C.-W. Hustad, D.L. Coleman, T. Mikus, Technology Overview for Integration of an MHD Topping Cycle with the CES Oxyfuel Combustor, CO2-Global, 2009. Available online: https://co2.no/wp-content/uploads/2020/07/MHD_Report-Final.pdf (accessed on 12 June 2011).
- E.K. Miller, Exploring the behavior of a matched load in the time domain, IEEE Antennas and Propagation Magazine 56 (2014) 103–111. [CrossRef]
- J. McCune, Non-Linear Effects of Fluctuations on MHD Performance, in: 6th Symposium on Engineering Aspects of Magnetohydrodynamics, AIAA [American Institute of Aeronautics and Astronautics], Pittsburgh, Pennsylvania, USA, 1965: pp. 89–103. [CrossRef]
- O.A. Marzouk, Coupled differential-algebraic equations framework for modeling six-degree-of-freedom flight dynamics of asymmetric fixed-wing aircraft, International Journal of Applied and Advanced Sciences 12 (2025) 30–51. [CrossRef]
- O.A. Marzouk, Estimated electric conductivities of thermal plasma for air-fuel combustion and oxy-fuel combustion with potassium or cesium seeding, Heliyon 10 (2024) e31697. [CrossRef]
- L.S. Frost, Conductivity of Seeded Atmospheric Pressure Plasmas, Journal of Applied Physics 32 (1961) 2029–2036. [CrossRef]
- J. Raeder, Chapter 2. Theory, in: MHD Power Generation - Selected Problems of Combustion MHD Generators, Springer, 1975: pp. 5–85.
- A.L. Khomkin, A.S. Shumikhin, Equation of state and conductivity of aluminum dense vapor plasma, in: 35th EPS Conference on Plasma Physics (2008-Europhysics), Hersonissos, Crete, Greece, 2008: pp. 720–723. Available online: https://citeseerx.ist.psu.edu/document?repid=rep1&type=pdf&doi=624078677a5a7acac621fa9651ac08e77a1839b9 (accessed on 31 March 2025).
- W. Ebeling, Kulik, V.E. Fortov, Riaby, Klimontovich, Röpke, Kovalenko, Rozanov, Kraeft, Kremp, Transport Properties of Dense Plasmas, Springer-Verlag, Basel, Switzerland, 2013. Available online: https://books.google.com.om/books?id=xUigBgAAQBAJ (accessed on 31 March 2025).
- O.A. Marzouk, Characteristics of the Flow-Induced Vibration and Forces With 1- and 2-DOF Vibrations and Limiting Solid-to-Fluid Density Ratios, Journal of Vibration and Acoustics 132 (2010) 041013. [CrossRef]
- R.M. Gavioso, Determination of the universal gas constant R and other metrological applications of speed of sound measurements, in: Recent Advances in Metrology and Fundamental Constants, IOS Press, 2001: pp. 195–215. [CrossRef]
- O.A. Marzouk, Assessment of Three Databases for the NASA Seven-Coefficient Polynomial Fits for Calculating Thermodynamic Properties of Individual Species, International Journal of Aeronautical Science & Aerospace Research 5 (2018) 150–163. [CrossRef]
- P. Šafarík, A. Nový, D. Jícha, M. Hajšman, ON THE SPEED OF SOUND IN STEAM, Acta Polytechnica 55 (2015) 422–426. [CrossRef]
- B.J. McBride, M.J. Zehe, S. Gordon, NASA Glenn Coefficients for Calculating Thermodynamic Properties of Individual Species, NASA [United States National Aeronautics and Space Administration], 2002. Available online: https://ntrs.nasa.gov/api/citations/20020085330/downloads/20020085330.pdf (accessed on 11 October 2011).
- V.N. Smirnov, Calculation of strong-collision dissociation rate constants from NASA thermodynamic polynomials, International Journal of Chemical Kinetics 52 (2020) 559–579. [CrossRef]
- A.A. Oliva, A. Jemcov, Method for Efficient Evaluation of Temperature Using the NASA Polynomials, AIAA Journal 62 (2024) 405–408. [CrossRef]
- H.O. Euclides, P.R. P. Barreto, APUAMA: a software tool for reaction rate calculations, J Mol Model 23 (2017) 176. [CrossRef]
- C.B. Laney, Computational Gasdynamics, 1st ed., Cambridge University Press, USA, 1998. [CrossRef]
- [United States National Institute of Standards and Technology] NIST, CODATA [Committee on Data for Science and Technology] Value: molar gas constant, (2018). Available online: https://physics.nist.gov/cgi-bin/cuu/Value?r (accessed on 7 May 2022).
- R. Akasaka, M.L. Huber, L.D. Simoni, E.W. Lemmon, A Helmholtz Energy Equation of State for trans-1,1,1,4,4,4-Hexafluoro-2-butene [R-1336mzz(E)] and an Auxiliary Extended Corresponding States Model for the Transport Properties, Int J Thermophys 44 (2023) 50. [CrossRef]
- M.A. Bespyatov, Low-Temperature Heat Capacity and Thermodynamic Functions of Europium(III) Heptafluorodimethyloctanedionate, J. Chem. Eng. Data 68 (2023) 3222–3227. [CrossRef]
- P.J. Linstrom, W.G. Mallard, The NIST Chemistry WebBook: A Chemical Data Resource on the Internet, J. Chem. Eng. Data 46 (2001) 1059–1063. [CrossRef]
- O.A. Marzouk, Thermo Physical Chemical Properties of Fluids Using the Free NIST Chemistry WebBook Database, Fluid Mechanics Research International Journal 1 (2017). [CrossRef]
- T. Engel, J. Gasteiger, Chemoinformatics: Basic Concepts and Methods, John Wiley & Sons, Weinheim, Germany, 2018. Available online: https://books.google.com.om/books?id=X7paDwAAQBAJ (accessed on 31 March 2025).
- [United States National Institute of Standards and Technology] NIST, NIST Chemistry WebBook - Water, (2023). Available online: https://webbook.nist.gov/cgi/cbook.cgi?Name=h2o (accessed on 15 August 2023).
- [United States National Institute of Standards and Technology] NIST, NIST Chemistry WebBook - Nitrogen, (2021). Available online: https://webbook.nist.gov/cgi/cbook.cgi?Name=n2 (accessed on 7 May 2022).
- [United States National Institute of Standards and Technology] NIST, NIST Chemistry WebBook - Cesium, (2023). Available online: https://webbook.nist.gov/cgi/cbook.cgi?Name=cesium (accessed on 15 August 2023).
- [United States National Institute of Standards and Technology] NIST, NIST Chemistry WebBook - Potassium, (2025). Available online: https://webbook.nist.gov/cgi/cbook.cgi?Name=potassium (accessed on 31 March 2025).
- K.K. Kuo, Principles of Combustion, 2nd ed, John Wiley, Hoboken, NJ, 2005.
- T. Poinsot, D. Veynante, Theoretical and Numerical Combustion, 2nd ed, Edwards, Philadelphia, 2005.
- N.K. Ram, N.R. Singh, P. Raman, A. Kumar, P. Kaushal, A detailed experimental analysis of air–steam gasification in a dual fired downdraft biomass gasifier enabling hydrogen enrichment in the producer gas, Energy 187 (2019) 115937. [CrossRef]
- T. Taniguchi, K. Kawamura, S. Sakamoto, H. Tagashira, Three-body attachment in oxygen and an air-like nitrogen and oxygen mixture, J. Phys. D: Appl. Phys. 15 (1982) 1187. [CrossRef]
- M.A. Elyamani, The Role of Oxygen-Enriched Air in Sustainable Hydrogen Production and Combustion Performance in Fired Heaters, in: Mediterranean Offshore Conference, OnePetro, Alexandria, Egypt, 2024. [CrossRef]
- M. Mariani, Post-combustion CO2: Separation And Stocking, WIT Transactions on Ecology and the Environment 86 (2006) 785–791.
- X. Lu, E. Hu, X. Li, J. Ku, Z. Huang, Non-monotonic behaviors of laminar burning velocities of H2/O2/He mixtures at elevated pressures and temperatures, International Journal of Hydrogen Energy 42 (2017) 22036–22045. [CrossRef]
- C.D. Cooper, W.T. Naff, R.N. Compton, Negative ion properties of p-benzoquinone: Electron affinity and compound states, The Journal of Chemical Physics 63 (1975) 2752–2757. [CrossRef]
- [National Center for Biotechnology Information] NCBI, PubChem │ Ionization Energy in the Periodic Table of Elements, (2025). Available online: https://pubchem.ncbi.nlm.nih.gov/periodic-table/ionization-energy (accessed on 2 April 2025).
- R.N. Compton, C.D. Cooper, Molecular electron affinities from collisional ionization of cesium. II. SF6 and TeF6, The Journal of Chemical Physics 59 (1973) 4140–4144. [CrossRef]
- softUsvista, unitsconverters │ eV/particle to KJ/mol (Electron Volt Per Particle to KiloJoule Per Mole), (20255). Available online: https://www.unitsconverters.com/ru/D-%D0%9A-Millenium/Utu-97-7744 (accessed on 4 April 2025).
- K.E. Nizzi, C.A. Pommerening, L.S. Sunderlin, Gas-Phase Thermochemistry of Polyhalide Anions, J. Phys. Chem. A 102 (1998) 7674–7679. [CrossRef]
- T.C. Gibb, Principles of Mössbauer Spectroscopy, Science Paperbacks, New York City, New York, USA, 1976. Available online: https://books.google.com.om/books?id=6vjtCAAAQBAJ (accessed on 4 April 2025).
- S. Civiš, M. Ferus, P. Kubelík, P. Jelinek, V.E. Chernov, Potassium spectra in the 700–7000 cm-1 domain: Transitions involving f-, g-, and h-states, A&A 541 (2012) A125. [CrossRef]
- A. Kotarba, G. Adamski, Z. Sojka, G. Djega-Mariadassou, Potassium surface stability and electronic promotion in K-NbN0.9O0.1 catalysts, Applied Surface Science 161 (2000) 105–108. [CrossRef]
- L. Schmidt, R. Gomer, Adsorption of Potassium on Tungsten, The Journal of Chemical Physics 42 (1965) 3573–3598. [CrossRef]
- B.-G. Englert, Statistical Atom: Ionization Energies, Zeitschrift Für Naturforschung A 42 (1987) 825–834. [CrossRef]
- J.R. Crawford, P. Kunz, H. Yang, P. Schaffer, T.J. Ruth, e211Rn/e211At and e209At production with intense mass separated Fr ion beams for preclinical 211At-based α-therapy research, Applied Radiation and Isotopes 122 (2017) 222–228. [CrossRef]
- [Royal Society of Chemistry] RSC, RSC │ Francium - Element information, properties and uses, (2025). Available online: https://periodic-table.rsc.org/element/87/francium (accessed on 2 April 2025).
- [National Center for Biotechnology Information] NCBI, PubChem │ Francium (Fr), (2025). Available online: https://pubchem.ncbi.nlm.nih.gov/element/87 (accessed on 2 April 2025).
- S. Venetskii, Francium, Metallurgist 22 (1978) 61–65. [CrossRef]
- M.A. Pocsai, I.F. Barna, K. Tökési, Photoionisation of rubidium in strong laser fields, Eur. Phys. J. D 73 (2019) 74. [CrossRef]
- V. Roman, A. Kupliauskienė, A. Borovik, Excitation and ionization of outer shells in Rb by electron impact, J. Phys. B: At. Mol. Opt. Phys. 48 (2015) 205204. [CrossRef]
- [Royal Society of Chemistry] RSC, RSC │ Rubidium - Element information, properties and uses, (2025). Available online: https://periodic-table.rsc.org/element/37/Rubidium (accessed on 2 April 2025).
- P. Xing, C. Wang, Y. Chen, B. Ma, Rubidium extraction from mineral and brine resources: A review, Hydrometallurgy 203 (2021) 105644. [CrossRef]
- S.K. Sharma, D.Q. Truong, J. Guo, A.K. An, G. Naidu, B.J. Deka, Recovery of rubidium from brine sources utilizing diverse separation technologies, Desalination 556 (2023) 116578. [CrossRef]
- K.K. Mackay, J.B. Freund, H.T. Johnson, Enhancement of hydrogen microcombustion via field-emission dielectric barrier discharge, Plasma Sources Sci. Technol. 27 (2018) 085007. [CrossRef]
- K.C. Choi, S.H. Kim, B.J. Shin, J. Kang, K.-Y. Choi, E.-H. Yoo, Effects of Kr,hboxN2, and Ar on Address Discharge Time Lag in AC Plasma-Display Panel With High Xenon Content, IEEE Transactions on Electron Devices 53 (2006) 2410–2413. [CrossRef]
- S. Mohandas, R.O. Ramabhadran, S.S. Kumar, Theoretical Investigation of a Vital Step in the Gas-Phase Formation of Interstellar Ammonia NH2+ + H2 → NH3+ + H, J. Phys. Chem. A 124 (2020) 8373–8382. [CrossRef]
- M.G. Pia, H. Seo, M. Batic, M. Begalli, C.H. Kim, L. Quintieri, P. Saracco, Evaluation of Atomic Electron Binding Energies for Monte Carlo Particle Transport, IEEE Transactions on Nuclear Science 58 (2011) 3246–3268. [CrossRef]
- David.M. Wiles, The reactions of active nitrogen with phosphine and hydrogen chloride, Doctor of Philosophy, Department of Chemistry, McGill University, 1957. Available online: https://escholarship.mcgill.ca/concern/theses/qr46r4819 (accessed on 4 April 2025).
- S.K. Mitra, Atomic Nitrogen in Auroras, Nature 167 (1951) 897–897. [CrossRef]
- A. Kumar, M. Kołaski, H.M. Lee, K.S. Kim, Photoexcitation and Photoionization Dynamics of Water Photolysis, J. Phys. Chem. A 112 (2008) 5502–5508. [CrossRef]
- F. Misaizu, M. Sanekata, K. Tsukamoto, K. Fuke, S. Iwata, Photodissociation of size-selected aquamagnesium (Mg+(H2O)n) ions for n = 1 and 2, J. Phys. Chem. 96 (1992) 8259–8264. [CrossRef]
- Liu, B. Li, Y. Liu, J. Yan, Thermodynamic analysis on the transient cycling of coal-fired power plants: Simulation study of a 660 MW supercritical unit, Energy 122 (2017) 505–527. [CrossRef]
- S. Boonnasa, P. Namprakai, Sensitivity analysis for the capacity improvement of a combined cycle power plant (100–600 MW), Applied Thermal Engineering 28 (2008) 1865–1874. [CrossRef]
- W. Chen, G. Zhang, B. Li, M. Liu, J. Liu, Simulation study on 660 MW coal-fired power plant coupled with a steam ejector to ensure NOx reduction ability, Applied Thermal Engineering 111 (2017) 550–561. [CrossRef]
- J.E. Mason, C.L. Archer, Baseload electricity from wind via compressed air energy storage (CAES), Renewable and Sustainable Energy Reviews 16 (2012) 1099–1109. [CrossRef]
- A. Massarini, C.A. Borghi, Time-dependent quasi-one-dimensional flow models for linear magnetohydrodynamic generator channels, Physics of Fluids B: Plasma Physics 4 (1992) 2823–2829. [CrossRef]
- C.A. Borghi, A. Cristofolini, P.L. Ribani, Analysis of magneto-plasma dynamic transients in a combustion gas magnetohydrodynamic generator, Physics of Plasmas 4 (1997) 3082–3090. [CrossRef]
- A. Cristofolini, C.A. Borghi, A difference method for the solution of the electrodynamic problem in a magnetohydrodynamic field, IEEE Transactions on Magnetics 31 (1995) 1749–1752. [CrossRef]
- C.A. Borghi, A. Massarini, G. Mazzanti, P.L. Ribani, Steady State Descriptions of MHD Plasma Flows, in: Beijing, China, 1992: pp. 770–775.
- X. Wang, A. Barnett, The Evolving Value of Photovoltaic Module Efficiency, Applied Sciences 9 (2019) 1227. [CrossRef]
- O.A. Marzouk, Land-Use competitiveness of photovoltaic and concentrated solar power technologies near the Tropic of Cancer, Solar Energy 243 (2022) 103–119. [CrossRef]
- S. Dubey, J.N. Sarvaiya, B. Seshadri, Temperature Dependent Photovoltaic (PV) Efficiency and Its Effect on PV Production in the World – A Review, Energy Procedia 33 (2013) 311–321. [CrossRef]
- T. Saiki, Y. Takizawa, K. Miyahara, M. Arima, Utilizing conductivity of seawater for bioelectric measurement of fish, Sci Rep 10 (2020) 16363. [CrossRef]
- T. Saiki, Y. Takizawa, K. Murai, R. Okuno, M. Arima, A novel method for noninvasive bioelectric measurement utilizing conductivity of seawater, Sci Rep 11 (2021) 7073. [CrossRef]
- Z. Zheng, Y. Fu, K. Liu, R. Xiao, X. Wang, H. Shi, Three-stage vertical distribution of seawater conductivity, Sci Rep 8 (2018) 9916. [CrossRef]
- G. Zambrano, H. Riascos, P. Prieto, E. Restrepo, A. Devia, C. Rincón, Optical emission spectroscopy study of r.f. magnetron sputtering discharge used for multilayers thin film deposition, Surface and Coatings Technology 172 (2003) 144–149. [CrossRef]
- W. Jitschin, G. Reich, Molecular velocity distribution at large Knudsen numbers, Journal of Vacuum Science & Technology A 9 (1991) 2752–2756. [CrossRef]
- J. Li, J.A.M. Kuipers, Effect of pressure on gas–solid flow behavior in dense gas-fluidized beds: a discrete particle simulation study, Powder Technology 127 (2002) 173–184. [CrossRef]
- G.R. Lynch, O.I. Dahl, Approximations to multiple Coulomb scattering, Nuclear Instruments and Methods in Physics Research Section B: Beam Interactions with Materials and Atoms 58 (1991) 6–10. [CrossRef]
- F. Gámiz, J.A. López-Villanueva, J.A. Jiménez-Tejada, I. Melchor, A. Palma, A comprehensive model for Coulomb scattering in inversion layers, Journal of Applied Physics 75 (1994) 924–934. [CrossRef]
- W.R. Johnson, T.A. Weber, C.J. Mullin, Coulomb Scattering of Polarized Electrons, Phys. Rev. 121 (1961) 933–939. [CrossRef]
- [Royal Society of Chemistry] RSC, RSC │ Potassium - Element information, properties and uses, (2025). Available online: https://periodic-table.rsc.org/element/19/potassium (accessed on 2 April 2025).
- A. Sarkar, Momentum-space properties for the S-states of the valence electron of potassium atom, Eur. Phys. J. D 76 (2022) 118. [CrossRef]
- J.M. Brown, A New Limit on Lorentz- and CPT-Violating Neutron Spin Interactions Using a Potassium-Helium Comagnetometer, Doctor of Philosophy, Department of Physics, Princeton University, 2011. Available online: https://www.proquest.com/openview/da8c7ee94b771c5271825badfd66f968/1 (accessed on 3 April 2025).
- S. Fritzsche, K. Jänkälä, M. Huttula, S. Urpelainen, H. Aksela, Photoelectron satellite structure from the 3d and 4d inner-shell ionization of rubidium and cesium: Role of atomic relaxation, Phys. Rev. A 78 (2008) 032514. [CrossRef]
- WebElements, WebElements │ Caesium - properties of free atoms, (2025). Available online: https://www.webelements.com/caesium/atoms.html (accessed on 2 April 2025).
- J. Sherson, H. Krauter, R.K. Olsson, B. Julsgaard, E.S. Polzik, Quantum memory and teleportation using macroscopic gas samples, J. Phys. B: At. Mol. Opt. Phys. 41 (2008) 223001. [CrossRef]
- Y. Mori, K. Ohtake, M. Yamamoto, K. Imani, Thermodynamic and Electrical Properties of Combustion Gas and Its Plasma: 1st Report, Theoretical Calculation, Bulletin of JSME 11 (1968) 241–252. [CrossRef]
- O.A. Marzouk, Temperature-Dependent Functions of the Electron–Neutral Momentum Transfer Collision Cross Sections of Selected Combustion Plasma Species, Applied Sciences 13 (2023) 11282. [CrossRef]
- W. Yang, A tutorial overview of the angular scattering models of electron–neutral, ion–neutral, neutral–neutral, and Coulomb collisions in Monte Carlo collision modeling on low-temperature plasma, Plasma Sources Sci. Technol. 33 (2024) 023001. [CrossRef]
- P. Banks, Collision frequencies and energy transfer electrons, Planetary and Space Science 14 (1966) 1085–1103. [CrossRef]
- S. Hjärtstam, K. Andersson, F. Johnsson, B. Leckner, Combustion characteristics of lignite-fired oxy-fuel flames, Fuel 88 (2009) 2216–2224. [CrossRef]
- G. Bagheri, E. Ranzi, M. Pelucchi, A. Parente, A. Frassoldati, T. Faravelli, Comprehensive kinetic study of combustion technologies for low environmental impact: MILD and OXY-fuel combustion of methane, Combustion and Flame 212 (2020) 142–155. [CrossRef]
- Z. Dobó, Heat radiation measurement method for high pressure oxy-fuel combustion, Measurement 124 (2018) 191–196. [CrossRef]
Figure 1.
The hydrogen magnetohydrodynamic (H2MHD) generator power system.
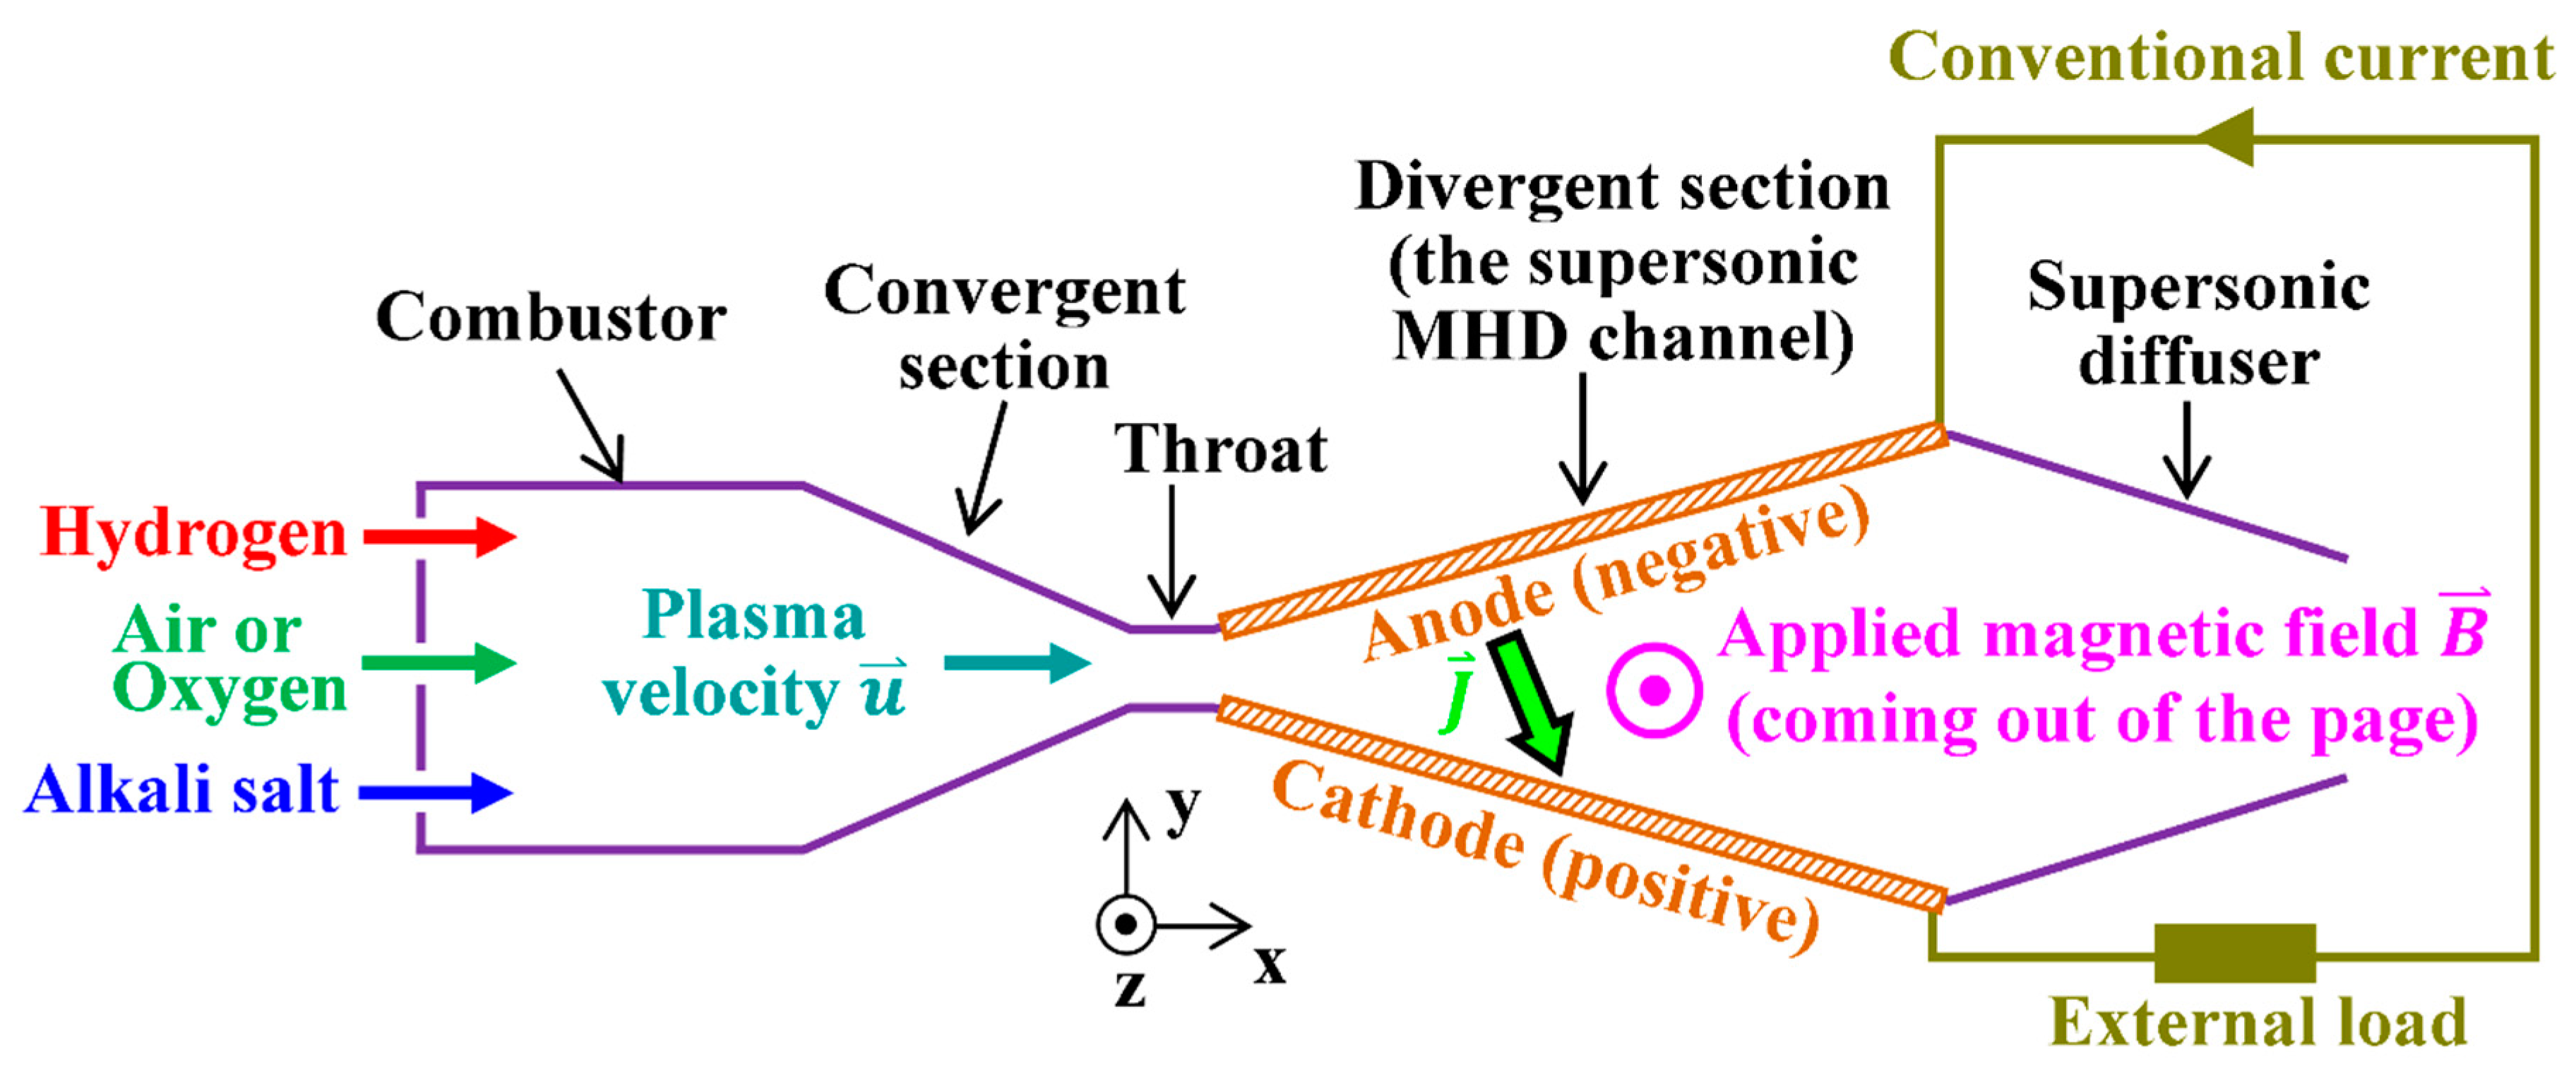
Figure 2.
Electric conductivity in the case of cesium seed and air oxidizer.
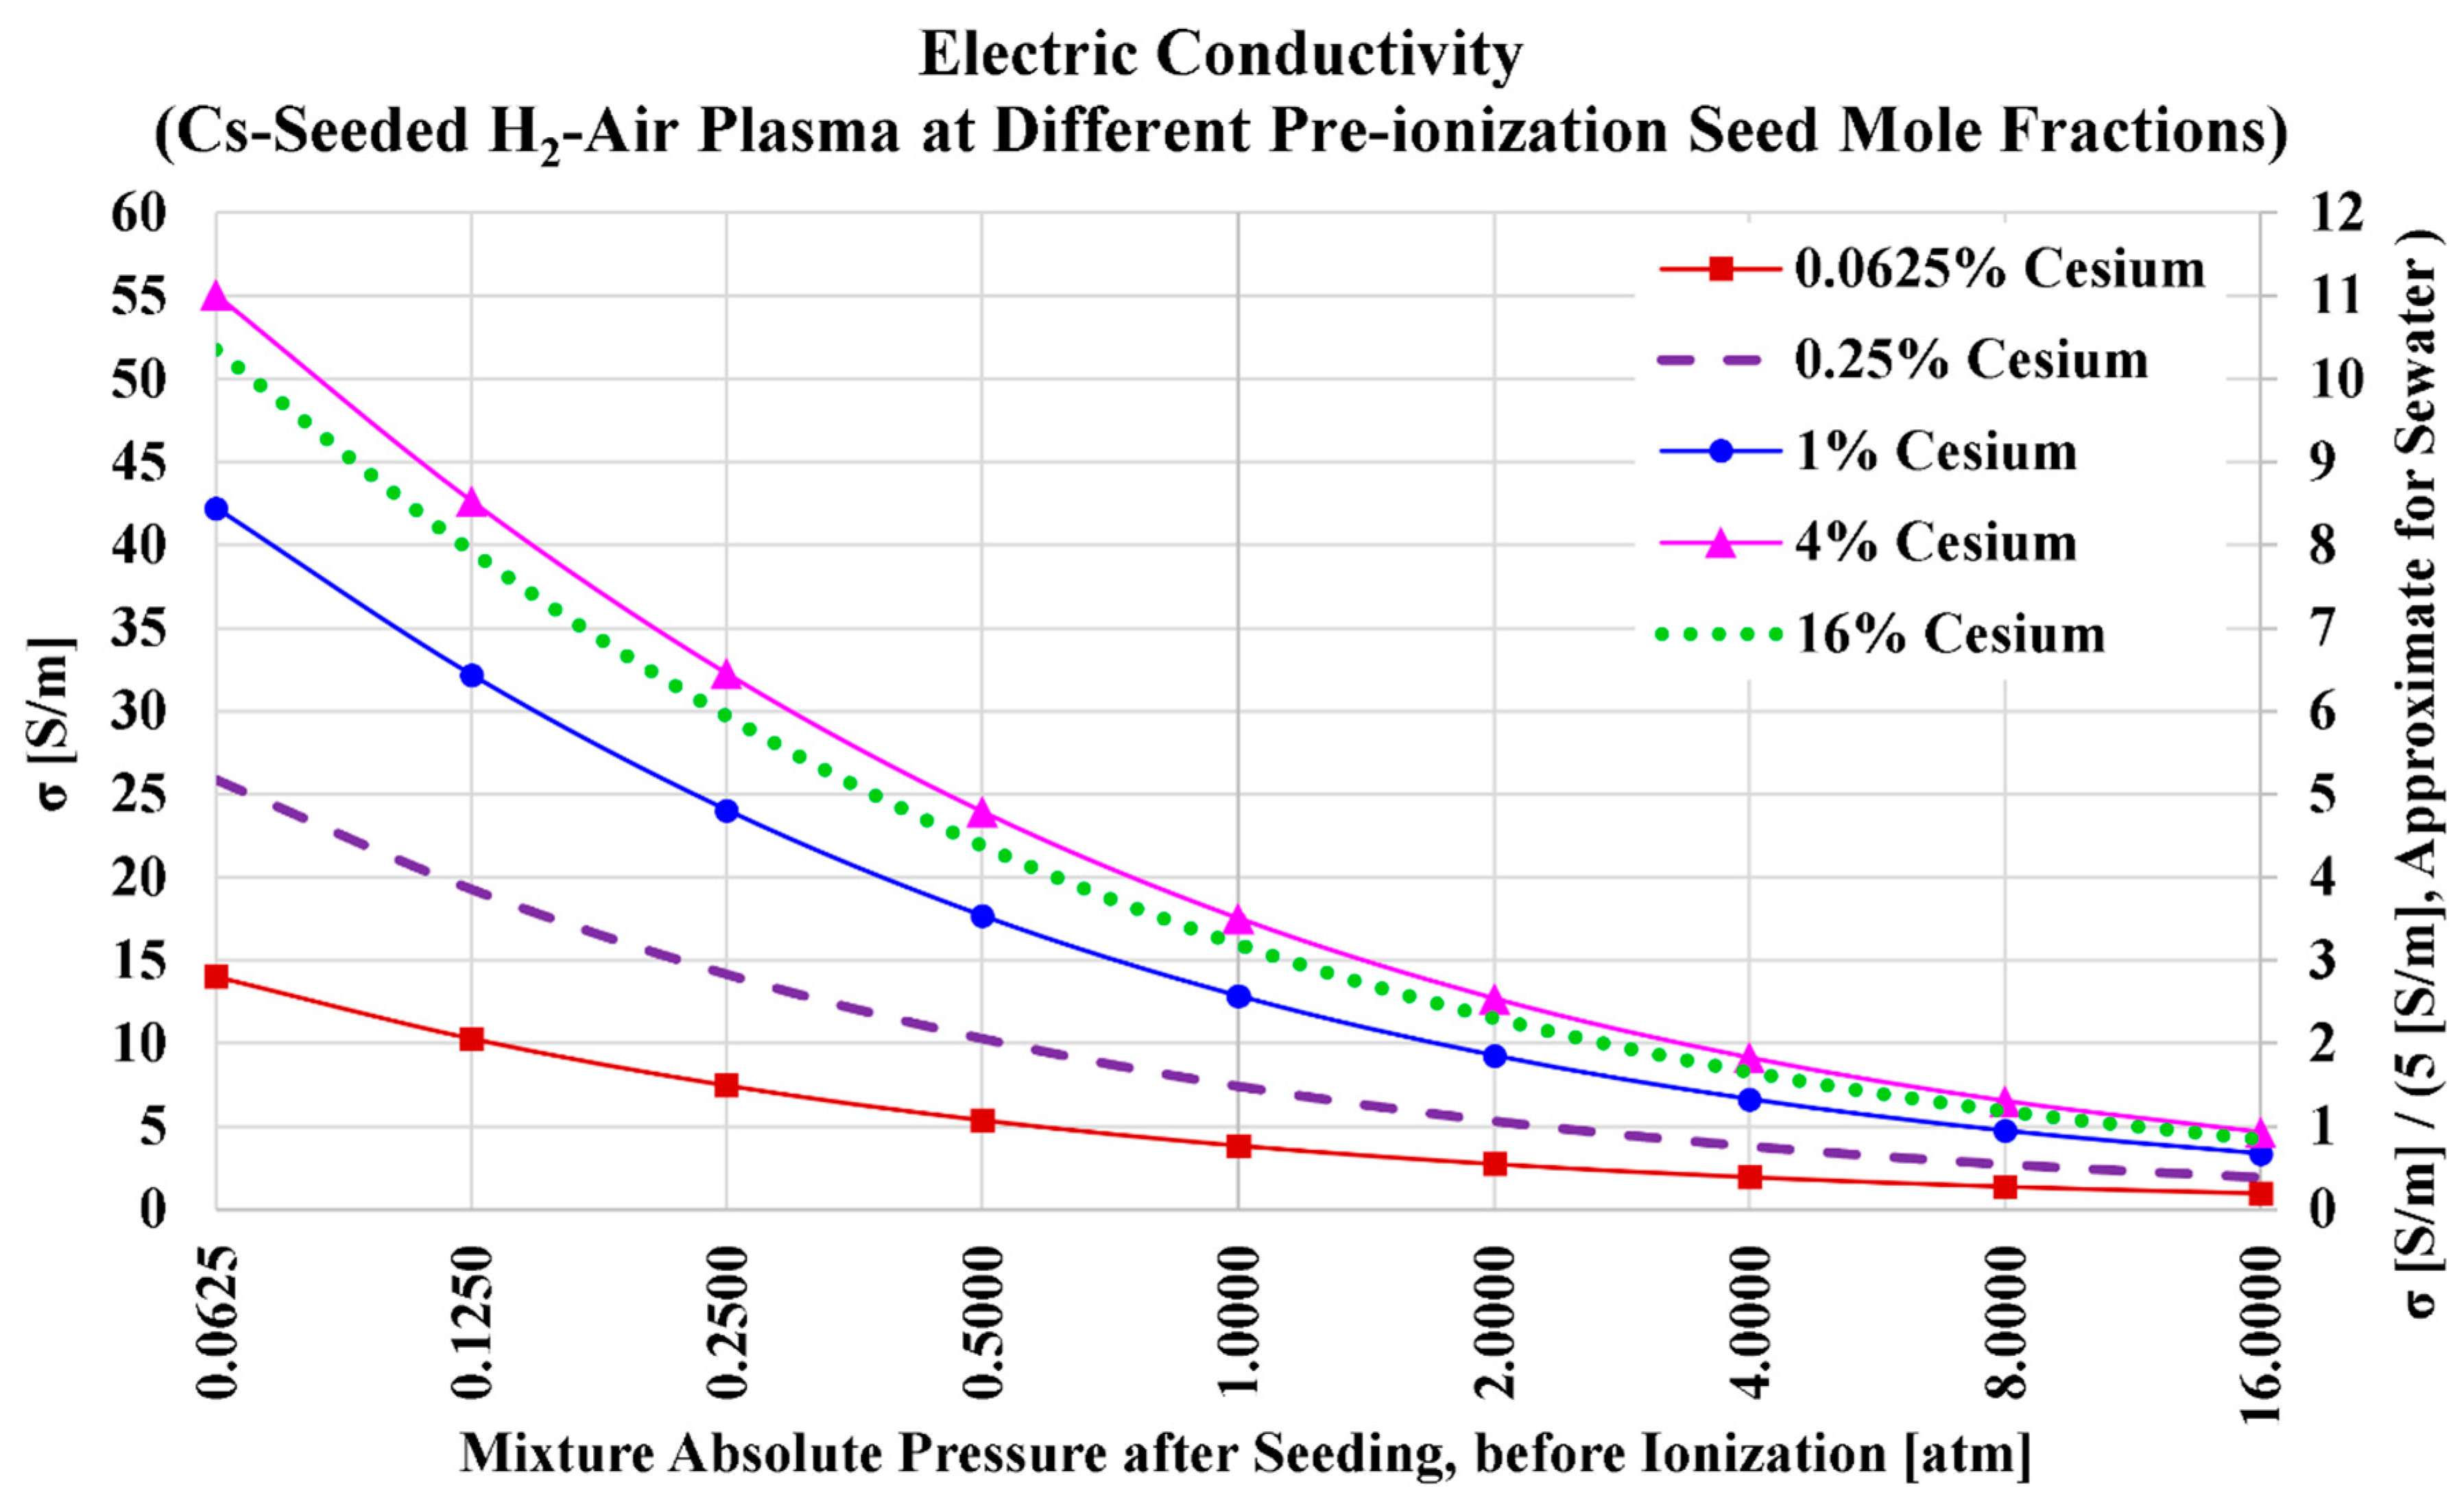
Figure 3.
Ideal power density in the case of cesium seed and air oxidizer.
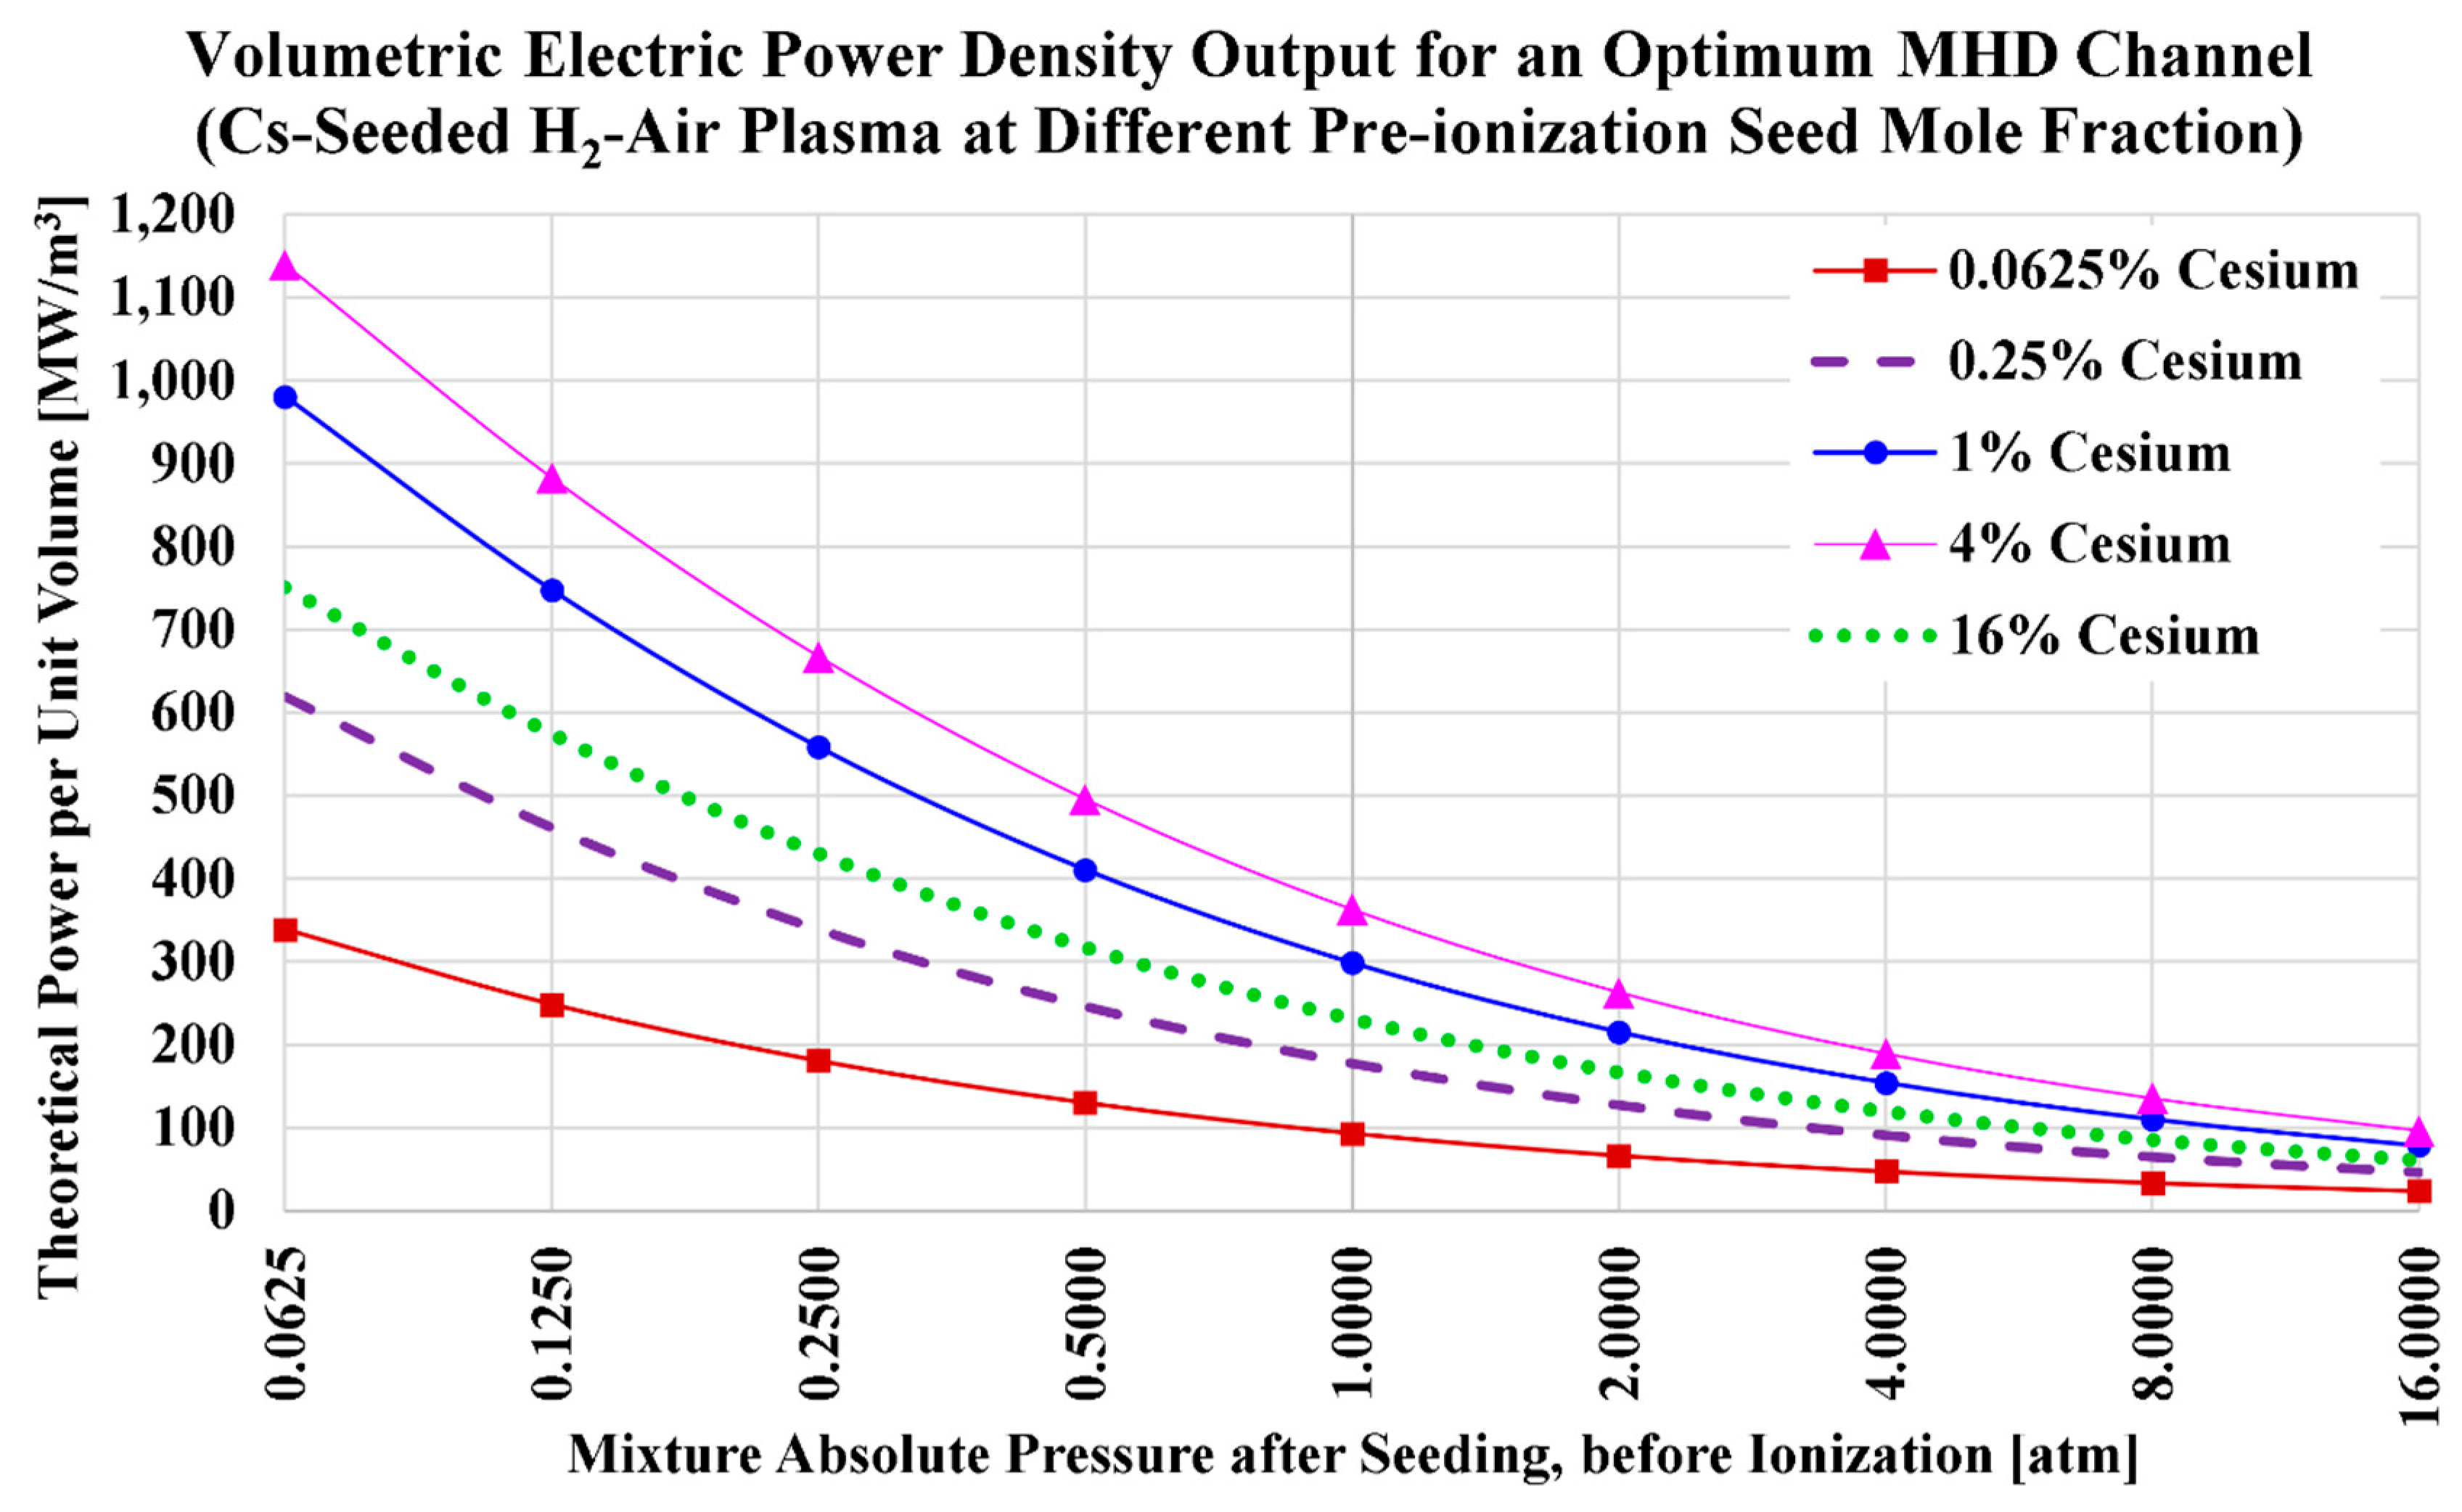
Figure 4.
Electric conductivity in the case of potassium seed and air oxidizer.
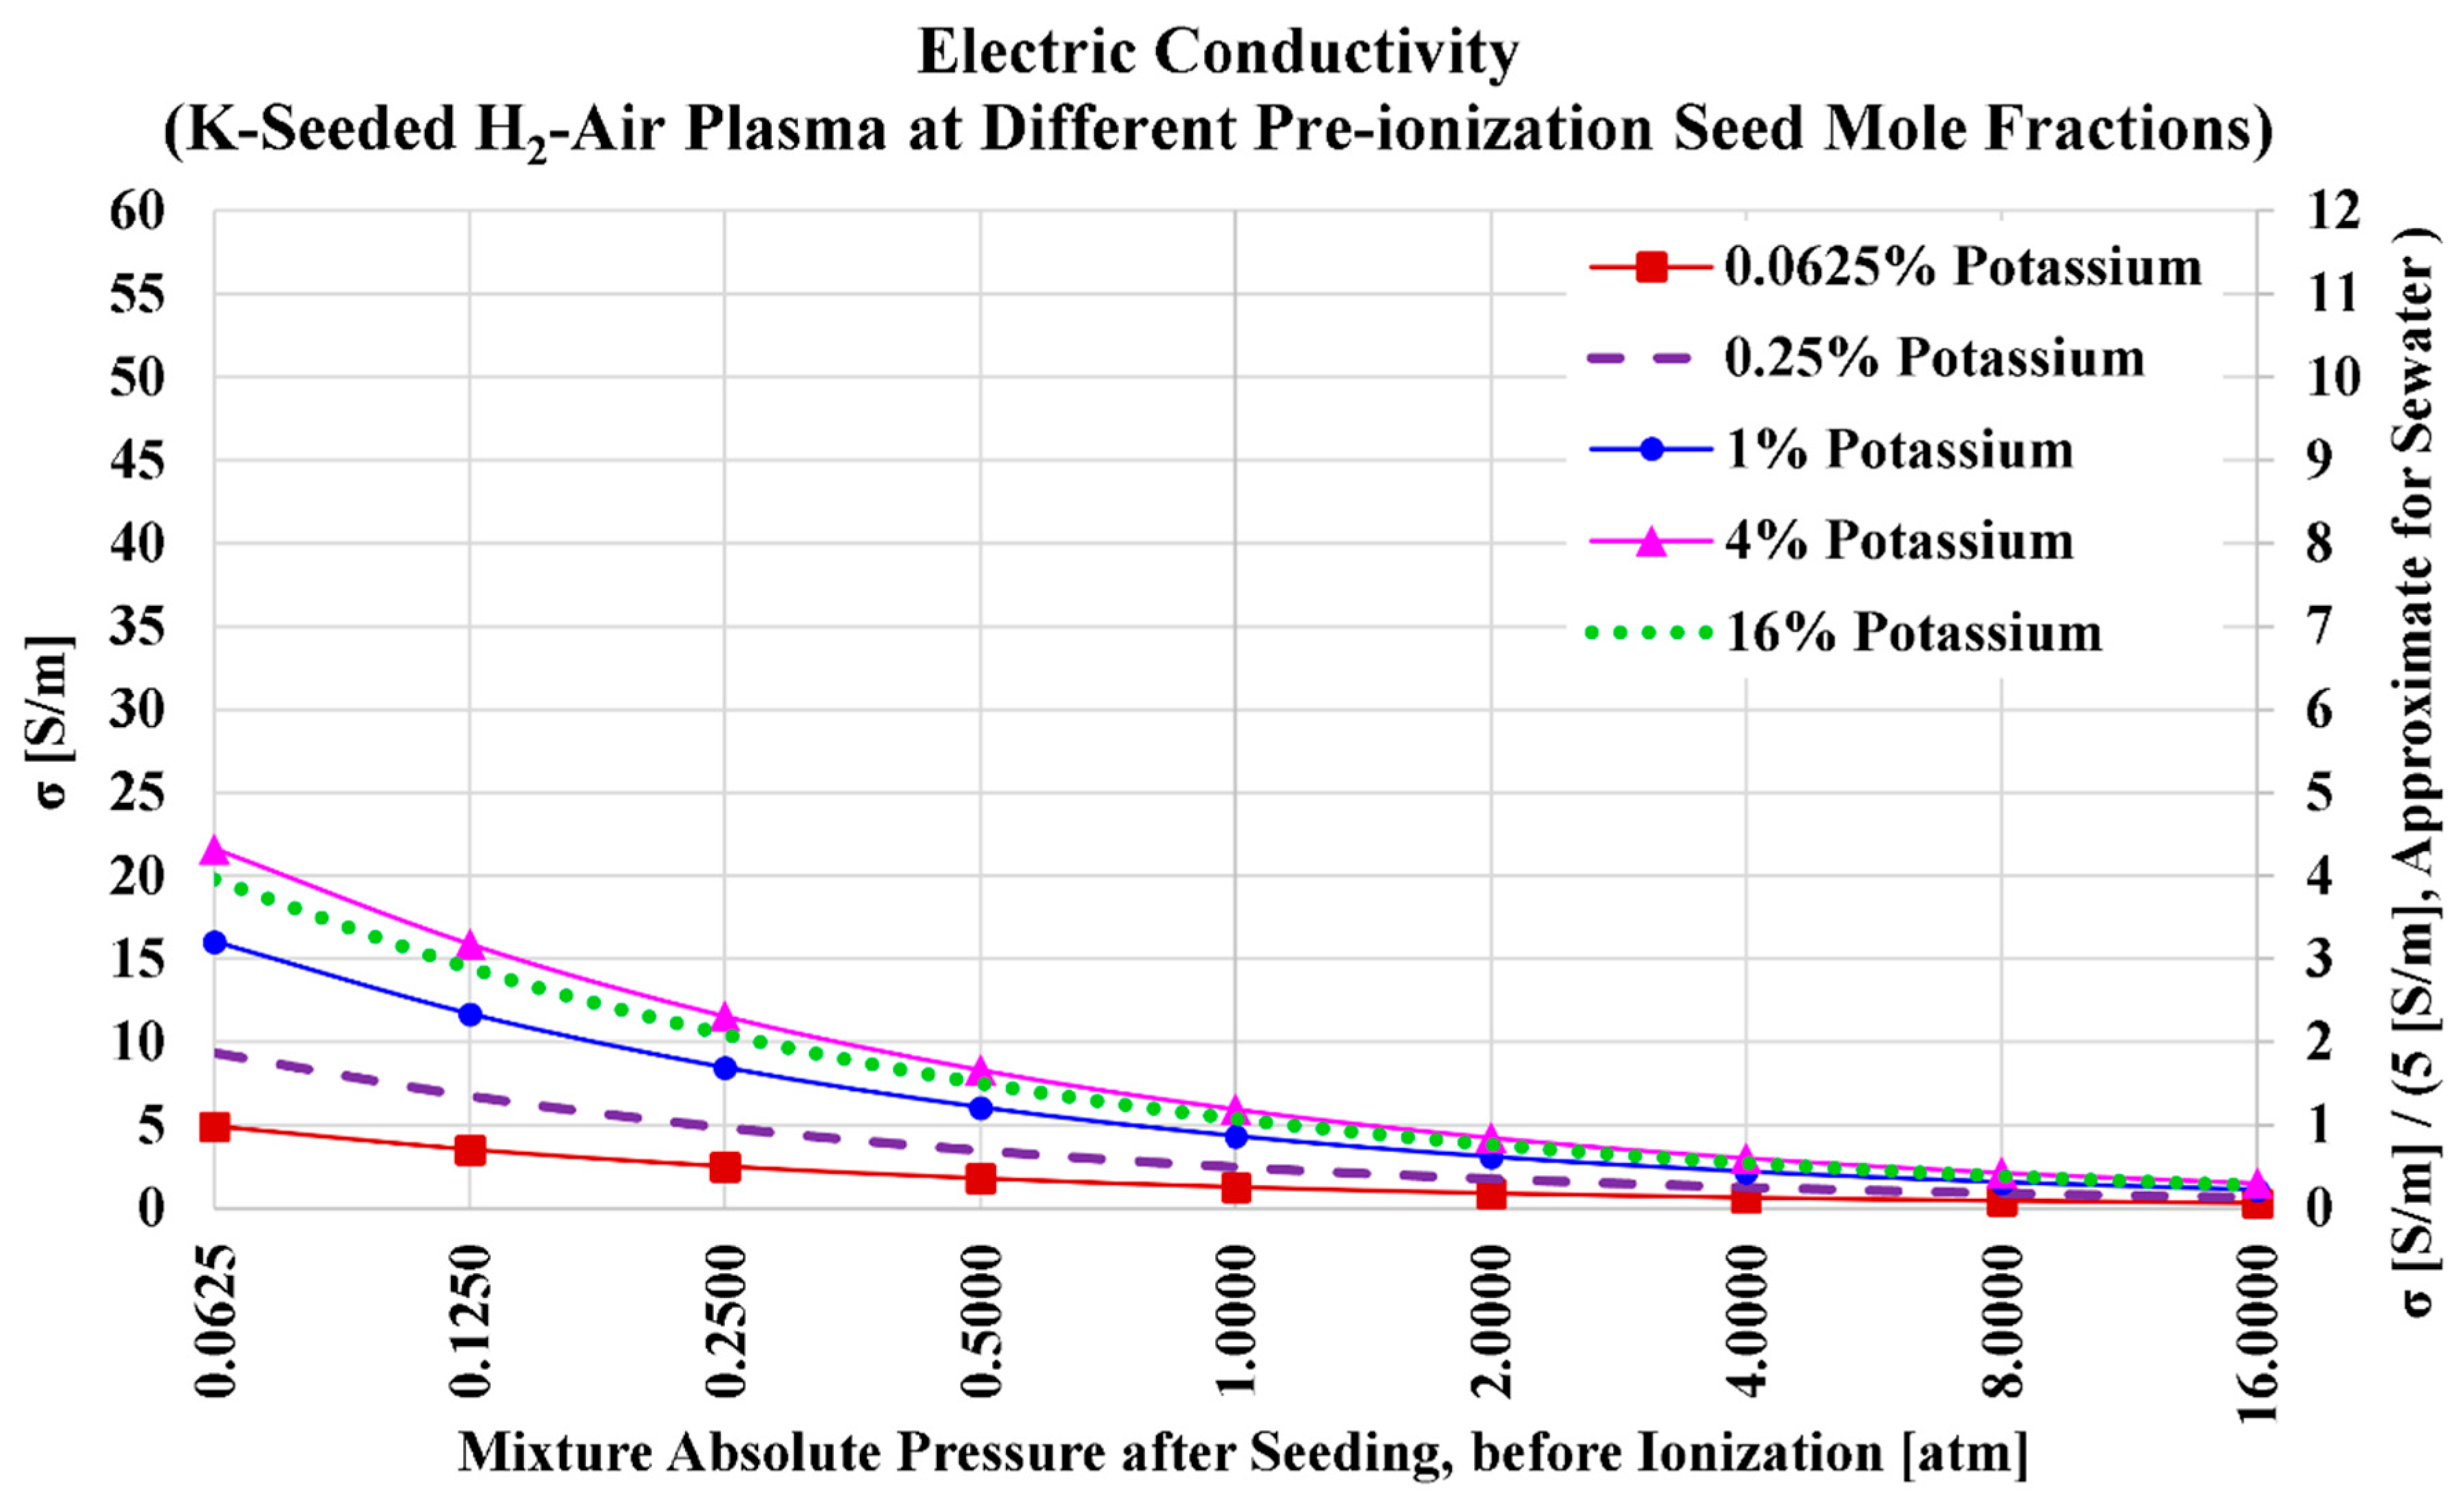
Figure 5.
Ideal power density in the case of potassium seed and air oxidizer.
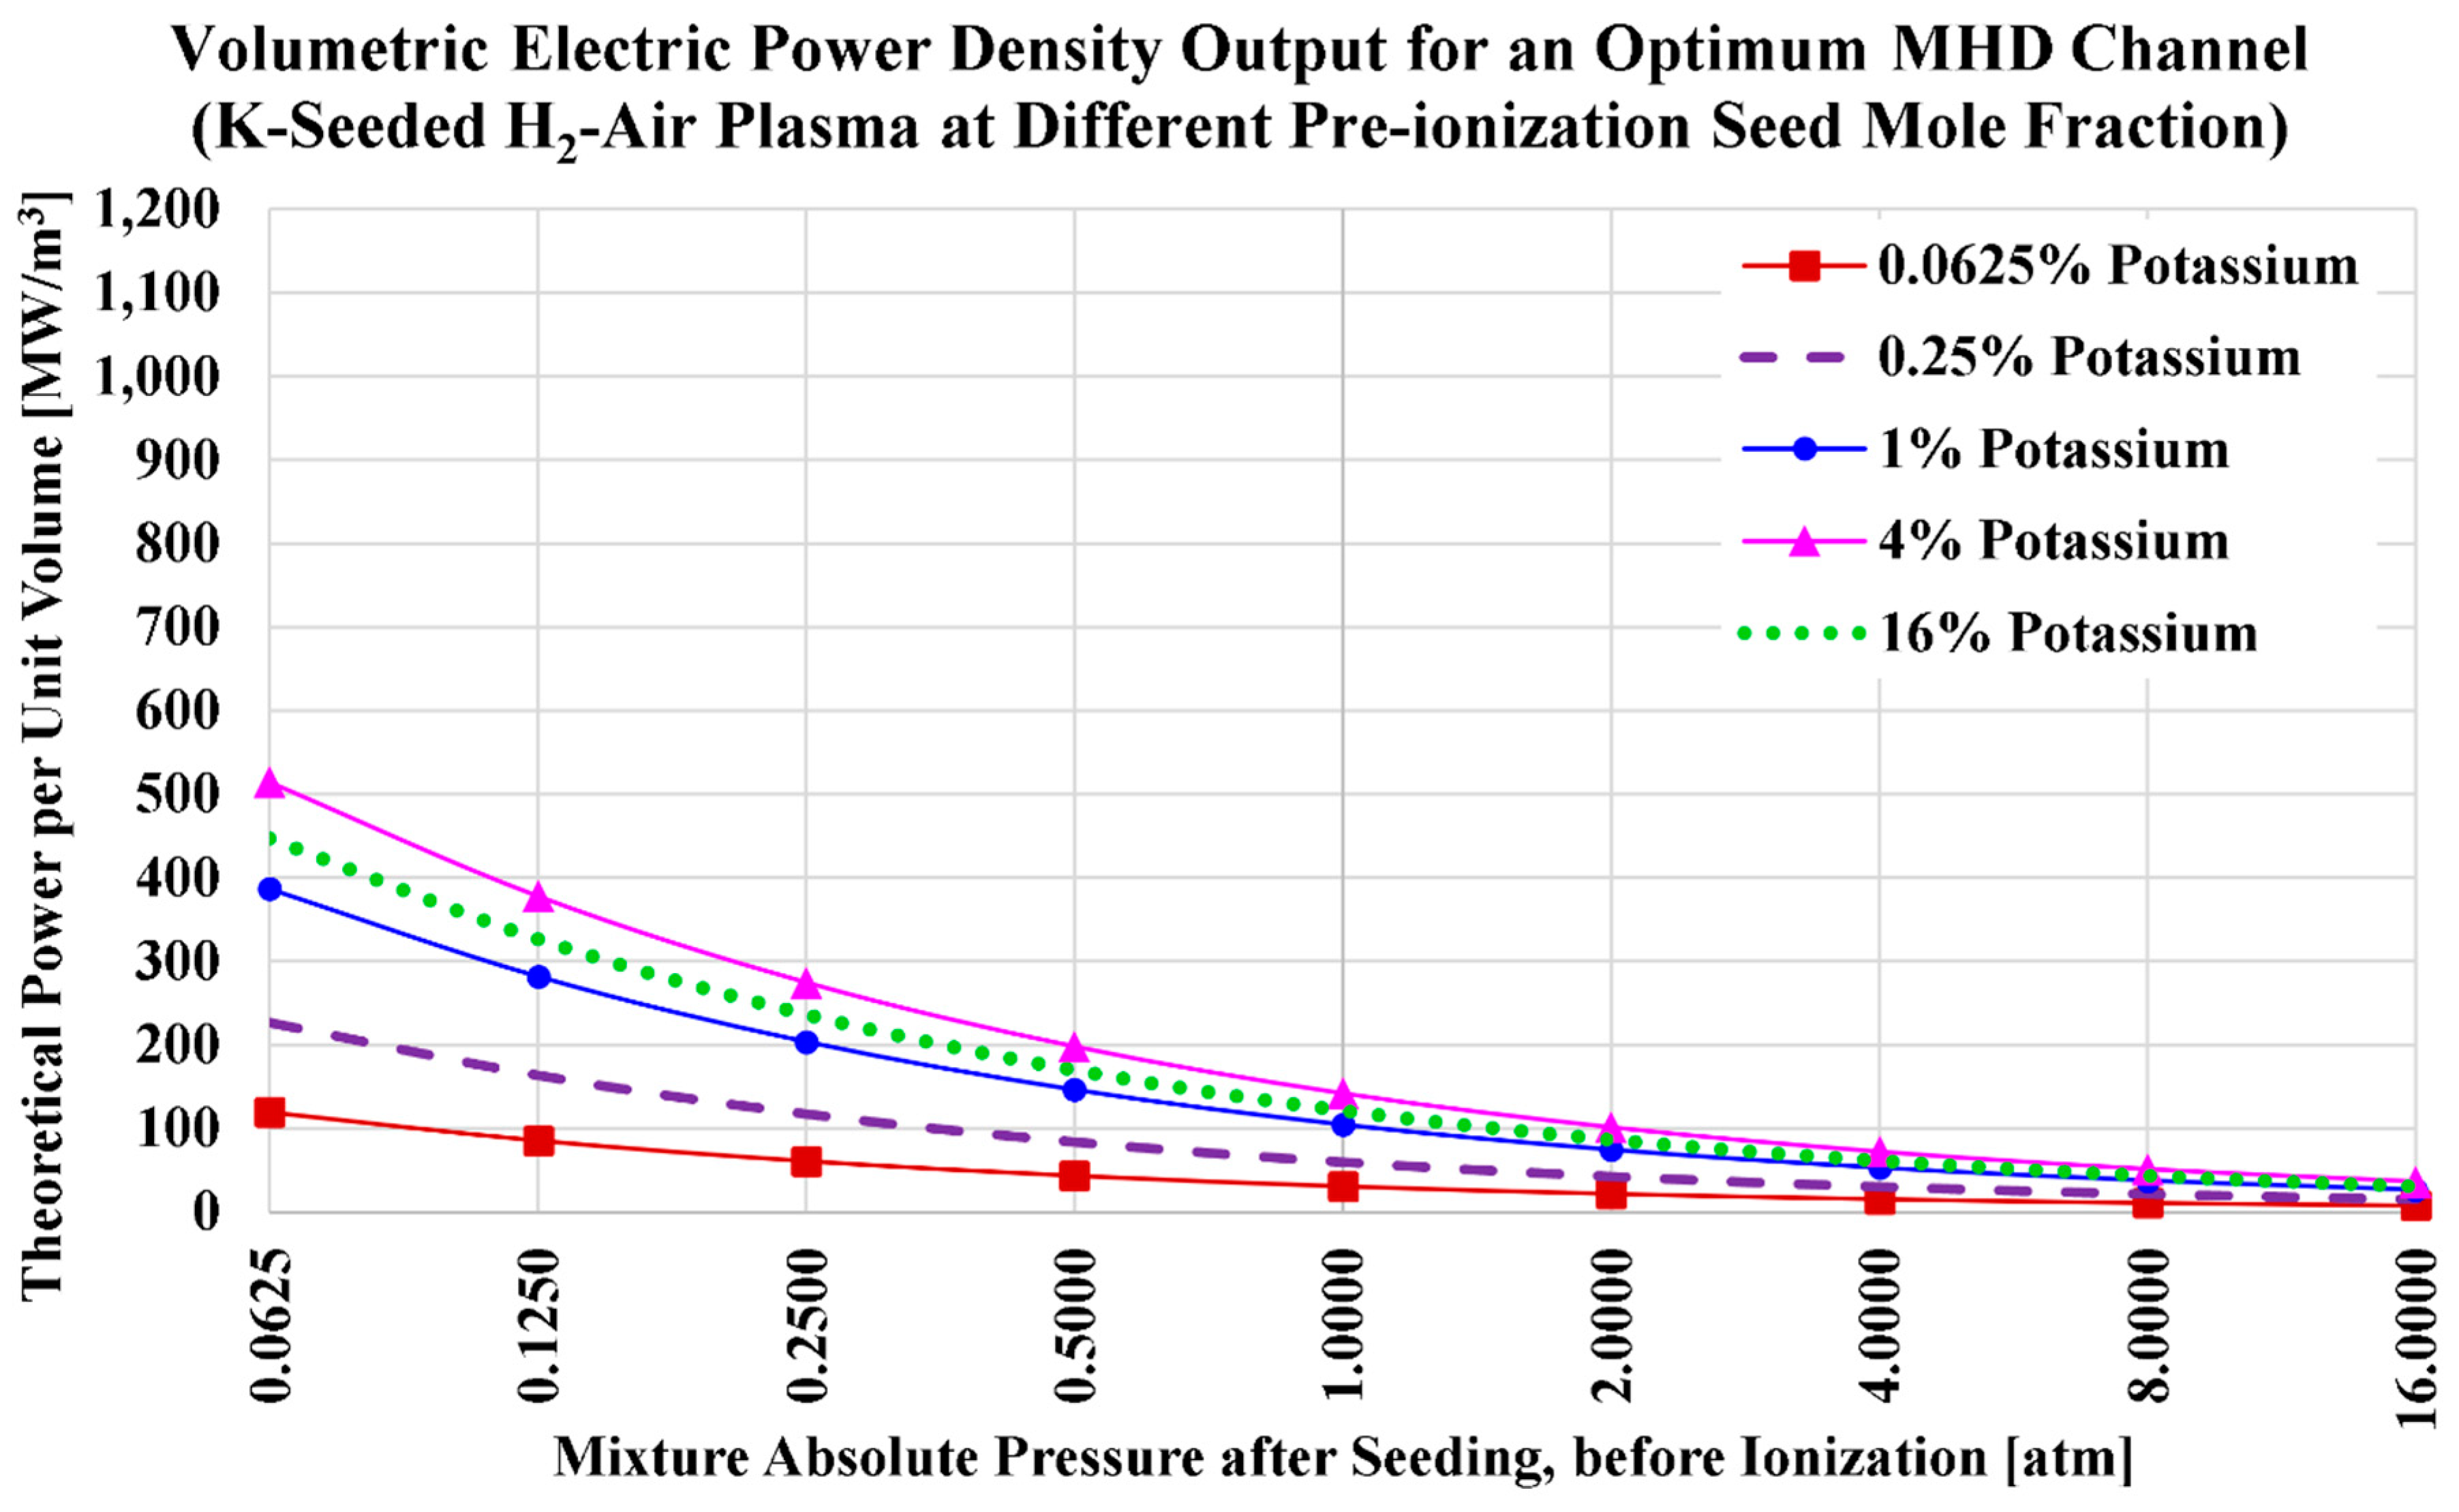
Figure 6.
Electric conductivity in the case of potassium seed and oxygen oxidizer.
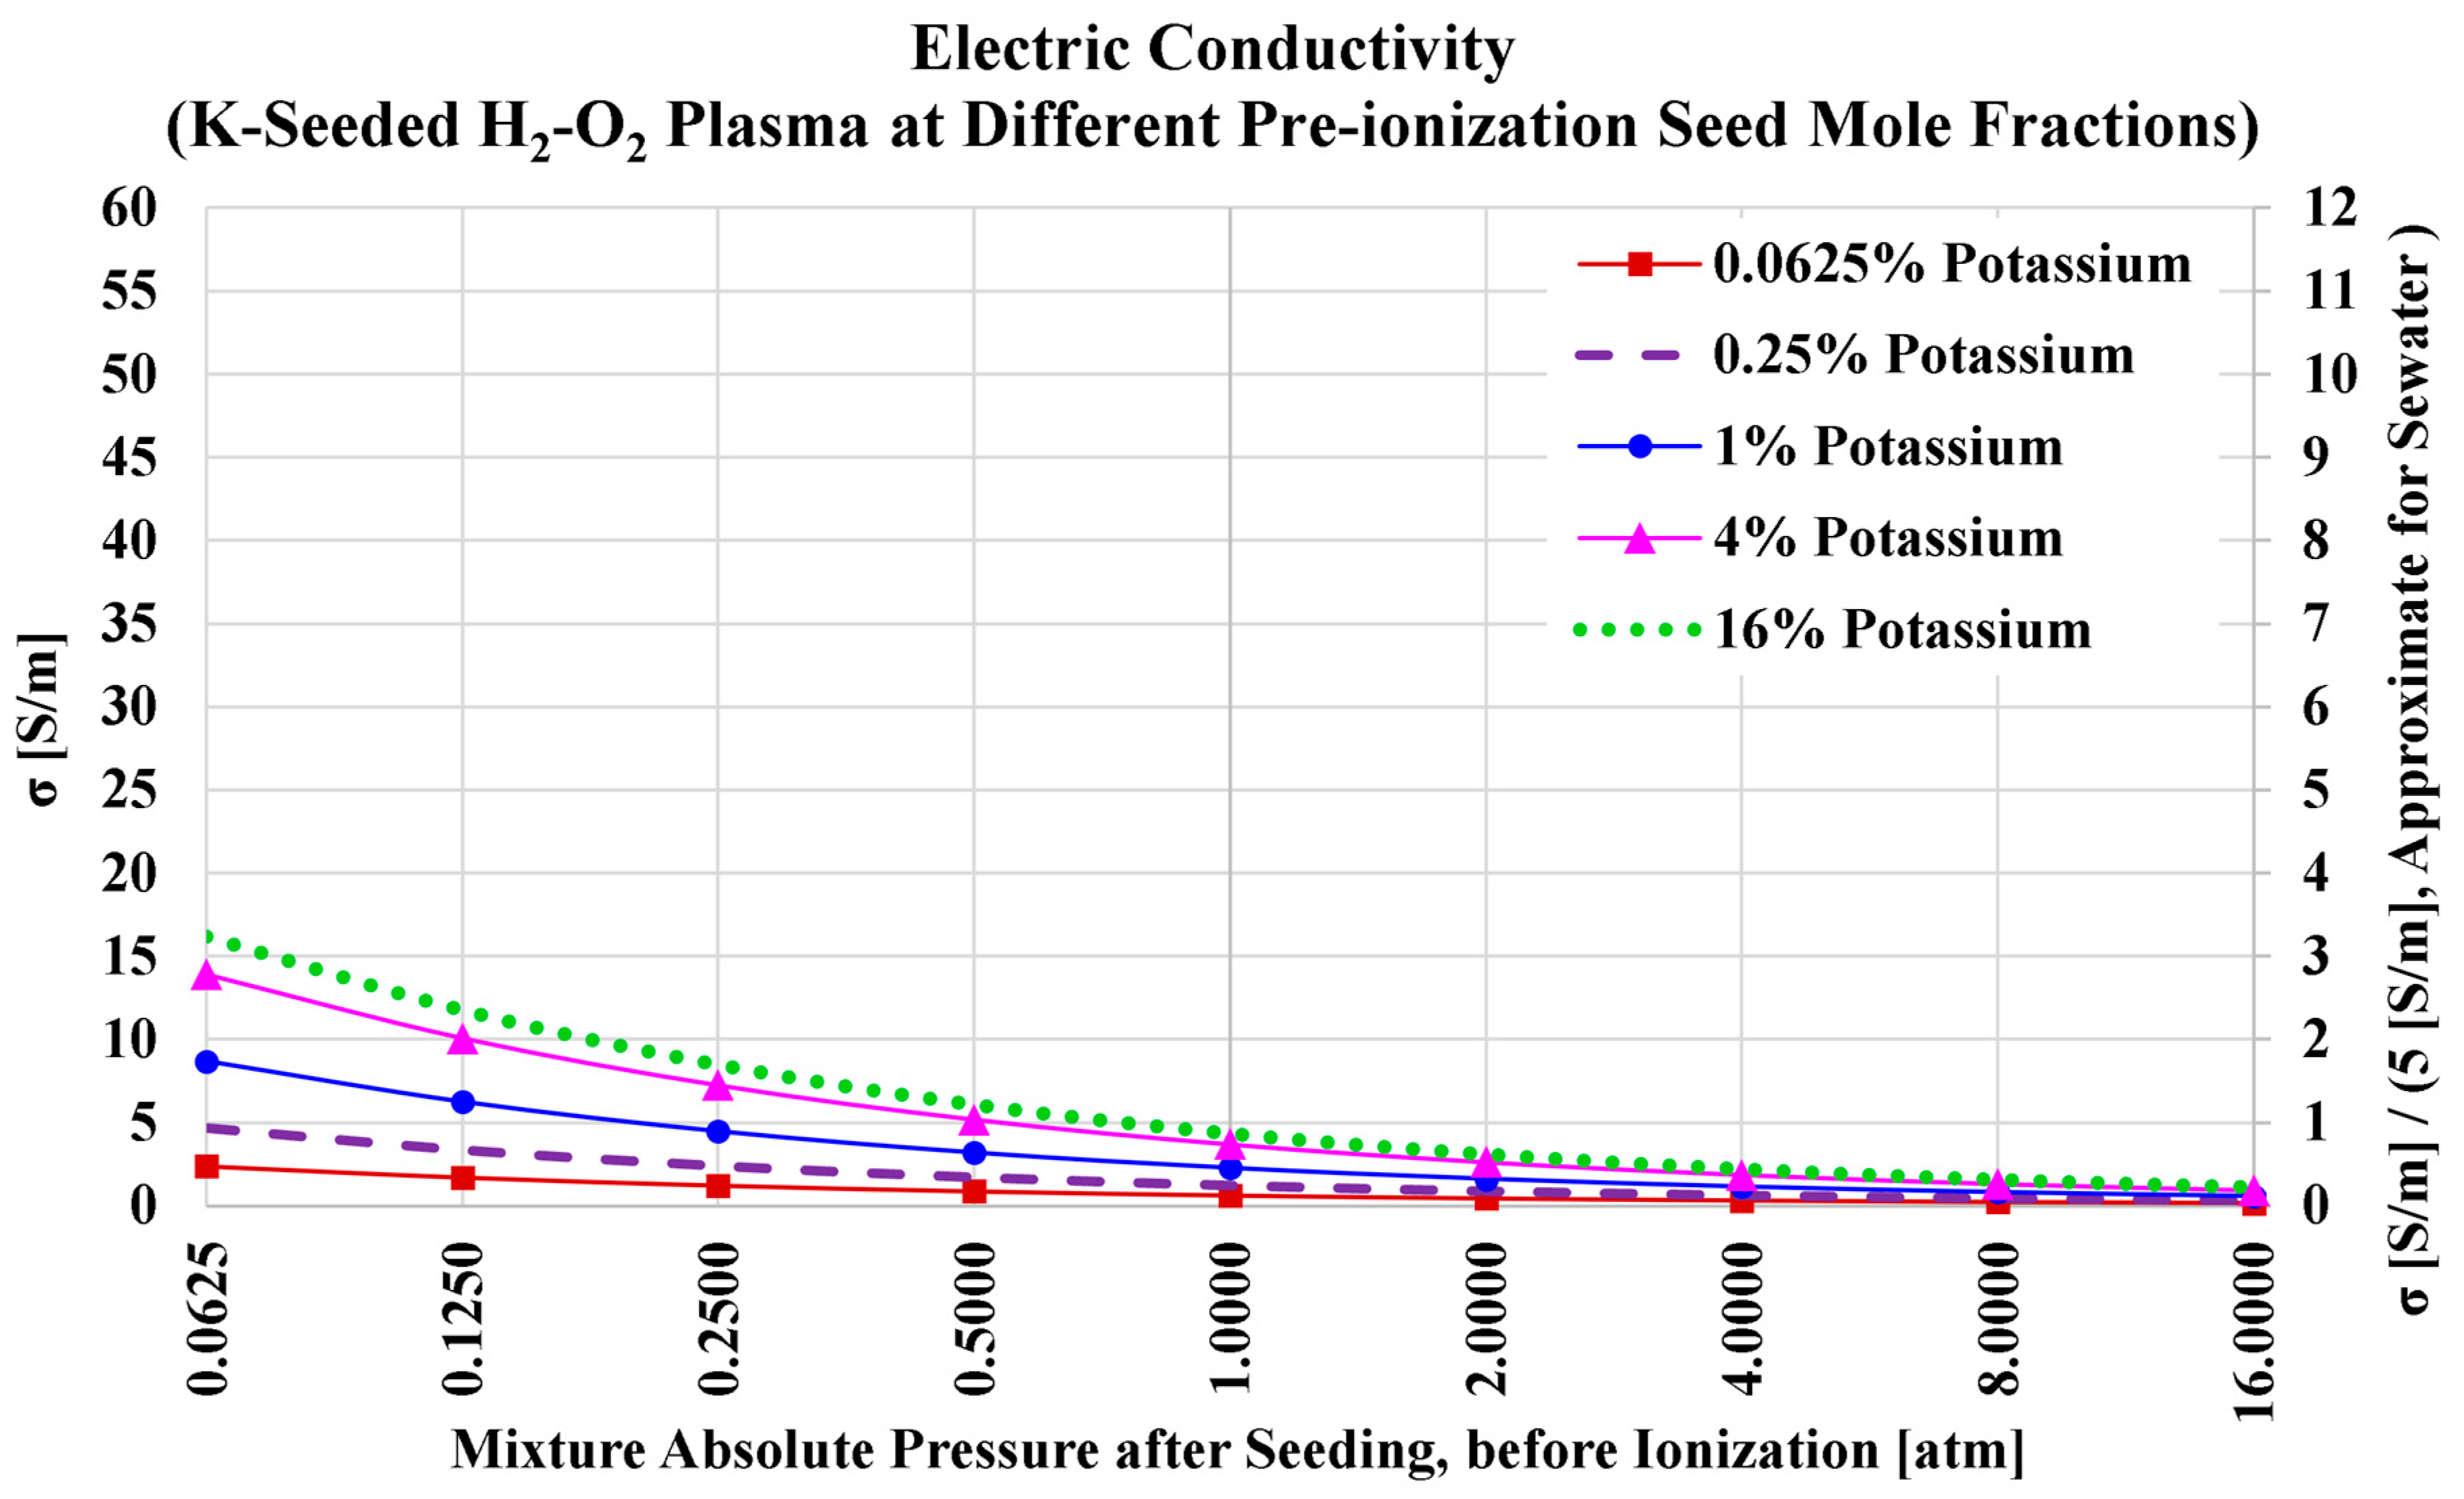
Figure 7.
Ideal power density in the case of potassium seed and oxygen oxidizer.
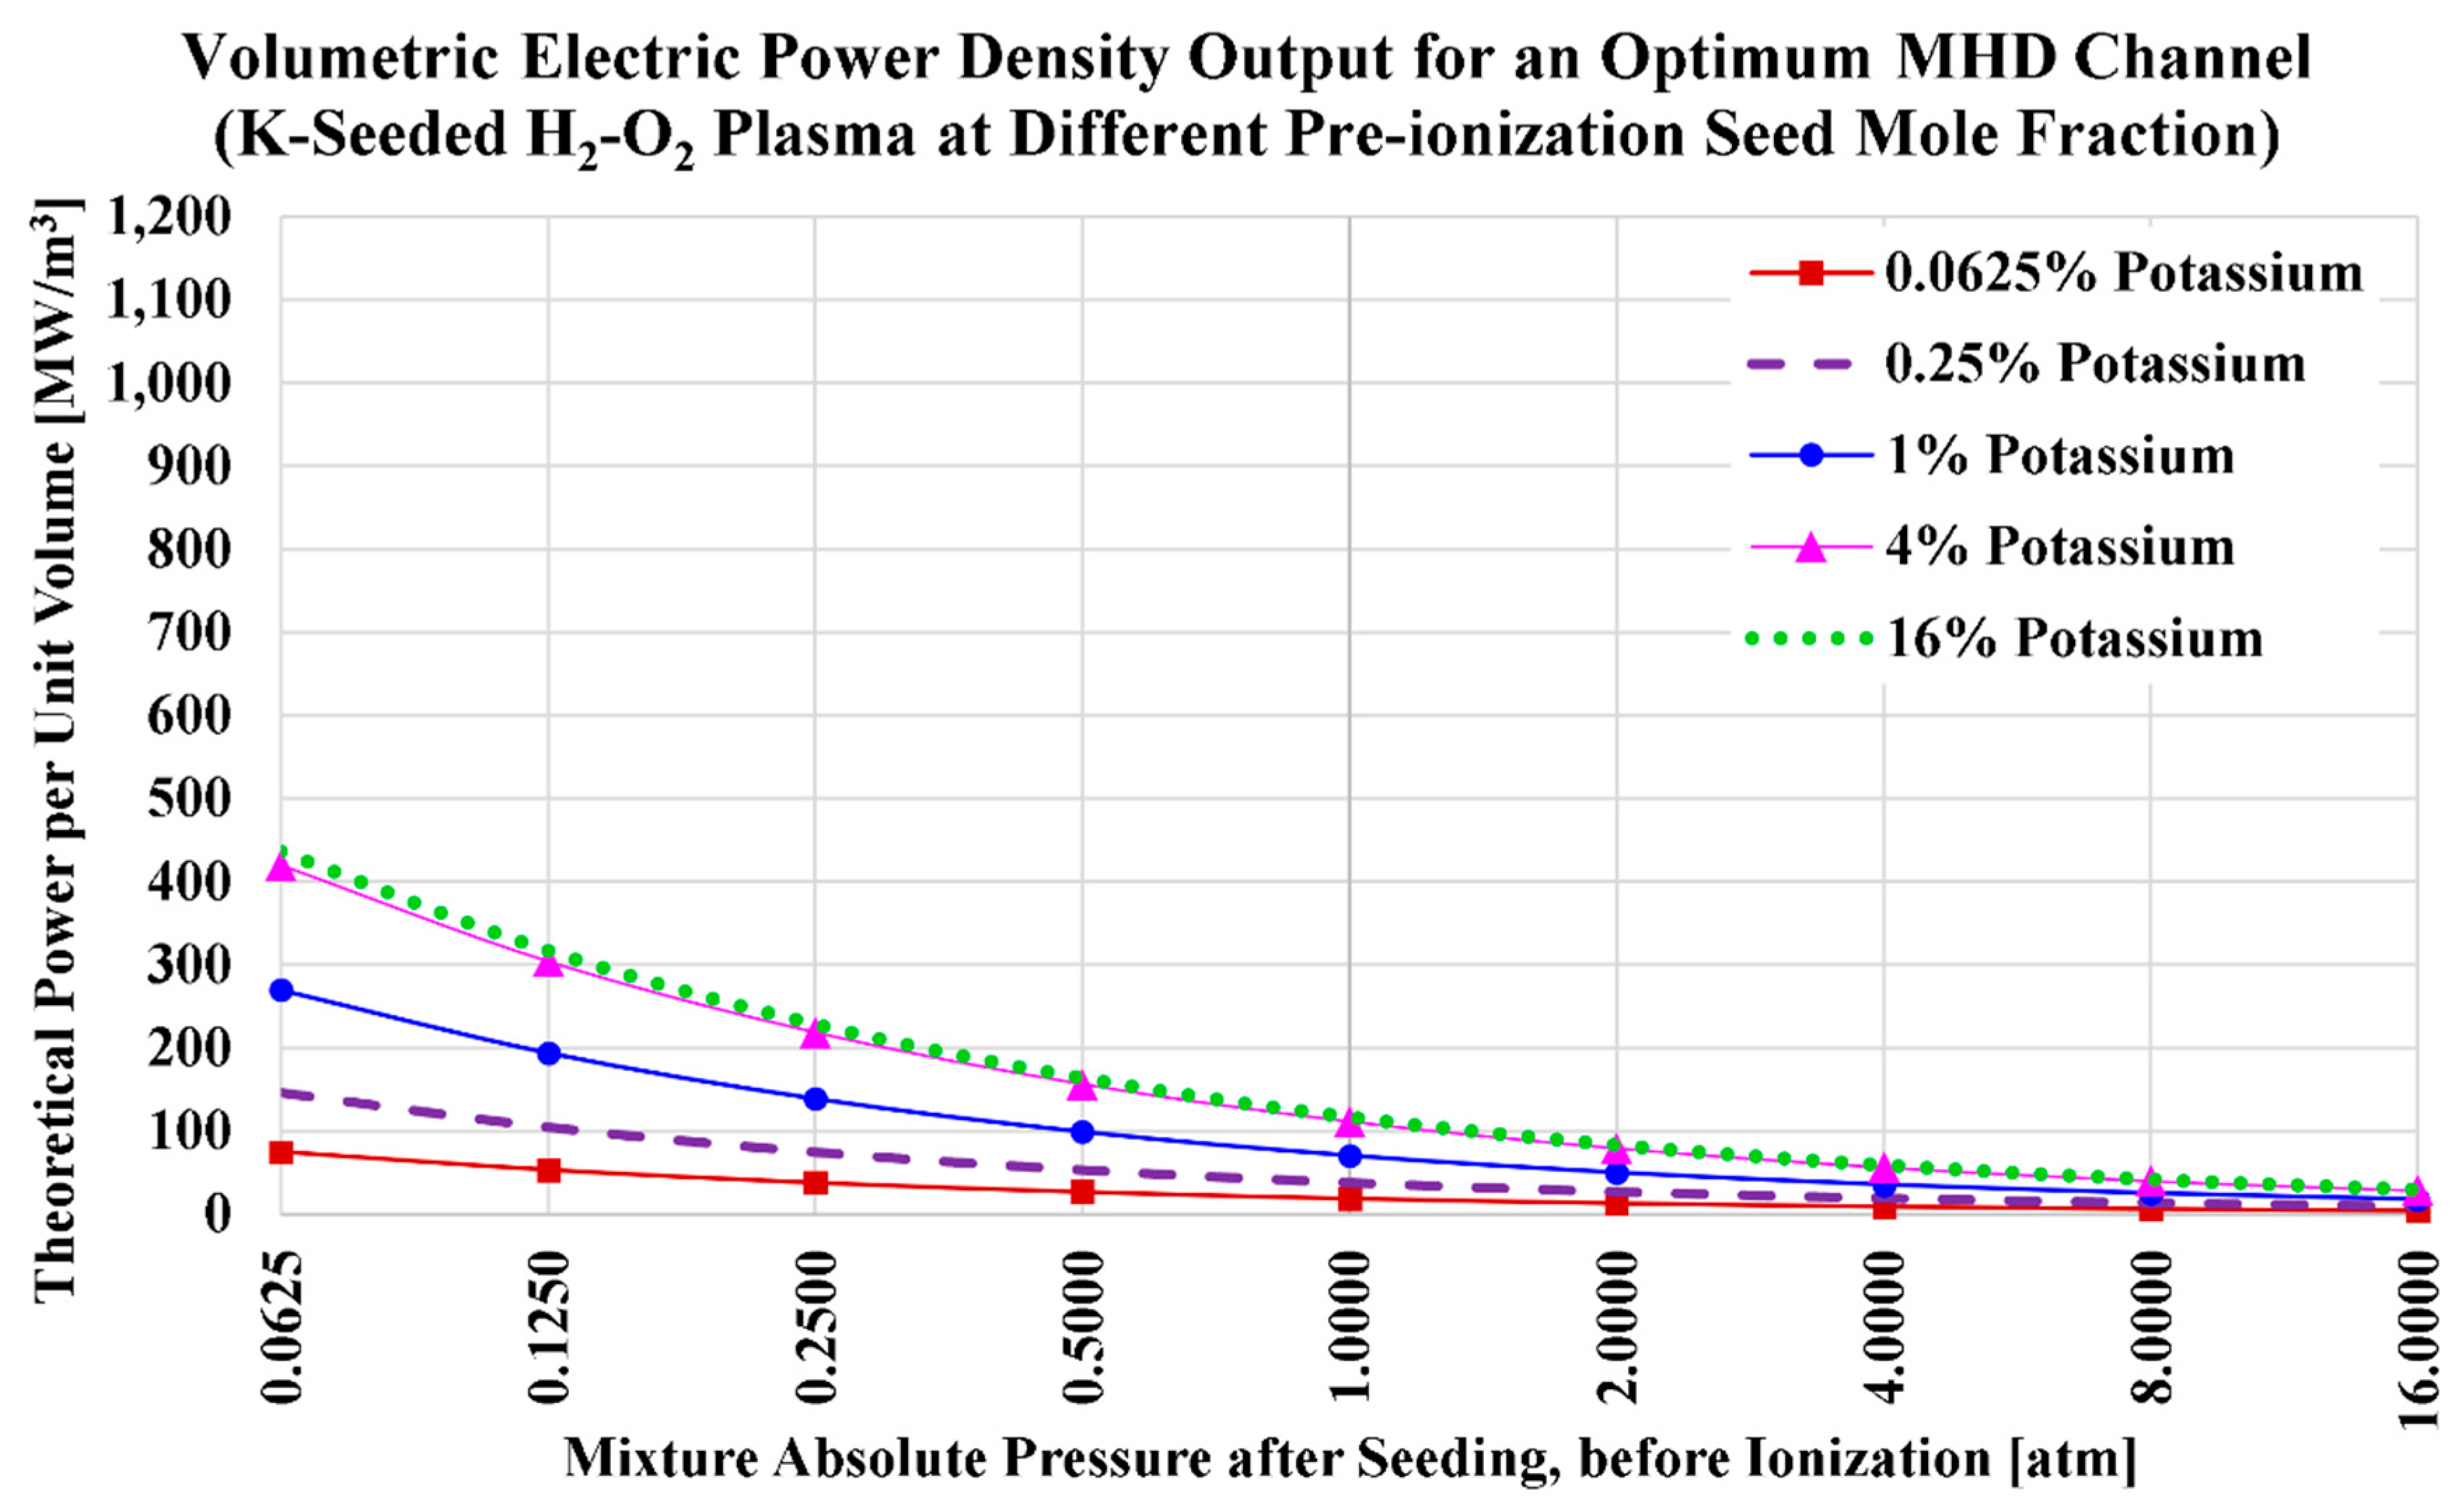
Figure 8.
Electric conductivity in the case of cesium seed and oxygen oxidizer.
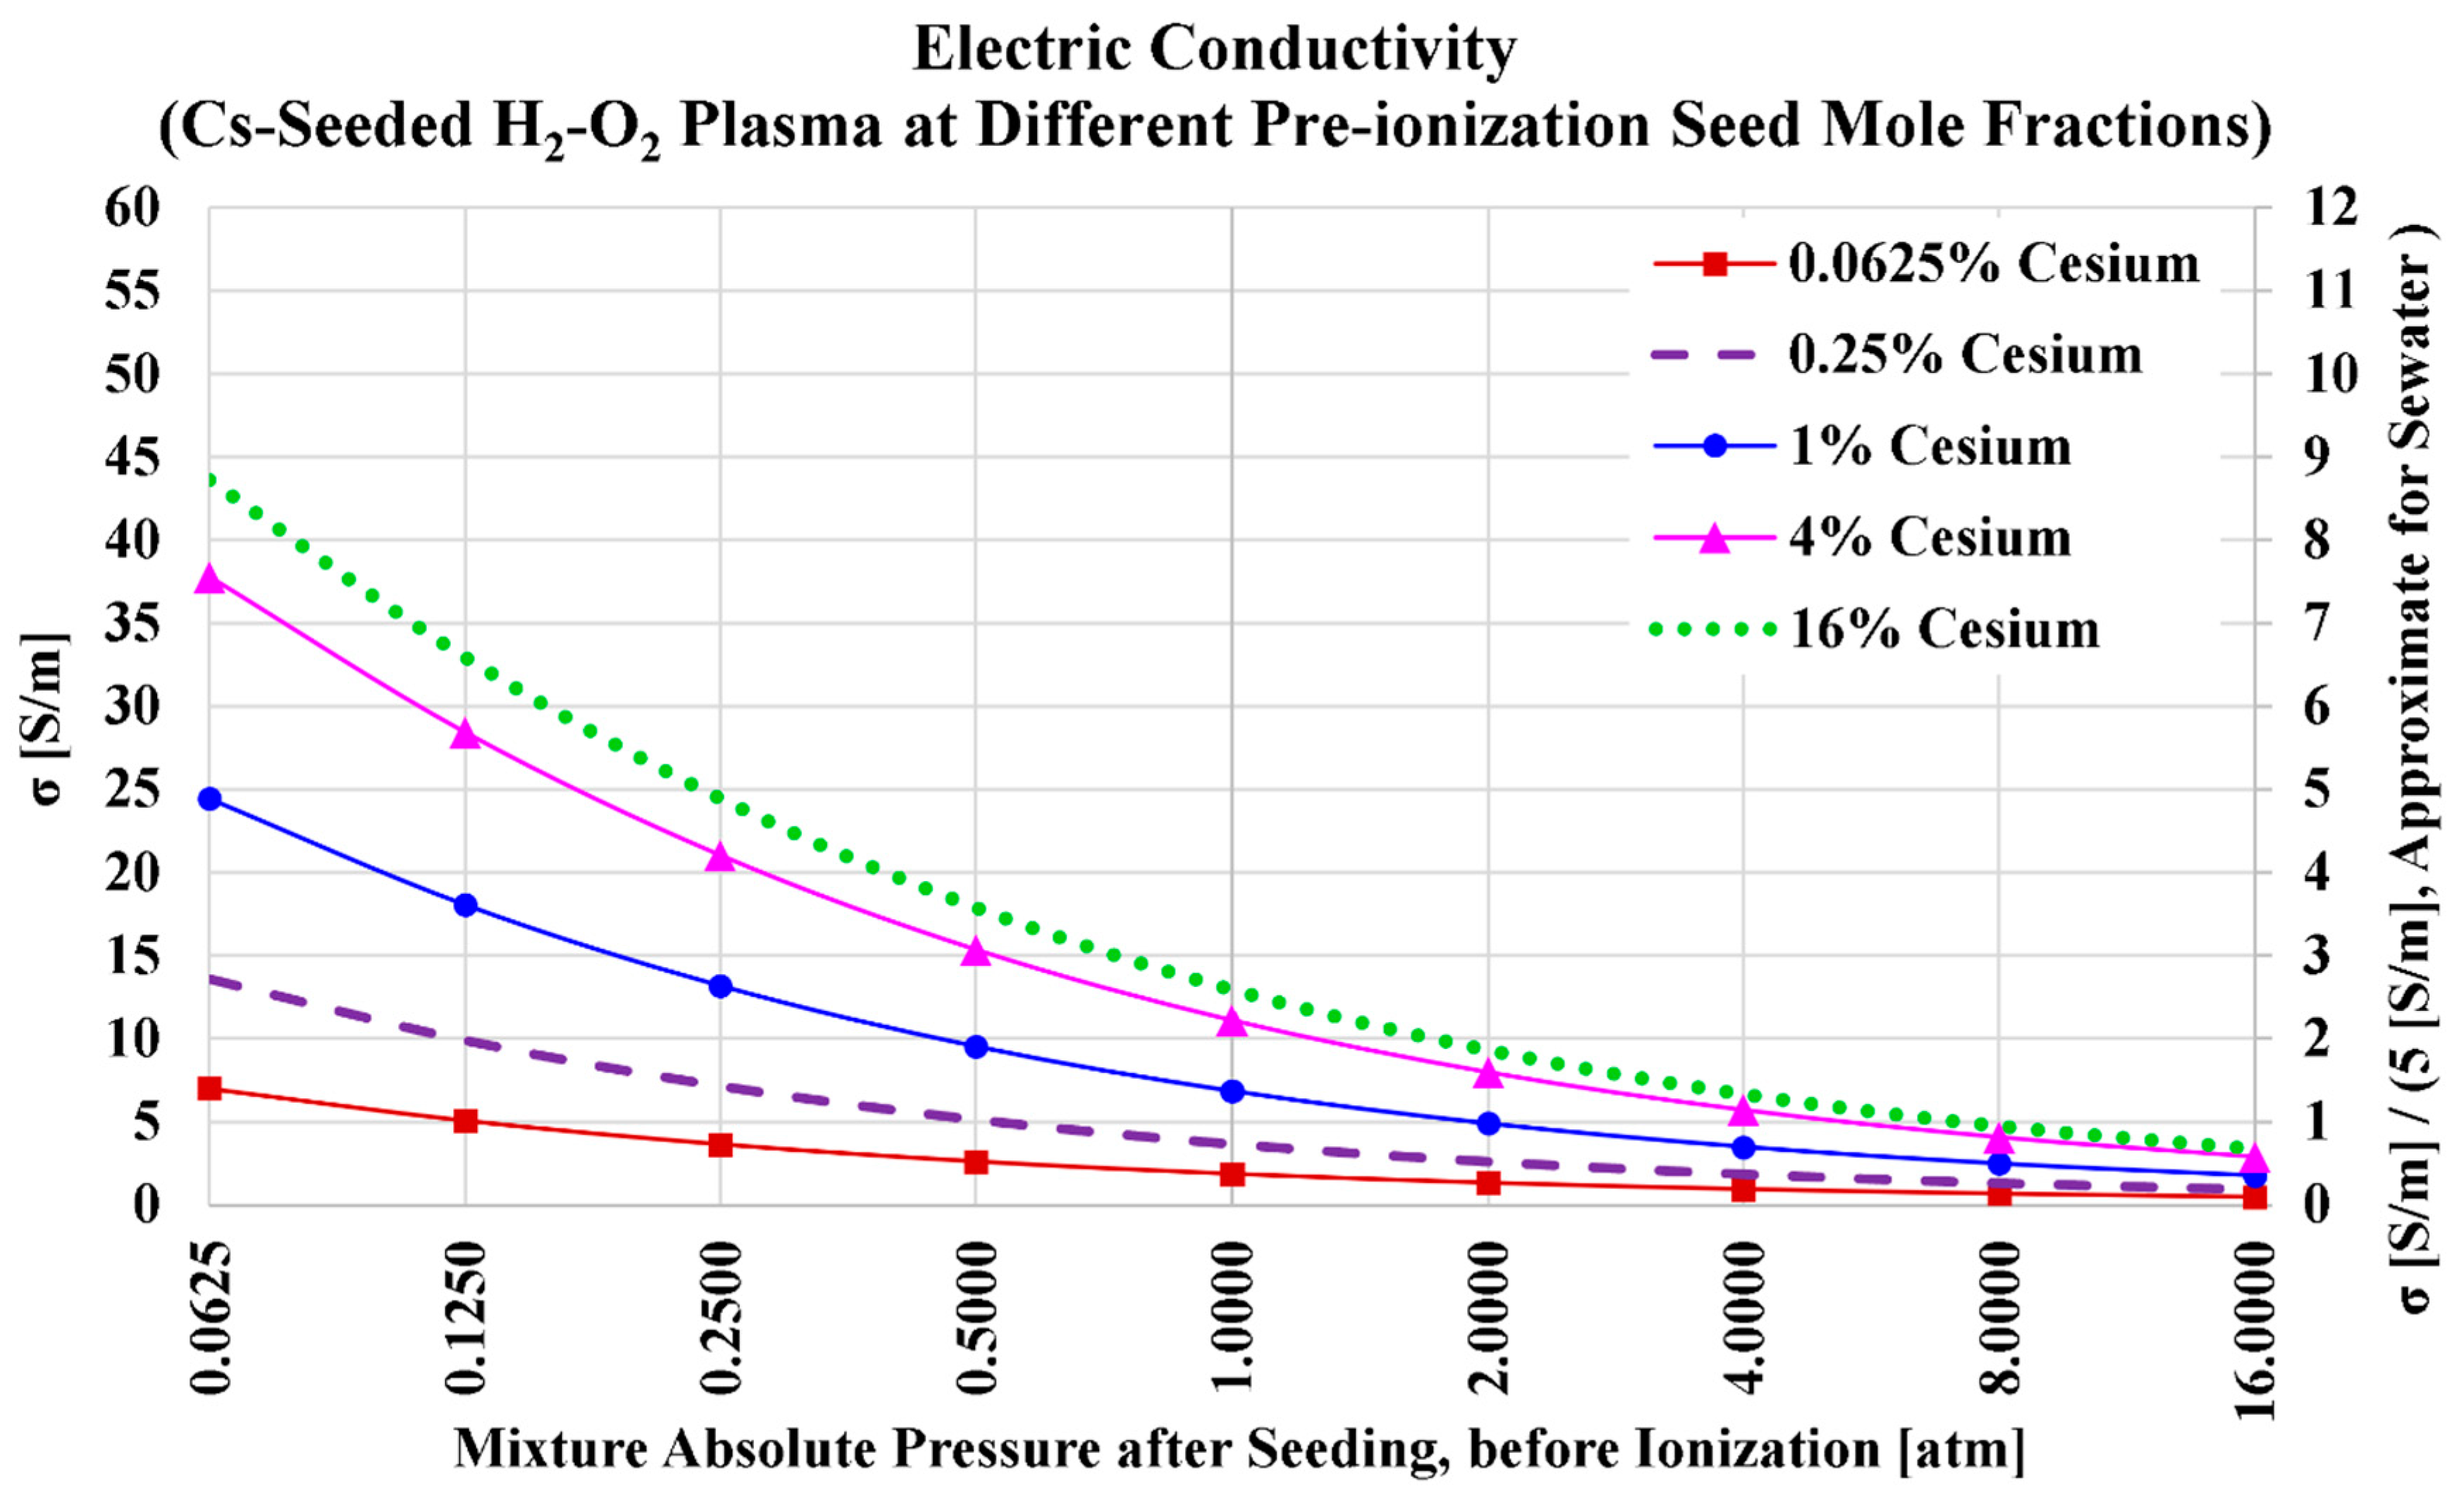
Figure 9.
Ideal power density in the case of cesium seed and oxygen oxidizer.
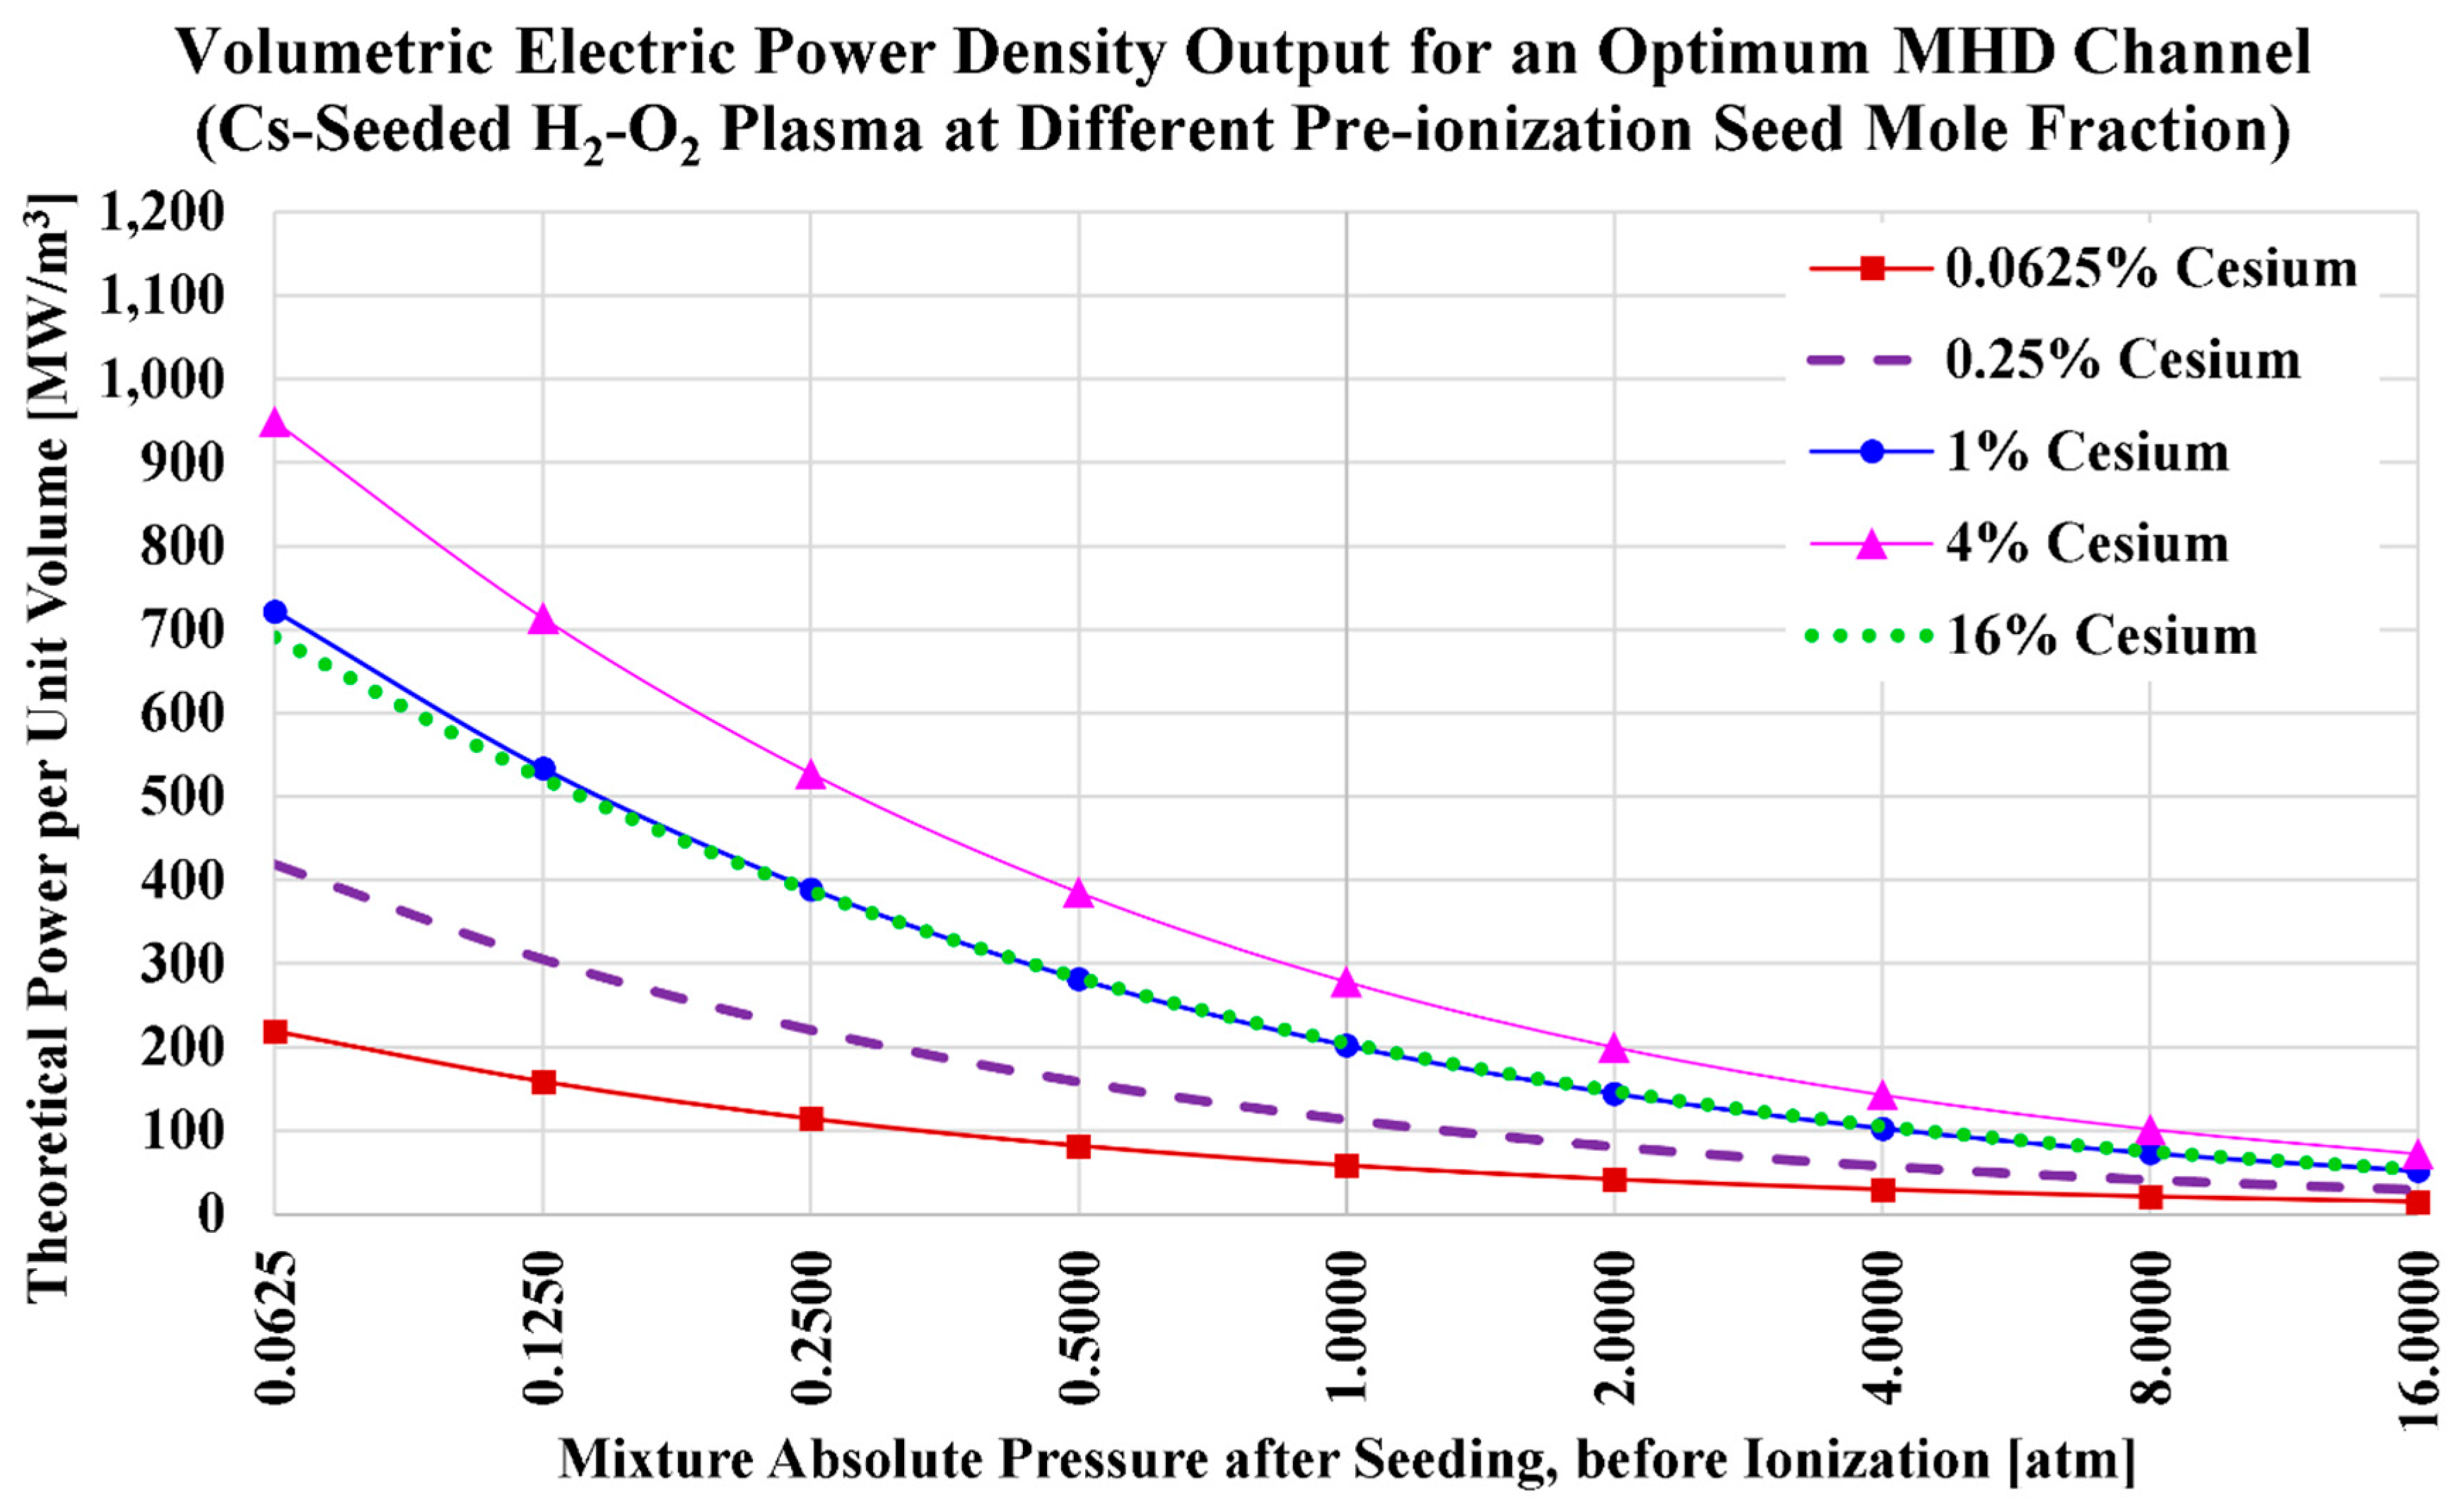
Table 1.
Example uses of Hydrogen.
| Serial number | Characteristics | References |
|---|---|---|
| 1. | Oil refinery | [7,8,9] |
| 2. | Fuel cell power units | [10,11,12] |
| 3. | Synthetizing ammonia | [13,14,15,16] |
| 4. | Electrified-type hydrogen-powered transport | [17,18,19,20,21,22] |
| 5. | Synthetizing methanol | [23,24,25] |
| 6. | Gas turbines powered by hydrogen or hydrogen-blended gas | [26,27,28] |
| 7. | Synthetizing hydrocarbon fuels | [29,30,31,32] |
| 8. | Aerospace and rocket propulsion | [33,34,35,36,37] |
| 9. | Reduction processes to extract a metal from its ore | [38,39,40,41] |
| 10. | Combustion-type hydrogen-powered transport | [42,43,44] |
| 11. | Specialized welding operations | [45,46,47] |
| 12. | Food industry | [48,49,50] |
| 13. | Cooling of turbogenerator winding | [51,52,53,54] |
Table 2.
Three fixed parameters in the current study.
| Fixed Parameter | Value | References |
| Temperature | 2,300 K = 2,026.85 °C | [149,150,151] |
| Magnetic-field flux density | 5 T (5 teslas) = 5,000 G (50,000 gausses) | [152,153,154,155] |
| Mach number | 2 | [156,157,158] |
Table 3.
Molecular weights used in the current study.
| Gaseous Species | Molecular Weight [kg/kmol] | Reference |
| Water vapor (H2O) | 18.0153 | [184] |
| Nitrogen (N2) | 28.0134 | [185] |
| Cesium vapor (Cs) | 132.9054519 | [186] |
| Potassium vapor (K) | 39.0983 | [187] |
Table 4.
Fitting coefficients of the specific heat capacities at constant pressure.
| ) | ) | |||
|---|---|---|---|---|
| H2O | N2 | Cs | K | |
| 1.034972096e06 | 5.877124060e05 | 6.166040900e06 | –3.566422360e06 | |
| –2.412698562e03 | –2.239249073e03 | –1.896175522e04 | 1.085289825e04 | |
| 4.646110780e00 | 6.066949220e00 | 2.483229903e01 | –1.054134898e01 | |
| 2.291998307e–03 | –6.139685500e–04 | –1.251977234e–02 | 8.009801350e–03 | |
| –6.836830480e–07 | 1.491806679e–07 | 3.309017390e–06 | –2.696681041e–06 | |
| 9.426468930e–11 | –1.923105485e–11 | –3.354012020e–10 | 4.715294150e–10 | |
| –4.822380530e–15 | 1.061954386e–15 | 9.626500908e–15 | –2.976897350e–14 | |
Table 6.
Pre-ionization properties of cesium-seeded air-hydrogen combustion mixture.
| Property | ) | ||||
|---|---|---|---|---|---|
| 0.0625% | 0.25% | 1% | 4% | 16% | |
| [%] | 0.062500% | 0.250000% | 1.000000% | 4.000000% | 16.000000% |
| [%] | 34.688476% | 34.623395% | 34.363068% | 33.321763% | 29.156543% |
| [%] | 65.249024% | 65.126605% | 64.636932% | 62.678237% | 54.843457% |
| [kg/kmol] | 24.611 | 24.814 | 25.627 | 28.878 | 41.881 |
| [J/(kg.K)] | 337.8384 | 335.0721 | 324.4457 | 287.9214 | 198.5258 |
| [-] | 1.243991 | 1.244265 | 1.245365 | 1.249869 | 1.269668 |
| [m/s] | 983.166 | 979.241 | 964.014 | 909.773 | 761.408 |
| [m/s] | 1,966.33 | 1,958.48 | 1,928.03 | 1,819.55 | 1,522.82 |
Table 7.
Electric conductivity [S/m] of hydrogen plasma (cesium seed, air oxidizer).
| Pressure [atm] | Plasma Electric Conductivity [S/m] (at the Different Cesium Levels) | |||||
|---|---|---|---|---|---|---|
| 0.0625% | 0.25% | 1% | 4% | 6% | 16% | |
| 0.0625 | 14.0116 | 25.8383 | 42.2099 | 55.0610 | 56.0605 | 51.7766 |
| 0.125 | 10.2858 | 19.2426 | 32.1752 | 42.6407 | 43.4010 | 39.6267 |
| 0.25 | 7.4702 | 14.1237 | 24.0379 | 32.2535 | 32.8188 | 29.6901 |
| 0.5 | 5.3830 | 10.2551 | 17.6829 | 23.9483 | 24.3616 | 21.8837 |
| 1 | 3.8573 | 7.3878 | 12.8589 | 17.5335 | 17.8321 | 15.9340 |
| 2 | 2.7530 | 5.2923 | 9.2729 | 12.7050 | 12.9189 | 11.4995 |
| 4 | 1.9593 | 3.7762 | 6.6470 | 9.1379 | 9.2904 | 8.2470 |
| 8 | 1.3917 | 2.6869 | 4.7447 | 6.5378 | 6.6461 | 5.8882 |
| 16 | 0.9871 | 1.9081 | 3.3768 | 4.6603 | 4.7371 | 4.1912 |
Table 8.
Power density [MW/m3] of hydrogen plasma (cesium seed and air oxidizer).
| Pressure [atm] | Volumetric Power Density [MW/m3] (at the Different Cesium Levels) | |||||
|---|---|---|---|---|---|---|
| 0.0625% | 0.25% | 1% | 3% | 4% | 16% | |
| 0.0625 | 338.596 | 619.417 | 980.665 | 1,146.828 | 1,139.332 | 750.427 |
| 0.125 | 248.561 | 461.299 | 747.529 | 886.885 | 882.329 | 574.332 |
| 0.25 | 180.520 | 338.585 | 558.474 | 670.107 | 667.395 | 430.315 |
| 0.5 | 130.082 | 245.844 | 410.828 | 497.150 | 495.543 | 317.173 |
| 1 | 93.213 | 177.106 | 298.752 | 363.771 | 362.806 | 230.940 |
| 2 | 66.527 | 126.871 | 215.438 | 263.484 | 262.894 | 166.669 |
| 4 | 47.347 | 90.526 | 154.430 | 189.454 | 189.083 | 119.528 |
| 8 | 33.631 | 64.413 | 110.234 | 135.521 | 135.281 | 85.341 |
| 16 | 23.854 | 45.743 | 78.453 | 96.591 | 96.432 | 60.745 |
Table 9.
Pre-ionization properties of potassium-seeded air-hydrogen combustion mixture.
| Property | ) | ||||
|---|---|---|---|---|---|
| 0.0625% | 0.25% | 1% | 4% | 16% | |
| [%] | 0.062500% | 0.250000% | 1.000000% | 4.000000% | 16.000000% |
| [%] | 34.688476% | 34.623395% | 34.363068% | 33.321763% | 29.156543% |
| [%] | 65.249024% | 65.126605% | 64.636932% | 62.678237% | 54.843457% |
| [kg/kmol] | 24.552 | 24.579 | 24.689 | 25.125 | 26.872 |
| [J/(kg.K)] | 338.6451 | 338.2691 | 336.7734 | 330.9206 | 309.4112 |
| [-] | 1.243994 | 1.244278 | 1.245418 | 1.250087 | 1.270686 |
| [m/s] | 984.341 | 983.906 | 982.178 | 975.430 | 950.935 |
| [m/s] | 1,968.68 | 1,967.81 | 1,964.36 | 1,950.86 | 1,901.87 |
Table 10.
Electric conductivity [S/m] of hydrogen plasma (potassium seed, air oxidizer).
| Pressure [atm] | Plasma Electric Conductivity [S/m] (at the Different Potassium Levels) | |||||
|---|---|---|---|---|---|---|
| 0.0625% | 0.25% | 1% | 4% | 6% | 16% | |
| 0.0625 | 4.9217 | 9.3443 | 16.0343 | 21.6201 | 21.9827 | 19.7671 |
| 0.125 | 3.5282 | 6.7405 | 11.6895 | 15.8856 | 16.1504 | 14.4434 |
| 0.25 | 2.5189 | 4.8334 | 8.4459 | 11.5428 | 11.7342 | 10.4518 |
| 0.5 | 1.7931 | 3.4513 | 6.0630 | 8.3195 | 8.4568 | 7.5108 |
| 1 | 1.2739 | 2.4570 | 4.3325 | 5.9617 | 6.0597 | 5.3707 |
| 2 | 0.9037 | 1.7456 | 3.0859 | 4.2546 | 4.3243 | 3.8271 |
| 4 | 0.6405 | 1.2383 | 2.1931 | 3.0277 | 3.0772 | 2.7205 |
| 8 | 0.4536 | 0.8776 | 1.5561 | 2.1502 | 2.1853 | 1.9307 |
| 16 | 0.3211 | 0.6215 | 1.1029 | 1.5250 | 1.5499 | 1.3686 |
Table 11.
Power density [MW/m3] of hydrogen plasma (potassium seed and air oxidizer).
| Pressure [atm] | Volumetric Power Density [MW/m3] (at the Different Potassium Levels) | |||||
|---|---|---|---|---|---|---|
| 0.0625% | 0.25% | 1% | 4% | 5% | 16% | |
| 0.0625 | 119.219 | 226.149 | 386.697 | 514.268 | 518.972 | 446.874 |
| 0.125 | 85.464 | 163.132 | 281.914 | 377.864 | 381.364 | 326.521 |
| 0.25 | 61.016 | 116.977 | 203.689 | 274.564 | 277.128 | 236.283 |
| 0.5 | 43.435 | 83.528 | 146.221 | 197.892 | 199.751 | 169.796 |
| 1 | 30.858 | 59.464 | 104.486 | 141.808 | 143.144 | 121.415 |
| 2 | 21.890 | 42.247 | 74.422 | 101.202 | 102.158 | 86.519 |
| 4 | 15.515 | 29.969 | 52.891 | 72.019 | 72.698 | 61.502 |
| 8 | 10.988 | 21.239 | 37.528 | 51.146 | 51.631 | 43.647 |
| 16 | 7.778 | 15.041 | 26.598 | 36.275 | 36.618 | 30.940 |
Table 12.
Pre-ionization properties of potassium-seeded oxy-hydrogen combustion mixture.
| Property | ) | ||||
|---|---|---|---|---|---|
| 0.0625% | 0.25% | 1% | 4% | 16% | |
| [%] | 0.0625% | 0.25% | 1% | 4% | 16% |
| [%] | 99.9375% | 99.75% | 99% | 96% | 84% |
| [kg/kmol] | 18.028 | 18.068 | 18.226 | 18.859 | 21.389 |
| [J/(kg.K)] | 461.1850 | 460.1760 | 456.1837 | 440.8839 | 388.7337 |
| [-] | 1.183244 | 1.183490 | 1.184479 | 1.188543 | 1.206766 |
| [m/s] | 1,120.311 | 1,119.201 | 1,114.801 | 1,097.826 | 1,038.727 |
| [m/s] | 2,240.62 | 2,238.40 | 2,229.60 | 2,195.65 | 2,077.45 |
Table 13.
Electric conductivity [S/m] of hydrogen plasma (potassium seed, oxygen oxidizer).
| Pressure [atm] | Plasma Electric Conductivity [S/m] (at the Different Potassium Levels) | |||||
|---|---|---|---|---|---|---|
| 0.0625% | 0.25% | 1% | 4% | 13% | 16% | |
| 0.0625 | 2.3874 | 4.6735 | 8.6753 | 13.9154 | 16.2537 | 16.1854 |
| 0.125 | 1.7027 | 3.3408 | 6.2385 | 10.0857 | 11.8100 | 11.7558 |
| 0.25 | 1.2112 | 2.3803 | 4.4635 | 7.2563 | 8.5119 | 8.4704 |
| 0.5 | 0.8601 | 1.6920 | 3.1821 | 5.1932 | 6.0993 | 6.0683 |
| 1 | 0.6099 | 1.2008 | 2.2628 | 3.7030 | 4.3527 | 4.3300 |
| 2 | 0.4322 | 0.8513 | 1.6063 | 2.6335 | 3.0974 | 3.0809 |
| 4 | 0.3060 | 0.6030 | 1.1389 | 1.8696 | 2.1997 | 2.1878 |
| 8 | 0.2166 | 0.4269 | 0.8068 | 1.3256 | 1.5601 | 1.5516 |
| 16 | 0.1533 | 0.3021 | 0.5712 | 0.9391 | 1.1054 | 1.0993 |
Table 14.
Power density [MW/m3] of hydrogen plasma (potassium seed, oxygen oxidizer).
| Pressure [atm] | Volumetric Power Density [MW/m3] (at the Different Potassium Levels) | |||||
|---|---|---|---|---|---|---|
| 0.0625% | 0.25% | 1% | 4% | 9% | 16% | |
| 0.0625 | 74.910 | 146.352 | 269.538 | 419.279 | 458.894 | 436.583 |
| 0.125 | 53.426 | 104.618 | 193.827 | 303.888 | 333.446 | 317.099 |
| 0.25 | 38.004 | 74.540 | 138.679 | 218.636 | 240.334 | 228.479 |
| 0.5 | 26.988 | 52.985 | 98.866 | 156.474 | 172.221 | 163.685 |
| 1 | 19.137 | 37.603 | 70.304 | 111.573 | 122.907 | 116.797 |
| 2 | 13.561 | 26.659 | 49.907 | 79.349 | 87.463 | 83.104 |
| 4 | 9.601 | 18.883 | 35.385 | 56.332 | 62.116 | 59.013 |
| 8 | 6.796 | 13.368 | 25.067 | 39.941 | 44.054 | 41.853 |
| 16 | 4.810 | 9.460 | 17.747 | 28.296 | 31.215 | 29.652 |
Table 15.
Pre-ionization properties of cesium-seeded oxy-hydrogen combustion mixture.
| Property | ) | ||||
|---|---|---|---|---|---|
| 0.0625% | 0.25% | 1% | 4% | 16% | |
| [%] | 0.0625% | 0.25% | 1% | 4% | 16% |
| [%] | 99.9375% | 99.75% | 99% | 96% | 84% |
| [kg/kmol] | 18.087 | 18.303 | 19.164 | 22.611 | 36.398 |
| [J/(kg.K)] | 459.6900 | 454.2795 | 433.8539 | 367.7191 | 228.4336 |
| [-] | 1.183242 | 1.183482 | 1.184449 | 1.188419 | 1.206172 |
| [m/s] | 1,118.493 | 1,112.004 | 1,087.161 | 1,002.552 | 796.065 |
| [m/s] | 2,236.99 | 2,224.01 | 2,174.32 | 2,005.10 | 1,592.13 |
Table 16.
Electric conductivity [S/m] of hydrogen plasma (cesium seed, oxygen oxidizer).
| Pressure [atm] | Plasma Electric Conductivity [S/m] (at the Different Cesium Levels) | |||||
|---|---|---|---|---|---|---|
| 0.0625% | 0.25% | 1% | 4% | 13% | 16% | |
| 0.0625 | 6.9878 | 13.5501 | 24.4282 | 37.7620 | 43.6710 | 43.5831 |
| 0.125 | 5.0633 | 9.8700 | 18.0514 | 28.4084 | 33.0271 | 32.9308 |
| 0.25 | 3.6427 | 7.1273 | 13.1716 | 21.0071 | 24.5184 | 24.4295 |
| 0.5 | 2.6073 | 5.1146 | 9.5223 | 15.3342 | 17.9480 | 17.8732 |
| 1 | 1.8595 | 3.6539 | 6.8382 | 11.0877 | 13.0034 | 12.9440 |
| 2 | 1.3227 | 2.6023 | 4.8876 | 7.9629 | 9.3514 | 9.3060 |
| 4 | 0.9392 | 1.8492 | 3.4818 | 5.6913 | 6.6899 | 6.6560 |
| 8 | 0.6661 | 1.3121 | 2.4746 | 4.0541 | 4.7684 | 4.7435 |
| 16 | 0.4719 | 0.9300 | 1.7559 | 2.8812 | 3.3901 | 3.3721 |
Table 17.
Power density [MW/m3] of hydrogen plasma (cesium seed, oxygen oxidizer).
| Pressure [atm] | Volumetric Power Density [MW/m3] (at the Different Cesium Levels) | |||||
|---|---|---|---|---|---|---|
| 0.0625% | 0.25% | 1% | 4% | 5% | 16% | |
| 0.0625 | 218.548 | 418.885 | 721.804 | 948.874 | 947.117 | 690.486 |
| 0.125 | 158.358 | 305.119 | 533.382 | 713.839 | 714.060 | 521.722 |
| 0.25 | 113.928 | 220.332 | 389.194 | 527.861 | 528.886 | 387.036 |
| 0.5 | 81.545 | 158.112 | 281.365 | 385.314 | 386.524 | 283.165 |
| 1 | 58.157 | 112.956 | 202.055 | 278.609 | 279.721 | 205.072 |
| 2 | 41.368 | 80.447 | 144.419 | 200.090 | 201.008 | 147.435 |
| 4 | 29.374 | 57.166 | 102.880 | 143.010 | 143.725 | 105.451 |
| 8 | 20.833 | 40.562 | 73.119 | 101.870 | 102.409 | 75.151 |
| 16 | 14.759 | 28.750 | 51.883 | 72.398 | 72.793 | 53.424 |
Disclaimer/Publisher’s Note: The statements, opinions and data contained in all publications are solely those of the individual author(s) and contributor(s) and not of MDPI and/or the editor(s). MDPI and/or the editor(s) disclaim responsibility for any injury to people or property resulting from any ideas, methods, instructions or products referred to in the content. |
© 2025 by the authors. Licensee MDPI, Basel, Switzerland. This article is an open access article distributed under the terms and conditions of the Creative Commons Attribution (CC BY) license (http://creativecommons.org/licenses/by/4.0/).
Copyright: This open access article is published under a Creative Commons CC BY 4.0 license, which permit the free download, distribution, and reuse, provided that the author and preprint are cited in any reuse.


