Submitted:
08 April 2025
Posted:
09 April 2025
You are already at the latest version
Abstract
Achieving sustainable energy futures is a cornerstone of global efforts to combat environmental degradation and align with corporate social responsibility (CSR) objectives. This study examines the complex relationship between energy consumption, carbon emissions, and the moderating influence of Foreign Direct Investment (FDI) in the E-7 economies—Brazil, China, India, Indonesia, Mexico, Russia, and Turkey—from 2000 to 2022. Employing advanced panel data methodologies, including continuously updated fully modified (Cup-FM) and continuously updated bias-corrected (Cup-BC) techniques, we explore the long-term dynamics of energy use, urbanization, human capital, and FDI. Our findings reveal persistent cointegration among these variables, with energy consumption, urbanization, and human capital significantly contributing to CO₂ emissions. However, FDI emerged as a critical mitigating factor, exhibiting a negative correlation with carbon emissions and moderating the emission-enhancing effects of urbanization and human capital. These results underscore the dual role of FDI as both an engine of economic growth and a catalyst for environmental sustainability. This study advocates prioritizing green FDI inflows, particularly in renewable energy infrastructure, to harmonize economic development with global sustainability targets. By integrating CSR strategies with energy transition policies, this study provides actionable insights for policymakers and corporate leaders to foster sustainable development in rapidly industrializing economies. The findings contribute to the broader discourse on sustainable development, emphasizing the need for strategic investments and policy frameworks to achieve a low-carbon future.
Keywords:
Sustainable development
; Corporate social responsibility (CSR)
; Foreign direct investment (FDI)
; Carbon emissions
; Energy consumption
; Environmental sustainability
; Renewable energy
; Urbanization
; Human capital
1. Introduction
Emerging countries are developing rapidly and are marked by profound transformations in multiple dimensions. These include accelerated urbanization, escalating energy consumption, investment in human capital, and sustained economic expansion [1]. Human capital, which encompasses a workforce’s collective educational attainment, technical competencies, and cognitive skills, is a pivotal driver of economic development and efficient allocation of productive resources [2]. Urbanization, an integral component of socioeconomic progress, exacerbates energy consumption and carbon dioxide (CO₂) emissions through intensified resource demand; however, its agglomerative effects also enable strategic urban planning, systemic efficiencies in energy infrastructure, and economies of scale in large-scale public transportation networks, fostering pathways for low-carbon transitions [3]. Energy consumption is a critical factor in these countries. Other factors that substantially impact the environment are the type of energy consumed and its efficiency. As these countries grow economically, energy demand increases, often resulting in increased CO2 emissions unless there is a substantial shift towards renewable sources [4]. Economic growth is impossible without increased industrial production and consumer demand, which increases CO2 emissions. This relationship is nonlinear and is influenced by the type of economic activity and technology used [5]. The role of Foreign Direct Investment (FDI) in this context is crucial and complex. On the one hand, FDI investments introduce capital, technologies, and practices that contribute to more efficient resource use and emission reduction. However, if not adequately regulated, FDI can also lead to an increase in environmentally harmful practices, such as exploiting natural resources and relying on carbon-intensive technologies [6]. This study aimed to dissect these relationships using empirical data and analyses. By understanding the interplay between these factors, this study provides insights into how emerging countries navigate their paths to economic growth while minimizing their environmental footprints. The findings of this study are intended to inform policymakers, business leaders, and international organizations about strategies that can lead to sustainable development in these critical regions of the world.
The motivation for this research is the urgent need to understand how various developmental factors contribute to CO2 emissions in emerging economies. Significant changes in technological advancements, globalization, and environmental awareness represent critical windows for analysis [7]. Moreover, the role of FDI in moderating the impact of these factors on CO2 has not been explored extensively. FDI is often regarded as a driver of economic growth and is vital for shaping sustainable development. Furthermore, the extent to which FDI mitigates the impact of these factors on CO2 has not been widely examined in previous studies. Because FDI is generally a driver of economic development, it is critical to its influence on sustainable development [8]. However, the exact function that allows for the efficient development of strategies and plans has not been well documented. The main objective of this study is to test the impact of human capital, energy usage, urbanization, and economic growth on CO2 emissions in emerging economies while FDI moderates this relationship. This study uses a novel panel data approach to determine the empirical relationships between these factors. Another key objective is to examine the long-run associations of these variables and assess dynamic interactions and heterogeneity within panel data. This study aims to comprehensively understand the factors influencing CO2 emissions in emerging economies by achieving these goals. Figure 1 depicts the CO2 emissions percentage in the E-7 countries. The percentages represent each country’s contribution to the total emissions or changes in emissions over time, highlighting the environmental impacts associated with economic activities in these countries.
As a crucial source of pollution and global warming, CO2 must be addressed because identifying its causes can improve environmental protection [10]. Therefore, this study extends several methods for environmental protection and sustainable development. First, it analyzes the effects of urbanization and human capital on CO2 emissions in emerging economies. This group of countries is considered an essential contributor to sustainable urbanization. Second, FDI highlights its influence on reducing CO2 emissions by considering the effects of economic development and energy usage. This study explored the role of FDI. Because the increase in FDI contributes through infrastructure to fulfill basic needs, such as water and energy, this variable is vital for environmental preservation and sustainability [11]. Third, this study stands out for its utilization of advanced econometric models, specifically Cup-FM and Cup-BC. These models offer advanced techniques to address endogeneity, unobserved heterogeneity, and bias, guaranteeing precise and reliable estimation. These models enhance the reliability and accuracy of the outcomes. This study has several important implications for policymakers and stakeholders in promoting sustainable development. These important implications should be considered. These findings can assist in developing specific policies and initiatives to promote sustainable development. The remainder of this paper is organized as follows: Section 2 presents the empirical literature. Section 3 delves into the methodology, and Section 4 presents the empirical results and a thorough analysis. Section 5 presents the conclusions, policy recommendations, and potential avenues for future research.
2. Literature Review
The literature review explores the multifaceted impacts of human capital, energy usage, urbanization, and economic growth on CO2 emissions in emerging economies while delving into the critical role of FDI in this dynamic. Poumanyvong and Kaneko [12] proposed three theories to explain the connection between urbanization and CO2: compact cities, ecological modernization, and urban environmental transition theories. Ecological modernization theorists postulate that low-income people care only about their economic well-being; after reaching a certain level, they become concerned about the environment [13,14]. Based on urban environmental transition theory, urbanization is believed to involve infrastructure improvement. Initially, individuals grappled with environmental concerns and became intrigued by the repercussions of waste [15]. Compact city theorists believe that growing cities benefit citizens and the environment because they are equipped with better facilities and use resources more efficiently [16]. Empirical research has investigated the correlation between urbanization and CO2 emissions. A positive, negative, nonlinear, or insignificant relationship may exist between variables depending on their viewpoint. The research conducted by Salahuddin et al. [17] employed second-generation panel regression techniques that incorporated heterogeneity slope coefficients and cross-sectional dependence to assess the impact of urbanization on CO2 emissions in 44 sub-Saharan African countries between 1984 and 2016. Their results suggest that urbanization contributes to CO2 emissions. This result was further corroborated by other studies [18,19,20]. Figure 2 depicts the urbanization rates across E-7 nations, measured as the percentage of the population residing in urban areas. This metric is a critical indicator of economic modernization and demographic transformation, reflecting shifts in the labor market, infrastructure development, and spatial reorganization.
According to Effiong [21], urbanization harms CO2 emissions. These scholars employed a generalized least squares (GLS) methodology to analyze the relationship between urbanization and CO₂ emissions across OECD economies from 1996 to 2018. Their findings revealed that government effectiveness significantly moderates the positive correlation between urbanization and CO₂ levels, suggesting that enhanced institutional efficiency enables OECD countries to mitigate the environmental impact of urban expansion. Furthermore, this study explores the nonlinear dynamics between urbanization and CO₂ emissions using the environmental Kuznets curve (EKC) theoretical lens, offering nuanced insights into decoupling economic growth from ecological degradation. The EKC is a method for evaluating environmental performance. The EKC was derived from the inverted U-shaped graph developed by Kuznets in 1955 [22]. The EKC represents the connection between CO2 and its influencing factors. From Kuznets’ perspective, the environment suffers from economic growth, but this relationship eventually improves as economic growth continues. According to the EKC hypothesis, income and environmental quality have an inverted U-shaped relationship. According to the EKC, environmental degradation is caused by economic development. However, once a specific threshold of economic growth is reached, ecological quality improves as the per capita income increases. The shape of this curve indicates that environmental pollution initially increases with rising income but then begins to decline. The first introduced an inverted U-shaped relationship, and the term ‘Environmental Kuznets Curve’ was formulated by Grossman and Krueger [23]. Xiaoman et al. [24] posited that rising per capita income triggers heightened demand for environmental quality, incentivizing the adoption of cleaner, sustainable technologies to mitigate ecological degradation.
Several empirical studies support the GDP growth and environmental quality EKC hypotheses [25,26,27]. This inverted U-shaped relationship was confirmed by Al-Mulali & Ozturk, Majeed et al. [28,29] confirmed this inverted-U-shaped relationship. Using data from 1995 to 2019, Saqib et al. [30] explored the possibility of extending the traditional Kuznets curve to growing, industrialized economies. According to this study, income expansion precedes environmental sustainability in these economies. Furthermore, technological modernization contributes to pollution mitigation. Using 54 African nations as case studies, Hussain et al. [31] examined the heterogeneous effects of urbanization and non-renewable energy usage on the environment. Research indicates that urbanization and the utilization of non-renewable energy sources in Africa have detrimental environmental effects. The relationship between economic development and CO2 emissions follows an inverted U-shaped curve, consistent with the EKC theory. By examining the Middle Eastern and North African economies, Kostakis et al. [32] proved the EKC hypothesis and suggested that energy use adversely affects environmental quality. According to Kaya Kanlı and Küçükefe [33], although the EKC theory addresses the connection between the environment and income, it cannot be applied globally. Thus, regardless of income level, all countries must work to limit CO2 emissions in different ways. Researchers have investigated the relationship between human capital and pollution from this perspective. Iorember et al. [34] conducted a study on the impact of renewable energy usage, human capital, and trade on the ecological footprint in South Africa; multiple structural breaks cointegration tests were employed and found that human capital is key to enhancing a nation’s environmental sustainability. Consequently, they can regulate and reduce CO2 emissions [35,36,37]. Figure 3 shows human capital development in the E-7 economies, measuring education levels and returns on education. It is crucial to understand how these nations invest in their populations to drive economic growth and competitiveness.
Conversely, Gu et al. [39] employed a nonlinear panel autoregressive distributed lag method to assess the impact of human capital on CO2 emissions in BRICS economies and found that a reduction in education increases CO2 emissions. They believe that human capital accretion is vital for reducing environmental degradation by lowering CO2 emissions [40]. However, according to Hill and Magnani [41], more education leads to greater consumption of non-renewable energy sources. Although analyses of urbanization, CO2, human capital, and CO2 nexus have been conducted, a gap remains in emerging countries. As highlighted above, FDI has been overlooked in previous studies as a conditional factor that moderates the connection between urbanization, CO2, human capital, and CO2 in emerging countries. Hence, this analysis attempts to fill this gap by first considering the role of FDI in the nexus of urbanization and human capital in emerging countries. Our objective is to contribute to the analysis of sustainable urbanization and development by considering new policies that mitigate pollution. Second, the importance of FDI in implementing sustainable development shows that it can be a key instrument in the fight against pollution, particularly in emerging countries. According to FDI theory, various countries strive to attract FDI because of its potential economic benefits. International production networks, knowledge transfer, and productivity increase through FDI [42]. Figure 4 compares the FDI levels in the E-7 economies. It shows FDI as a percentage of GDP inflows, illustrating how these economies have attracted foreign investments over the past two decades.
Hence, FDI contributes significantly to economic growth compared to national investment [43]. Wang [44] examined FDI’s contribution of FDI to reducing CO2 emissions and found that FDI combined with human capital has a positive environmental impact in China. Foreign firms must introduce technologies tailored to the educational level of host countries because FDI inflows in countries with reasonable academic levels will reduce CO2. However, Ahmad et al. [45] considered that the innovative and cleaner technologies provided by FDI reduce CO2 emissions in host economies. The existing literature provides an understanding of the individual effects of human capital, energy usage, urbanization, and economic growth on CO2 emissions in emerging nations. However, there is a gap in the studies that comprehensively analyze these factors in conjunction with the moderating role of FDI. Furthermore, the dynamics of these relationships may vary across different regions and developmental stages, suggesting a need for more nuanced studies. This study investigated the mitigation of sustainable development and climate change in emerging economies.
3. Model Description, Data, and Methodology
3.1. Model Description
This study evaluated the impact of human capital, urbanization, FDI, energy use, and gross domestic product on CO2 emissions in E-7 economies from 2000 to 2022. The variables were log-transformed as logarithmic transformations utilized in regression models to stabilize the variance, linearize relationships, and provide better interpretability, particularly for multiplicative impacts. Thus, the analysis was more comprehensive [46]. The generalized empirical relations are as follows:
Equation (1) represents the regression as follows:
Where is the constant term, and , , , , , , the coefficients of the variables HC, URB., FDI, EC., GDP., and GDP2, respectively. The variable signifies the error term. The subscripts i (i=1, 2,…), n), and t (t=1,2…, T) denote economies, and time, respectively. The influence of FDI on urbanization and human capital is shown in Equations 3 and 4.
The moderating effect between FDI and urbanization is described by using interaction terms. In this analysis, we verify the EKC hypothesis and expect the coefficient of the GDP square to be significant and negative. This study confirms the EKC hypothesis by anticipating that the GDP square coefficient will be significant and negative.
The moderating effect between foreign direct investment and human capital is explained by employing interaction terms. This study confirms the EKC hypothesis by anticipating a significant negative coefficient for the GDP square.
3.2. Data
This study examines the impact of human capital, foreign direct investment (FDI), urbanization, energy consumption, and economic growth on CO₂ emissions in the E-7 emerging economies (Brazil, China, India, Indonesia, Mexico, Russia, and Turkey) using data from 2000 to 2022. CO2 was computed in metric tons per capita, indicating the pollution level per person. Data were gathered from the World Development Indicators (WDI) [9]. The human capital index (HC) uses years of schooling and educational returns to measure human capital. The data source is the Penn World Table (PWT) [38]. Economic growth (GDP) was computed as GDP per capita and the growth of domestic products per inhabitant. The data were derived from the WDI. Energy consumption (EC) was quantified as kilograms of oil equivalent per capita consumed by each inhabitant. Data were obtained from WDI. Urbanization (URB) is the ratio of people living in cities or towns to the total population. Data were acquired from the WDI. Foreign direct investment (FDI) inflow was quantified as a percentage of the gross domestic product (GDP). Data were obtained from WDI.
3.3. Methodology
3.3.1. Cross-Sectional Dependency Test
The primary objective of the slope heterogeneity test was to assess whether heterogeneity existed among the gradients of the different variables in the dataset. Conversely, cross-sectional dependence (CD) allows for the identification of interconnectedness between cross-sectional observations [47]. The test statistics are derived using the following equation:
3.3.2. Panel Unit Root Tests
Panel data analysis frequently utilizes second-generation panel unit root testing, CIPS, and CADF. A characteristic of second-generation panel unit root tests is their ability to reject the null hypothesis of the CD. Therefore, these methods consider the relationships among cross-sections to overcome this issue [48]. The CIPS assessment is determined by the IPS approach, which presents the regression equation of the CADF in Equations (10) and (11).
3.3.3. Panel Cointegration Test
Panel cointegration tests assess whether a stable and long-lasting connection exists between time-series data. Panel data analysts commonly use error correction-based tests developed by Kao [49] and Pedroni [50]. The error correction-based method is a pioneering cointegration technique for analyzing panel data [51]. The Kao and Pedroni cointegration tests operate under the null hypothesis of no cointegration among the variables, with the alternative hypothesis asserting that cointegration exists across all the panels. In this study, we employ the Westerlund cointegration test, which extends this framework by evaluating the alternative hypothesis that cointegration is present in at least one panel, thereby offering a more nuanced assessment of cross-sectional dependencies and heterogeneous panel structures [51].
3.3.4. CUP-FM and CUP-BC Approaches
The selection of an appropriate estimation method is critical, as it directly affects the accuracy, reliability, and interpretability of the empirical findings. Among the widely used estimators in panel data analysis are the “Continuously Updated Fully Modified” (Cup-FM) and “Continuously Updated Bias-Corrected” (Cup-BC) approaches. These methods offer significant advantages, particularly in addressing endogeneity concerns and reducing estimation bias, thereby enhancing the robustness of dynamic panel data models. The Cup-FM estimator represents a sophisticated advancement in estimating dynamic panel data and provides improved efficiency and consistency in the presence of cross-sectional dependence and heterogeneous dynamics. Bai and Kao [52] draw advantages from both fixed effects and instrumental variable methods. An effective solution to the endogeneity issue caused by unobserved heterogeneity constraints and simultaneity bias is achieved through structural means. A distinctive feature of the Cup-FM method is its ability to continuously update estimates with new information, enabling real-time analysis and supervision of dynamic relationships. The Cup-FM estimator has proven effective in integrating fixed effects to control for unobserved heterogeneity that is time-invariant over individuals or entities in panel data. The endogeneity issue has been effectively mitigated by applying instrumental variable (IV) techniques, which facilitate the derivation of unbiased and statistically consistent estimators. These estimators are particularly advantageous in dynamic panel models, especially when lagged dependent variables are incorporated as regressors to address autocorrelation and simultaneity bias. The methodological framework for the (Cup-FM) and (Cup-BC) estimators is formally represented by the following equation:
This study employs a novel method called dynamic seemingly unrelated cointegrating regression (DSUR), introduced by Mark et al. [53]. The SUR model expands on the conventional SUR model by incorporating dynamics. It is utilized when there is a group of equations with internal variables that change over time, and the parameters of these equations are determined, considering any potential correlations and fluctuations between them. The SUR model for each Equation j is displayed for cross-sectional unit i and period t as follows:
4. Results and Discussion
The outcomes of the CD and slope heterogeneity analyses are presented in Table 1. The findings suggest that the research units have diverse properties and exhibit cross-sectional dependence and a shared dynamic. The results in Table 1 are statistically significant at the 1% level, indicating differences between units.
As shown in Table 2, the test statistics for CADF and CIPS are statistically significant at the 1% level after making the first difference in the constant and trend. It suggests that these results support the notion that all variables are integrated in the first order, specifically, I(1). Table 3 presents the results of the panel cointegration tests. Kao and Pedroni [49,50] and Westerlund [51] conducted a panel cointegration test to determine whether the dependent and independent variables cointegrated in the long run. The analysis revealed a long-term relationship in the empirical equation, as assessed through panel cointegration test results.
This study utilized novel panel data evaluation techniques, such as Cup-FM, Cup-BC, and DSUR. Table 4, Table 5, and Table 6 present the estimation results, respectively. Table 4 shows that a 1% increase in human capital leads to a 0.105% increase in CO2, while a 1% increase in the urban population leads to a 0.191% increase in CO2. In addition, FDI has a negative effect on CO2 emissions. Thus, a 1% increase in FDI decreases CO2 emissions by 0.092%. Hence, an increase in FDI decreases CO2 emissions in emerging economies. Furthermore, a 1% increase in energy usage resulted in a 0.158% increase in CO2. GDP positively affected CO2, indicating that a 1% increase contributed to CO2 by 0.168%. GDP2 negatively affects CO2 emissions, confirming the environmental Kuznets curve. A 1% increase in GDP2 decreased CO2 emissions by 0.077%. The Cup-FM outcomes were aligned with the Cup-BC and DSUR findings. The positive influence of human capital on CO2 in E-7 countries is linked to multiple factors, such as improvements in human capital, education, and skills that drive economic growth and industrialization. It often leads to increased energy consumption, much of which is based on fossil fuels, thereby increasing CO2 emissions. As human capital leads to better job opportunities and income, there is an increase in living standards, which increases the need for energy-intensive goods and services, further contributing to CO2 emissions [54]. Figure 5 presents the findings in Table 4.
Urbanization increases CO2 emissions in E-7 countries because urban regions have larger energy demands owing to the population, extensive industrial and commercial activities, and the need for transportation, heating, and cooling, which often rely on fossil fuels. Urbanization leads to more vehicles on the road as people commute to work and for personal needs, increasing fuel usage and CO2. The proliferation of urban regions involves significant construction activity, which consumes energy and often uses materials such as cement and steel, the production of which is carbon-intensive [18]. FDI negatively impacts CO2 emissions in E-7 economies, primarily through technology transfer and efficiency improvements. FDI facilitates the transfer of advanced and efficient technologies from developed to developing countries, promotes sustainable development, and reduces environmental pollution in the E-7 countries. The implementation of greener production methods and renewable energy sources has reduced the reliance on fossil fuels and lowered CO2 emissions. FDI plays a pivotal role in driving economic modernization by facilitating the transition towards service-oriented and high-technology industries, which are generally characterized by lower carbon intensity than conventional manufacturing and industrial sectors [55].
The dependence on fossil fuels for energy in E-7 countries contributes to the positive impact of EC on CO2 emissions. As these emerging economies grow, their demand for energy, fuel, industrialization, transportation, and urban development increases. This energy demand is primarily met through coal, oil, and natural gas, which leads to higher CO2 emissions because these energy sources release carbon dioxide when burned. Moreover, E-7 countries in various developmental stages have not fully transitioned to cleaner renewable energy sources. Therefore, as EC increases, CO2 also increases because of the carbon-intensive nature of the primary energy sources.
The reliance on fossil fuels for energy in the E-7 nations amplifies the positive relationship between EC and CO₂ emissions. As these emerging economies expand, their escalating energy demands, driven by industrialization, transportation, and urban development, are predominantly met through coal, oil, and natural gas. The combustion of these carbon-intensive energy sources releases significant quantities of CO₂, exacerbating emissions. Furthermore, the E-7 countries, at varying stages of development, have yet to achieve a comprehensive transition to cleaner, renewable energy alternatives. Consequently, rising EC levels correlate with increased CO₂ emissions, reflecting the persistent carbon dependency of energy systems [56]. GDP’s positive effect of GDP on CO2 emissions in E-7 economies is linked to economic growth and its associated increases in industrial, transportation, and energy activities. As GDP grows, it typically signifies higher industrial output, more vehicles on the roads, and greater energy consumption across various sectors, including residential and commercial sectors. In the early phases of development, they often relied on carbon-intensive energy sources derived from fossil fuels, such as coal, natural gas, and oil. The combustion of these fuels for energy and transportation leads to increased CO₂ emissions [57]. Figure 6 illustrates how human capital, energy use, GDP, and urbanization are linked to CO2 emissions, which is the central focus of this study. Adorned with a plus sign, it suggests that these factors positively affect CO2, except for FDI, highlighting the multifaceted influences on environmental sustainability in E-7 economies.
The squared GDP term and the EKC hypothesis negatively impacted CO2 emissions in the E-7 countries. The EKC hypothesis demonstrates an inverse relationship between CO2 and economic growth (measured by GDP) that follows an inverted U-shape. As GDP increases, CO2 emissions also increase because economic growth is typically driven by industrialization and increased energy consumption, often from the use of fossil fuels [58]. However, beyond a certain point of economic development, further increases in GDP lead to decreased CO2, where the “GDP squared” term comes into play with a negative coefficient. As countries expand and mature, they prefer to adopt advanced, efficient, and cleaner technologies that reduce CO2 emissions per unit of economic output. Economic growth often raises public awareness and demand for environmental protection, leading to better regulations, pollution control measures, and investments in sustainable practices and technologies [59].
Moreover, the findings in Table 5 are significant, with the results in Table 4 for the Cup-FM, Cup-BC, and DSUR methods. The interaction term FDI*URB has a negative effect on CO2 in E-7 economies, indicating that FDI moderates the relationship between urbanization and CO2. FDI introduces cutting-edge technologies and managerial techniques to the host nation. When these investments are directed towards urban areas, they introduce more energy-efficient infrastructure, green technologies, and sustainable urban planning practices. It mitigates the typical increase in CO2 emissions associated with urbanization [60]. FDI also includes investments in renewable energy projects and environmentally friendly technologies in urban areas. These investments help offset the carbon footprint of growing cities by reducing their dependence on fossil fuels [61]. FDI stimulates less carbon-intensive sectors, such as services and high-tech industries, within urban regions. This diversification shifts economic activities in cities away from heavy industries, which are major contributors to CO2 emissions. Consequently, the negative effect of the FDI*URB interaction on CO2 indicates the critical importance of foreign investments in enabling sustainable urban development in E-7 countries, leading to a more environmentally friendly urbanization process [60]. Figure 7 presents the findings in Table 5.
Table 6 demonstrates the negative effect of the FDI*HC interaction term on CO2 emissions in E-7 countries. It is a synergistic effect of combining foreign investment with a skilled and educated workforce. FDI often brings innovative technologies and practices to the host country. These technologies can be efficiently implemented and utilized by a well-educated and skilled workforce (high human capital), leading to more sustainable and less carbon-intensive industrial processes. Enhanced human capital maximizes the benefits of FDI by adopting new technologies and methods more effectively, resulting in improved energy efficiency and reduced CO2 emissions [62]. FDI and human capital foster an environment conducive to innovation. It has resulted in the development and adoption of greener technologies and sustainable practices within industries, thereby reducing CO2 emissions. Workforces with advanced human capital are likely to be more so. When such a workforce collaborates with foreign firms, they advocate and implement environmentally friendly practices that reduce the carbon footprint of their operations. Thus, the interaction between FDI and human capital mitigates CO2 emissions by enhancing technological adoption, operational efficiency, and environmental sustainability in the economic activities of the E-7 countries [8]. Figure 8 presents the findings in Table 6.
5. Conclusion and Policy Propositions
This study examines the impact of human capital, urbanization, FDI, energy usage, and GDP on CO2 emissions, explicitly identifying FDI’s mediating role of FDI with urbanization and human capital in E-7 countries between 2000 and 2022. This study employed Cup-FM, Cup-BC, and DSUR methods. The results show that human capital, urbanization, energy use, and GDP positively impact CO2 emissions, whereas FDI and GDP2 negatively affect CO2 emissions. FDI mitigates urbanization and the positive impacts of human capital on CO2 emissions in E-7 economies. The outcomes verify the robustness of the model by having similar coefficient values for all the estimations. Policymakers should encourage FDI, especially green FDI, by establishing policies that facilitate foreign investment in urban areas. An increase in green FDI can improve environmental protection. Encouraging green FDI poses several challenges. Encouraging green FDI means appropriate public policies (regulatory quality and taxation) and good governance (transparency), which can create a favorable political and economic environment for its implementation. For example, the governments of these countries can set climate standards and promote green FDI by requiring investors to comply. Through these policies, emerging countries should relax the circulation of goods and services between member countries, which would facilitate the implementation and use of hybrid cars, electric cars, and appliances, as well as the development of environmentally friendly roads, railways, and bridge systems.
These countries should implement sustainable urbanization by planning, investing in public transportation, creating walkable neighborhoods, building green infrastructure, and fostering economic diversity. Low-carbon apartments or green environments should be constructed to make them accessible to the general population. Furthermore, cities can promote sustainable transportation, energy efficiency, and waste reduction. FDI can reduce the positive association between human capital and CO2 emissions by easing awareness-raising programs in emerging countries. Government decision-makers should promote remote work and telecommuting to reduce CO2 emissions. These countries should build intelligent cities, skyscrapers, and short distances between workplaces and residences. By reducing energy use, these countries can reduce their CO2 emissions as well. Efficient urbanization planning is a prerequisite for managing the growth of existing cities and facilitating the construction of new cities. The effectiveness of sustainable policies should be based on countries’ development levels, as it can be difficult for policymakers to balance economic growth and environmental sustainability. Future research should consider incorporating political and institutional factors, such as political stability, which can contribute to environmental degradation. Political stability influences FDI growth by highlighting a country’s safety.
Author Contributions
Conceptualization, JiaZheng Yu; Data curation, Abdul Majeed; Formal analysis, Abdul Majeed; Methodology, Abdul Majeed; Resources, JiaZheng Yu; Software, Abdul Majeed; Validation, JiaZheng Yu; Visualization, Yiran Liu; Writing – original draft, JiaZheng Yu; Writing – review & editing, Abdul Majeed and Yiran Liu.
Funding
Not Applicable.
Institutional Review Board Statement
Not applicable.
Informed Consent Statement
Not applicable.
Data Availability Statement
The datasets used and/or analyzed in the current study are available from the corresponding author upon reasonable request.
Conflicts of Interest
The authors declare no competing interests.
References
- Sethi, P.; Chakrabarti, D.; Bhattacharjee, S. Globalization, Financial Development and Economic Growth: Perils on the Environmental Sustainability of an Emerging Economy. J. Policy Model. 2020, 42, 520–535. [Google Scholar] [CrossRef]
- Alvarado, R.; Deng, Q.; Tillaguango, B.; Méndez, P.; Bravo, D.; Chamba, J.; Alvarado-Lopez, M.; Ahmad, M. Do Economic Development and Human Capital Decrease Non-Renewable Energy Consumption? Evidence for OECD Countries. Energy 2021, 215, 119147. [Google Scholar] [CrossRef]
- Yasmeen, H.; Tan, Q.; Zameer, H.; Tan, J.; Nawaz, K. Exploring the Impact of Technological Innovation, Environmental Regulations and Urbanization on Ecological Efficiency of China in the Context of COP21. J. Environ. Manage. 2020, 274, 111210. [Google Scholar] [CrossRef]
- Zaman, K.; el Moemen, M.A. Energy Consumption, Carbon Dioxide Emissions and Economic Development: Evaluating Alternative and Plausible Environmental Hypothesis for Sustainable Growth. Renew. Sustain. Energy Rev. 2017, 74, 1119–1130. [Google Scholar] [CrossRef]
- Ozcan, B.; Tzeremes, P.G.; Tzeremes, N.G. Energy Consumption, Economic Growth and Environmental Degradation in OECD Countries. Econ. Model. 2020, 84, 203–213. [Google Scholar] [CrossRef]
- Zhu, H.; Duan, L.; Guo, Y.; Yu, K. The Effects of FDI, Economic Growth and Energy Consumption on Carbon Emissions in ASEAN-5: Evidence from Panel Quantile Regression. Econ. Model. 2016, 58, 237–248. [Google Scholar] [CrossRef]
- Sun, Y.; Ak, A.; Serener, B.; Xiong, D. Natural Resource Abundance and Financial Development: A Case Study of Emerging Seven (E−7) Economies. Resour. Policy 2020, 67, 101660. [Google Scholar] [CrossRef]
- Wang, Z.; Gao, L.; Wei, Z.; Majeed, A.; Alam, I. How FDI and Technology Innovation Mitigate CO2 Emissions in High-Tech Industries: Evidence from Province-Level Data of China. Environ. Sci. Pollut. Res. 2022, 29, 4641–4653. [Google Scholar] [CrossRef]
- World Bank World Bank Available online:. Available online: https://data.worldbank.org/indicator (accessed on 3 April 2024).
- Ozturk, I. Measuring the Impact of Alternative and Nuclear Energy Consumption, Carbon Dioxide Emissions and Oil Rents on Specific Growth Factors in the Panel of Latin American Countries. Prog. Nucl. Energy 2017, 100, 71–81. [Google Scholar] [CrossRef]
- Zhang, C.; Zhou, X. Does Foreign Direct Investment Lead to Lower CO2 Emissions? Evidence from a Regional Analysis in China. Renew. Sustain. Energy Rev. 2016, 58, 943–951. [Google Scholar] [CrossRef]
- Poumanyvong, P.; Kaneko, S. Does Urbanization Lead to Less Energy Use and Lower CO2 Emissions? A Cross-Country Analysis. Ecol. Econ. 2010, 70, 434–444. [Google Scholar] [CrossRef]
- York, R.; Rosa, E.A.; Dietz, T. STIRPAT, IPAT and ImPACT: Analytic Tools for Unpacking the Driving Forces of Environmental Impacts. Ecol. Econ. 2003, 46, 351–365. [Google Scholar] [CrossRef]
- Bekhet, H.A.; Othman, N.S. Impact of Urbanization Growth on Malaysia CO2 Emissions: Evidence from the Dynamic Relationship. J. Clean. Prod. 2017, 154, 374–388. [Google Scholar] [CrossRef]
- Moradi, A.; Vagnoni, E. A Multi-Level Perspective Analysis of Urban Mobility System Dynamics: What Are the Future Transition Pathways? Technol. Forecast. Soc. Change 2018, 126, 231–243. [Google Scholar] [CrossRef]
- Holden, E.; Norland, I.T. Three Challenges for the Compact City as a Sustainable Urban Form: Household Consumption of Energy and Transport in Eight Residential Areas in the Greater Oslo Region. Urban Stud. 2005, 42, 2145–2166. [Google Scholar] [CrossRef]
- Salahuddin, M.; Ali, M.I.; Vink, N.; Gow, J. The Effects of Urbanization and Globalization on CO 2 Emissions: Evidence from the Sub-Saharan Africa (SSA) Countries. Environ. Sci. Pollut. Res. 2019, 26, 2699–2709. [Google Scholar] [CrossRef]
- Li, K.; Lin, B. Impacts of Urbanization and Industrialization on Energy Consumption/CO2 Emissions: Does the Level of Development Matter? Renew. Sustain. Energy Rev. 2015, 52, 1107–1122. [Google Scholar] [CrossRef]
- Kwakwa, P.A.; Alhassan, H.; Adu, G. Effect of Natural Resources Extraction on Energy Consumption and Carbon Dioxide Emission in Ghana. Int. J. Energy Sect. Manag. 2020, 14, 20–39. [Google Scholar] [CrossRef]
- Kassi, D.F.; Li, Y.; Riaz, A.; Wang, X.; Batala, L.K. Conditional Effect of Governance Quality on the Finance-Environment Nexus in a Multivariate EKC Framework: Evidence from the Method of Moments-Quantile Regression with Fixed-Effects Models. Environ. Sci. Pollut. Res. 2022, 29, 52915–52939. [Google Scholar] [CrossRef]
- Effiong, E.L. On the Urbanization-Pollution Nexus in Africa: A Semiparametric Analysis. Qual. Quant. 2018, 52, 445–456. [Google Scholar] [CrossRef]
- Dinda, S. Environmental Kuznets Curve Hypothesis: A Survey. Ecol. Econ. 2004, 49, 431–455. [Google Scholar] [CrossRef]
- Grossman, G.M.; Krueger, A.B. Environmental Impacts of a North American Free Trade Agreement. Natl. Bur. Econ. Res. 1991, 1–57. [Google Scholar] [CrossRef]
- Xiaoman, W.; Majeed, A.; Vasbieva, D.G.; Yameogo, C.E.W.; Hussain, N. Natural Resources Abundance, Economic Globalization, and Carbon Emissions: Advancing Sustainable Development Agenda. Sustain. Dev. 2021, 29, 1037–1048. [Google Scholar] [CrossRef]
- Majeed, A.; Wang, L.; Zhang, X.; Muniba; Kirikkaleli, D. Modeling the Dynamic Links among Natural Resources, Economic Globalization, Disaggregated Energy Consumption, and Environmental Quality: Fresh Evidence from GCC Economies. Resour. Policy 2021, 73, 102204. [Google Scholar] [CrossRef]
- Bartlett, B. The High Cost of Turning Green. Wall Str. J. 1994, 14. [Google Scholar]
- Grossman, G.M.; Krueger, A.B. Economic Growth and the Environment. Q. J. Econ. 1995, 110, 353–377. [Google Scholar] [CrossRef]
- Majeed, A.; Ye, C.; Chenyun, Y.; Wei, X. ; Muniba Roles of Natural Resources, Globalization, and Technological Innovations in Mitigation of Environmental Degradation in BRI Economies. PLoS One 2022, 17, e0265755. [Google Scholar] [CrossRef]
- Al-Mulali, U.; Ozturk, I. The Effect of Energy Consumption, Urbanization, Trade Openness, Industrial Output, and the Political Stability on the Environmental Degradation in the MENA (Middle East and North African) Region. Energy 2015, 84, 382–389. [Google Scholar] [CrossRef]
- Saqib, N.; Usman, M.; Radulescu, M.; Sinisi, C.I.; Secara, C.G.; Tolea, C. Revisiting EKC Hypothesis in Context of Renewable Energy, Human Development and Moderating Role of Technological Innovations in E-7 Countries? Front. Environ. Sci. 2022, 10, 1077658. [Google Scholar] [CrossRef]
- Hussain, M.N.; Li, Z.; Yang, S. Heterogeneous Effects of Urbanization and Environment Kuznets Curve Hypothesis in Africa. Nat. Resour. Forum 2023, 47, 317–333. [Google Scholar] [CrossRef]
- Kostakis, I.; Armaos, S.; Abeliotis, K.; Theodoropoulou, E. The Investigation of EKC within CO2 Emissions Framework: Empirical Evidence from Selected Cross-Correlated Countries. Sustain. Anal. Model. 2023, 3, 100015. [Google Scholar] [CrossRef]
- Kaya Kanlı, N.; Küçükefe, B. Is the Environmental Kuznets Curve Hypothesis Valid? A Global Analysis for Carbon Dioxide Emissions. Environ. Dev. Sustain. 2023, 25, 2339–2367. [Google Scholar] [CrossRef]
- Iorember, P.T.; Jelilov, G.; Usman, O.; Işık, A.; Celik, B. The Influence of Renewable Energy Use, Human Capital, and Trade on Environmental Quality in South Africa: Multiple Structural Breaks Cointegration Approach. Environ. Sci. Pollut. Res. 2021, 28, 13162–13174. [Google Scholar] [CrossRef] [PubMed]
- Işık, C.; Ongan, S.; Ozdemir, D.; Jabeen, G.; Sharif, A.; Alvarado, R.; Amin, A.; Rehman, A. Renewable Energy, Climate Policy Uncertainty, Industrial Production, Domestic Exports/Re-Exports, and CO2 Emissions in the USA: A SVAR Approach. Gondwana Res. 2024, 127, 156–164. [Google Scholar] [CrossRef]
- Lin, B.; Ullah, S. Effectiveness of Energy Depletion, Green Growth, and Technological Cooperation Grants on CO2 Emissions in Pakistan’s Perspective. Sci. Total Environ. 2024, 906, 167536. [Google Scholar] [CrossRef]
- Hussain, Z.; Marcel, B.; Majeed, A.; Tsimisaraka, R.S.M. Effects of Transport–Carbon Intensity, Transportation, and Economic Complexity on Environmental and Health Expenditures; Springer Netherlands, 2023; ISBN 0123456789.
- PWT Penn World Table Available online:. Available online: https://www.rug.nl/ggdc/productivity/pwt/?lang=en (accessed on 3 April 2024).
- Gu, X.; Baig, I.A.; Shoaib, M.; Zhang, S. Examining the Natural Resources-Ecological Degradation Nexus: The Role of Energy Innovation and Human Capital in BRICST Nations. Resour. Policy 2024, 90, 104782. [Google Scholar] [CrossRef]
- Haini, H. Examining the Impact of ICT, Human Capital and Carbon Emissions: Evidence from the ASEAN Economies. Int. Econ. 2021, 166, 116–125. [Google Scholar] [CrossRef]
- Hill, R.J.; Magnani, E. An Exploration of the Conceptual and Empirical Basis of the Environmental Kuznets Curve. Aust. Econ. Pap. 2002, 41, 239–254. [Google Scholar] [CrossRef]
- Findlay, R. Relative Backwardness, Direct Foreign Investment, and the Transfer of Technology: A Simple Dynamic Model. Q. J. Econ. 1978, 92, 1–16. [Google Scholar] [CrossRef]
- Zhang, K.H. How Does Foreign Direct Investment Affect Economic Growth in China? Econ. Transit. 2001, 9, 679–693. [Google Scholar] [CrossRef]
- Wang, C.; Wang, L. Can Outward Foreign Direct Investment Improve China’s Green Economic Efficiency? Environ. Sci. Pollut. Res. 2023, 30, 37295–37309. [Google Scholar] [CrossRef] [PubMed]
- Ahmad, M.; Jiang, P.; Majeed, A.; Raza, M.Y. Does Financial Development and Foreign Direct Investment Improve Environmental Quality? Evidence from Belt and Road Countries. Environ. Sci. Pollut. Res. 2020, 27, 23586–23601. [Google Scholar] [CrossRef]
- Villadsen, A.R.; Wulff, J.N. Statistical Myths About Log-Transformed Dependent Variables and How to Better Estimate Exponential Models. Br. J. Manag. 2021, 32, 779–796. [Google Scholar] [CrossRef]
- Pesaran, M.H.H. General Diagnostic Tests for Cross-Sectional Dependence in Panels. Empir. Econ. 2020, 0435. [Google Scholar] [CrossRef]
- Pesaran, M.H. A Simple Panel Unit Root Test in the Presence of Cross-section Dependence. J. Appl. Econom. 2007, 22, 265–312. [Google Scholar] [CrossRef]
- Kao, C. Spurious Regression and Residual-Based Tests for Cointegration in Panel Data. J. Econom. 1999, 90, 1–44. [Google Scholar] [CrossRef]
- Pedroni, P. Panel Cointegration: Asymptotic and Finite Sample Properties of Pooled Time Series Tests with an Application to the PPP Hypothesis. Econom. Theory 2004, 20, 597–625. [Google Scholar] [CrossRef]
- Westerlund, J. Testing for Error Correction in Panel Data. Oxf. Bull. Econ. Stat. 2007, 69, 709–748. [Google Scholar] [CrossRef]
- Bai, J.; Kao, C. On the Estimation and Inference of a Panel Cointegration Model with Cross-Sectional Dependence. In; Elsevier, 2006; Vol. 274, pp. 3–30.
- Mark, N.C.; Ogaki, M.; Sul, D. Dynamic Seemingly Unrelated Cointegrating Regressions. Rev. Econ. Stud. 2005, 72, 797–820. [Google Scholar] [CrossRef]
- Yao, Y.; Ivanovski, K.; Inekwe, J.; Smyth, R. Human Capital and CO2 Emissions in the Long Run. Energy Econ. 2020, 91, 104907. [Google Scholar] [CrossRef]
- Xie, Q.; Wang, X.; Cong, X. How Does Foreign Direct Investment Affect CO2 Emissions in Emerging Countries?New Findings from a Nonlinear Panel Analysis. J. Clean. Prod. 2020, 249, 119422. [Google Scholar] [CrossRef]
- Gu, W.; Zhao, X.; Yan, X.; Wang, C.; Li, Q. Energy Technological Progress, Energy Consumption, and CO2 Emissions: Empirical Evidence from China. J. Clean. Prod. 2019, 236, 117666. [Google Scholar] [CrossRef]
- Mitić, P.; Ivanović, O.M.; Zdravković, A. A Cointegration Analysis of Real Gdp and CO2 Emissions in Transitional Countries. Sustainability 2017, 9, 568. [Google Scholar] [CrossRef]
- Yang, G.; Sun, T.; Wang, J.; Li, X. Modeling the Nexus between Carbon Dioxide Emissions and Economic Growth. Energy Policy 2015, 86, 104–117. [Google Scholar] [CrossRef]
- Shahbaz, M.; Shahzad, S.J.H.; Ahmad, N.; Alam, S. Financial Development and Environmental Quality: The Way Forward. Energy Policy 2016, 98, 353–364. [Google Scholar] [CrossRef]
- Lee, C.C.; Zhao, Y.N. Heterogeneity Analysis of Factors Influencing CO2 Emissions: The Role of Human Capital, Urbanization, and FDI. Renew. Sustain. Energy Rev. 2023, 185, 113644. [Google Scholar] [CrossRef]
- Doğan, B.; Lorente, D.B.; Ali Nasir, M. European Commitment to COP21 and the Role of Energy Consumption, FDI, Trade and Economic Complexity in Sustaining Economic Growth. J. Environ. Manage. 2020, 273, 111146. [Google Scholar] [CrossRef]
- Abdouli, M.; Omri, A. Exploring the Nexus Among FDI Inflows, Environmental Quality, Human Capital, and Economic Growth in the Mediterranean Region. J. Knowl. Econ. 2021, 12, 788–810. [Google Scholar] [CrossRef]
Figure 1.
CO2 emissions in the E-7 economies. Source: World Bank [9].
Figure 1.
CO2 emissions in the E-7 economies. Source: World Bank [9].
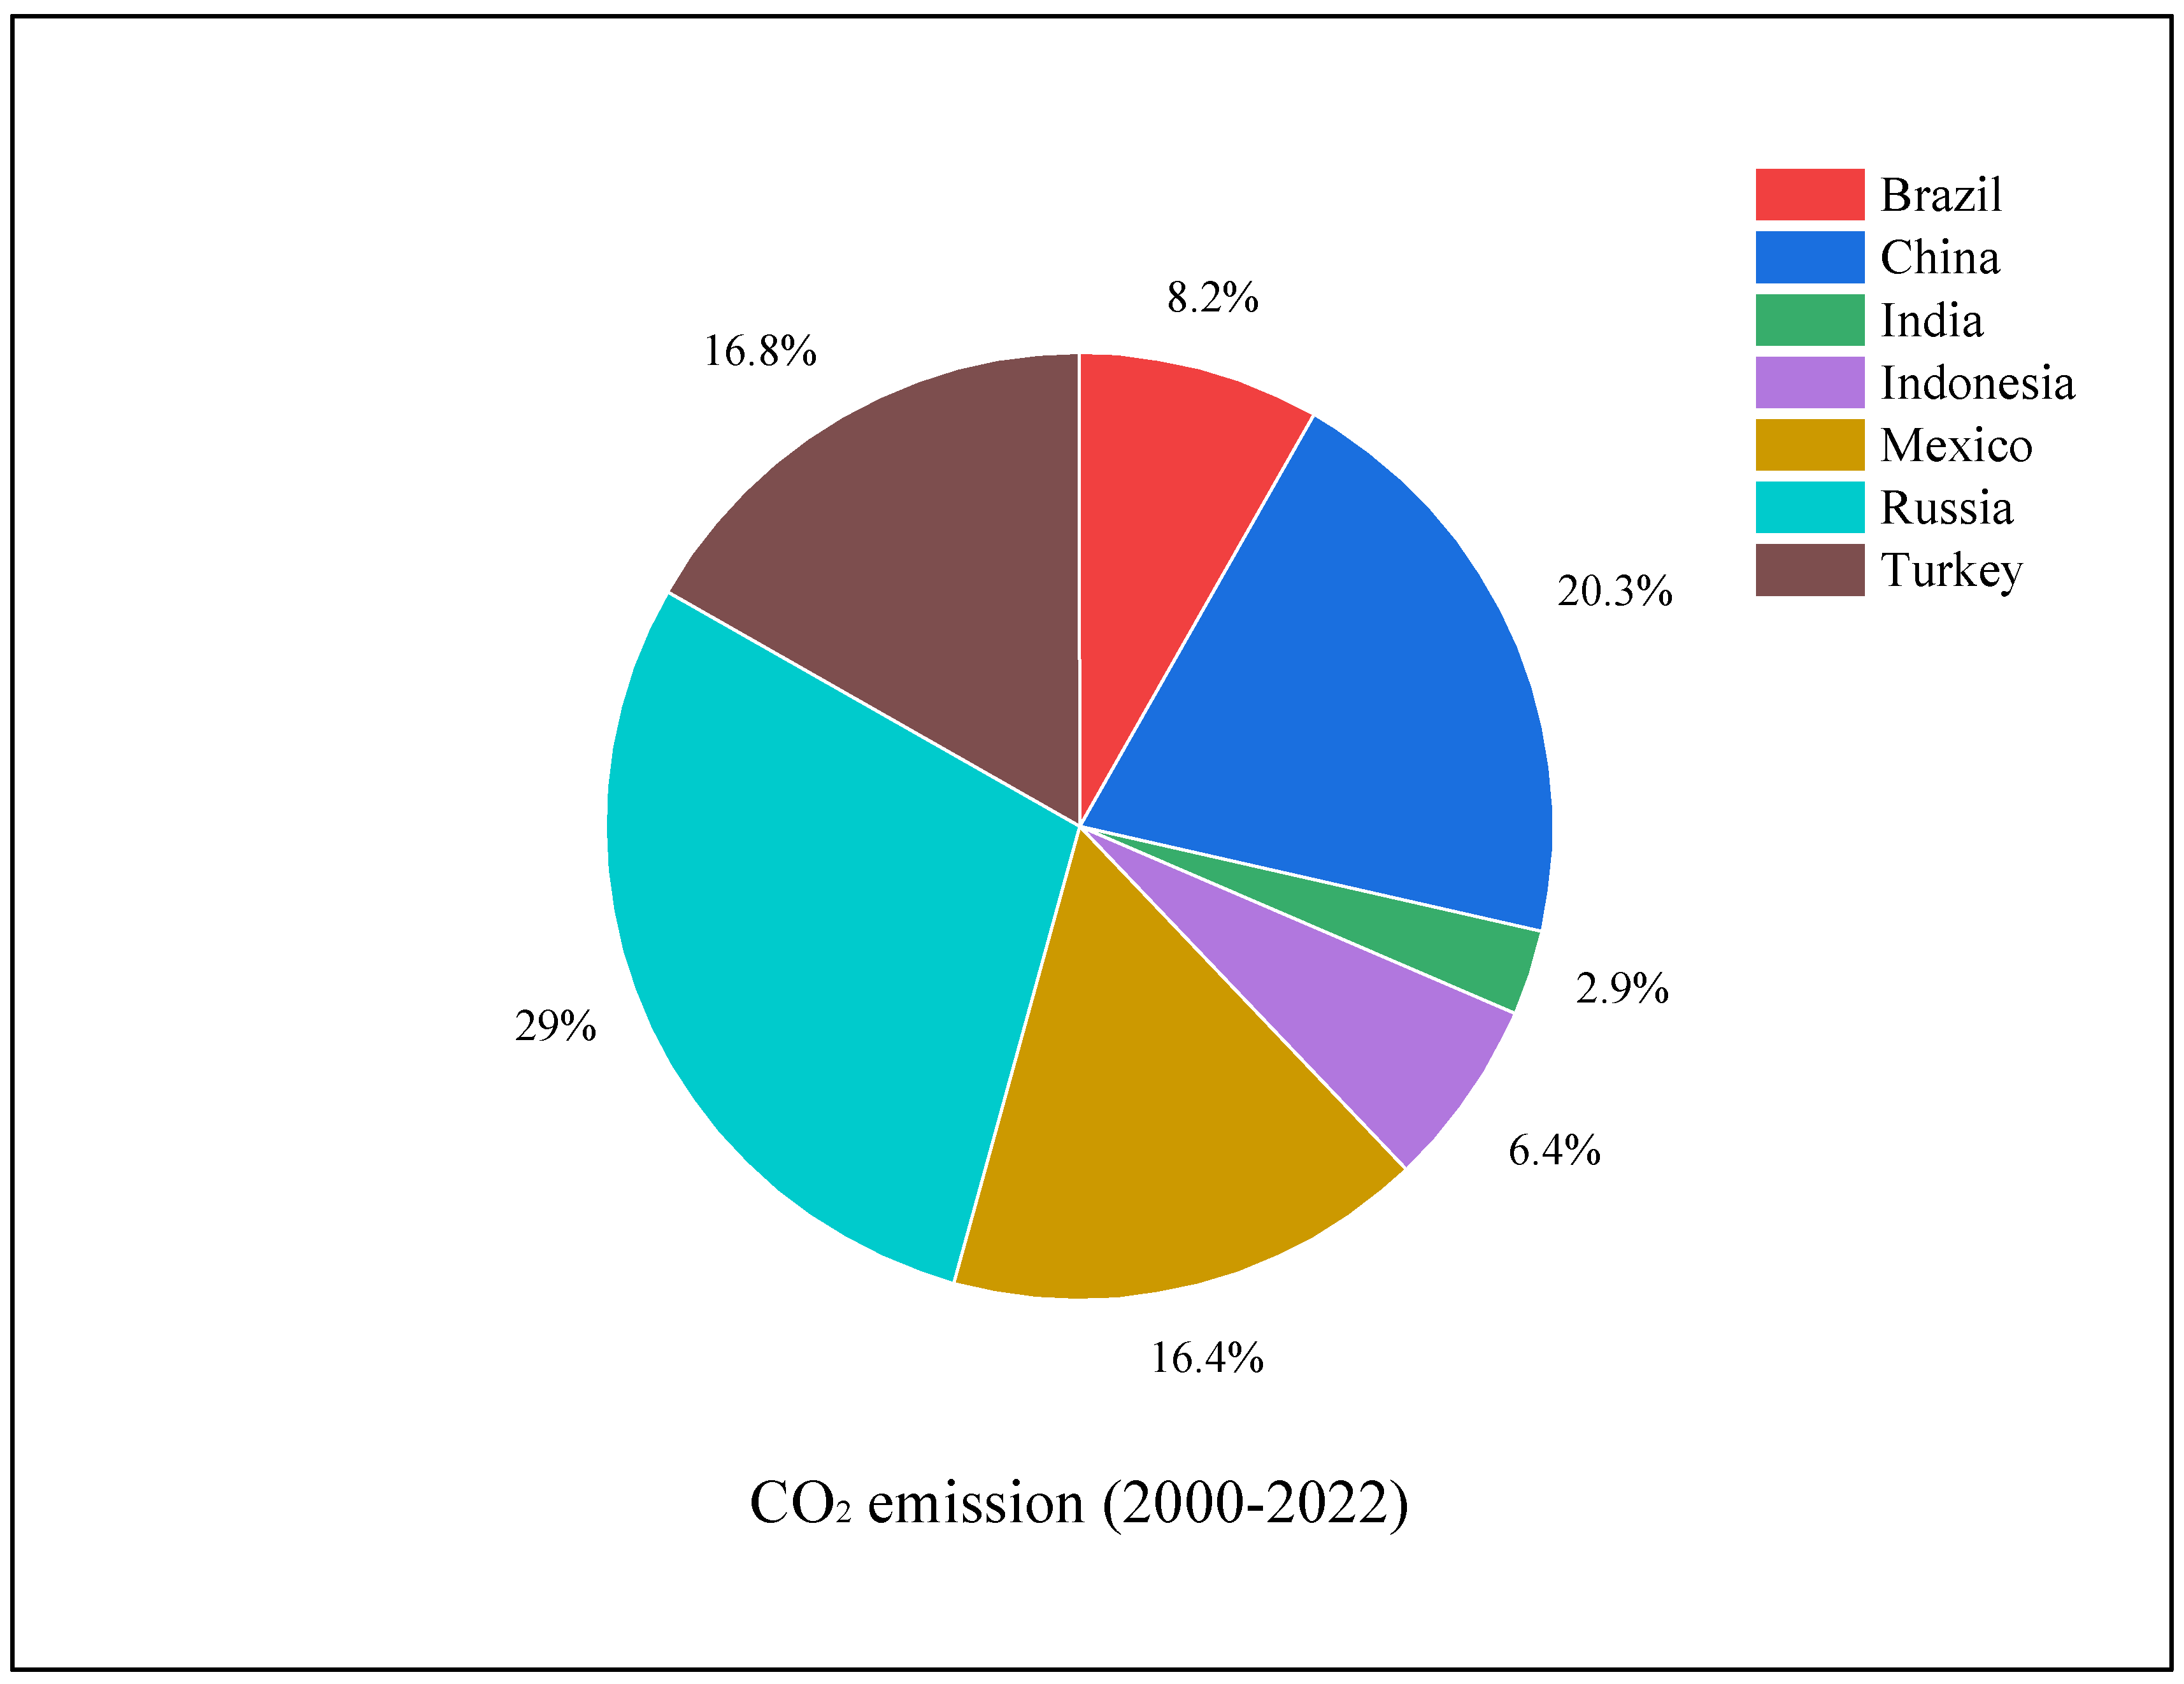
Figure 2.
Urbanization in E-7 Economies. Source: World Bank [9].
Figure 2.
Urbanization in E-7 Economies. Source: World Bank [9].
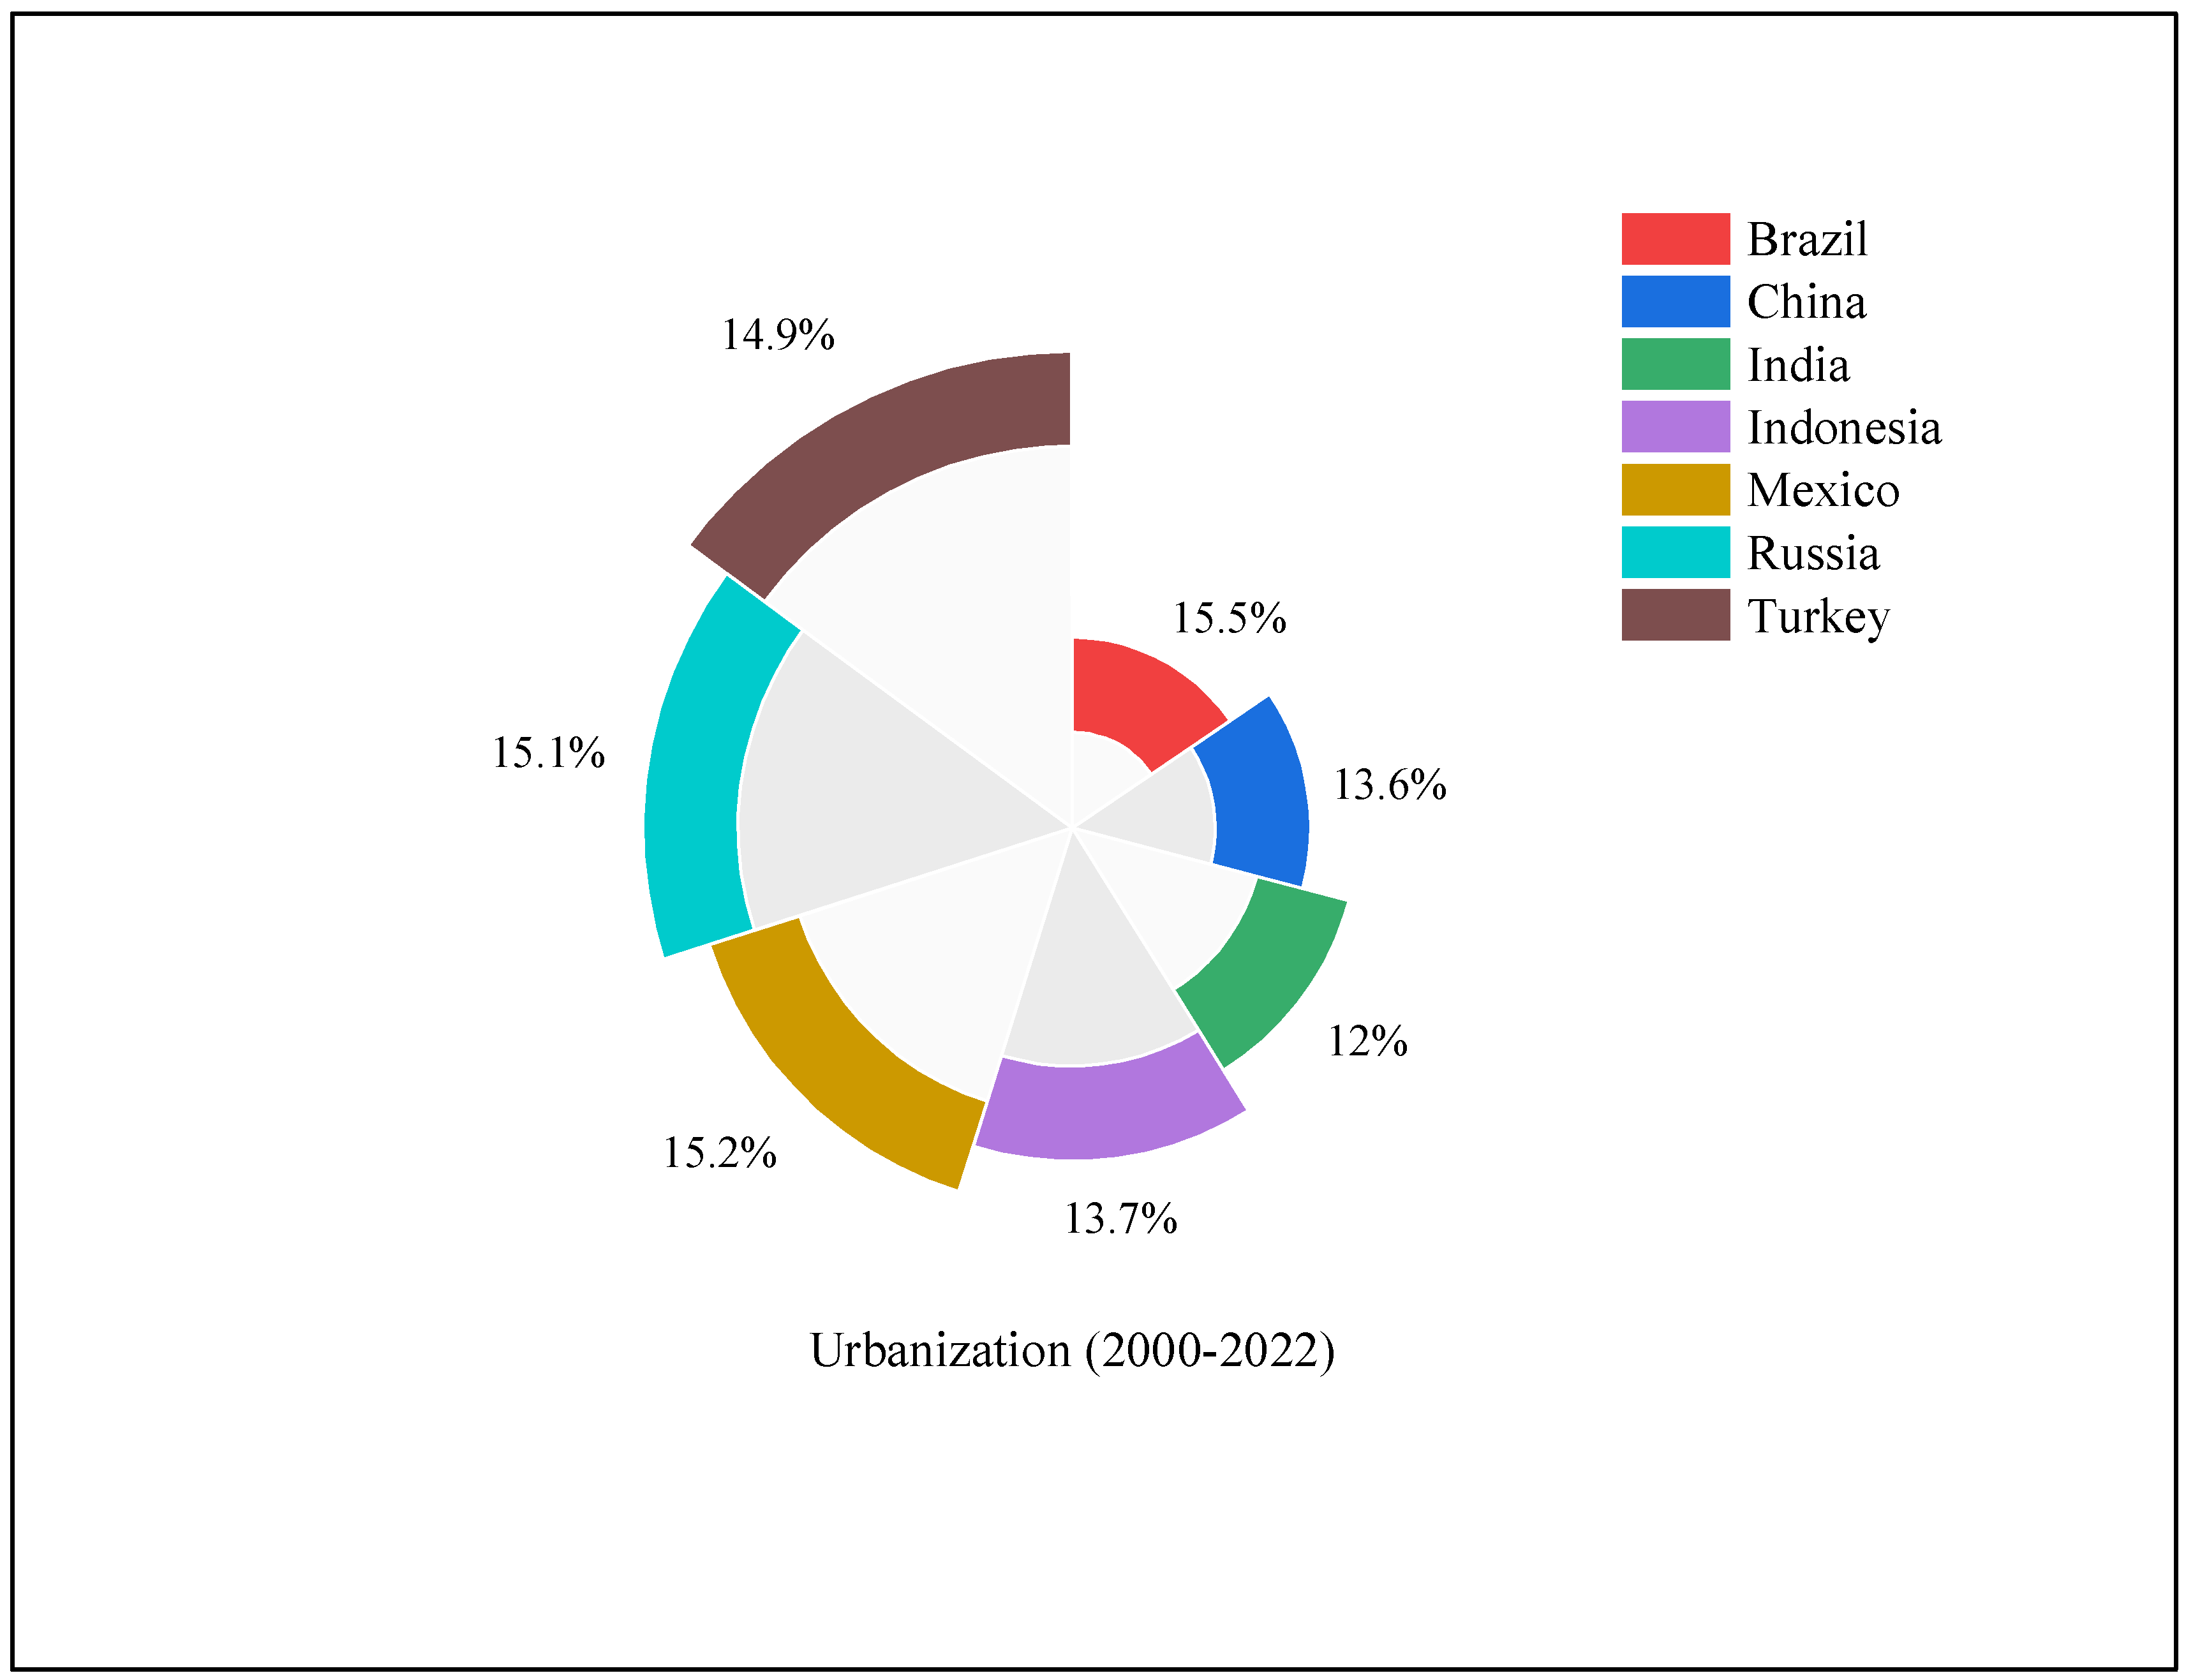
Figure 3.
Human Capital in the E-7 Economies. Source: Penn World Table [38].
Figure 3.
Human Capital in the E-7 Economies. Source: Penn World Table [38].
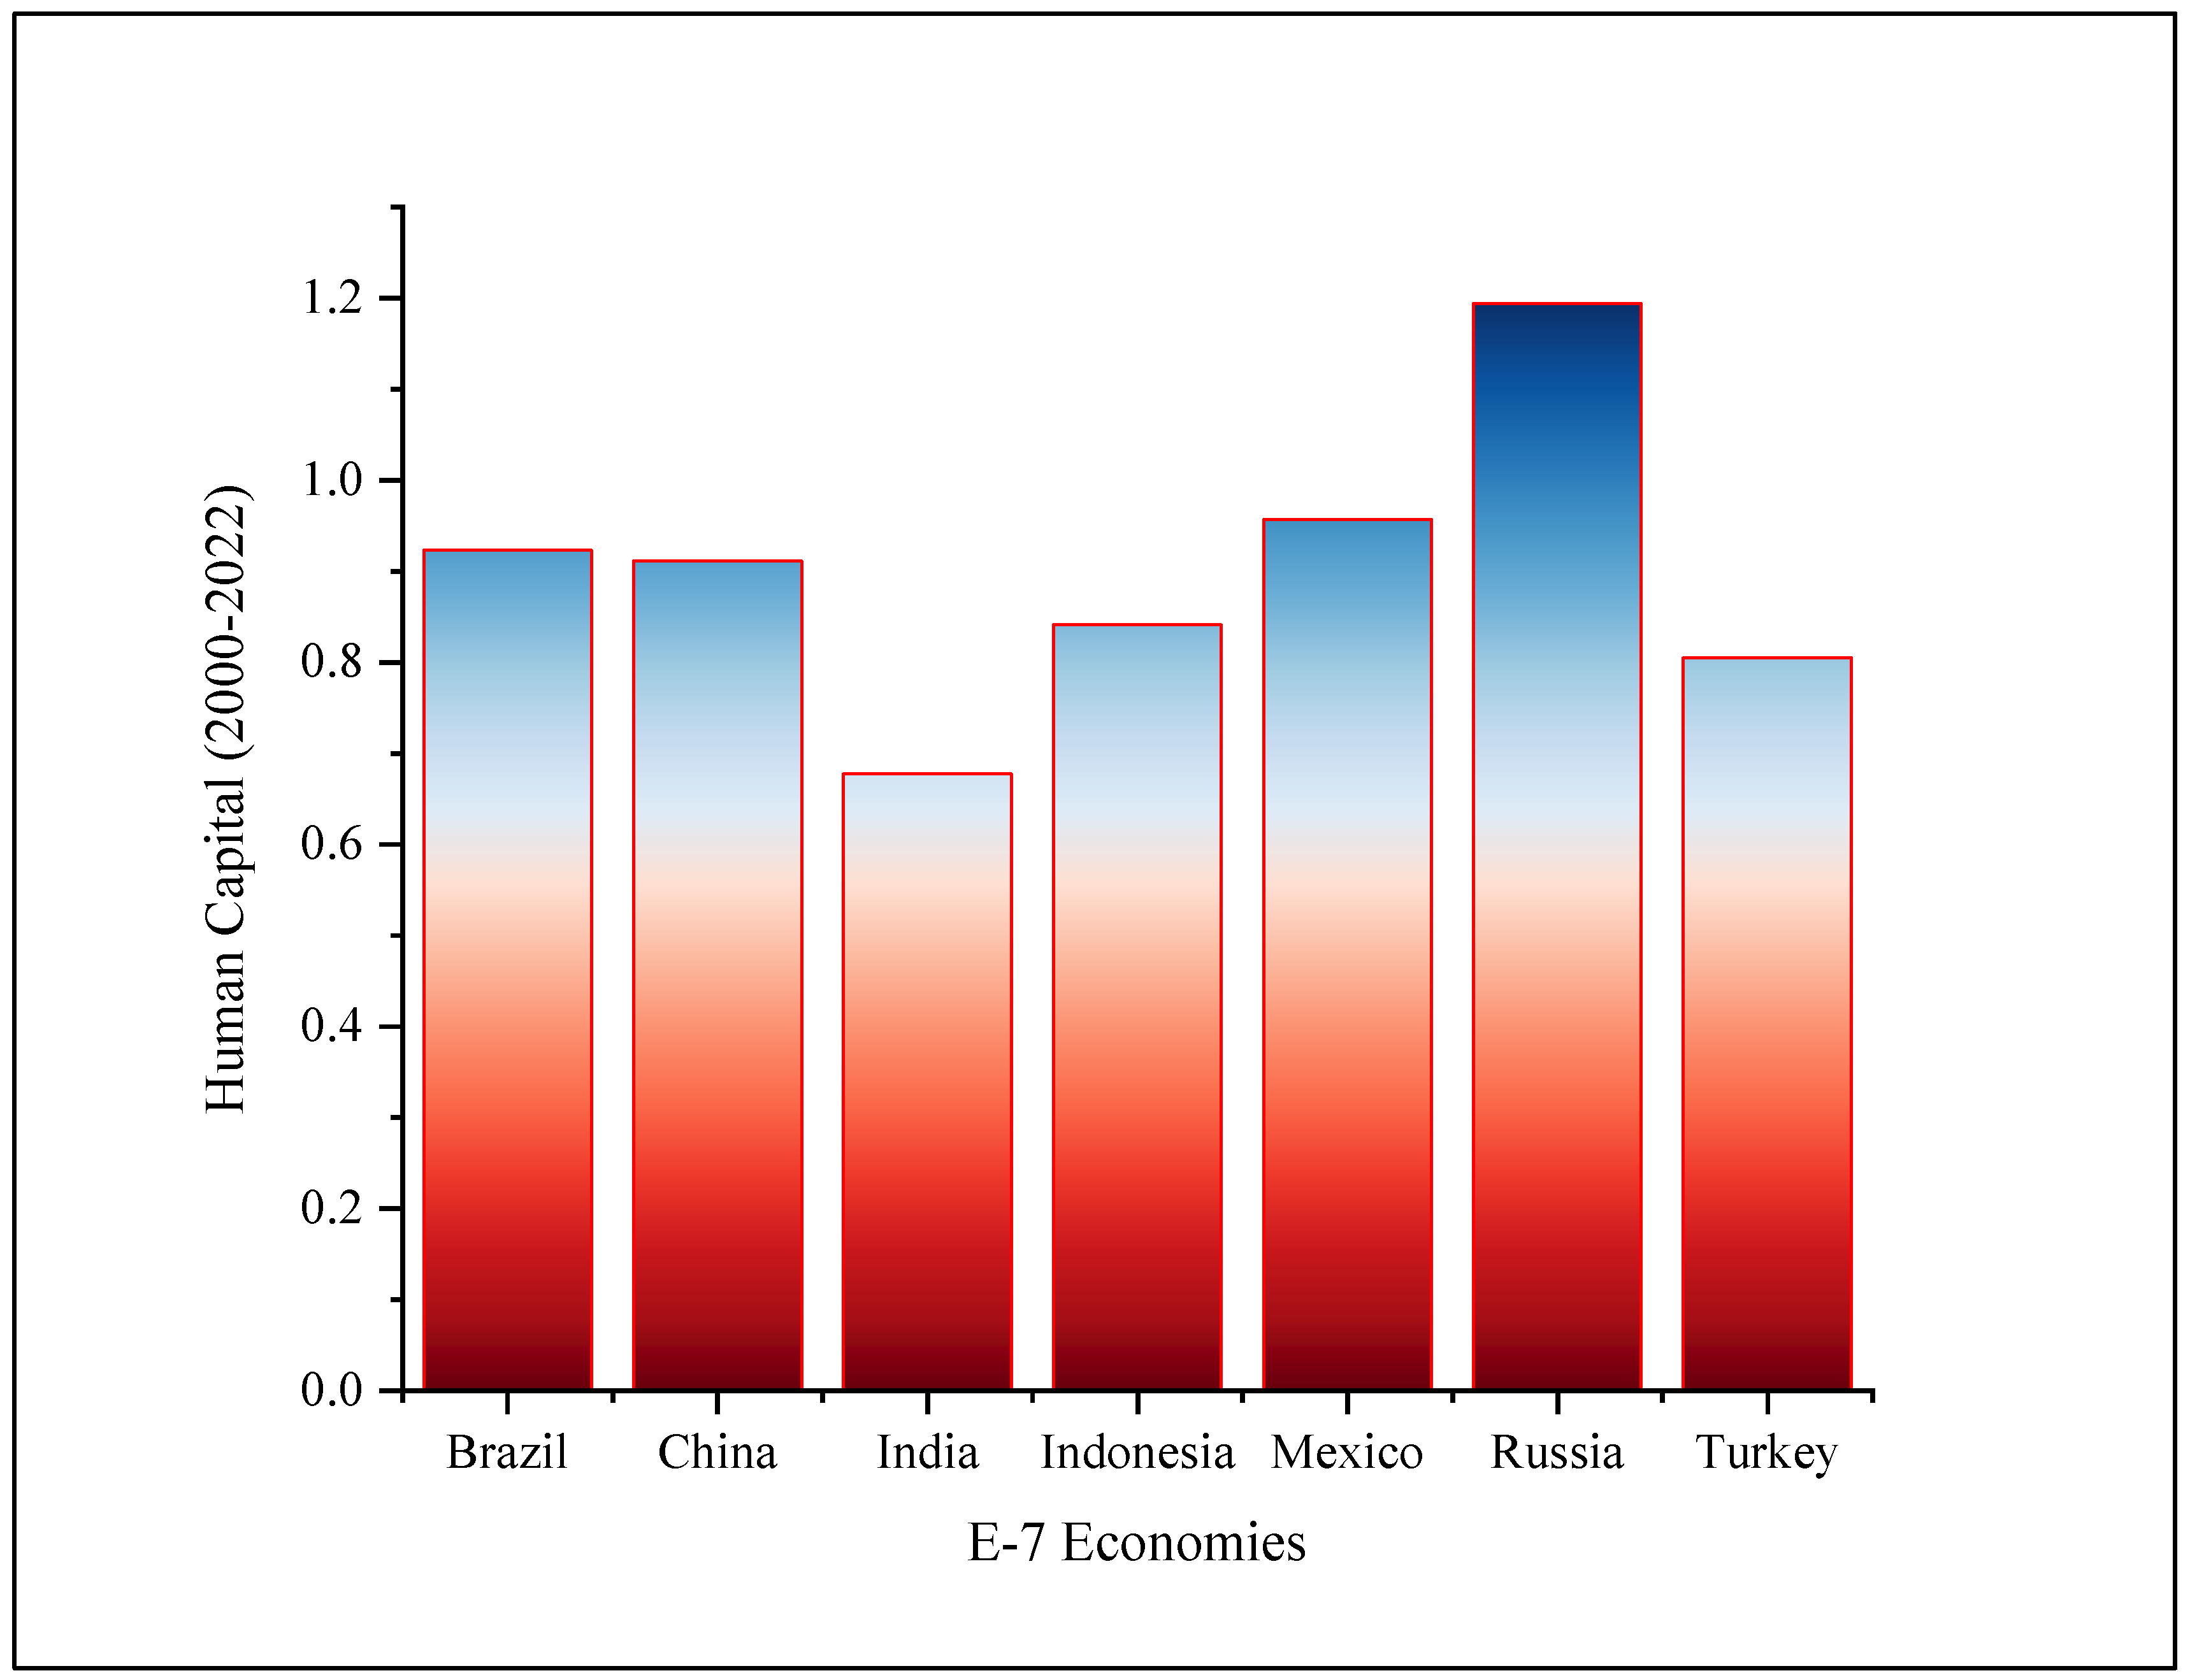
Figure 4.
FDI in E-7 Economies. Source: World Bank [9].
Figure 4.
FDI in E-7 Economies. Source: World Bank [9].
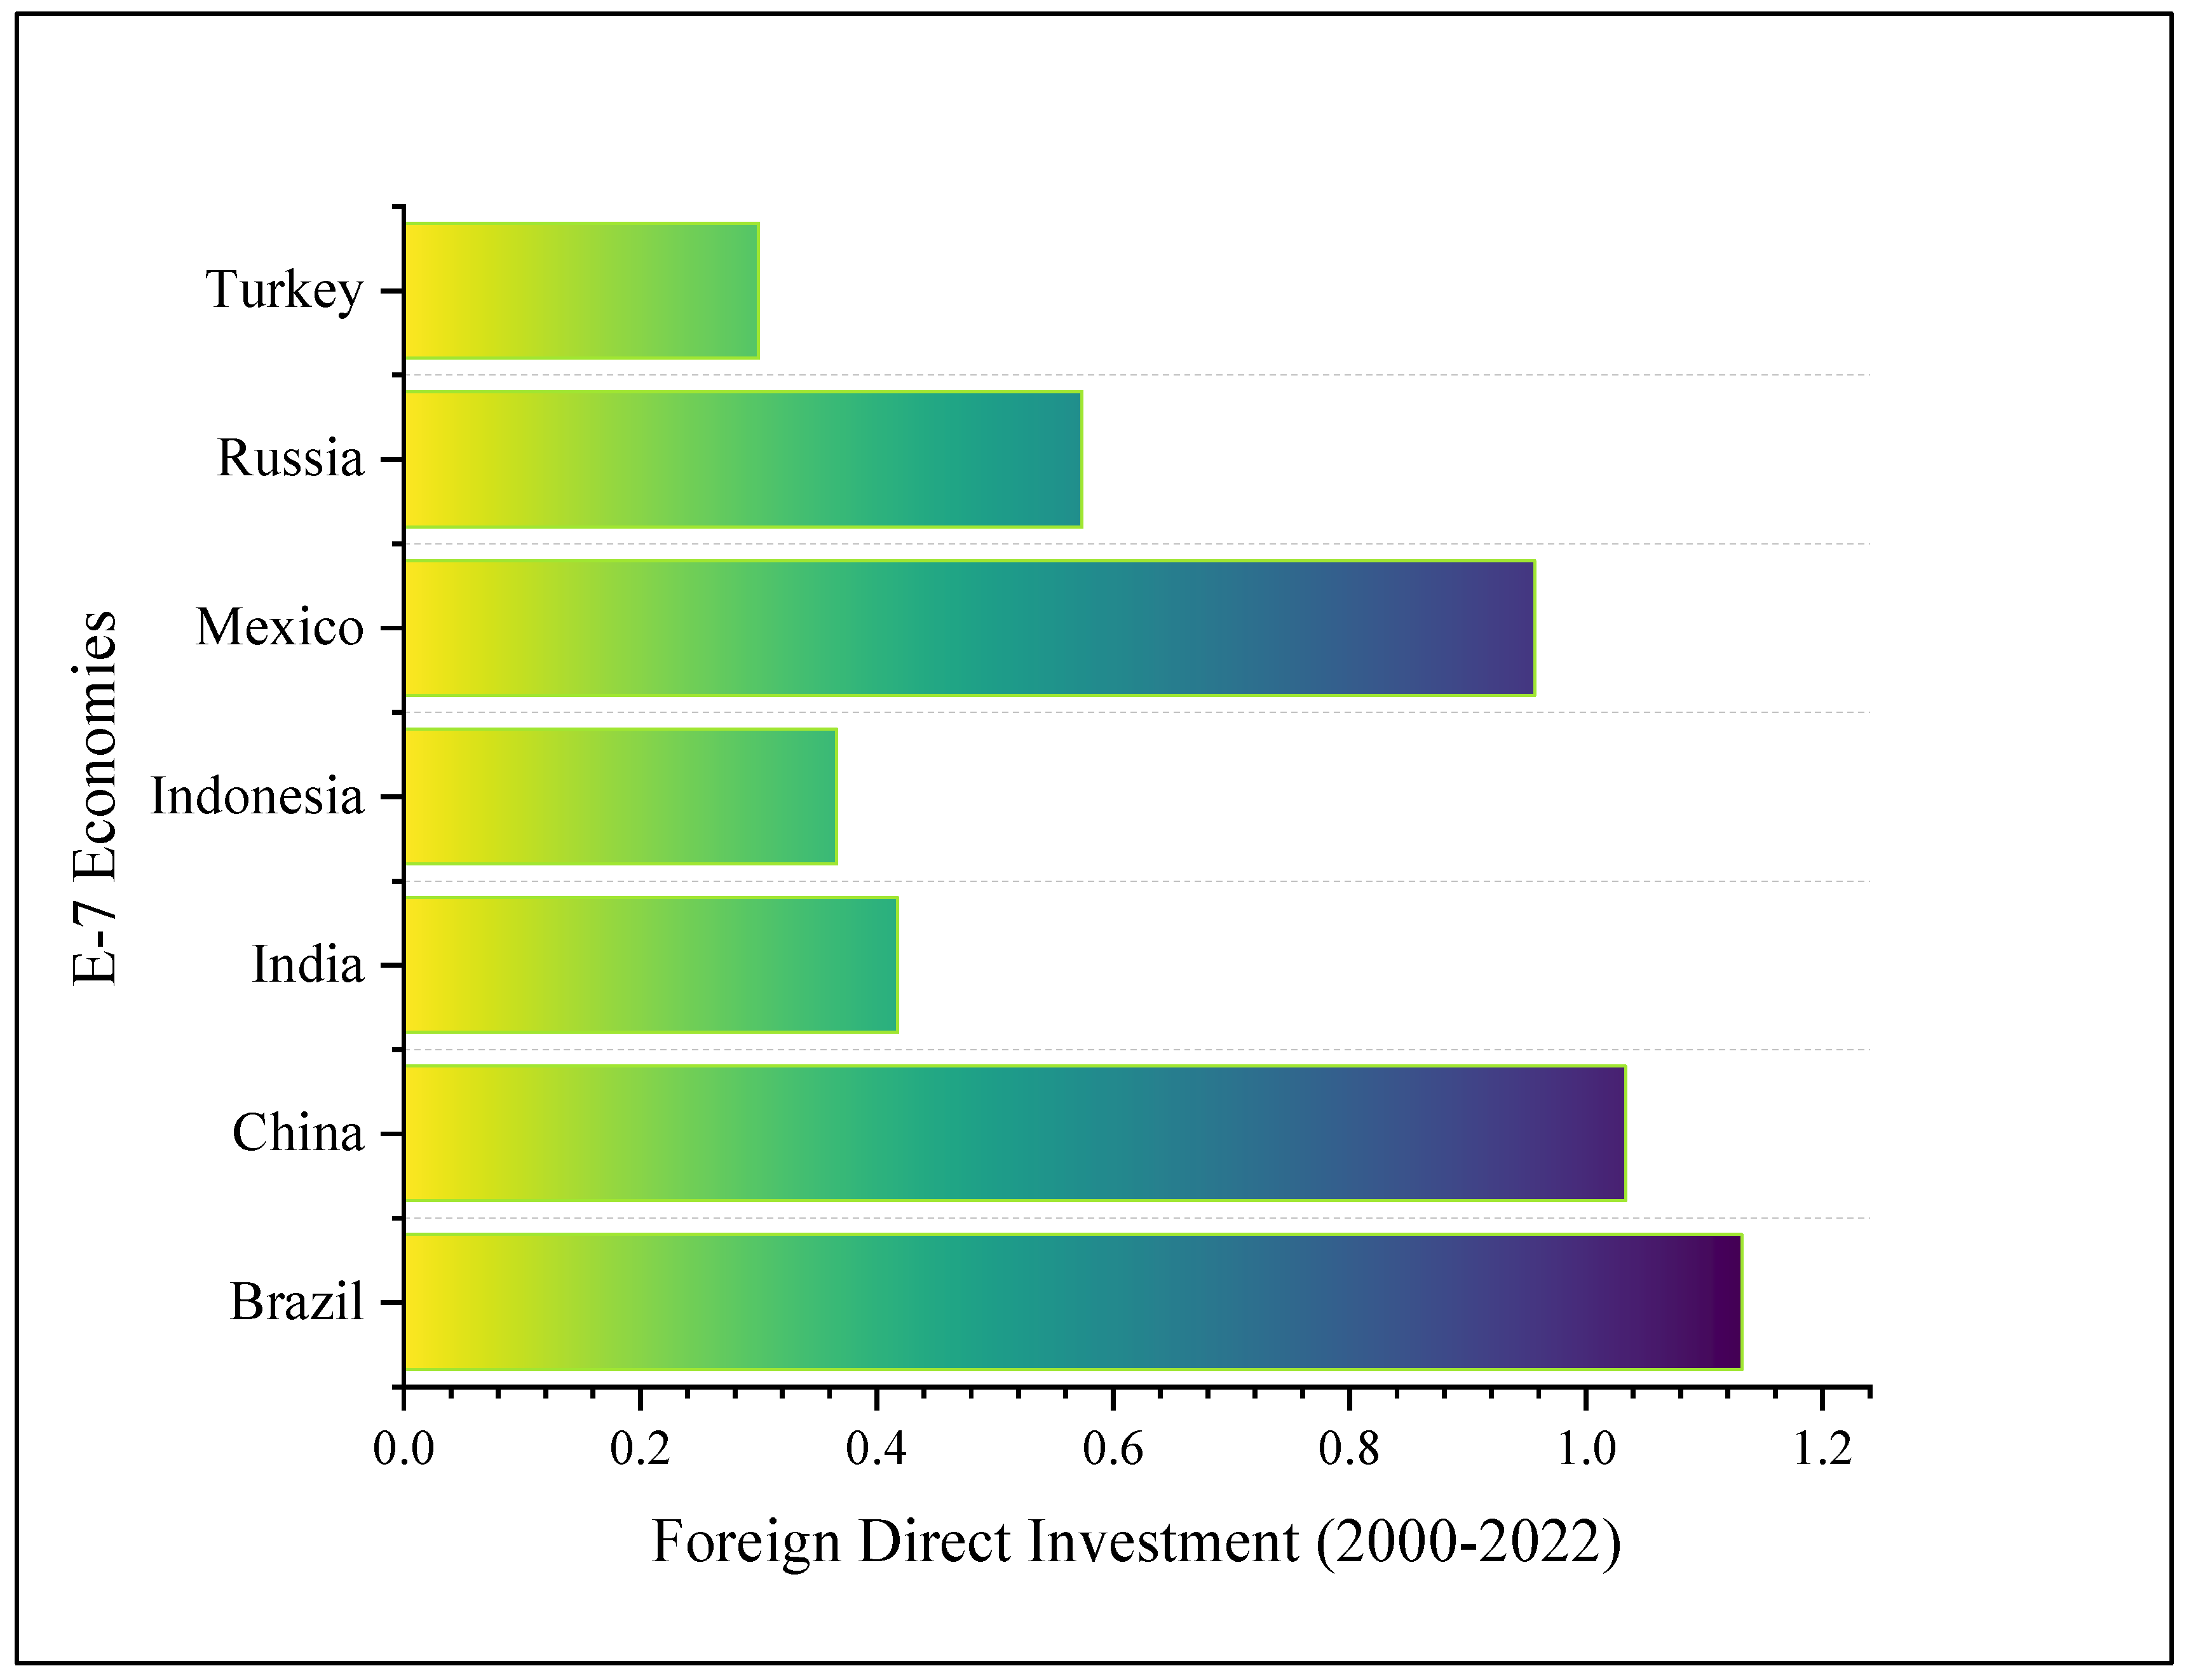
Figure 5.
Findings from CUP-FM, CUP-BC, and DSUR. Source: Author’s calculation.
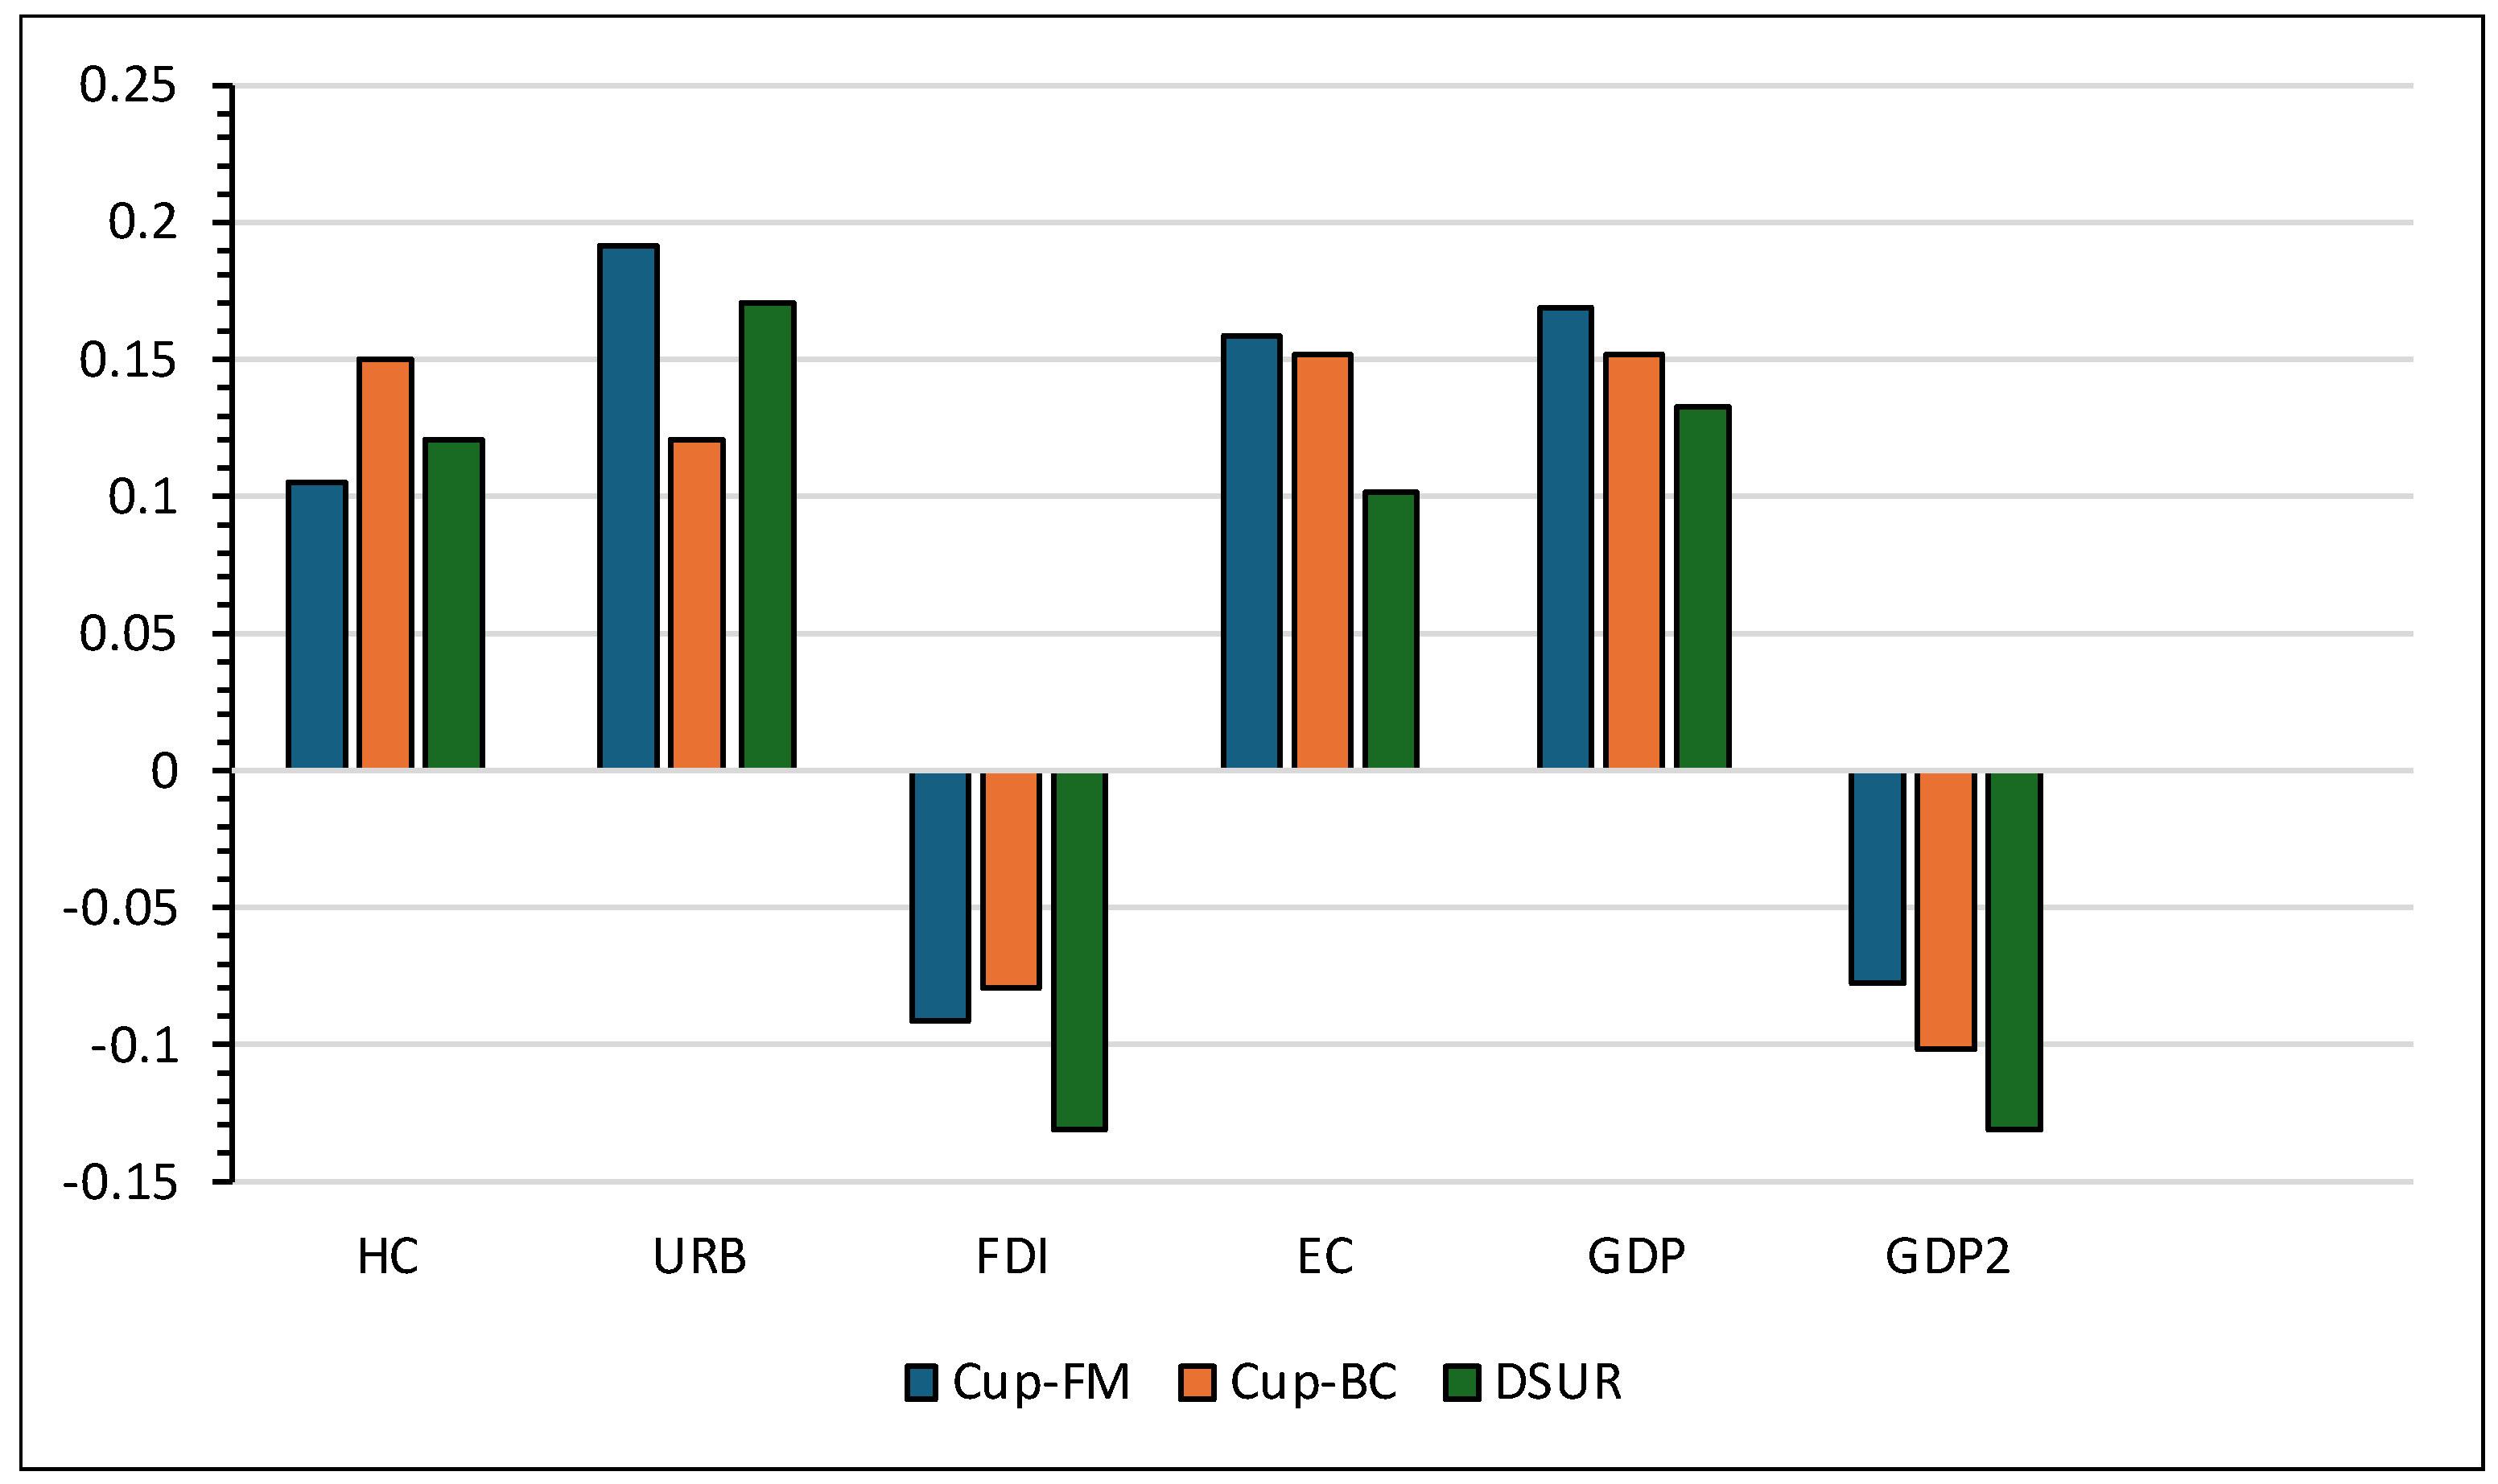
Figure 6.
Findings for Cup-FM, Cup-BC, and DSUR. Source: Author’s calculation.
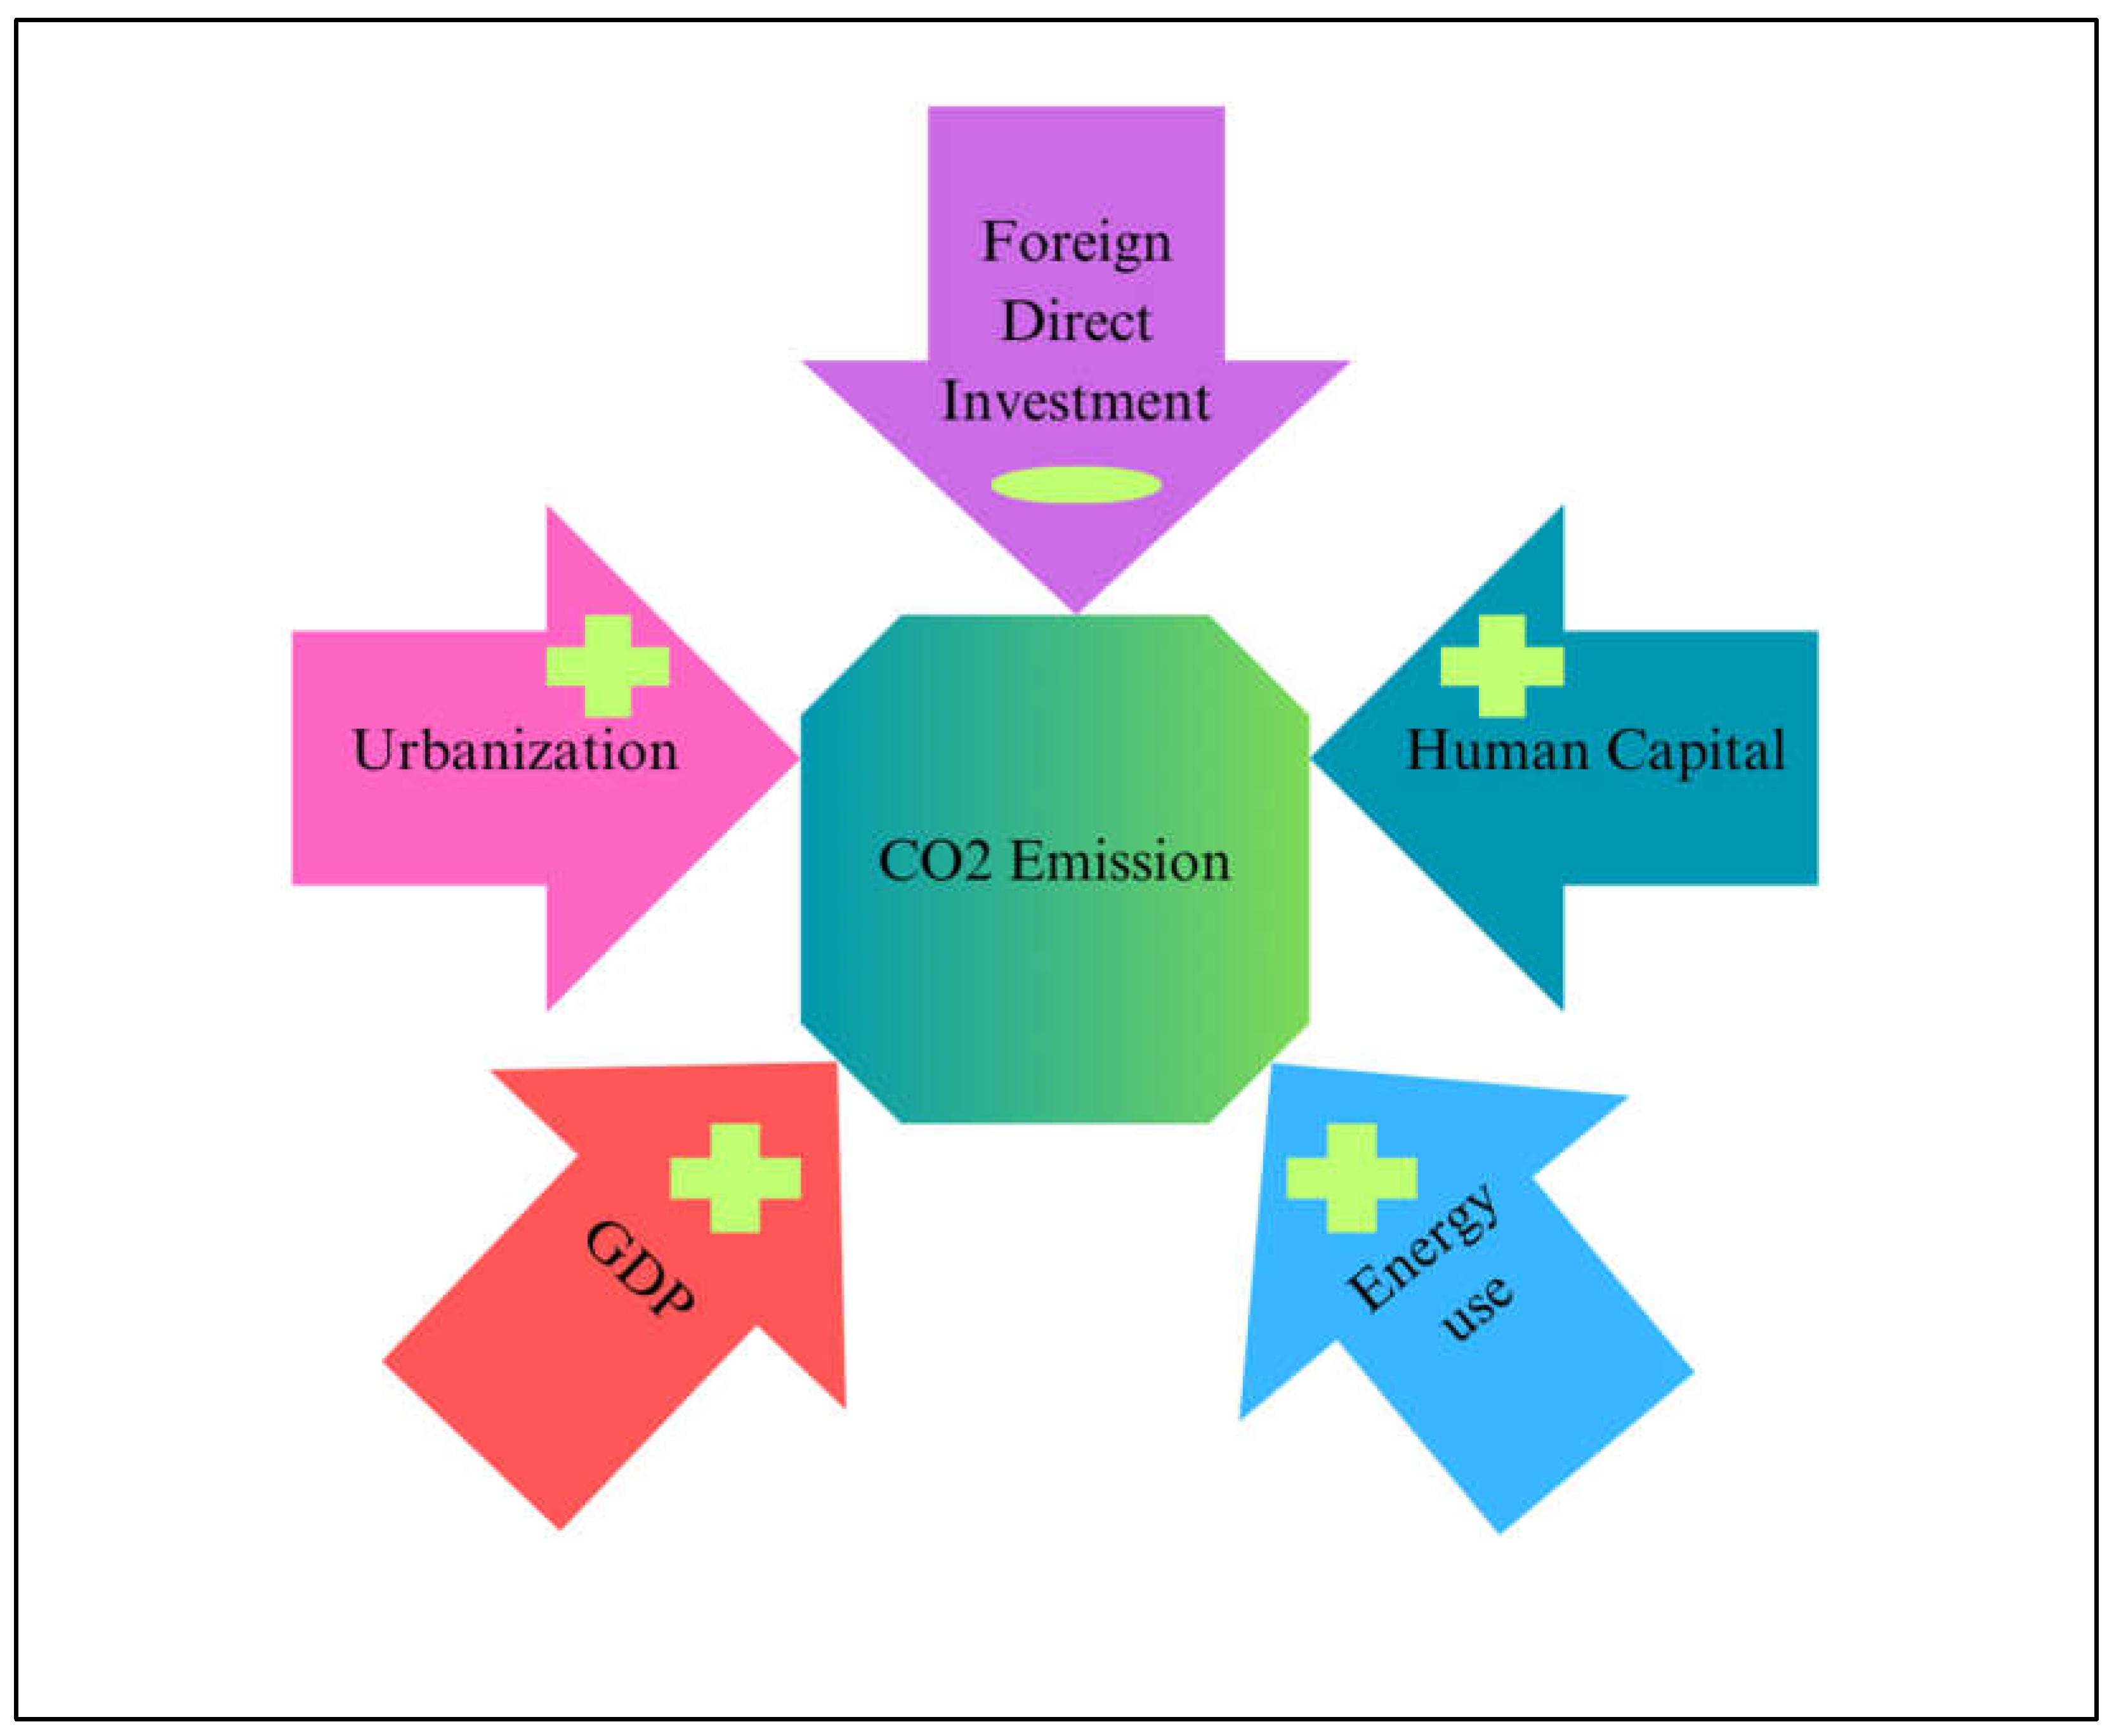
Figure 7.
CUP-FM, CUP-BC, and DSUR results: Mediating effects of FDI and urbanization. Source: Author’s calculation.
Figure 7.
CUP-FM, CUP-BC, and DSUR results: Mediating effects of FDI and urbanization. Source: Author’s calculation.
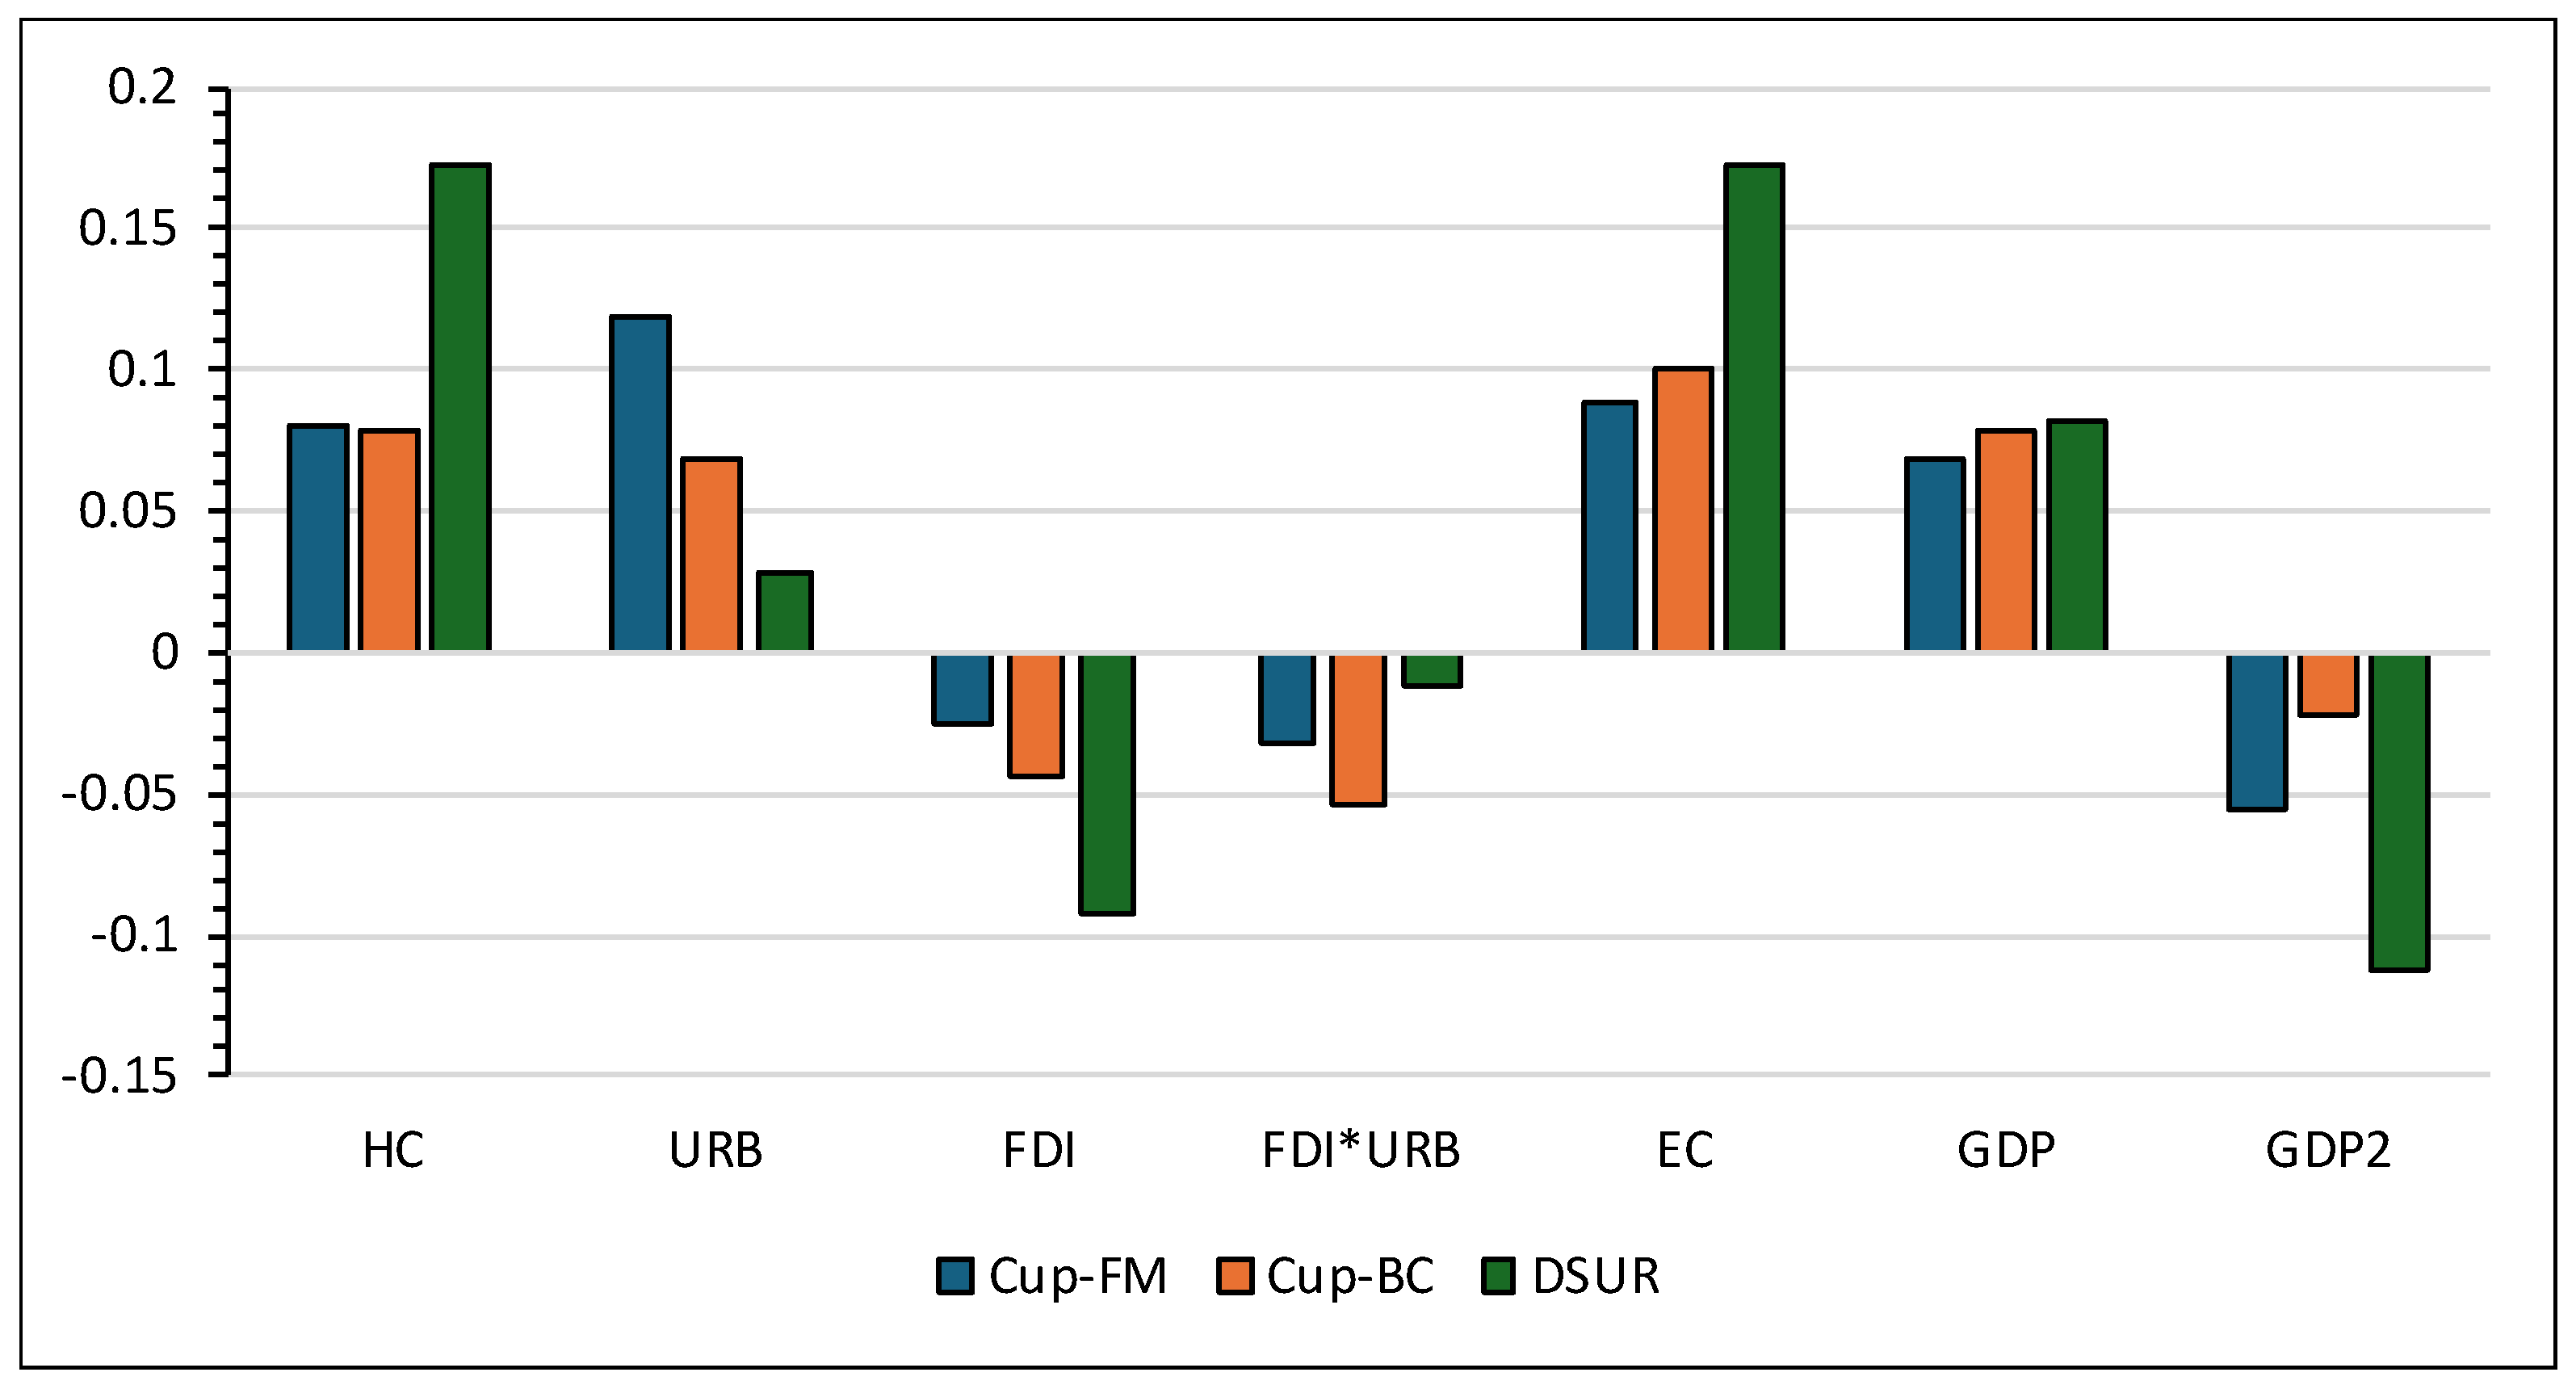
Figure 8.
CUP-FM, CUP-BC, and DSUR results: Mediating effect of FDI & Human capital. Source: Author’s calculation.
Figure 8.
CUP-FM, CUP-BC, and DSUR results: Mediating effect of FDI & Human capital. Source: Author’s calculation.
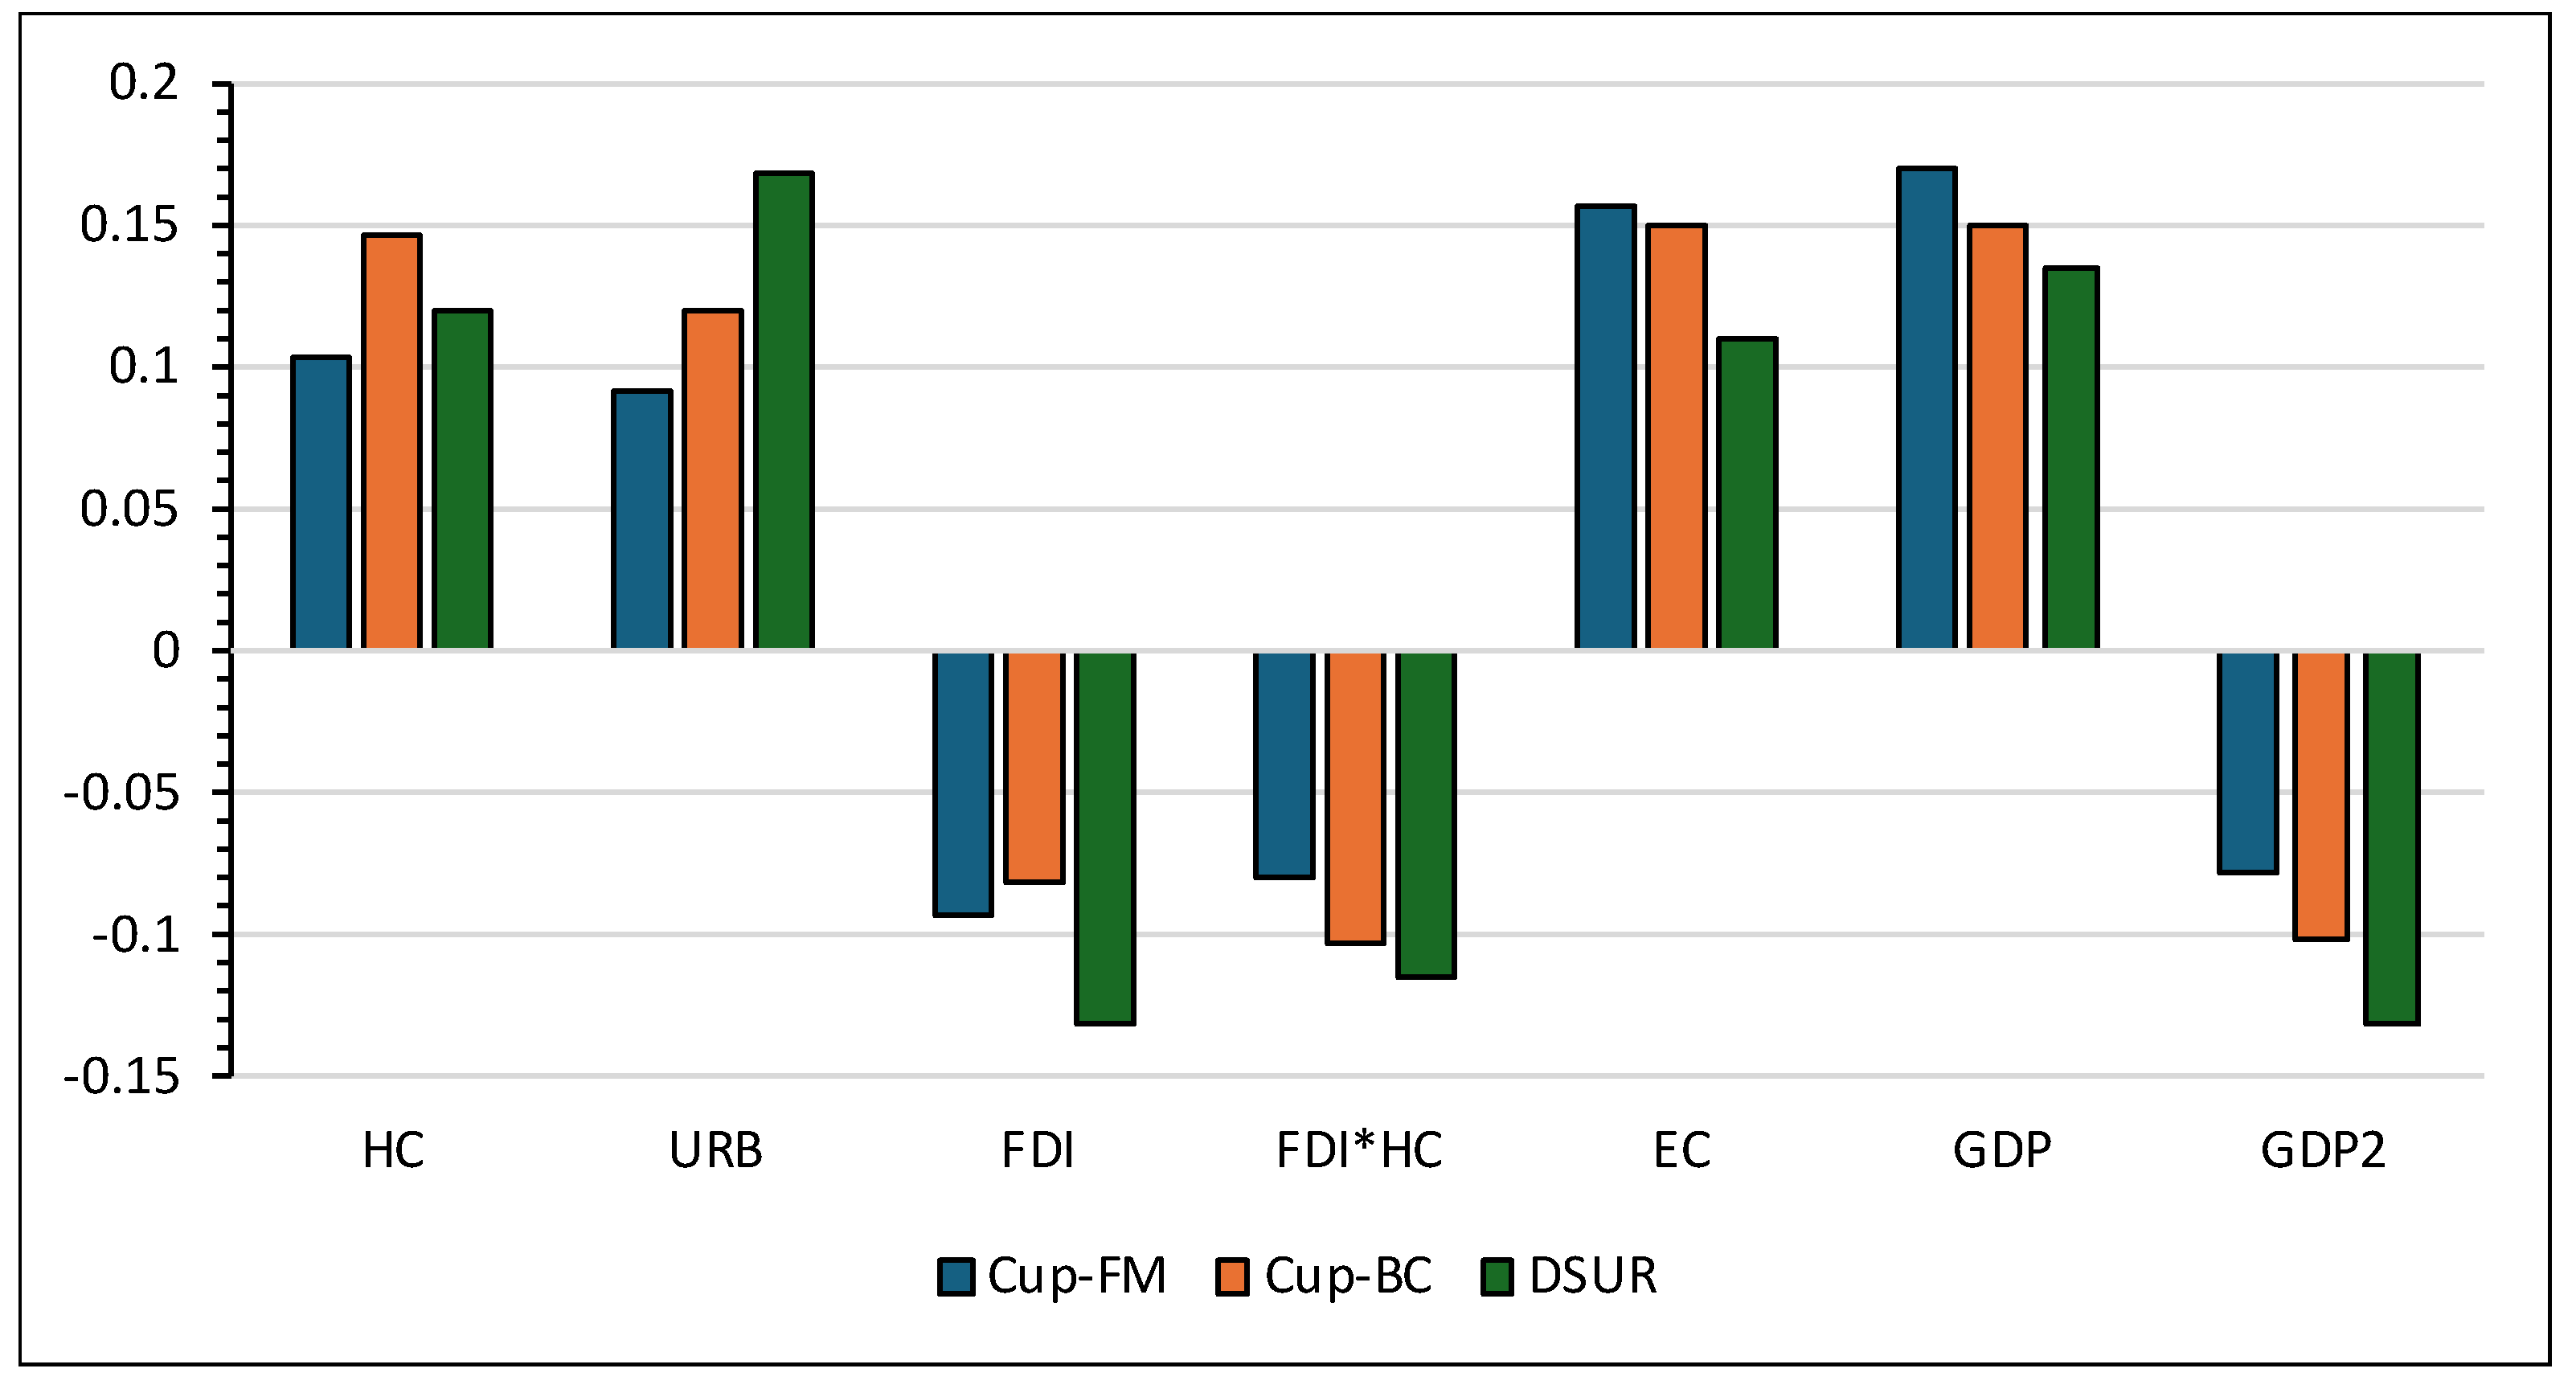

Table 1.
Outcomes of CD and slope heterogeneity test.
| Breusch-Pagan LM Test | Pesaran Scaled LM Test | Adjusted LM Test | Pesaran CD Test | ∆ | Adj.∆ | |
| CO2 | 315.302a | 17.833a | 127.934a | 12.582a | 29.87a | 103.109a |
| HC | 235.733a | 18.356a | 224.55a | 42.186a | 70.144a | 138.655a |
| URB | 179.885a | 37.878a | 138.041a | 54.954a | 57.97a | 126.852a |
| FDI | 244.548a | 27.477a | 109.788a | 21.012a | 49.767a | 122.94a |
| EC | 406.663a | 26.557a | 123.517a | 53.829a | 59.177a | 55.843a |
| GDP | 169.386a | 31.385a | 213.025a | 30.683a | 33.853a | 87.594a |
LM signifies Lagrange Multiplier, ∆ shows Delta and Adj.∆ exhibits Adjusted Delta. Note: c, b, and a are significant at the 10, 5, and 1% levels.
Table 2.
Panel unit root test results.
| Variables | CADF statistic | CIPS statistic | CADF statistic | CIPS statistic | ||||
| Constant | Constant | Constant and trend | Constant and trend | |||||
| Level | 1st difference | Level | 1st difference | Level | 1st differences | Level | 1st difference | |
| CO2 | -2.005 | -4.048a | -1.821 | -6.149a | -2.634 | -7.823a | -1.14 | -3.253a |
| HC | -1.527 | -4.299a | -1.209 | -6.532a | -1.808 | -4.677a | -2.531 | -2.973a |
| URB | -2.923 | -2.868a | -2.932 | -3.473a | -2.052 | -3.786a | -2.463 | -4.604a |
| FDI | -1.886 | -3.007a | -1.851 | -2.094a | -1.851 | -3.191a | -2.782 | -7.095a |
| EC | -2.827 | -7.876a | -2.069 | -4.573a | -1.413 | -4.898a | -1.918 | -7.423a |
| GDP | -1.471 | -6.487a | -2.304 | -5.759a | -2.956 | -3.241a | -2.635 | -4.775a |
c, b, and a denote significance at the 1%, 5%, and 10% levels.
Table 3.
Panel Cointegration Analysis Outcome.
| Pedroni [50] | |||||
| Within-dimension | Statistics | Prob. | Between-dimension | Statistic | Prob. |
| Panel v-Statistic | 1.788b | 0.038 | Group rho-Statistic | 1.313 | 0.904 |
| Panel rho-Statistic | 0.648 | 0.742 | Group PP-Statistic | -2.228b | 0.014 |
| Panel PP-Statistic | -2.328b | 0.010 | Group ADF-Statistic | -2.315b | 0.010 |
| Panel ADF-Statistic | -2.418a | 0.008 | |||
| Kao [49] | t-Statistic | Prob. | Westerlund [51] | Z-Value | P-Value |
| ADF | -2.175b | 0.014 | Gt | -4.069a | 0.000 |
| Ga | 1.658 | 0.951 | |||
| Pt | -3.145a | 0.000 | |||
| Pa | -0.862 | 0.194 | |||
The significance levels are c at 1%, b at 5%, and a at 10%.
Table 4.
Results from CUP-FM, CUP-BC, and DSUR.
| Variables | CUP-FM | CUP-BC | DSUR | ||||||
| Coeff. | Std. error | t-stat | Coeff. | Std. error | t-stat | Coeff. | Std. error | t-stat | |
| HC | 0.105a | 0.036 | 3.052 | 0.149a | 0.039 | 3.858 | 0.121a | 0.018 | 7.989 |
| URB | 0.191b | 0.038 | 2.414 | 0.120a | 0.023 | 5.956 | 0.170a | 0.027 | 6.543 |
| FDI | -0.092a | 0.023 | -3.693 | -0.080b | 0.037 | -2.131 | -0.131a | 0.016 | -7.707 |
| EC | 0.158a | 0.022 | 7.254 | 0.151a | 0.022 | 7.189 | 0.102a | 0.018 | 5.655 |
| GDP | 0.168a | 0.026 | 6.151 | 0.151a | 0.033 | 5.006 | 0.133a | 0.022 | 6.377 |
| GDP2 | -0.077b | 0.035 | -2.148 | -0.101a | 0.020 | -4.871 | -0.131a | 0.026 | -4.672 |
| C | 11.238a | 0.242 | 46.797 | 10.843a | 0.241 | 45.151 | 16.942a | 0.242 | 70.548 |
| R2 | 0.889 | 0.898 | 0.906 | ||||||
| Adj R2 | 0.951 | 0.937 | 0.945 | ||||||
Note: c, b, and a are significant at the 10%, 5%, and 1% levels.
Table 5.
CUP-FM, CUP-BC, and DSUR results; mediating effect of FDI & urbanization.
| Variables | CUP-FM | CUP-BC | DSUR | ||||||
| Coeff. | Std. error | t-stat | Coeff. | Std. error | t-stat | Coeff. | Std. error | t-stat | |
| HC | 0.080a | 0.016 | 3.665 | 0.078a | 0.004 | 27.808 | 0.172a | 0.005 | 27.125 |
| URB | 0.118a | 0.018 | 11.128 | 0.068a | 0.008 | 12.505 | 0.028a | 0.012 | 2.624 |
| FDI | -0.025a | 0.007 | -3.493 | -0.043a | 0.005 | -7.927 | -0.092a | 0.009 | -9.408 |
| FDI*URB | -0.032a | 0.013 | -2.661 | -0.054a | 0.008 | -24.456 | -0.012a | 0.009 | -22.654 |
| EC | 0.088a | 0.009 | 9.436 | 0.100a | 0.003 | 25.743 | 0.173a | 0.011 | 17.362 |
| GDP | 0.068a | 0.008 | 22.654 | 0.078a | 0.009 | 10.202 | 0.082a | 0.007 | 10.505 |
| GDP2 | -0.055a | 0.007 | -13.133 | -0.022a | 0.005 | -3.656 | -0.112a | 0.003 | -23.664 |
| C | 10.365a | 0.360 | 42.568 | 11.324a | 0.356 | 42.453 | 18.467a | 0.356 | 77.678 |
| R2 | 0.901 | 0.910 | 0.920 | ||||||
| Adj R2 | 0.961 | 0.957 | 0.967 | ||||||
Note: c, b, and a are significant at the 10%, 5%, and 1%, respectively.
Table 6.
CUP-FM, CUP-BC, and DSUR results; mediating effect of FDI & Human capital.
| Variables | CUP-FM | CUP-BC | DSUR | ||||||
| Coeff. | Std. error | t-stat | Coeff. | Std. error | t-stat | Coeff. | Std. error | t-stat | |
| HC | 0.103c | 0.033 | 3.050 | 0.147b | 0.038 | 3.851 | 0.119a | 0.015 | 7.988 |
| URB | 0.091c | 0.037 | 2.412 | 0.119a | 0.022 | 5.955 | 0.168a | 0.025 | 6.540 |
| FDI | -0.094b | 0.025 | -3.696 | -0.081b | 0.038 | -2.130 | -0.132a | 0.017 | -7.708 |
| FDI*HC | -0.080a | 0.028 | -4.987 | -0.103a | 0.044 | -6.346 | -0.115a | 0.033 | -5.876 |
| EC | 0.157a | 0.021 | 7.253 | 0.150a | 0.021 | 7.188 | 0.109a | 0.019 | 5.654 |
| GDP | 0.169a | 0.027 | 6.152 | 0.150a | 0.033 | 5.007 | 0.135a | 0.021 | 6.379 |
| GDP2 | -0.078c | 0.036 | -2.149 | -0.102a | 0.021 | -4.872 | -0.132a | 0.028 | -4.674 |
| C | 11.237a | 0.240 | 46.795 | 10.842a | 0.240 | 45.150 | 16.941a | 0.240 | 70.549 |
| R2 | 0.888 | 0.899 | 0.905 | ||||||
| Adj R2 | 0.950 | 0.938 | 0.944 | ||||||
Note: c, b, and a significance level of 10%, 5%, and 1%.
Disclaimer/Publisher’s Note: The statements, opinions and data contained in all publications are solely those of the individual author(s) and contributor(s) and not of MDPI and/or the editor(s). MDPI and/or the editor(s) disclaim responsibility for any injury to people or property resulting from any ideas, methods, instructions or products referred to in the content. |
© 2025 by the authors. Licensee MDPI, Basel, Switzerland. This article is an open access article distributed under the terms and conditions of the Creative Commons Attribution (CC BY) license (http://creativecommons.org/licenses/by/4.0/).
Copyright: This open access article is published under a Creative Commons CC BY 4.0 license, which permit the free download, distribution, and reuse, provided that the author and preprint are cited in any reuse.


