
Submitted:
11 April 2025
Posted:
11 April 2025
You are already at the latest version
Abstract
Existing stellar map simulators lack color temperature information, have a complex system structure, and cannot independently control the color temperature of stars. Therefore, this study developed an OLED-based semi-physical simulation method and a simulation algorithm for the stellar map with color temperature information to realize a semi-physical simulation of the stellar map close to the real situation in space. The study also aimed to independently control the color temperature of each star. The simulation effect of the stellar map with color temperature information was verified using four stellar maps. The developed simulator achieved independent and controllable color temperature information for each star in the stellar map.
Keywords:
stellar map
; Color temperature simulation
; Semi-physical simulation
; Star sensor
; Color temperature deviation calibration
1. Introduction
The star sensor—a star-sensitive device—is a key component of the spacecraft attitude determination and control system whose accuracy directly affects the performance of the navigation system [1]. The working conditions of the star-sensitive device [2] have become increasingly complex, and its navigation method has developed from the traditional astronomical angular measurement or ranging navigation method to emerging navigation technologies, such as astronomical spectral velocimetry navigation using stellar color temperature information [3,4,5]. Existing star simulators, which can only provide limited information on the color temperatures of the stars [6,7], fail to satisfy the ground-based calibration requirements of the star-sensitive device.
Recent efforts have been made to accurately simulate the multi-dimensional information of stellar maps in outer space. For example, Linghao Wu et al. [8] developed a star simulator with stray light suppression capability and simulated stellar map of stars as dim as magnitude 6. Schulz et al. [9] developed a stellar map generation method with controllable Gaussian background noise and simulated stellar map with an approximate sky background. Teague and Chahl [10] developed a simulation method for motion-blurred stellar map, effectively correcting the grayscale information of stellar map in stellar map display devices through color space conversion methods. Although this method only generated grayscale stellar map, it has significant implications for simulating stellar map with color temperature information using a single stellar map display device.
With the development of spectral simulation architectures from multi-LED mixing [11] to spatial light modulation-based dimming [12], stellar spectral simulation methods have been extensively investigated. Liu et al. [13] simulated a single star in the 3000–11000 K color temperature range using a digital micromirror device (DMD) and a fuzzy proportional–integral–derivative (PID) control algorithm. Yun et al. [14] extended the color temperature simulation range to 2000–12000 K by combining backpropagation (BP), a neural network, and a PID control algorithm. Although the above two methods can simulate the color temperature information of individual stars more realistically, they cannot simulate the real state of stars with different color temperature information in stellar map.
To improve the similarity between the stellar map and the actual state of outer space, Bin Zhao et al. [15] proposed a fast playback method in which the stellar maps were fused with cosmic background radiation information to improve the stellar maps’ refreshing speed. However, the simulation of stellar map with stellar color temperature information has still not been realized. Songzhou Yang et al. [16] developed a “series–parallel” hybrid, multi-source, information fusion, spatial target simulation system. In this system, three light sources (one LED light source and two blackbody light sources) and three spatial light modulation devices (one thin-film transistor liquid crystal display (TFT-LCD) and two DMDs) were used to simulate each star in the stellar map. The energy ratio of four spectral intervals (UV, visible, mid-wave infrared, and long-wave infrared) of each star in the stellar map could be adjusted. However, the system structure was complicated, and the system could not accurately simulate the color temperature.
In summary, the existing current stellar map simulators have various shortcomings, such as missing color temperature information, complex system structure, and inability to independently control the color temperature of stars. Therefore, this study aimed to address this research gap by developing a semi-physical stellar map simulation method with color temperature information. The stellar map simulator leveraged an OLED-based architecture. A stellar map simulation link with color temperature information was established, and a stellar map generation algorithm with color temperature information was proposed. We successfully controlled the color temperature of each star in the semi-physical simulation in the stellar map. This study provides new technical means and implementation approaches for the ground calibration and testing of star sensors. The developed star simulator has important theoretical and practical significance.
2. Framework for Semi-Physical Simulations of Stellar Maps with Color Temperature Information
When significantly distant stars are observed through optical payloads such as star sensitizers, they can be regarded as point light sources at infinity [17]. Currently, star simulators use liquid crystal on silicon (LCOS) [18], LCD [19], or DMD [20] as stellar map display devices placed at the focal plane and according to the working principle of the collimated optical system [21]. Combined with the stellar map illumination device [22], stellar maps are simulated at infinity by loading the grayscale images of stellar maps. However, the current stellar map illumination devices are mostly LED light sources [23], blackbody radiation sources [24], or specially designed illumination optical systems [25], which can only output illumination beams with fixed color temperature information. The illumination area of the stellar map illumination device covers the entire range of the stellar map display device. Therefore, the stars displayed in existing stellar map display devices all have the same color temperature information. However, the stars in actual space have different color temperature information, resulting in inconsistency between the simulated and actual color temperature information. Therefore, in this study, the architecture of the star simulator is simplified by replacing the traditional stellar map display device and stellar map illumination device with a self-luminous OLED device that enables independent and controllable color temperature information of each pixel. As such, the stellar map simulation with color temperature information is realized so that the stellar map simulated is closer to the actual state of stars in the universe.
The color temperature information of stars is primarily classified based on their surface temperatures [26], and the OLED devices adjust the color temperature by adjusting the ratio of the luminous intensity of the three primary colors of red (R), green (G), and blue (B) [27]. The light beam emitted from the stellar map displayed by the OLED device passes through the collimated optical system. Thus, the color temperature of the simulated stellar map deviates from that of the OLED device [28] and the spectral transmittance of the collimated optical system [29]. Compensating for this combined color temperature deviation is necessary. Therefore, a stellar map simulation algorithm linked with color temperature information was formulated to improve the ability of the OLED-based stellar map simulation architectures to accurately simulate stellar maps containing color temperature information. The stellar map simulation architecture and algorithm link with color temperature information are shown in Figure 1.
3. Algorithm for Stellar Map Simulation with Color Temperature Information
According to the architecture and algorithmic links, the stellar map simulation algorithm with color temperature information was divided into three modules: conversion of the stellar spectrum into the three primary colors of RGB, color temperature deviation calibration, and stellar map generation algorithm with color temperature information. The algorithmic flow is shown in Figure 2.
3.1. Stellar Spectral Type to RGB Triple-Color Conversion
Stellar spectral types are primarily classified into seven according to the Harvard spectral classification (HSC): O, B, A, F, G, K, and M. Each spectral type is further subdivided into ten subtypes ranging from 0 to 9 [30]. No formula has been established to convert stellar spectral types directly to RGB triplet colors owing to the complexity of the stellar spectra and the nonlinear relationship between spectral features and blackbody color temperature. Therefore, the stellar spectral types were numerically coded to facilitate the calculation and analysis, with 1 as the coding interval, and the 70 spectral subtypes from the O0 to M9 type were sequentially coded from 00 to 69 starting from 0. The coding rules are listed in Table 1.
Based on the discrete data of stellar spectral type and temperature provided by Harre and Heller [31], the spectral type of the star was converted to the corresponding stellar temperature by a polynomial fitting method [32] given by
where is the stellar temperature, s is the spectral-type code, and a1, a2,…an are the polynomial coefficients corresponding to the nth spectral-type code. As stellar radiation approximates blackbody radiation at a certain temperature [33], according to Planck's formula for blackbody radiation, the spectral profile emitted by a star can be expressed as
where λ is the wavelength, h is Planck's constant (), c is the speed of light ( ), k is Boltzmann's constant (). According to the color matching functions, , , and are defined by the International Commission on Illumination (CIE) [34]. The triple-stimulus XYZ values of the stellar spectral curve [35] were obtained as
The corresponding RGB triple-base color on the OLED was obtained through the RGB conversion matrix [36] as
where is an element of the RGB transformation matrix representing the linear transformation coefficients from the XYZ to RGB color spaces.
3.2. Color Temperature Deviation Calibration
The color temperature deviation calibration was performed by loading the standard color card images of multiple color blocks on the OLED device and using a color temperature calibrated industrial camera to obtain the three chromatic colors of each color block after collimating the optical system. Thus, the color temperature deviation calibration matrix was obtained.
Let the number of color blocks in the standard color card be n. The theoretical tri-color of the standard color block numbered i can be expressed as , where . Then, the theoretical RGB tri-color matrix of the standard color card is
. The industrial camera can obtain the RGB tri-color of the corresponding standard color block as. Then, the RGB tri-color matrix of the standard color card obtained by the industrial camera is . According to the principle of least squares, the color temperature deviation calibration matrix (CCM) can be expressed as
According to Equation(1)–(5), the color temperature deviation-calibrated stellar spectral type corresponding to the three fundamental colors , , and are
3.3. Algorithm for Generating Stellar Maps with Color Temperature Information
Based on the stellar spectral type to RGB three-color conversion law and the color temperature deviation calibration, the stellar map presents the attitude information of the celestial coordinate system [37] (azimuth , pitch , roll ) to obtain the stellar map pointing unit vector as
The 3D coordinates of the star point [38] were screened according to the stellar map field of view (FOV), and the maximum coordinate values of the stellar map display device were set as and . Then, the coordinates of the simulated star on the stellar map display device (x', y') were obtained as
Subsequently, according to the stellar spectral type in the stellar catalog [39], Equation(5) and (6) were used to obtain the RGB triple colors of the OLED device corresponding to the star, thus completing the generation of the stellar map with color temperature information.
4. Experimentation and Discussion
4.1. Experimental Platform and Design
In this study, the stellar map simulation algorithm with color temperature information was implemented on the host computer using the Visual Studio 2022 development tool based on the Microsoft Foundation Class framework. OpenCV image processing and Eigen matrix manipulation libraries were introduced during the development process. The stellar map simulation device was constructed using Sony MicroOLED ECX331DB-6 with a resolution of 1024 × 768, an 8-bit color depth OLED device, and a collimated optical system with an FOV of 20° × 20° and a focal length of 35 mm. MV-UB1000C by MindVision, which has 10 million pixels, was used as an industrial camera. The semi-physical simulation platform for stellar maps with color temperature information is shown in Figure 3.
Based on the stellar map simulation algorithm with color temperature information, two experimental phases were involved in this study: pre-experiment and validation experiment. The specific experimental arrangement is summarized in Table 2.
4.2. Experimental Results of the Pre-Experimental Phase
The experiment on stellar map generation with color temperature information was divided into two parts: stellar spectral type to RGB triple-color conversion and color temperature deviation calibration.
4.2.1. Stellar Spectral Type to RGB Three-Color Conversion
Polynomial fits from 1 to 50 times were conducted to obtain the optimal polynomial fit of the spectral type of the star to the blackbody color temperature. The fit correlation coefficient [34] was used to evaluate the polynomial fit. The relationship between the polynomial counts and fit correlation coefficients is shown in Figure 4.
As shown in Figure 4, the fitting correlation coefficients were ˃0.99 for the fitting times in the interval from 3 to 37, and the 22nd polynomial fitted the best. sRGB is the most widely used color space [35], and its color gamut is sufficient to cover the range of stellar colors [36]. Therefore, the sRGB color space was selected. The stellar spectral type and RGB triple-base color scale relations were obtained (Figure 5) according to Equation(2)–(4).
4.2.2. Color Temperature Deviation Calibration
The 24-color standard color card was displayed on the OLED device (RGB three-color as and ). The industrial camera was used to obtain the image of the standard color card through the collimated optical system (RGB three-color , , and ), and according to Equation(5), the CCM was obtained as . Then, the RGB three-color of the standard color card were set after calibrating the color temperature deviation to , , and . The color difference of the 24 standard colors before and after the calibration of and was determined using
Here, is the sum of squares of the three primary color deviations of the standard color card before calibration, is the average value of , is the sum of squares of the three primary color deviations of the standard color card after calibration, and is the average value of . Using the standard deviation of and , and , which indicates the overall simulation accuracy of the OLED device on the 24 standard colors of the color blocks before and after calibration, was calculated as 6.98 and 4.34, respectively. The theoretical 24-color standard color card, as well as the standard color card image and the corresponding RGB three-color heat map acquired by the industrial camera before and after calibration, are shown in Figure 6(a,b), respectively. The color difference between the 24 standard color blocks before and after calibration is shown in Figure 6(c). The was smaller than , implying that the color emitted by the OLED after calibration was closer to the standard color card.
4.3. Experimental Results of the Validation Experiment Phase
The simulation accuracy of stellar map with color temperature information before and after calibrating the color temperature deviation was evaluated based on the mapping relationship between the stellar spectral type and RGB tri-color. This was achieved based on the following steps: 1) a mapping table of stellar spectral type () and RGB tri-color () was established (notated as ), and 2) an algorithm for identifying the spectral type of a stellar star point based on the look-up-table method was designed. In the algorithm, the principle of least squares was used to determine the spectral-type position () matching the simulated stellar RGB three-color values (, and ). Then, the corresponding spectral type of the star 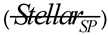 was obtained. The discriminative formula of the stellar star-point spectral type identification algorithm is given as
was obtained. The discriminative formula of the stellar star-point spectral type identification algorithm is given as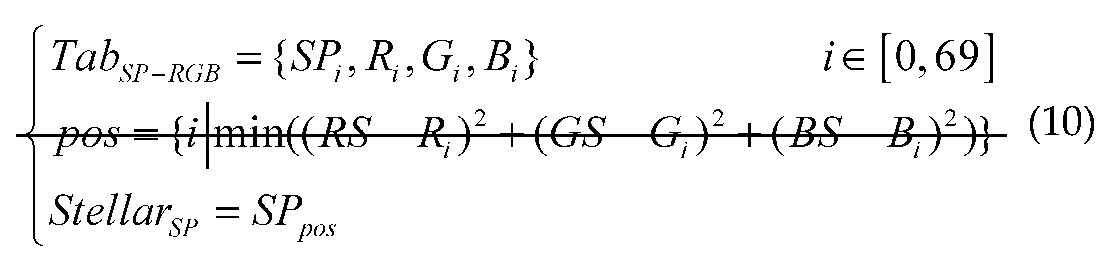
4.3.1. Stellar Map Image Generation with Color Temperature Information
Theoretical stellar map with color temperature information were selected from the commonly used SAO catalog (5091 stars) with magnitudes ranging from 0 Mv to +6.0 Mv and above [37]. Three additional stellar maps with the attitudes (0, 30, 8), (23, -80, 8), and (66, 34, 2) were randomly generated using the stellar map simulation algorithm with color temperature information to obtain the central attitude stellar map (0, 0, 0) and prevent inconsistent experimental results. The overall distribution of the maps and the four attitudes of the stellar maps are shown in Figure 7.
4.3.2. Semi-Physical Simulation of Stellar Maps with Color Temperature Information
Four theoretical stellar maps with color temperature information were loaded onto the OLED device. The stellar maps with uncalibrated and calibrated color temperature deviations were successively captured using the industrial camera, and the spectral type simulation effect of the four maps was obtained using the stellar star-point spectral-type recognition algorithm. The color temperature deviation-calibrated stellar maps are shown in Figure 8(a), and the spectral type simulation accuracy is shown in Figure 8(b).
The maximum, average, and standard deviations of the spectral type simulations of the four stellar maps before and after calibration are summarized in Table 3. The maximum deviation of the simulated spectral types of the four stellar maps after calibration was 9, which was smaller than the metric scale of ten minor spectral types within a major stellar spectral type. This deviation was reduced by a factor of 1.89–2.11, demonstrating significant improvement in the accuracy of the stellar maps spectral simulation. In addition, the average and standard deviations of the simulated spectral types of the four stellar maps after calibration were reduced by a factor of 1.29–1.73 and from 1.58 to 2.53, respectively. This indicated substantially improved accuracy of the spectral simulation of the stellar maps and improved dispersion of the simulation of the overall color temperature information of the stellar maps.
4.4. Discussion and Comparison
The comparison between the related studies on stellar maps simulation and the present study is summarized in Table 4. Linghao Wu et al. [8] successfully simulated fainter stars, Schulz et al. [9] and Bin Zhao et al. [15] simulated the superposition of stellar map and backgrounds, and Teague and Chahl [10] simulated stellar map of motion-blurred stars; however, none of these studies could simulate color temperature. The simulator proposed in [13] and [14] can simulate color temperature in a wide range. However, only a single stellar color temperature can be simulated. The simulators developed in [16] and this study can simulate the color temperature information of stars independently within the stellar map. However, in the simulator proposed in [16], only the energy ratio of four spectral intervals (ultraviolet, visible, mid-wave infrared, and long-wave infrared) can be adjusted, which is a weak simulation of the color temperature information. Conversely, the simulator developed in this study can cover the entire O–M types (the seven main spectral types) and the subtypes of 0–9 under each spectral type, with a total of ten subtypes, totaling 70 stellar spectral types.
In summary, to the best of the authors' knowledge, the proposed semi-physical simulation of stellar map with color temperature information achieved independent controllability of the color temperature information of each star within the stellar map. Concurrently, the simulation range of the stellar spectral types covers all 70 stellar spectral types of the HSC. However, this study presents a limitation in that the bit depth of the device is only 8 bits. Using a device with a higher bit depth would improve the correction ability of the proposed method. In future research, 16-bit color OLED display devices could be used to improve the degree of correction subdivision of the devices and obtain better calibration results.
5. Discussion and Conclusions
This study aimed to overcome the lack of independent simulation methods of stellar color temperature in stellar map and the complex structure of existing stellar map simulation systems with color temperature information. Therefore, a simplified stellar map simulation architecture based on OLED devices and a stellar map simulation algorithm with color temperature information was developed in this study. An experimental platform was developed, and two pre-experiments of stellar spectral type to RGB three-base color conversion and color temperature deviation calibration were performed. Subsequently, four pairs of stellar maps were used to verify the semi-physical simulation effect of stellar maps with color temperature information. According to the experimental results:
- 1.
- The polynomial number of fits of the stellar spectral type to the blackbody color temperature ranged from 3 to 37 correlation coefficients above 0.99, with the 22nd polynomial fit being the best. The standard deviation of the simulated color difference of the 24 standard colors was reduced by a factor of 1.6 after calibration with a 24-color standard color card.
- 2.
- The maximum deviation of the stellar spectral type simulations of the four stellar maps after color temperature bias calibration is better than 9, and the average deviation is better than 6.55, which are all smaller than the metric scale of 10 minor spectral types within a major stellar spectral type.
- 3.
- After the color temperature deviation calibration, the maximum deviation of the spectral type simulation of the four stellar maps is reduced by a factor of 1.89 to 2.11, the average deviation by a factor of 1.29 to 1.73, and the standard deviation of the simulation deviation by a factor of 1.58 to 2.53, which indicates that the spectral simulation limiting accuracy of the stellar map, the overall correctness of the simulation of the color temperature information as well as the dispersion are significantly improved.
In addition, compared with international studies, the developed simulator realized independent control of the color temperature information of each star in the stellar map, and the spectral type simulation covered all 70 stellar spectral types of the HSC. The study findings provide a simulation method for the attitude determination algorithm using multi-dimensional information carried by the star sensor and establish a research basis for advancing the fields of remote sensing technology and spectral navigation.
In the future, using devices [40] with better performance can be further investigated to overcome the limitation of stellar spectral-type simulation accuracy. The cosmic radiation background can be increased, and the playback speed of the stellar map can be improved to make them closer to the actual stellar map of outer space. Color stellar map simulation technology provides strong technical support for the accuracy, reliability and adaptability of remote sensing technology by optimizing the performance of remote sensing equipment, supporting the calibration of radiation characteristics of remote sensing data and target recognition in complex environments. The innovative application of this technology not only promotes the development of remote sensing field, but also shows broad application prospects.
Author Contributions
Conceptualization, Yu Zhang and Jian Zhang; methodology, Bin Zhao and Dongpeng Yang; software, Bin Zhao, Zhipeng Wei; validation, Taiyang Ren; formal analysis, Dianwu Ren; investigation, Yu Zhang; resources, Jian Zhang, Jingrui Sun; data curation, Jingrui Sun; writing—original draft preparation, Yu Zhang; writing—review and editing, Yu Zhang, Bin Zhao and Jian Zhang; visualization, Ke Zhang; supervision, Junjie Yang; project administration, Junjie Yang; funding acquisition, Songzhou Yang, Jian Zhang All authors have read and agreed to the published version of the manuscript.
Funding
This work was supported by and Technology Development Program of Jilin Province (YDZJ202501ZYTS583), the National Natural Science Foundation of China (62305031), the Jilin Province Science Research Project of the Education Department (JJKH20250493KJ).
Data availability
The data underlying the results presented in this paper are not publicly available at this time but can be obtained from the authors upon reasonable request.
Conflicts of Interest
The authors declare no conflicts of interest.
References
- W. Zhang, Y. Yang, W. You, Autonomous navigation method and technology implementation of high-precision solar spectral velocity measurement, Sci. China Phys. Mech. Astron. 2022, 65 8, 289606. [CrossRef]
- Z. Wang, S. Liu, H. Sun, The influence of color temperature mismatch in star simulator on positioning accuracy and magnitude measurement by star sensor, J. Phys. Conf. Ser. 2021, 1, 2132. [CrossRef]
- A. Chaudhary, B. Thapa, T. Sodari, Distribution of Dust Color Temperature, Planck’s Function, and Dust Mass around PSR J1240-4124. J. Nepal Phys. Soc. 2022, 8 1 88–95. [CrossRef]
- S. Huang, Z. Kang, J. Liu, Accuracy analysis of spectral velocimetry for the solar Doppler difference navigation, IEEE Access. 2021, 9 78075–78082. 10.1109/ACCESS.2021.3079500.
- 5. W Zhou, Z Liu, Y Sun, Bidirectional Littrow double grating interferometry for quadruple optical interpolation, Optics and Laser Technology. 2024, 110751 175. [CrossRef]
- Y. Niu, X. Wei, J. Li, Fast and robust star identification using color ratio information, IEEE Sens. 2022, J 22 21, 20401–20412. [CrossRef]
- W. Zhang, Astronomical spectral velocimetry navigation technology and application considerations, Navig. Control. 2020 19 Z1 64–73.
- L. Wu, G. Zhang, G. Sun, Optical engine optimization for faint starlight simulation systems, Opt. Commun. 2020, 471 125833. [CrossRef]
- V. H. Schulz, G. M. Marcelino, L. O. Seman, Universal verification platform and star simulator for fast star tracker design, Sensors (Basel, Switzerland). 2021, 21 3 907. [CrossRef]
- S. Teague and J. Chahl, Imagery synthesis for drone celestial navigation simulation, Drones. 2022, 6 8. [CrossRef]
- N. Trivellin, D. Barbisan, M. Ferretti, Adaptive multi-wavelength LED star simulator for space life studies, Proc. SPIE. 2016, 9768 976815. [CrossRef]
- J. L. Jing, G. Y. Z. Guoyu, J. Z. Jian, Spectral simulation method for calibration light source of transmissometers, Acta Opt. Sin. 2022, 42 6 123–135 . 10.3788/AOS202242.0601005.
- Q. Liu, G. Zhang, Y. Zhang, Multi-color temperature and magnitude simulation for astronomical spectral velocity measurement, IEEE Access. 2023, 11 108104-108116 . [CrossRef]
- Z. Yun, Y. Zhang, Q. Liu, Research on the simulation method of a BP neural network PID control for stellar spectrum, Opt. Express. 2024, 32 22 38879–38895. [CrossRef]
- B. Zhao, Y. Zhang, D. Yang, Playback method for dynamic star map simulation by fusing cosmic background radiation information, Measurement. 2025, 116086 242. [CrossRef]
- S. Yang, Y. Zhang, B. Zhao, Simulation method for multi-source information fusion space target, Opt. Express. 2024, 32 12 21820–21836. [CrossRef]
- Y. Bai, J. Li, R. Zha, Catadioptric optical system design of 15-magnitude star sensor with large entrance pupil diameter, Sensors (Basel, Switzerland). 2020, 20 19 5501. [CrossRef]
- T Hong, J Li, D Chu, Modulation approach of arbitrary linear polarization states of optical fields using single-beam coding for next-generation optical storage in glass, Optics and Laser Technology. 2023, 164. [CrossRef]
- Z. Du, G. Sun, S. Yang, Research on ultraviolet-visible composite optical target simulation technology, Opt. Express 2024 32 8 14541–14554. [CrossRef]
- Ma, M.; Niu, Y.; Gao, D.; Li, F.; Shi, G. Efficient Hyperspectral Video Reconstruction via Dual-Channel DMD Encoding. Remote Sens. 2025, 17, 190. [CrossRef]
- S. Liu, J. Zhang, Y. Zhang, Overall study of solar simulation optical system with large irradiated surface using free-form concentrator to improve uniformity, iScience. 2023, 26 10, 107781. [CrossRef]
- L. Wu, J. Wang, L. Sheng, Research on polarization effect suppression method of weak starlight simulation device,” Opt. Express. 2024, 32 22 39818–39830. [CrossRef]
- X. Gao, X. Gan, Y. Chen, Study of digital high-precision multi-star simulator for multi-magnitude output, IJCA. 2016, 9 9 255–264. [CrossRef]
- Q. Xu, C. Zhao, and X. Li, Stellar radiation modeling and image simulation for airborne daytime star sensor, in IEEE International Conference on Signal and Image Processing (ICSIP). 2016. [CrossRef]
- K. Saurova, A. Shamro, K. Alipbayev, Research of methods to improve the accuracy of the star sensor for global navigation satellite system technology, Engineered Sci. 2024, 33, 1351. [CrossRef]
- R. A. Bell and B. Gustafsson, The effective temperatures and colours of G and K stars, Mon. Not. R. Astron. Soc. 1989, 236 3 653–707. [CrossRef]
- M. C. Catalbas and M. Bernard Kobav, Measurement of correlated color temperature from RGB images by deep regression model, Measurement. 2022, 195 111053. [CrossRef]
- D. Han, M. Lee, W. Jang, Two-color strip-patterned white OLEDs: Tunable color-temperature via pattern dimension control, Adv. Opt. Mater. 2022, 10 16 2200456. [CrossRef]
- H. J. Tian, T. Chen, Y. Hu, Change of circadian effect with colour temperature and eye spectral transmittance at different ages, Lighting Res. Technol. 2021, 53 1, 41–53. [CrossRef]
- Chaity, M.D.; van Aardt, J. Exploring the Limits of Species Identification via a Convolutional Neural Network in a Complex Forest Scene through Simulated Imaging Spectroscopy. Remote Sens. 2024, 16, 498. [CrossRef]
- J. V. Harre and R. Heller, Digital color codes of stars, Astron. Nachr. 2021, 342 3, 578–587. [CrossRef]
- A. Bateni, S. S. Susnar, A. Amirfazli, A high-accuracy polynomial fitting approach to determine contact angles, Colloids Surf. A Physicochem. Eng. Aspects. 2003, 219 1–3 215–231. [CrossRef]
- E. G. Vicente, B. M. Matesanz, M. Rodríguez-Rosa, Effect of correlated color temperature and S/P-ratio of LED light sources on reaction time in off-axis vision and mesopic lighting levels, LEUKOS. 2023, 19 1 4–15. [CrossRef]
- J. A. Burrow, R. Jakachira, G. Lemaster, Smartphone tristimulus colorimetry for skin-tone analysis at common pulse oximetry anatomical sites, arXiv Preprint ArXiv: 2024 2411.13832. [CrossRef]
- S. Y. Kahu, R. B. Raut, and K. M. Bhurchandi, Review and evaluation of color spaces for image/video compression, Color Res. Appl. 2019 44 1 8–33. [CrossRef]
- L. Galteri, C. Ferrari, S. Kollias, Color and texture analysis of textiles using image acquisition and spectral analysis in calibrated sphere imaging system-I, Electronics. 2022, 11 23, 3887. [CrossRef]
- H. Bian, A. Li, H. Ma, R. Wang, Navigation coordinate system, in Essentials of Navigation: A Guide for Marine Navigation (Springer Nature, Singapore). 2024, pp. 19–50. [CrossRef]
- Yuan, H.; Li, D.; Wang, J. A Robust Star Identification Algorithm Based on a Masked Distance Map. Remote Sens. 2022, 14, 4699. [CrossRef]
- H. Yi and G. Yan, Preliminary research on color simulation of stars in a star simulator, Opto-Elec Eng. 2010, 37 8 65–73. [CrossRef]
- J Zhang, S Yu, Y Wang, Research on manufacturing technology of nanoimprinted grating, Journal of Manufacturing Processes. 2024, 131, 891–909. [CrossRef]
Figure 1.
Architecture and algorithmic links for simulating stellar maps with color temperature information.
Figure 1.
Architecture and algorithmic links for simulating stellar maps with color temperature information.
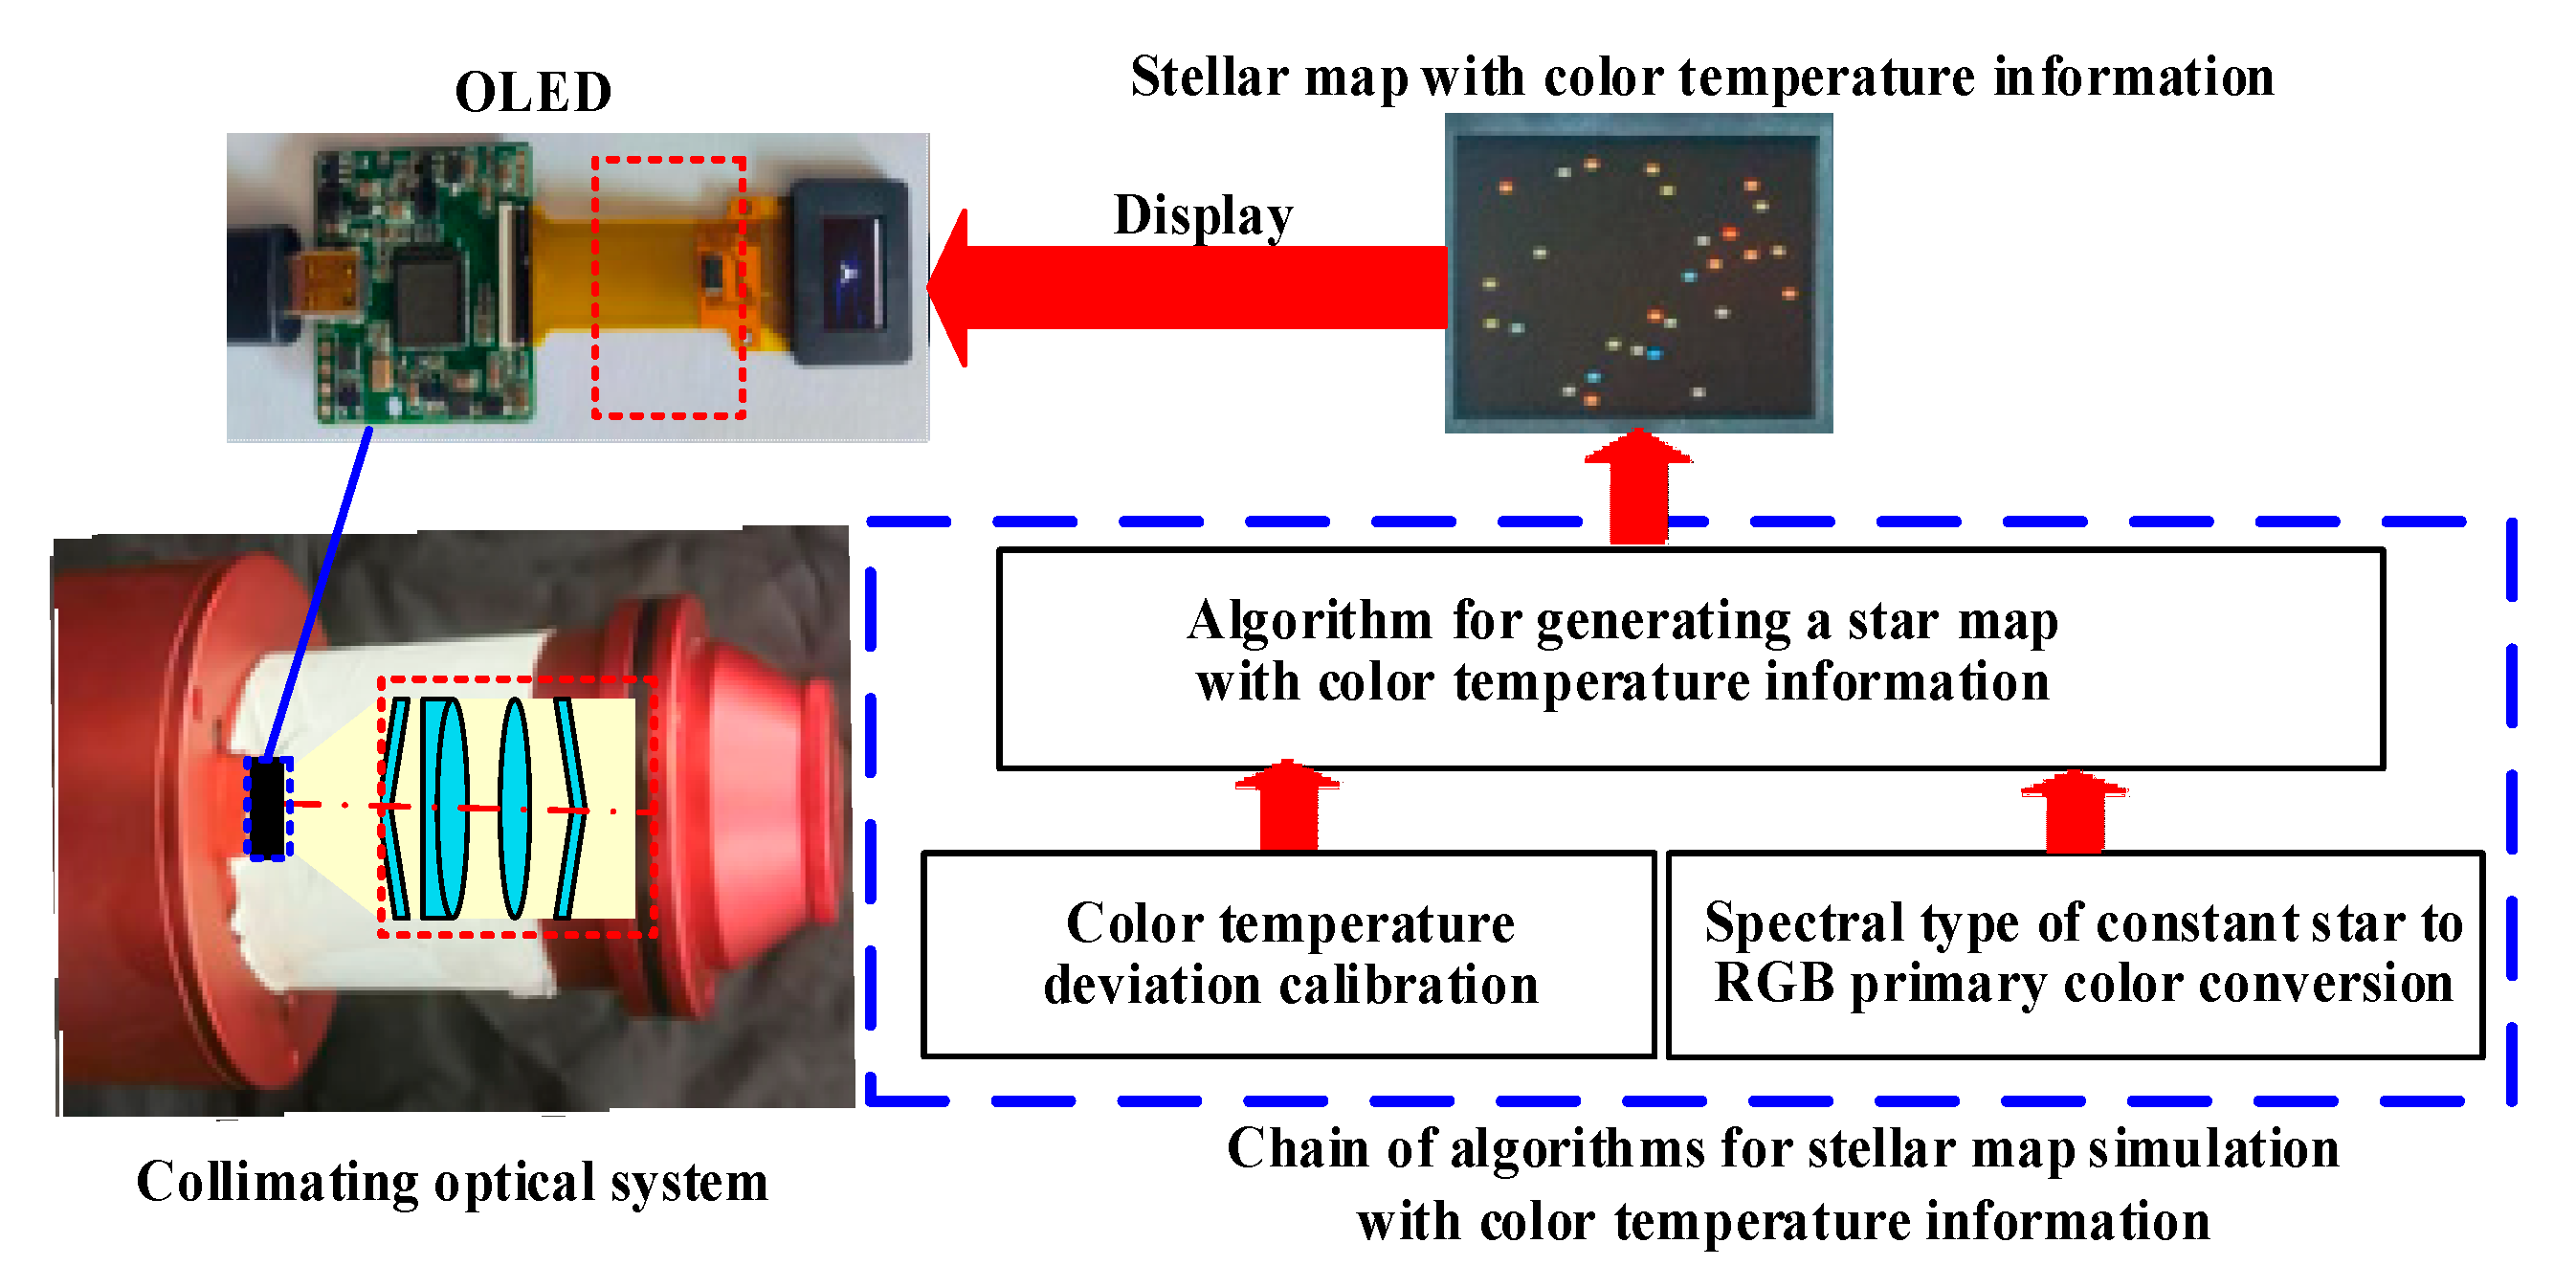
Figure 2.
Algorithm flow of stellar nap simulation with color temperature information.
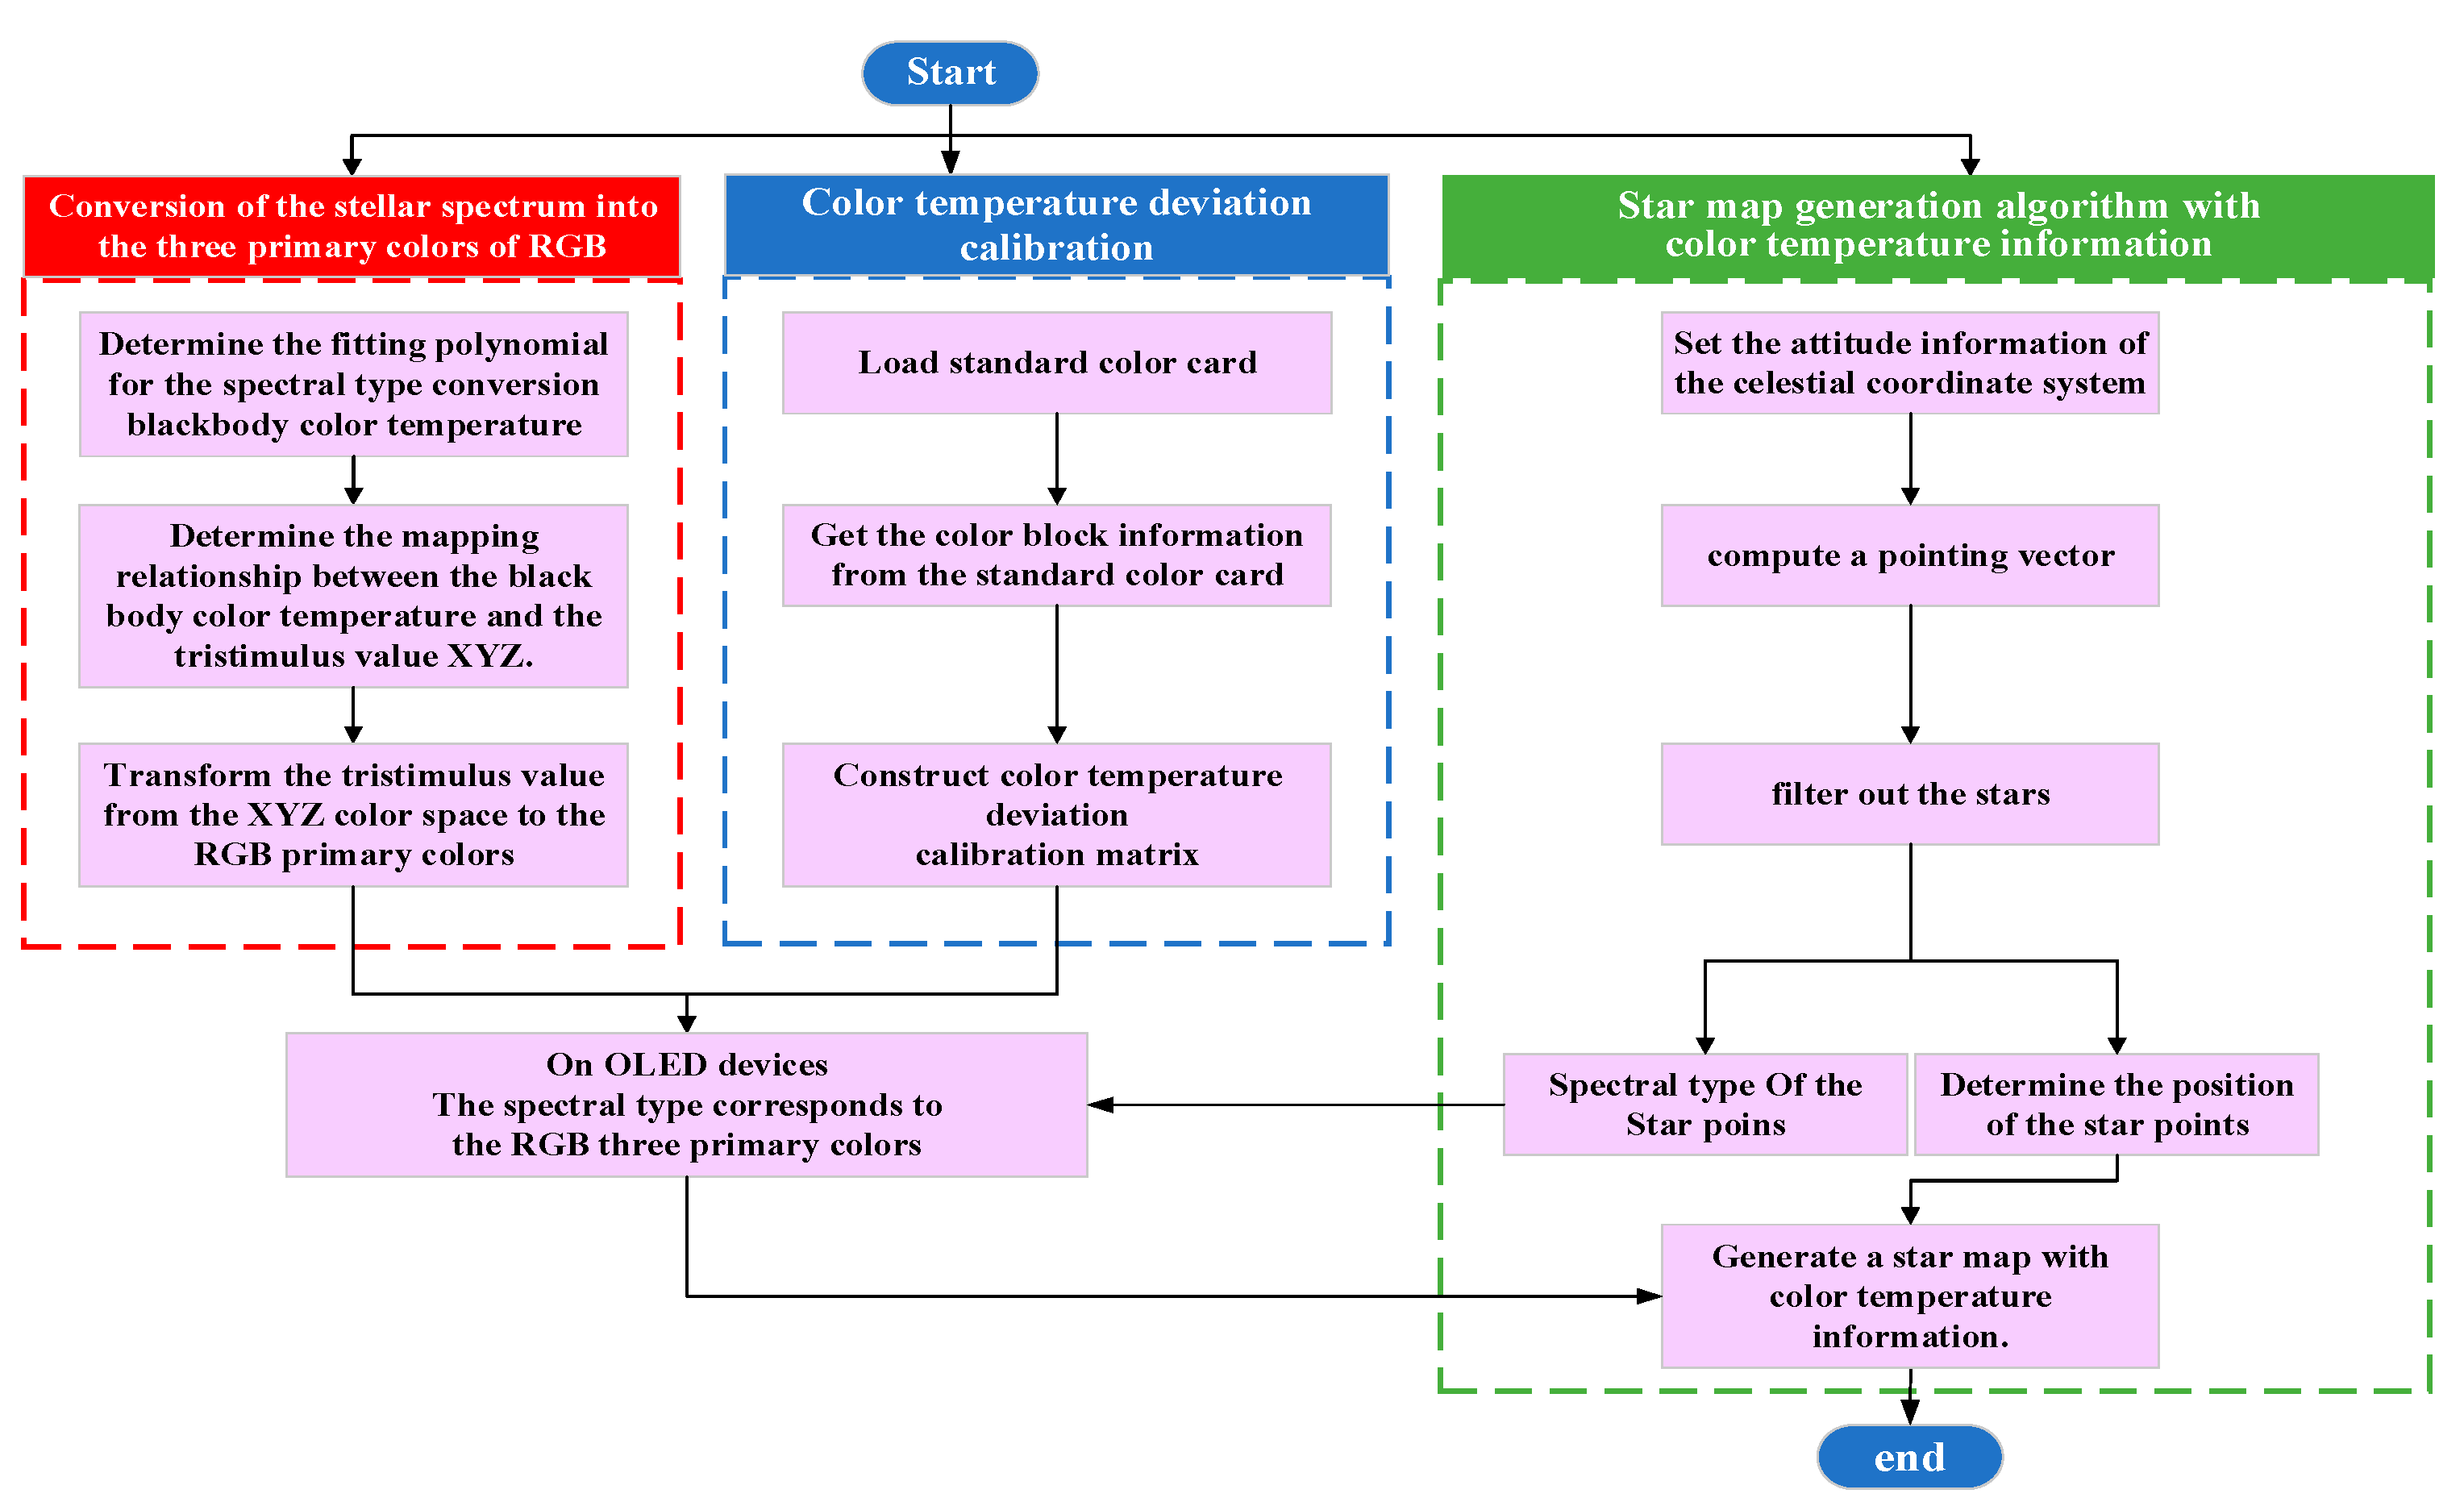
Figure 3.
Experimental platform for semi-physical simulation of stellar map with color temperature information.
Figure 3.
Experimental platform for semi-physical simulation of stellar map with color temperature information.
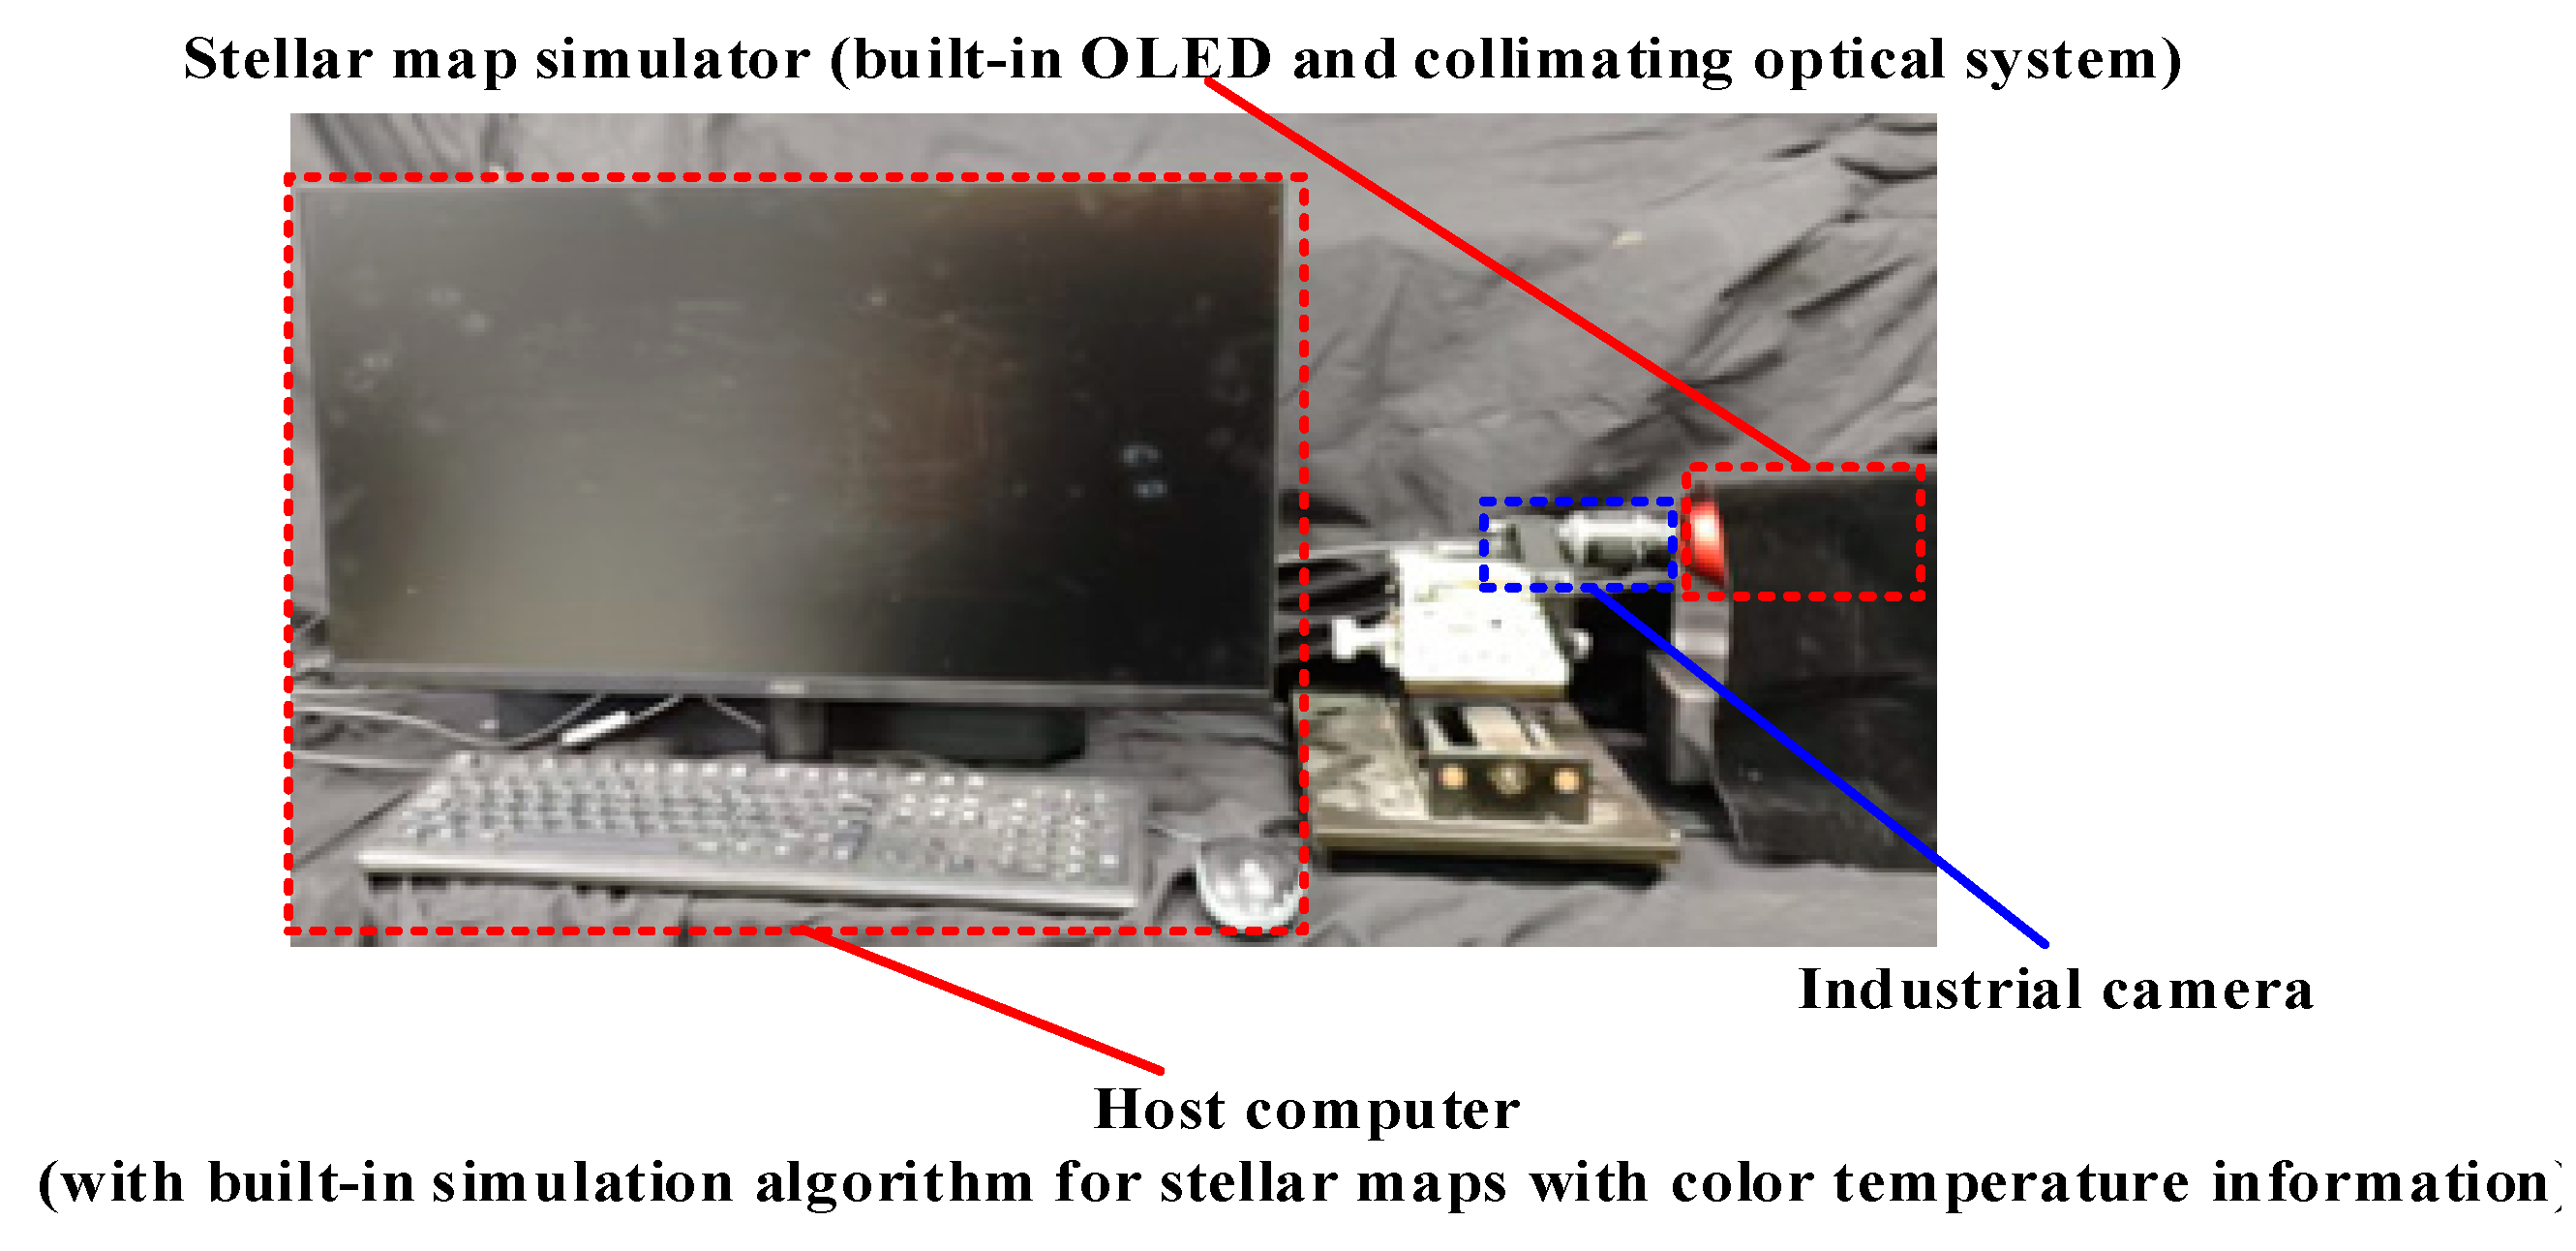
Figure 4.
Number of polynomials versus fitted correlation coefficient.
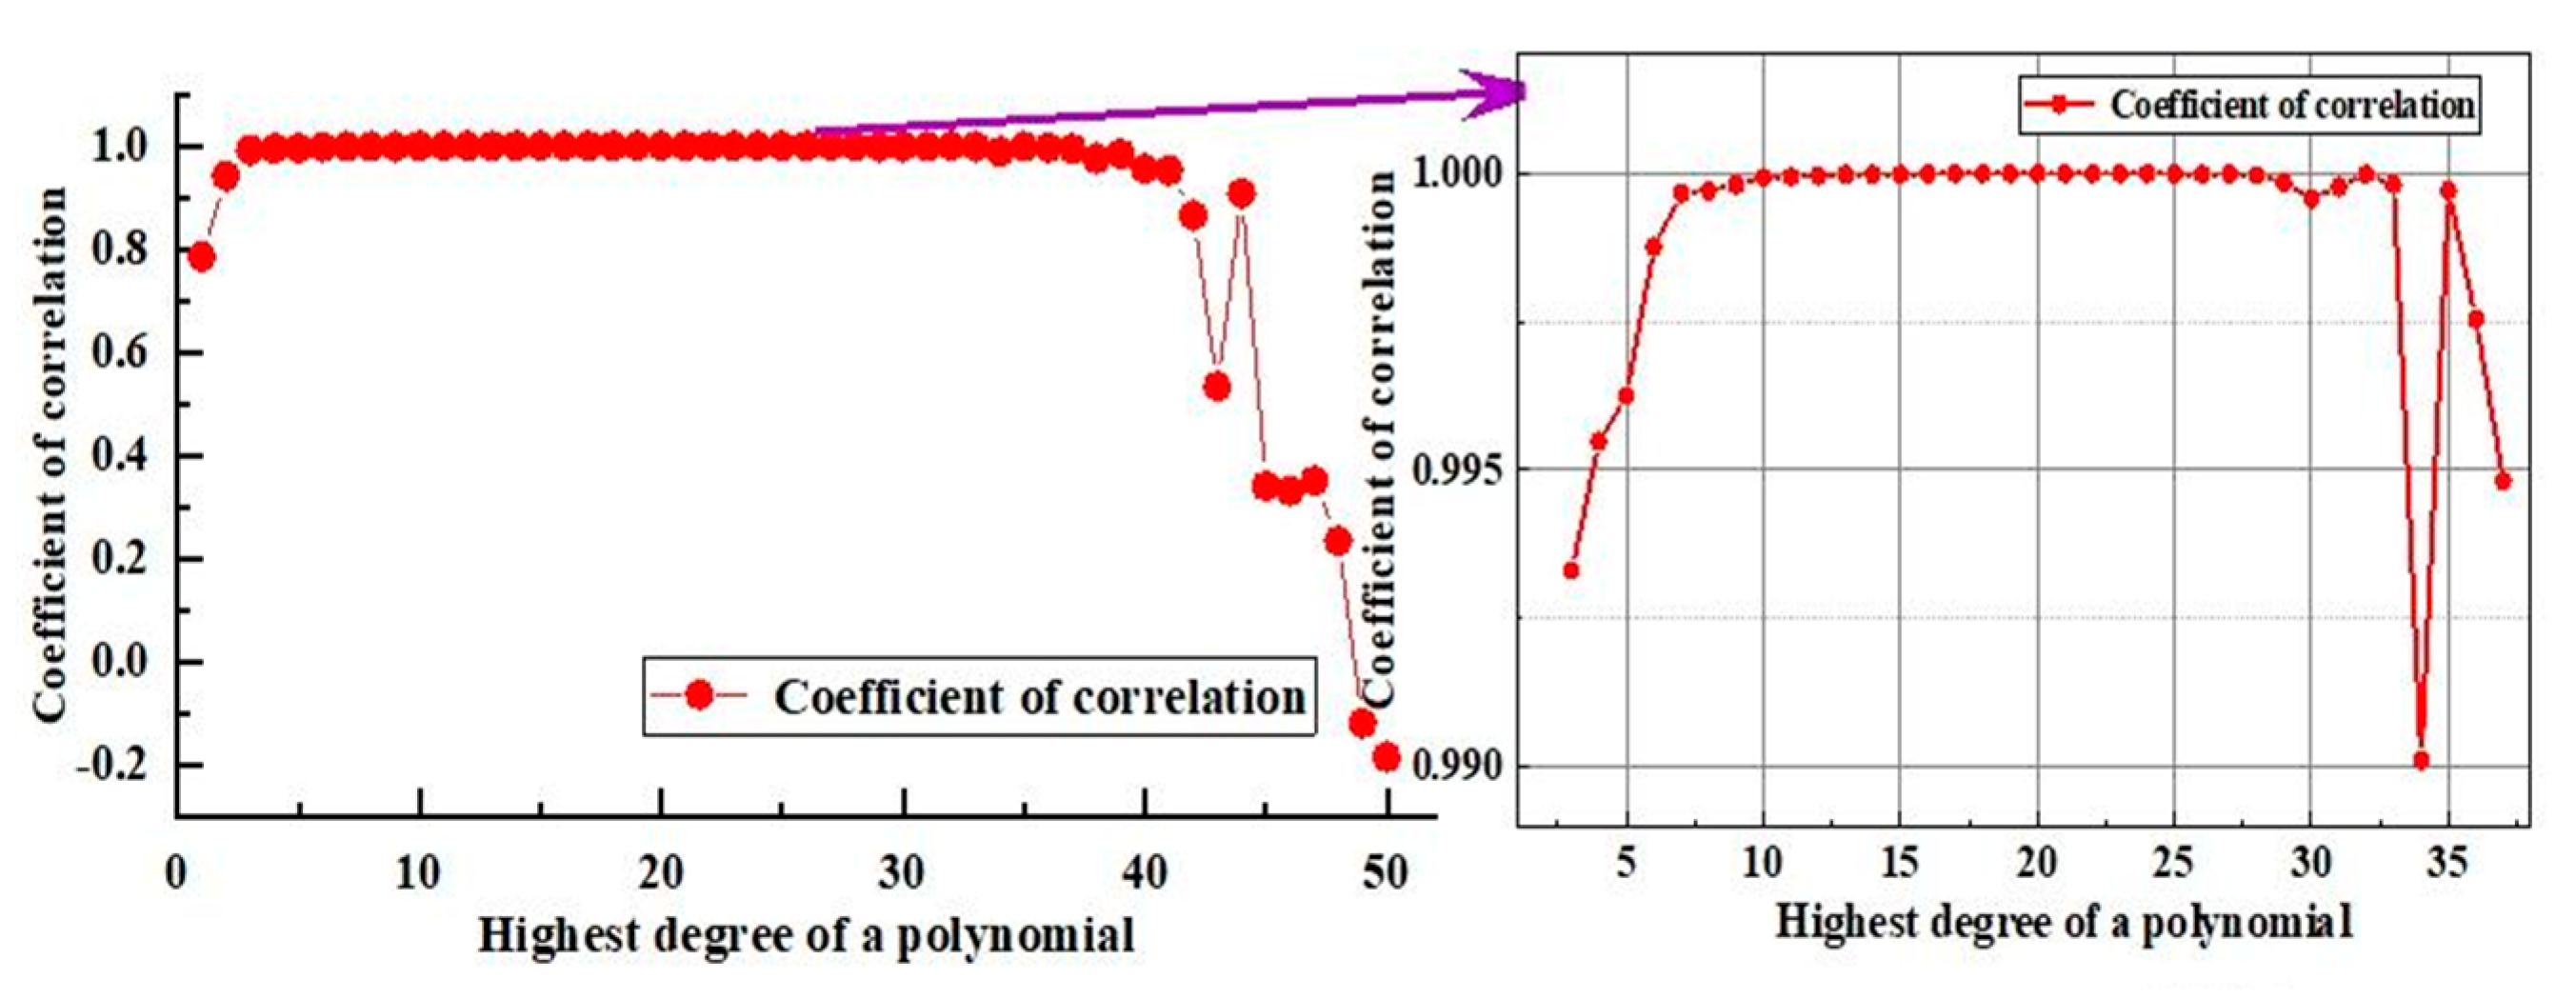
Figure 5.
Stellar spectral type and RGB three-color scale relationship.
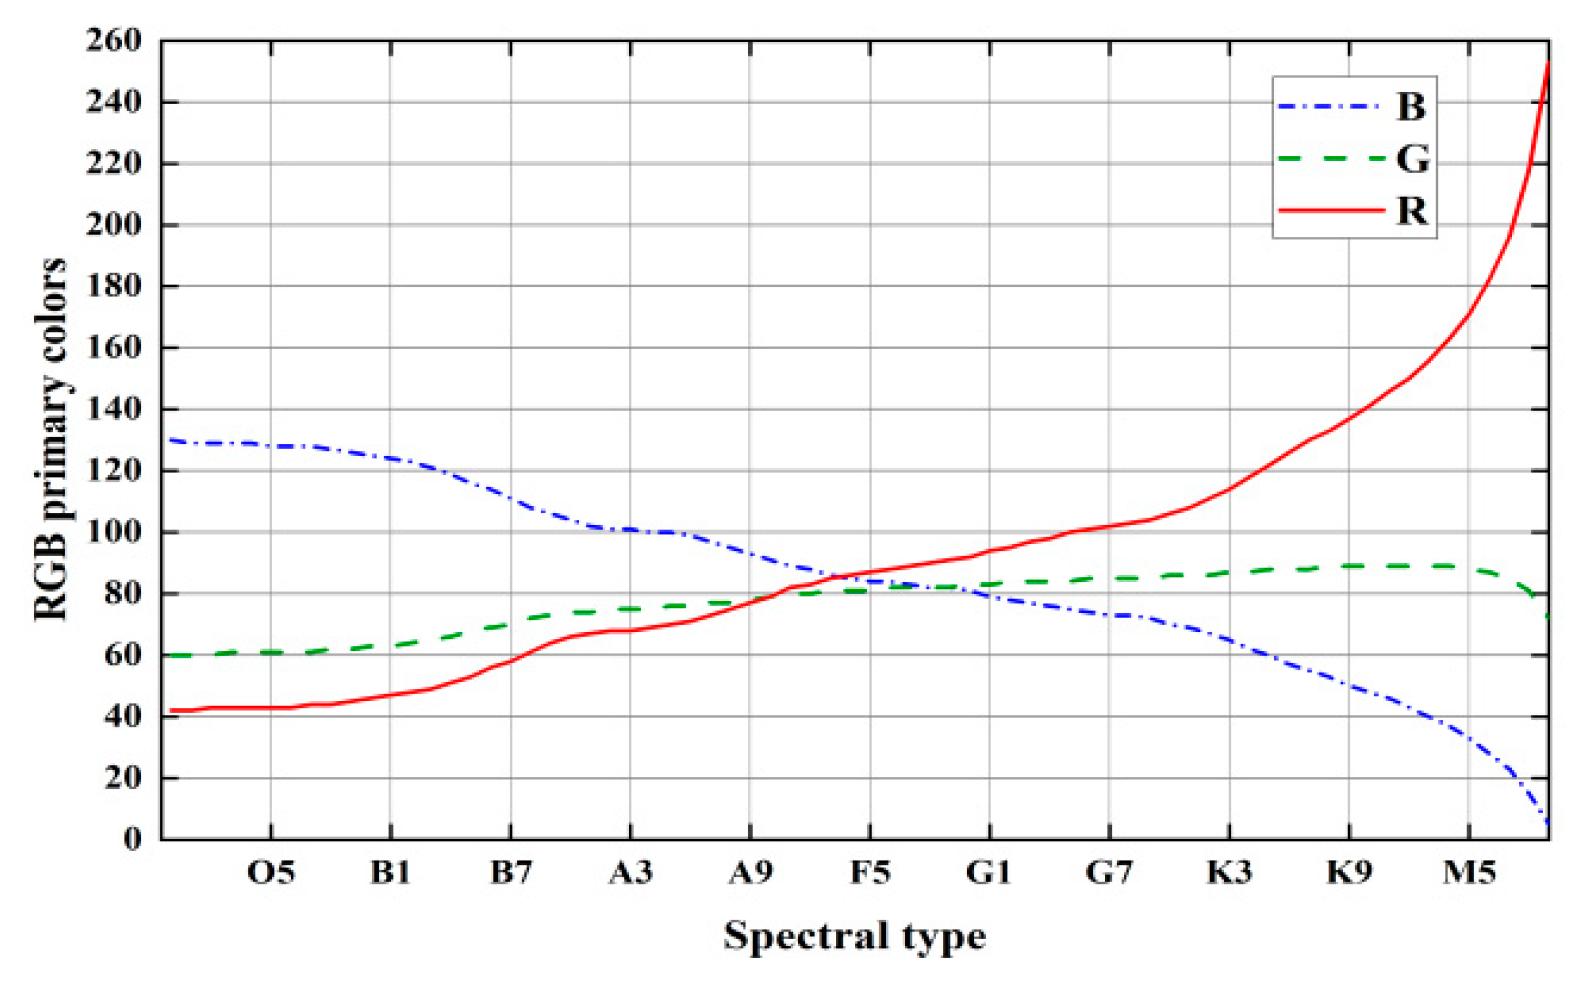
Figure 6.
Color temperature deviation calibration results. (a) Stellar maps after color temperature deviation calibration. (b) Image and corresponding RGB three-color heat map. (c) Color difference between the 24 standard colors before and after calibration.
Figure 6.
Color temperature deviation calibration results. (a) Stellar maps after color temperature deviation calibration. (b) Image and corresponding RGB three-color heat map. (c) Color difference between the 24 standard colors before and after calibration.
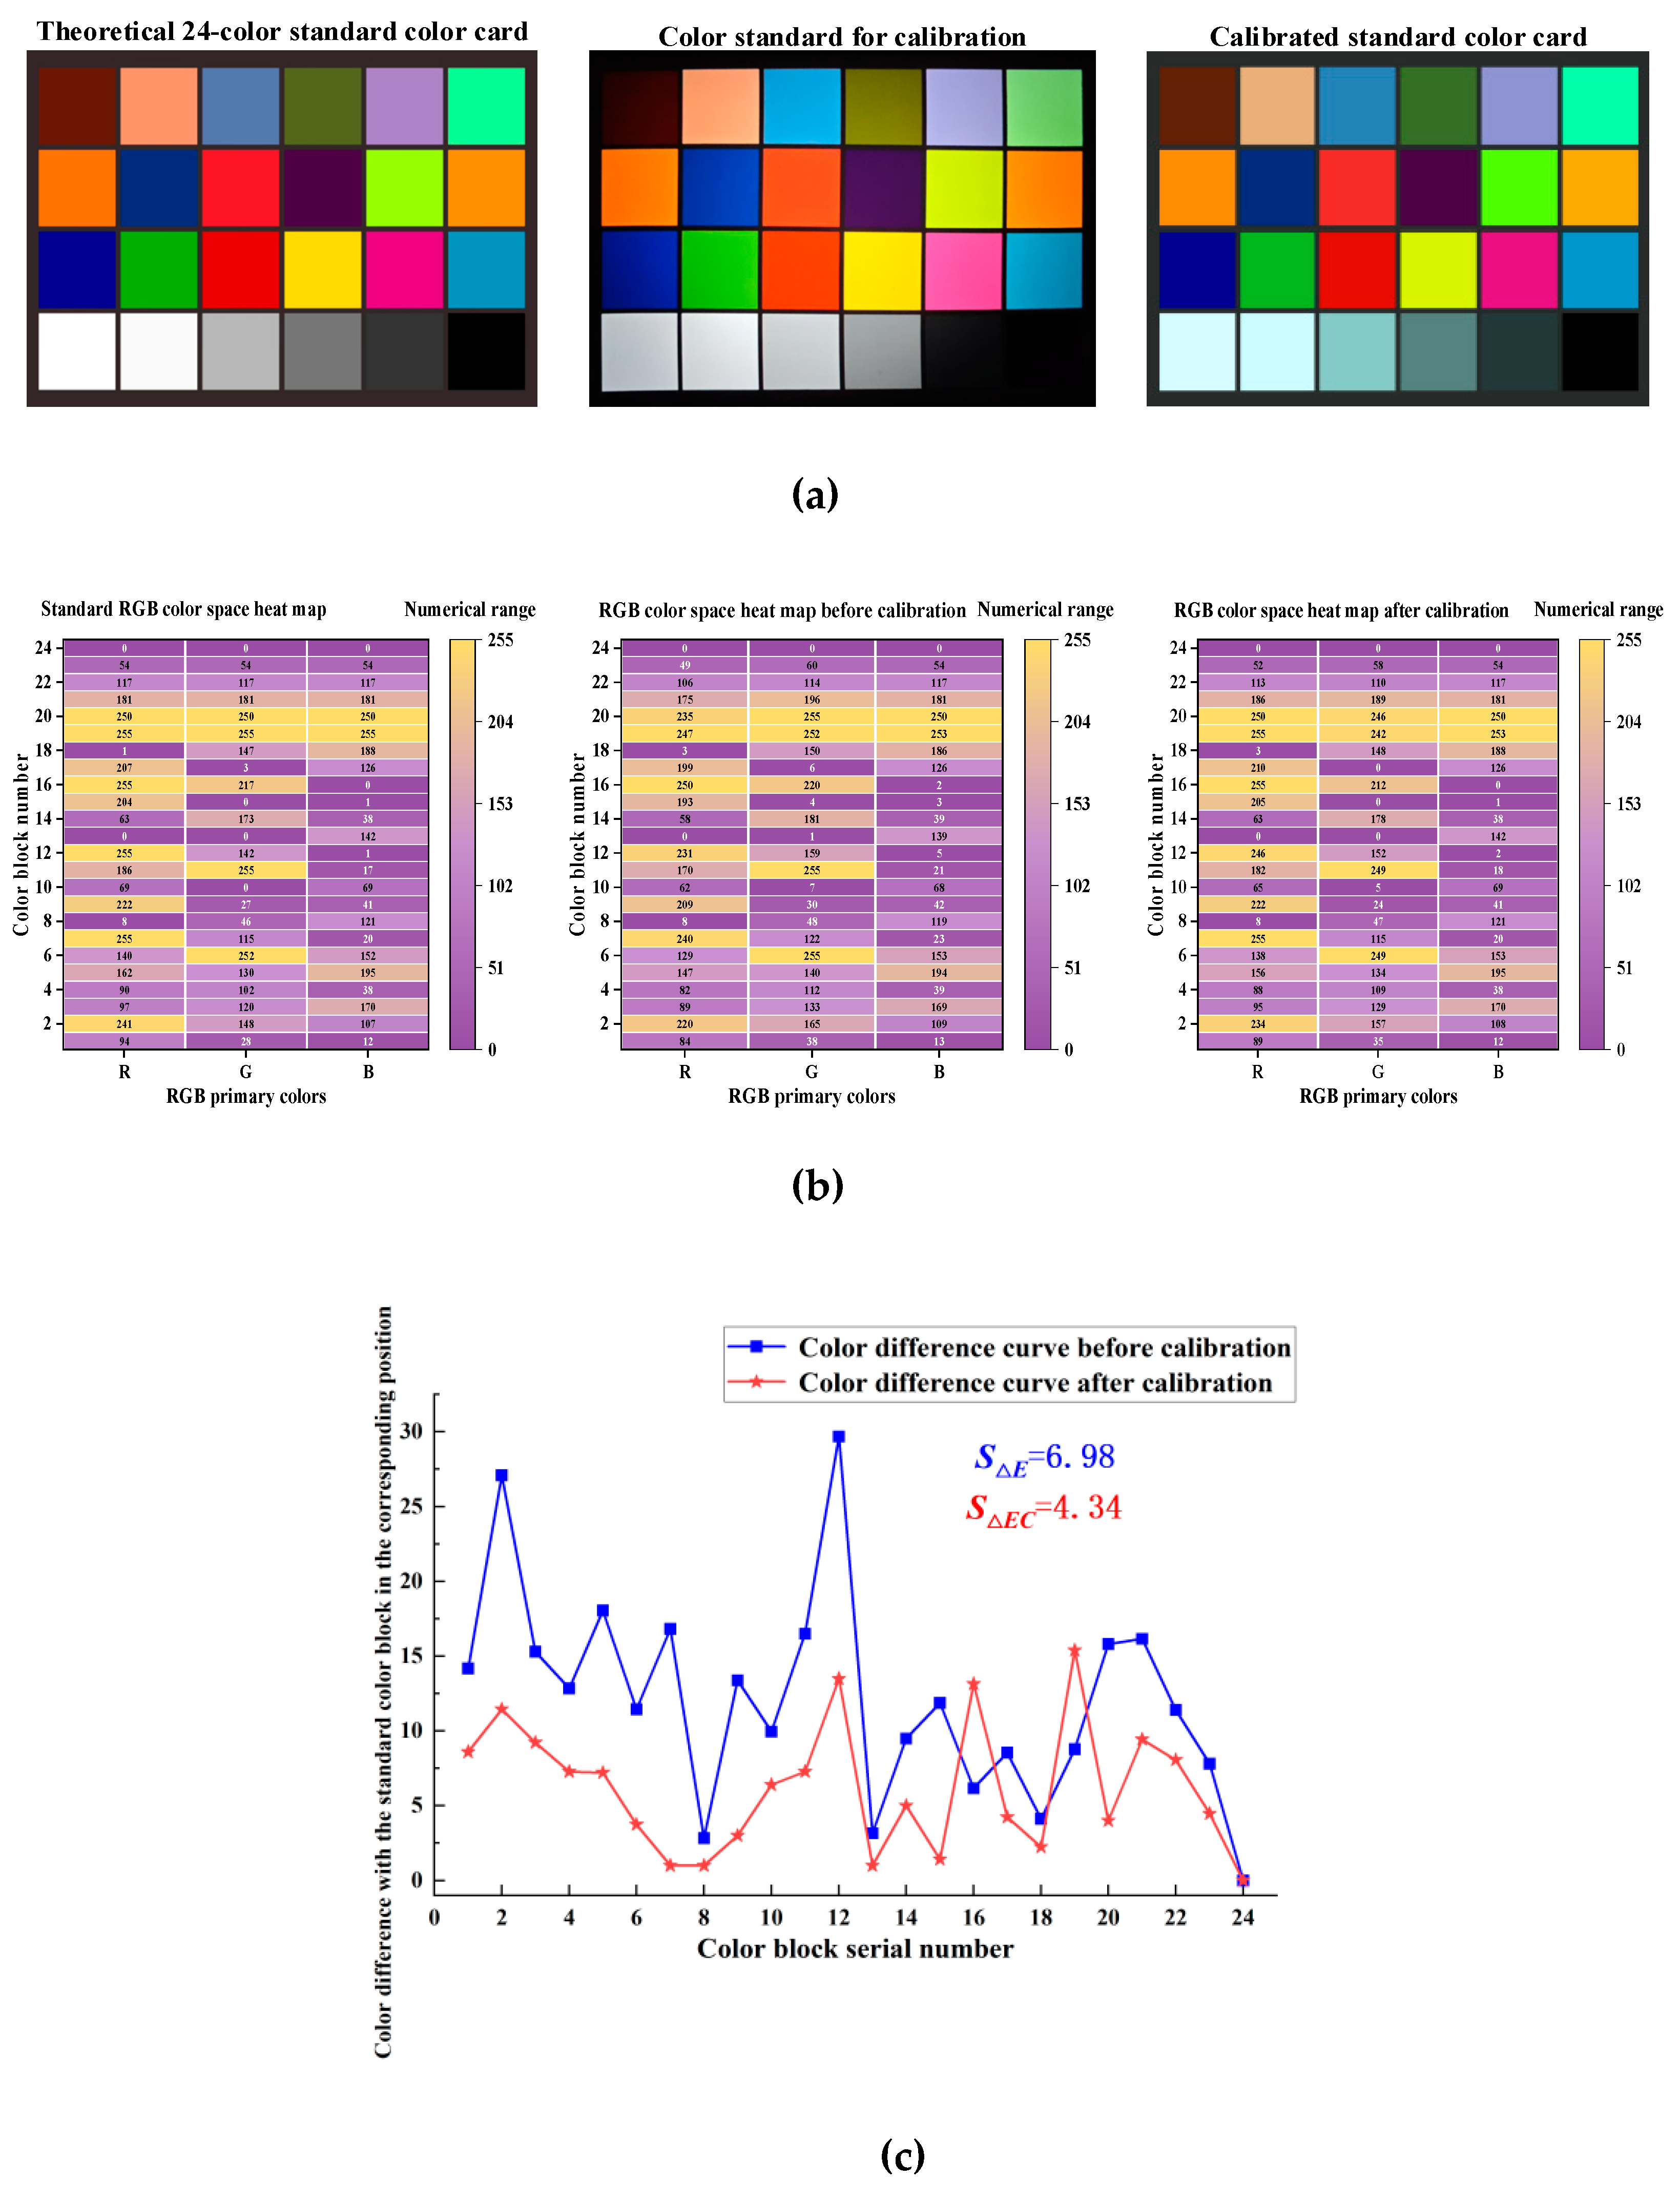
Figure 7.
Theory of stellar maps with color temperature information.
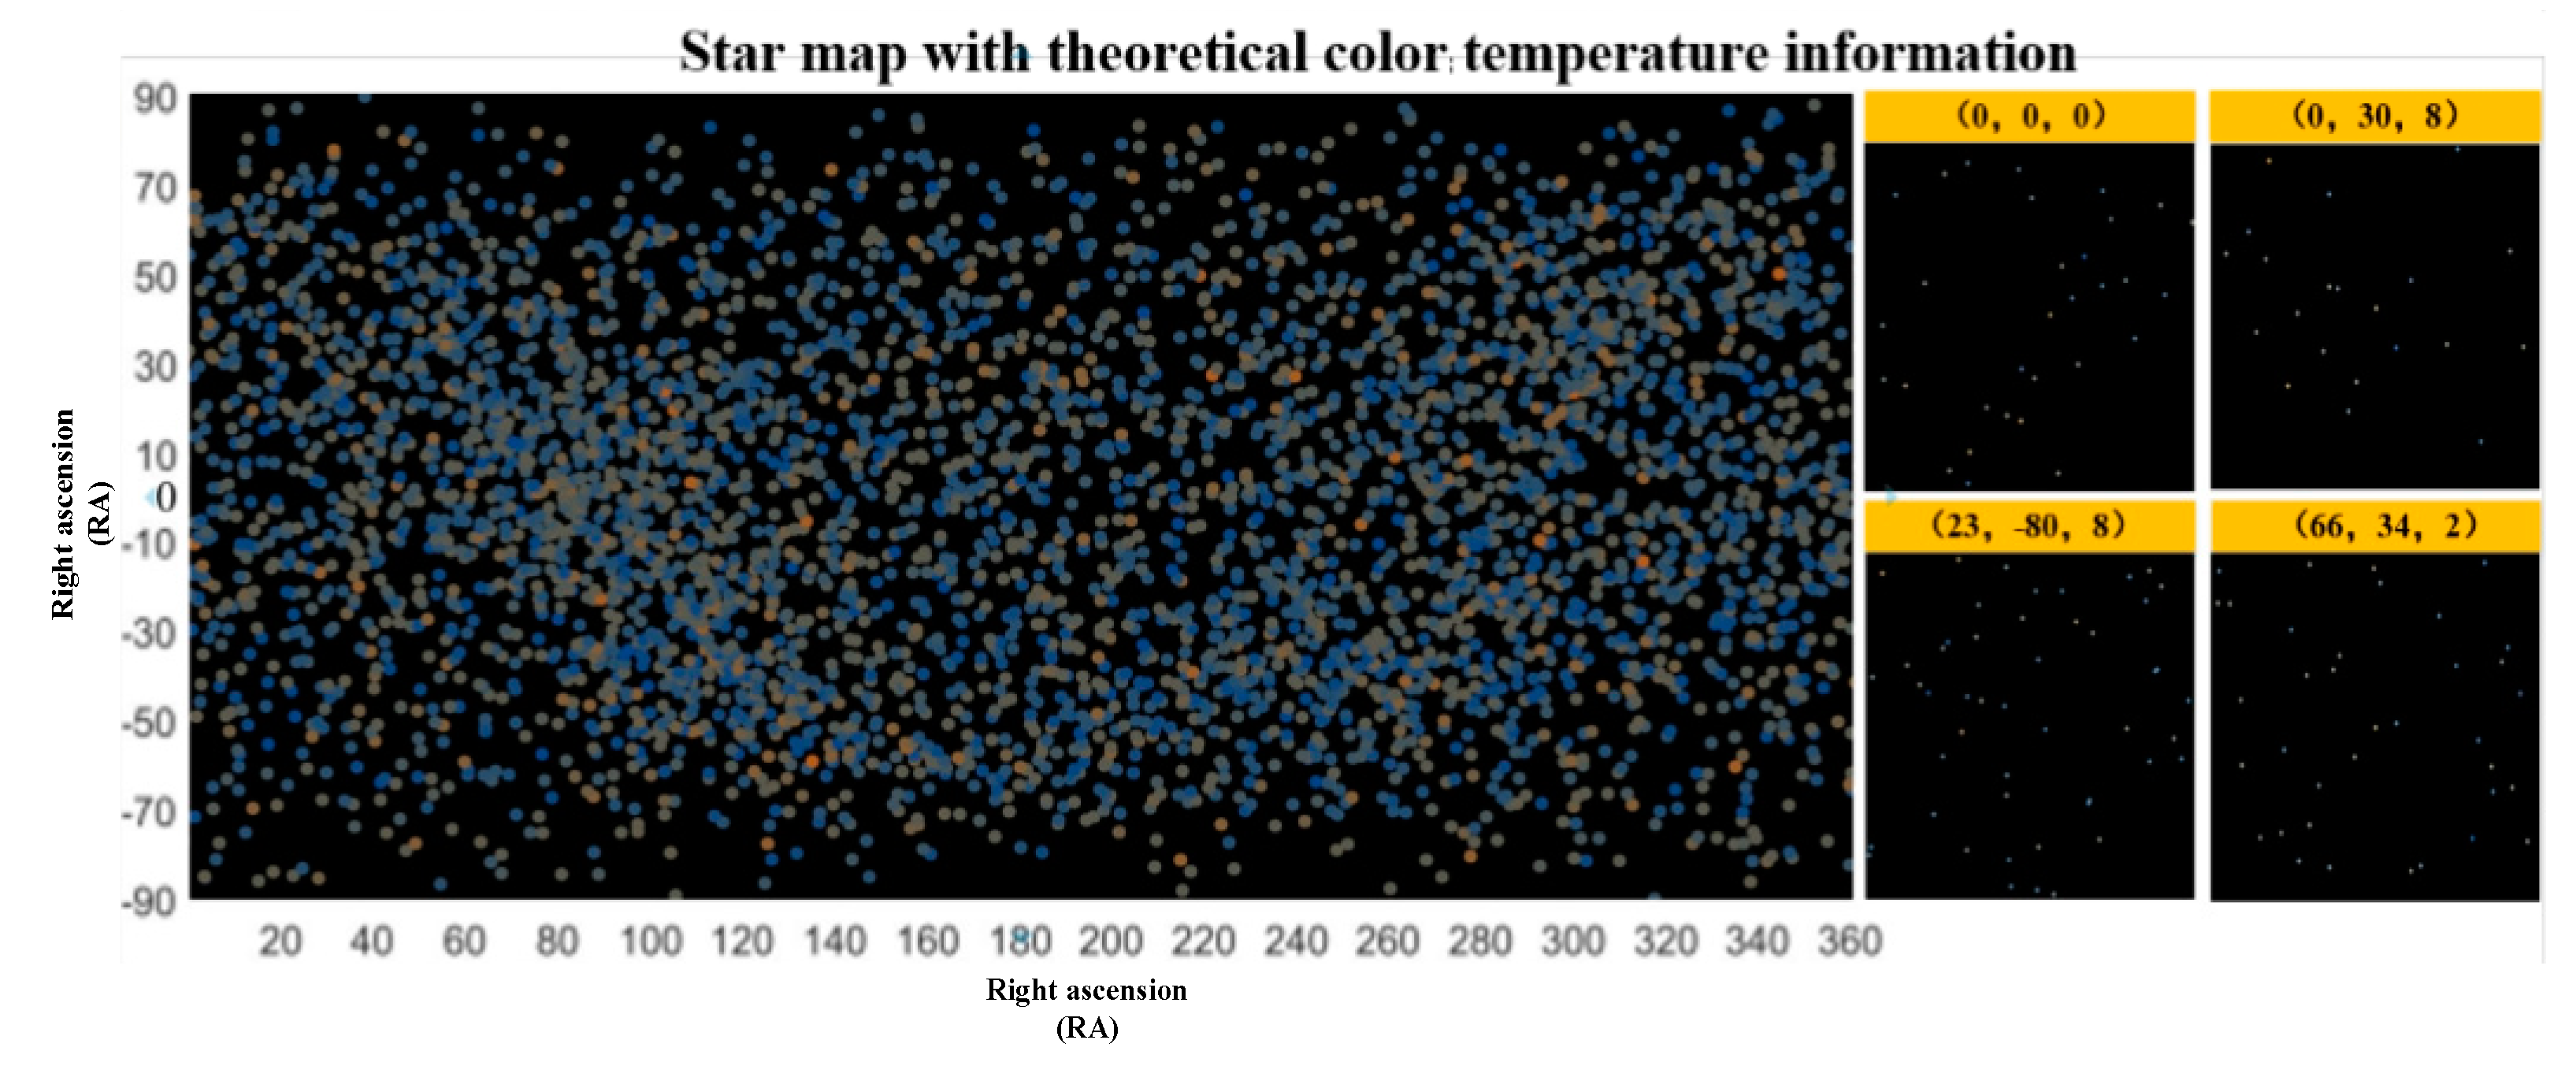
Figure 8.
Simulation effect of the semi-physical simulation method of stellar maps with color temperature information. (a) Stellar maps after color temperature deviation calibration, (b) Stellar maps after color temperature deviation calibration.
Figure 8.
Simulation effect of the semi-physical simulation method of stellar maps with color temperature information. (a) Stellar maps after color temperature deviation calibration, (b) Stellar maps after color temperature deviation calibration.
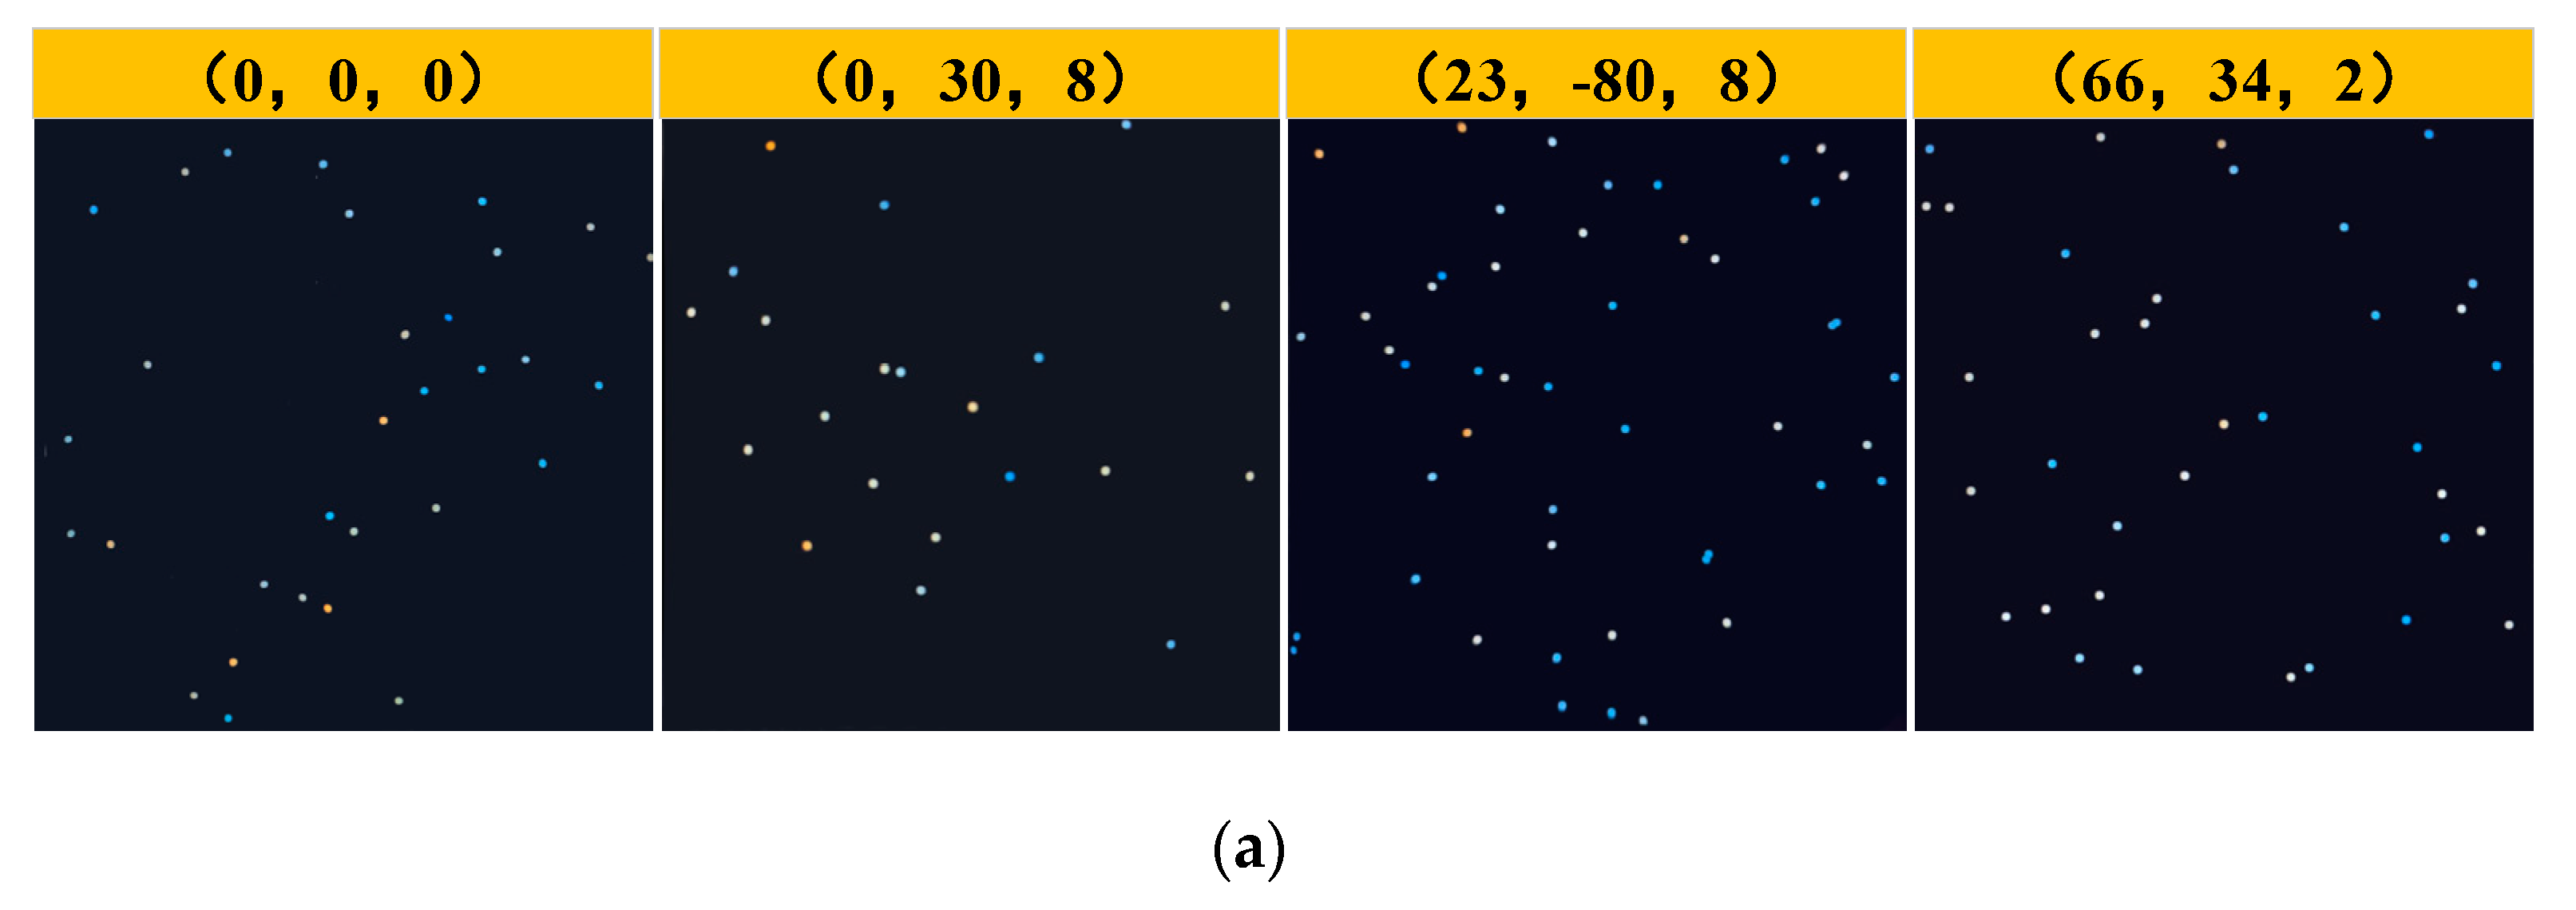
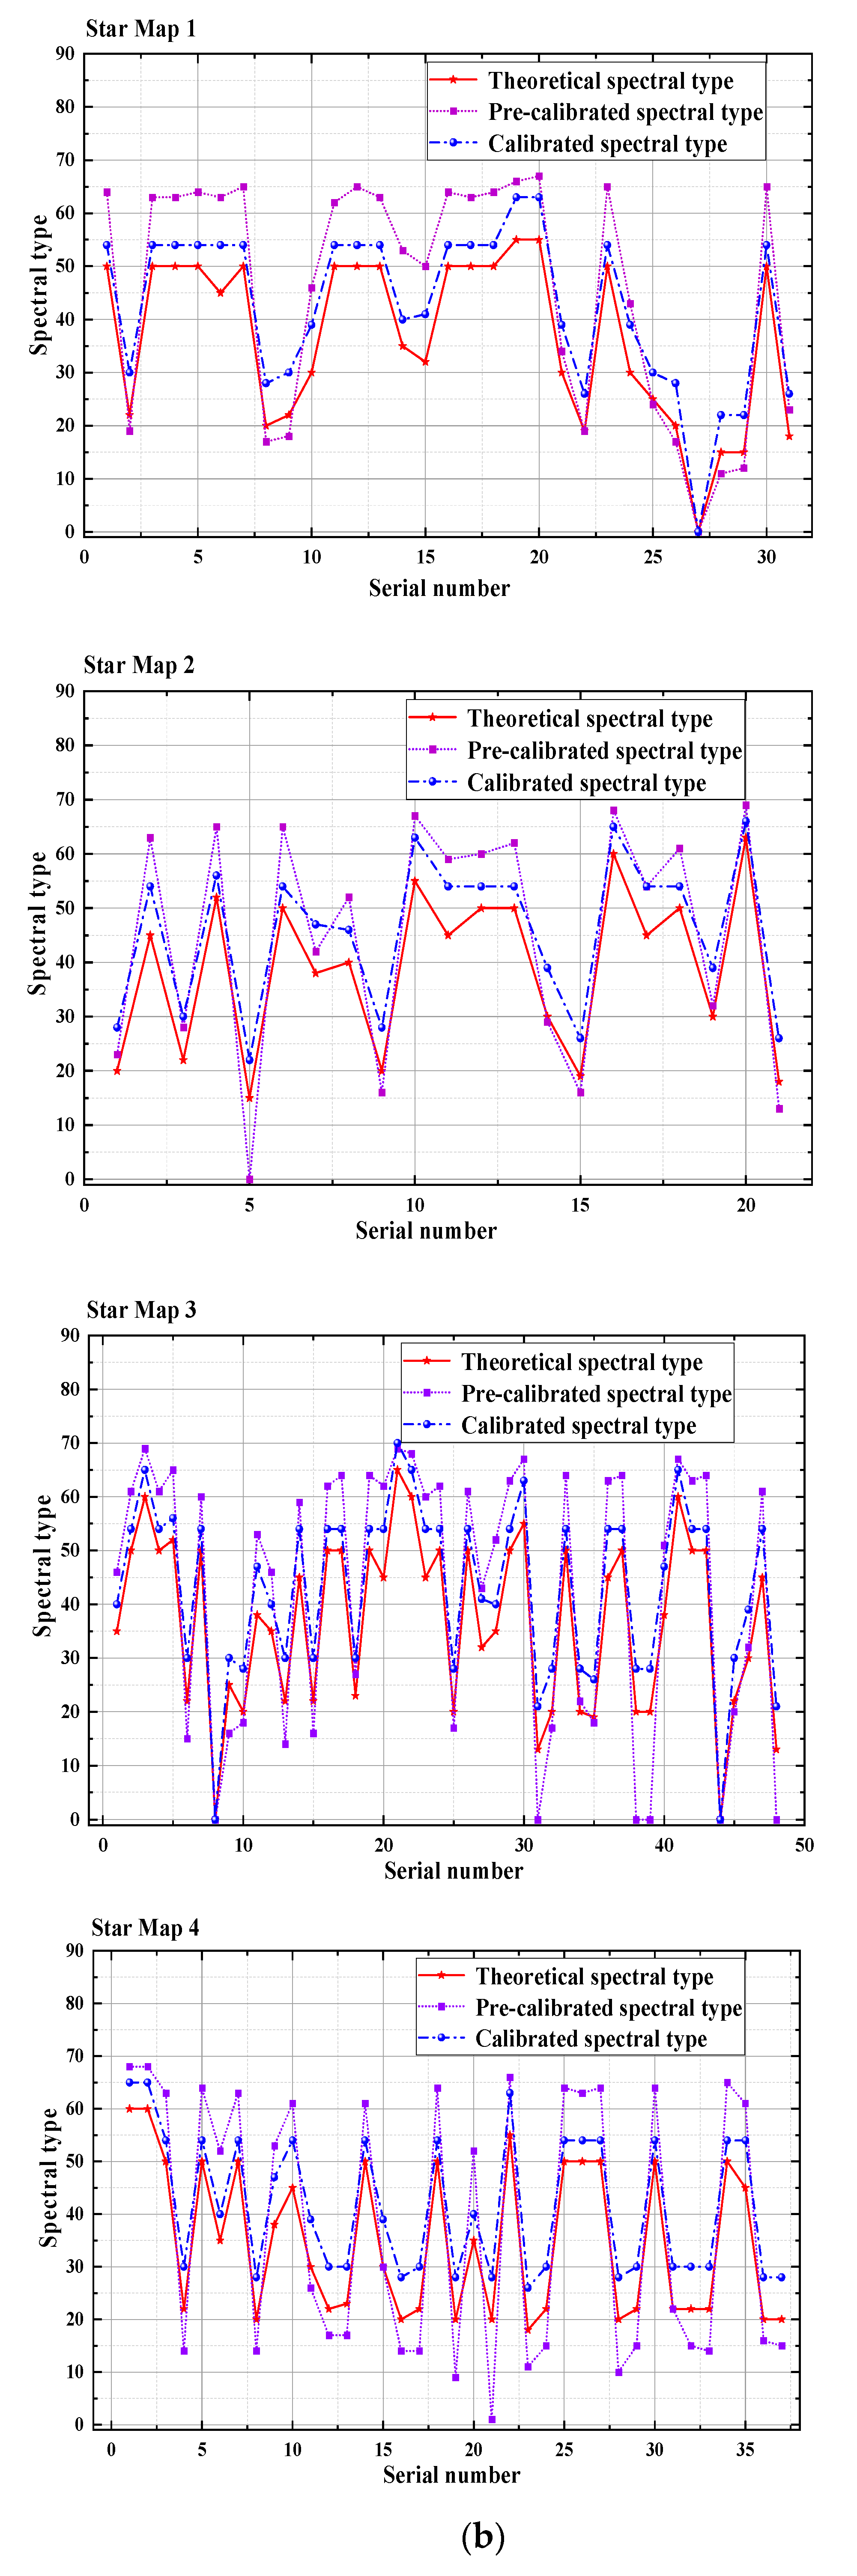

Table 1.
Rules for coding stellar spectral types.
| Main spectral types | Encodings | Secondary spectral type | Encodings |
|---|---|---|---|
| TypO | 0 | Typ0 | 0 |
| TypB | 1 | Typ1 | 1 |
| TypA | 2 | Typ2 | 2 |
| TypF | 3 | Typ3 | 3 |
| TypG | 4 | Typ4 | 4 |
| TypK | 5 | Typ5 | 5 |
| TypM | 6 | Typ6 | 6 |
| - | - | Typ7 | 7 |
| - | - | Typ8 | 8 |
| - | - | Typ9 | 9 |
Table 2.
Experimental phases, names, and objectives.
| Point | Name | Goal |
|---|---|---|
| Pre-experiment | Stellar spectral type to RGB triple-color conversion | The relationship between stellar spectral type and RGB triple-base color conversion is obtained |
| Color temperature deviation calibration | The combined color temperature deviations of the OLED devices and collimated optical systems are calibrated | |
| Verification experiment | Stellar map image generation with color temperature information | Theoretical stellar map with color temperature information are generated to serve as a theoretical benchmark set to provide a baseline and reference for subsequent experiments |
| Semi-physical simulation of stellar maps with color temperature information | Simulated stellar map before and after calibrating the color temperature deviation are set as the uncalibrated control and experimental groups after calibration, respectively, to obtain the simulation effect of the semi-physical simulation method of stellar map with color temperature information |
Table 3.
Maximum deviation, average deviation, and standard deviation for spectral-type simulations.
Table 3.
Maximum deviation, average deviation, and standard deviation for spectral-type simulations.
| Star atlasserial number | Maximum deviation | Average deviation | Standard deviation | ||||||
|---|---|---|---|---|---|---|---|---|---|
| Before calibration | After calibration | Reduction ration | Before calibration | After calibration | Reduction ration | Before calibration | After calibration | Reduction ration | |
| Stellar Map 1 | 18 | 9 | 2 | 10.19 | 5.94 | 1.72 | 5.83 | 2.31 | 2.53 |
| Stellar Map 2 | 18 | 9 | 2 | 5.9 | 4.58 | 1.29 | 5.70 | 3.61 | 1.58 |
| Stellar Map 3 | 17 | 9 | 1.89 | 10.23 | 5.90 | 1.73 | 4.25 | 2.25 | 1.89 |
| Stellar Map 4 | 19 | 9 | 2.11 | 10.19 | 6.55 | 1.56 | 4.75 | 1.96 | 2.42 |
Table 4.
Comparison of related studies.
| Author | Analog stellar map features | Color temperature information simulation capability |
| Linghao Wu [8] | Stellar maps (fainter stars can be simulated) | - |
| Schulz et al. [9] | Stellar map(with controlled Gaussian background noise) | - |
| Teague and Chahl [10] | Stellar map(with motion blur simulation capability) | - |
| Qiang Liu [13] | Single star | 3000–11000 K color temperature simulation |
| Zhikun Yun [14] | Single star | 2000–12000 K color temperature simulation |
| Bin Zhao et al. [15] | Stellar map(with information on cosmic background radiation) | - |
| Songzhou Yang et al. [16] | Stellar map | The energy ratios of the four spectral intervals of each star are independently adjustable, without the ability to adjust the spectral type of the star |
| This study | Stellar map | The color temperature information for each star is independently adjustable, and the simulation covers all 70 stellar spectral types of the HSC |
Disclaimer/Publisher’s Note: The statements, opinions and data contained in all publications are solely those of the individual author(s) and contributor(s) and not of MDPI and/or the editor(s). MDPI and/or the editor(s) disclaim responsibility for any injury to people or property resulting from any ideas, methods, instructions or products referred to in the content. |
© 2025 by the authors. Licensee MDPI, Basel, Switzerland. This article is an open access article distributed under the terms and conditions of the Creative Commons Attribution (CC BY) license (http://creativecommons.org/licenses/by/4.0/).
Copyright: This open access article is published under a Creative Commons CC BY 4.0 license, which permit the free download, distribution, and reuse, provided that the author and preprint are cited in any reuse.


