
Submitted:
14 April 2025
Posted:
14 April 2025
You are already at the latest version
Abstract
Passion fruit is an underutilised fruit in northeastern India, known for its unique flavour and health benefits. This study analysed 15 genotypes (P1 to P15) to explore their morphological and biochemical traits related to fruit quality and yield. P. quadrangularis L. (P15) exhibited maximum traits such as flower length, fruit size, weight, juice content, shelf-life, and yield. P. edulis f. flavicarpa (P3, P5, P2) had the highest seed count per fruit and antioxidant activity, along with greater chlorophyll and anthocyanin levels. Passiflora edulis Sim (P8, P11) showed superior total soluble solids, carotenoids, and vitamin C. The study found that fruit shelf life positively correlated with seed weight, while the number of fruits per vine negatively correlated with seed traits and peel weight. Additionally, certain traits, such as total carotenoids, had strong positive correlations with reducing sugar and flavonoids. Principal component analysis revealed distinct trait relationships, particularly for genotypes P7 and P10. SDS-PAGE protein profiling indicated a significant distance between P3 and P14, emphasising genetic diversity. In conclusion, this research highlights the diverse morphological and biochemical characteristics of passion fruit genotypes, paving the way for the region's improved fruit quality, yield, and breeding strategies.
Keywords:
biochemical
; correlation
; morphology
; pca
; Passiflora
; sds-page
1. Introduction
Passion fruit is a significant yet underexploited fruit abundantly found in the northeast region of India [1]. It is a perennial, vigorous, climbing, woody vine that produces round or oval-shaped fruits [2]. Fruits have a tough, smooth, waxy, dark purple/yellow coloured rind with faint, fine white specks [3]. Fruit contains orange-coloured pulpy juice with many small, hard, dark brown to black pitted seeds. It belongs to the family Passifloraceae, which comprises 16 genera with more than 700 species [4] and about 520 species of genera Passiflora, the majority of which are distributed to Neotropics and Africa [5]. The genera Passiflora shows significant variations within and between species [6,7,8]. The genotypes of different species also varied in physiochemical characteristics, as Ramaiya et al. [9] reported, as the purple type recorded the highest fruit length, width, and weight. In contrast, the yellow type recorded the highest juice weight. The fruit shape varies from round to ovoid [10]. The Passiflora incarnata and Passiflora coccinea are different in their filament colour [11]. Even differences among the different passion fruit species were observed in pulp, peel, and seeds [12,20]. The morpho-physiochemical and seed protein of Passiflora foetida and Passiflora edulis indicated unique bands, indicating the diversity in protein molecular weight [21].
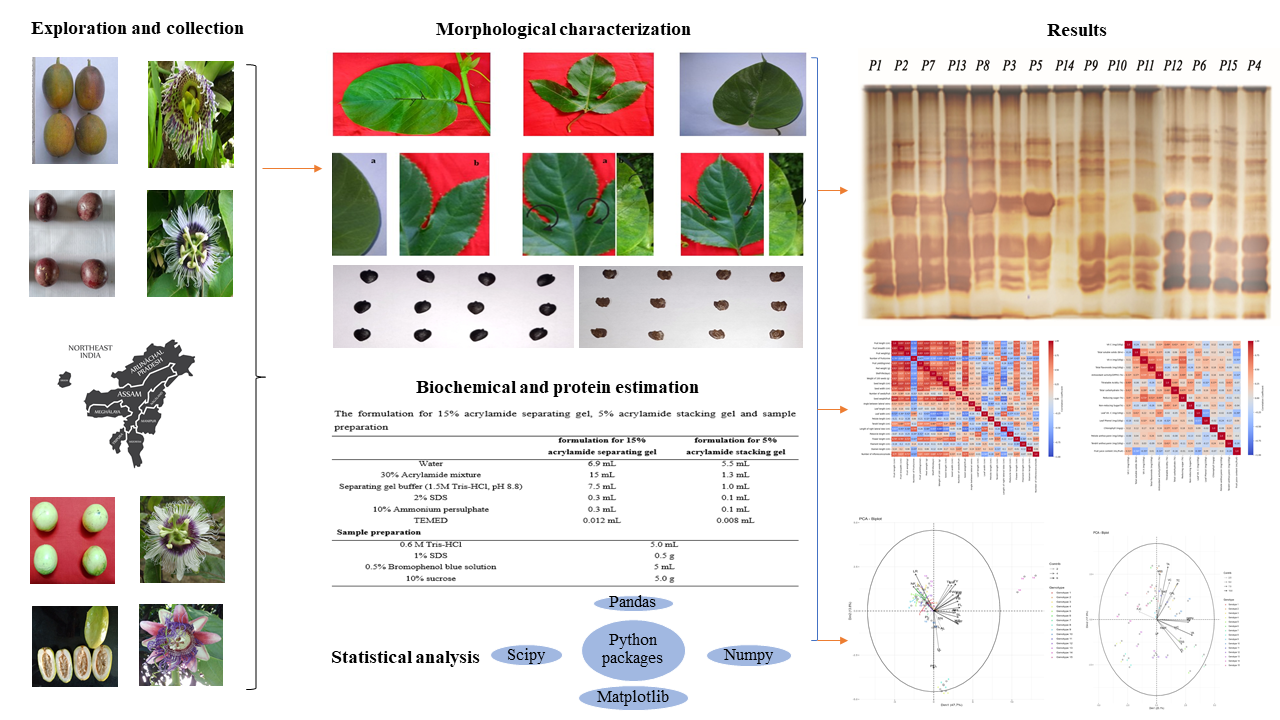
The northeastern region of India has a rich diversity of underexploited fruits, including different passion fruit species, especially Passiflora edulis Sim (purple type), Passiflora edulis f. flavicarpa Deg (yellow type), Passiflora quadrangularis L (giant granadilla) as well as Passiflora ligularis Juss (sweet granadilla) [27]. The total area dedicated to passion fruit cultivation in India during 2023 was 0.011 million hectares, yielding a total production of 0.056 million metric tons [22], which is mainly dominated by yellow and purple types. Passion fruit juice [3], leaves [23], rind residue (5-6% protein), and seed (23 % oil; similar to soybean and sunflower oil) [1] have industrial importance. In Nagaland, India, fresh passion fruit leaves are boiled to extract their medicinal properties, which are often used for treating dysentery and hypertension [24]. In contrast, in South America, it is used as a sedative, diuretic, anthelmintic, anti-diarrheal, stimulant, and tonic and for the treatment of hypertension, signs of menopause, and infant colic [25]. The 21st century has witnessed continued research, technology, marketing systems, and conservation efforts for underutilised crops, including passion fruit [26]. However, improved passion fruit cultivars could be an important source of income for marginal to large farmers because of their nutritional and industrial value and short maturity period. As a diversified crop in the Himalayan region of India, evaluation and physicochemical characterisation have not been systematically explored. Patel et al. [18] conducted a study on six genotypes of three species viz., Passiflora edulis, P. edulis f. flavicarpa and P. alata at NEH region, Megalaya, India and studied the physiochemical changes. In our study, the fifteen different genotypes of Passifora edulis f. flavicarpa Deg, Passifora edulis Sim, Passifora ligularis Juss, and Passifora quadrangularis L., collected from Arunachal Pradesh, Manipur, Assam, Tripura, Mizoram, Nagaland, Sikkim, and Mizoram were evaluated based on morpho-physicochemical properties of fruit juice, leaves, and tendrils and validated based on seed proteins using SDS-PAGE (sodium sodecyl sulphate polyacrylamide gel electrophoresis). Moreover, By doing so, we aim to elucidate the genetic variation present within Passifora species endemic to the northeastern region of India. The outcomes of this research endeavour will serve as valuable resources for future investigations focused on understanding and harnessing the potential of these species.
2. Materials and Methods
2.1. Details of Genotypes
Fifteen genotypes of Passiflora species were collected from seven states in the eastern region of India, namely Arunachal Pradesh, Assam, Manipur, Nagaland, Mizoram, Sikkim, and Tripura. These genotypes include P. edulis f. flavicarpa Deg, Passiflora edulis Sim, Passiflora ligularis Juss, and Passiflora quadrangularis L. (Table 1, Figure 1).
2.2. Morphological Characterisation
The morphological characterisation such as the angle between lateral veins (°), leaf length (cm), leaf width (cm), leaf shape, leaf size, leaf base size, leaf colour, leaf margin shape, division of leaf lamina, presence of leaf nectaries, sinus depth, presence of heterophylly, presence of stipule, petiole length (cm), tendril length (cm), length of the right lateral lobe (cm), peduncle length (cm), flower length (cm), filament length (cm), stamen length (cm), number of flowers per node, fruit length (cm), fruit breadth (cm), fruit weight (g), number of fruits per vine, fruit yield (kg per vine), peel weight (g), shelf-life (days), the weight of 100 seeds (g), seed length (cm), seed width (cm), number of seeds per fruit, seed weight per fruit, stem colour, flower colour, petal colour, ovary colour, fruit colour, fruit shape and seed colour, were recorded following the morpho-agronomic descriptors for Passiflora spp. [28] (Figure 7 supplementary file) and the tropical fruit descriptor developed by Bioversity International (IPGRI) (supplementary files). The leaves, tendrils, and ripe fruits were collected for the study. The Image J software was used to calculate the angle between lateral veins [29].
2.3. Sample Preparation
The fruits were harvested at full ripeness, retaining their natural skin colour. The fruits were washed in running water, halved, and divided into pulp, peel (albedo and flavedo), and seeds. The parts were packed into plastic bags and stored in a freezer at -20 °C until further analysis.
2.4. Biochemical Characterisation
The biochemical attributes of pulp, leaves, and tendrils were analysed following standard protocol. The total soluble solid content (TSS) was determined in pulps with a °Brix refractometer; total carotenoid content (mg100g-1) as per [30]; total flavonoids (mg100g-1) as per [31]; antioxidant activity (2,2-Diphenyl-1-picrylhydrazyl, DPPH) (%) [32]; titratable acidity (%) as per [33]; total carbohydrates (%) [34]; reducing sugar (%) [35] and non-reducing sugar (%) [36]. The anthocyanin content (mg 100g-1) in petioles and tendrils was determined using [37]. The vitamin C (mg 100g-1) [37], phenol (mg g-1) [31] and chlorophyll content (mg g-1) [38] content in leaves were determined following standard methods (Table 2).
2.5. Protein Extraction and Estimation
Seeds weighing 0.2 grams were extracted from the fully ripened fruits of the selected genotypes of the Passiflora species. These extracted seeds had been pre-soaked in a phosphate buffer solution (pH 7.0) for 24 hours before use. Seeds have been crushed with a solution of Tris-HCl 0.06 M (PH 7.4), 10 mM urea, 1 mM EDTA, 0.1% TCA, 2.5% glycerol, 0.5% SDS and 1.25% β-mercaptoethanol. After crushing volume, make up to 2 mL and centrifuged at 8000 rpm for 20 minutes at 4 ⁰C. Estimation of protein was done as per Lowry’s method [39] to quantify the amount of protein present in the sample.
2.6. Sodium Dodecyl Sulphate Polyacrylamide Gel Electrophoresis (SDS-PAGE)
Electrophoresis was carried out in the presence of denaturing agent (SDS/SLS) as per the procedure described by [40] with some modifications, and RF value and the molecular weight of each protein band were determined to observe variation among the Passiflora species found in the northeastern Himalayan region of India (Table 3).
2.7. Staining Solution
Silver staining was used to stain the protein bands as per [42] which comprised of fixing Solution (50% ethanol, 12% glacial acetic acid, 0.05 mL formaldehyde), sensitising solution (0.02% aqueous solution of sodium thiosulphate), silver stain solution (0.2% silver nitrate and 0.076% formaldehyde), developing solution (6% sodium carbonate, 0.004% sodium thiosulphate and 0.05% formaldehyde solution) and terminating/stopping solution (12% acetic acid).
2.8. Statistical Analysis
Data analysis was performed using variance analysis with the SAS software. In addition, the Pearson correlation matrix and principal component analysis (PCA) were conducted using Python packages, including scikit-learn, bioinfokit, seaborn, scipy, numpy, pandas, and matplotlib. The gels were scored as presence (+) or absence (-) of protein polypeptide bands for protein banding pattern. Depending upon the presence or absence of polypeptide bands, the similarity index (SI) [42] between the genotypes was calculated by the following formula:
Where Z= Number of similar bands between the genotypes, and X+Y =Total number of bands in the two genotypes compared.
3. Results
3.1. Morphological Parameters
Variations in morphological characteristics were evident among the collected genotypes, as illustrated in Figure 1 and detailed in Table 4 and Table 5. The genotype P10 of P. edulis Sim displayed the highest leaf length at 15.13 cm, while genotypes P13 (14.45 cm) and P14 (14.38 cm), belonging to P. ligularis Juss., exhibited similar leaf lengths. Notably, the maximum leaf width was recorded in genotype P1 (16.07 cm), followed by P4 (15.67 cm) and P2 (15.56 cm), all of which are classified under Passiflora edulis f. flavicarpa Deg. In terms of flower length, genotype P15 of Passiflora quadrangularis L. displayed the longest at 9.20 cm, followed by P10 (7.73 cm) of Passiflora edulis Sim, which was comparable to P10 (7.40 cm) of Passiflora edulis f. flavicarpa Deg. The genotype P4 of Passiflora edulis f. flavicarpa Deg exhibited the longest stamen and filament lengths, measuring 2.02 cm and 1.37 cm, respectively. Conversely, genotype P15 of Passiflora quadrangularis L. demonstrated superior metrics in various parameters, including fruit length (14.48 cm), breadth (9.30 cm), fruit weight (496.67 g), seed length (0.79 cm), the angle between lateral veins (64.52°), seed width (0.62 cm), seed weight per fruit (9.37 g), and shelf life of fruit (27 days at room temperature), when compared to Passiflora edulis f. flavicarpa Deg, Passiflora edulis Sim, and Passiflora ligularis Juss genotypes under study. Furthermore, fruit shapes exhibited diversity ranging from oblate (genotypes P1, P2, P3, P4, P6, P7, P8, P9, P10, P11, and P12 of Passiflora edulis f. flavicarpa Deg) to ellipsoid (genotype P5 of Passiflora edulis f. flavicarpa Deg, and genotypes P13 and P14 of Passiflora ligularis Juss), and oblong (genotype P15 of Passiflora quadrangularis L.). The length of the right lateral lobe varied significantly, with Passiflora edulis f. flavicarpa Deg (genotype P1) exhibiting the maximum at 7.17 cm, while absent in genotypes P13 and P14 of Passiflora ligularis Juss and genotype P15 of Passiflora quadrangularis L. Notably, a higher number of fruits per vine were observed for genotypes P12 (174.67) and P7 (166.67), both belonging to Passiflora edulis f. flavicarpa Deg. In contrast, genotype P15 (52.33) of Passiflora quadrangularis L. exhibited the least. Genotype P15 displayed the maximum number of flowers per node (2.67), followed by genotypes P13 and P14 (1.67), while other genotypes bore only one flower per node. In terms of fruit yield (kg per vine), genotype P15 (26.23 kg per vine) of Passiflora quadrangularis L. and genotype P6 (10.47 kg per vine) of Passiflora edulis f. flavicarpa Deg demonstrated the highest yields. In contrast, genotype P13 (4.62 kg per vine) of Passiflora ligularis Juss exhibited the lowest. These findings underscore the significant variability in morphological traits and fruit productivity among different Passiflora genotypes, suggesting the potentiality of these regions.
3.2. Contributions of Morphological Characters Towards Diversity in Passiflora Species
The morphological characters such as angle between lateral veins (°), leaf length (cm) leaf width (cm), petiole length (cm), tendril length (cm), length of right lateral lobe (cm), peduncle length (cm), flower length (cm), filament length (cm), stamen length (cm), number of flowers per node, fruit length (cm), fruit breadth (cm), fruit weight (g), number of fruits per vine, fruit yield (kg per vine), peel weight (g), weight of 100 seeds (g), seed length (cm), seed width (cm), number of seeds per fruit, seed weight per fruit were studied towards diversity. Among the different variable seed length contributed the highest percent towards genetic divergence (55.24%), followed by the seed weight per fruit (22.86%), number of seeds per fruit (8.57%) and filament length (1.90%). In contrast, the length of the right lateral lobe and seed breadth (5.71%) contributed to the same percentage (Figure 2).
3.3. Biochemical Characteristics of Fruit Juice, Leaves, Petioles and Tendrils
Significant differences were observed in the biochemical attributes of fruit juice, leaves, tendrils, and petioles among Passiflora edulis f. flavicarpa Deg, Passiflora edulis Sim, Passiflora ligularis A. Juss and Passiflora quadrangularis L. collected from the northeastern Himalayan region of India under study (Table 6 and Table 7). Among the horticultural characteristics, a significant result was recorded for maximum juice content (mL per fruit) in genotype P15 (117.92 mL) followed by P6 (34.20 mL). In comparison, the lowest value was registered in genotype P9 (10.94 mL). The highest TSS content was recorded for P8 (18.28 °Brix), a purple type (Passiflora edulis Sim) and P5 (18.13 °Brix), a yellow type (Passiflora edulis f. flavicarpa Deg). In contrast, the lowest TSS was recorded for P15 (13.54 °Brix), a giant granadilla (Passiflora quadrangularis L.). The highest titratable acidity content was recorded for P2 (3.91%) and P1 (3.56%), while the lowest was recorded in P14 (0.63%). The highest vitamin C content in fruit juice was recorded in P11 (0.320 mg g-1) and P15 (0.309 mg g-1), whereas the lowest values were recorded for P13 (0.134 mg g-1) and P14 (0.128 g-1). The genotype P10 contained the highest amount of total carbohydrates (12.88%), followed by P7 (12.36%), while the lowest value was recorded for P6 (7.81 %). The highest percentage of reducing sugar was recorded in genotype P8 (6.92%), which was comparable to P5 (6.88%), while the lowest was registered in genotype P13 (3.51 %) of Passiflora ligularis Juss. The highest percentage of non-reducing sugar was recorded in P2 (6.54%) and P4 (6.52%), while the lowest was in P6 (3.05%) of Passiflora edulis f. flavicarpa Deg. Among the different genotypes, the total carotenoid content was highest in genotypes P8 (0.397 mg g-1) and P5 (0.30 mg g-1). Both genotypes belong to Passiflora edulis Sim, while the lowest was registered in genotypes P13 and P14 (0.0001 mg g-1), and both species belong to Passiflora ligularis Juss. The genotype P5 contained a significantly higher amount of total flavonoid and antioxidant activity (0.355 mg g-1; 22.15%), followed by P10 (0.261 mg g-1; 14.76%), while the lowest was registered in genotype P9 (0.077 mg g-1) for flavonoids and genotype P15 (6.28%) for antioxidant activity. The maximum vitamin C content of leaves was recorded for P5 (1.749 mg g-1) and P12 (1.500 mg g-1), while it was the least in genotype P10 (0.489 mg g-1). Significantly higher phenol content in the leaves was recorded for P10 (4.985 mg g-1), P15 (3.489 mg g-1), P14 (3.113 mg g-1) and P13 (3.108 mg g-1) while least in genotype P3 (1.432 mg g-1). The maximum total chlorophyll content of leaves was recorded for P2 (2.91 mgg-1).
3.4. Maximum Percentage Contributions of Biochemical Characters Towards Diversity in Passion Fruit Species
The biochemical parameetrs such as Vitamin C, total soluble solids, total carotenoid, total flavonoids, antioxidant activity, titratable acidity, total carbohydrates, reducing sugar, non-reducing sugar in fruit juice, anthocyanin content in leaves, petioles and tendrils, phenol, total chlorophyll and vitmain C content in leaves were subjected towards diversity contribution. Among the traits studied, total flavonoid content contributed to the highest percentage towards genetic divergence (63.81%), followed by chlorophyll content in leaves (17.14%), total carbohydrates content (8.57%), anthocyanin content in petioles (3.81%) and total carotenoid content (1.90%) (Figure 3).
3.5. Characterisation of Passiflora Species Through Seed Protein Profiles (SDS-PAGE)
The protein banding pattern of fifteen genotypes of Passiflora edulis f. flavicarpa Deg, Passiflora edulis Sim, Passiflora ligularis A. Juss and Passiflora quadrangularis L collected from different states of the the northeastern Himalayan region of India was generated by SDS-PAGE (Figure 4). Cluster analysis of the banding pattern of fifteen genotypes based on similarity index and UPGMA resulted in distinct clusters (Figure 5). A total of 89 protein bands, as per
Rm values, were identified through silver staining. The genotypes displayed significant variation in the number of protein bands, ranging from 6 to 11. Among them, P13 and P14 showed the highest number (11) of protein bands, while the lowest number (6) of bands was present in P1 (P. edulis f. flavicarpa Deg). P. ligularis Juss (genotypes P13 and P14) was characterised by three specific protein bands at bands 2, 10 and 13. In contrast, band number 30 was found only in P1 (P. edulis f. Flavicarpa Deg) and P13 (P. ligularis Juss). Band number 2 (Rm=0.11) was exclusively present in genotypes P8; similarly, band number 9 (Rm=0.18) was found in genotypes P11 and P14, whereas it was absent in all other genotypes studied. The same protein bands were observed in P. edulis f. Flavicarpa Deg (P2, P3 and P4) and P. edulis Sim (P8, P9, P10 and P11).
3.6. Correlation Analysis
Among the morphological traits studied, the fruit length was maximum positively correlated with fruit breadth, fruit weight,peel weight and seed length; fruit weight with fruit yield and peel weight; weight of 100 seeds with seed weight/fruit. Whereas, number of fruits/vine was maximum negatively correlated with seed weight/fruit; fruit length, breadth and weight with number of fruits/vine; weight of 100 seeds, seed length, seed weight/fruit and angle between lateral veins with leaf width and length of right lateral lobe; flowe length with filament length; length of right lateral lobe with number of inflorescence/node and peduncle length; tendril length with stamen length, peduncle lenth and length of right lateral lobe, seed weight with leaf width and length of right lateral lobe; fruit yield with pendulce length, length of right lateral lobe, leaf width and petiole length.The number of fruit/vine indicated negative correlation with most of the studied parameters except for length of right lateral lobe, leaf width and filament lenght (Figure 6). Regrading biochemical traits, total carotenoid content was significantly positively correlated with reducing sugar, total flavonoids, and antioxidant activity; total soluble sugar with total carotenoid, total flavonoid and antioxidant activity of fruit juice as well leaf vitamin C content. However, leaf vitamin C content showed a negative correlation with leaf phenol content, while total soluble sugar content showed a maximum negative correlation with fruit juice content (Figure 7).
3.7. Principal Components Analysis
The principal component analysis was performed for morphological and biochemical traits across the genotypes to understand the relationship between critical variables (Figure 8 and Figure 9). The principal component 1 accounted 47.7 % of the variation, while PC2 accounted for 13.8 % of the variation in the morphological traits studied. Petiole length exhibited a negative correlation with P. edulis f. flavicarpa Deg (P1) and P. edulis Sim (P7 and P10) in PC1, whereas most traits showed a positive correlation in PC2 in other passion fruit genotypes under study. Regarding biochemical traits, a total variation of 43% was accounted for, with most traits showing a positive correlation. The genotype P5 (P. edulis f. flavicarpa Deg) accounted for total solube sugar while genotypes P1 (P. edulis f. flavicarpa Deg), P14 (P. ligularis Juss) and P15 (P. quadrangularis L.) were associated with fruit juice content.
4. Discussion
Understanding the genetic diversity within collections of genotypes is crucial for effectively conserving and managing germplasm resources and utilising them in breeding programs for passion fruit [43]. Genetic variation among genotypes is essential for developing new crop varieties that enhance productivity and resilience against biotic and abiotic stresses. In this study, we used different morpho-physicochemical traits and seed proteins to estimate diversity among fifteen genotypes belonging to P. edulis f. flavicarpa Deg, P. edulis Sim, P. ligularis Juss and P. quadrangularis L., collected from Arunachal Pradesh, Manipur, Assam, Tripura, Mizoram, Nagaland, Sikkim and Mizoram states located in northeastern Himalayan region of India during 2018-2020. Differences in leaf and stamen characters were observed among the genotypes, as they belong to different species, while even within the species of Passiflora edulis Sim (genotype P10) variations were evident. These differences arose due to the diverse origins of the different species from the seed. Variability in morphological characters was also noted by [23,44] indicating significant diversity among the collected Passiflora species. The genotype P15 belongs to Passiflora quadrangularis L. represented the maximum fruit length, fruit breadth, fruit weight, seed length, angle between lateral veins, seed width, and seed weight per fruit compared to Passiflora edulis f. flavicarpa Deg, Passiflora edulis Sim and Passiflora ligularis Juss genotypes. This phenomenon can be attributed to the giant nature of Passiflora quadrangularis L., as reported by [46]. Regarding flower length, Passiflora quadrangularis L. exhibited the maximum, while stamen and filament length were greatest in Passiflora edulis f. flavicarpa, in agreement with findings by [45]. In some cases, different passion fruit species might be preferred for specific markets or vegetable purposes. Additionally, factors such as variety selection, growing conditions, and cultural practices also influence fruit size and overall yield. The ultimate goal for breeders and growers is to achieve higher fruit yield per vine. Improving passion fruit directly correlates with selecting elite genotypes that exhibit higher fruit yield and quality. Similar findings from the data align with those of [15], which resulted in higher yields. The maximum TSS content was recorded for P8 (18.28 °Brix), a purple type (Passiflora edulis Sim), and P5 (18.13 °Brix), a yellow type (Passiflora edulis f. flavicarpa Deg). In contrast, the lowest content was observed in P15 (13.54 °Brix), a giant granadilla (Passiflora quadrangularis L). The total soluble sugar content varies according to species, geographical origin, genetic factors, environmental conditions, cultural practices, and harvesting techniques [16]. For instance, genotype P8, belonging to Passiflora edulis Sim (purple type), was collected from East Sikkim at an altitude of 882 meters, resulting in higher soluble sugar content. Data on TSS content align with findings from [17,18]. It is therefore, the passion fruit genotypes with high total soluble sugar content are valued for their superior flavor, marketability, nutritional benefits, processing qualities, and ability to meet consumer preferences. As a result, genotypes that consistently produce fruits with high sugar content are highly sought after in the passion fruit industry [19]. The concentration of ascorbic acid in Passiflora species highlights the potential use of the fruit as a good source of ascorbic acid. Not only are the fruit juice rich in vitamin C, but the vitamin C content of the leaves was also significant, with the highest reported in genotype P5, which is of the yellow type. Hence, these assortments could serve as a promising reservoir of ascorbic acid, offering nutritional, medicinal, and commercial advantages. Utilised in traditional remedies for ailments such as dysentery and hypertension [24], fresh passion fruit leaves also boast properties as a sedative, diuretic, anthelmintic, anti-diarrheal, and stimulant [25]. Moreover, they are enriched with antioxidant potential due to their high vitamin C content.. These findings are consistent with the results of [47] regarding ascorbic acid content. Additionally, genotypes P8 and P5 contained higher amounts of total carotenoid content compared to the other studied genotypes. This finding is consistent with the one reported by [12]. The variation observed among the genotypes is not only due to geographical effects but also influenced by factors such as the maturation stage of the fruits at harvest, crop year, variety, and storage conditions [13]. It has been reported that temperature can impact the total carbohydrate or sugar content in passion fruit [14], which is reflected in the results of the yellow, purple passion, sweet, and giant granadilla fruit collected from different altitudes and temperature conditions in the northeastern Himalayan region of India. Studies have found a range from 5.25 to 6.98 g/100 g of total sugars in yellow passion fruit [15]; however, they have also reported that the total sugar varied from 5.75 to 13.97 g/100 g for P. edulis f. flavicarpa harvested in two different places, and these values are consistent with those detected in our study due to variation in geography. Flavonoids possess antioxidant, pharmacological, and cytotoxic properties [48], and they demonstrate the capacity to shield against DNA damage induced by reactive oxygen species (ROS). The genotype P5 (P. edulis f. flavicarpa Deg) and P10 (P. edulis Sim) recorded maximum flavonoid content among other genotypes under study. Carmona-Hernandez et al. [49] documented a flavonoid content of 0.29 mg catechin g−1 for P. edulis f. flavicarpa and 0.28 mg catechin g−1 for P. edulis f. edulis. These reported values are almost similar than those observed in our study which also includes same species. Our findings highlight P5 and P10, as a promising genotype for breeding due to its notably higher flavonoid content and exhibits considerable potential. Our outcomes were also in line with the findings of [50]. The antioxidant potential is influenced by more than just the phenolic composition. It is also shaped by various bioactive compounds, their interactions, and synergistic effects [52]. The DPPH value showed that genotype P5 of Passiflora edulis f. flavicarpa exhibited the highest antioxidant activity. de Oliveira et al. [52] documented a total antioxidant activity of 7.20 micromoles of Trolox equivalents per gram of fresh weight in ripe yellow passion fruit cultivated under conventional management. Reis et al. [12] found a correlation between antioxidant activity and carotenoid content, a relationship also observed in our study, which contributed significantly to the total antioxidant activity. Our result are also inline with the work of [57,58] who reported the higher naioidcanr acivity in Passiflora edulis leaves. The giant granadilla (Passiflora quadrangularis L) holds nutritional importance as it can serve as a source of fresh vegetables, with its green stage being suitable for cooking [53]. Additionally, the leaves of Passiflora edulis f. flavicarpa Deg and Passiflora edulis Sim can be utilised as a rich source of vitamin C. SDS-PAGE method used to discern the diversity of seed proteins within the germplasm. In genetic variation studies, seed proteins serve as crucial genetic markers due to their direct correlation with structural genes [54,55]. Any modification in a gene's coding sequence typically translates into a corresponding alteration in the protein's primary structure it encodes [56]. According to Beena and Beevy [21], SDS–PAGE protein profiling indicates variations within and between Passiflora species. The low TF% of 40% observed in Passiflora edulis varieties suggests the cultivated taxa have evolved. The presence of unique protein bands at 65.66 KDa in Passiflora foetida and 17.50 KDa in Passiflora edulis confirms their interspecific variation. Our study resulted in a maximum distance between genotype P3 (Passiflora edulis f. flavicarpa Deg) and P14 (Passiflora ligularis Juss), indicating their potential for breeding programs.
5. Conclusions
From the study, it can be concluded that fifteen genotypes from four Passiflora species collected from various parts of the northeastern region of India exhibit significant variation in morphological and biochemical characteristics, comprising thirty-nine morphological traits and seventeen biochemical characters. SDS-PAGE protein profiling also revealed variations at both the intra- and interspecific levels among Passiflora species found in northeast India. Based on the mean performance of all the traits studied, genotypes P2, P8, P3, P5, P11, and P6 were identified as superior for most of the yield components and fruit quality traits. These genotypes could serve as valuable parental sources in future breeding programs.
Supplementary Materials
The following supporting information can be downloaded at the website of this paper posted on Preprints.org.
Author Contributions
Kripa Shankar: Investigation and data compilation S. R. Singh: Conceptualization, supervision and editing, L. Wangchu: Assistance in lab works and editing, A. K. Phurailatpam: Conceptualization and editing, L. Shantikumar: Physio-chemical study, Ps. M. Anal: Genotype collection and characterization, N. Devchandra: Survey and collection, B N Hazarika: Data interpretation and Aria Dolatabadian: Statistical analysis and editing
Funding
This study was not funded by any organisation.
Data Availability Statement
The datasets generated and analyzed during the current study are available in the manuscript and its supplementary files.
Acknowledgements
The first author is obliged to the Department of Fruit Science, College of Horticulture and Forestry, Central Agricultural University, Pasighat, Arunachal Pradesh, India for providing research facility during exploration and research work activities.
Conflicts of Interest
The authors declare no conflicts of interest.
References
- Shankar, K.; Singh, S.R.; Hazarika, B.N.; Wangchu, L.; Singh, B. (2021). Cultivated Passiflora sp. in North East region of India. Indian Hortic., 66(5), 50–52.
- Bailey, M.; Sarkhosh, A.; Rezazadeh, A.; Anderson, J.; Chambers, A.; Crane, J.H. (2021). The passion fruit in Florida: HS1406, 1/2021. Edis, 2021(1). [CrossRef]
- Thokchom, R.; Mandal, G. (2017). Production preference and importance of passion fruit (Passiflora edulis): A review. J. Agric. Eng. Food Technol., 4(1), 27–30.
- Feuillet, C. (2004). Passifloraceae (Passion flower family). In: Mori, N.; Henderson, S.A.; Stevenson, D.W.; Heald, S.D. (Eds.) Flowering plants of the neotropics; Oxford: USA, pp. 286–287.
- Ulmer, T.; MacDougal, J.M. (2004). Passiflora: Passion flowers of the world; Timber Press: Portland, OR, USA, p. 430.
- Fajardo, D.; Angel, F.; Grum, M.; Tohme, J.; Lobo, M.; Roca, W.M.; Sanchez, I. Genetic variation analysis of the genus Passiflora L. using RAPD markers. Euphytica 1998, 101, 341–347. [Google Scholar] [CrossRef]
- Viana, A.J.C.; Souza, M.M.; Araújo, I.S.; Corrêa, R.X.; Ahnert, D. Genetic diversity in Passiflora species determined by morphological and molecular characteristics. Biol. Plant. 2010, 54, 535–538. [Google Scholar] [CrossRef]
- Viana, A.P.; Pereira, T.S.; Pereira, M.G.; de Souza, M.M.; Maldonado, J.M.; Do Amaral Junior, A.T. (2003). Genetic diversity among yellow passion fruit commercial genotypes and among Passiflora species using RAPD. Rev. Bras. Frutic., 25, 489–493.
- Ramaiya, S.D.; Bujang, J.S.; Zakaria, M.H. Genetic Diversity inPassifloraSpecies Assessed by Morphological and ITS Sequence Analysis. Sci. World J. 2014, 2014, 1–11. [Google Scholar] [CrossRef] [PubMed]
- Joy, P.P. (2010). Passion fruit (Passiflora edulis Sims): Passifloraceae. Tech. Bull., Pineapple Research Sta-tion, Kerala, India.
- Aizza, L.C.B.; Sawaya, A.C.H.F.; Dornelas, M.C. (2019). Identification of anthocyanins in the corona of two species of Passiflora and their hybrid by UHPLC-ESI-MS/MS. Biochem. Syst. Ecol., 85, 60–67. [CrossRef]
- Reis, L.C.R.D.; Facco, E.M.P.; Salvador, M.; Flores, S.H.; De Oliveira Rios, A. (2018). Antioxidant poten-tial and physicochemical characterization of yellow, purple and orange passion fruit. J. Food Sci. Technol., 55, 2679–2691.
- Souza, L.M.D.; Ferreira, K.S.; Chaves, J.B.P.; Teixeira, S.L. (2008). L-ascorbic acid, β-carotene and lyco-pene content in papaya fruits (Carica papaya) with or without physiological skin freckles. Sci. Agric., 65, 246–250.
- Shinohara, T.; Usui, M.; Higa, Y.; Igarashi, D.; Inoue, T. (2013). Effect of accumulated minimum tem-perature on sugar and organic acid content in passion fruit. J. ISSAAS, 19(2), 1–7.
- Ramaiya, S.D.; Bujang, J.S.; Zakaria, M.H.; Kinga, W.S.; Sahrira, M.A.S. (2012). Sugars, ascorbic acid, total phenolic content and total antioxidant activity in passion fruit (Passiflora) cultivars. J. Sci. Food Agric., 93, 1198–1205. [CrossRef]
- Tjoelker, M.G.; Oleksyn, J.; Reich, P.B.; Zytkowiak, R. (2008). Coupling of respiration, nitrogen, and sugars underlies convergent temperature acclimation in Pinus banksiana across wide-ranging sites and populations. Glob. Change Biol., 14(4), 782–797. [CrossRef]
- Espinosa, D.; Melgarejo, L.; Hernández, M.; Melo, S.; Fernández-Trujillo, J. Physiological and biochemical characterization of sweet granadilla (Passiflora ligularis JUSS) at different locations. Acta Hortic. 2018, 1459–1464. [Google Scholar] [CrossRef]
- Patel, R.K.; Singh, A.; Prakash, J.; Nath, A.; Deka, B.C. (2014). Physico-biochemical changes during fruit growth, development and maturity in passion fruit genotypes. Indian J. Hort., 71, 486–493.
- Joseph, A.V.; Sobhana, A.; Joseph, J.; Bhaskar, J.; Vikram, H.C.; Sankar, S.J. (2021). Performance evalu-ation of passion fruit (Passiflora edulis Sims.) genotypes. J. Trop. Agric., 59(2).
- Loizzo, M.R.; Lucci, P.; Núñez, O.; Tundis, R.; Balzano, M.; Frega, N.G.; Conte, L.; Moret, S.; Filatova, D.; Moyano, E.; et al. Native Colombian Fruits and Their by-Products: Phenolic Profile, Antioxidant Activity and Hypoglycaemic Potential. Foods 2019, 8, 89. [Google Scholar] [CrossRef] [PubMed]
- Beena, V.L.; Beevy, S.S. (2015). Genetic diversity in two species of Passiflora L. (Passifloraceae) by kary-otype and protein profiling. Nucl., 58(2), 101–106.
- Agricultural Statistics at a Glance. (2022). Ministry of Agriculture & Farmers Welfare, Government of India, p. 92.
- Da Silva, M.A.P.; Placido, G.R.; Caliari, M.; Carvalho, B.S.; Da Silva, R.M.; Cagnin, C.; De Lima, M.S.; do Carmo, R.M.; Da Silva, R.C.F. (2015). Physical and chemical characteristics and instrumental colour pa-rameters of passion fruit (Passiflora edulis Sims). Afr. J. Agric. Res., 10, 1119–1126.
- Jamir, T.; Sharma, H.; Dolui, A. Folklore medicinal plants of Nagaland, India. Fitoterapia 1999, 70, 395–401. [Google Scholar] [CrossRef]
- Mowrey, D. (1993). Herbal tonic therapies; Keats Publishing Inc.: New Canaan, CT, USA, p. 400.
- Swaminathan, M.S. (1999). Enlarging the basis of food security. Proc. Int. Workshop on the Role of Un-derutilized Species, 17–19 February, M.S. Swaminathan Research Foundation, Chennai, India.
- Shankar, K.; Singh, S.R.; Annu, T. (2021a). Existence of Passiflora ligularis Juss in North Eastern Hima-layan Region of India. Res. J. Agric. Sci., 12(6), 2276–2280.
- De Jesus, O.N.; de Oliveira, E.J.; Faleiro, F.G.; TL, S.; Girardi, E.A. (2017). Illustrated morpho-agronomic descriptors for Passiflora spp.; Embrapa Mandioca e Fruticultura: Brazil.
- Collins, T.J. (2007). ImageJ for Biotechniques microscopy. Biotechniques, 43(S1), S25–S30. [CrossRef]
- Bayfield, R.; Cole, E. (1980). Colorimetric estimation of vitamin A with trichloroacetic acid. Methods Enzymol., 67, 180–195. [CrossRef]
- Ranganna, S. (1986). Handbook of analysis and quality control for fruit and vegetable products, 2nd ed.; Tata McGraw-Hill: New Delhi, India, pp. 89–90.
- Medlicott, A.P.; Reynoso, W.; Thompson, A.K. (1988). Modeling of mango ripening for prediction of optimal harvest time and maturity. Acta Hortic., 269, 215–223.
- AOAC. (2000). Official methods of analysis of AOAC International, 17th ed.; Association of Official Analytical Chemists: Gaithersburg, MD, USA.
- Capocasa, F.; Scalzo, J.; Mezzetti, B. (2008). Combining quality and antioxidant content in fruit breeding. Acta Hortic., 814, 61–66.
- Singleton, V.L.; Orthofer, R.; Lamuela-Raventós, R.M. Analysis of total phenols and other oxidation substrates and antioxidants by means of folin-ciocalteu reagent. Methods Enzymol. 1999, 299, 152–178. [Google Scholar] [CrossRef]
- Aebi, H. (1984). Catalase in vitro. Methods Enzymol., 105, 121–126. [CrossRef]
- Beauchamp, C.; Fridovich, I. Superoxide dismutase: Improved assays and an assay applicable to acrylamide gels. Anal. Biochem. 1971, 44, 276–287. [Google Scholar] [CrossRef] [PubMed]
- Nakano, Y.; Asada, K. Hydrogen Peroxide is Scavenged by Ascorbate-specific Peroxidase in Spinach Chloroplasts. Plant Cell Physiol. 1981, 22, 867–880. [Google Scholar] [CrossRef]
- Moore, S.; Stein, W.H. PHOTOMETRIC NINHYDRIN METHOD FOR USE IN THE CHROMATOGRAPHY OF AMINO ACIDS. J. Biol. Chem. 1948, 176, 367–388. [Google Scholar] [CrossRef] [PubMed]
- Arnon, D.I. Copper enzymes in isolated chloroplasts. Polyphenoloxidase in Beta vulgaris. Plant Physiol. 1949, 24, 1–15. [Google Scholar] [CrossRef] [PubMed]
- Bai, Y.; Dougherty, L.; Xu, K. Towards an improved apple reference transcriptome using RNA-seq. Mol. Genet. Genom. 2014, 289, 427–438. [Google Scholar] [CrossRef] [PubMed]
- Kim, D.; Langmead, B.; Salzberg, S.L. HISAT: A fast spliced aligner with low memory requirements. Nat. Methods 2015, 12, 357–360. [Google Scholar] [CrossRef] [PubMed]
- Pertea, M.; Kim, D.; Pertea, G.M.; Leek, J.T.; Salzberg, S.L. Transcript-level expression analysis of RNA-seq experiments with HISAT, StringTie and Ballgown. Nat. Protoc. 2016, 11, 1650–1667. [Google Scholar] [CrossRef] [PubMed]
- Love, M.I.; Huber, W.; Anders, S. (2014). Moderated estimation of fold change and dispersion for RNA-seq data with DESeq2. Genome Biol., 15, 550. [CrossRef]
- Young, M.D.; Wakefield, M.J.; Smyth, G.K.; Oshlack, A. Gene ontology analysis for RNA-seq: accounting for selection bias. Genome Biol. 2010, 11, 1–12. [Google Scholar] [CrossRef] [PubMed]
- Kanehisa, M.; Sato, Y.; Kawashima, M.; Furumichi, M.; Tanabe, M. KEGG as a reference resource for gene and protein annotation. Nucleic Acids Res. 2015, 44, D457–D462. [Google Scholar] [CrossRef] [PubMed]
- Ye, J.; Fang, L.; Zheng, H.; Zhang, Y.; Chen, J.; Zhang, Z.; Wang, J.; Li, S.; Li, R.; Bolund, L.; et al. WEGO: A web tool for plotting GO annotations. Nucleic Acids Res. 2006, 34, W293–W297. [Google Scholar] [CrossRef] [PubMed]
- Jones, P.; Binns, D.; Chang, H.-Y.; Fraser, M.; Li, W.; McAnulla, C.; McWilliam, H.; Maslen, J.; Mitchell, A.; Nuka, G.; et al. InterProScan 5: Genome-scale protein function classification. Bioinformatics 2014, 30, 1236–1240. [Google Scholar] [CrossRef] [PubMed]
- Shannon, P.; Markiel, A.; Ozier, O.; Baliga, N.S.; Wang, J.T.; Ramage, D.; Amin, N.; Schwikowski, B.; Ideker, T. Cytoscape: A software environment for integrated models of Biomolecular Interaction Networks. Genome Res. 2003, 13, 2498–2504. [Google Scholar] [CrossRef] [PubMed]
- Awasthi, O.P.; More, T.A. (2009). Evaluation of different passion fruit genotypes under semi-arid region of western India. Indian J. Agric. Sci., 79, 419–421.
- Baghel, M.S.; Meena, S.R.; Meena, R.K.; Rai, D.R.; Verma, P.K.; Kumar, R. (2017). Evaluation of passion fruit (Passiflora edulis Sims) genotypes for growth, yield and fruit quality under Delhi conditions. Indian J. Agric. Sci., 87(10), 1383–1388.
- Joseph, A.V.; Sobhana, A.; Sankar, S.J. (2015). Evaluation of passion fruit (Passiflora edulis Sims) genotypes for yield and quality. J. Trop. Agric., 53(2), 165–168.
- Shankar, K.; Singh, S.R.; Wangchu, L.; Singh, B. (2022). Passion fruit in India: Cultivation, utilization, and future prospects. Indian Hortic., 67(2), 6–9.
- Lobo, M.; Tohme, J.; Angel, F.; Roca, W. (1996). Application of molecular markers for characterization of Passiflora germplasm. Proc. Int. Symp. Trop. Fruits, 1, 34–45.
- Muthuswamy, M.; Madanagopal, R.; Durairaj, S.; Elayabalan, S. (2021). Evaluation of superior genotypes of passion fruit (Passiflora edulis Sims) under lower Pulney hills of Tamil Nadu. J. Pharmacogn. Phytochem., 10(5), 2535–2539.
- Silva, R.F.D.; Santos, V.S.; Santos, J.M.D.; Brito, N.V.; Pessoa, R.C.D.; Oliveira, G.M.D.; Soares, A.B.; Viana, A.P. (2018). Diversity and structure of the Passiflora edulis gene pool accessed by SSR markers. Acta Sci. Agron., 40, e39373.
- Viana, A.P.; Freitas, J.C.O.; Santos, C.E.M.; Moreira, S.O.; Paiva, C.L.; Santos, E.A.; Amaral Júnior, A.T. (2021). Breeding of passion fruit: A historical overview and future perspectives. Front. Plant Sci., 12, 712228.
- Souza, M.M.; Pereira, M.G. (2006). Molecular characterization of genotypes of the genus Passiflora L. using inter-simple sequence repeat (ISSR) markers. Sci. Hortic., 111(2), 164–169.
Figure 1.
Fruits, leaves and flowers of (A) Passiflora ligularis Juss, (B) Passiflora edulis f. flavicarpa, (C) Passiflora edulis Sim and (D) Passiflora quadrangularis L.
Figure 1.
Fruits, leaves and flowers of (A) Passiflora ligularis Juss, (B) Passiflora edulis f. flavicarpa, (C) Passiflora edulis Sim and (D) Passiflora quadrangularis L.
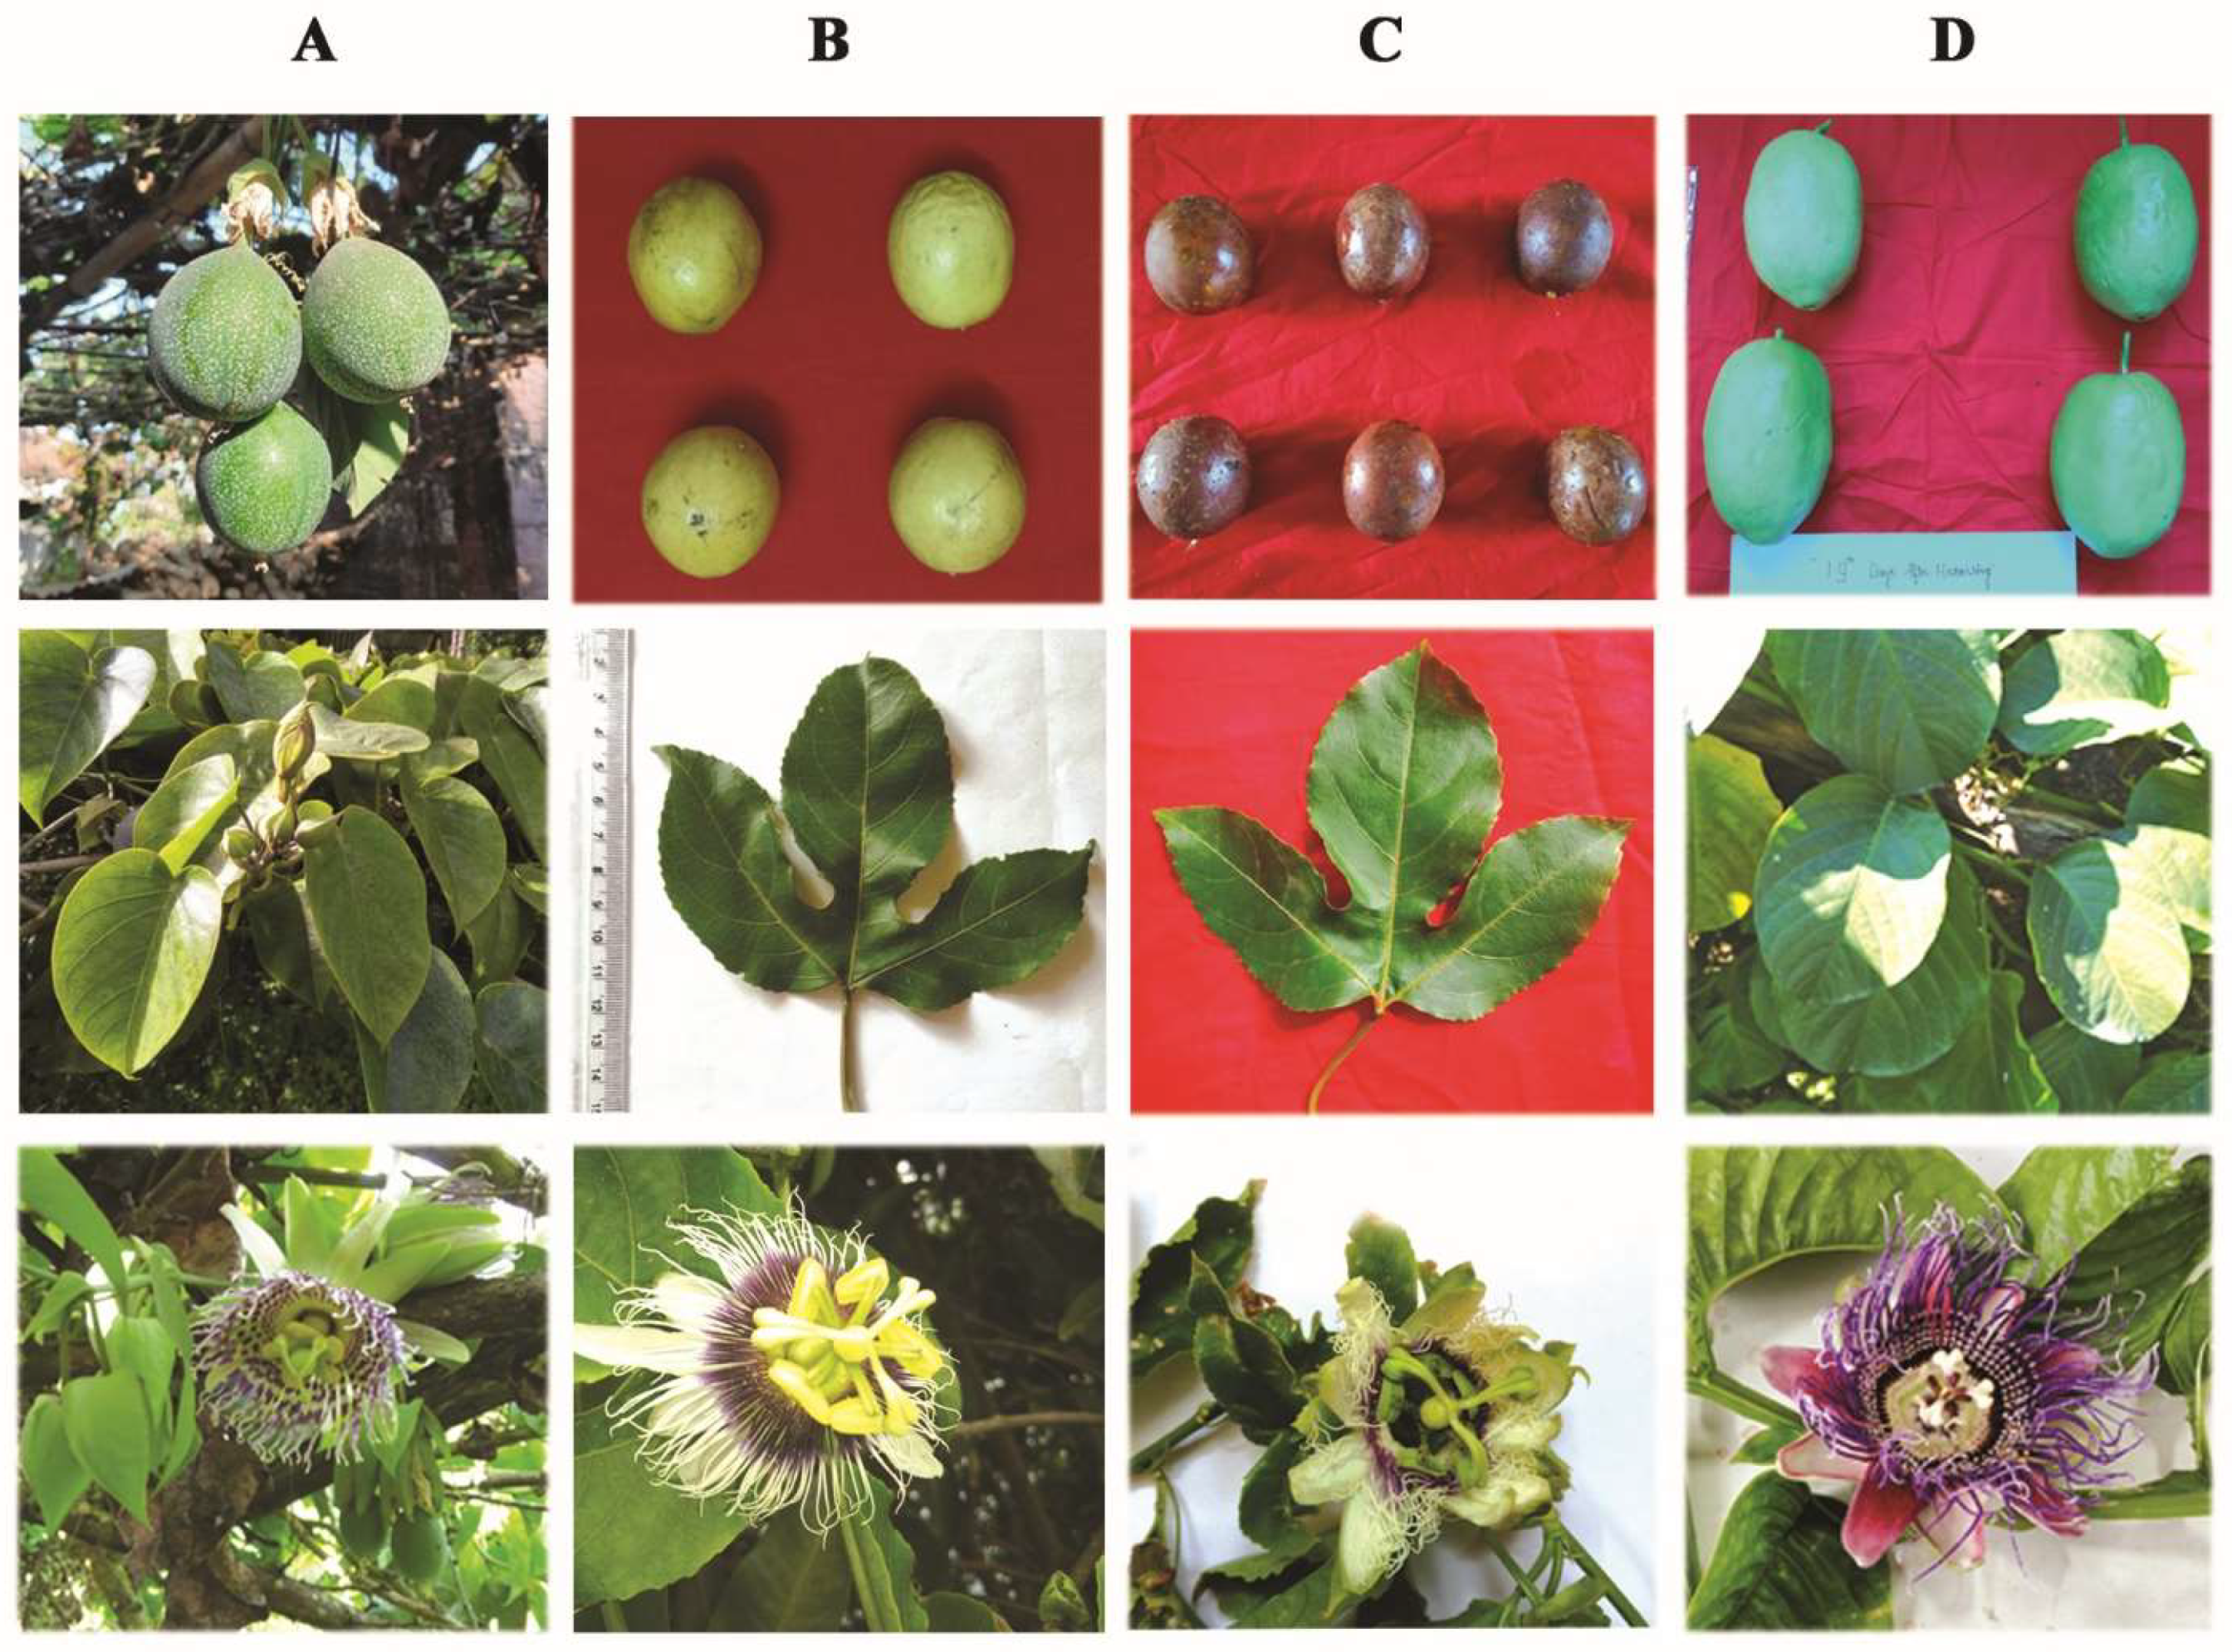
Figure 2.
Maximum percentage contributions of morphological characters towards diversity.
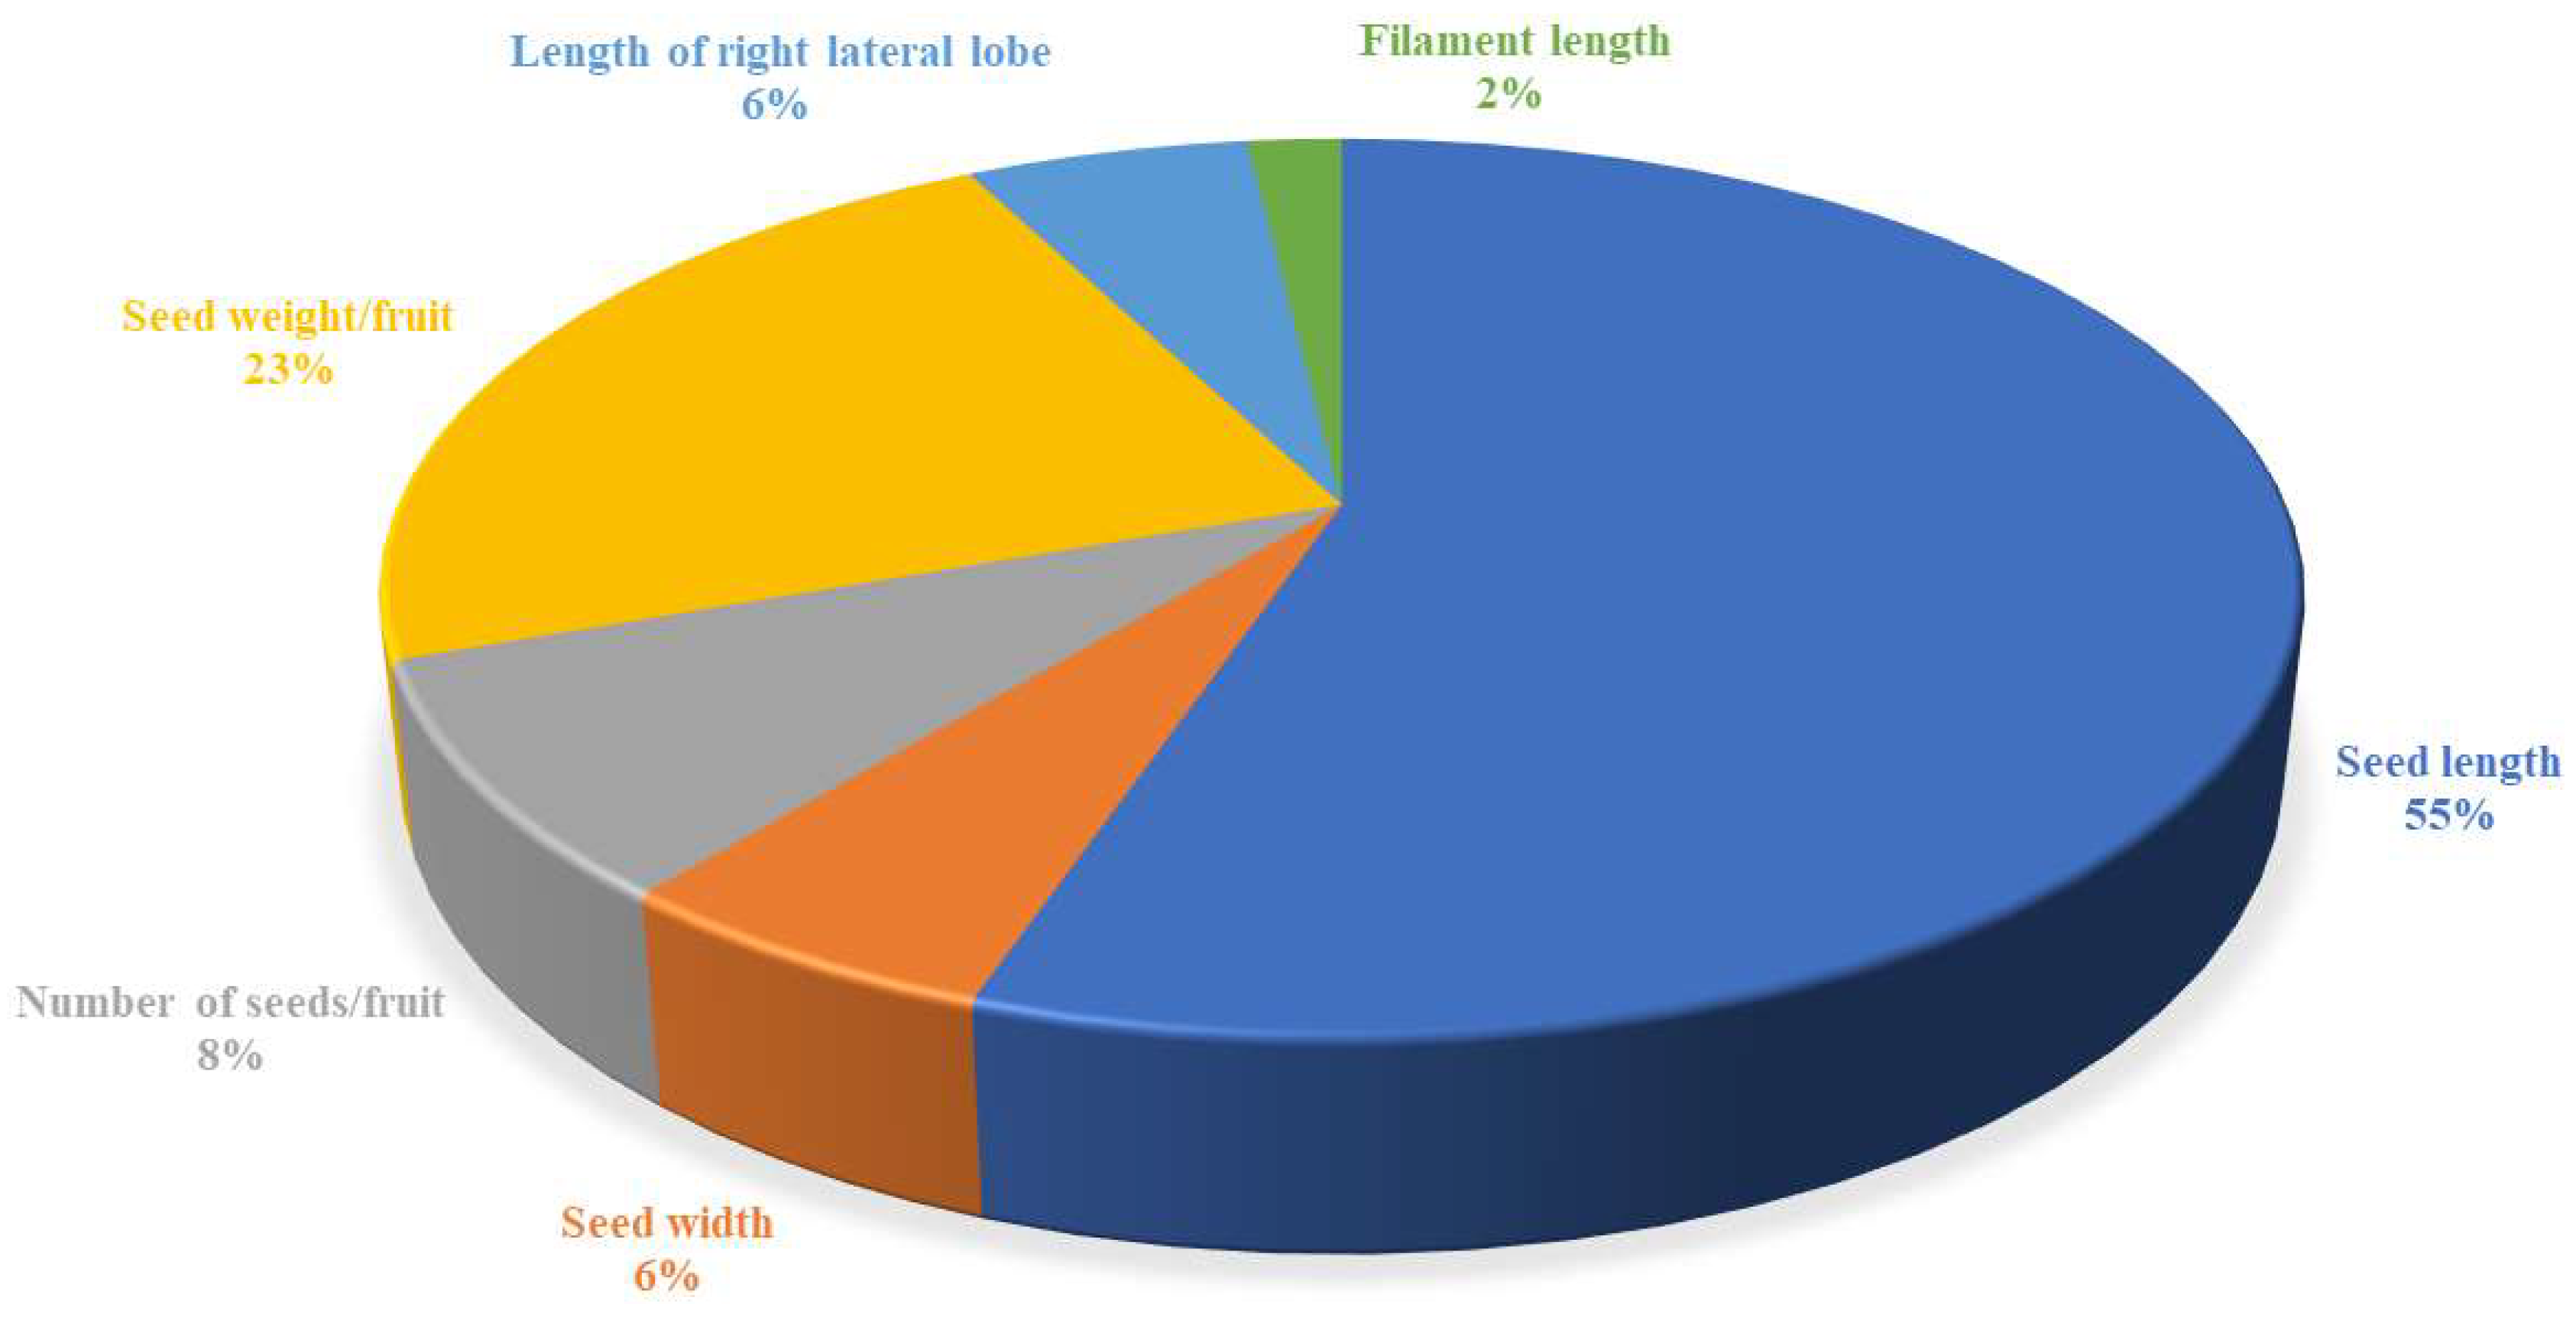
Figure 3.
Maximum percentage contributions of biochemical characters towards diversity.
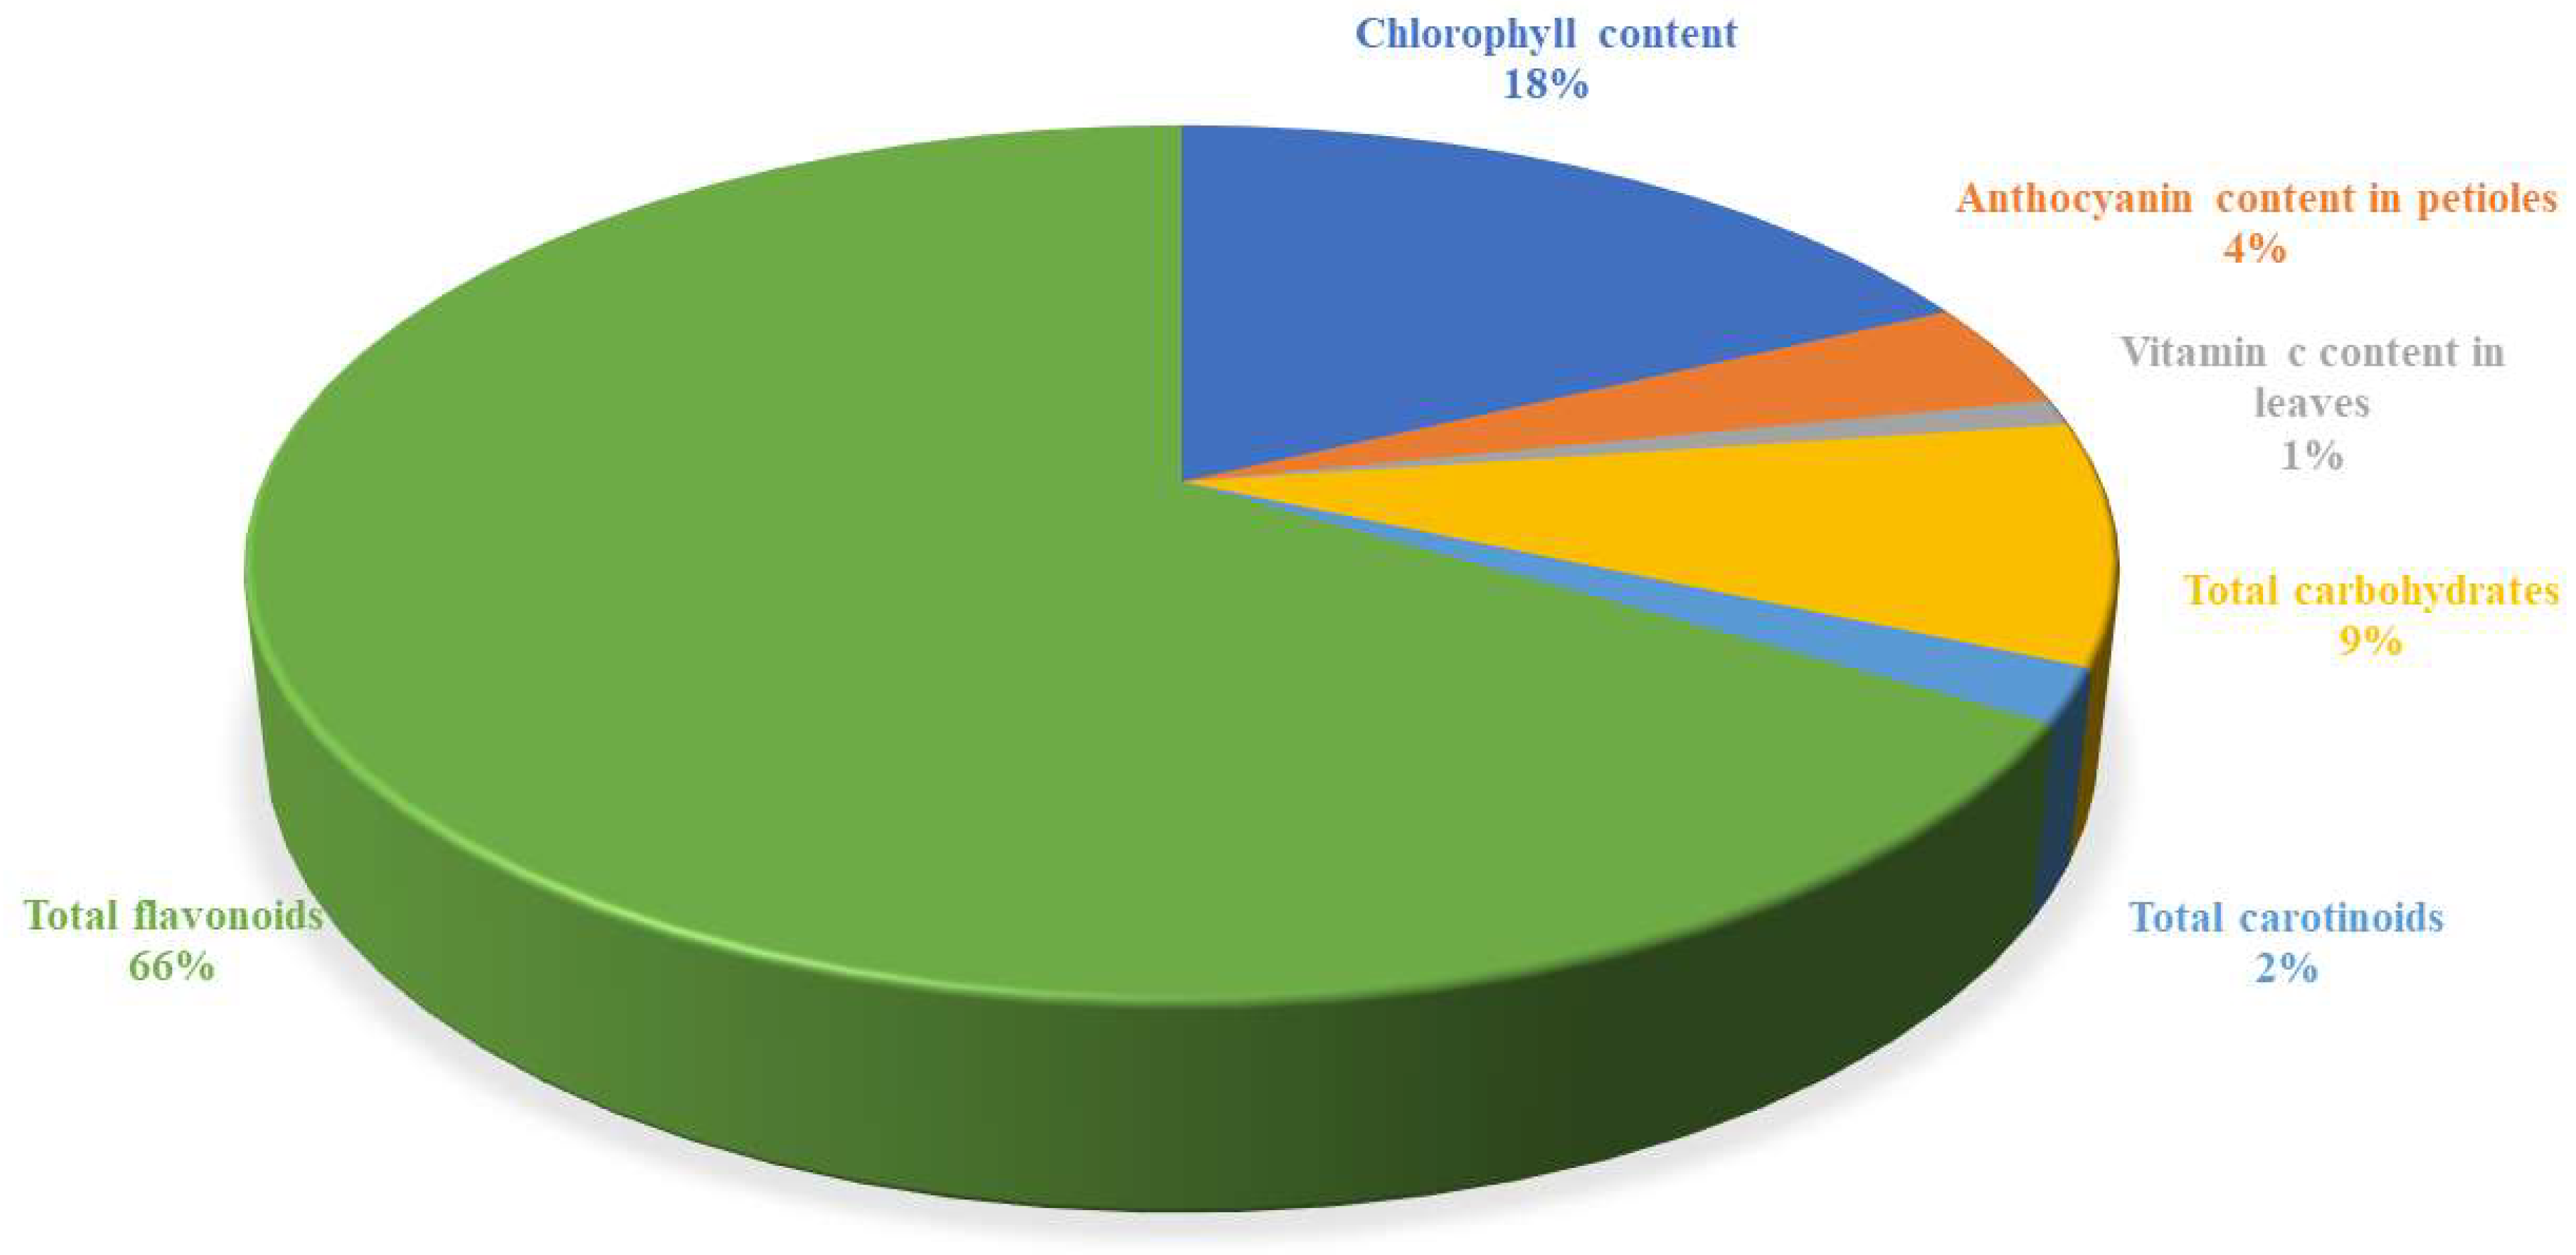
Figure 4.
Seed protein profiling of 15 genotypes of passion fruit under study.
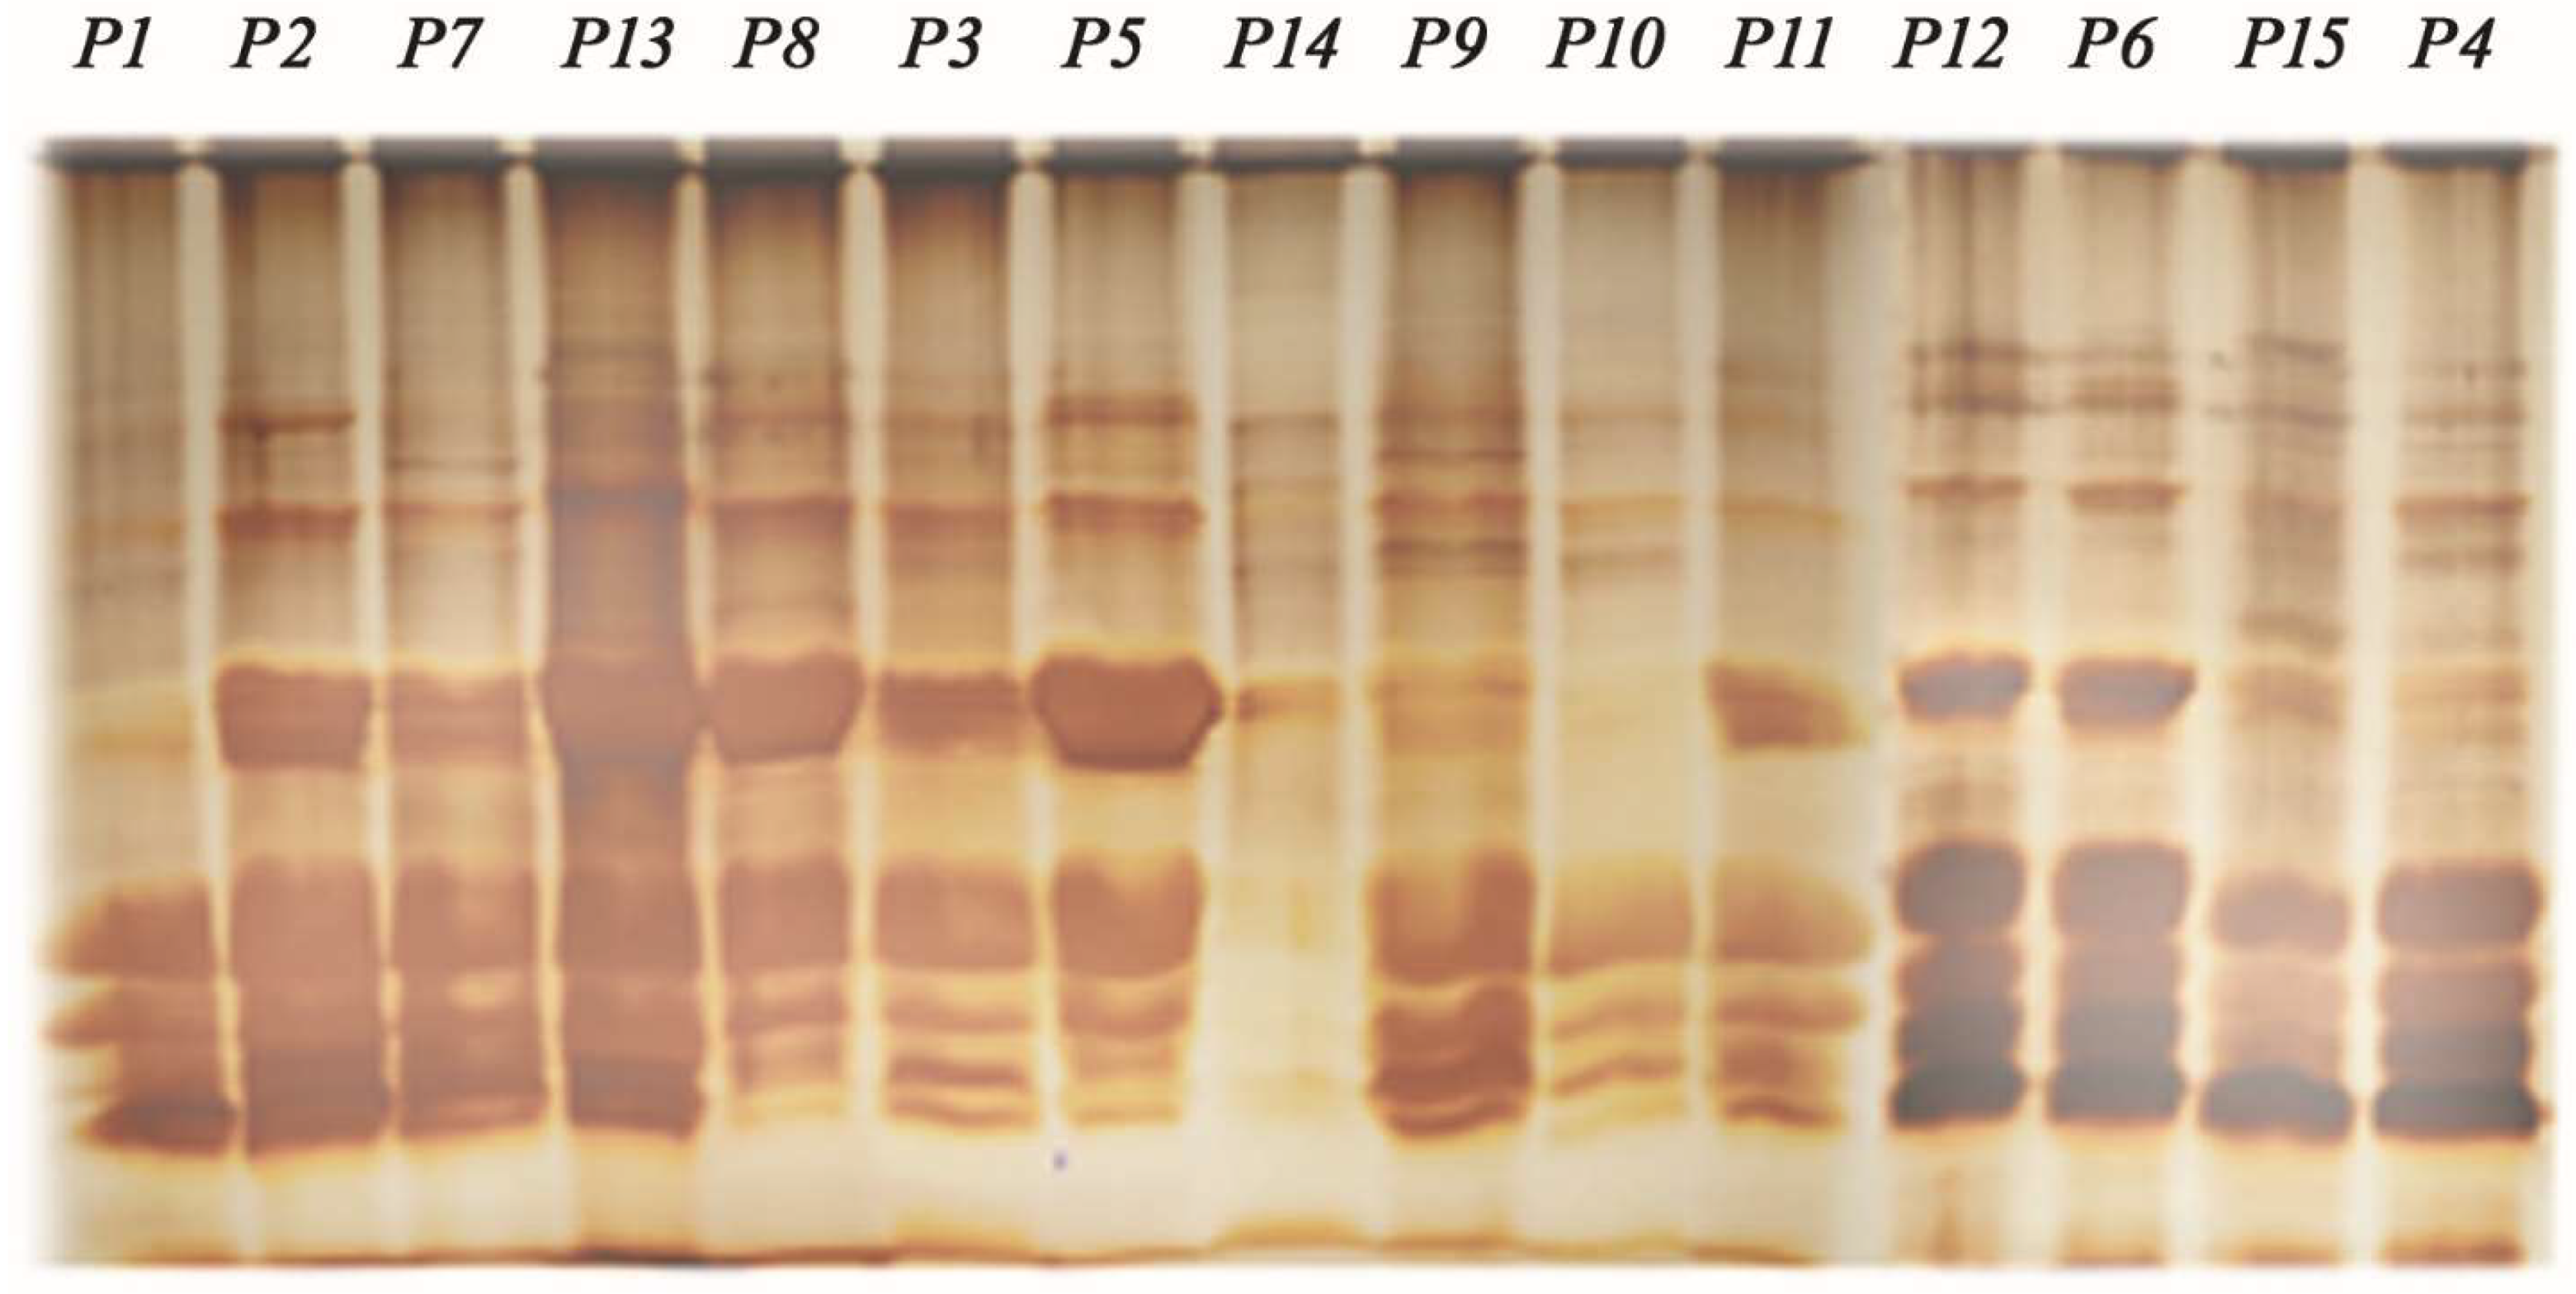
Figure 5.
Dendrogram using ward linkage of seed protein of fifteen passion fruit genotypes.
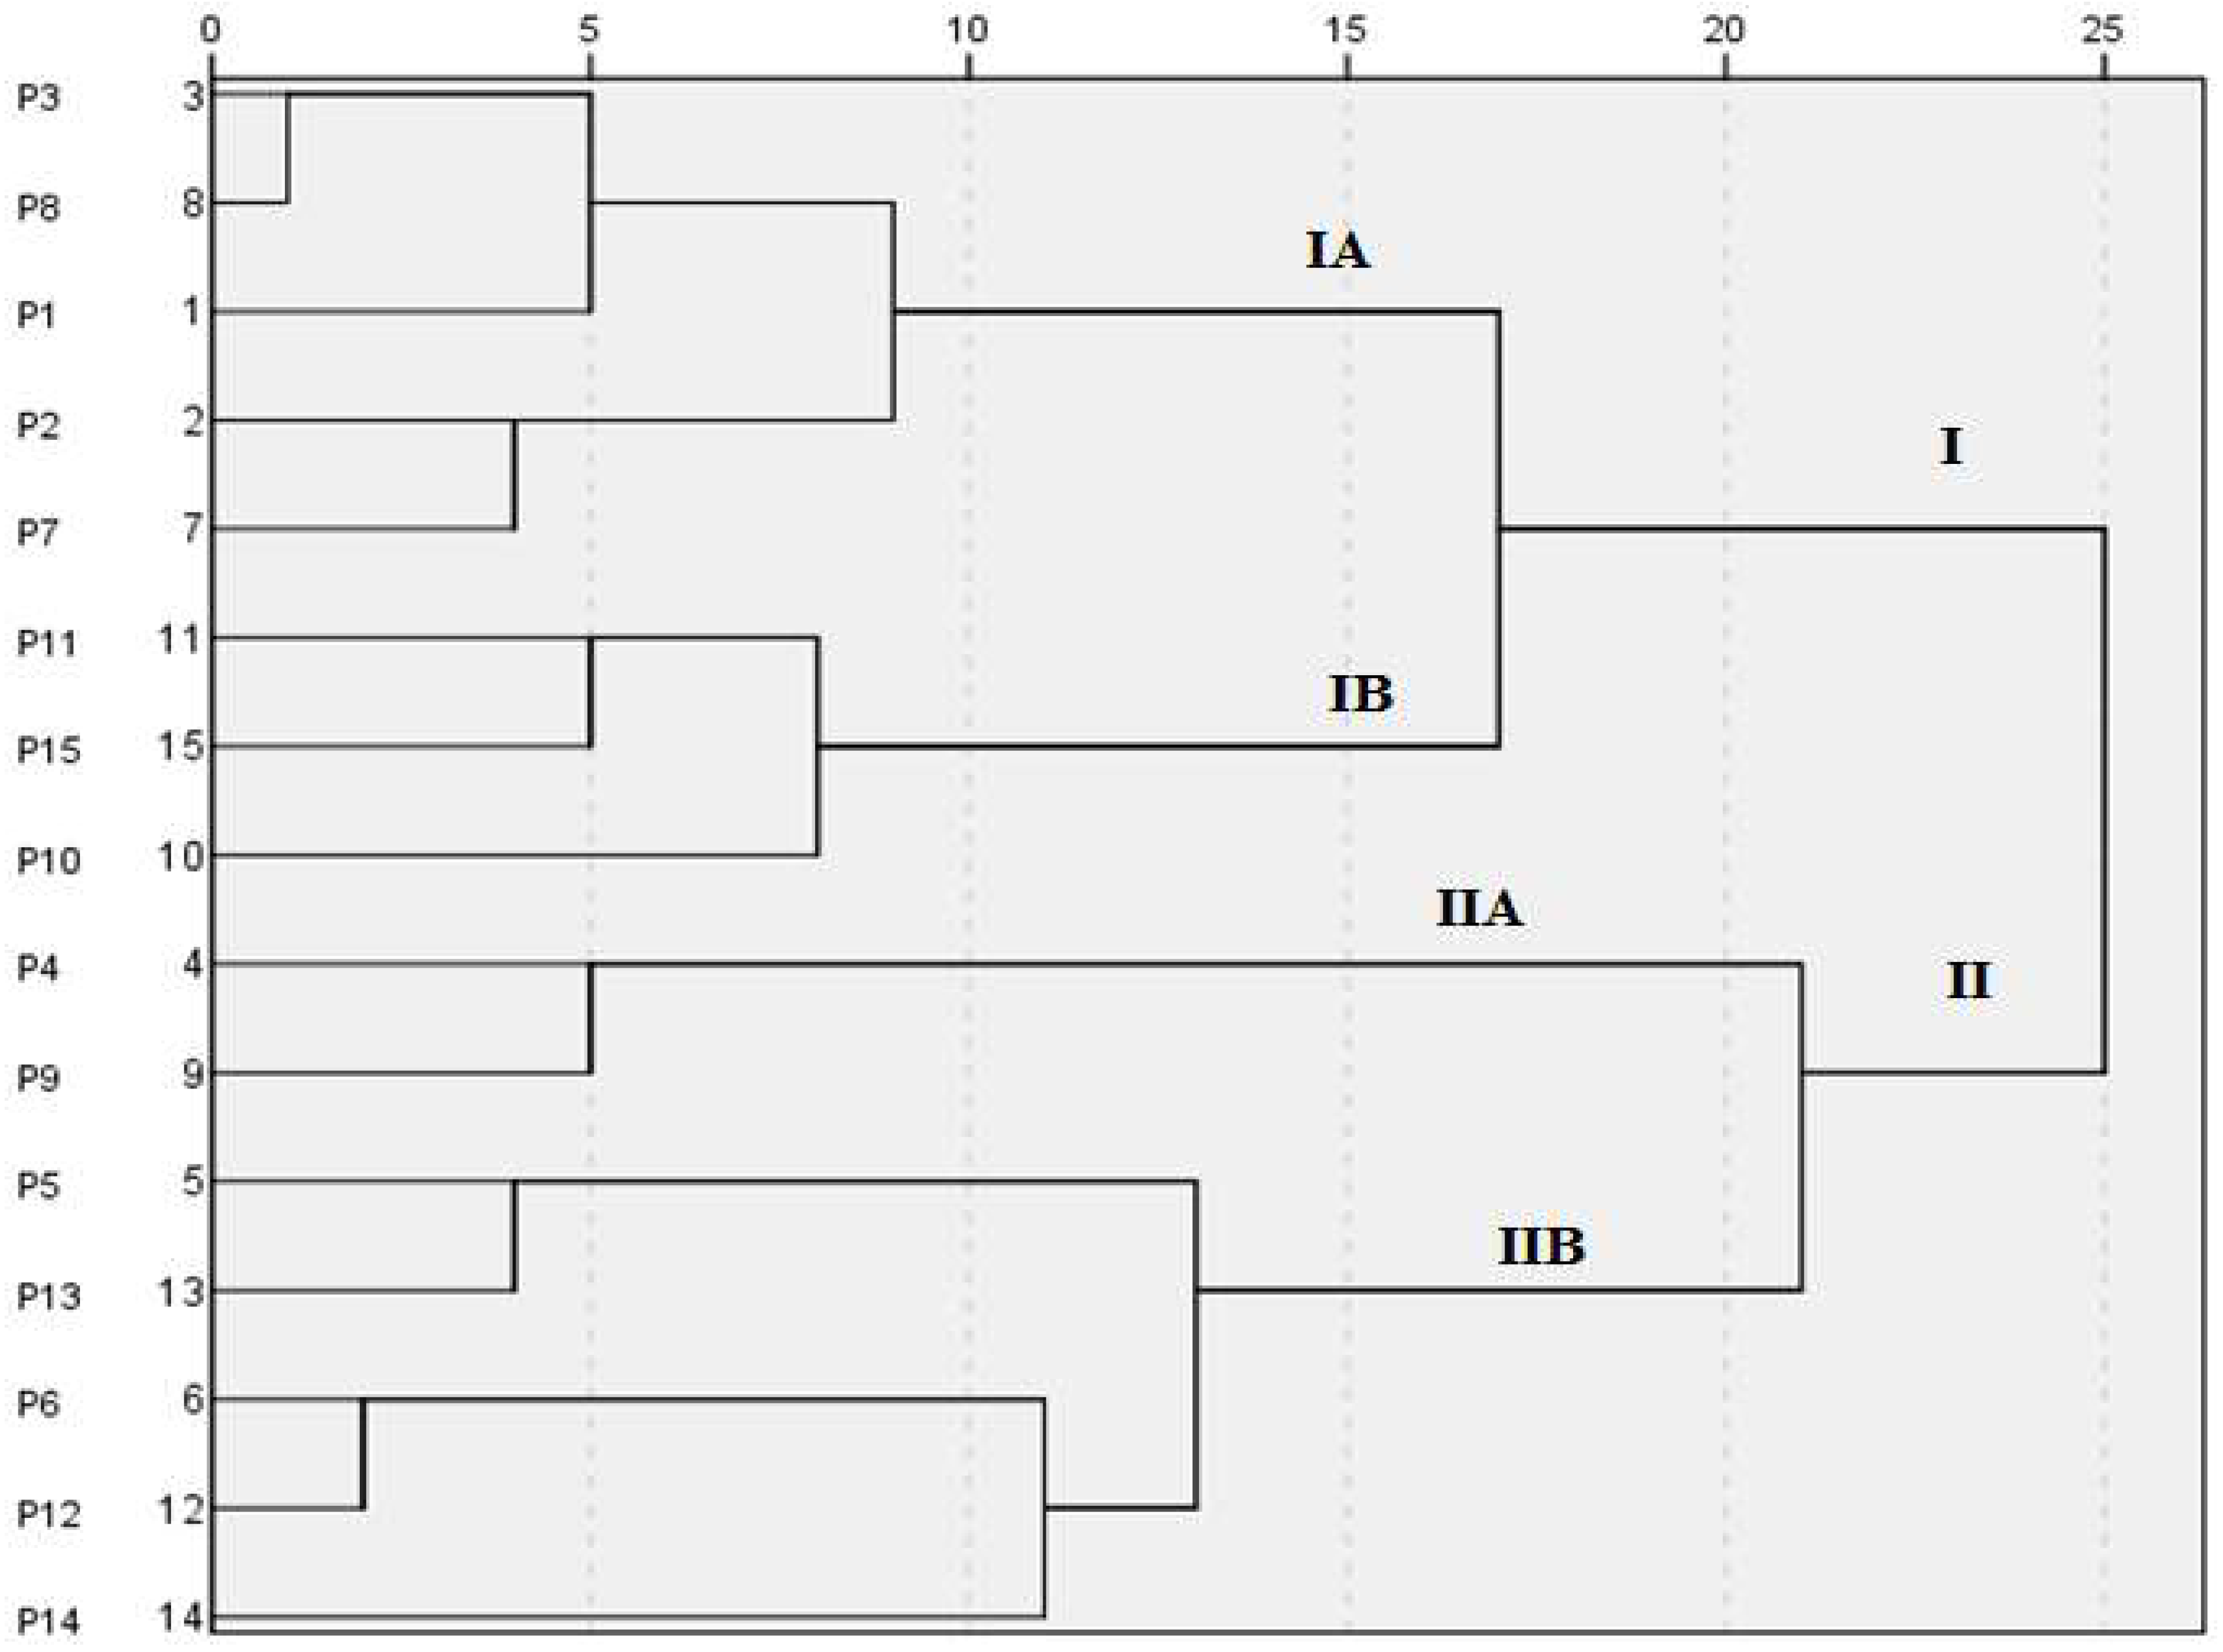
Figure 6.
Correlation study of morphological traits.
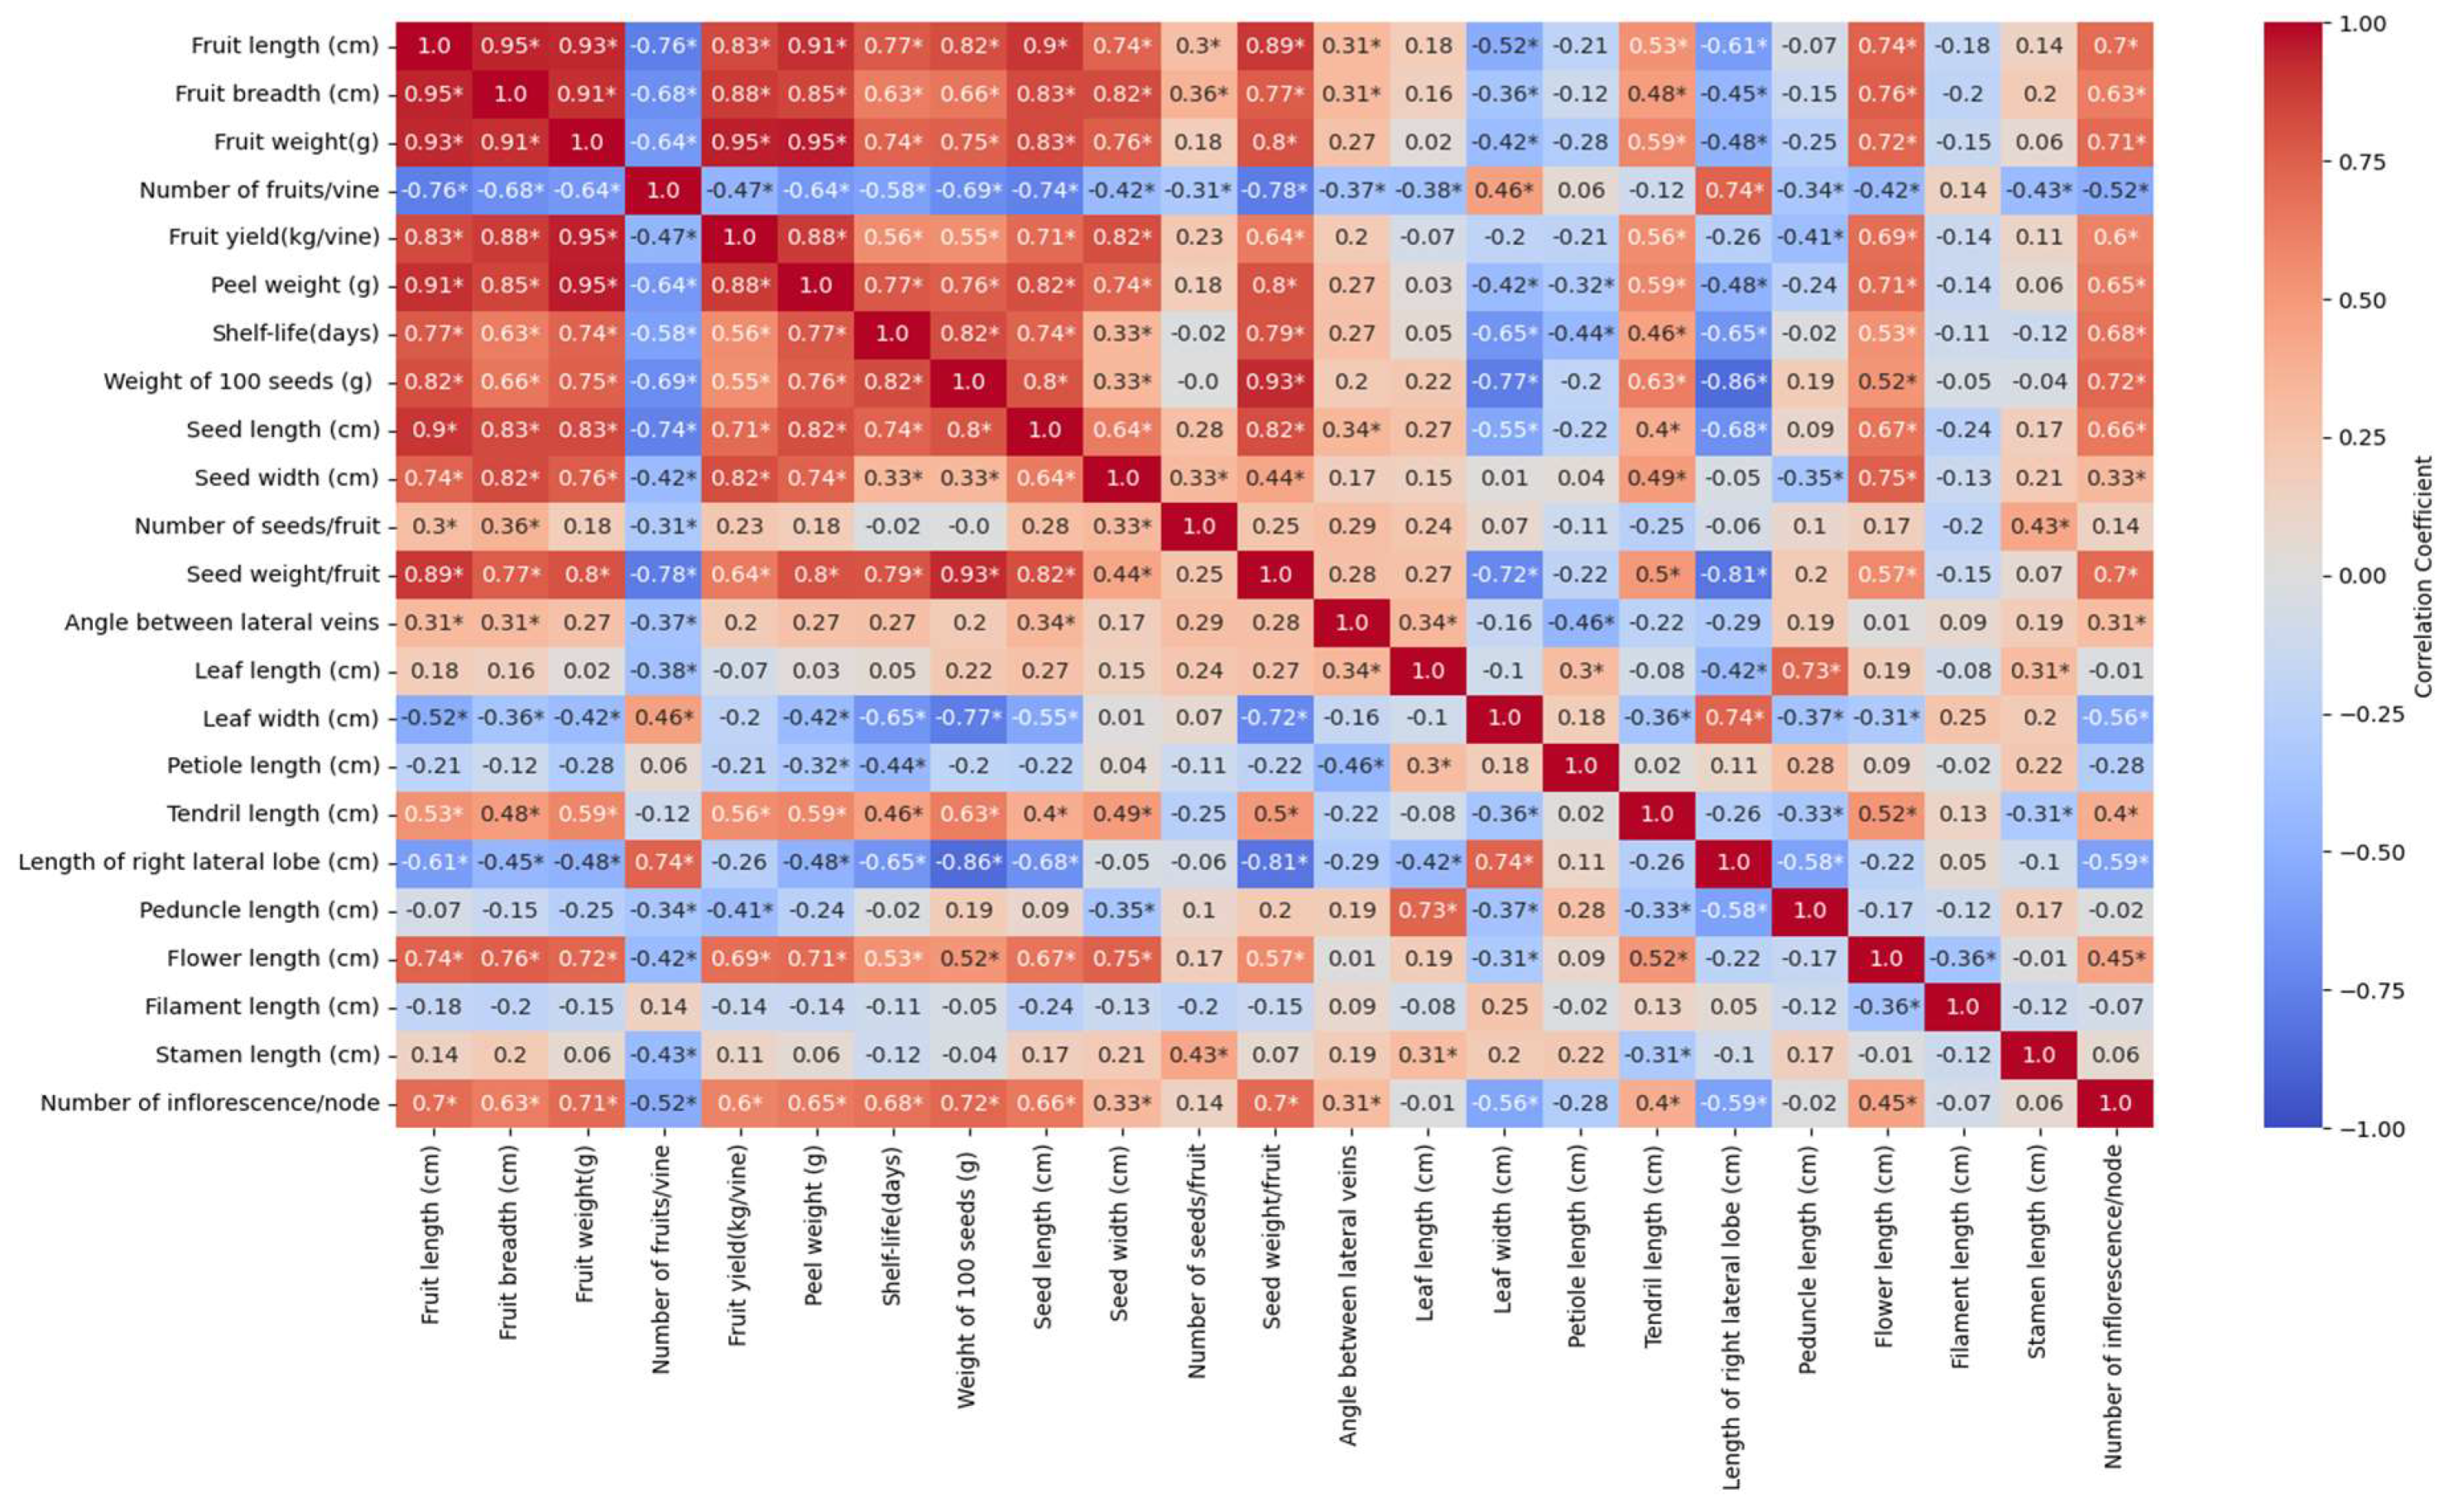
Figure 7.
Correlation study of biochemical traits.
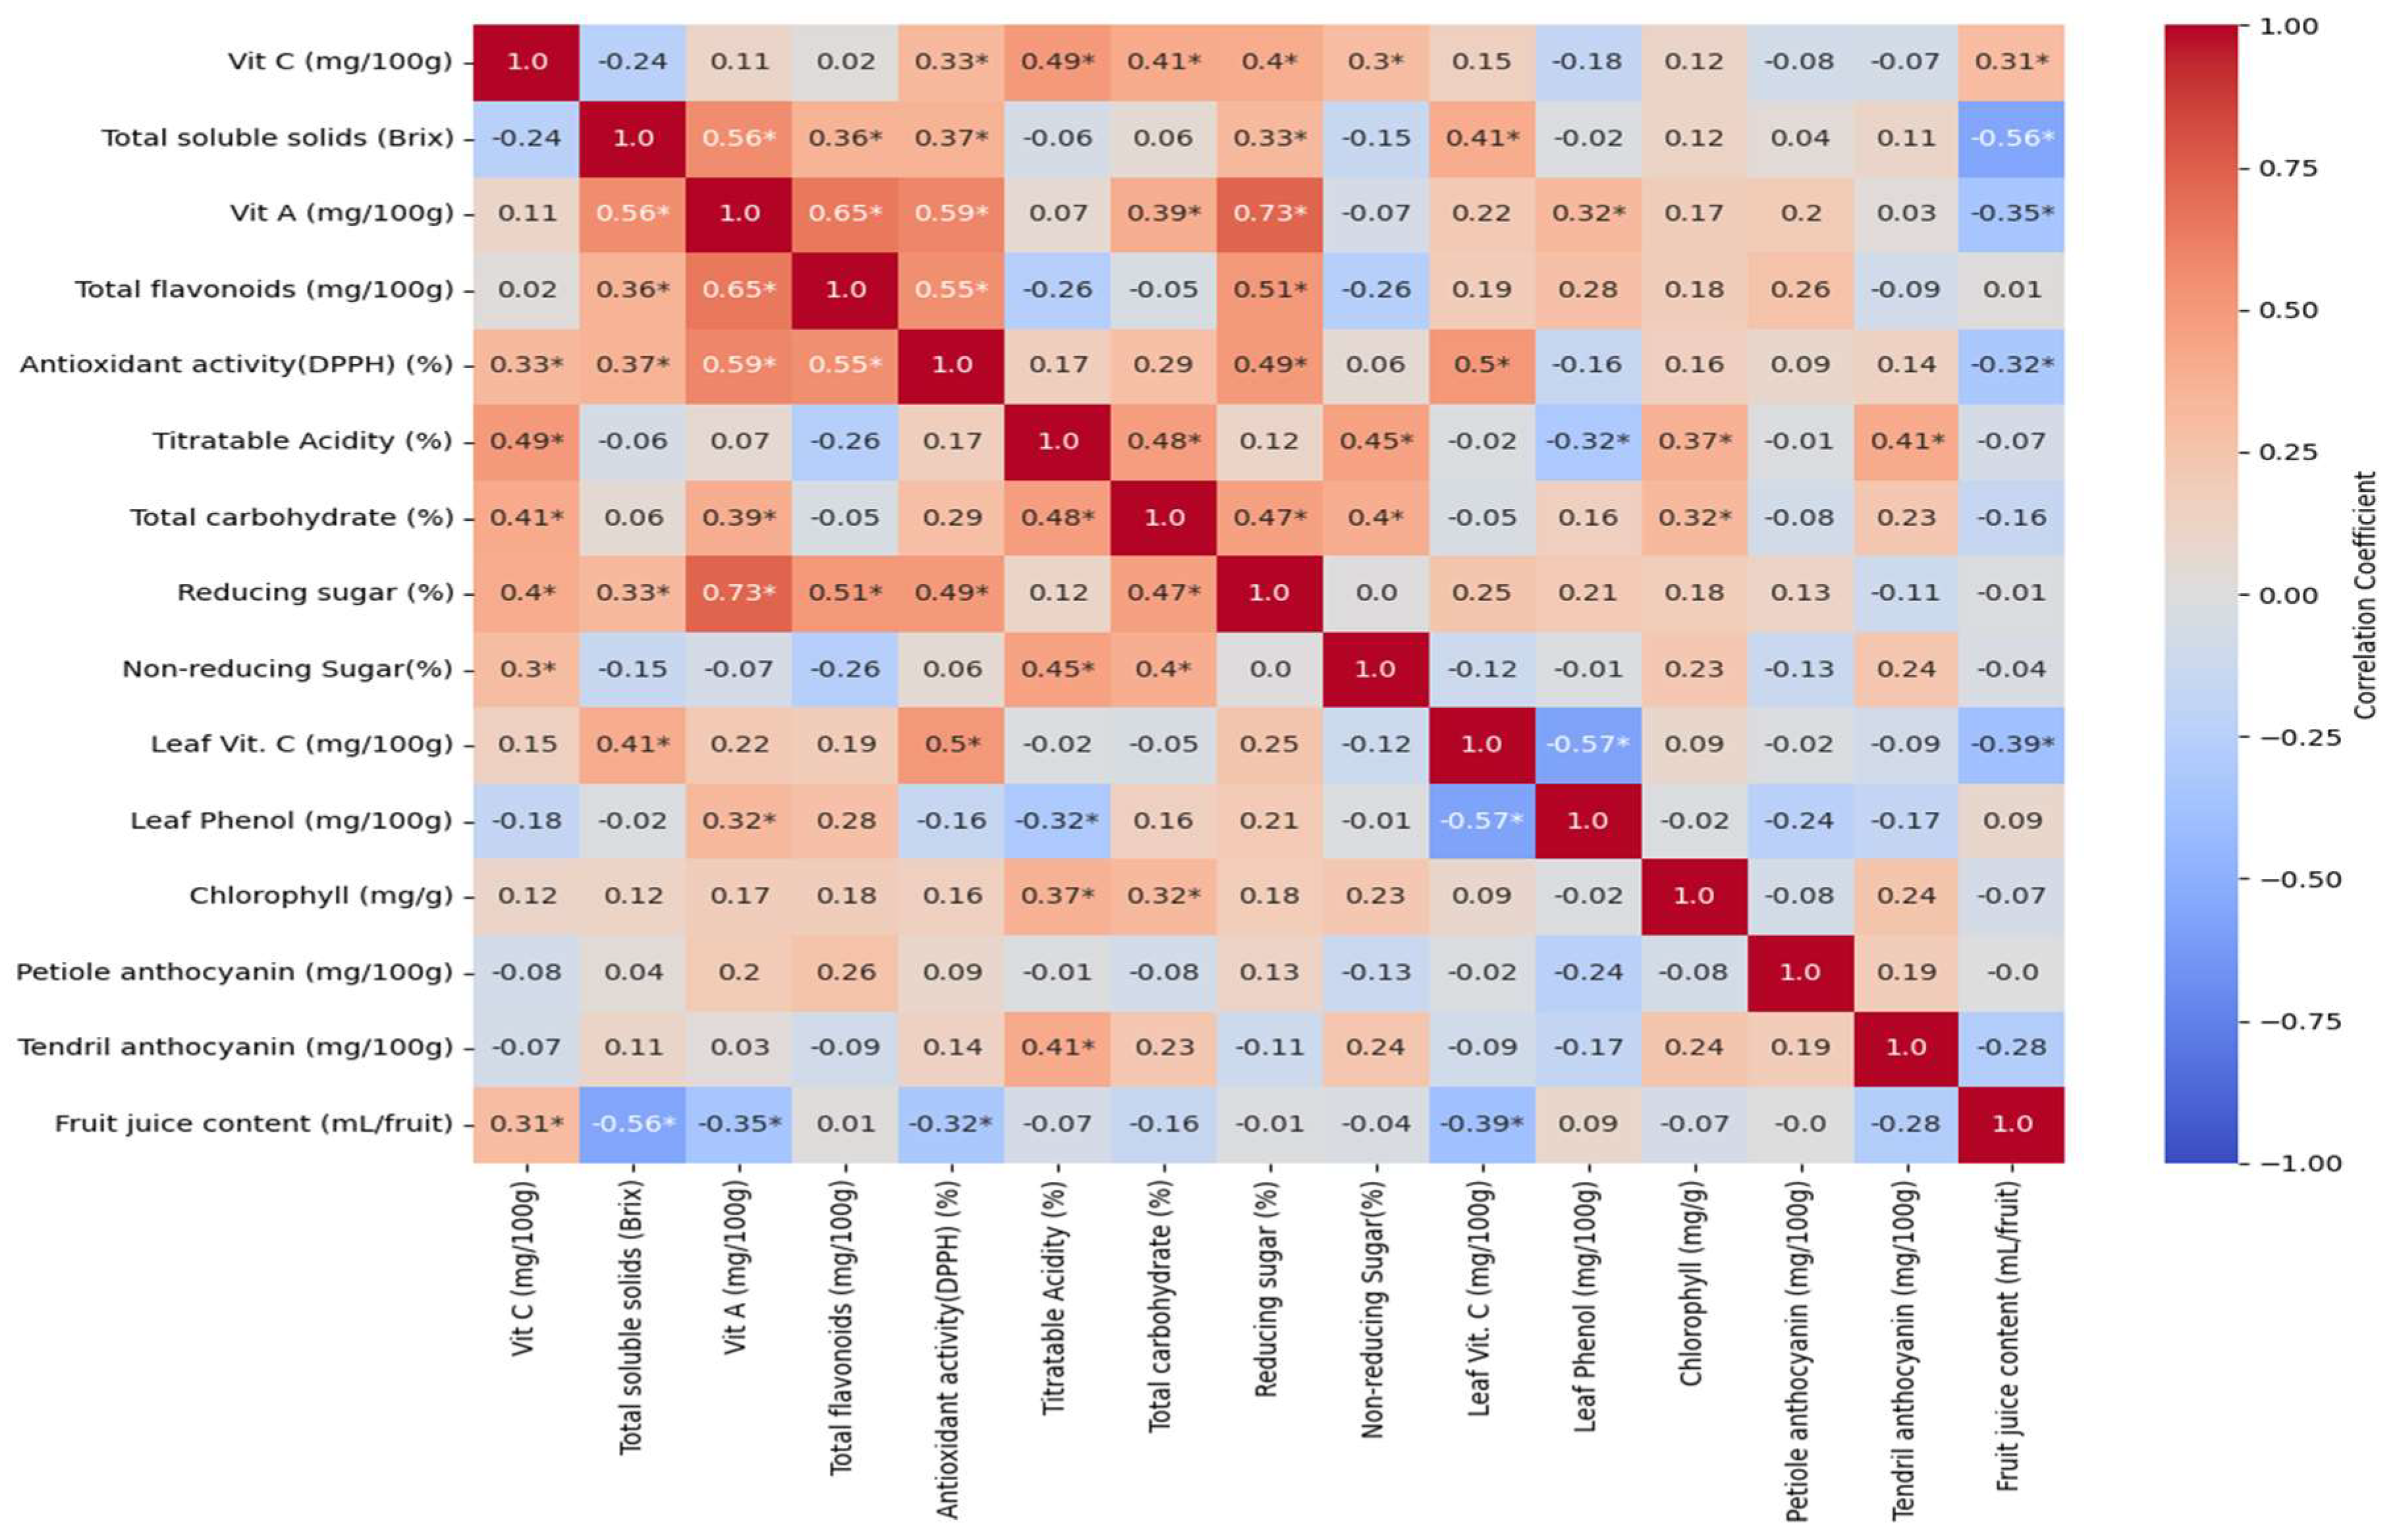
Figure 8.
Principal component analysis for morphological traits.
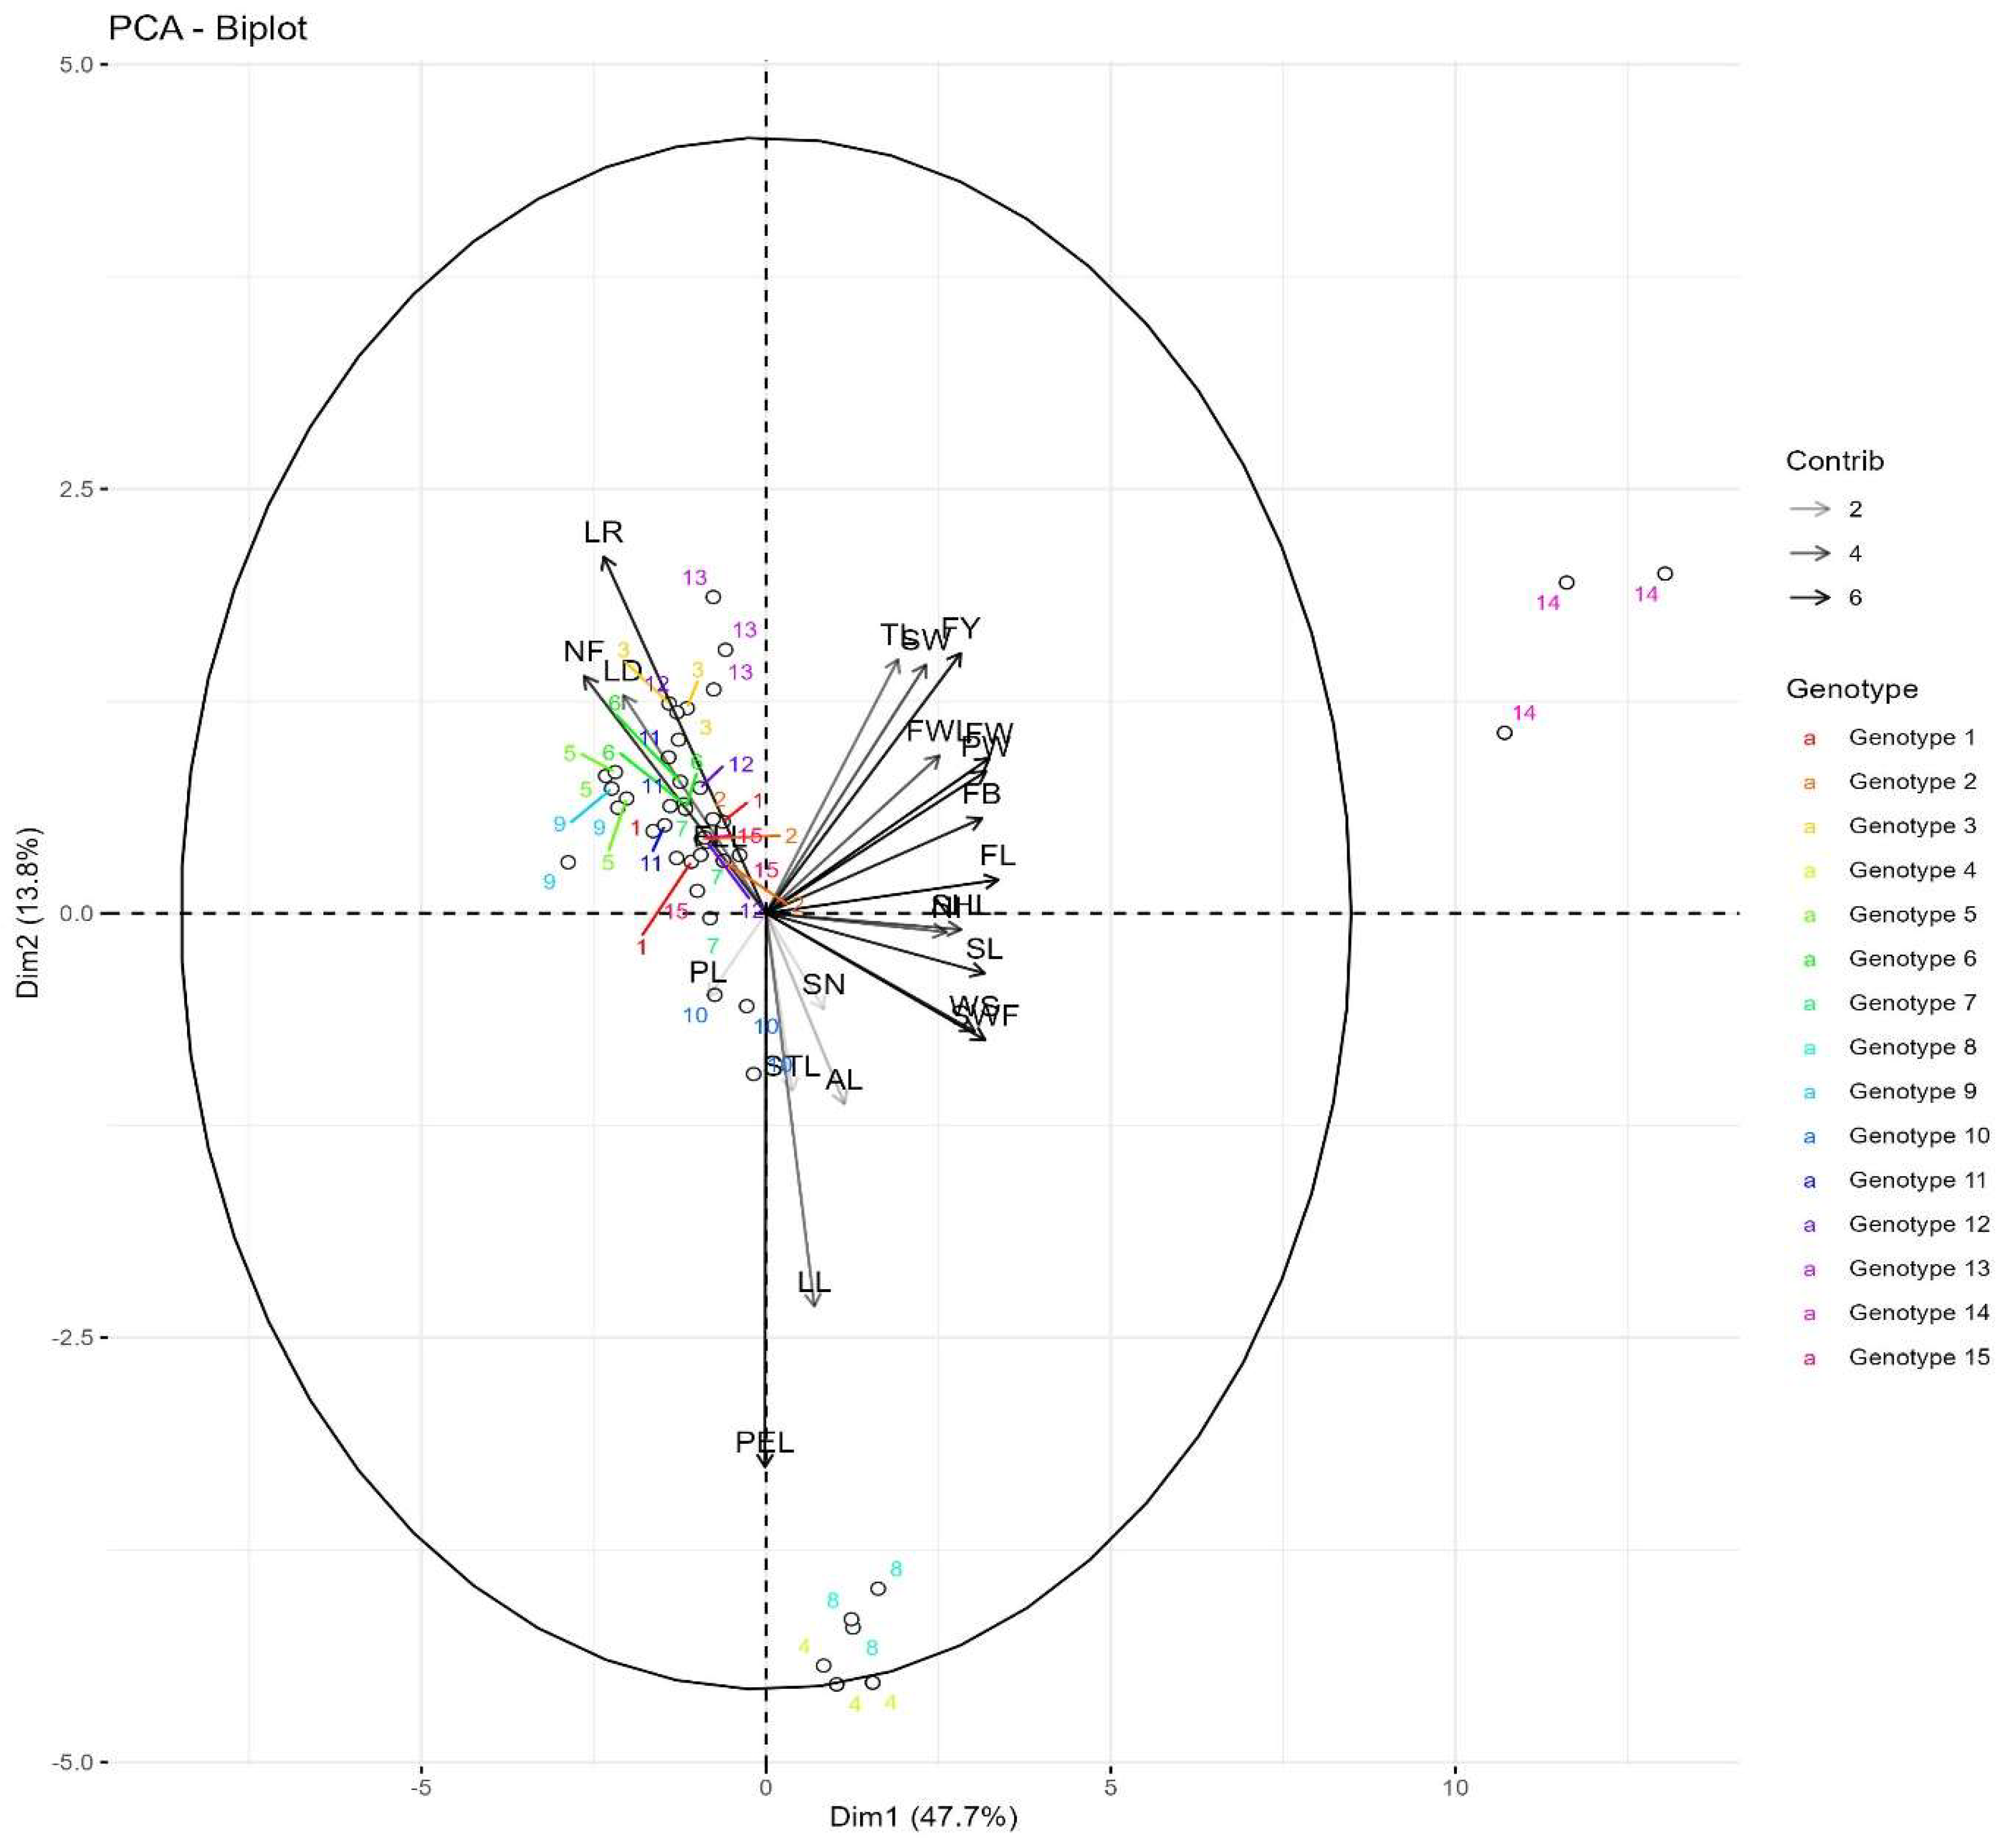
Figure 9.
Principal component analysis for biochemical traits.
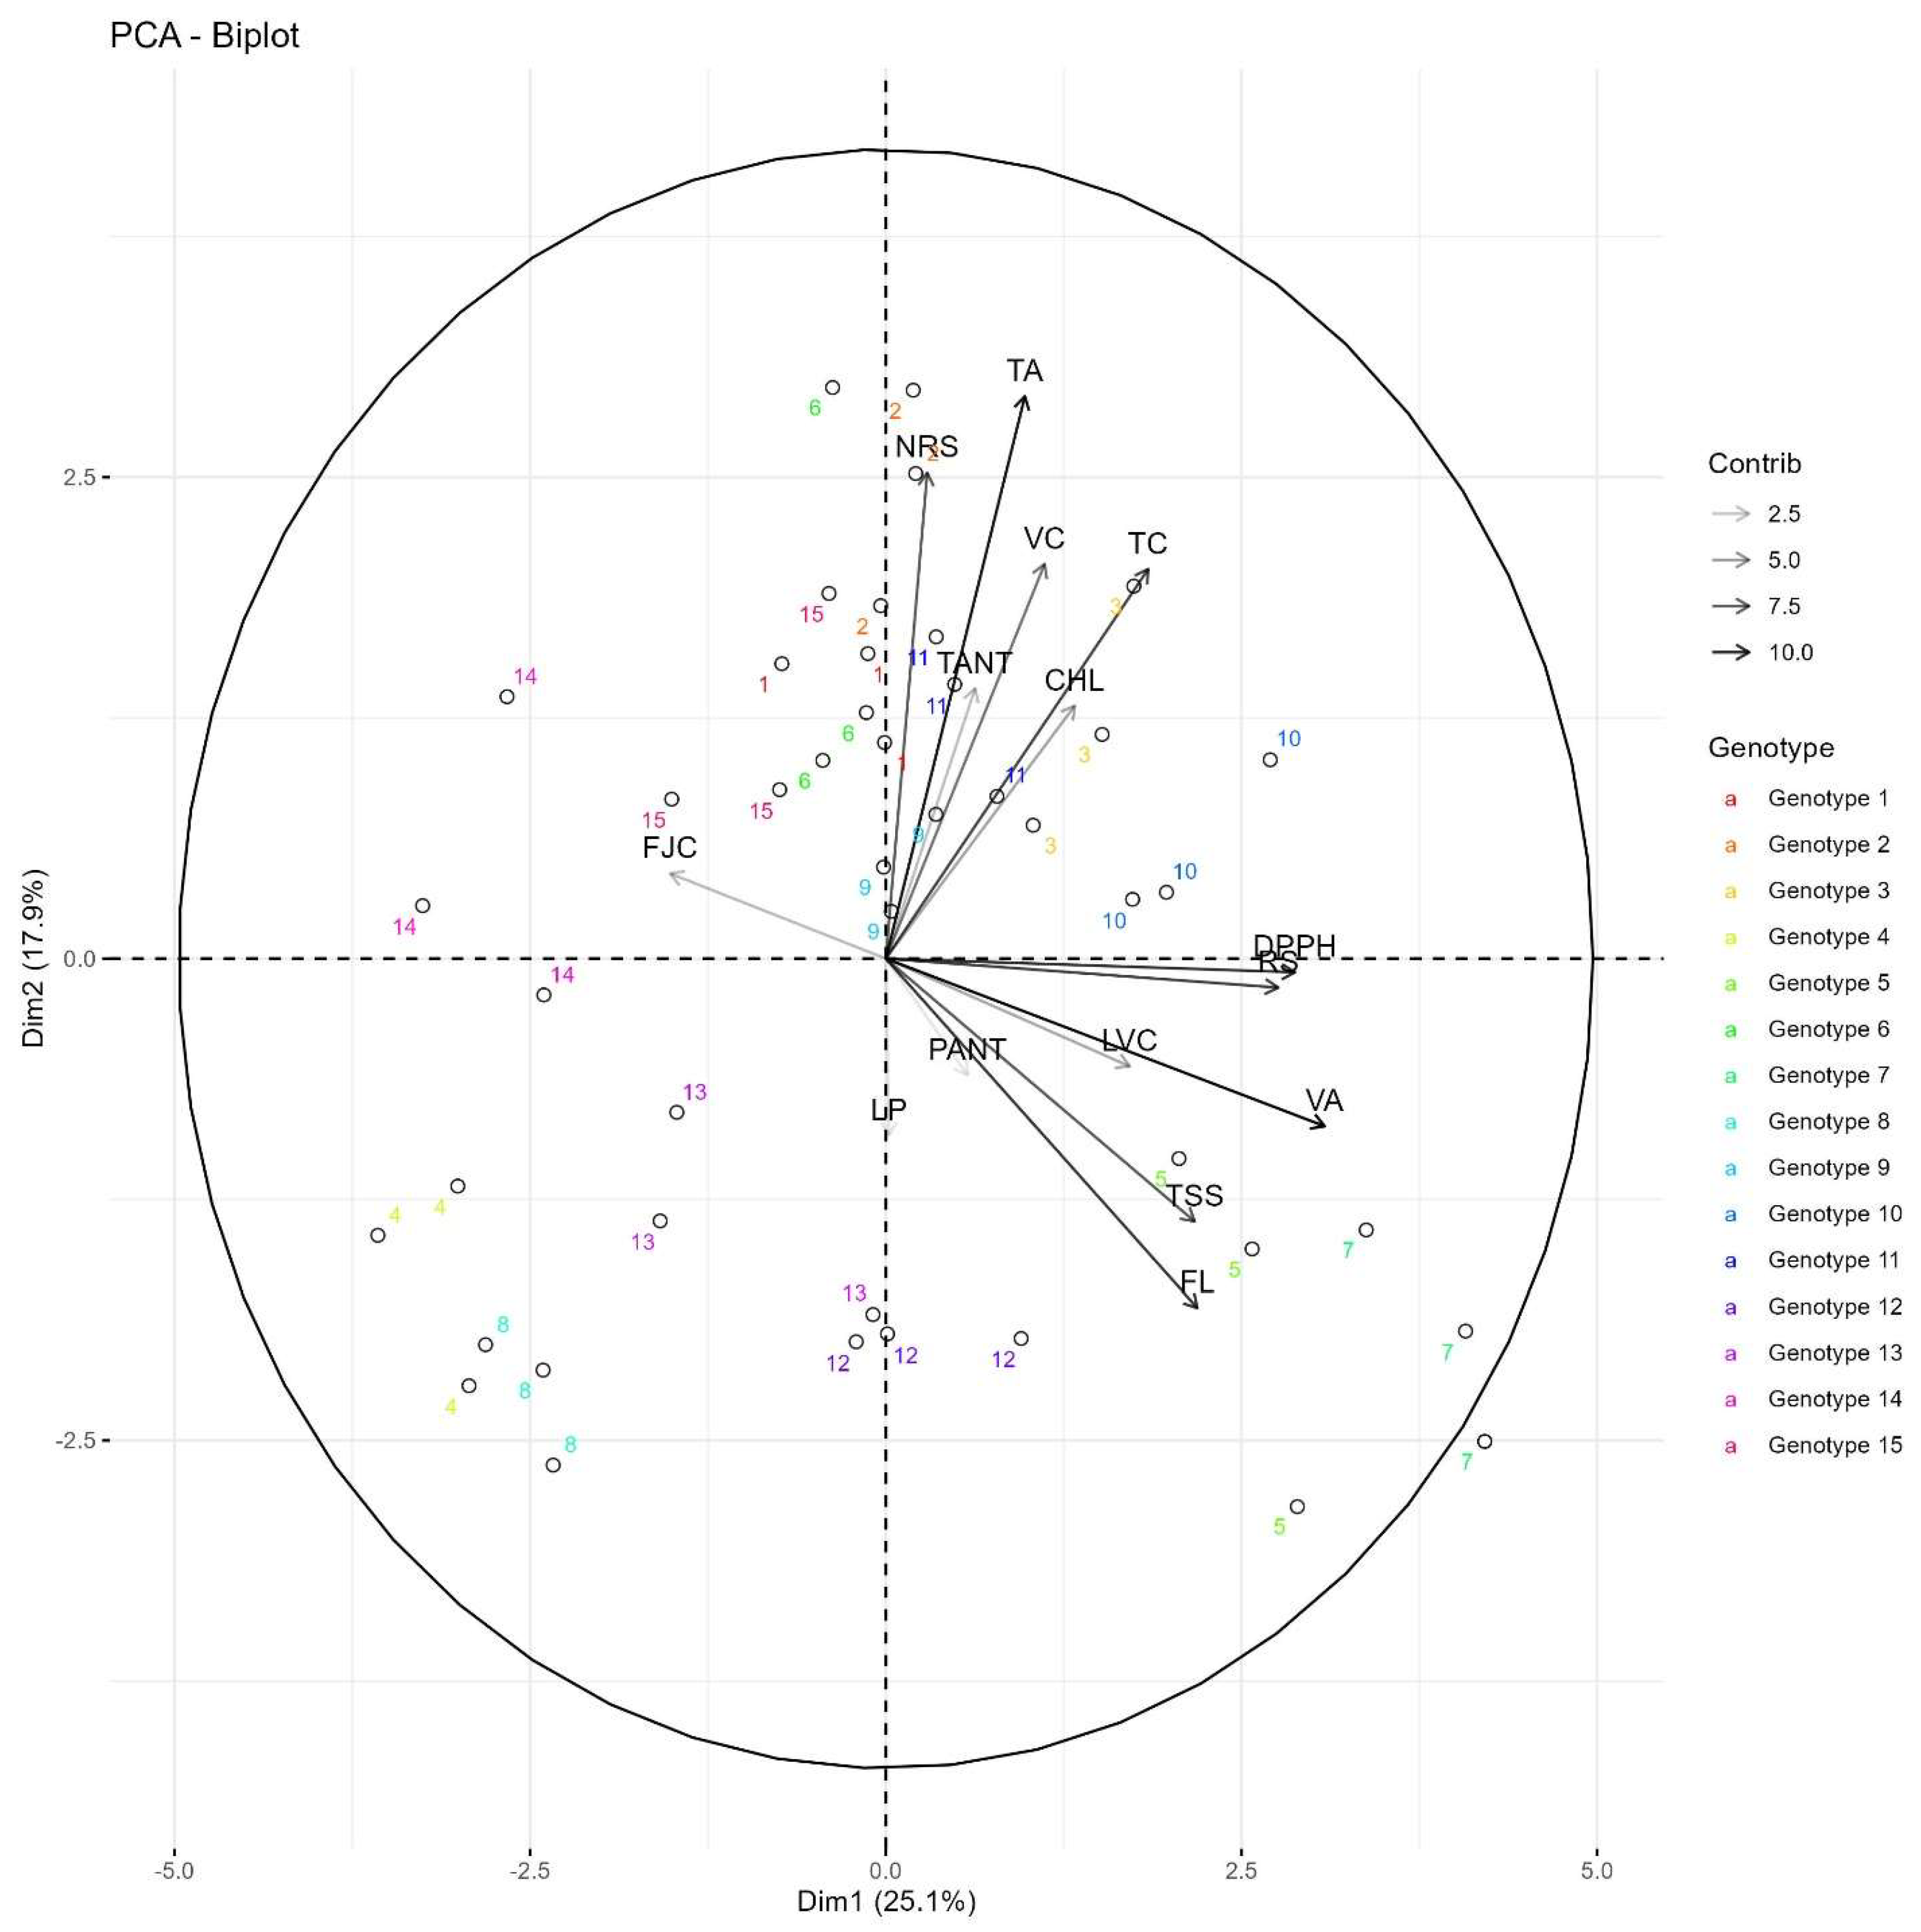

Table 1.
List of Passifora edulis f. flavicarpa Deg, Passifora edulis Sim, Passifora ligularis Juss, and Passifora quadrangularis L and their sources.
Table 1.
List of Passifora edulis f. flavicarpa Deg, Passifora edulis Sim, Passifora ligularis Juss, and Passifora quadrangularis L and their sources.
| Species | Code | Sources | Latitude (N) | Longitude (E) | Altitude |
| P. edulis f. flavicarpa Deg | P1 | Andro, Manipur | 24⁰73' | 94⁰04' | 815 m |
| P. edulis f. flavicarpa Deg | P2 | West Imphal, Manipur | 24⁰47' | 93⁰58' | 906 m |
| P. edulis f. flavicarpa Deg | P3 | Sutamura, west Tripura, Tripura | 23⁰62' | 91⁰26' | 20 m |
| P. edulis f. flavicarpa Deg | P4 | College of Agriculture, Biswanath Cherali, Assam |
26⁰43' | 93⁰08' | 82 m |
| P. edulis f. flavicarpa Deg | P5 | Notun Basti, Dimapur, Nagaland | 25⁰55' | 93⁰43' | 154 m |
| P. edulis f. flavicarpa Deg | P6 | CHF, Pasighat, Arunachal Pradesh | 28⁰04' | 95⁰19' | 162 m |
| P. edulis Sim | P7 | Kangpokpi, Manipur | 24⁰42' | 93⁰46' | 1510 m |
| P. edulis Sim | P8 | ICAR-NOFRI, East Sikkim | 27⁰17' | 88⁰36' | 882 m |
| P. edulis Sim | P9 | Aizawl, Mizoram | 23⁰43' | 92⁰44' | 786 m |
| P. edulis Sim | P10 | CHF, Campus, Pasighat, Arunachal Pradesh | 28⁰04' | 95⁰19' | 168 m |
| P. edulis Sim | P11 | Ziro, Lower Subansiri, Arunachal Pradesh | 27⁰32' | 93⁰48' | 1566 m |
| P. edulis Sim | P12 | Pasighat, Arunachal Pradesh | 28⁰03' | 95⁰20' | 154 m |
| P. ligularis Juss | P13 | Lunghar Village, Ukhrul, Manipur | 25⁰16' | 94⁰42' | 1633 m |
| P. ligularis Juss | P14 | Sakhabama, Kohima, Nagaland |
25⁰39' | 94⁰11' | 1077 m |
| P. quadrangularis L. | P15 | Pasighat, Arunachal Pradesh | 28⁰03' | 95⁰20' | 156 m |
Table 2.
Quality parameters studied following standard protocol.
| Plant Part | Characters | References |
| Leaf | I.Anthocyanin content (mg/100 g) | [37] |
| II.Vitamin C content (mg/100 g) | [37] | |
| III.Phenol content (mg/100 g) | [31] | |
| IV.Chlorophyll content (mg/g) | [38] | |
| Petiole | V.Anthocyanin content (mg/100 g) | [37] |
| Tendril | VI.Anthocyanin content (mg/100 g) | |
| Fruit | VII.Vitamin C (mg/100 g) | [37] |
| VIII.Total Soluble Solids (°Brix) | Hand refractometer | |
| IX.Total carotenoid (mg/100 g) | [30] | |
| X.Total flavonoids (mg/100 g) | [31] | |
| XI.Antioxidant activity (DPPH) (%) | [32] | |
| XII.Titratable acidity (%) | [33] | |
| XIII.Total carbohydrates (%) | [34] | |
| XIV.Reducing sugar (%) | [35] | |
| XV.Non-reducing sugar (%) | [36] |
Table 3.
The formulation for 15% acrylamide separating gel, 5% acrylamide stacking gel and sample preparation.
Table 3.
The formulation for 15% acrylamide separating gel, 5% acrylamide stacking gel and sample preparation.
| formulation for 15% acrylamide separating gel | formulation for 5% acrylamide stacking gel | |
| Water | 6.9 mL | 5.5 mL |
| 30% Acrylamide mixture | 15 mL | 1.3 mL |
| Separating gel buffer (1.5M Tris-HCl, pH 8.8) | 7.5 mL | 1.0 mL |
| 2% SDS | 0.3 mL | 0.1 mL |
| 10% Ammonium persulphate | 0.3 mL | 0.1 mL |
| TEMED | 0.012 mL | 0.008 mL |
| Sample preparation | ||
| 0.6 M Tris-HCl | 5.0 mL | |
| 1% SDS | 0.5 g | |
| 0.5% Bromophenol blue solution | 5 mL | |
| 10% sucrose | 5.0 g | |
Table 4.
Morphological characters of fifteen genotypes of Passiflora edulis f. flavicarpa Deg, Passiflora edulis Sim, Passiflora ligularis A. Juss and Passiflora quadrangularis L.
Table 4.
Morphological characters of fifteen genotypes of Passiflora edulis f. flavicarpa Deg, Passiflora edulis Sim, Passiflora ligularis A. Juss and Passiflora quadrangularis L.
| Species | Code | Angle between lateral veins (°) | Leaf length (cm) | Leaf width (cm) | Petiole length (cm) | Tendril length (cm) | Length of right lateral lobe (cm) | Peduncle length (cm) | Flower length (cm) | Filament length (cm) | Stamen length (cm) | Number of flowers per node |
| P. edulis f. flavicarpa Deg | P1 | 63.38ab | 12.56bc | 16.07a | 2.21bc | 13.39g | 7.17a | 3.27de | 6.93d | 0.83d | 1.80abc | 1.00b |
| P. edulis f. flavicarpa Deg | P2 | 63.02ab | 12.21bcd | 15.56ab | 1.94cd | 12.70g | 7.03ab | 3.20de | 6.87d | 0.80d | 1.77abcd | 1.00b |
| P. edulis f. flavicarpa Deg | P3 | 59.70abc | 11.23cdef | 14.10bcd | 1.78de | 16.13e | 6.90b | 3.27de | 5.60i | 0.83d | 1.63abcde | 1.00b |
| P. edulis f. flavicarpa Deg | P4 | 63.38ab | 12.70b | 15.67ab | 2.22bc | 20.23c | 5.90de | 3.10de | 5.60i | 1.37a | 2.02a | 1.00b |
| P. edulis f. flavicarpa Deg | P5 | 57.21bc | 10.20f | 12.68de | 1.76de | 14.57f | 6.60c | 3.07de | 6.73d | 0.83d | 1.50bcdef | 1.00b |
| P. edulis f. flavicarpa Deg | P6 | 42.24d | 11.27cdef | 14.80abc | 3.02a | 22.40b | 5.80e | 3.23de | 7.40c | 0.90cd | 1.67abcde | 1.00b |
| P. edulis Sim | P7 | 58.32abc | 10.68ef | 13.24cde | 1.73de | 20.54c | 5.43g | 2.93de | 6.30e | 1.13b | 0.70h | 1.00b |
| P. edulis Sim | P8 | 57.12bc | 10.86def | 13.92bcd | 1.79de | 19.13d | 5.27h | 3.30d | 5.93fgh | 1.13b | 0.80gh | 1.00b |
| P. edulis Sim | P9 | 57.10bc | 10.66def | 13.80bcd | 1.75de | 19.11d | 5.19h | 3.27d | 5.81fgh | 1.11b | 0.78gh | 1.00b |
| P. edulis Sim | P10 | 57.97abc | 15.13a | 12.07ef | 2.49b | 22.13b | 6.00d | 5.07c | 7.73b | 0.80d | 1.12fgh | 1.00b |
| P. edulis Sim | P11 | 54.07c | 10.41f | 12.64de | 1.96cd | 20.00c | 5.40gh | 2.93de | 5.77hig | 0.67e | 1.28def | 1.00b |
| P. edulis Sim | P12 | 58.79abc | 10.42f | 13.28cde | 1.89cde | 19.20d | 5.30gh | 2.87e | 5.87fgh | 1.13b | 1.39cdef | 1.00b |
| P. ligularis Juss | P13 | 62.17ab | 14.45a | 10.51fg | 2.42b | 14.27f | 0.00i | 7.23a | 6.00f | 0.97c | 1.57abcdef | 1.67c |
| P. ligularis Juss | P14 | 63.55ab | 14.38a | 11.58ef | 1.88cde | 16.13e | 0.00i | 6.43b | 5.97fg | 0.83d | 1.97ab | 1.67c |
| P. quadrangularis L. | P15 | 64.52a | 11.95bcde | 9.44g | 1.56e | 28.13a | 0.00i | 2.40f | 9.20a | 0.83d | 1.42cdef | 2.67a |
Table 5.
Morphological characters of fifteen genotypes of Passiflora edulis f. flavicarpa Deg, Passiflora edulis Sim, Passiflora ligularis A. Juss and Passiflora quadrangularis L.
Table 5.
Morphological characters of fifteen genotypes of Passiflora edulis f. flavicarpa Deg, Passiflora edulis Sim, Passiflora ligularis A. Juss and Passiflora quadrangularis L.
| Species | Code | Fruit length (cm) | Fruit breadth (cm) | Fruit weight (g) | Number of fruits per vine | Fruit yield (kg per vine) | Peel weight (g) | Shelf-life (days) | Weight of 100 seeds (g) | Seed length (cm) | Seed width (cm) | Number of seeds per fruit | Seed weight per fruit |
| P. edulis f. flavicarpa Deg | P1 | 6.16cd | 5.33cd | 78.75b | 126.34ef | 9.94bc | 42.85b | 9.33cde | 1.17f | 0.54cd | 0.35b | 146.33bcd | 1.92ef |
| P. edulis f. flavicarpa Deg | P2 | 6.63bc | 6.16b | 65.1b | 138.33de | 9.01bcde | 42.32b | 8.33de | 0.90g | 0.56bc | 0.38b | 231.33a | 2.08def |
| P. edulis f. flavicarpa Deg | P3 | 6.16cd | 5.33cd | 69.98b | 144.00cde | 10.07bc | 43.34b | 6.33e | 1.32f | 0.54cd | 0.35b | 193.00ab | 2.54cdef |
| P. edulis f. flavicarpa Deg | P4 | 6.51bcd | 5.64bc | 77.69b | 118.00f | 9.15bcd | 43.29b | 7.00e | 2.00de | 0.52de | 0.37b | 166.33bcd | 3.03cd |
| P. edulis f. flavicarpa Deg | P5 | 5.95cd | 5.02cd | 45.18b | 128.00ef | 5.78cde | 20.59b | 11.67bcd | 1.95de | 0.52de | 0.18c | 171.00bcd | 3.27c |
| P. edulis f. flavicarpa Deg | P6 | 6.51bcd | 5.64bc | 77.69b | 134.92ef | 10.473b | 47.96b | 6.00e | 2.00de | 0.52de | 0.37b | 152.00bcd | 3.04cd |
| P. edulis Sim | P7 | 5.95cd | 5.02cd | 45.18b | 166.67ab | 7.56bcde | 24.59b | 10.33bcde | 2.31c | 0.51de | 0.20c | 140.00bcd | 3.23c |
| P. edulis Sim | P8 | 4.79e | 4.27ef | 32.7b | 159.67abc | 5.22de | 16.30b | 10.00bcde | 1.88e | 0.52de | 0.21c | 123.33de | 2.31cdef |
| P. edulis Sim | P9 | 4.68e | 4.21f | 31.78b | 152.67bcd | 4.85de | 15.90b | 12.00bcd | 1.85e | 0.49e | 0.19c | 87.67e | 1.61f |
| P. edulis Sim | P10 | 6.16cd | 5.33cd | 33.08b | 161.33abc | 5.35de | 16.17b | 9.33cde | 2.17cd | 0.54cd | 0.35b | 146.33bcd | 3.15cd |
| P. edulis Sim | P11 | 5.69d | 4.86de | 43.89b | 157.67abc | 6.95bcde | 22.86b | 9.83bcde | 2.16cd | 0.52de | 0.22c | 136.33cde | 2.97cde |
| P. edulis Sim | P12 | 5.72d | 4.89de | 43.99b | 174.67a | 7.68bcde | 22.23b | 13.00bc | 2.18cd | 0.51de | 0.20c | 141.67bcd | 2.92cde |
| P. ligularis Juss | P13 | 7.17b | 5.38cd | 53.41b | 86.67g | 4.62e | 32.31b | 14.00b | 3.20b | 0.60b | 0.17c | 164.33bcd | 5.27b |
| P. ligularis Juss | P14 | 7.16b | 5.36cd | 53.23b | 87.33g | 4.67e | 31.94b | 12.00bcd | 3.20b | 0.60b | 0.17c | 180.33bc | 5.25b |
| P. quadrangularis L. | P15 | 14.48a | 9.30a | 496.67a | 52.33h | 26.23a | 360.00a | 27.33a | 5.45a | 0.79a | 0.62a | 172.33bcd | 9.37a |
Table 6.
Biochemical parameters of fruit juice of Passiflora edulis f. flavicarpa Deg, Passiflora edulis Sim, Passiflora ligularis A. Juss and Passiflora quadrangularis L.
Table 6.
Biochemical parameters of fruit juice of Passiflora edulis f. flavicarpa Deg, Passiflora edulis Sim, Passiflora ligularis A. Juss and Passiflora quadrangularis L.
| Species | Genotypes | Vit C (mg g-1) | Total soluble solids (⁰Brix) | Total carotenoid (mg g-1) | Total flavonoids (mg g-1) | Antioxidant activity (DPPH) (%) | Titratable Acidity (%) | Total carbohydrate (%) | Reducing sugar (%) | Non-reducing Sugar (%) | Fruit juice content (mL/fruit) |
| P. edulis f. flavicarpa Deg | P1 | 0.238bcd | 16.17d | 0.100hi | 0.114def | 10.85cde | 3.56ab | 10.14de | 4.92cdef | 5.20abcd | 34.17b |
| P. edulis f. flavicarpa Deg | P2 | 0.26.1abc | 15.97d | 0.090ij | 0.113def | 11.70bcd | 3.91a | 11.14abcd | 4.63defg | 6.54a | 20.70bcd |
| P. edulis f. flavicarpa Deg | P3 | 0.262abc | 15.13e | 0.116h | 0.09ef | 12.93bcd | 3.41abc | 12.12ab | 4.93cdef | 5.79abc | 24.09bcd |
| P. edulis f. flavicarpa Deg | P4 | 0.262abc | 16.03d | 0.08.7ij | 0.11def | 11.48bcd | 3.32bc | 10.31cde | 4.10fg | 6.52a | 31.35bc |
| P. edulis f. flavicarpa Deg | P5 | 0.265abc | 18.13a | 0.300c | 0.35a | 22.15a | 1.15gh | 10.84bcd | 6.88a | 4.72abcd | 21.31bcd |
| P. edulis f. flavicarpa Deg | P6 | 0.214cd | 17.53c | 0.077j | 0.16cde | 12.50bcd | 2.43e | 7.81f | 4.35efg | 3.05d | 34.20b |
| P. edulis Sim | P7 | 0.292ab | 18.07a | 0.265f | 0.11def | 11.96bcd | 2.78de | 12.36ab | 6.36ab | 6.28ab | 17.35d |
| P. edulis Sim | P8 | 0.226cd | 18.28a | 0.397a | 0.24bc | 12.60bcd | 2.59e | 10.59bcd | 6.92a | 3.42cd | 14.09d |
| P. edulis Sim | P9 | 0.207cd | 17.94ab | 0.196g | 0.07g | 9.80def | 2.52e | 12.06abc | 5.54bcd | 5.99abc | 10.94d |
| P. edulis Sim | P10 | 0.214cd | 17.27c | 0.240b | 0.26b | 14.76b | 3.19bcd | 12.88a | 5.98abc | 6.40ab | 13.75d |
| P. edulis Sim | P11 | 0.320a | 14.70ef | 0.285e | 0.10ef | 13.70bc | 2.91cde | 12.18ab | 6.41ab | 5.96abc | 18.14cd |
| P. edulis Sim | P12 | 0.177de | 17.53bc | 0.145d | 0.20bcd | 10.33cdef | 1.20g | 10.14de | 5.35bcde | 3.86bcd | 18.78cd |
| P. ligularis Juss | P13 | 0.134e | 14.43f | 0.0001k | 0.11ef | 7.52efg | 0.64h | 8.41f | 3.51g | 4.25abcd | 16.77d |
| P. ligularis Juss | P14 | 0.127e | 14.64bc | 0.0001k | 0.11def | 7.17fg | 0.63h | 8.80ef | 4.03fg | 4.50abcd | 16.77d |
| P. quadrangularis L. | P15 | 0.308a | 13.54g | 0.0172k | 0.17cde | 6.28g | 1.81f | 10.32cde | 5.52bcde | 4.92abcd | 117.92a |
Table 7.
Biochemical parameters in leaves, petioles and tendrils Passiflora edulis f. flavicarpa Deg, Passiflora edulis Sim, Passiflora ligularis A. Juss and Passiflora quadrangularis L.
Table 7.
Biochemical parameters in leaves, petioles and tendrils Passiflora edulis f. flavicarpa Deg, Passiflora edulis Sim, Passiflora ligularis A. Juss and Passiflora quadrangularis L.
| Species | Genotypes | Leaf Vit. C (mg g-1) | Leaf Phenol (mg g-1) | Leaf chlorophyll (mg g-1) | Petiole anthocyanin (µg g-1) | Tendril anthocyanin (µg g-1) |
| P. edulis f. flavicarpa Deg | P1 | 1.151cd | 1.538h | 2.84ab | 20.30bcde | 28.90ab |
| P. edulis f. flavicarpa Deg | P2 | 1.1807c | 1.527h | 2.90a | 18.60cde | 33.90a |
| P. edulis f. flavicarpa Deg | P3 | 0.981de | 1.432h | 1.56de | 30.50ab | 26.90abc |
| P. edulis f. flavicarpa Deg | P4 | 1.218c | 1.795g | 1.50de | 15.70def | 19.80abcd |
| P. edulis f. flavicarpa Deg | P5 | 1.748a | 1.942g | 1.87cde | 28.10abc | 21.40abcd |
| P. edulis f. flavicarpa Deg | P6 | 1.256c | 1.798g | 1.16e | 9.30ef | 24.50abcd |
| P. edulis Sim | P7 | 1.172cd | 2.709e | 2.16bcd | 19.0cde | 31.40ab |
| P. edulis Sim | P8 | 1.101cd | 2.813de | 1.57de | 35.40a | 21.10abcd |
| P. edulis Sim | P9 | 1.183c | 2.242f | 1.64cde | 05.90f | 20.40abcd |
| P. edulis Sim | P10 | 489g | 4.985a | 2.60ab | 10.10def | 31.10ab |
| P. edulis Sim | P11 | 1.258c | 2.968cd | 1.32e | 4.30f | 14.10bcd |
| P. edulis Sim | P12 | 1.500b | 3.059c | 2.38abc | 5.90f | 06.70d |
| P. ligularis Juss | P13 | 0.882ef | 3.108c | 1.23e | 21.50bcd | 26.40abc |
| P. ligularis Juss | P14 | 0.752f | 3.113c | 1.10e | 20.40bcde | 16.0abcd |
| P. quadrangularis L. | P15 | 0.493g | 3.489b | 1.65cde | 17.80cde | 09.30cd |
P1 (2.84 mg g-1) and P10 (2.60 mg g-1) while the least was in P13 (0.0012 mg g-1). The anthocyanin in petioles of P8 (35.40 µg g-1), P3 (30.50 µg g-1) and P5 (28.10 µg g-1) contained a significantly higher amount. In comparison, genotype P2 showed a higher amount of anthocyanin in tendrils (33.90 µg g-1), followed by P7 (31.40 µg g-1) and P10 (31.1 µg g-1). The lowest anthocyanin content was recorded in genotype P11 (4.30 µg g-1) in petioles and genotype P12 (6.70 µg g-1) in tendrils.
Disclaimer/Publisher’s Note: The statements, opinions and data contained in all publications are solely those of the individual author(s) and contributor(s) and not of MDPI and/or the editor(s). MDPI and/or the editor(s) disclaim responsibility for any injury to people or property resulting from any ideas, methods, instructions or products referred to in the content. |
© 2025 by the authors. Licensee MDPI, Basel, Switzerland. This article is an open access article distributed under the terms and conditions of the Creative Commons Attribution (CC BY) license (http://creativecommons.org/licenses/by/4.0/).
Copyright: This open access article is published under a Creative Commons CC BY 4.0 license, which permit the free download, distribution, and reuse, provided that the author and preprint are cited in any reuse.


