
Submitted:
14 April 2025
Posted:
15 April 2025
You are already at the latest version
Abstract
Accurate fatigue prediction is essential for ensuring the reliability and durability of engineering systems. Suitable predictive performance was achieved by artificial neural networks trained on the FatLim dataset, however further improvements are needed due to its small sample size. This study explored the impact of dataset augmentation on model performance by exemplarily expanding the FatLim dataset and comparing results against the original dataset. The dataset was augmented by generating additional uniaxial stress scenarios and applying tensor transformations to simulate varied stress orientations. Neural network models are trained separately on the original and expanded datasets, and their predictive performance is evaluated. The results demonstrated that the model trained on the augmented dataset achieved better accuracy, confirming the effectiveness of dataset expansion in improving fatigue prediction. This research underscores the potential of data augmentation techniques to enhance machine learning models for fatigue analysis.
Keywords:
Fatigue strength
; multiaxial fatigue analysis
; estimation of material parameters
; machine learning
; artificial neural networks
1. Introduction
In the context of stress and strength assessment, artificial neural can be used for capturing complex relationships between independent variables—such as stress tensors, loading phases, and material properties—and dependent variables, including the results of uniaxial fatigue testing under fully reversed loading. Various types of artificial neural networks are utilized in material fatigue research [1], with their application shaped by critical factors such as data availability, computational efficiency, and generalization ability. As research shifts toward more adaptive and intelligent approaches, artificial neural networks offer the advantage of learning and integrating both qualitative and quantitative information. This capability makes them particularly well-suited for capturing the complexities of dynamic loading behavior and enabling accurate multiaxial fatigue assessment.
Before the integration of AI-driven approaches, research primarily focused on developing various fatigue criteria for assessing high-cycle fatigue in metals under multiaxial loading conditions The studies on fatigue strength criteria [2], aimed to evaluate different methodologies and improve predictive accuracy by comparing their results with empirical observations. To systematically assess the accuracy of these criteria, the FatLim dataset was established as a comprehensive resource containing experimental data on multiaxial fatigue strength.
The dataset is publicly accessible online and utilized by researchers for validating different methods of predicting material failure under stress [3].
As machine learning techniques continue to advance, they play a vital role in improving the accuracy of fatigue prediction calculations. According to recent research [4], FatLim dataset was used to develop an artificial neural network model for stress assessment. However, they highlighted the limitations of artificial neural networks, primarily due to the small dataset size. The restricted dataset hinders both the accuracy and reliability of the machine learning model.
Given the constraints of the original dataset, this study investigated whether augmenting the dataset can improve the predictive accuracy of artificial neural networks for fatigue assessment. The dataset was augmented by leveraging the invariance properties of the stress tensor, Although the original dataset did not specify whether the materials were isotropic or anisotropic, assumptions were made regarding isotropic material properties to apply the invariance method. Additionally, uniaxial testing data from the dataset were used to create additional loading cases. To evaluate the effects of this expansion, a comparative analysis was conducted. Two identical ANN models were trained separately using different datasets—one with the original data and the other with the expanded dataset. Their performance was then evaluated to assess the effect of data augmentation.
2. Materials and Methods
2.1. Dataset
The dataset comprises information from experiments on multiaxial testing cases (). Each testing case corresponds to a specific specimen and includes its associated uniaxial loading test data, which incorporates both tensile and shear components (). In total, the dataset contains data from 294 experiments. In this study, relying on the availability of FatLim data [3], the ensuing essential stress state parameters are regarded as crucial and subsequently utilized. 23 entries were selected for training as follows:
- Amplitude stress tensor in multiaxial loading. Amplitude of normal and shear components of stress during cyclic multiaxial loading conditions.
- Mean stress tensor in multiaxial loading. Mean or average values of normal and shear components of stress during cyclic multiaxial loading conditions.
- Fatigue limit tensile stress in repeated uniaxial loading. Maximum stress that the material undergoes alternating cycles of stress with magnitudes in tension higher than compression.
- Fatigue limit stress in fully reversed uniaxial loading. Maximum stress that the material undergoes alternating cycles of stress with equal magnitudes in tension and compression.
- Torsion fatigue limit in repeated uniaxial loading. Maximum stress that the material undergoes alternating cycles of stress with the magnitudes in tension higher than compression.
- Torsion fatigue limit in fully reversed uniaxial loading. Maximum stress that the material undergoes alternating cycles of stress with equal magnitudes in tension and compression.
- Maximum (Ultimate) strength. Refers to the maximum stress or force that a material can withstand before undergoing fracture or failure.
- Yield strength. Denotes the stress or force at which a material begins to deform plastically without undergoing permanent deformation.
- Shifted phased in stress load. Different starting point of stress cycles with a or a phase shift compared to the original loading conditions.
There was missing data in certain test cases that must be rectified prior to any processing. These missing data points were approximated using the recommended uniaxial stress estimation formula outlined in the FKM guideline and other relevant research resources [5,6]. The equations employed for estimating uniaxial stress are presented as follows.
2.1. Augmenting the Database
The dataset comprises results from multiaxial loading tests and corresponding uniaxial fatigue stress data for each testing datapoint. It includes key parameters, as outlined in Section 2.1. The augmentation process consists of two steps. First, tensor transformation is applied, followed by the generation of uniaxial testing case datapoints from the uniaxial data. Tensor transformation is performed on the multiaxial loading test data under the assumption that the testing specimens exhibit isotropic material behavior. Matrix transformation techniques are employed to modify the stress tensor in various directions. The mathematical formulation for tensor rotation is presented as follows.
where represents the original stress tensor, is the transformation matrix, and is its transpose. To perform augmentation, rotation matrices , , and are applied to rotate the stress tensor by 90 degrees around the X, Y, and Z axes, respectively [7]. Datapoint 1 represents the original data, and the transformation results in the creation of datapoints 2, 3, and 4, as shown in Table 1.
In the next stage of augmentation, the uniaxial fatigue stress data was used to generate new testing datapoints. The uniaxial loading test data, which includes both tensile and shear stress components, was conducted under two different loading ratios: R = -1 and R = 0. In the R = -1 condition, representing fully reversed uniaxial loading, the mean stress is zero and the stress amplitude is equal to the fatigue limit stress . In the R = 0 condition, representing repeated uniaxial loading, the stress amplitude is equal to the mean stress, while the fatigue limit tensile stress is double their value . For example, given the uniaxial fatigue limit values , , , and = 822, new uniaxial loading cases can be created for loading in the xx, yy, and zz directions, as well as for shear loading in the xy, yz, and zx planes as shown in Table 2.
and are utilized to generate datapoints 5 and 8, respectively. Likewise, the and values, which incorporate mean stress, serve as the basis for generating datapoints 11 and 14. Consequently, the aforementioned tensor transformations were applied to datapoints 5, 8, 11, and 14 resulted in 6, 7, 9, 10, 12, 13, 15 and 16.
This systematic expansion process increased the dataset's diversity, enabling a more comprehensive representation of stress behaviors and fatigue responses. As a result, the original dataset, which contained 294 cases, was expanded to a total of 1732 cases.
2.2. Model Training and Data Processing
A neural networks model was trained on the original Fatlim dataset and on the augmented dataset. Let denote the original dataset and denote the augmented dataset, which was generated using the previously described method and does not include datapoints from . Both datasets were partitioned into distinct training and testing sets.
For the model trained on , referred to as model , the training set comprised a randomly selected 80% of . Meanwhile, the model trained on , referred to as , utilized a training set consisting of a randomly selected 80% of , combined with a randomly selected 80% of . The remaining 20% of the data from each dataset was reserved for testing (), ensuring a comprehensive evaluation of both models' performance. Figure 1 illustrates the allocation of the training and testing datasets from the original and augmented datasets.
2.3. Artificial Neural Network
The artificial neural network is developed using PyTorch frameworks, input layer parameters such as the amplitude stress tensor , mean stress tensor , fatigue limit tensile stress , torsion fatigue limits , ultimate strength , yield strength , and shifted phase in stress load . With the stress tensors consisting of 9 Parameters each (xx…zz) this layer consists of 23 nodes. The output layer delivers a predicted stress fatigue limit and is therefore a single node.
The hidden layers are 5 densely connected layers with 200 nodes each. The ReLU activation function, as expressed in (9), is employed after each dense layer, aiding in capturing nonlinear relationships in the data [9,10].
In this study, the Mean Absolute Error (MAE), has been chosen as the loss function for its ability to handle regression scenarios where output variables are Gaussian-distributed and susceptible to outliers. [11,12].
where refers to model trainable parameters, represents the true output, and stands for the predicted output as a function of .
The Adam optimizer was selected to enhance the optimization process by utilizing momentum and gradient-based methods, ensuring efficient weight and bias adjustments during training through backpropagation [8]. The selected hyperparameters for the Adam optimizer in this research were a learning rate of 0.0001, complemented by the adjustment of learning rate parameters = , as well as .
The training process of the artificial neural network is illustrated in Figure 2. The process begins with extracting fatigue data from the and , which is then divided into training and testing subsets. The data undergoes standard score normalization to ensure consistency before modeling. Next, the training data is fed into an artificial neural network with initial weights, biases, and hyperparameters. The network's performance is assessed using the loss function (8). Based on the optimizer adapts the trainable parameters of the model. Training continues for a set number of 2000 epochs.
3. Results
The accuracy was calculated by measuring the relative deviation of the equivalent stress which is the model's output , at the multiaxial fatigue limit from the uniaxial fatigue limit under fully reversed loading. It is formally defined in (10) and evaluates how well the predicted fatigue resistance aligns with uniaxial reference values [13].
To evaluate the effectiveness of the artificial neural network models, a comparative analysis was performed between models trained on the original FatLim dataset and models trained on the expanded dataset. The performance of both models on their respective training datasets is presented in Table 3.
A performance comparison was conducted between models trained on the expanded dataset and those trained on the original dataset. To ensure a fair evaluation and accurately assess the impact of data augmentation, both models were tested using the same dataset, with all test data points selected from the original dataset. The results demonstrate that the model trained on the expanded dataset achieved significantly higher predictive accuracy, showing a three-time improvement compared to the model trained on the original FatLim dataset, while also exhibiting a lower standard deviation, indicating more consistent predictions. The prediction errors are detailed in Table 4, while the model prediction results are illustrated in Figure 3.
4. Discussion
The model trained on the original dataset () exhibited acceptable performance when evaluated using the testing dataset from . However, the model trained on the augmented dataset () demonstrated better performance in comparison to . Specifically, the prediction error for was approximately three times lower than that of , with all predictions achieving an accuracy of 80%. This improvement corroborates the initial hypothesis, that an enhanced training dataset, which incorporates augmented data improves the model’s ability to account for invariance and generalize across a broader range of testing scenarios. Conversely, produced significant prediction errors when tested on the test dataset from , whereas yielded more accurate predictions. The substantial error observed in is likely due to the limited diversity within the original dataset, which consists exclusively of multiaxial stress data. As a result, struggled to generalize effectively to newly introduced uniaxial loading cases. It is worth mentioning, that the performance of on and on respectively are of less interest, as the qualitative behaviour of the identically designed models with respect to the training dataset is the focus of our research.
Despite the improvements on by , certain limitations must be acknowledged. The assumption of isotropic material properties may not be valid for all materials, potentially restricting the model’s applicability to more complex, anisotropic materials. Furthermore, while the inclusion of augmented data enhanced performance, reliance on artificially generated data may introduce biases that do not fully capture real-world conditions.
5. Conclusions
In this study, the impact of dataset augmentation on the performance of neural network models in predicting material fatigue strengths under complex loading conditions was investigated. The augmentation process was conducted by utilizing the invariance properties of tensors through matrix transformations and introducing additional uniaxial testing scenarios. To evaluate the impact of this augmentation, two identical models were trained and tested. One model was trained on the original dataset, while the other also contained augmented datapoints in its dataset.
The results demonstrated that augmenting the FatLim dataset through uniaxial case generation and tensor transformations significantly enhances the predictive performance of artificial neural networks for fatigue analysis. The model trained on the augmented dataset consistently outperformed the one trained on the original dataset. While the model trained on the original dataset exhibited adequate accuracy when predicting familiar data points, it struggled with generalization, resulting in substantial prediction errors. This demonstrates the crucial role of dataset augmentation in improving the accuracy and reliability of neural network models. By expanding the dataset, the model was exposed to a wider range of scenarios, allowing it to learn more robust patterns and make more precise predictions.
For future work, it is recommended to incorporate a broader range of material properties, including anisotropic cases, to further enhance the model's generalization capabilities. Moreover, validating the model against more extensive experimental datasets could help in assessing its practical applicability and reducing potential biases introduced by synthetic data. Expanding the model to include more advanced loading scenarios and stress conditions could also provide deeper insights into material behavior under complex real-world situations.
Appendix A
The neural network model and the corresponding validation dataset utilized in this study are publicly available at https://github.com/Napon-IKAT/FatLim-stressFatigue
References
- Chen, J.; Liu, Y. Fatigue Modeling Using Neural Networks: A Comprehensive Review. Fatigue Fract Eng Mat Struct 2022, 45, 945–979. [Google Scholar] [CrossRef]
- Papuga, J.; Nesládek, M.; Hasse, A.; Cízová, E.; Suchý, L. Benchmarking Newer Multiaxial Fatigue Strength Criteria on Data Sets of Various Sizes. Metals 2022, 12, 289. [Google Scholar] [CrossRef]
- Papuga, J.; Kaľavský, A.; Lutovinov, M.; Vízková, I.; Parma, S.; Nesládek, M. Evaluation of Data Sets Usable for Validating Multiaxial Fatigue Strength Criteria. International Journal of Fatigue 2021, 145, 106093. [Google Scholar] [CrossRef]
- Nagode, M.; Papuga, J.; Oman, S. Application of Machine Learning Models for Estimating the Material Parameters for Multiaxial Fatigue Strength Calculation. Fatigue Fract Eng Mat Struct 2023, 46, 4142–4160. [Google Scholar] [CrossRef]
- Analytical Strength Assessment of Components: Made of Steel, Cast Iron and Aluminium Materials: FKM Guideline; Rennert, R. , Kullig, E., Vormwald, M., Esderts, A., Luke, M., Forschungskuratorium Maschinenbau, Eds.; FKM Forschung im VDMA; 7th revised edition 2020.; VDMA Verlag GmbH: Frankfurt am Main, 2021; ISBN 978-3-8163-0745-7. [Google Scholar]
- Liu, J.; Zenner, H. Berechnung Der Dauerschwingfestigkeit Bei Mehrachsiger Beanspruchung — Teil 1. Materialwissenschaft Werkst 1993, 24, 240–249. [Google Scholar] [CrossRef]
- Ottosen, N.S.; Ristinmaa, M. The Mechanics of Constitutive Modeling; Elsevier: Amsterdam ; London, 2005; ISBN 978-0-08-044606-6.
- Kingma, D.P.; Ba, J. Adam: A Method for Stochastic Optimization. 2014. [CrossRef]
- Kinsley, H.; Kukiela, D. Neural Networks from Scratch in Python, 1st ed.; 2020. [Google Scholar]
- Szandała, T. Review and Comparison of Commonly Used Activation Functions for Deep Neural Networks. 2020. [CrossRef]
- Bishop, C.M. Neural Networks for Pattern Recognition; Oxford University PressOxford, 1995; ISBN 978-0-19-853849-3.
- Brownlee, J. How to Choose Loss Functions When Training Deep Learning Neural Networks. MachineLearningMastery.com 2020. [Google Scholar]
- Papuga, J. A Survey on Evaluating the Fatigue Limit under Multiaxial Loading. International Journal of Fatigue 2011, 33, 153–165. [Google Scholar] [CrossRef]
Figure 1.
Allocation of the training and testing datasets.
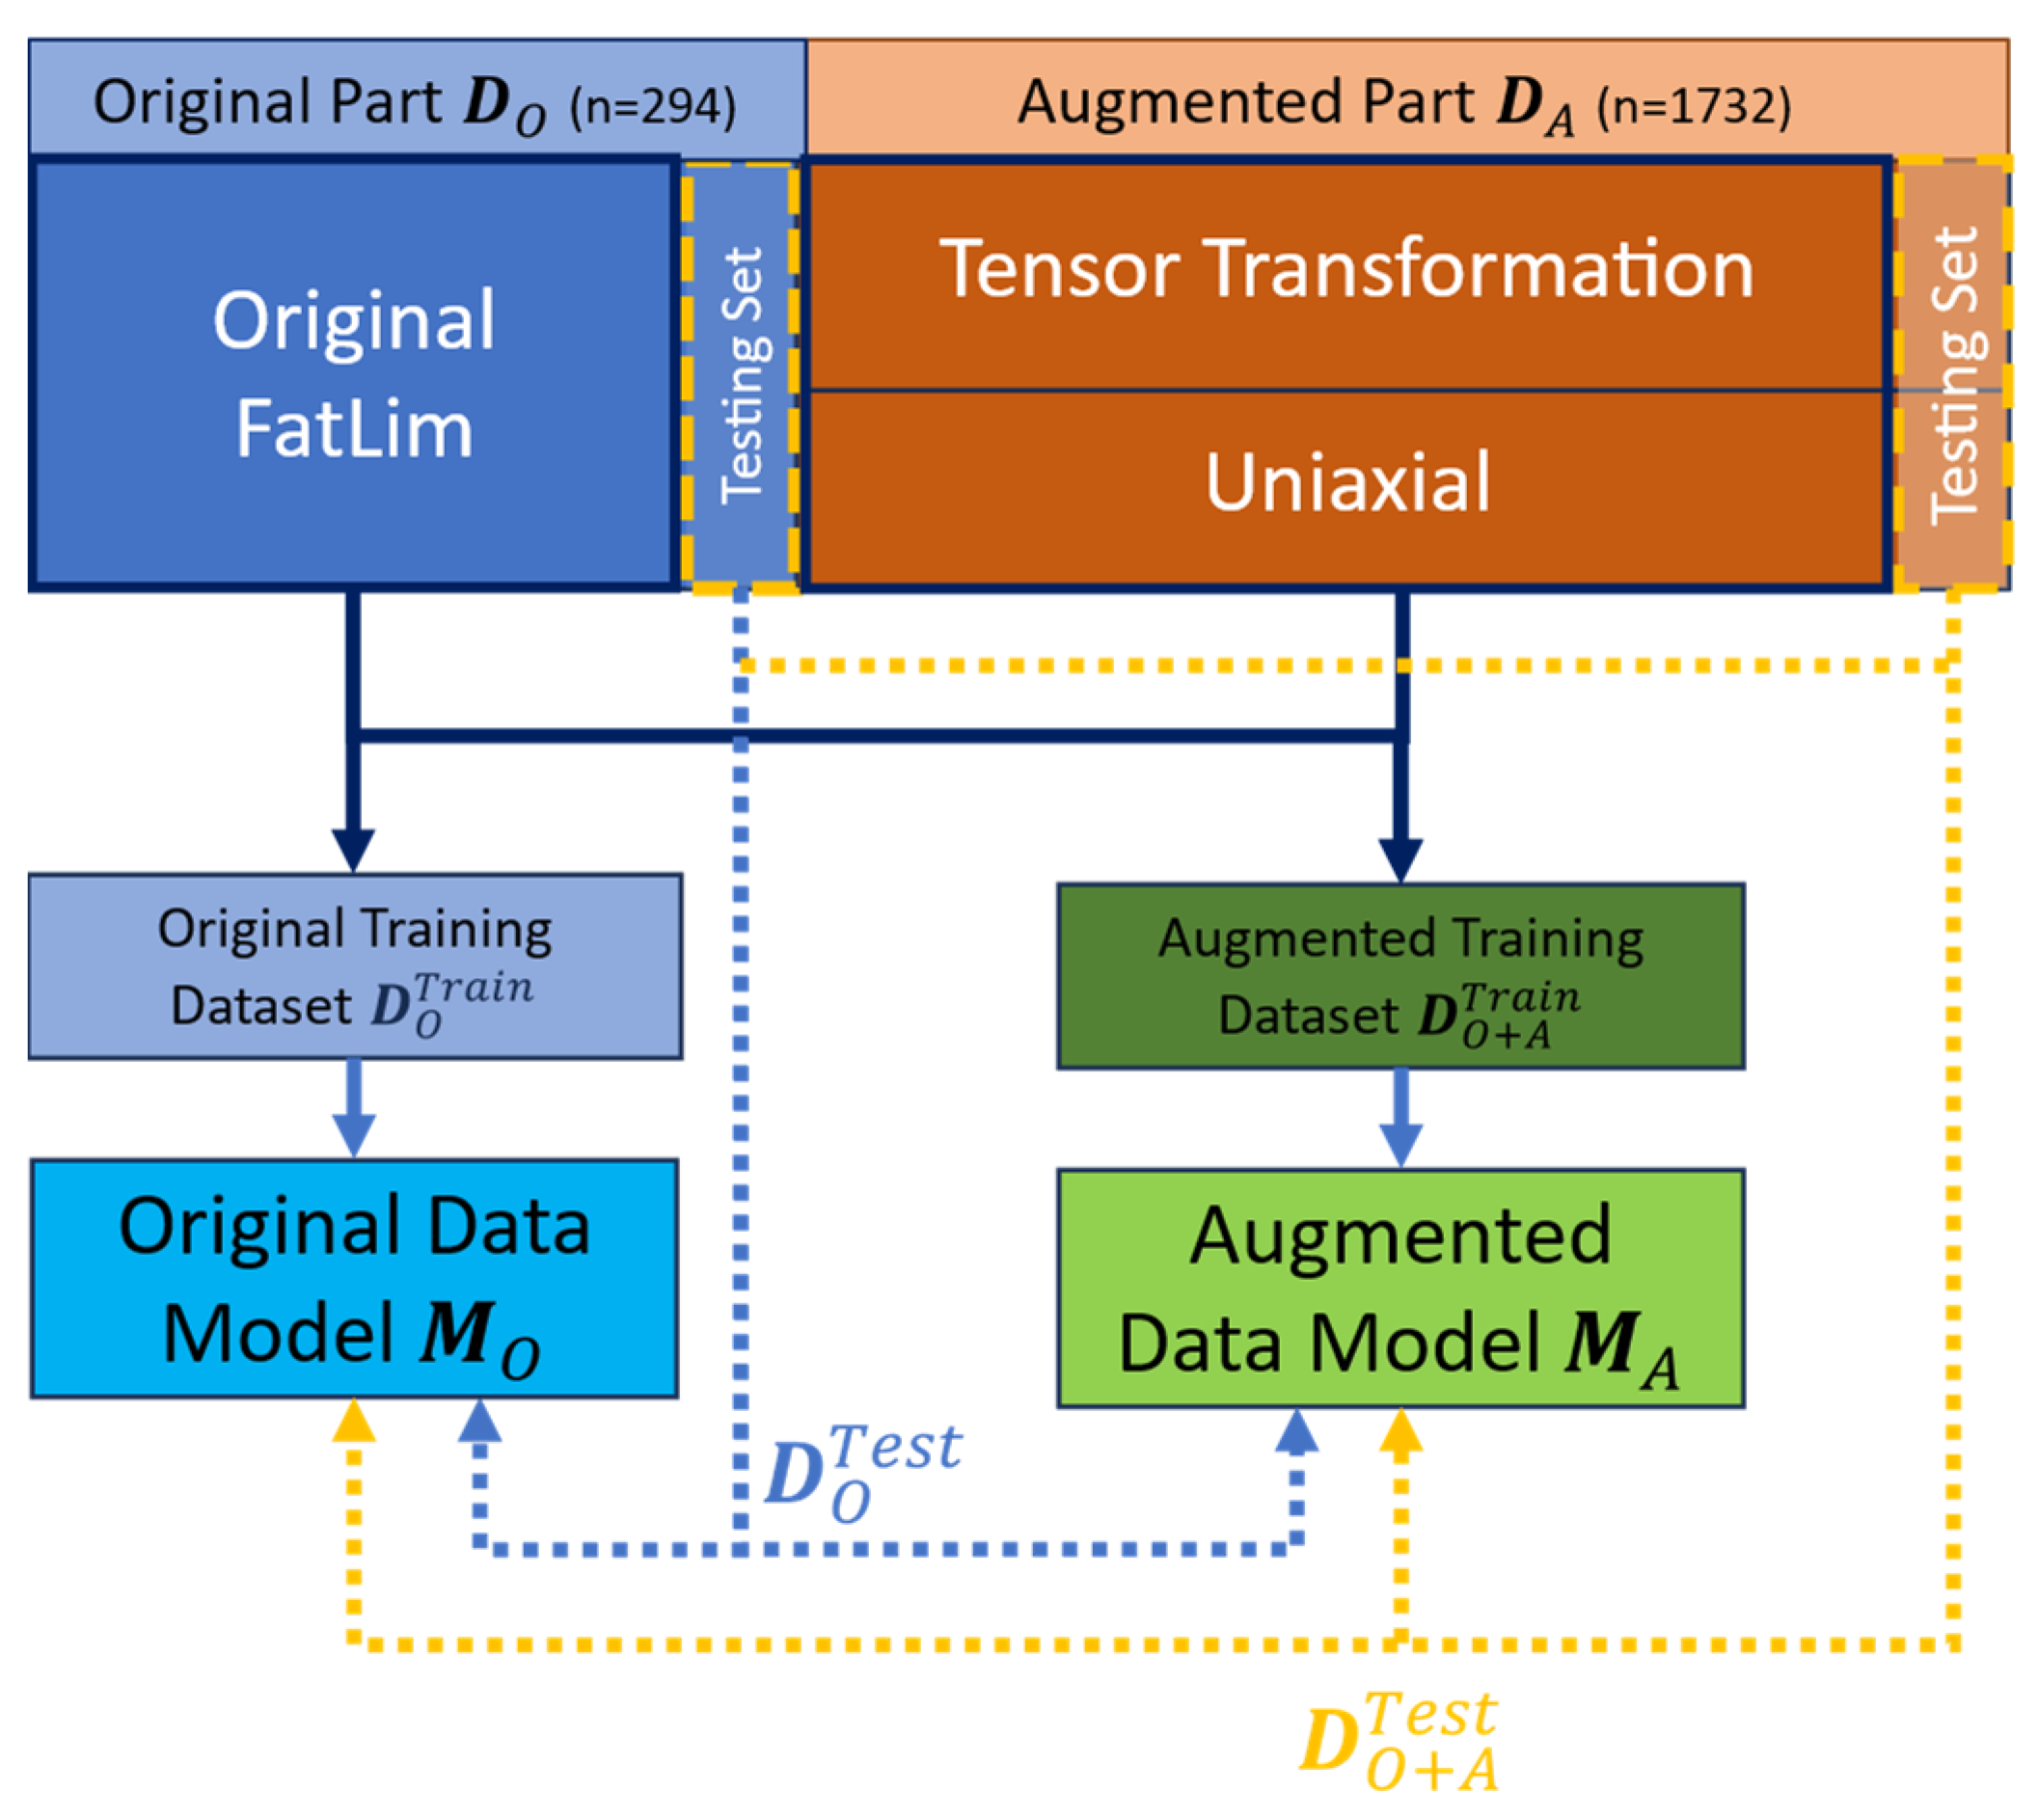
Figure 2.
Diagram flow of the fatigue stress model.
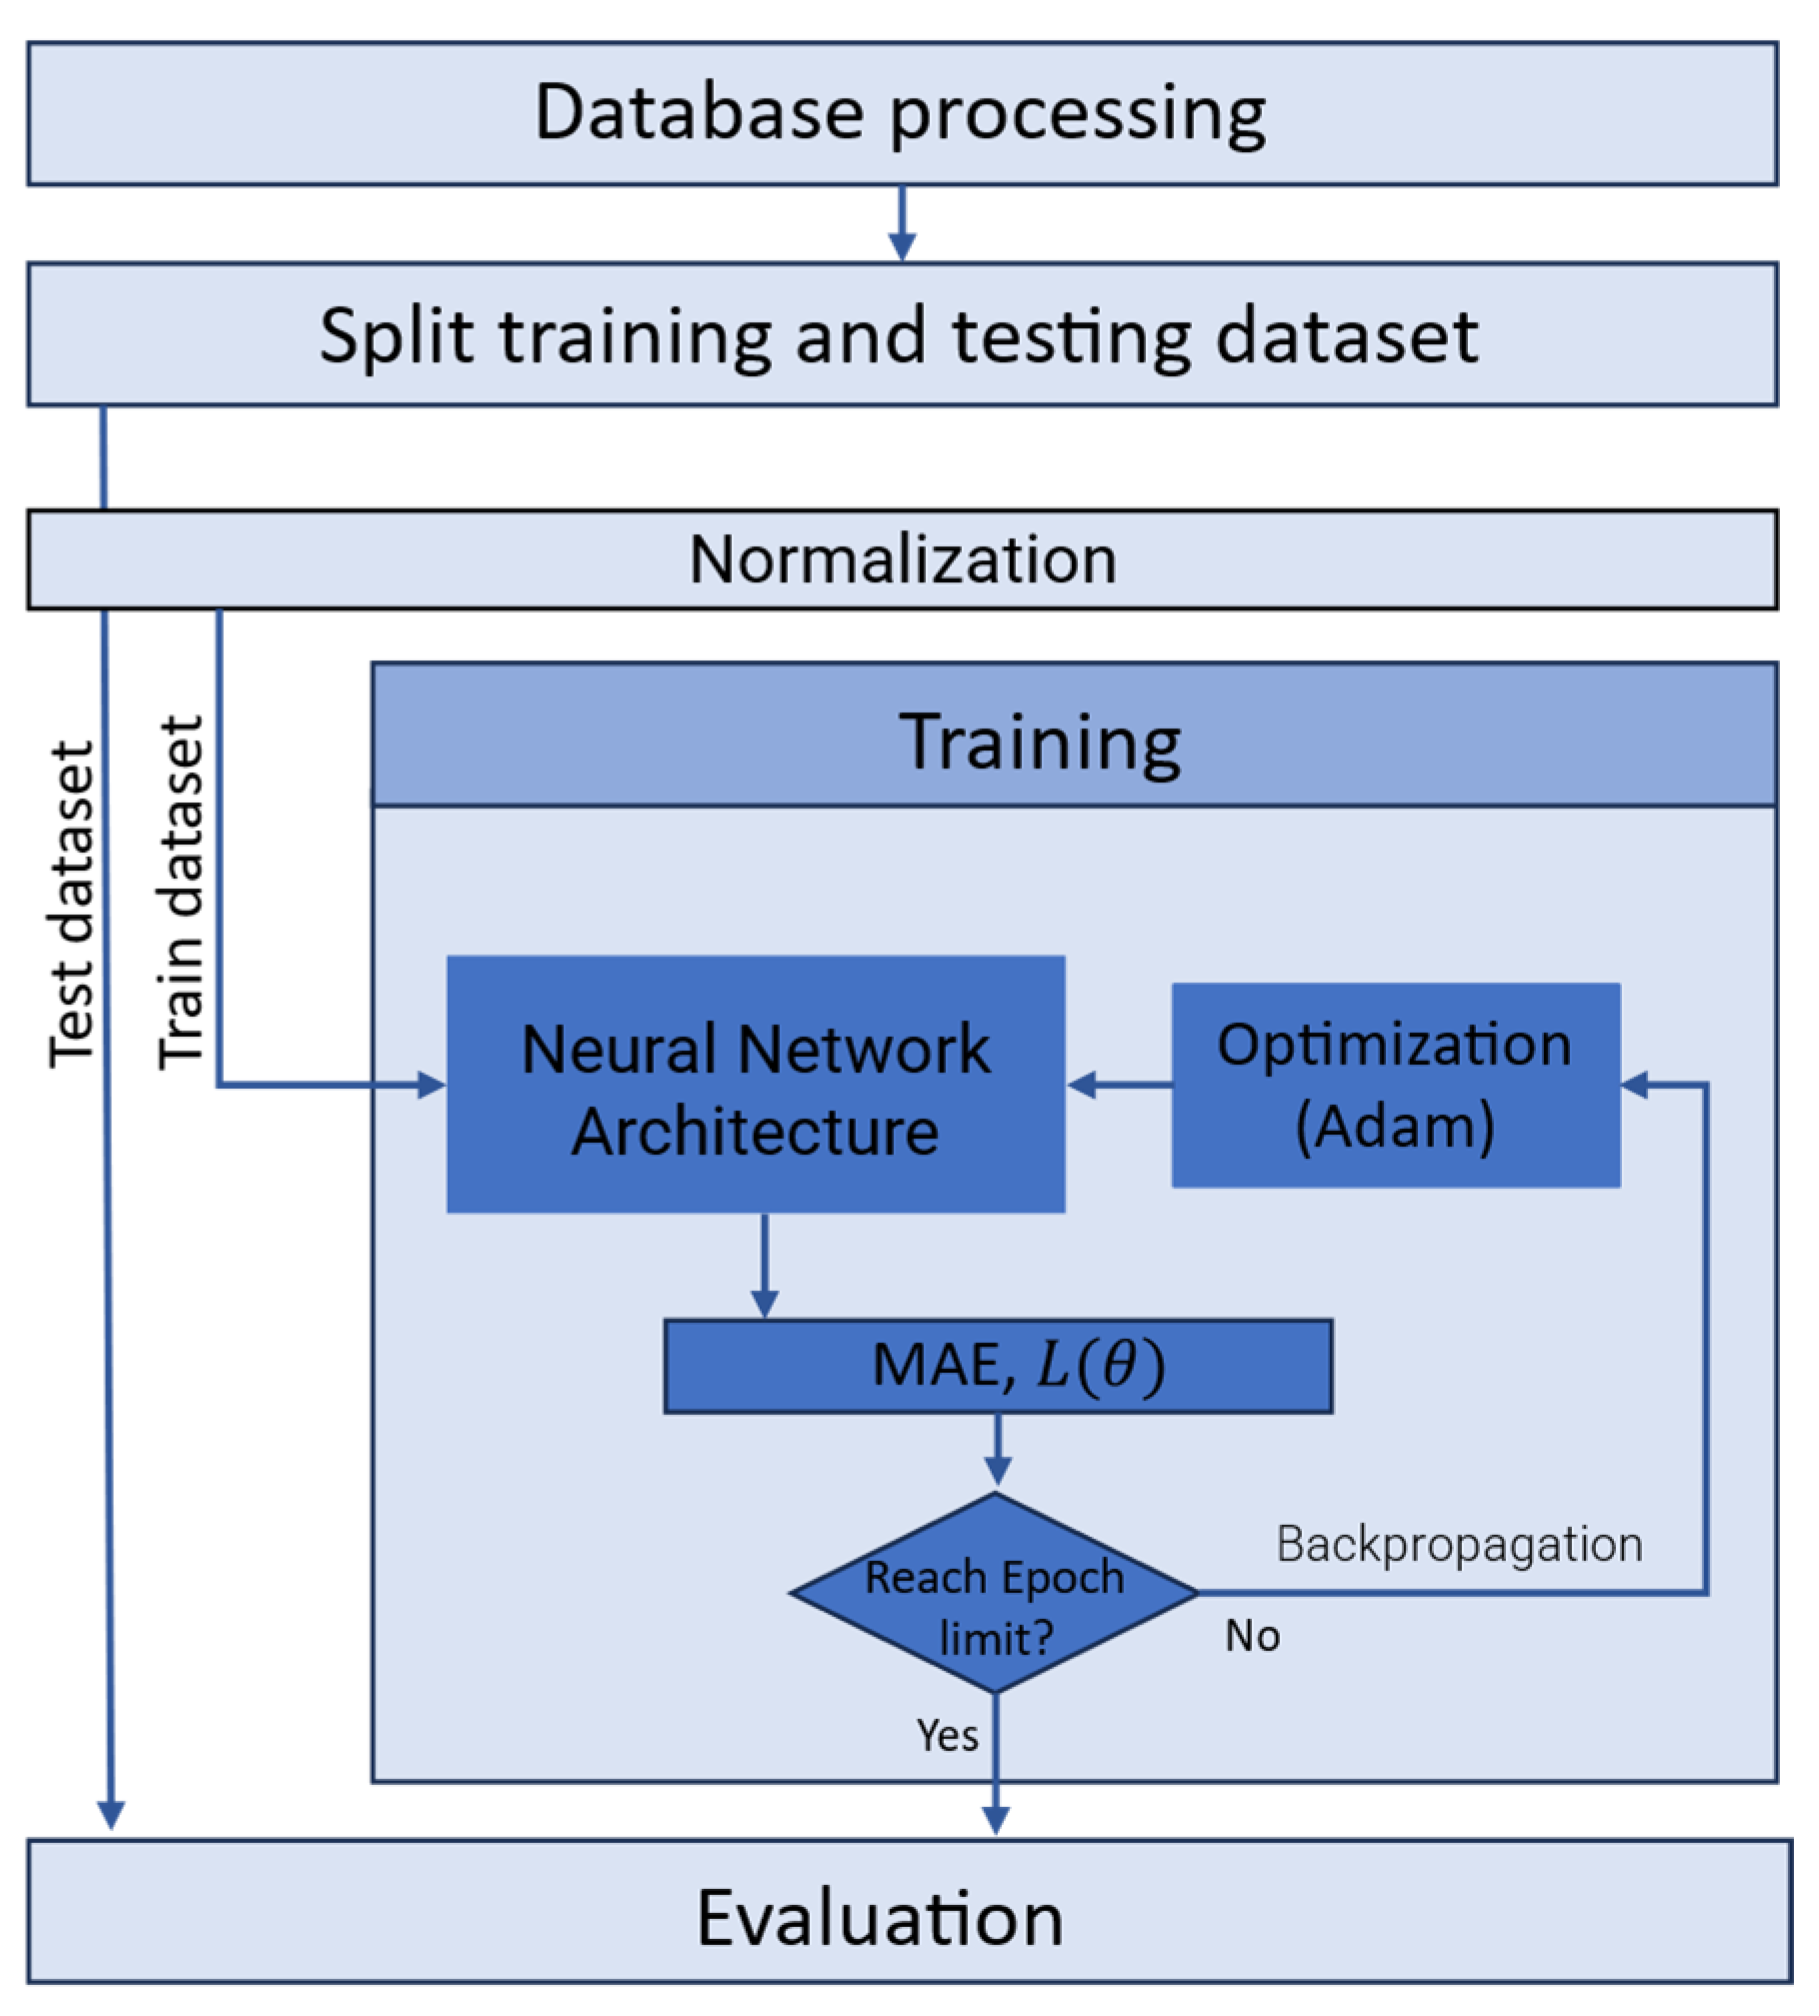
Figure 3.
(a) Predicted stresses using the neural network model trained with the original Fatlim dataset. (b) Predicted stresses using the neural network model trained with the augmented dataset.
Figure 3.
(a) Predicted stresses using the neural network model trained with the original Fatlim dataset. (b) Predicted stresses using the neural network model trained with the augmented dataset.
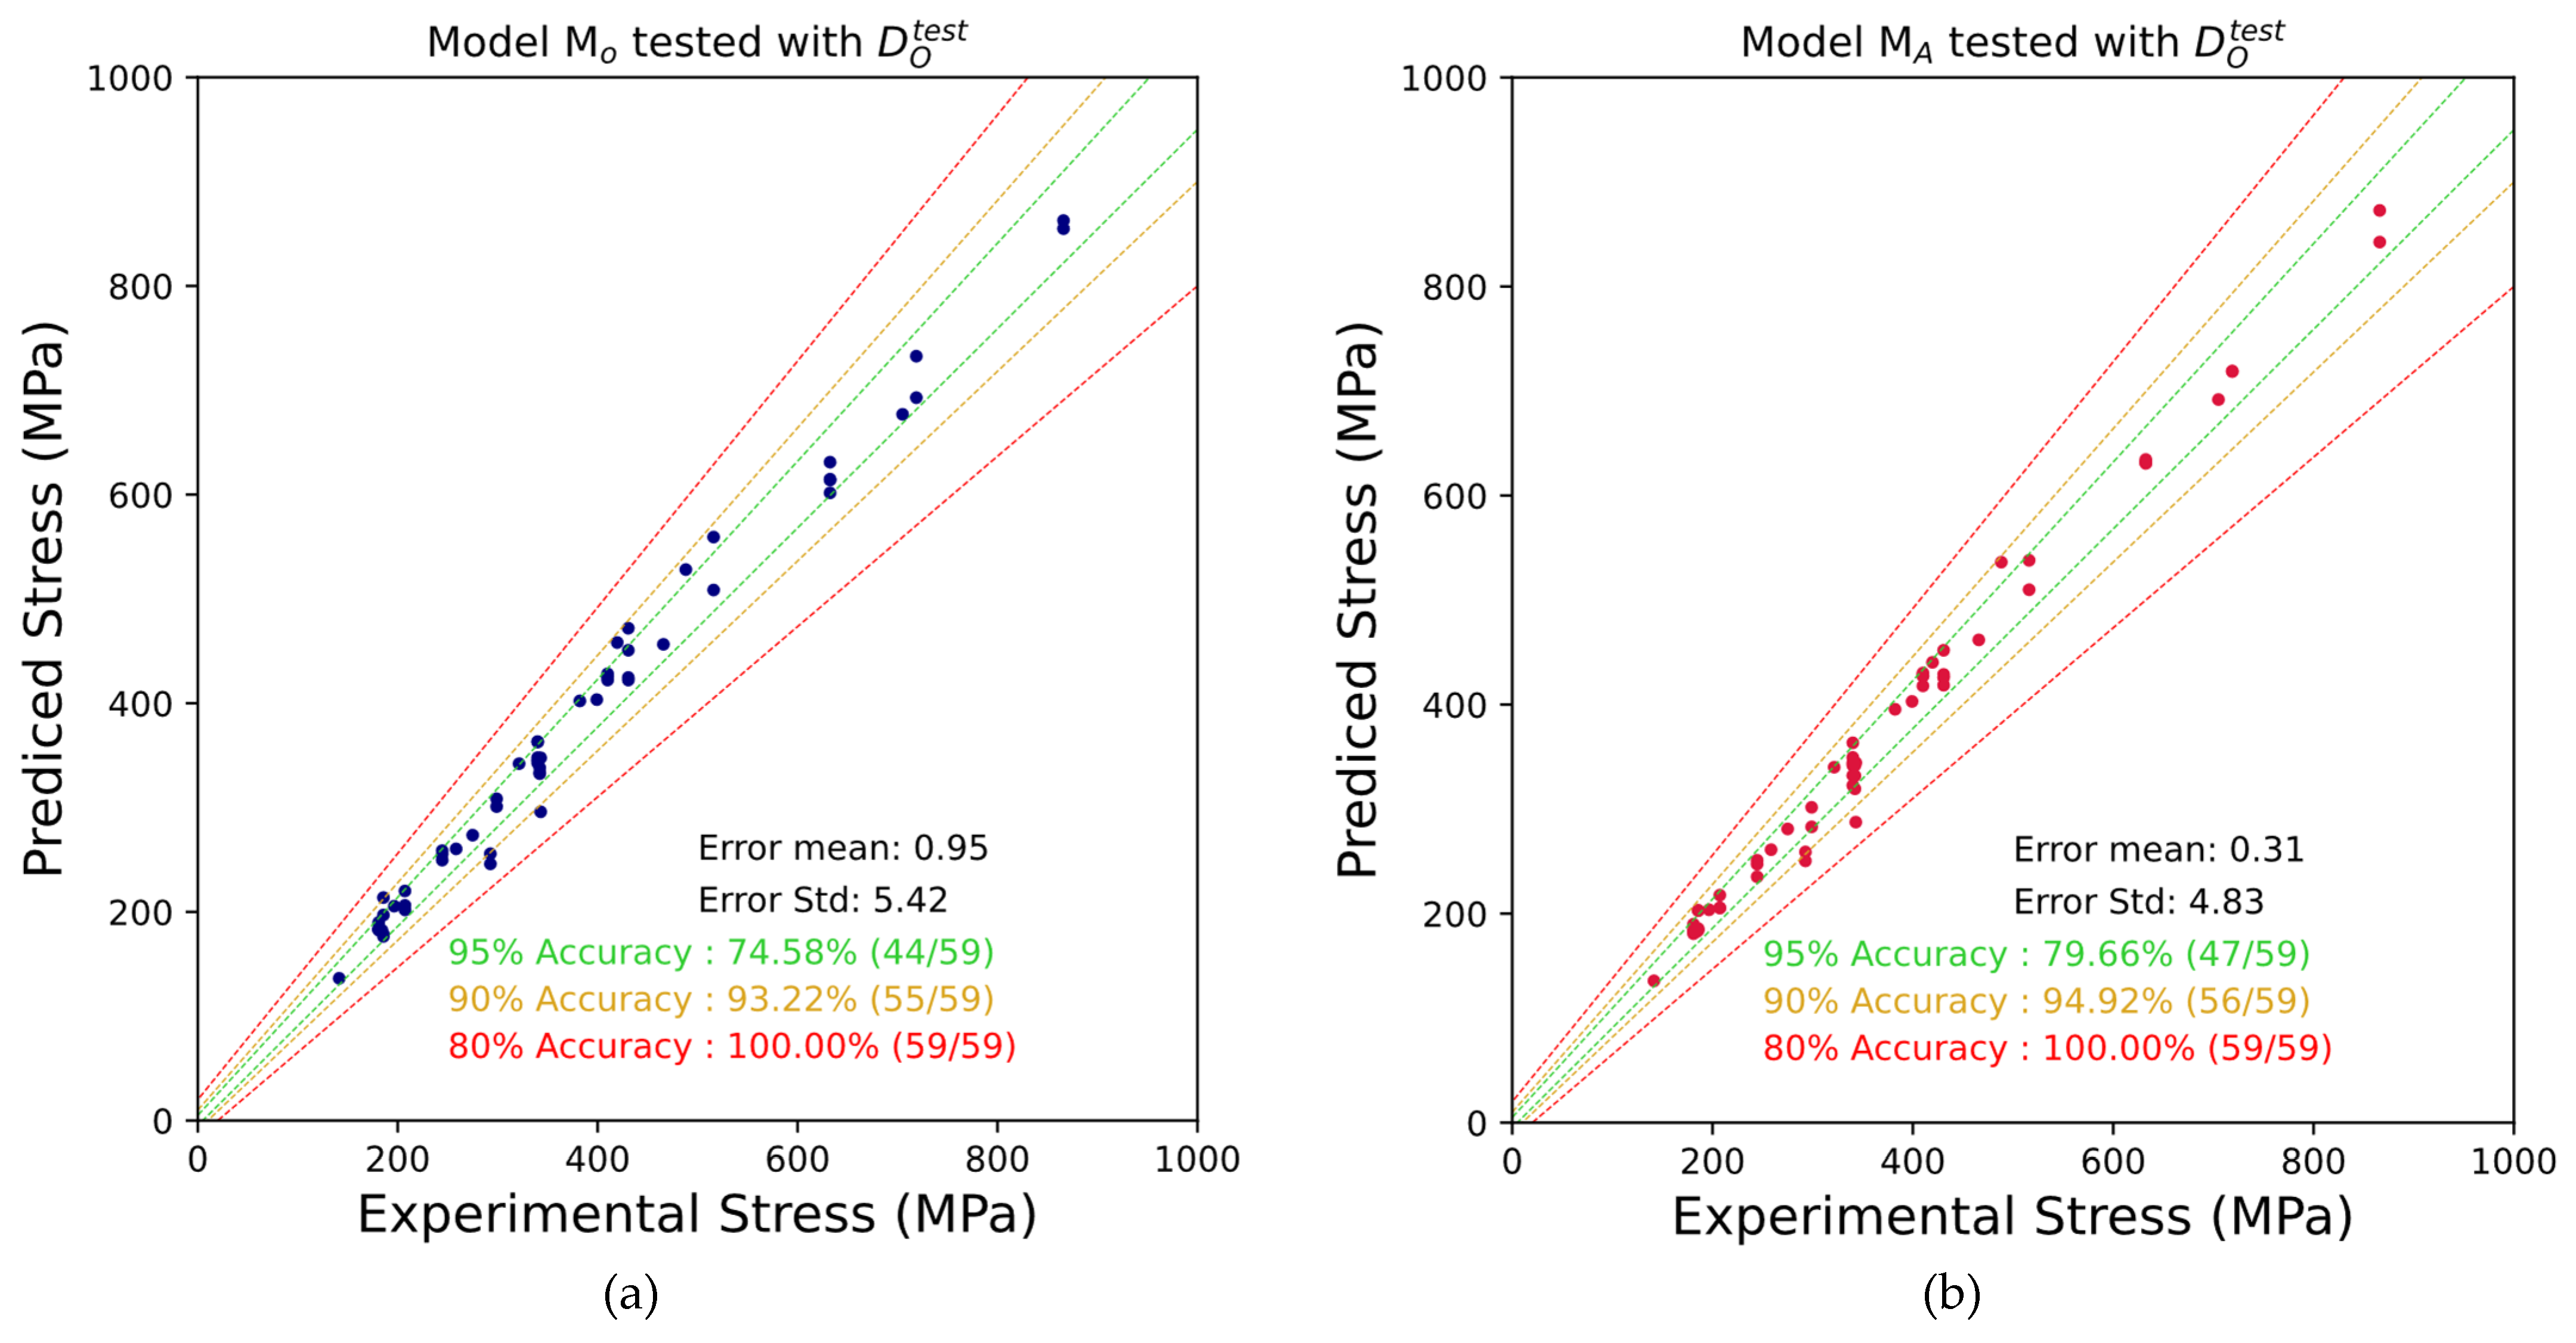
Figure 4.
(a) Predicted stresses using the neural network model trained with the original Fatlim dataset; (b) Predicted stresses using the neural network model trained with the augmented dataset.
Figure 4.
(a) Predicted stresses using the neural network model trained with the original Fatlim dataset; (b) Predicted stresses using the neural network model trained with the augmented dataset.
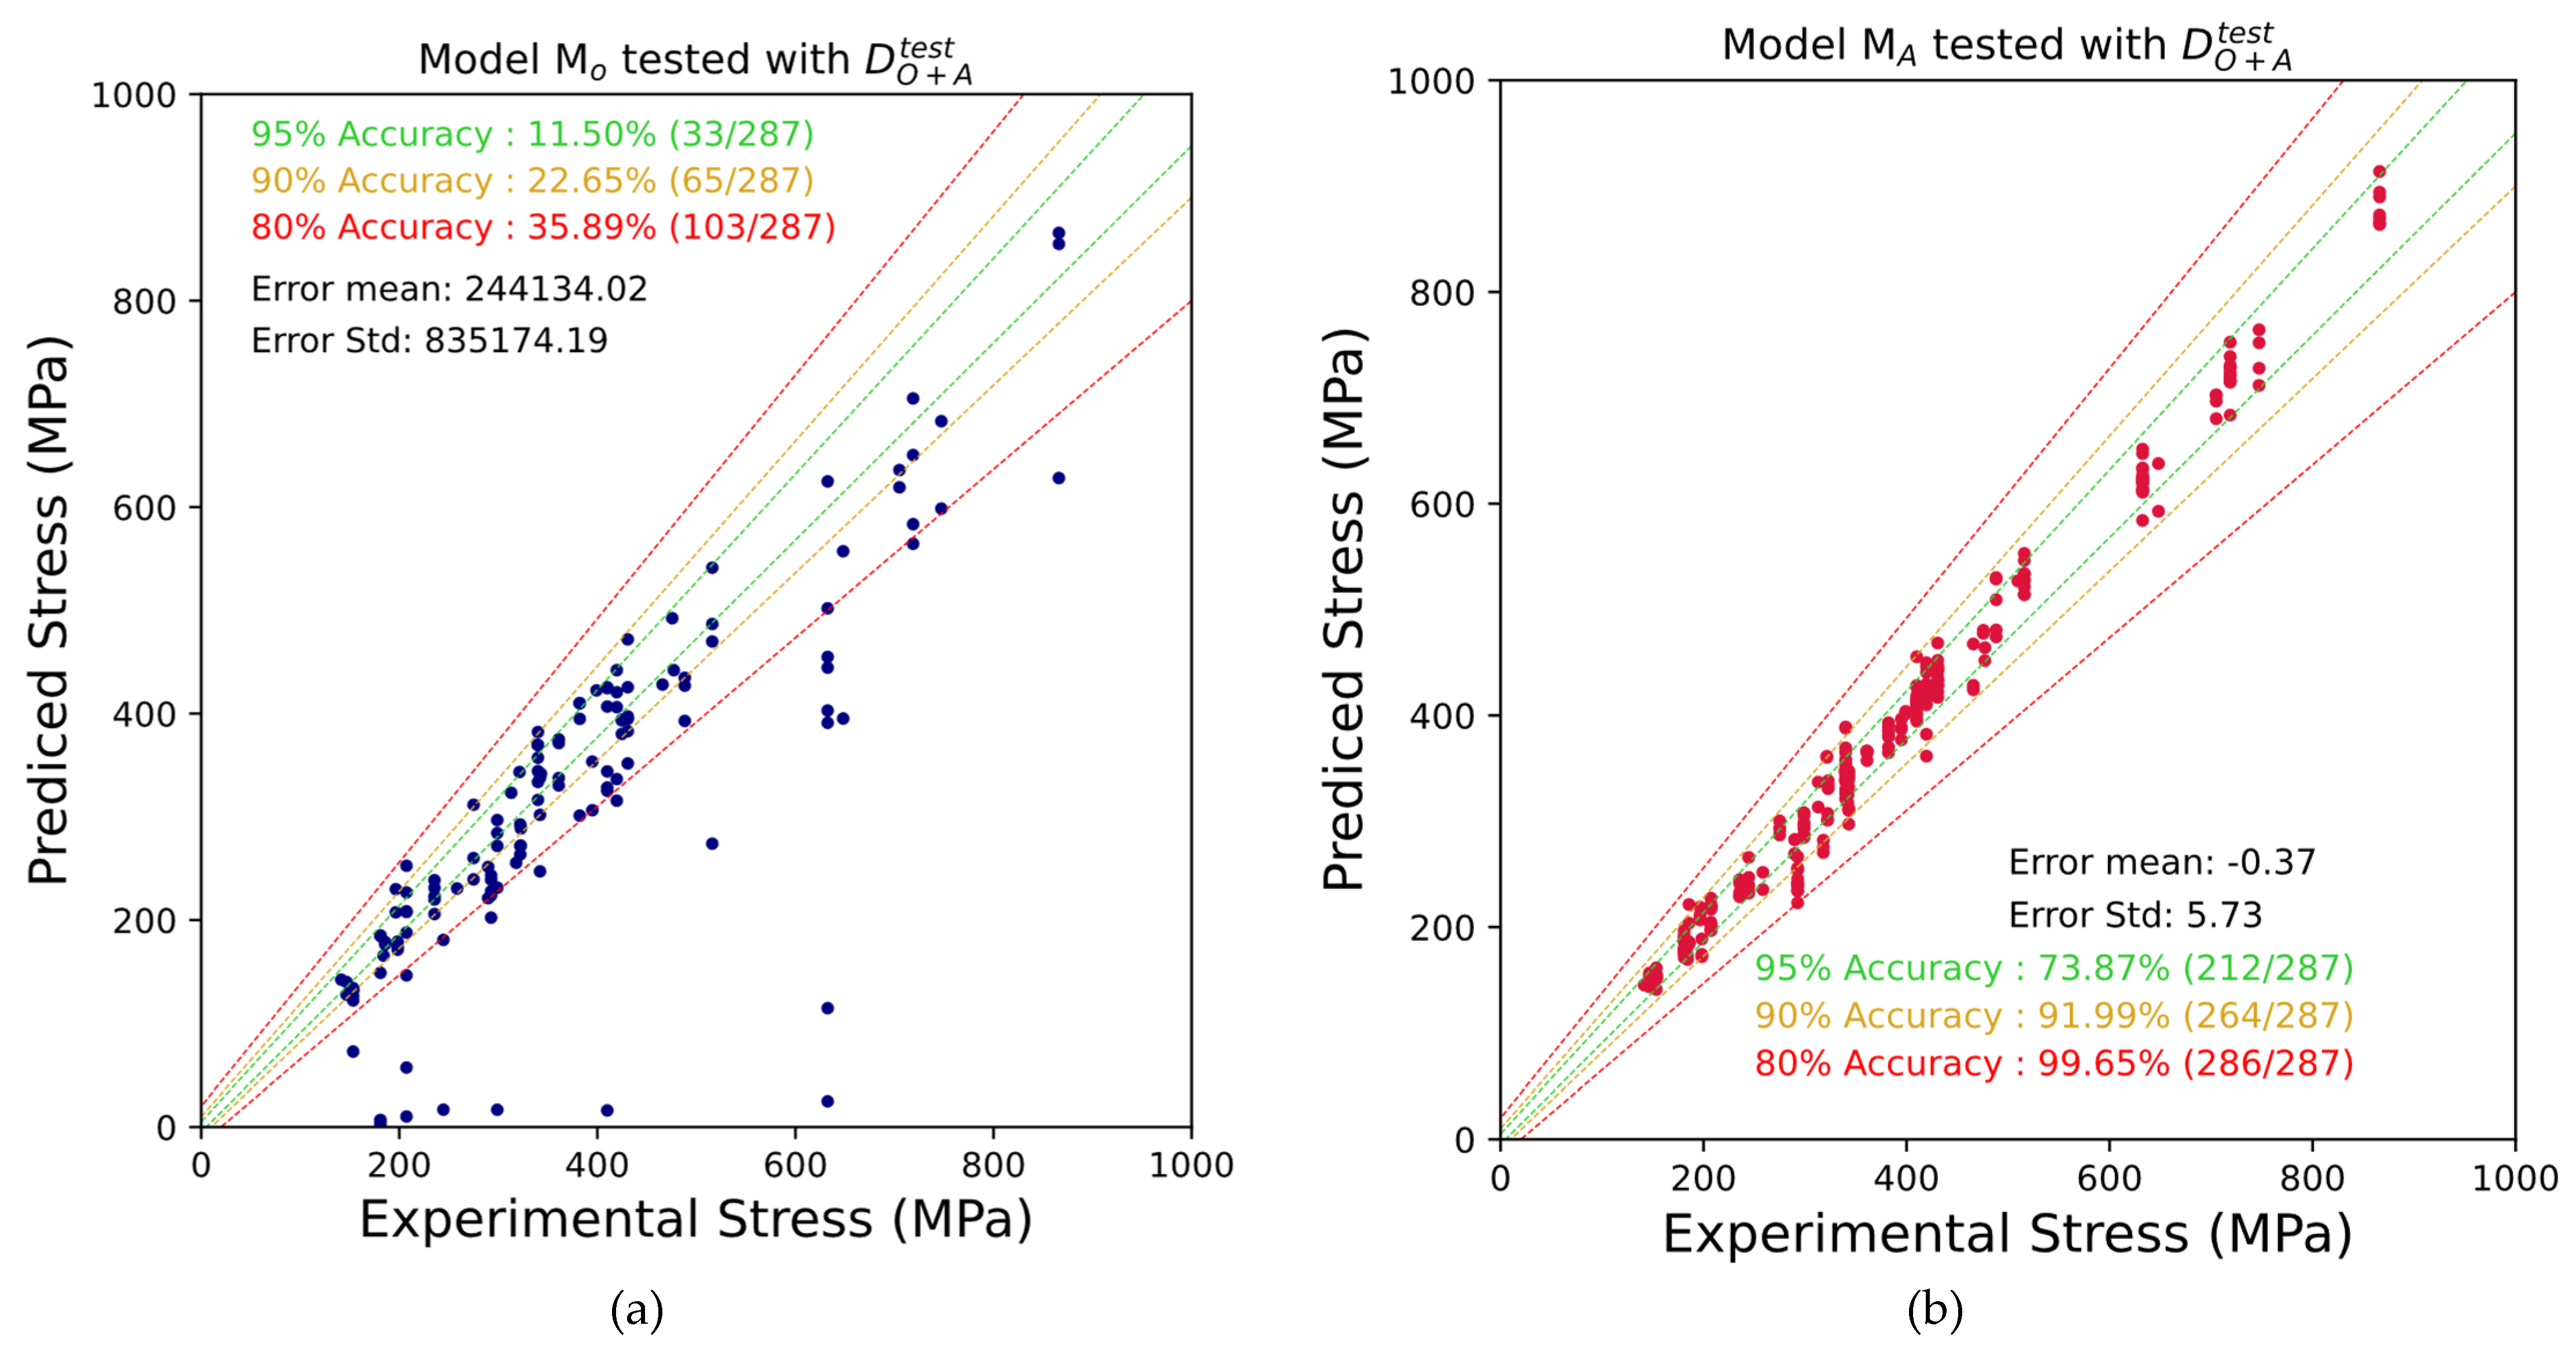

Table 1.
Example of original Datapoint and Corresponding augmented Datapoints.
| No. | Tensile Stress Amplitude | Tensile Mean Stress | Shear Stress amplitude | Shear Mean Stress | Transformation matrix | |||||||||||
| xx | yy | zz | xx | yy | zz | xy | xz | yz | xy | xz | yz | |||||
| 1 | 417 | 510 | 209 | 90 | Original data point | |||||||||||
| 2 | 417 | 510 | -209 | 90 | ||||||||||||
| 3 | 417 | 510 | 209 | 90 | ||||||||||||
| 4 | 417 | 510 | -209 | 90 | ||||||||||||
Table 2.
Example of generating uniaxial loading case with uniaxial loading testing data. * uniaxial loading. † tensor transformation.
Table 2.
Example of generating uniaxial loading case with uniaxial loading testing data. * uniaxial loading. † tensor transformation.
| No. | Tensile Stress amplitude | Tensile Mean Stress | Shear Stress amplitude | Shear Mean Stress | ||||||||||||
| xx | yy | zz | xx | yy | zz | xy | xz | yz | xy | xz | yz | |||||
| 1 | 866 | 541 | 1060 | 822 | 417 | 510 | 209 | |||||||||
| 5 | 866* | |||||||||||||||
| 6 | 866† | |||||||||||||||
| 7 | 866† | |||||||||||||||
| 8 | 541* | |||||||||||||||
| 9 | 541† | |||||||||||||||
| 10 | 541† | |||||||||||||||
| 11 | 530* | 530* | ||||||||||||||
| 12 | 530† | 530† | ||||||||||||||
| 13 | 530† | 530† | ||||||||||||||
| 14 | 411* | 411* | ||||||||||||||
| 15 | 411† | 411† | ||||||||||||||
| 16 | 411† | 411† | ||||||||||||||
Table 3.
Fatigue prediction error of Artificial Neural Network models testing with training dataset.
Table 3.
Fatigue prediction error of Artificial Neural Network models testing with training dataset.
| Model | Fatigue prediction error (%) | |||
| Max | Min | Mean | Standard deviation | |
| Original FatLim | 11.700 | -18.277 | -0.183 | 3.202 |
| Expanded FatLim | 22.769 | -26.909 | -0.149 | 4.585 |
Table 4.
Fatigue prediction error of Artificial Neural Network models testing with
| Model | Fatigue prediction error (%) | |||
| Max | Min | Mean | Standard deviation | |
| Original FatLim | 15.09 | -15.94 | 0.95 | 5.41 |
| Expanded FatLim | 9.84 | -16.17 | 0.31 | 4.83 |
Table 5.
Fatigue prediction error of Artificial Neural Network models testing with
| Model | Fatigue prediction error (%) | |||
| Max | Min | Mean | Standard deviation | |
| Original FatLim | 5.79×10⁶ | -1.00×10² | 2.44×10⁵ | 8.35×10⁵ |
| Expanded FatLim | 19.21 | -23.81 | -0.37 | 5.73 |
Disclaimer/Publisher’s Note: The statements, opinions and data contained in all publications are solely those of the individual author(s) and contributor(s) and not of MDPI and/or the editor(s). MDPI and/or the editor(s) disclaim responsibility for any injury to people or property resulting from any ideas, methods, instructions or products referred to in the content. |
© 2025 by the authors. Licensee MDPI, Basel, Switzerland. This article is an open access article distributed under the terms and conditions of the Creative Commons Attribution (CC BY) license (http://creativecommons.org/licenses/by/4.0/).
Copyright: This open access article is published under a Creative Commons CC BY 4.0 license, which permit the free download, distribution, and reuse, provided that the author and preprint are cited in any reuse.


