
Submitted:
14 April 2025
Posted:
15 April 2025
You are already at the latest version
Abstract
A comparison of the net present value, the payback period and the levelized cost of electricity for three different projects of construction and exploitation of plants for electricity production with the aim of decarbonizing the energy sector is conducted. The first project is building of a large-scale nuclear power plant with a light-water reactor, the second one is a deployment of several identical small modular reactors and the third project is based on solar and wind power plants. Given that the sun and wind are intermittent renewable energy sources, it is inevitable to take into account the construction of an energy storage facility in the last project. The results show that the most profitable are the small modular reactors, while the investment into solar and wind power plants are burdened with the necessary electricity storage plants costs. Another drawback of an investment in solar and wind power plant is their shorter exploitation lifetime of 25 years, compared to the long-term operation of nuclear power plants of 60 years or even more.
Keywords:
net present value
; payback period
; levelized cost of electricity
; nuclear power plant
; small modular reactor
; solar
; wind
; pumped hydroelectric energy storage
1. Introduction
The Republic of Serbia joined the Energy Community for Southeast Europe by signing the Energy Community Treaty in 2005. This Treaty was ratified in 2006 [1]. The Ministerial Council of the Energy Community defined the obligations of member states regarding the increase in the use of renewable energy sources and the reduction of carbon dioxide emissions and other greenhouse gases [2]. Serbia's obligations are to increase the share of renewable energy in gross final energy consumption from 24.67% in 2022. [3] to 40.7% by 2030. This significant, nearly double increase in the share of renewable energy sources within a relatively short period of five years requires a substantial reduction in the consumption of fossil fuels, primarily coal, which accounted for 49.4% of total gross energy consumption in 2020 [4]. The Republic of Serbia is obligated to reduce its total anthropogenic carbon dioxide equivalent emissions, including emissions from agricultural activities, by 40.3% by 2030 compared to emissions in 1990, with the target emissions for 2030 set at 47.82 MtCO2eq. In addition to this, the European Union (EU) began the transitional phase of implementing the "Carbon Border Adjustment Mechanism (CBAM)" on October 1, 2023 [5]. This mechanism involves the payment of taxes within the EU for the import of certain goods produced outside the EU, whose production involves intensive carbon dioxide emissions. So far, the following products are subject to CBAM: cement, iron, steel, aluminum, fertilizers, electricity, and hydrogen. The transitional period for adjustment, monitoring, and development of the mechanism will last until January 1, 2026, after which the CBAM tax will be implemented. The application of the CBAM mechanism will have a significant impact on Serbia, as the EU is its largest foreign trade partner. Achieving the aforementioned goals of increasing the share of renewable energy, reducing greenhouse gas emissions, and adjusting to the restrictions imposed by the CBAM mechanism requires significant decarbonization of the energy sector.
This paper discusses the diversification of the energy mix of the Republic of Serbia, with the aim of reducing carbon dioxide emissions, by using nuclear energy and also by using renewable energy sources such as wind and solar. Three projects are taken into account: building of a large-scale nuclear power plant (LS NPP) with pressurized water reactor (PWR) with a net capacity of 1200 MWel, implementing four small modular reactors (SMR), as a new and modern technology, with a net capacity of 300 MWel each and the construction of solar power plants with a total net capacity of 3033 MWel and wind power plants with a total net capacity of 1706 MWel, which will meet the needs of the electricity consumer in the same way as the previous two projects. The solar and wind are complementary sources during a yearly period. The solar availability is maximum during the summer period, while the wind prevails during the winter. The proposed total solar and wind powers of respectively 3033 MWel and 1706 MWel would produce approximately the same amount of electricity.
The sun and wind are intermittent renewable energy sources, so amounts of electricity produced from these sources must be accumulated to be available to consumers when they need it. Based on meteorological data (regional and local), it is possible to somewhat predict the time intervals in which solar power plants and wind power plants will produce electricity. The operation of solar power plants and wind power plants cannot be regulated except by reducing and interrupting production [6]. In such operating conditions of the power system, it is necessary to consider and select the appropriate technology for energy storage.
Figure 1 shows the available technologies for energy storage, depending on the level of development of storage technology on the one hand, and capital costs and technological risk on the other [7]. The pumped hydroelectric energy storage (PHES) or reversible hydroelectric power plant is flexible, because it works on the principle of pumping water from the lower reservoir or the river into the upper reservoir, when electricity demand is lower, and it produces energy using water from the upper reservoir when the demand increases. PHES produces peak energy to cover maximum daily consumption, which is the most expensive energy on the electricity market. The PHES technology is mainly based on the application of existing equipment whose performance has been confirmed in engineering practice and has the lowest values of capital costs per unit of stored electricity and technological risk. The other technologies stand out that are in the implementation phase, such as plants with compressed air, various electrochemical batteries (NaS, Li-ion,...), flywheels, and plants for heat storage with molten salts. The problem with using Li-ion batteries is their flammability. In 2024, the largest number of incidents 84 (appearance of smoke, fire, device overheating) was recorded in the past 10 years [8]. The risk of self-ignition depends on the condition of the batteries and increases due to shocks or during transport. In the energy sector, there would be a large number of batteries in the same place, which would significantly increase the risk of fire and danger to the environment.
In the Republic of Serbia, the reversible hydropower plant Bajina Basta with an installed capacity of 2x310 MW has a water storage capacity of 150 million m3. By emptying the upper lake, 194 GWh of net electricity can be produced. The construction of the reversible hydropower plant Bistrica, with an installed capacity of 4x164 MW, is planned in western Serbia, in the valley of the Uvac and Lim rivers, with a storage capacity of 70 million m3 in the upper Klak reservoir, which is 310 GWh, which represents support for 1.5 GW of renewable energy sources. The expected time of completion of the works is 2032 [9].
In the present study, the net capacities of the solar and wind power plants are determined from the condition that they together produce the same amount of electricity for a given year as a large-scale nuclear power plant or a power plant with SMRs. The accepted value of the capacity factor, which is the ratio of the produced energy in a certain period to the maximum produced energy in that period, for solar power plant in Serbia is 0.18 [10] and for wind power plant 0.32 [6,11]. The capacity factor for LS NPP with PWR and NPP with SMR is 0.91, although SMR vendors state that a capacity factor for their SMR is 95% or more [12,13]. The capacity factor changes from year to year depending on the annual production achieved, with expected changes, so there is data on the capacity factor that varies over a wide range. Figure 2 shows range of capacity factors from the report that contains data for 243 plats in 24 countries [12].
Levelized cost of electricity (LCOE) is the production price of electricity from a certain source at which no profit is generated, but also no losses are incurred. It represents an economic assessment of the costs of electricity production, which includes all the costs of the plant incurred during its operating lifetime, namely: capital costs, operations and maintenance (O&M) costs, fuel costs and decommissioning costs. Sometimes LCOE calculation takes into account carbon costs [12].
The LCOE is a tool for comparing unit costs at plant level for different base technologies of electricity production during their working life. It represents the economic costs of production technology, not the financial costs of a specific project in a specific market and it is closer to the cost of electricity production in regulated markets with stable prices than in unregulated markets with variable prices.
2. Methods
The cost calculation and following analysis is done based on the adopted value of the total overnight cost for considered technologies: for LS NPP with light-water nuclear reactor 7,777 $/kW, for NPP with SMR 8,349 $/kW, for solar power plant 1,808 $/kW and for wind power plant 2,098 $/kW [14]. These construction prices are for a typical plant for each electricity generating technology before adjusting for regional cost factors. Also, the total overnight cost excludes interest income during the period of plant construction and development. The total overnight costs for wind power plant are without energy storage and for solar power plant they take into account daily energy storage. The total investment for building of a LS NPP with PWR is 9,332 M$, for one SMR 2,505 M$, for solar power plant 5,484 M$ and for wind power plant 3,579 M$. Energy from solar and wind power plants must be stored, which makes it difficult to increase its share in the consumption structure and creates technical, financial and environmental problems. The increase in the share of energy from solar and wind power plants is associated with the costs of their integration into the electricity grid, which many times exceed the costs of building the power plants themselves [6]. For the capital costs for building of the PHES, the lowest recommended value of 5 $/kWh according to [15] was adopted. In order to cover the production of electricity from the sun and wind, the storage capacity of at least 620 GWh (or 3 GW) is required. Hence, the total investment cost in PHES is 3,100 M$.
The common economic and financial performance indicator is the net present value (NPV). It is calculated using the following expression:
where:
- net operating income in year t [$];
- investments and other expenses in year t [$];
- discount rate [-];
- construction period in years;
- projected exploitation lifetime in years;
- discrete time in years.
In Eq.(1) annual incomes, revenues from the sale of electricity achieved during the operating life of the plant, are discounted to the present value; from the obtained value is subtracted the discounted value of the investments and other expenses, such as fuel, decommissioning and O&M costs, and the NPV is obtained. If NPV has a positive value the investment is justified. The payback (PB) period is determined with the NPV equal to zero.
The LCOE calculation is based on the equality of the present value of the sum of discounted revenues on the left hand side of Eq. 2 and the present value of the sum of discounted costs on the right hand side of the Eq. 2 [12], as follows
where:
- electricity generation in year t [MWh];
- electricity price [$/MWh];
- discount rate [-];
- discrete time in years;
- plant lifetime in years;
- investment (capital) costs in year t [$];
- operations and maintenance costs in year t [$];
- fuel costs in year t [$];
- carbon costs in year t [$];
- decommissioning costs in year t [$].
Taking into account the assumption that the electricity price has constant value over time can be brought out of the sum sign, and can be considered as LCOE
The calculation was carried out using the following two assumptions:
- -
- the discount rate at which costs and benefits are discounted is stable and the same for all considered technologies and does not change its value during the lifetime of the project under consideration. Capital costs and the relevant discount rate may vary from technology to technology. Assuming that these costs are identical allows comparison of calculated LCOE values for different technologies and regions;
- -
- electricity price is stable and does not change in time during the project lifetime. All electricity produced, with adopted capacity factors, was sold at this price.
For a simpler approach, annual investments and net annual incomes are divided into equal annual instalments.
The influence of the discount rate on the NPV, the PB period and the LCOE is shown by performing calculations with the 3%, 5% and 8% of the discount rate. The discount rate of 3% corresponds approximately to the social cost of capital, the discount rate of 5% corresponds approximately to the cost of capital of a large utility in a deregulated or restructured market and the discount rate of 8% corresponds approximately to the cost of capital in an environment with relatively higher risks [12]. Nominal discount rates would have a higher value, due to taking inflation into account. In practice, capital costs and discount rates may vary across technologies, assuming identical capital costs and interest rates for all technologies allows for cost comparisons across technologies and regions.
In the analysis of the NPV and the PB period are considered the electricity prices of 80/100/120 $/MWh.
The expected period of exploitation of LS NPP and each SMR unit is 60 years, and for solar and wind power plants 25 years [12,16]. For uniformity, the considered period in which the change in the NPV of these three projects was observed is 60 years from the zero year, i.e. from the beginning of the construction of all plants. In that observed period, it is necessary to build new capacities of solar and wind power plants, after the expiration of their period of exploitation (after 25 years of use).
The losses in the pump and turbine in PHES are not taken into account during calculation. The losses in renewable electricity transport will depend on the exact location of the solar and wind power plants, which is currently unknown. Also, the annual efficiency loss of 0.5%, i.e. the reduced output as their operational lifetime progresses, in solar PV assumed in [12] is not considered.
The subject analysis was made for a total construction period of 9 years for both the large-scale NPP and for all four SMRs. In the case of the project with the four SMRs, it means a successive construction of reactors with assumed construction period of 3 years per SMR, while in the third year of the construction of one SMR, the construction of the next one starts. The average value for commissioning time for OECD and non-OECD countries, for solar PV technology is 2 years and for wind onshore is 3 years [17]. The construction period for PHES is 5 years. The construction timeline is shown in Figure 3.
The nuclear fuel costs per generated energy include costs for the front-end of the nuclear fuel cycle, which imply costs of mining, fuel enrichment and conditioning 7 $/MWh, and costs for the back-end of the nuclear fuel cycle, which include costs of spent fuel removal, disposal and storage 2.33 $/MWh [12]. The costs of recycling nuclear fuel are not considered here. In addition to fuel costs, it is necessary to include decommissioning costs in the analysis of the NPV of the projects. The decommissioning costs of a NPP depend on many factors, such as the type of the NPP, the equipment supplier, the age of the plant, the regulatory of the country where it is located, the capacity of the plant, the location of the plant, etc. and they may vary from 1 to 4 billion euros [18]. 1,500 M$ was assumed for both the decommissioning of the large-scale NPP and the NPP with SMR with a total capacity of 1200 MW. Gross costs of solar power plant decommission are estimated within a range of $0.03-0.20/W, which is around 3-20% of the initial installation costs [19]. Decommissioning costs for onshore wind farms can range from 0.1 to 0.4 M$/MW of capacity [20]. However, it is expected that in the future, methods for recycling materials from wind turbines will improve, so for the sake of conservatism, a lower value of 0.15 M$/MW has been adopted here, which would correspond to estimates for the Chippewa County Wind facility as stated in [20,21].
During commercial operation of the plant, fixed and variable O&M costs occur on an annual basis [22]. Fixed O&M costs are those that do not change with electricity generation, and they generally include labor, materials, contract services and general and administrative costs. O&M costs exclude property taxes and insurance. Routine labor refers to the basic maintenance of equipment recommended by the manufacturer, includes the maintenance of pumps, compressors, transformers, instruments, controls and valves. The typical design of the power plant ensures that routine labor does not require a plant outage. Materials and contract services encompass the materials needed for routine labor as well as contracted services, such as those covered by long-term service agreements that involve recurring monthly payments. General and administrative costs are operational costs, which include leases, management salaries and office utilities. Variable O&M costs fluctuate depending on the amount of generated electricity. These costs include water consumption, waste and wastewater discharge, chemicals and consumables. Fuel is not included.
It was assumed that the O&M costs for a large-scale nuclear power plant with PWR are the same as for a NPP with SMRs and that they are equal to 15 $/MWh. This value is close to the value for French technology EPR 1650 MWe [22] and also close to the optimistic O&M fixed and variable costs published in [23].
Average O&M costs for a solar PV power plant in Europe in 2019. were reported at 10 $/kW per year in [24,25].
The maintenance costs of wind power plants vary depending on a number of factors, including location, plant size and contractual terms. According to available data, the total maintenance costs of wind farms can range between 20 and 25 €/MWh [26]. These costs include turbine maintenance, plant operation, environmental monitoring, legal affairs and insurance.
The maintenance costs of wind power plants, which are covered by the contract, in the region amount to around 10 €/MWh, other costs that include maintenance not covered by the contract, plant management, environmental protection, legal affairs and insurance amount to 10 €/MWh. These costs are added to the costs of the local self-government fee which are approximately 1.5 €/MWh and also the fee for the use of state land ≈ 1.5 €/MWh, which makes a total of 23 €/MWh [26]. The O&M costs can be expressed as a share of LCOE. The share of O&M costs for onshore wind goes up to 30% of LCOE for this technology [27].
The input data for calculating net present value and levelized cost of electricity are sorted out in the Table 1, due to clearer understanding.
3. Results
The obtained results are shown in Figure 4, Figure 5 and Figure 6 for different electricity prices. Figure 4 presents the NPV for the three projects considered for the electricity price of 80 $/MWh, in Figure 5 for 100 $/MWh and in Figure 6 for 120 $/MWh. Each Figure contains three diagrams of NPV changes with time, for three different values of the discount rate 3%, 5% and 8%. There are three lines on each diagram which represent the three projects: solid line for LS NPP with PWR, dashed line for NPP with four SMRs and dotted line for solar and wind power plants in combination with PHES.
The lower the discount rate, the higher the net present value. For the electricity price of 80$/MWh (Figure 4), the maximum NPV is for a project with four SMRs for a discount rate of 3%, with a PB period of 36 years. For the project with LS NPP the PB period is 40 years (Figure 4), and for the project with solar and wind power and PHES the NPV has always been negative. In Figure 5 and Figure 6, for the electricity prices of 100/120 $/MWh, the shortest PB period, of 23/18 years, is for a project that includes renewable energy sources for a discount rate of 3%, but it is not competitive due to the later decrease in NPV caused by the increase in investment after the end of the plant's operating life of 25 years. The increase in the electricity price leads to the NPV increases, and consequently shortens the PB period, so the PB periods for 3% discount rate and the electricity price of 100 $/MWh goes from 25 and 29 years (Figure 5) for NPP with SMR and LS NPP respectively, to 20 and 24 years for price of 120 $/MWh (Figure 6).
In the case with a discount rate of 5% and the electricity price of 80 $/MWh, NPVs are never positive for all considered projects (Figure 4). The NPV has a very low value for a discount rate of 5% and the electricity price of 100 $/MWh in both projects with a NPP, with a SMR or with a classic PWR. This results with significantly longer PB periods of 42 and 33 years (Figure 5), respectively, while for discount rate of 8% the NPV has all the time negative value for all three projects considered.
The NPV for NPP with SMR, in Figure 4, Figure 5 and Figure 6, reaches a positive value much earlier and has a greater value than in the case of the project with the LS NPP, due to successive construction and earlier start of operation of SMRs, which leads to incomes from electricity production and in this way repayment of the investment is faster. The PB period in the case of investment in four SMRs is from 20 to 44 years, depending on the value of the discount rate and the electricity price. On the other hand, the PB period for the large-scale NPP ranges from 24 to 42 years. The project with four SMRs is the only one who has positive NPV for a discount rate of 8% (Figure 6), which makes it the only project that is theoretically profitable for the highest discount rate considered, although the PB period of 44 years is too long.
Due to additional investments and the necessary construction of new facilities, in the observed period of 60 years, the NPV of a project including renewable energy sources becomes positive, before the 40. year, only for higher electricity prices and for the lowest discount rate.
Figure 7 shows the LCOE values for the three considered projects and for the range of discount rates from 3% to 8%. All LCOE values are calculated for the 60th year from the start of plants construction. When looking at the calculated LCOE values for a discount rate of 3%, it can be seen that the value is $66/MWh for project with four SMRs, $67/MWh for LS NPP with PWR, while for the combination of solar power plant, wind powerplant and PHES, this value is significantly higher, approximately $88/MWh. In the literature [12], LCOE values for different plant types based on technologies from different countries are presented. For new build plants and a discount rate of 3%, the LCOE value for nuclear power plants ranges from approximately $27/MWh for Russian VVER Pressurized Water Reactor to approximately $61/MWh for Japanese Advanced Light Water Reactor. The increased LCOE value presented in this paper is a consequence of the anticipated slightly higher investment costs of the facilities.
4. Conclusions
A techno-economic analysis of the implementation of various electricity generation technologies that help decarbonize the energy sector of the Republic of Serbia has been conducted. The application of nuclear energy is envisaged in two ways: the large-scale nuclear power plants with light water nuclear reactors or nuclear power plants with multiple modules of SMRs. As an alternative energy source to nuclear, solar and wind energy has been proposed. Due to the intermittence of renewable energy sources, their application is possible with the use of energy storage. Pumped hydroelectric energy storage was chosen because of its lowest capital cost and least technological risk.
The NPV for the project with four SMRs earlier becomes positive and is greater than the NPV for the project with the LS NPP, due to sequential construction of SMR and earlier revenue from the sale of the electricity which makes the investment payback faster. The PB period for project with four SMRs is from 18 to 37 years, depending on the value of the discount rate and the electricity price. The shortest PB period is for 3% discount rate and the electricity price of 120 M$/MWh. However, the PB period for the LS NPP varies from 21 to 48 years.
Analysis for LCOE showed that the lowest value is in case of project with four SMRs for all considered range of discount rates. It can be seen that for the lowest discount rate the LCOE for projects with SMR and with PWR have similar values of approximately 67 $/MWh. For the highest discount rate PWR project and project with combination of renewable energy sources and PHES have similar values of 135 $/MWh.
The most cost-effective project is one with four SMRs due to consecutive building of modules. The project with solar and wind power plants and PHES is not cost-effective due to the short projected exploitation lifetime of these plants, which is 25 years, and the need to build new units in the observed period of 60 years.
Author Contributions
Sanja Milivojevic: writing – original draft, methodology, investigation, conceptualization; Milan M. Petrovic: methodology, investigation, conceptualization; Vladimir D. Stevanovic: supervision, methodology, investigation, conceptualization; Jovica Riznic: Writing - review & editing, resources; Milos Lazarevic: visualization, software, resources.
Funding
This research was funded by the Science Fund of the Republic of Serbia, #GRANT No 3434, Improving operational flexibility of decarbonized thermal power plants with energy storage toward increased renewable sources utilization – TPP-RSU.
Data Availability Statement
Data will be made available on request.
Conflicts of Interest
The authors declare no conflicts of interest. The funders had no role in the design of the study; in the collection, analyses, or interpretation of data; in the writing of the manuscript; or in the decision to publish the results.
Abbreviations
The following abbreviations are used in this manuscript:
| CBAM | Carbon Border Adjustment Mechanism |
| LCOE | Levelized Cost of Electricity |
| LS | Large Scale |
| NPP | Nuclear Power Plant |
| NPV | Net Present Value |
| O&M | Operations and Maintenance |
| PB | Payback |
| PHES | Power Hydroelectric Energy System |
| PWR | Pressurized Water Reactor |
| SMR | Small Modular Reactor |
References
- Law on the ratification of the Energy Community Treaty between the European Community and the Republic of Albania, the Republic of Bulgaria, Bosnia and Herzegovina, the Republic of Croatia, the former Yugoslav Republic of Macedonia, the Republic of Montenegro, Romania, the Republic of Serbia and the United Nations Interim Administration Mission in Kosovo in accordance with Security Council Resolution 1244 of the United Nations, Official Gazette of the Republic of Serbia no. 62/2006.
- Decision of the ministerial council of the energy community No 2022/02/MC-EnC. Available online: https://www.energy-community.org/legal/acquis.html (accessed on 13.02.2025.).
- Statistical Office of the Republic of Serbia, Renewable energy share in the total final energy consumption, Available online: https://data.stat.gov.rs/Home/Result/SDGUN070201?caller=SDGUN&languageCode=sr-Latn (accessed on 13.02.2025.).
- Energy balance of the Republic of Serbia for 2022. Available online: https://www.mre.gov.rs/extfile/sr/1144/energetski_bilans_rs_za_2022__0.pdf (accessed on 13.02.2025.).
- Carbon Border Adjustment Mechanism, European Commission, Regulation 2023/956.
- Development of the electric power industry of the Republic of Serbia up to the year 2050, Serbian Academy of Sciences and Arts Department of technical sciences, Academy board for energy, Belgrade, Serbia, 2023. (in Serbian).
- Leading the Energy Transition Factbook – Electricity Storage; SBC Energy Institute: Gravenhage, TX, USA, 2013. Available online: https://wecanfigurethisout.org/ENERGY/Web_notes/Round_Pegs/Power_Cycles_and_Energy_Storage_Supporting_Files/Electricity%20Storage%20-%20SBC%20Energy%20Institute%202013.pdf (accessed on 13.02.2025.).
- Federal Aviation Administration, Lithium Battery Incidents. Available online: https://www.faa.gov/hazmat/resources/lithium_batteries/incidents (accessed on 18.02.2025.).
- Stanimirovic, V. Djordjevic, JSC EPS – Overview & Serbian Nuclear Energy, Electric Power Industry of Serbia; presented at: Foundational Infrastructure for the Responsible Use of Small Modular Reactor Technology – FIRST, 2024. Belgrade.
- V. Stevanovic, Program for the introduction of nuclear energy and the development of organizational, institutional and technical technological infrastructure, Nuclear Power Plants in Serbian Energy, Serbian Academy of Sciences and Arts, Belgrade, November 2022. (in Serbian).
- A. Đorđević, Ž. Đurišić, Mathematical model for the optimal determination of voltage level and PCC for large wind farms connection to transmission network. IET Renewable Power Generation. 13 (12), 2019, pp. 2240-2250. [CrossRef]
- Projected Costs of Generating Electricity, 2020 Edition, International Energy Agency, Nuclear Energy Agency Organisation for Economic Co-operation and Development. Available online: https://iea.blob.core.windows.net/assets/ae17da3d-e8a5-4163-a3ec-2e6fb0b5677d/Projected-Costs-of-Generating-Electricity-2020.pdf (accessed on 13.02.2025.).
- Small modular reactors, Catalogue 2024, International Atomic Energy Agency, 2024. Available online: https://aris.iaea.org/Publications/SMR_catalogue_2024.pdf (accessed on 13.02.2025.).
- U.S. Energy Information Administration (EIA), Nuclear explained-Nuclear power plants. Available online: www.eia.gov/outlooks/aeo/assumptions/pdf/elec_cost_perf.pdf (accessed on 12.02.2025.).
- H. L. Ferreira, R. Garde, G. Fulli, W. Kling, J. P. Lopes, Characterisation of electrical energy storage technologies. Energy, 53, 2013, pp. 288-298. [CrossRef]
- T. Koivunen, E. Hirvijoki, Effect of investment cost on technology preference in a flexible, low-carbon Finnish power system. Nuclear energy and design, 417, 112854, 2024, pp. 1-15. [CrossRef]
- A. Gumber, Z. Riccardo, B. Steffen, A global analysis of renewable energy project commissioning timelines. Applied Energy, 358, 122563, 2024, pp. 1-29. [CrossRef]
- World nuclear association, Nuclear fuel cycle, Decommissioning Nuclear Facilities. Available online: https://world-nuclear.org/information-library/nuclear-fuel-cycle/nuclear-waste/decommissioning-nuclear-facilities (accessed on 19.02.2025.).
- Thunder Said Energy, Solar power: decommissioning costs, Available online: https://thundersaidenergy.com/downloads/solar-power-decommissioning-costs/ (accessed on 19.02.2025.).
- The Institute for Energy Research, The Cost of Decommissioning Wind Turbines is Huge. Available online: https://www.instituteforenergyresearch.org/renewable/wind/the-cost-of-decommissioning-wind-turbines-is-huge/ (accessed on 19.02.2025.).
- Palmer’s Creek Wind Farm Site Permit Application Chippewa County, Minnesota. Available online: https://www.edockets.state.mn.us/documents/%7B29950B36-761E-4C68-B259-F0FBF90842F4%7D/download (accessed on 19.02.2025.).
- U.S. Energy Information Administration (EIA), Capital Cost and Performance Characteristic Estimates for Utility Scale Electric Power Generating Technologies. Available online: https://www.eia.gov/analysis/studies/powerplants/capitalcost/pdf/capital_cost_aeo2020.pdf (accessed on 19.02.2025.).
- L. M. Larsen, N. Guaita, I. Lantgios, J. Zhou, A. Abou-Jaoude, N. Stauff, Nuclear Energy Cost Estimates for Net Zero World Initiative – 2024 Update, Idaho National Laboratory, INL/RPT-24-80552, 2024. Available online: https://inldigitallibrary.inl.gov/sites/sti/sti/Sort_130016.pdf (accessed on 19.02.2025).
- Steffen, M. Beuse, P. Tautorat, T. S. Schmidt, Experience Curves for Operations and Maintenance Costs of Renewable Energy Technologies. Joule, Vol. 4/2, 2019, pp. 359–75. [CrossRef]
- E. Vartiainen, G. Masson, C. Breyer, D. Moser, E. R. Medina, Impact of weighted average cost of capital, capital expenditure, and other parameters on future utility-scale PV levelised cost of electricity, Progress in Photovoltaics, Vol. 28/6, 2019, pp. 439–453. [CrossRef]
- Ivkovic, Wind power plants, Profitability of investments in distributed sources of electricity, November 2014. (in Croatian) Available online: https://www.ho-cired.hr/wp-content/uploads/2014/12/Ivkovic_-Vjetroelektrane_1.pdf (accessed on 19.02.2025.).
- International Renewable Energy Agency, Renewable Power Generation Costs in 2023. Available online: https://www.irena.org/-/media/Files/IRENA/Agency/Publication/2024/Sep/IRENA_Renewable_power_generation_costs_in_2023.pdf (accessed on 19.02.2025.).
Figure 1.
Dependence of the level of development of the energy storage technology on capital requirement and technological risk [7].
Figure 1.
Dependence of the level of development of the energy storage technology on capital requirement and technological risk [7].
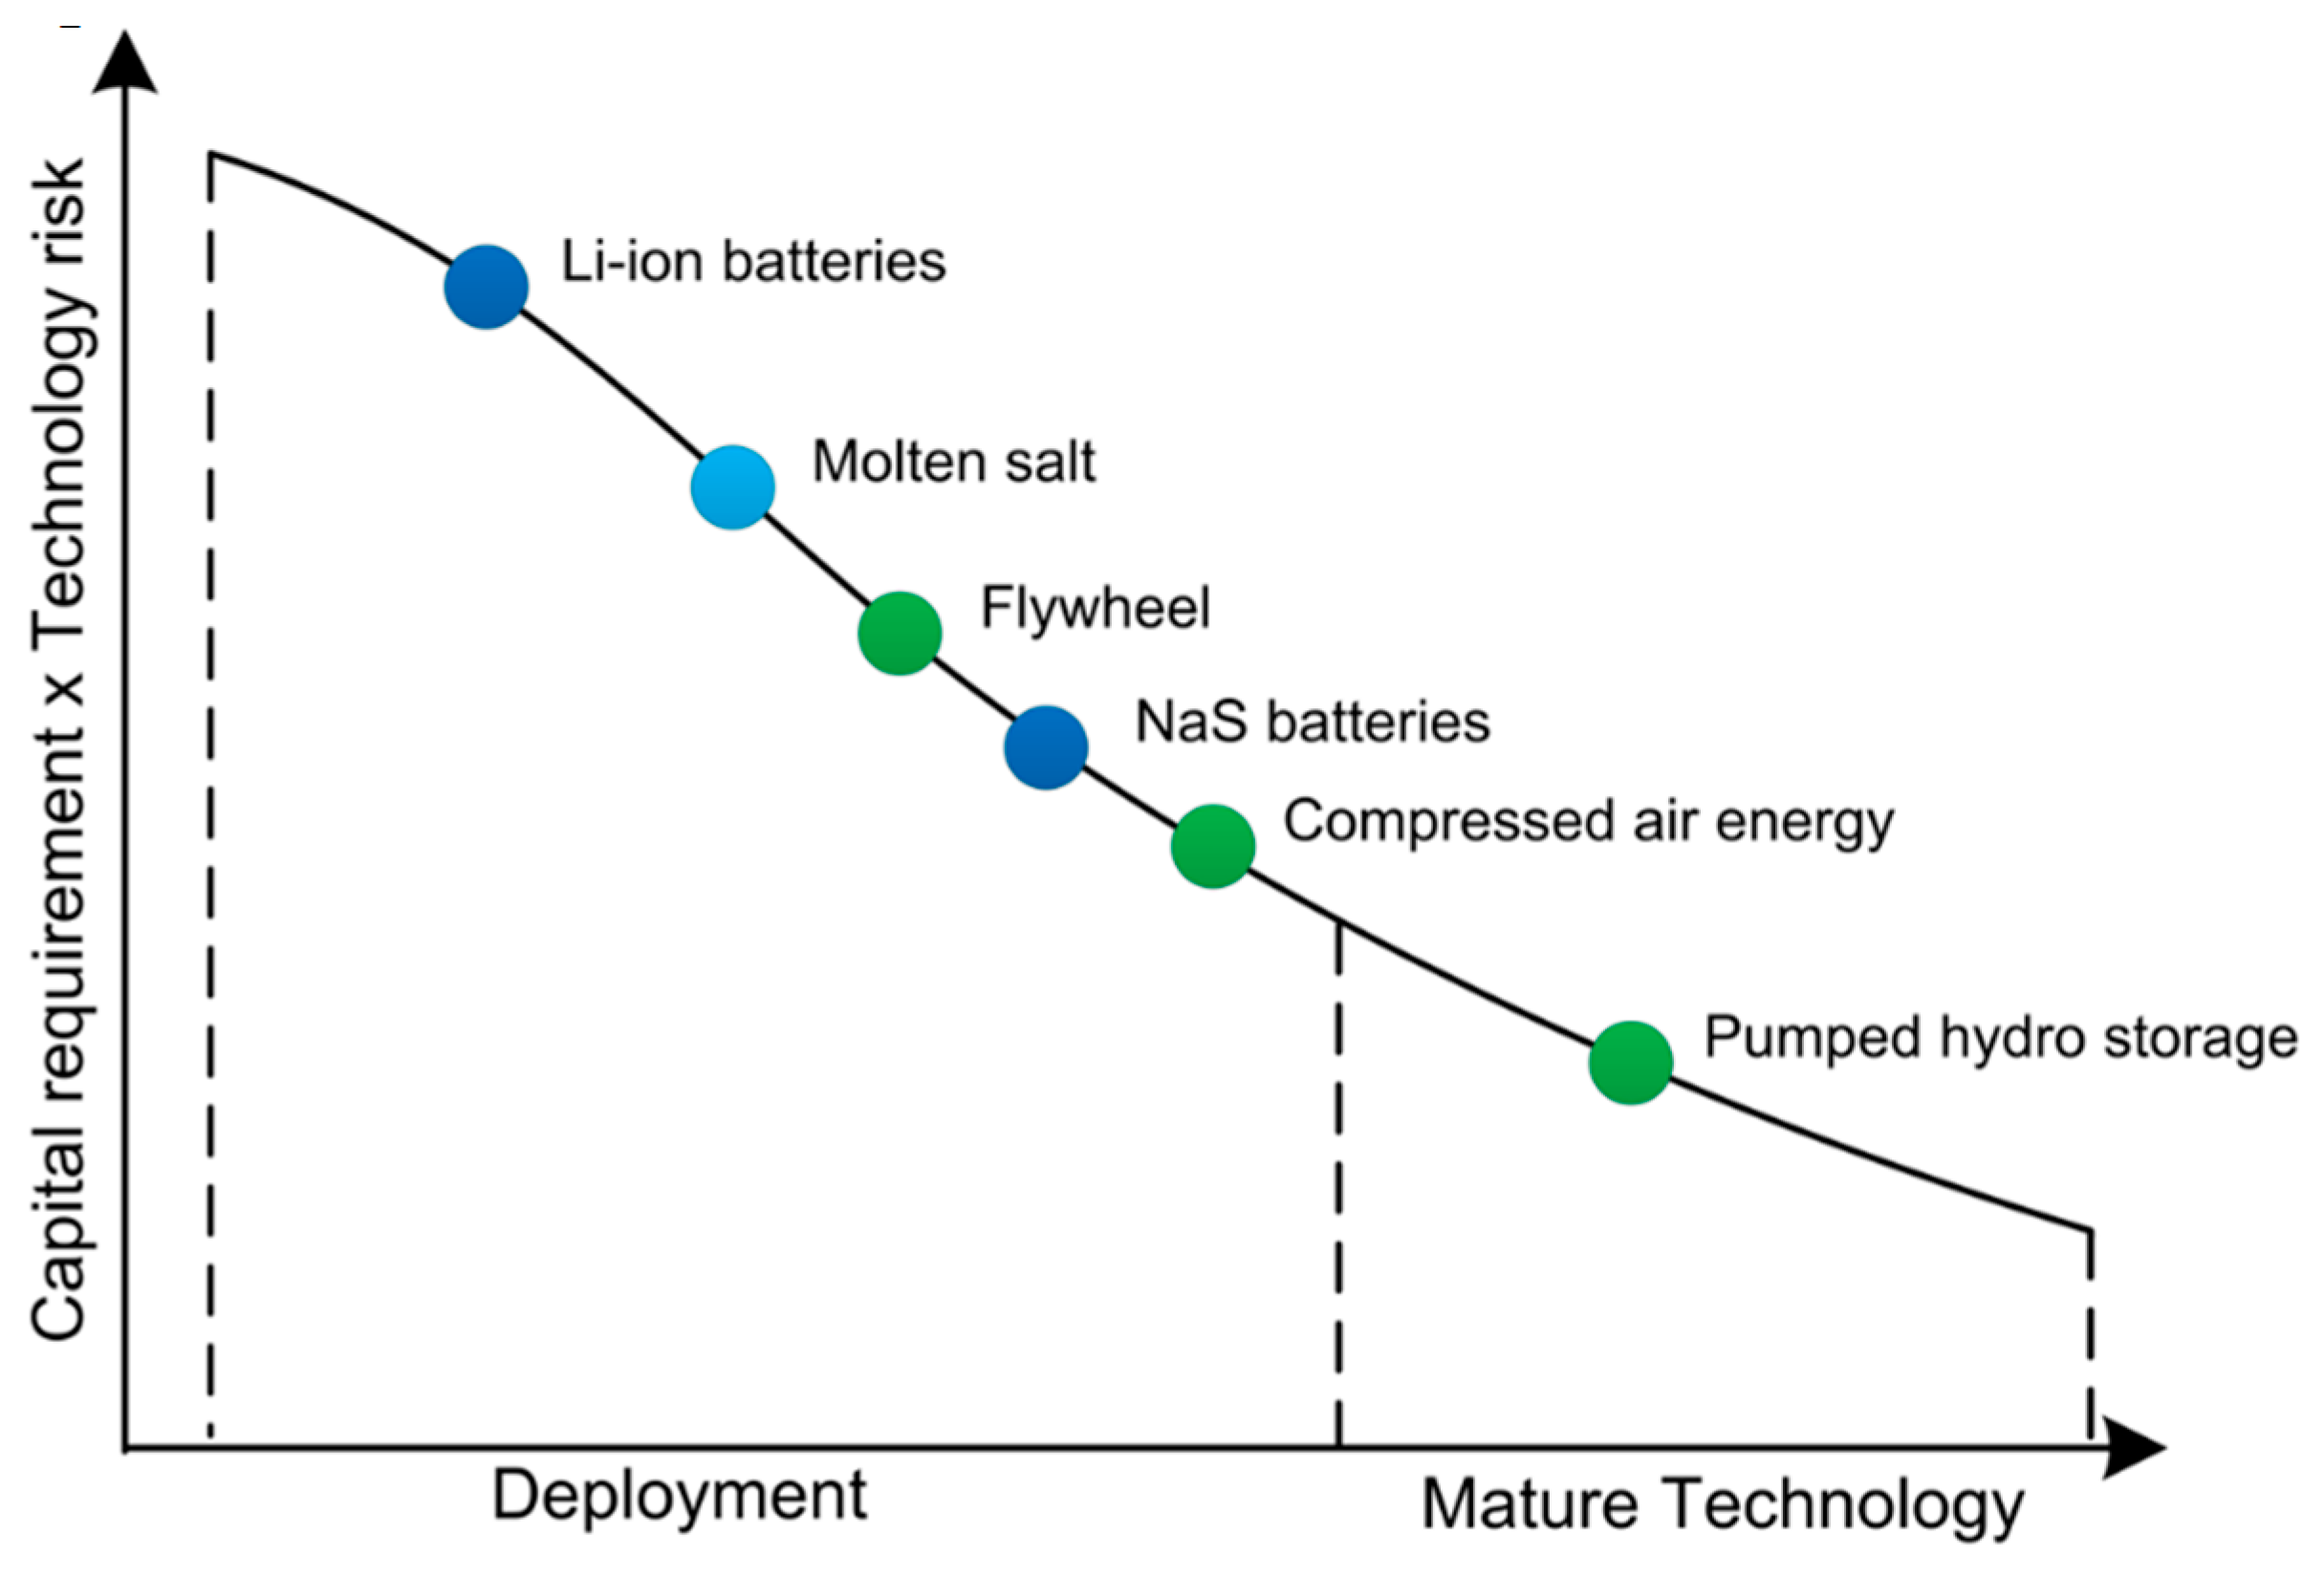
Figure 2.
Range of assumed capacity factors. The report contains data for 243 plants in 24 countries including 5 non-OECD countries: Brazil, People’s Republic of China, India, Romania, the Russian Federation and South Africa [12].
Figure 2.
Range of assumed capacity factors. The report contains data for 243 plants in 24 countries including 5 non-OECD countries: Brazil, People’s Republic of China, India, Romania, the Russian Federation and South Africa [12].
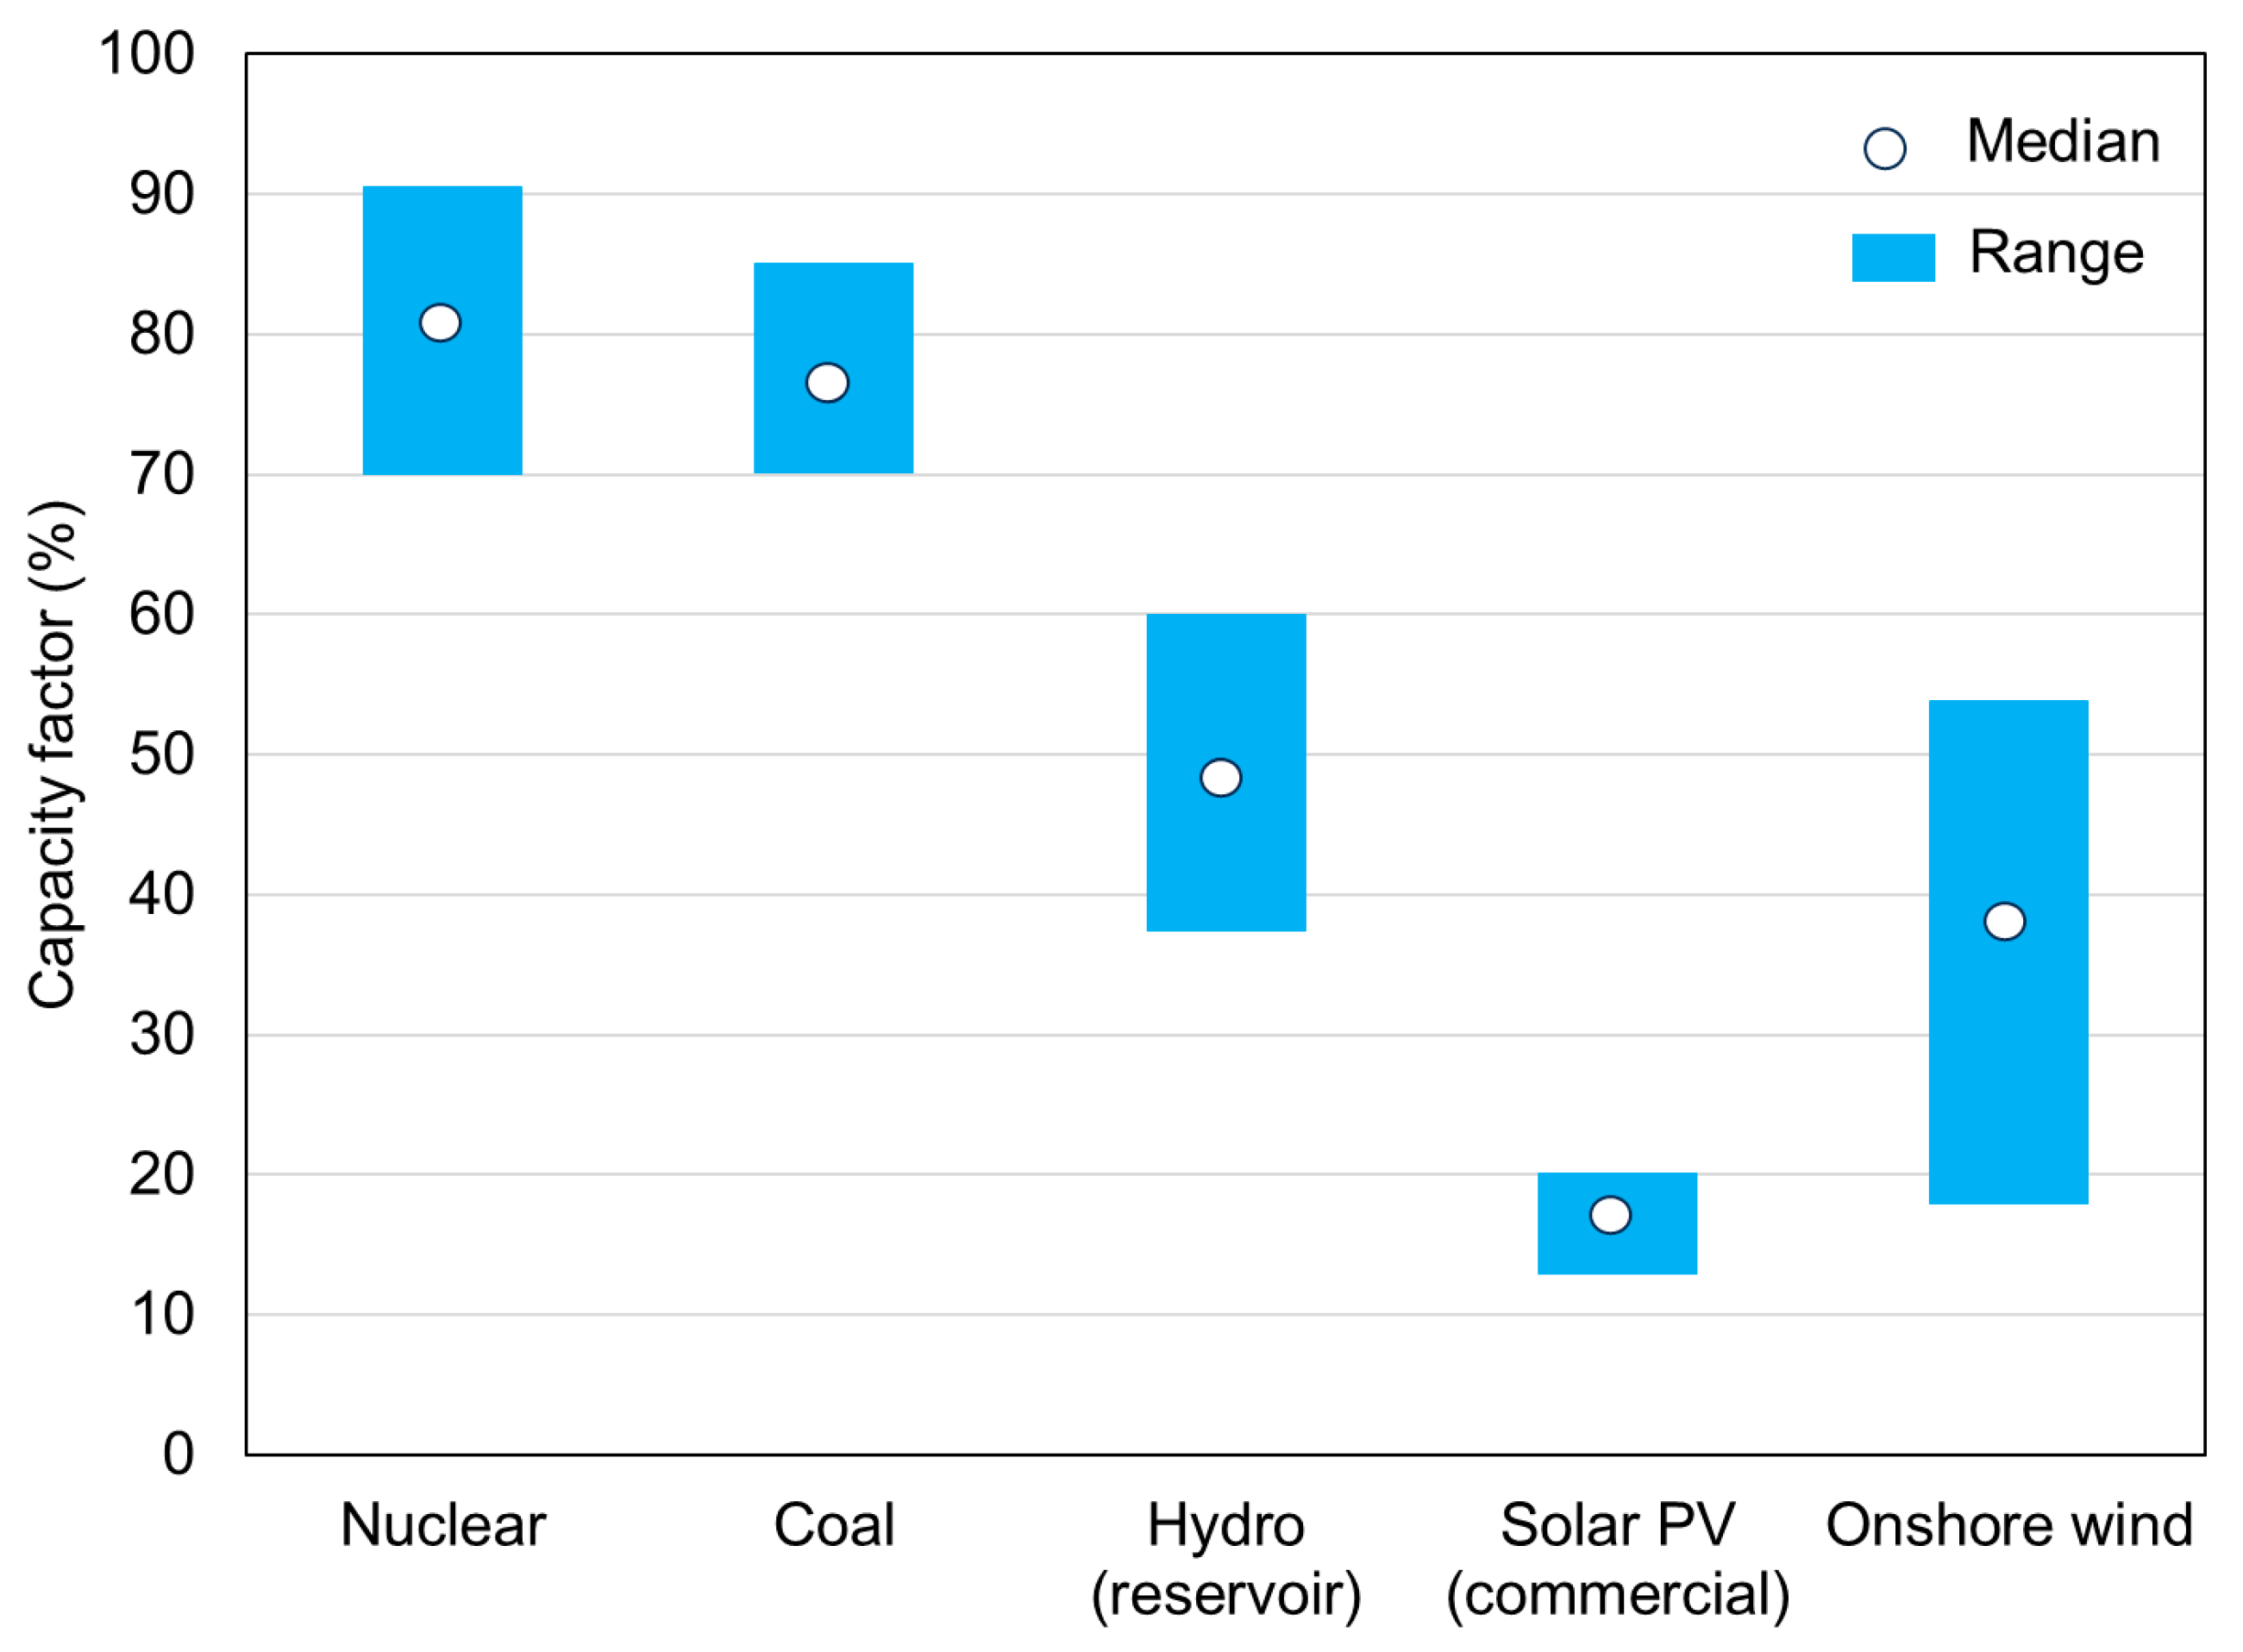
Figure 3.
The timeline of construction for one LS NPP with PWR, NPP with four SMRs, solar power plant, wind power plant and pump hydroelectric energy storage.
Figure 3.
The timeline of construction for one LS NPP with PWR, NPP with four SMRs, solar power plant, wind power plant and pump hydroelectric energy storage.
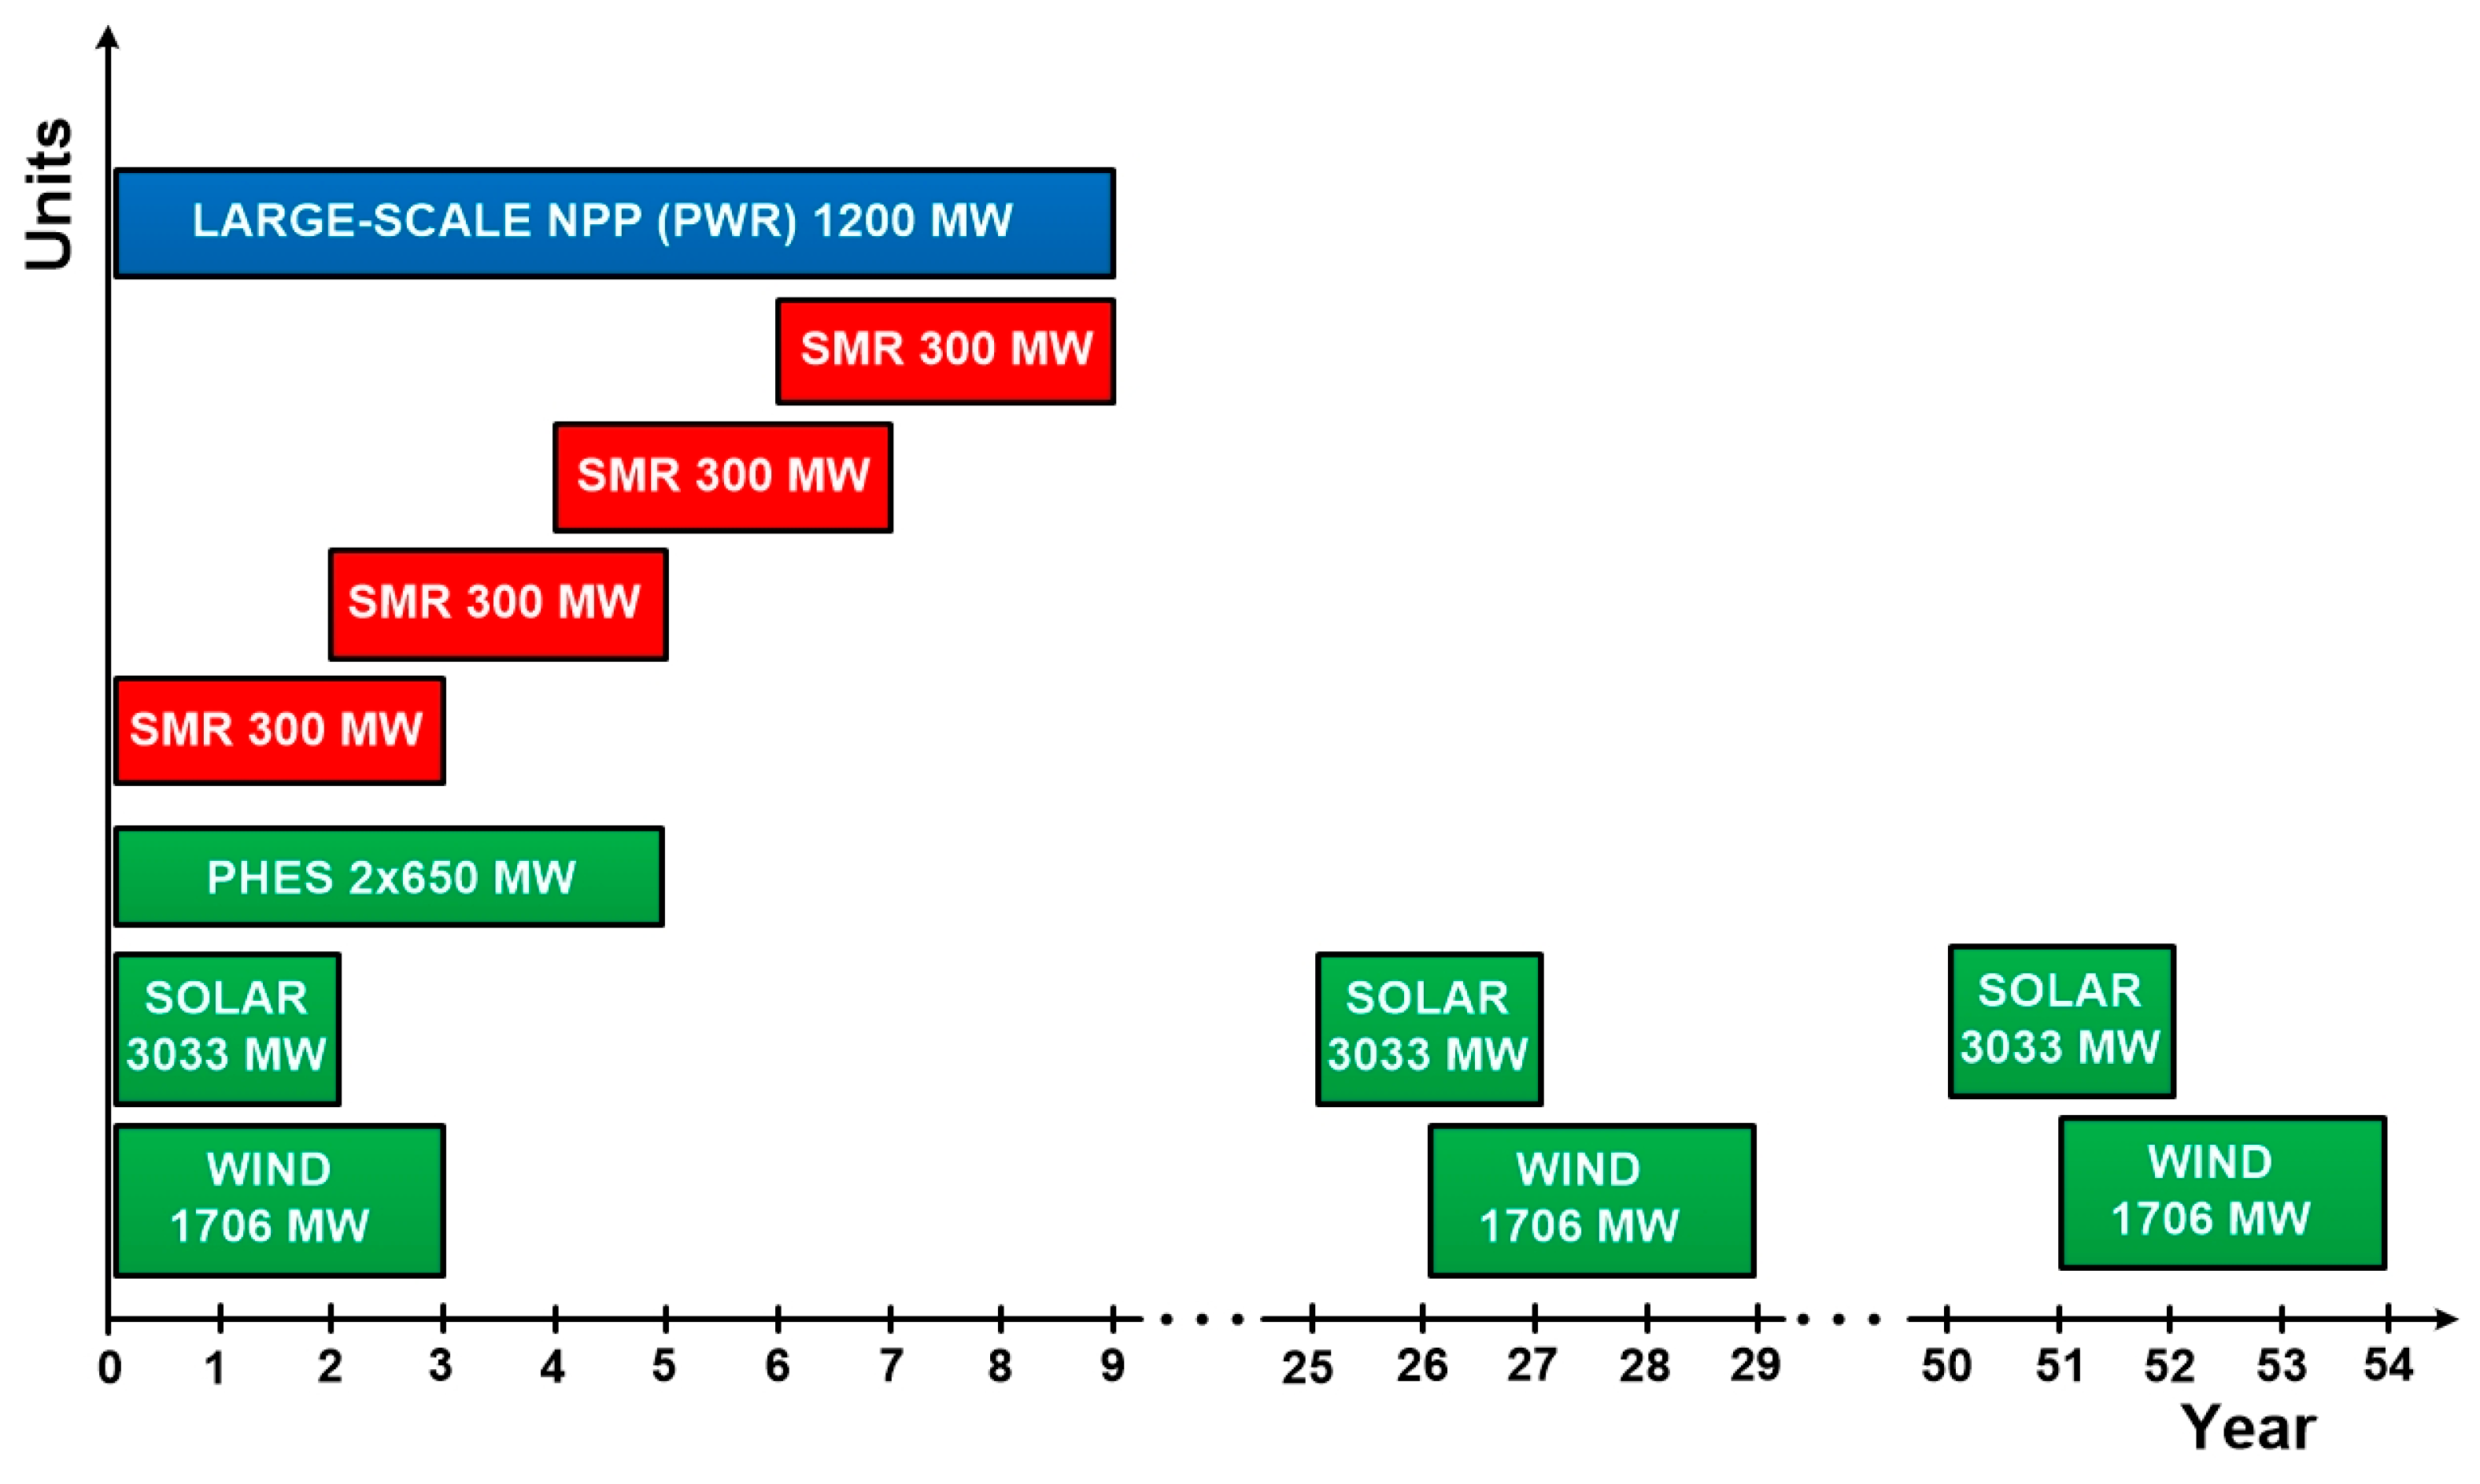
Figure 4.
Net present value and payback period for the three investment projects: large-scale NPP with PWR, four modules of SMRs and combination of solar and wind power plant with pumped hydroelectric energy storage under three different discount rates. The electricity price is 80 $/MWh.
Figure 4.
Net present value and payback period for the three investment projects: large-scale NPP with PWR, four modules of SMRs and combination of solar and wind power plant with pumped hydroelectric energy storage under three different discount rates. The electricity price is 80 $/MWh.
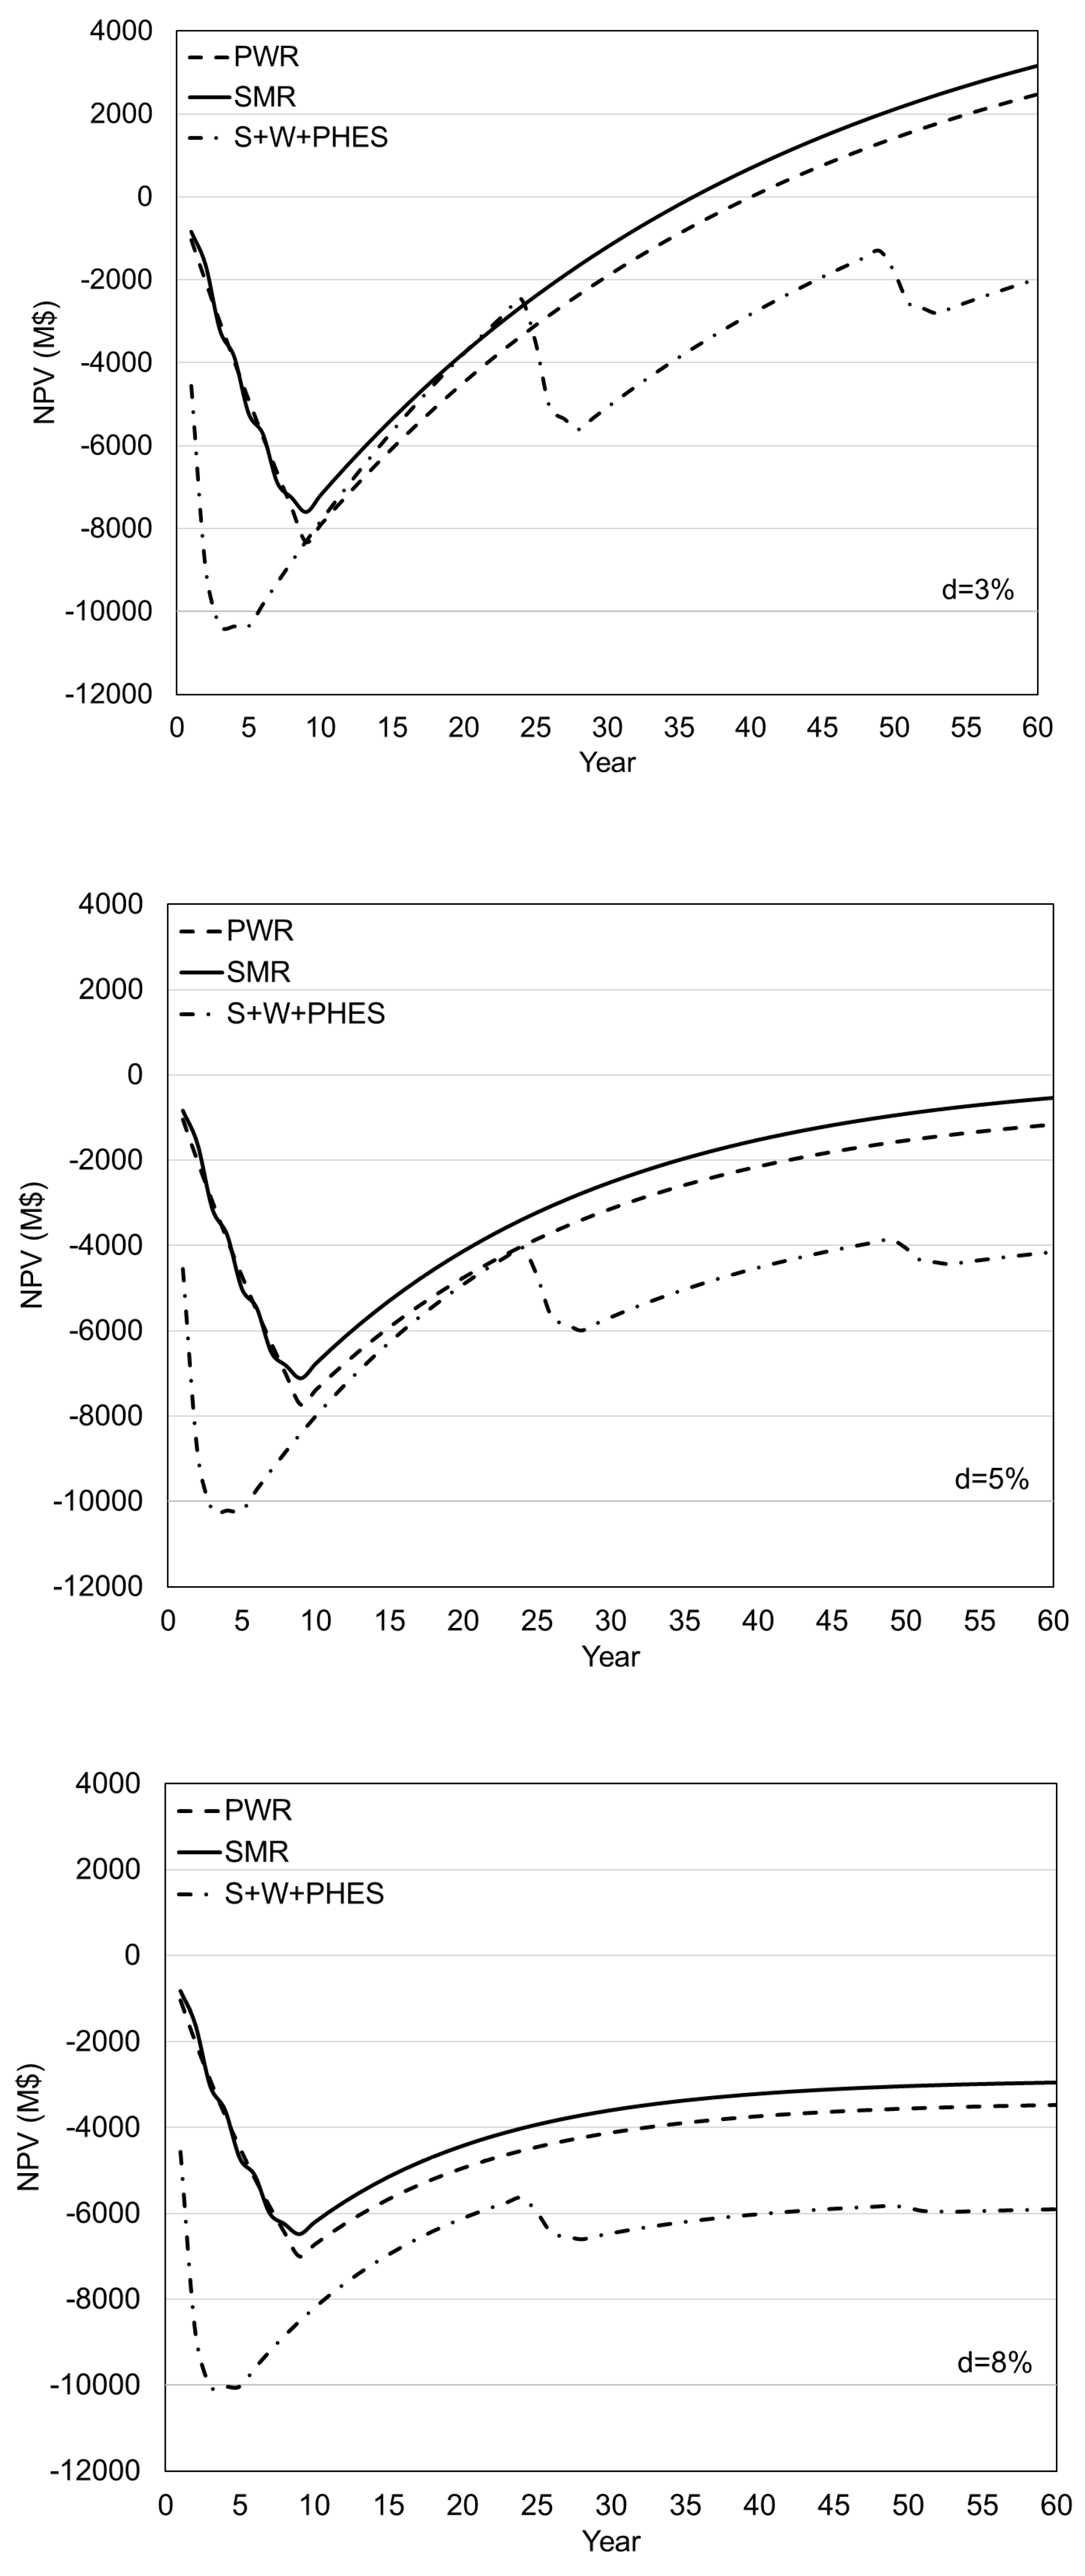
Figure 5.
Net present value and payback period for the three investment projects: large-scale NPP with PWR, four modules of SMRs and combination of solar and wind power plant with pumped hydroelectric energy storage under three different discount rates. The electricity price is 100 $/MWh.
Figure 5.
Net present value and payback period for the three investment projects: large-scale NPP with PWR, four modules of SMRs and combination of solar and wind power plant with pumped hydroelectric energy storage under three different discount rates. The electricity price is 100 $/MWh.
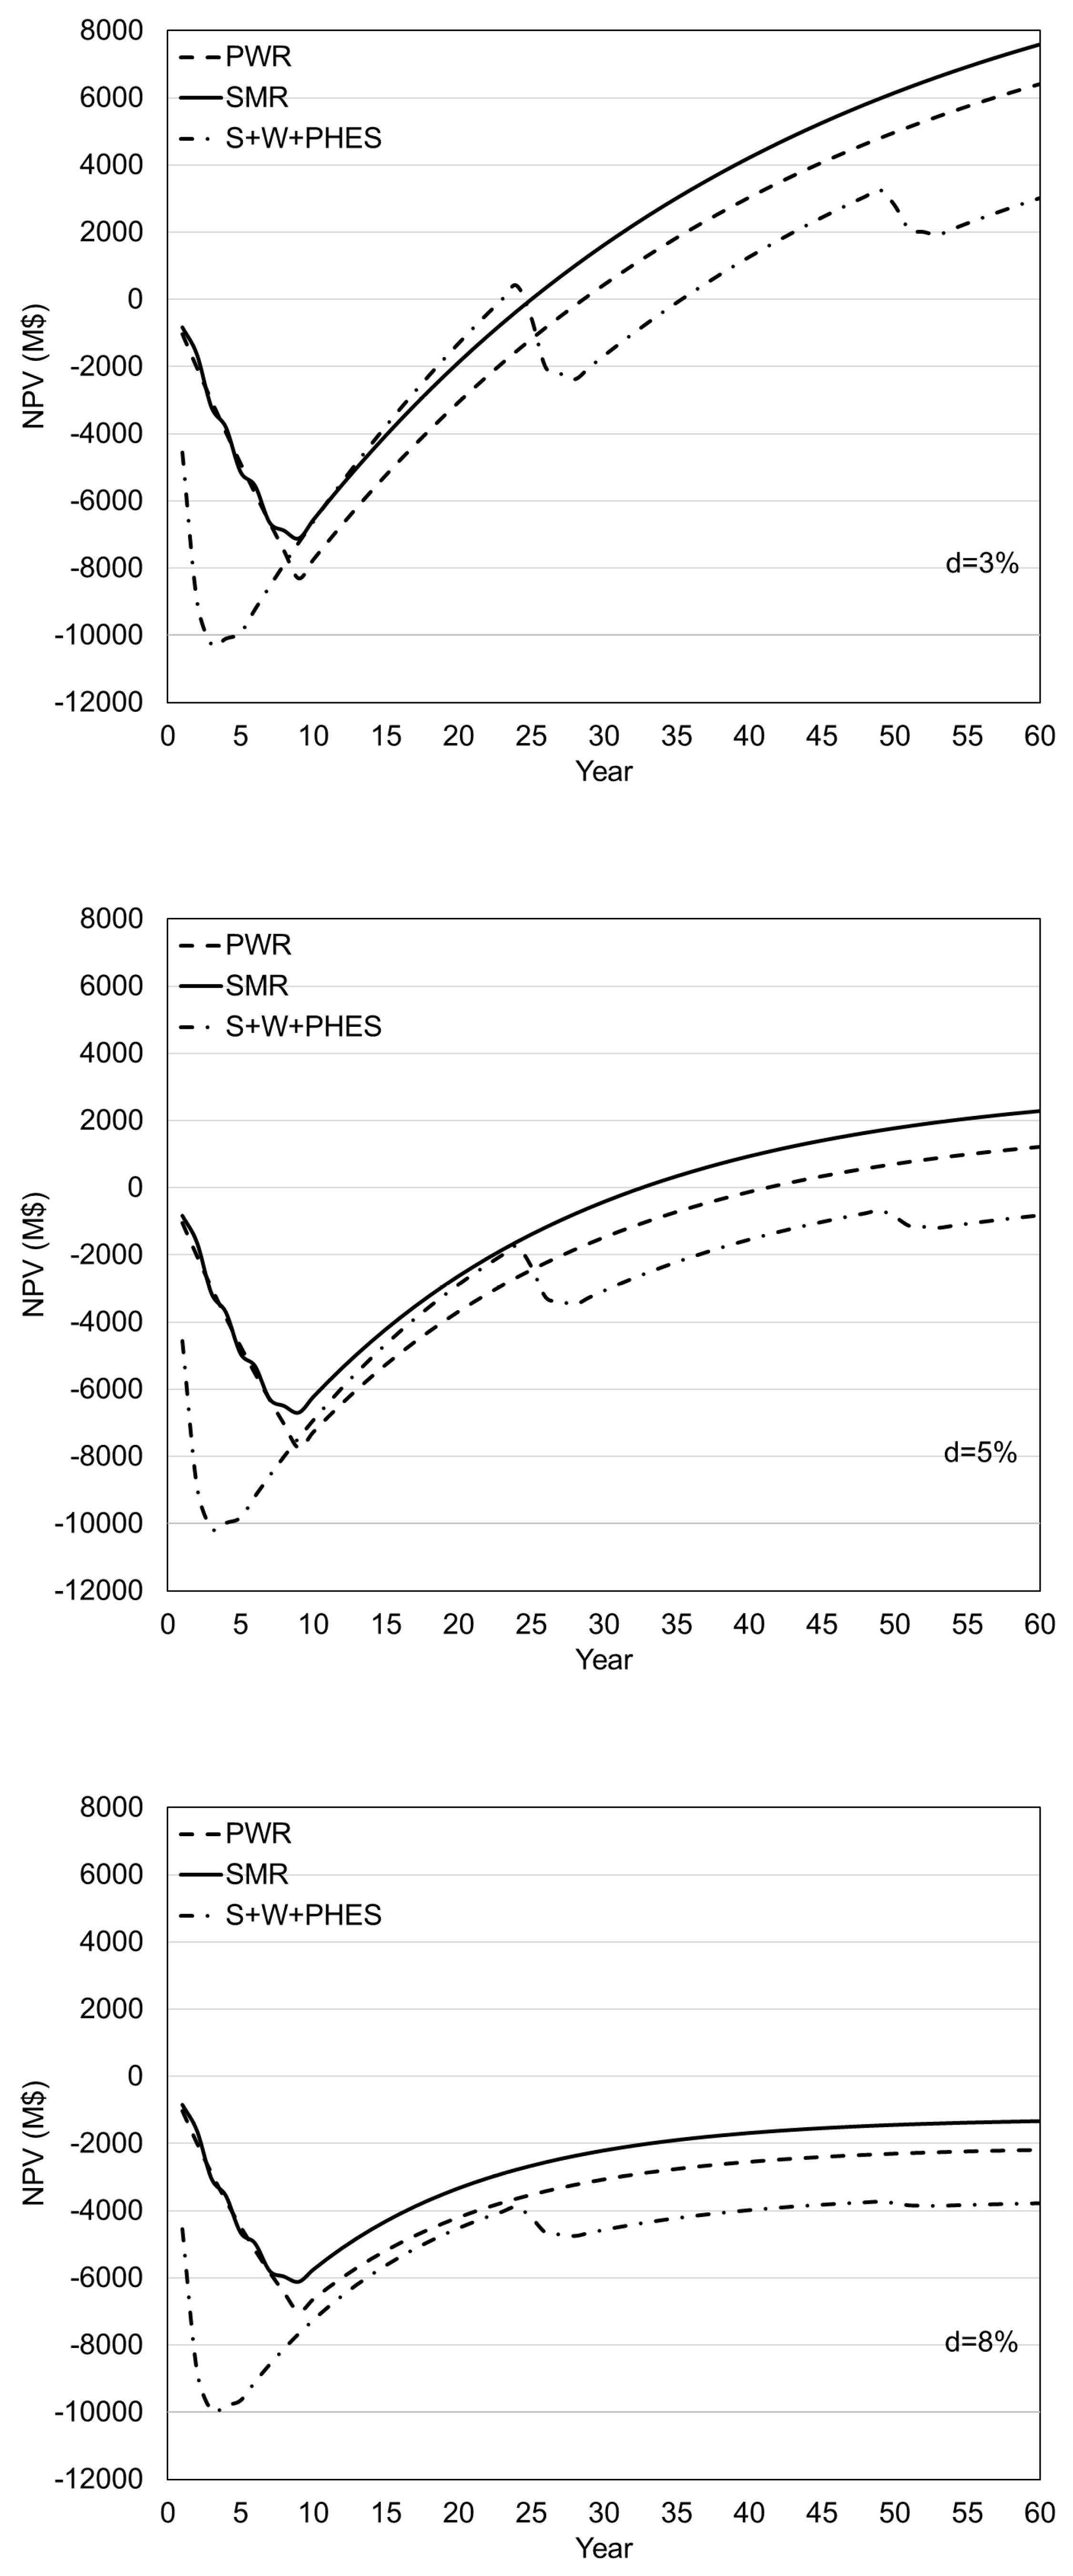
Figure 6.
Net present value and payback period for the three investment projects: large-scale NPP with PWR, four modules of SMRs and combination of solar and wind power plant with pumped hydroelectric energy storage under three different discount rates. The electricity price is 120 $/MWh.
Figure 6.
Net present value and payback period for the three investment projects: large-scale NPP with PWR, four modules of SMRs and combination of solar and wind power plant with pumped hydroelectric energy storage under three different discount rates. The electricity price is 120 $/MWh.
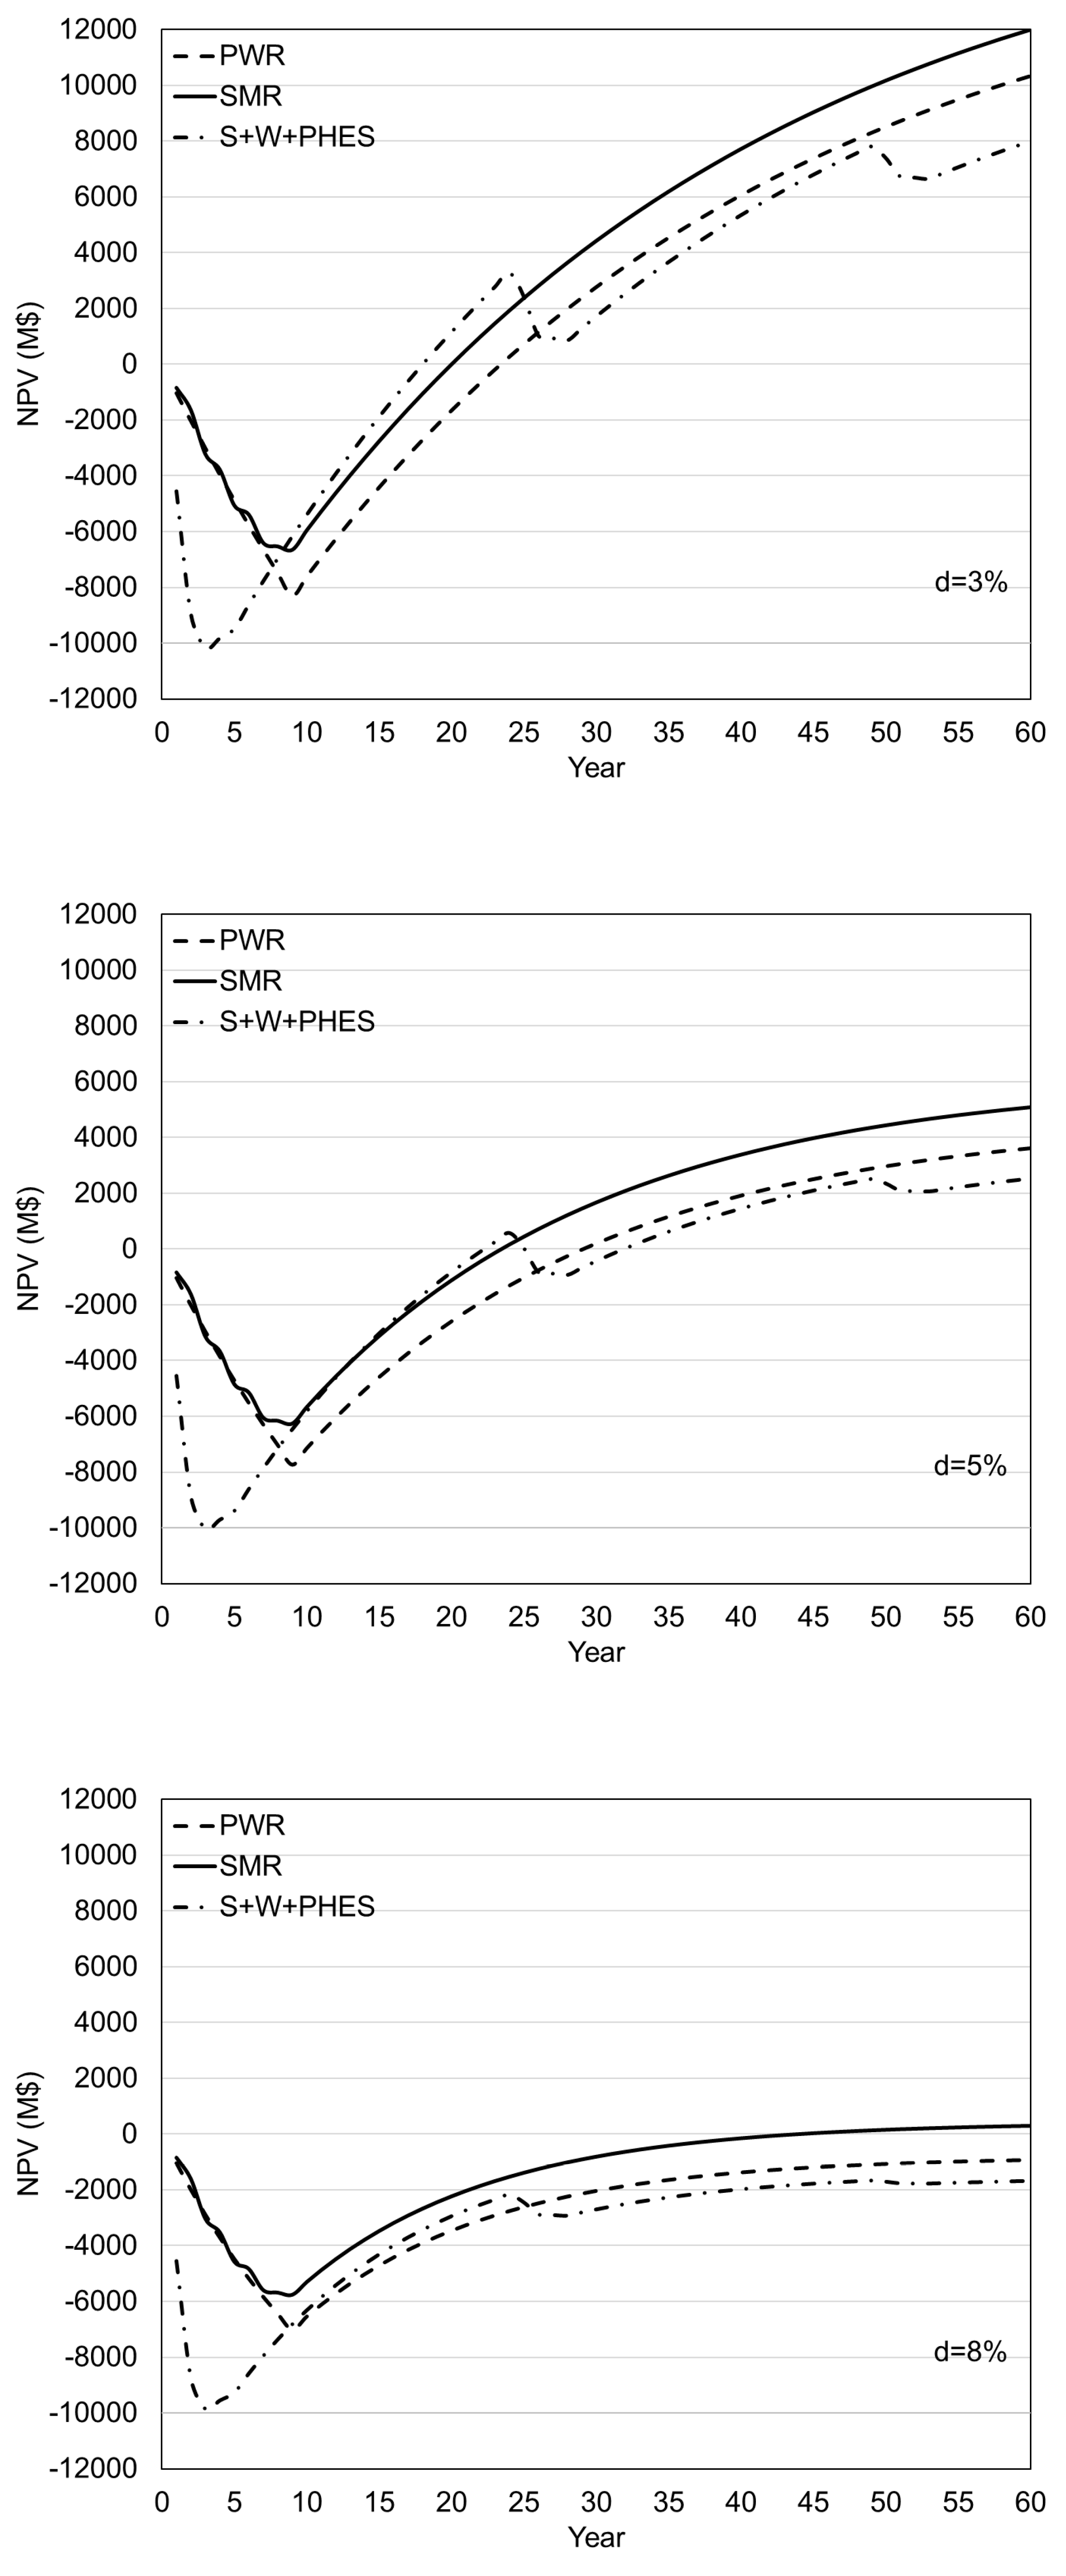
Figure 7.
Levelized cost of electricity for the three investment projects: large scale NPP with PWR, four modules of SMRs and combination of solar and wind power plant with pumped hydroelectric energy storage calculated for three different discount rates: 3%, 5% and 8%, for period of 60 years.
Figure 7.
Levelized cost of electricity for the three investment projects: large scale NPP with PWR, four modules of SMRs and combination of solar and wind power plant with pumped hydroelectric energy storage calculated for three different discount rates: 3%, 5% and 8%, for period of 60 years.
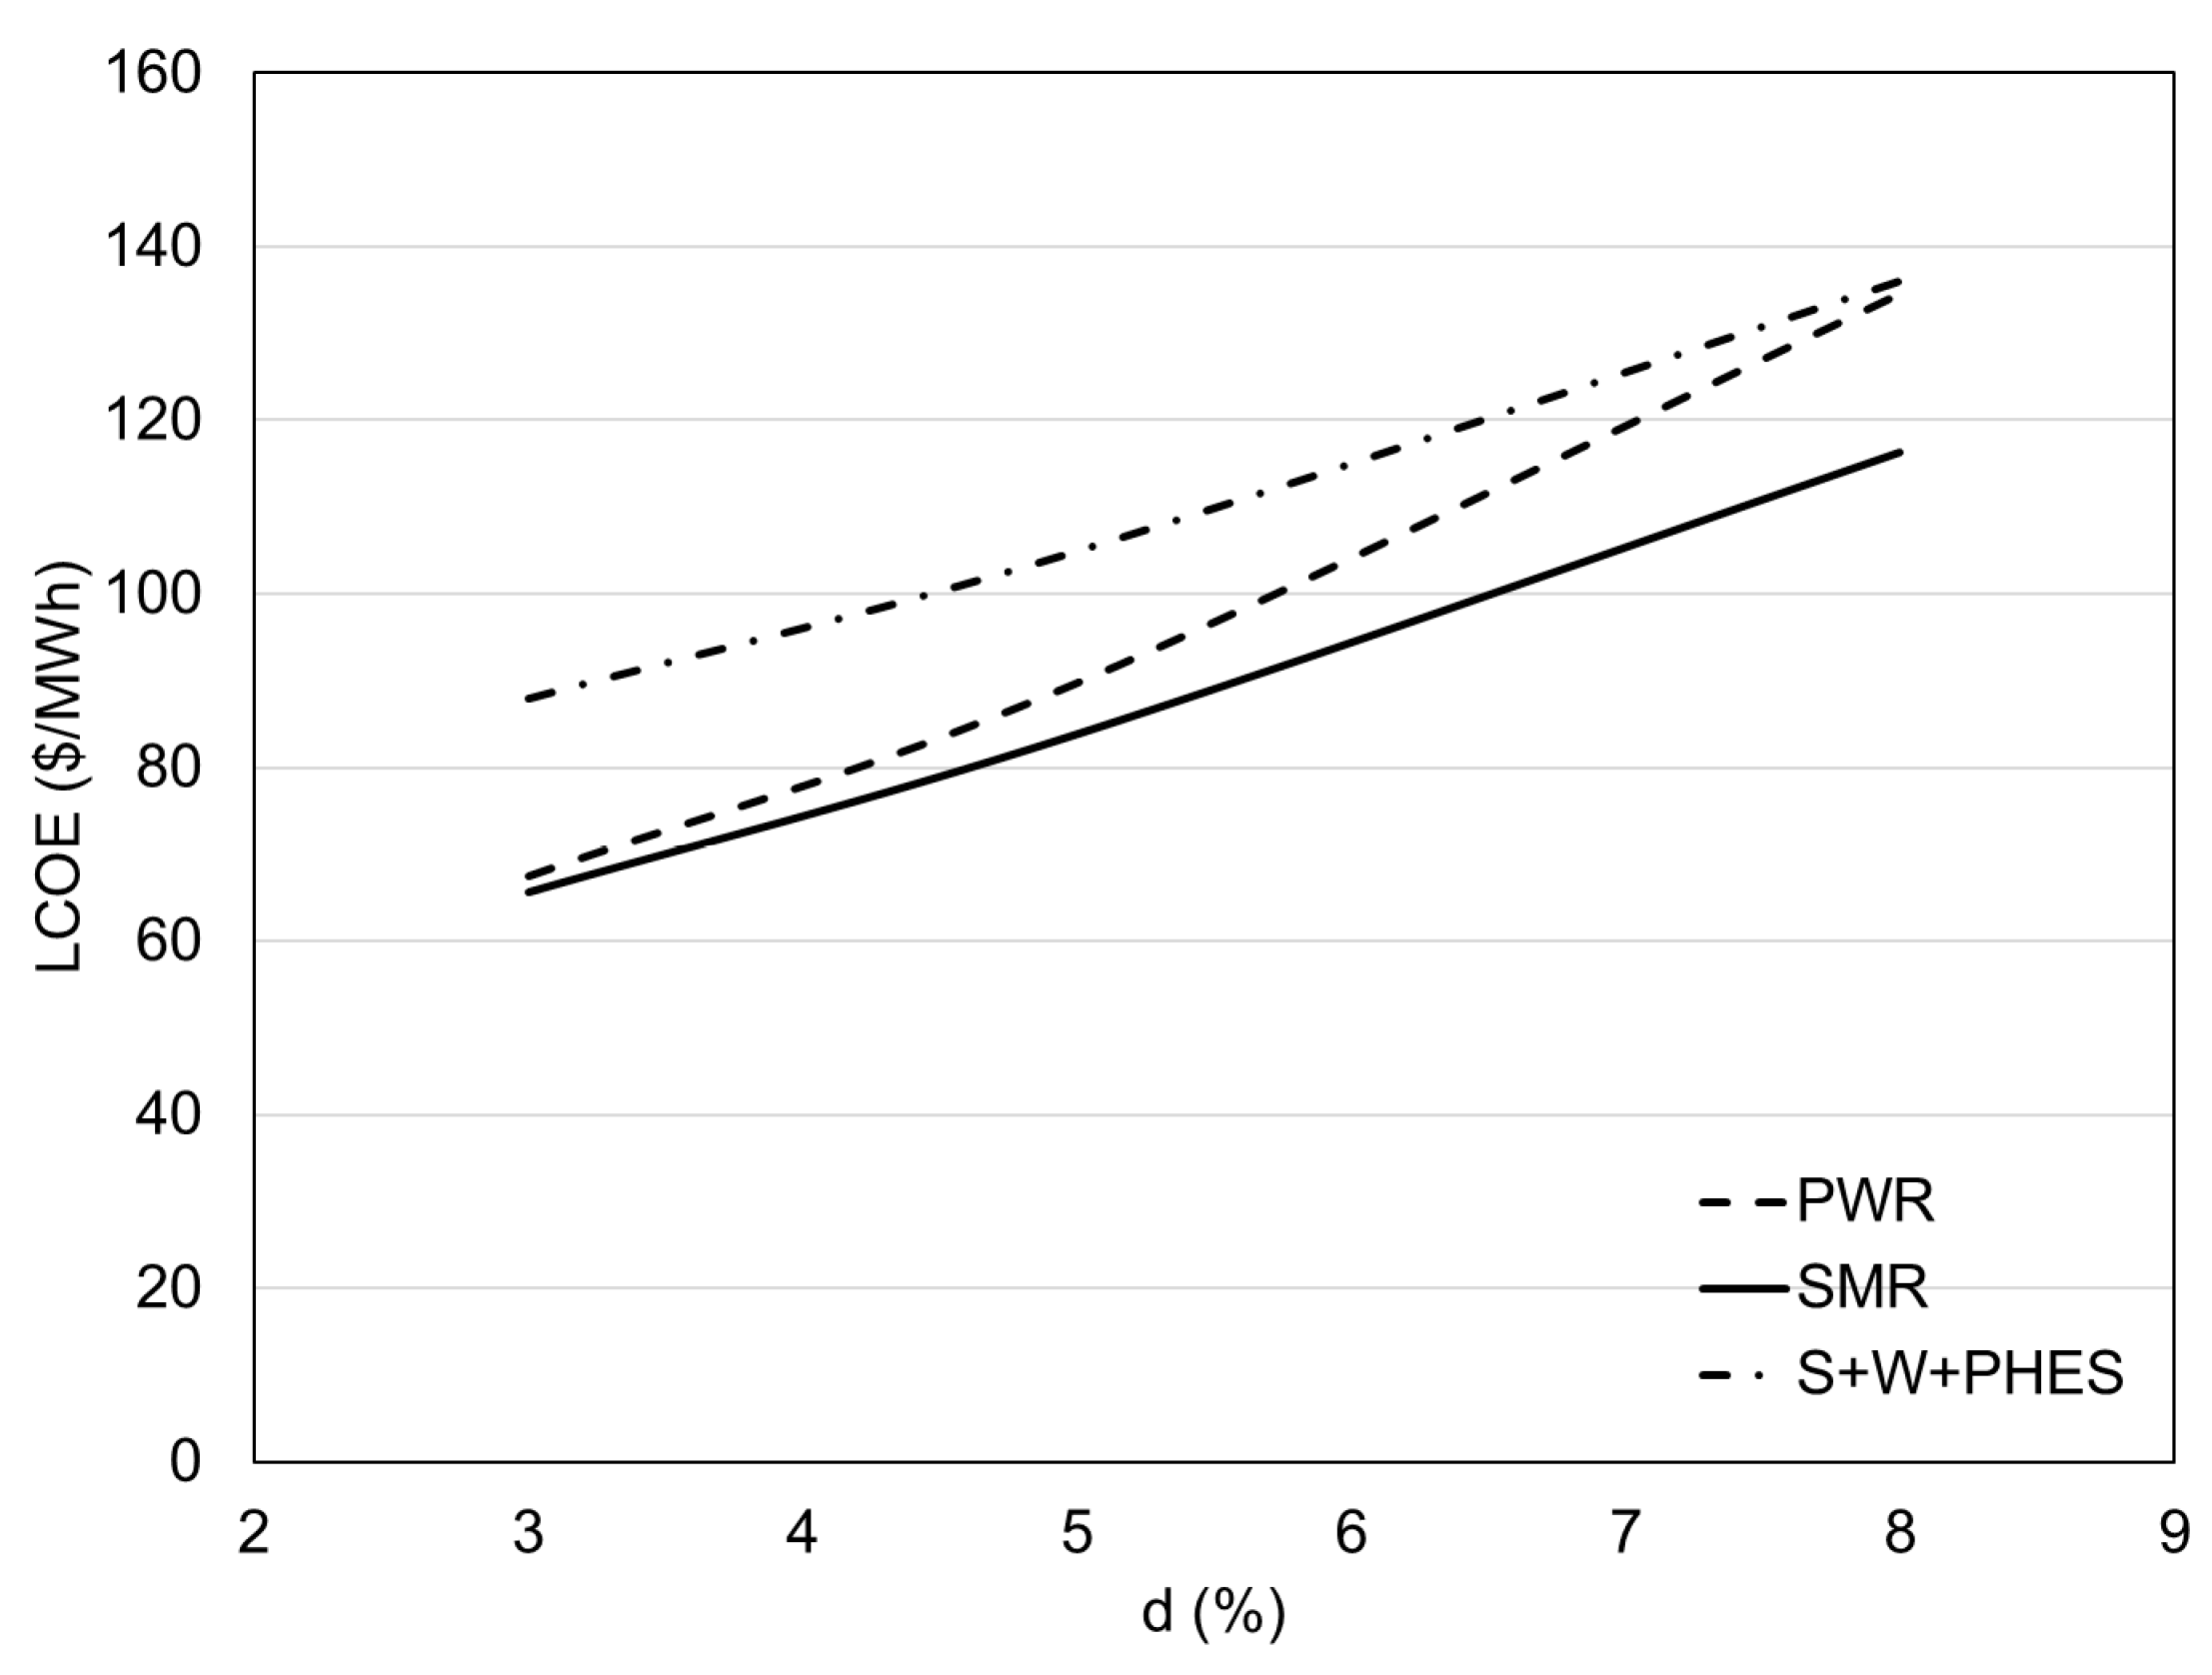

Table 1.
The input data for calculating net present value and levelized cost of electricity.
| Large-Scale NPP with PWR |
Modular NPP with SMR |
Solar and Wind Power Plant + PHES | |||
|---|---|---|---|---|---|
| Solar | Wind | PHES | |||
| Net capacity [MWel] | 1,200 | 4 x 300 | 3,033 | 1,706 | - |
| Capacity factor [-] | 0.91 | 0.91 | 0.18 | 0.32 | - |
| Total overnight cost [$/kW] | 7,777 | 8,349 | 1,808 | 2,098 | - |
| Total investment cost [M$] | 9,332 | 4 x 2,505 | 5,484 | 3,579 | 3,100 |
| The period of exploitation [year] |
60 | 60 | 25 | 25 | - |
| The construction period [year] |
9 | 3 (per one module) | 2 | 3 | 5 |
| The fuel costs [$/MWh] | 9.33 | 9.33 | - | - | - |
| The decommissioning costs [M$] | 1,500 | 1,500 | 303 | 256 | - |
| The O&M costs [$/MWh] | 15 | 15 | 6.34 | 22 | - |
Disclaimer/Publisher’s Note: The statements, opinions and data contained in all publications are solely those of the individual author(s) and contributor(s) and not of MDPI and/or the editor(s). MDPI and/or the editor(s) disclaim responsibility for any injury to people or property resulting from any ideas, methods, instructions or products referred to in the content. |
© 2025 by the authors. Licensee MDPI, Basel, Switzerland. This article is an open access article distributed under the terms and conditions of the Creative Commons Attribution (CC BY) license (http://creativecommons.org/licenses/by/4.0/).
Copyright: This open access article is published under a Creative Commons CC BY 4.0 license, which permit the free download, distribution, and reuse, provided that the author and preprint are cited in any reuse.


