Submitted:
15 April 2025
Posted:
15 April 2025
You are already at the latest version
Abstract
Liquid hydrogen (LH2) and 100% synthetic paraffinic kerosene (SPK), or sustainable aviation fuel (SAF), offer promising low-emission alternatives to conventional Jet-A fuel for long-distance flights—assuming they are produced through processes that support net-zero well-to-wake (WTWa) emissions. This study assesses the WTWa performance, including non-CO₂ effects, of a blended wing body aircraft designed to carry 300 passengers over a range of 13,890 km, using either LH2 or 100% SPK. The analysis quantifies emissions during the operational phase and evaluates fuel production impacts using the GREET model. Results from over 100 fuel production pathways show that LH2 can deliver net-zero or even negative WTWa CO₂-equivalent emissions when derived from biomass or produced via integrated fermentation combined with carbon capture and storage. Non-CO₂ emissions are found to be a major contributor to overall climate impacts. Using miscanthus as a feedstock, 100% SPK reduces WTWa CO₂-equivalent emissions by 70–85% relative to Jet-A. A high-level supply assessment suggests that by 2050, production of SAF and hydrogen could satisfy the energy needs of long-haul aviation, assuming a 4% annual increase in air traffic and widespread adoption of these alternative fuels. These findings offer valuable direction for future research, cost assessments, and policy-making aimed at enabling sustainable long-haul air travel.
Keywords:
Life cycle assessment
; decarbonising long-range aviation
; climate neutral aviation
; Hydrogen aircraft
; alternative aviation fuel
; sustainable aviation fuel
1. Literature Review of Life Cycle Assessment of Alternative Aviation Fuels
The climate impact of aircraft comprises CO2 and non-CO2 effects (soot, aerosol, sulphate, water vapour, oxides of nitrogen [NOx], and contrails and cirrus clouds) [1,2,3]. Presently, aviation contributes 3.5% to the overall anthropogenic radiative forcing [1,2], of which approximately two-thirds is attributable to non-CO2 effects [3]. The industry foresees a doubling in air travel demand over the next two decades (2024 - 2043) even considering the effects of the pandemic [4], which is expected to substantially increase its climate impact. It is projected that advancements in aircraft technology and the adoption of low-carbon fuels could collectively address 80% of the measures necessary for achieving carbon-neutral growth [5,6].
The total life cycle emissions associated with aircraft fuel performance encompass emissions from both the operational phase of the aircraft and the manufacturing stage of the fuel (from raw material extraction to fuel storage). According to research by Chester and Horvath [7], the greenhouse gas (GHG) emissions during the operational phase of aircraft account for approximately 70% of the total GHG emissions from the Jet-A aircraft. Presently, technological advancements and regulatory efforts in aviation are primarily focused on the use phase or direct operation of aircraft. The Greenhouse Gases, Regulated Emissions, and Energy Use in Technologies (GREET) model, developed by Argonne National Lab, USA, is one of the many tools for comprehensive life cycle assessment.
Not all alternative fuel pathways are equally energy efficient when considering their embodied emissions. For instance, from a conventional standpoint focusing on direct emissions, liquid hydrogen (LH2) appears promising for aviation due to its higher energy density and zero-carbon emissions during aircraft operation, compared to conventional Jet-A fuel. However, using the GREET model [8], it is observed that LH2 derived from coal emits three times more CO2 emissions over its life cycle compared to Jet-A. According to the aviation industry [9], evaluating the ‘sustainability’ of aviation fuels should include life cycle assessment , taking into account net emissions throughout the entire life cycle of the fuel.
Decarbonizing long-haul aviation poses significant challenges [6,10]. Based on the authors’ previous work [6,11,12,13], it was observed that decarbonising the long-range aviation sector is challenging, and of the several alternative energy carriers and propulsion technologies examined (including batteries and fuel cells) for aircraft operational performance, LH2 and 100% synthetic paraffin kerosene (SPK) or sustainable aviation fuel (SAF) are the only two alternatives to Jet-A for a large twin aisle (LTA) aircraft, whether tube-wing or blended wing body (BWB) airframes. Presently, 100% SPK is not permitted for use in the existing aircraft fleet. Approved drop-in fuels for civil aviation use include up to a 50% blend of alcohol-to-jet (ATJ), Fischer-Tropsch (FT), and hydro-processed renewable or hydro-processed esters and fatty acids (HRJ or HEFA) SPK pathways, as well as a 10% blend of sugar-to-jet (STJ) SPK pathway [6,14,15,16,17].
Studies by Proesmans et al. [18,19] examine the climate impacts of aircraft powered by SPK and LH2, including the impacts of contrails, but the analysis is restricted to the operational phase of the aircraft. The embodied energy/emissions associated with alternative fuel production also need to be considered for estimating greener production pathways. Therefore, a holistic approach needs to be used for evaluating the performance of future aircraft technology and energy vector combinations. This is also supported by review studies [20,21,22] which establish the need for an integrated methodological framework that should consider life-cycle impacts of aircraft performance towards the goal of sustainable aviation. Therefore, in the present study, a life cycle approach is used for identifying fuel feedstock and/or manufacturing pathway combination(s) that could enable a climate-neutral long-range flight of an LTA aircraft powered by LH2 and 100% SPK (separately). The scope of this work is limited to fuel life cycle assessment of combustion-based long-range LTA aircraft fuelled by LH2 and 100% SPK (separately), and the following literature review will focus on it.
Different studies conduct life cycle or well-to-wake (WTWa) emissions analysis for SPK and LH2 fuel for specific aircraft range applications – fossil fuel based SPK fuel [23], bio-jet fuel [23,24,25,26,27,28,29,30,31,32,33,42,43,44,45], power-to-liquid (PtL) or electro-fuel [29,31,39,40,41,42,43,44,45,46,47,48,49,50,51,52,53,54,55], and LH2 [30,31,37,38,39,40,41,42,43,44,45,46,47,48,49,50,51,52,53,54,55,56,57,58,59,60,61,62,63]. None of these studies [23,24,25,26,27,28,29,30,31,32,33,34,35,36,37,38,39,40,41,42,43,52,53,54,55,56,57,58,59,60,61,62], [27,28,32,33,34,35,36,37,38,39,40,41,42,43,44,45,46,47,48,49,50,51,52,53,54,55,56,57,58,59,60,61,62,63], examine different types of feedstocks and manufacturing pathway combination(s) that could enable a climate-neutral long-range flight of an LTA aircraft powered by LH2 and 100% SPK (bio-jet and PtL fuel), and not all of these consider non-CO2 emissions in their WTWa analysis. The important findings and/or limitations of these studies are concisely reviewed below, and a detailed review of some of these studies is included in Supplementary Information (SI) File SI §1. For details in terms of different manufacturing pathways and processes, properties, operability issues, and other miscellaneous aspects of these alternative fuels, the reader is advised to explore studies by Su-ungkavatin et al. [64], Cabrera et al. [65], Ansell [34], and Braun et al. [33].
Lau et al. [32] review HEFA and ATJ bio-jet fuel and find that the WTWa GHG emissions reduction potential of HEFA (from jatropha and palm oil) and ATJ (from wheat grain and wheat straw) could be 19% – 42% and 20% – 65%, respectively. According to Braun et al. [33], FT SPK fuel from miscanthus (silver grass), forestry and agricultural residues, and municipal solid waste, has the highest potential to decrease WTWa GHG emissions (90% – 100%). In some regions, GHG emissions reduction could be as high as 125%. The median reduction potentials of ATJ pathways are about 60%, while those of HEFA are below 60%. A review study by Ansell [34] examines different studies on bio-jet fuel and hydrogen produced from steam methane reforming (SMR) and electrolysis (using renewable electricity) which do not consider climate impacts of non-CO2 emissions in their life cycle assessment . Ansell finds that bio-jet fuel and renewable hydrogen has the potential to decrease the WTWa CO2 emissions by 68% and ~80%, respectively, with a fully renewable grid. The above studies [32,33,34] do not consider the non-CO2 emissions in their analysis. Afonso et al. [35] and Song et al. [36] observe that bio-jet fuel can reduce WTWa GHG emissions by up-to 80% (with non-CO2 emissions) and 41–89% (without non-CO2 emissions), compared to Jet-A. The reduction in WTWa GHG emissions depends on the feedstock and manufacturing pathways. The above studies consider limited/selective feedstocks for producing alternative fuels.
A study by Kolosz et al. [23] is limited to blended/drop-in SPK fuel, where a comparison of WTWa performance metrics is conducted for: fossil fuel based SPK fuel (from coal, oil sands, oil shale, natural gas, etc.), and bio-jet fuel (first, second, and third generation). Studies by Wei et al. [24], Pavlenko et al. [25] (also reviewed in [37]), and De Jong et al. [26] conduct WTWa emission of bio-jet fuel only for few selected biomass feedstocks. Similarly, studies [27], [28] are focussed only on bio-jet fuel and they explore only the feedstocks considered in CORSIA database (Carbon Offsetting and Reduction Scheme for International Aviation). A study by Van Der Sman et al. [29] reviews WTWa emission of SPK fuel (both bio-jet fuel and PtL) but this analysis is restricted to EU region. Similarly, Saad et al. [38] observe that PtL and bio-jet fuel could reduce ~50% WTWa emission, but the study is limited to Switzerland. All of the above studies [23,24,25,26,27,28,29,38] do not consider the climate impact of non-CO2 emissions (from the aircraft’s operational phase) in their WTWa analysis.
Grim et al. [48] observe that PtL could decrease WTWa GHG emissions by 66% – 94% (without non-CO2 emissions). According to Sacchi et al. [49], PtL fuel from direct air capture and carbon storage could reduce WTWa GHG emissions by 65% – 100% (including non-CO2 emissions). A study by Micheli et al. [51] examines PtL fuel produced from wind power and finds that the WTWa GHG emissions could be reduced by 27.6% – 46.2% (with non-CO2 effects) and 52.6% – 88.9% (without non-CO2 effects), but this study is limited to Germany’s energy landscape. Similar observations are made by Papantoni et al. [50], where the authors find that inclusive of the non-CO2 emissions, PtL from solar and wind energy could reduce WTWa GHG emissions by 32% and 42%, respectively. According to Klenner et al. [52], using wind power, the WTWa GHG emission reduction potential (including non-CO2 emissions) of PtL fuel is 48% and of LH2 fuel is 44% for short flights (<200 km), and for longer flights, the average WTWa GHG emission reduction potential increases to 52% (for PtL) and 54% (for LH2). These findings are limited to Norway’s energy mix. Studies by VanLandingham [53] and VanLandingham et al. [54], examine the performance of PtL and LH2 (both fuels are produced from renewable power) in a single aisle aircraft (Boeing 737) and find that the WTWa GHG emissions (including non-CO2 emissions) could be reduced by 43% and 61%, respectively. Similarly, a study by Prashanth et al. [55] finds that the WTWa GHG emission reduction potential (including non-CO2 emissions) of LH2 could be 91% (from solar energy) to 98% (from wind energy) and PtL 84% (from solar energy) to 93% (from wind energy). Studies [46,47] are limited to WTWa emission of PtL or electro-fuel in Germany’s energy landscape having ~100% WTWa GHG reduction potential in the future energy mix. The analysis in the above studies [46,47,48,49,50,51,52,53,54,55] are limited to a specific energy landscape and/or limited feedstocks are explored to produce the fuel under consideration. The life cycle GHG performance of PtL is dependent on the sourcing of CO2 (direct air capture or point sourcing), and of PtL and LH2 is dependent on the type of electricity mix.
Delbecq et al. [40] evaluate the WTWa performance of bio-jet fuel, PtL, and hydrogen with different scenarios at aviation system level for a small aircraft. The individual potential of each of the fuels in terms of WTWa GHG reduction is not known. Additionally, the sourcing of feedstock for bio-jet fuel is not known, and PtL and hydrogen are sourced only from renewable energy. Fantuzzi et al. [41] examine different alternative aviation fuels but consider limited feedstock/pathways for bio-jet fuel (HEFA and ATJ), PtL, and hydrogen (SMR and electrolysis using renewable electricity) and these offer up-to 70% savings in WTWa GHG (without non-CO2 emissions). Additionally, the study is limited to the UK energy landscape. Another study by Dray et al. [42] evaluates different alternative aviation fuels and their WTWa effects including non-CO2 emissions. The authors examine bio-jet fuel (ATJ, HEFA, and FT), PtL (using direct air capture), and hydrogen (electrolysis using renewable power). They observe that considering the ongoing efficiency improvements and efforts to avoid contrails, but excluding offsets, the energy transition could cut WTWa GHG emissions by 89–94% compared to 2019 levels. This reduction would be achieved while considering 2 – 3 times increase in demand by 2050. Despite being a detailed analysis with 2050 forecast, the study examines limited/selective feedstocks for each of the fuel examined. Quante et al. [43] examine alternative aviation fuels and observe that FT SPK, PtL, HEFA SPK, ATJ SPK, STJ SPK, and hydrogen could reduce WTWa GHG emissions (without non-CO2 emissions) by 85%, 100%, 54%, 62%, 61%, and 80%, respectively. However, the specific feedstocks used for producing bio-jet fuels are unknown. Another study by Penke et al. [39] observe that PtL, bio-jet fuel (HEFA) from soy oil, and renewable hydrogen could reduce WTWa GHG emission (without non-CO2 emissions) by 77%, 30%, and 95%, respectively. Similarly, Kossarev et al. [44] (continuing their previous work [45]) restrict their study to renewable hydrogen, algae-based HEFA bio-jet fuel, and hydrogenated vegetable oil, which have WTWa GHG emission reduction potential (including non-CO2 emissions) of 59.5%, 35.8%, and 112%, respectively. The above studies [39,41,42,43,44,45] focus on a particular energy landscape and/or explore limited feedstocks for producing the fuel in consideration.
Studies [34,37,41,43,57,58,59,60,61,62,66,67] on hydrogen as an aviation fuel do not consider non-CO2 emissions in their WTWa analysis which are important, and studies [56,61,62,66,67,68,69] limit their selection of feedstock/pathway for fuel production only to renewable power. The aircraft use-phase energy consumption and/or emissions have a significant impact on the WTWa performance. Studies [34,37,39,43,44,45,46,47,48,49,50,51,52,53,54,55,56,57,58,59,60,61,62] are focussed on the life cycle effects of hydrogen use in aircraft, it is either not clear from the information supplied or these do not consider the poor volumetric energy density characteristic of LH2 which penalises aircraft energy performance, which are their limitations. A study by Koroneos et al. [56] that examines an A320 (or single aisle) type of aircraft though considers realistic effects of LH2 on aircraft design, is less recent (from early 2000s) and considers fewer ways of LH2 production. Another study by Mukhopadhaya et al. [61] examines PtL, and LH2 from electrolysis (renewable energy) and observes that ~100% reduction in WTWa GHG emission could be achieved (without non-CO2 emissions). Tveitan [66] examines green hydrogen which has a 58% WTWa GHG emission (excluding non-CO2 emissions) reduction potential. Chan et al. [67] evaluate green hydrogen and bio-jet fuel (feedstock sourcing unknown), and find that bio-jet fuel and hydrogen have the best potential and can achieve up to 88% WTWa GHG emissions reduction. It is also unclear, or the above studies do not consider the non-CO2 emissions in their WTWa analysis.
Studies by Miller [30] and Miller et al. [63] include more number of feedstocks and pathways than the above studies, as consideration is given to tens of feedstocks and/or pathways for LH2 and bio-jet fuel along with the effect of contrails cirrus in WTWa analysis. However, PtL or electro-fuels and STJ pathway are omitted, and the WTWa results are limited only to a smaller aircraft with shorter range compared to LTA aircraft which is the focus of this work. Lastly, the FlyZero report [31] accounts the performance penalty due to cryogenic tank installation and non-CO2 emissions in their WTWa analysis of LH2, PtL and bio-jet fuel SPK for small to mid-size aircraft. However, their analysis is limited to a few feedstocks and/or pathways of manufacturing LH2, PtL and bio-jet fuel SPK.
Not all of the above studies [23,24,25,26,27,28,29,30,31,32,33,34,35,36,37,38,39,40,41,42,43,52,53,54,55,56,57,58,59,60,61,62,63,70,71,72] consider non-CO2 emissions in their WTWa analysis and none of these examine different types of feedstocks and manufacturing pathway combination(s) that could enable a climate-neutral long-range flight of an LTA aircraft powered by LH2 and 100% SPK (bio-jet and PtL fuel). According to the International Air Transport Association (IATA) [73], reaching net-zero CO2 emissions by 2050 could involve the following contributions: SAF at 65%, new aircraft technology, including electric and hydrogen aircraft, at 13%, infrastructure and operational efficiencies at 3%, and offsets and carbon capture at 19%. Carbon removal is identified as an important strategy to reduce GHG emission. None of the above studies consider fuel production routes that employ carbon capture and storage (CCS), except a study by Fantuzzi et al. [41] which shows that by employing carbon capture and storage for SMR LH2 production route can reduce the WTWa GHG emissions by 60% (median value). Also, according to the study by Pavlenko et al. [74], hydrogen is a crucial component in the SPK fuel manufacturing process and thus has a significant impact on the life cycle GHG emissions of SPKs (bio-jet and PtL fuel) and using green hydrogen in SPK production could help reducing the WTWa GHG emissions. None of the studies reviewed above considers the sensitivity of hydrogen production to the WTWa GHG emissions of SPKs. Furthermore, above studies do not provide any estimation of the energy demand in 2050 for the long-haul aviation sector, and whether or not that energy demand can be met with 100% SPK (or SAF) and/or LH2.
The above limitations in literature motivate this current work. In this work, the primary research effort is to estimate the life cycle or WTWa GHG performance while addressing non-CO2 emissions, for a long-range LTA aircraft (separately) powered by LH2 and 100% SPK (bio-jet and PtL fuel) manufactured from over 100 different feedstocks and/or pathways, where in some cases carbon capture and storage is also employed. Additionally, the sensitivity of hydrogen sourcing to SPK production, and of biomass sourcing for some hydrogen production pathways, are investigated in this work. Similarly, this work explores the sensitivity of energy mix (2020 vs 2050) to alternative fuel production. Furthermore, the energy demand and supply (of 100% SPK [or SAF] and LH2) in future (2050) for long-haul aviation is considered. These are novel contributions of the present work.
In authors’ previous studies [12,13], the engine (ultrahigh bypass ratio geared turbofan) and aircraft operational energy performance modelling of a 2030+ (N+2 timeframe) BWB LTA aircraft powered by LH2 and 100% SPK (separately) are conducted considering penalty due to cryogenic tank installation for LH2 aircraft modelling. This enables the estimation of GHG emissions in the aircraft use-phase. Knowing the fuel manufacturing emissions, the WTWa or life cycle emissions can be calculated. In this work, over 100 different ways in total (including fuel manufacturing unit that employs carbon capture and storage) for producing LH2, PtL, and bio-jet fuel SPK are examined (for use in the N+2 BWB aircraft).
Not all bio-jet fuels (i.e. fuel from different production pathways) can be directly used in the present aircraft (called ‘drop-in’ fuels), because some of fuel properties and chemical contents are not same as that of the conventional jet fuel [75]. Some systems within the aircraft are designed considering the properties of conventional jet fuel. For example: The aromatic content of conventional jet fuel causes rubber seals used in the high-pressure fuel system to swell, thereby preventing fuel leakage during aircraft operation at different altitudes; and synthetic paraffin kerosene (SPK) jet fuel cannot be used in neat form (100%) without modifications to aircraft or without addition of synthetic aromatics/additives [75]. The American Society for Testing and Materials (ASTM) has approved four bio-jet fuel pathways which can be used in aircraft as ‘drop-in’ fuels [76]. These are:
- Fischer Tropsch (FT) SPK (FT-SPK) with maximum 50% blend and syngas FT with aromatic alkylation (FT-SPK/A) with maximum 50% blend
- Hydro-processed renewable jet fuel (HRJ) or hydro-processed ester and fatty acids (HEFA) (HRJ/HEFA-SPK) with maximum 50% blend
- Bio-chem sugars or hydro-processed fermented sugars to synthetic iso-paraffins with maximum 10% blend (also referred to as sugar-to-jet fuel or STJ), and
- Alcohol-to-jet (ATJ-SPK) fuel with maximum 50% blend (recently revised from 30% blending)
- where the blending is done with the conventional jet fuel. 100% SPK (biomass-based and electro-fuel) is not strictly a drop-in fuel as it has not yet been approved.
A study by Wei et al. [24] reviews different bio-jet fuel types produced from different feedstocks. The authors carry out a comparison of holistic life cycle (well-to-wake [WTWa]) greenhouse gas (GHG) emission for the fuel type and feedstock combinations, which is summarised in Table 1 (also includes use-phase GHG emissions [without the effect of contrails]). The GHG life cycle assessment is carried out at an industrial level and the GHG emission comprise of following process components:
- Feedstock cultivation, harvesting, and transportation
- Land use effect
- Production and transportation of ancillary chemicals
- Refining
- Transport, distribution, storage, and the combustion of the fuel
Additionally, the authors carry out a cost comparison of some of the fuel type and feedstock combinations (from Table 1) and this is summarised in Table 2. It can be observed from Table 1 and Table 2 i.e., considering both holistic life cycle GHG emission [carbon dioxide (CO2) equivalent] and fuel cost, that HEFA-camelina oil and HEFA-waste oils and animal fat are the preferred candidates of fuel type and feedstock combinations followed by ATJ-sugarcane (biochemistry) and ATJ-switchgrass (lignocellulose-biochemistry).
Another study by Pavlenko et al. [25] examines different alternative jet fuel types produced from different feedstocks. The authors use three different parameters that measure embodied carbon for a given fuel. The first measure is called direct life cycle emissions (i.e., WTWa). This is attributable to upstream phase of fuel manufacturing (feedstock production and fuel conversion), transport, and the use-phase of the fuel. The second measure is indirect land-use change (ILUC) that comprises of indirect GHG emissions considering land-use effects. The ILUC emissions are associated with crop-based feedstocks. The ILUC emissions may also be attributable to by-products, waste, and residues if these are deflected from the present utilisation. Such impacts may be significant, especially if the economic relationships of the feedstocks are closely related with vegetable oils.
The third measure is called carbon intensity, which is a sum of the first and the second measure i.e. sum of direct life cycle (WTWa) emissions and ILUC emissions [25]. Additionally, the authors carry out a cost comparison of some of the fuel type and feedstock combinations, where they compare the levelized cost of the production process. The levelized cost comprises of capital, feedstock, and operating cost. The comparison of complete life cycle GHG emissions (three measures) and levelized production cost for the fuel type and feedstock combinations is summarised in Table 3.
The information in Table 3 is important, particularly considering the first and third measure. This information is helpful for analysing the ‘sustainability’ aspect of bio-jet fuels with the limited feedstocks evaluated in the study by Pavlenko et al. [25]. The levelized production cost and the first measure i.e., direct life cycle emissions for feedstock and fuel type is analysed through Figure 1. Similarly, the levelized production cost and the third measure i.e., carbon intensity for feedstock and fuel type is analysed through Figure 2. Figure 2 absorbs the unintended impacts of crop-based feedstocks i.e., ILUC emissions. Typically, ILUC emissions are not calculated in all life cycle studies.
It can be observed from Figure 1 and Figure 2 that none of the feedstock and fuel type combination fall in the ‘ideal alternative fuel zone’ (or sustainable alternative fuel zone) i.e., the combination that has lower GHG emission and cost compared to the conventional jet fuel. Referring to Figure 1, HEFA-UCO and HEFA-PFAD (food crop) are the preferred candidates of fuel type and feedstock combinations followed by HEFA-palm oil (food crop) and HEFA-soy oil (food crop). After considering the land-use impacts of the crop-based feedstocks i.e., Figure 2, particularly for food-crops, HEFA-PFAD (food crop), HEFA-palm oil (food crop) and HEFA-soy oil (food crop) are no longer preferred candidates. Referring to Figure 2, HEFA-UCO and FT-MSW are the top two preferred candidates. Figure 1 and Figure 2, especially the latter convey the importance of a holistic evaluation. Though ‘direct life cycle emission’ or WTWa is a holistic measure, it does not capture the unintended impacts of certain feedstocks for fuel production, especially feedstocks that compete with food-crops.
A study by Schmidt et al. [46] demonstrates the development of a relatively novel fuel called ‘power-to-liquid’ (PtL) jet fuel. Electricity produced from renewable sources like solar and wind energy is used in the electrolysis of water for hydrogen production. After carbon (CO2) capture, hydrogen and CO2 undergo chemical process to form hydrocarbon fuel (PtL). This study provides information on different pathways of producing PtL fuel, and it estimates the life cycle GHG from the production pathways. PtL has significantly lower/near-zero life cycle GHG emission and about 55% lower water consumption compared to conventional jet fuel. It is not currently approved for civil aviation. The life cycle GHGs of PtL from two paths [46,47]; are as follows:
- i.
- PtL (wind/photovoltaics [PV] in Germany, renewable world embedding) = ~1 g/MJ
- ii.
- PtL (wind/PV in Germany, today’s energy landscape in material sourcing and construction) = 11 to 28 g/MJ
One of the processes involved in fuel refining is the FT process. It is to be noted that 50% blended FT jet fuel is approved by ASTM, and 50% blend of PtL from FT process can be used directly. It has higher fuel productivity per hectare land compared to all bio-jet fuels. Its thermo-physical and fuel handling properties are like conventional jet fuel, which means that PtL can be potentially used as a ‘drop-in’ fuel. This enables status-quo in aircraft powerplants. Presently, it costs 7.3 – 10 times more than conventional jet fuel. Similar information is revealed in the report by the German Environmental agency [47], where details of PtL fuel production, life cycle GHG, and its current and 2050 production costs are provided. In 2050, the cost of PtL is predicted to be 1.4 – 4.5 times the cost of conventional jet fuel [46,47]. Table 3 and Figure 2 provide the ILUC emissions of PtL. The ILUC emissions are attributable to the infrastructure required for new renewable electricity generation. The direct life cycle GHG emissions for PtL in future renewable energy landscape is 1 g/MJ and after considering the ILUC emission of 12.5 g/MJ results in a carbon intensity of 13.5 g/MJ for PtL. Referring to Table 3, the levelized cost of production of FT-PtL (using future energy landscape) is 5.9 times the present cost of the conventional jet fuel.
A study by De Jong et al. [26] carries out WTWa CO2 equivalent emission performance of several renewable jet fuel pathways and analyses the effect of different co-product allocation process. The WTWa CO2 equivalent values for different renewable jet pathways are summarised in Table 4. The authors find that FT pathway enables the highest reduction of GHG emission (86 – 104%) compared to conventional jet fuel. The authors highlight that renewable jet fuel could significantly reduce aviation related GHG emissions if correct pathways and/or feedstock are used. Additionally, the authors note that the GHG emission performance of renewable jet fuel could be further improved by employing carbon capture and storage, and using sustainable hydrogen sources, in the fuel production.
In 2021, the international civil aviation organization (ICAO) published/updated the default life cycle emissions values for carbon offsetting and reduction scheme for international aviation (CORSIA) eligible fuels [28], based on study [27]. For these CORSIA values, three different parameters are used that measure embodied carbon for a given fuel. The first measure is called direct or core life cycle emissions which is attributable to upstream phase of fuel manufacturing (feedstock production and fuel conversion), transport, and the use-phase of the fuel. The second measure is ILUC that comprises of indirect GHG emissions considering land-use effects. The ILUC emissions are associated with crop-based feedstocks which maybe attributable to by-products, waste, and residues if these are deflected from the present utilisation. Such effects may be important, especially if the economic relationships of the feedstocks are closely related with vegetable oils. The third measure is called carbon intensity or net emissions, which is a sum of the first and the second measure i.e., sum of direct life cycle emissions and ILUC emissions. These default values are calculated based on the core life cycle emissions and ILUC emissions, for selected feedstocks and pathways in different country, region and/or globally, and are summarised in Table 5. The lowest net emissions (WTWa) are observed for FT fuel (-22.5 g/MJ CO2 equivalent) produced from miscanthus in the USA.
A review study by Kolosz et al. [23] compares the WTWa performance metrics of different studies on ‘drop in’ fuels which include biofuels (first, second, and third generation) and different fossil fuel based jet fuel (from coal, oil sands, oil shale, natural gas, etc.). The review study highlights the uncertainty during fuel production and combustion at high altitudes. The study points out next generation fuels such as oleaginous yeasts, alcohols, and low-carbon fuels – liquid hydrogen (LH2), liquid natural gas (LNG), and liquid ammonia (LNH3), and the need to examine these fuels on WTWa basis, in future studies.
A report by Van Der Sman et al. [29] reviews cost of sustainable aviation fuels (biofuels and PtL) and their carbon reduction potential in EU, in addition to reviewing literature on other industry strategies for decarbonising aviation. The authors report that PtL has higher embodied carbon reduction potential as compared to biofuels but has significantly higher cost. For example, jet fuel produced from used cooking oil (HEFA) and hydrothermal liquefaction (separately) will cost 1.9 – 2.7 times higher and PtL will cost 2.2 – 6.4 times higher, compared to Jet-A.
The study by Koroneos et al. [56] (based on the Cryoplane project) conducted a comparative WTWa performance examination of a small aircraft from the A320 family (3,360 km range, 124 passengers) powered by LH2 and Jet-A (separately) considering effects such as greenhouse, acidification, eutrophication, and winter smog. This analysis is conducted using GEMIS (global emission model for integrated systems) database. The authors examine a smaller aircraft, though it is relevant to this work (large twin aisle aircraft) in terms of high-level objectives, is less recent (early 2000s) and considers fewer ways of producing LH2. Also, the authors do not consider the effect of contrails cirrus in their WTWa analysis. The authors consider energy source like solar photovoltaics, solar thermal, wind, biomass, hydropower, and natural gas, for hydrogen production. The authors emphasise the significance of producing LH2 from renewable energy sources such as wind energy and hydropower, especially considering their negligible environmental impacts. However, the authors also point the need to produce LH2 from these sources cost-effectively while ensuring the fuel demands are met.
A study by Pereira et al. [57] compares LH2, LNG, and Jet-A on a WTWa basis, where LH2 is produced from four separate pathways – steam methane reformation, solar PV, wind energy, and hydropower. This comparison is carried out for both small (A320 type) and large aircraft (A340 type). The authors use a combination of existing models (GREET and GEMIS) for the well-to-pump (WTP) phase or fuel manufacturing phase emissions modelling and existing EMEP/EEA dataset for the pump-to-wake (PTWa) phase or use-phase. The methodology does not consider the poor volumetric energy density characteristics of LH2 which penalises aircraft energy performance. The aircraft use-phase energy consumption and/or emissions have a significant impact on the WTWa performance. Also, the authors do not consider the effect of contrails cirrus in their WTWa analysis. The authors observe that renewable hydrogen is the less polluting option, particularly from hydropower or wind energy. Additionally, manufacturing LH2 from renewable energy sources has benefits both in terms of WTWa energy consumption, and environmental and social impacts. The authors point out the need to examine renewable LH2 production cost, since the market penetration of this fuel depends on its cost effectiveness.
Bicer et al. [58] conducts a WTWa evaluation of a small twin aisle aircraft of conventional tube-wing architecture (such as the Boeing 767) with a flight range of 5,600 km, where the aircraft is operated by Jet-A, LH2, LNG, LNH3, ethanol, and methanol (separately). It is to be noted that the authors use SimaPro software (with Ecoinvent database), which is a life cycle assessment software, for their analysis. The methodology does not consider the poor volumetric energy density characteristics of LH2 which penalises aircraft energy performance that has a significant impact on the WTWa performance. Also, the authors do not consider the effect of contrails cirrus in their WTWa analysis. The fuels are examined considering aspects such as land use, global warming potential (GWP), ozone layer depletion, abiotic depletion, and human toxicity. For both LH2 and LNH3, the authors evaluate renewable energy sources for fuel manufacturing that include hydropower, geothermal, solar, and wind energy, and for LH2 the production pathway of underground coal gasification with carbon capture storage is also examined. The authors find that LH2 when manufactured from geothermal energy could be preferred route than LNH3 (from geothermal), other alternatives, and Jet-A on WTWa basis in terms of GWP.
Similarly, a study by Ratner et al. [59] provides the WTWa performance of a small aircraft (1,667 km range, 190 passengers) powered by battery and fuel cell (separately), where the electricity and LH2 are produced from different sources. The authors use Ecoinvent life cycle assessment (LCA) dataset for their analysis, and it is unclear (not explicit) whether the (negative) volumetric effects of LH2 are considered in the aircraft energy modelling. The methodology is either not clear from the information supplied or do not consider the poor volumetric energy density characteristic of LH2 which penalises aircraft energy performance. The aircraft use-phase energy consumption and/or emissions have a significant impact on the WTWa performance. Also, the authors do not consider the effect of contrails cirrus in their WTWa analysis. The authors provide comparison of 13 different alternative cases with metrics such as oxidation and eutrophication potential, climate impact, ecotoxicity, and land use, along with their cost. The authors find that electric aircraft powered by electricity produced from wind energy could reduce the aircraft’s climate impact, compared to Jet-A, while being the most cost-effective solution of all alternatives and of similar magnitude as that of Jet-A. The analysis is simplistic in nature and is limited to fewer pathways/sources of producing electricity and LH2, for a small aircraft with short range.
A study by Siddiqui et al. [60] conducts comparative WTWa performance examination of a passenger aircraft (range and passengers not known) powered by LH2, LNH3, ethanol, methanol, dimethyl ether, biodiesel, and Jet-A (separately). The fuels are examined considering aspects such as greenhouse effect, ionising radiation potential, terrestrial acidification, freshwater eutrophication, photochemical ozone formation, particulate matter, freshwater ecotoxicity, human carcinogenic toxicity, and land use occupation. For LH2 and LNH3, the authors examine renewable energy sources for fuel production such as hydropower, geothermal, solar, and wind energy. This analysis is conducted using SimaPro software using Ecoinvent database. The methodology is either not clear from the information supplied or do not consider the poor volumetric energy density characteristic of LH2 which penalises aircraft energy performance. The aircraft use-phase energy consumption and/or emissions have a significant impact on the WTWa performance. Also, the authors do not consider the effect of contrails cirrus in their WTWa analysis. The authors find that LH2 when produced from geothermal energy, performs better than LNH3 (from geothermal), other alternatives, and Jet-A, on WTWa basis in terms of greenhouse effect. The authors point out the need of manufacturing LH2 from renewable energy sources cost-effectively while simultaneously ensuring that the required fuel demand is met.
In a study by Miller [30], a slightly more detailed WTWa analysis of alternative aviation fuels (LH2 and biofuels) is conducted, compared to above studies. The metrics used for this comparative WTWa analysis are climate impacts and air quality, water consumption in fuel manufacturing stage, and in non-use phase it estimates acidification, eutrophication, respiratory effects, and smog. This study encompasses aircraft and airport emissions (construction and use-phase) and considers a simplistic estimation of effect of contrails toward climate impacts. The methodology of the said study for the WTWa emissions analysis is eclectic as the authors use published models for different segments of the life cycle. For example, the author uses GREET model for the fuel manufacturing phase emissions. The author uses all available LH2 production pathways in GREET, and for biofuel only FT, HEFA, and ATJ are used. The study by Miller, though is slightly more detailed compared to the above studies as it consider tens of several feedstocks and/or pathways for LH2 and biofuels along with the effect of contrails cirrus in WTWa analysis, it misses out on PtL or electro-fuels and STJ fuel, and the WTWa results are limited only to short or medium range aircraft. The author provides analysis in the use-phase for different aircraft size at 930 km range (500 nmi) and further examines a Boeing 787-800 type for a 6,500 km range (3,500 nmi), for its WTWa performance. The author observes that the WTWa performance of combustion based LH2 aircraft is strongly dependent on the fuel production pathway. LH2 produced from renewable energy sources (wind, hydroelectric, and geothermal) are strong contenders but scalability is a concern. Additionally, the author points out the need for further evaluation of contrail cirrus effect of LH2 aircraft to refine the WTWa estimates and help decision making towards LH2 powered aviation investments.
A study by Mukhopadhaya et al. [61] evaluates the performance of regional and small range LH2 aircraft along with cost analysis and embodied carbon. The authors model the LH2 aircraft while considering its poor volumetric energy density characteristic along with the effect of cryogenic tank gravimetric index, which penalises the energy performance. The authors compare the embodied carbon and cost per revenue passenger km of LH2 (blue and green) and e-kerosene (PtL) with Jet-A for 2035 and 2050 timeframe in EU and USA. However, the authors consider fewer ways of LH2 production and do not consider the effect of contrails cirrus in their WTWa analysis for the fuels considered. The authors find that the cost of powering aircraft with green hydrogen is expected to be more than Jet-A but lesser than e-kerosene or blue hydrogen. Also, if carbon pricing is included then green LH2 could be cost competitive with Jet-A or cost lesser. Additionally, to maximise the climate impact reduction potential for LH2 aircraft and enable successful penetration of green hydrogen (low embodied carbon) in aviation, there is a need to account the life cycle effects appropriately along with policies. Moreover, for LH2 aircraft to be successful, the above efforts need to be complemented with supportive government policies such as low-carbon fuel standards, alternative fuel mandates to bridge the cost gap with Jet-A, carbon pricing, and/or bolstering fuel efficiency policies, to enable required investments for fostering R&D, design, testing, and establishing infrastructure for LH2 production, distribution, and storage.
The FlyZero report [31] studies different fuels and propulsion type (with technology improvement in 2040 timeframe) and compares them on WTWa basis, for regional short-range to midsize medium range aircraft. In terms of fuels and propulsion type, the study examines LH2 (fuel cell and combustion based, considering performance penalty due to installation of cryogenic tank), PtL, and biofuel. The study reports the climate impact due to contrail cirrus along with the climate impacts due to oxides of nitrogen (NOx), H2O, and CO2 in the use-phase, and emissions in the fuel manufacturing phase. The study uses a combination of models for the life cycle assessment which includes use of SimaPro software (hydrogen) and CORSIA values (for biofuels). The FlyZero report accounts the performance penalty due to cryogenic tank installation and the impact of contrail cirrus in their WTWa analysis of LH2, PtL, and biofuel for small to mid-size aircraft. However, their analysis is limited to a few selected feedstocks and/or pathways of manufacturing LH2, PtL, and biofuel. LH2 is assumed to be produced only from renewable electricity and biofuels manufactured using a mix of feedstocks from CORSIA eligible fuels (limited feedstocks only). Overall, the study finds that both combustion-based and fuel-cell powered LH2 aircraft are preferred candidates as their WTWa CO2 equivalent emissions are lesser than other alternatives and Jet-A fuel, except for very-short range where electric aircraft would be preferred vehicles.
2. Fuel Manufacturing Process
2.1. Jet-A and 100% SPK
The fuel manufacturing process can be broadly broken down into four steps – raw material extraction, transportation of raw materials to the fuel refining unit, fuel refining, and fuel transportation to the storage facility.
Kerosene or jet fuel is manufactured from crude oil (fossil fuel). The extracted crude oil is transported to the refining plant where the crude oil undergoes refining, distillation, cracking, reforming, and separation [77]. During the production of kerosene several other co-products like petrol, gas oil, diesel oil, and residual oil are formed. After kerosene is manufactured, it is transported to the storage facility and/or airport.
In this work, four SPK production pathways are considered for evaluation – ATJ, STJ, HEFA, and FT. The production process of these four pathways is discussed below:
- ATJ fuel is produced from alcohols that are sourced from sugar containing feedstocks and lignocellulosic biomass by fermentation [77]. In the ATJ production, alcohols are dehydrated, and water is removed to form hydrocarbon chains via oligomerisation. Later these are distilled for fractioning the hydrocarbons in terms of chain lengths or separate products.
- STJ fuel is manufactured from biomass feedstocks that contain sugars [77]. When such feedstocks are fermented, hydrocarbons are formed which are further refined and catalytically improved to form SPK.
- FT fuel is primarily manufactured from syngas which can be sourced from any carbon containing matter [77]. Coal and natural gas are presently used as common feedstocks for producing FT fuel. Syngas is commonly manufactured via gasification of lignocellulosic biomass feedstocks such as energy crops, municipal solid waste, and agricultural residues. The biomass undergoes chemical process at very high pressure and temperature in the presence of air and steam. The need for external electric power for the FT process is low. This is because during the FT conversion process, syngas is partly converted to wax and partly to produce electricity that is used for FT conversion process. The co-products of this process are utilised to make hydrogen that is required for hydrocracking of the wax formed during the process. This is followed by separation of products.
- HEFA SPK is produced from feedstocks that contain renewable oil i.e., oil extracted from plants, waste greases, and animal fats [77]. Renewable oil has properties similar to jet fuel and conversion to SPK is an easy process. Such oils undergo hydrotreatment followed by hydrocracking to produce the required hydrocarbon chain. During this process the oxygen from oil is removed. The products are separated into naphtha, diesel, and jet fuel.
The present fuel readiness level of ATJ, STJ, FT, and HEFA are 7, 6 – 7, 7, and 9 respectively.
2.2. Hydrogen
- Natural gas
Hydrogen is produced from natural gas using process known as steam methane reformation (SMR), which is an endothermic process. At present, hydrogen is primarily produced using SMR process. In SMR, methane reacts with steam at high pressure (3–25 bar pressure) using a catalyst to produce carbon monoxide, hydrogen, and a small amount of carbon dioxide [78].
- Coal
Organic matter, for example coal, is converted to hydrogen, carbon dioxide, and CO at temperatures above 700°C without combustion, and this process is called as gasification [79]. Further CO reacts with water to form more hydrogen and carbon dioxide via water-gas shift reaction. Hydrogen is separated from the products using special membranes and/or adsorbers.
- Coke oven gas (COG)
COG is formed when coal is heated to 1100°C without the presence of air. COG typically contains ethylene (5%), carbon monoxide (CO) (10%), methane (CH4) (34%), and H2 (51%) [80]. COG undergoes steam reforming followed with water-gas shift reaction to produce H2 and CO2 [81].
- By-product of natural gas liquid (NGL) steam cracking (SC)
NGLs are hydrocarbons such as ethane, propane, butane, isobutane, and pentane [82]. Steam crackers convert hydrocarbon/NGLs to light olefins using thermal cracking process (converting long-chain hydrocarbon to short-chain hydrocarbons) to produce hydrogen as a by-product [83].
- Solar PV
The electricity produced from solar energy using PV system, is used for the electrolysis of water to produce hydrogen [84].
- Nuclear thermochemical cracking of water
Sulphur – Iodine process is a common thermo-chemical process used for splitting water to produce hydrogen [85]. The first step is called as Bunsen reaction where iodine and sulphur dioxide react with water at 120 °C to produce hydriodic acid and sulphuric acid. In the second step, sulphuric acid is decomposed to sulphur dioxide at high temperature (around 1,000 °C). In the final step, hydriodic acid is decomposed to produce iodine and hydrogen at above 300 °C.
- Nuclear high temperature gas reactor (HTGR)
A nuclear high temperature gas reactor is a graphite moderated and helium cooled reactor [85]. A heat exchange system is used to cool off the helium and heat up water to produce steam. Electricity is produced from the steam using turbines and hot water from the turbine outlet is electrolysed to produce hydrogen, using the electricity produced from turbine.
- Biomass
Hydrogen can be produced from biomass using gasification process which is described above. Since growing biomass reduces atmospheric carbon dioxide, the net carbon emissions of this process could be low, especially if carbon capture and storage technology is employed [79].
- Integrated fermentation
Hydrogen can be produced from biological routes that use sunlight (photosynthesis and photolysis), fermentative bacteria (dark fermentation i.e. no light), and electrolysis of organic matter via microbial metabolism with small external energy input (microbial electrolysis cell) [86]. The effluent from the dark fermentation route is rich in organic matter and this could be utilised by microbial electrolysis cell for producing additional hydrogen. This process is an integrated pathway that combines microbial electrolysis cell and dark fermentation for hydrogen production.
- High temperature electrolysis (HTE) with solid oxide electrolysis cell (SOEC)
HTE uses both electricity and thermal energy for splitting water employing SOEC and hydrogen is produced [87]. In this process, water is heated so that it evaporates which requires a high amount thermal energy. This thermal energy is provided either directly in the form of steam to the electrolyser or via an external heat input. The heat input could come from renewable energy source like solar, wind, nuclear, etc. and the embodied carbon for hydrogen production could be reduced. In this work, two electricity source types are studied – Nuclear HTGR and natural gas combined cycle.
- By-product of chlorine manufacturing plant
The electrolysis of a sodium chloride solution (brine) is called as the Chlor-alkali process [88]. Hydrogen gas is one of the co-products of this process along with chlorine and sodium hydroxide.
2. Methodology

Table 7.
Operational conditions and fuel burn for different fuels at various flight segments
| Altitude (m)* | pamb (Pa)** | Tamb (K)** | Speed (m/s) | Mach** | Fuel burn (kg)*** | |||
| Jet-A | 100% SPK | LH2 | ||||||
| Engine start and warm-up | 0 | 101,325 | 288.15 | 0 | 0 | 847 | 824 | 241 |
| Taxi-out | 0 | 101,325 | 288.15 | 10.29 [89] | 0.03 | 844 | 821 | 241 |
| Take-off | 0 | 101,325 | 288.15 | 77.17 [90], [91] | 0.23 | 420 | 409 | 120 |
| Climb | 5,334 | 51,652 | 253.48 | 149.19* | 0.47 | 584 | 568 | 162 |
| Cruise | 10,668 | 23,842 | 218.81 | 248.10* | 0.84 | 59,035 | 57,727 | 19,003 |
| Descent and approach | 5,334 | 51,652 | 253.48 | 128.61 [90] | 0.44 | 626 | 612 | 216 |
| Loiter | 1,500 | 84,556 | 278.40 | 200.85* | 0.60 | 2,678 | 2,623 | 894 |
| Land, taxi-in and shutdown | 0 | 101,325 | 288.15 | 79.74 [90], [92] | 0.23 | 491 | 481 | 172 |
| *known from [12] **calculated using source [93] for given altitude known from [12] ***known from [13] | ||||||||
Table 8.
Emission index of different species and contrails for the three fuels
| Species | Emission index (g/kg fuel) | Reference | ||
| Jet-A | LH2 | 100% SPK | ||
| CO2 | 3,158 [8] | 0 | 3,092 [8] | [8] |
| H2O | 1,240 [94] | 8937 [95] | 1,370 [96] | [94]–[96] |
| SO2 | 0.8 [94] | 0 | 0 [8] | [8], [94] |
| VOC | 0.17 | 0 | 0.17 | [8] |
| CO | 1.49 | 0 | 1.51 | [8] |
| PM10 | 0.20 | 0 | 0.02 | [8] |
| PM2.5 | 0.20 | 0 | 0.02 | [8] |
| SOx (total) | 1.40 | 0 | 0.00 | [8] |
| BC | 0.06 | 0 | 0.00 | [8] |
| OC | 0.06 | 0 | 0.00 | [8] |
| CH4 | 1.18E-03 | 0 | 1.21E-03 | [8] |
| N2O | 2.31E-03 | 0 | 2.37E-03 | [8] |
| g/MJ | ||||
| Contrails | 65 | 40 | 50 | [31] |
Table 9.
GWP of NOx and H2O at different mission segments
| Altitude (m) | GWP | ||
| NOx | H2O | ||
| Engine start and warm-up | 0 | -11 [8], [97] | 0 [97] |
| Taxi-out | 0 | -11 [8], [97] | 0 [97] |
| Take-off | 0 | -11 [8], [97] | 0 [97] |
| Climb | 5,334 | 9.17 [97] | 0 [97] |
| Cruise | 10,668 | 114 [2] | 0.06 [2] |
| Descent and approach | 5,334 | 9.17 [97] | 0 [97] |
| Loiter | 1,500 | -11 [8], [97] | 0 [97] |
| Land, taxi-in and shutdown | 0 | -11 [8], [97] | 0 [97] |
Table 11 (SI §3) lists the production capacities of different fuels and production feedstocks/pathways per plant. It is to be noted that only shortlisted pathways of LH2 and 100% SPK from §3.1.3 are listed in this table. The IF manufacturing capacities are not known. In Table 11 (SI §3) the global manufacturing capacity for Jet-A is purposely listed for 2019 (normal operations prior to the pandemic). It can be observed from Table 11 (SI §3) that for both LH2 and 100% SPK the manufacturing units and capacities and liquefication capacity must be ramped up significantly (multiplication factor of 400 – 3,500 for LH2 and 600 – 6,300 for 100% SPK, depending on the pathway) if these fuels have to replace Jet-A fuel.
3. Results
In §3.1.3 LH2 is identified as the fuel that has the potential to make long-range flight emit near-zero and/or negative WTWa CO2 equivalent emissions, where LH2 is manufactured from Biomass w CS LUSME, Biomass w CS LBIGCC and IF w CS feedstock/pathways. Table 12 provides a summary of other unintended life cycle environmental and social impacts for these three LH2 production routes in comparison with Jet-A. These three routes are compared with Jet-A for aspects like indirect use of fossil fuels, water consumption, and WTWa VOC, CO, NOx, PM10, PM2.5, SOx, BC, and OC emissions. A colour coded ranking system is used for simplicity and this is indicated in Table 12. Similar data for remaining LH2 production routes and 100% SPK cases are discussed below for completeness (Figure 3 to 12).
Figure 3 provides the comparison of fossil fuel use for different LH2 and 100% SPK feedstock and pathways for 2020 and 2050 US energy mix scenarios. It can be observed that for the three identified LH2 cases (Biomass w CS LUSME, Biomass w CS LBIGCC, and/or IF w CS), the use of fossil fuels is significantly greater (indicative of poor process efficiency) compared to Jet-A production (difference of order of magnitude).
The net WTWa CO2 equivalent emissions are lower for these three cases due to the employment of carbon sequestration. The greater use of fossil fuels (indirectly) for producing LH2 from the above three feedstocks/pathways compared to Jet-A, is an unintended natural resource (environmental) impact which none of the studies in literature have accounted. This greater (indirect) use of fossil fuels for the three feedstock/pathways is due to the poor manufacturing (supply-chain) process energy efficiency (from the point of cultivating crops to the point of producing hydrogen from biomass). This needs to be reduced for US based LH2 production from the above three routes or could be lesser in regions that employ greater renewable energy resources (like European countries) for power production. This effect of greater renewable energy resources in the energy mix can be observed from Figure 3 between 2020 and 2050 US energy mix scenarios. Additionally, the indirect use of fossil fuels can be reduced for the said three routes by improving the energy efficiency of fuel manufacturing and its supply chain. For 100% SPK cases, the fossil fuel use is greater than Jet-A but of the similar order.
Figure 4 shows the comparison of water consumption for different LH2 and 100% SPK feedstock and pathways for 2020 and 2050 US energy mix scenarios. It can be observed that for the three identified LH2 cases (Biomass w CS LUSME, Biomass w CS LBIGCC, and/or IF w CS), the water consumption is significantly greater compared to Jet-A production due to the water required for cultivation of biomass feedstocks/crops. The greater use of water for producing LH2 from the above three feedstocks/pathways compared to Jet-A, is an unintended resource (environmental and social) impact which none of the studies in literature have accounted. For biomass based 100% SPK cases, water consumption is greater than Jet-A due to the water required for crop cultivation.
It can be observed from Table 12 that the three LH2 production routes perform poorly in terms of (indirect) use of fossil fuels and water consumption, compared to Jet-A. For WTWa CO, NOx, PM10, PM2.5, BC, and OC emissions, Biomass w CS LBIGCC route performs the best. Jet-A performs best for VOC and SOx emission (effect of lesser use of fossil fuels). The IF w CS route performs poorly on most of the aspects studied in Table 12, though this route provides a net negative WTWa CO2 equivalent emissions compared to Jet-A (due to carbon sequestration). Therefore, it is important to examine the unintended environmental and social impacts of a selected route i.e., widening the boundary for analysis than just focusing on climate impacts. This is supported by a review study by Pinheiro Melo et al. [20], where the authors observe that though advanced technologies and alternative fuels can provide solutions for mitigating aviation emissions, there might be new socio-economic and environmental challenges associated with these. Thus, they establish the need for diversifying environmental indicators beyond GHG emissions and the need to consider social and economic aspects.
The above is the significance of this section and these aspects are not considered in the studies reviewed in §1. It is important to minimise the (indirect) use of fossil fuels (resource impact) and water. The aspect of higher use of fossil fuels can be addressed by increasing the share of renewable energy sources in the energy mix and increasing the efficiency of fuel manufacturing processes/plants and fuel supply chain. The water consumption aspect can be addressed by using ocean or wastewater and treating it to be used for fuel production. This entails accounting for water treating energy and emissions in WTWa analysis.
Figure 6.
WTWa CO emission comparison for different LH2 and 100% SPK feedstock and pathways for 2020 and 2050 US energy mix scenarios.
Figure 6.
WTWa CO emission comparison for different LH2 and 100% SPK feedstock and pathways for 2020 and 2050 US energy mix scenarios.
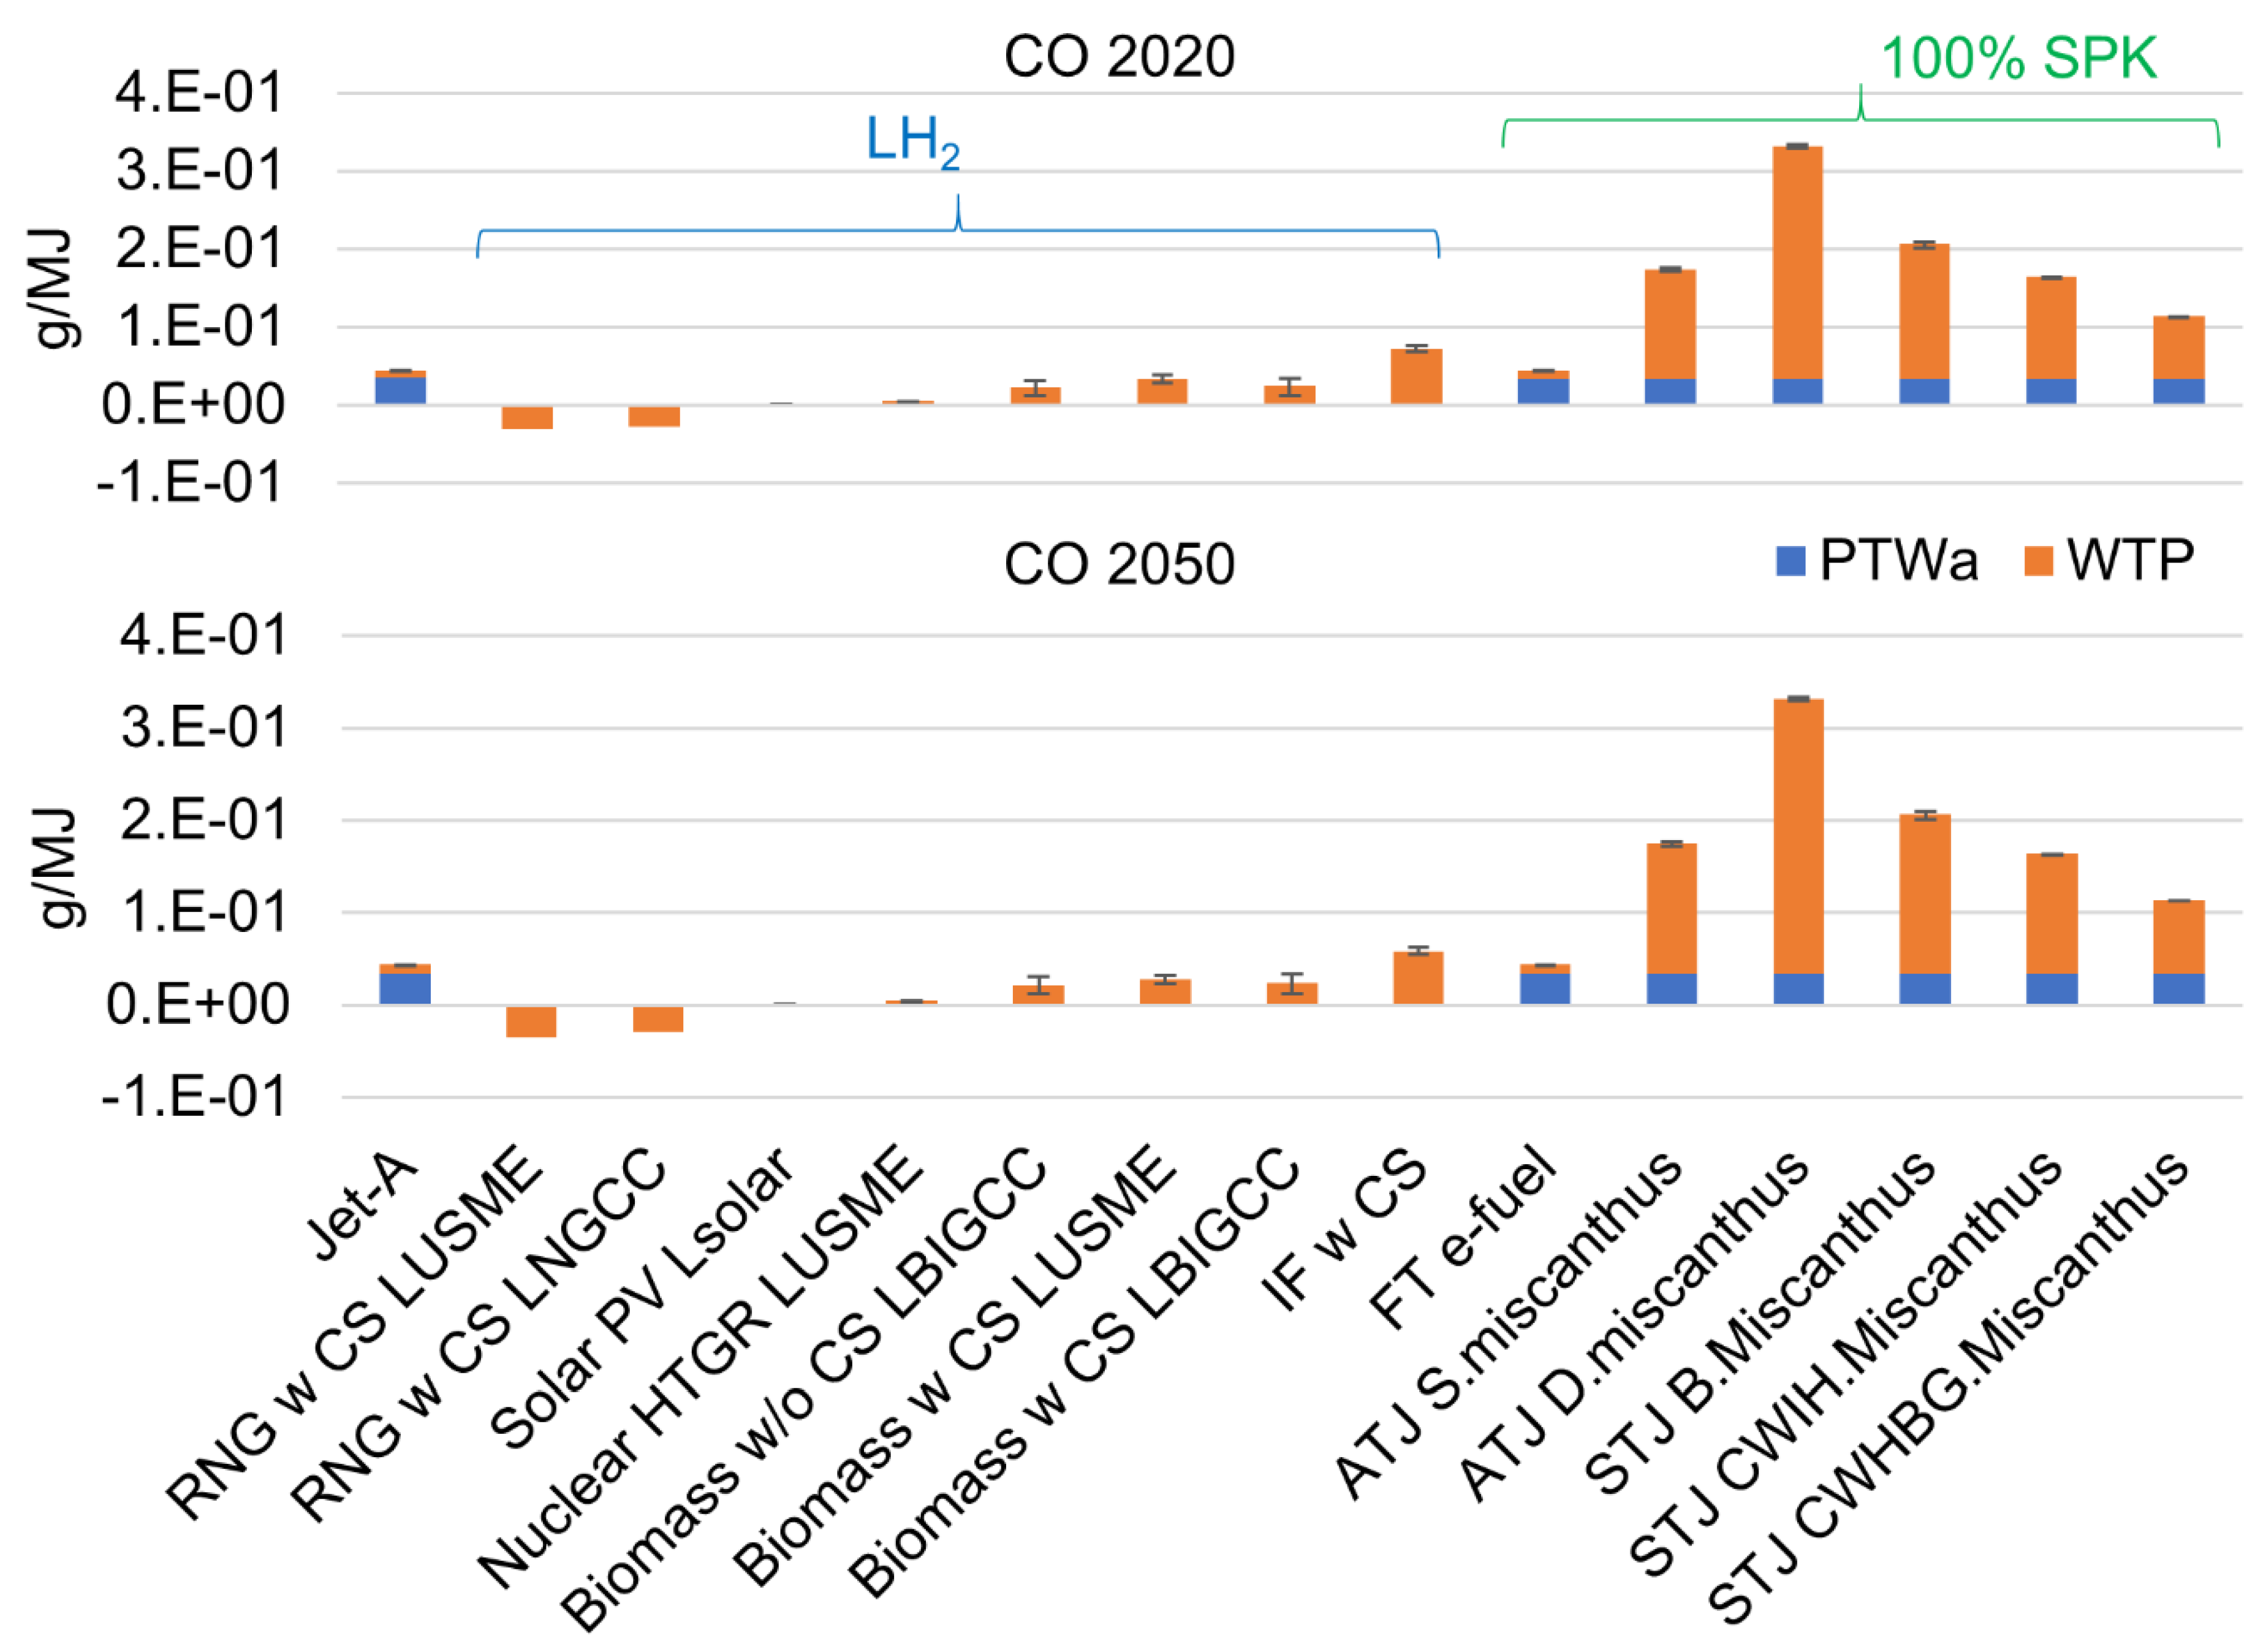
Figure 7.
WTWa NOx emission comparison for different LH2 and 100% SPK feedstock and pathways for 2020 and 2050 US energy mix scenarios.
Figure 7.
WTWa NOx emission comparison for different LH2 and 100% SPK feedstock and pathways for 2020 and 2050 US energy mix scenarios.
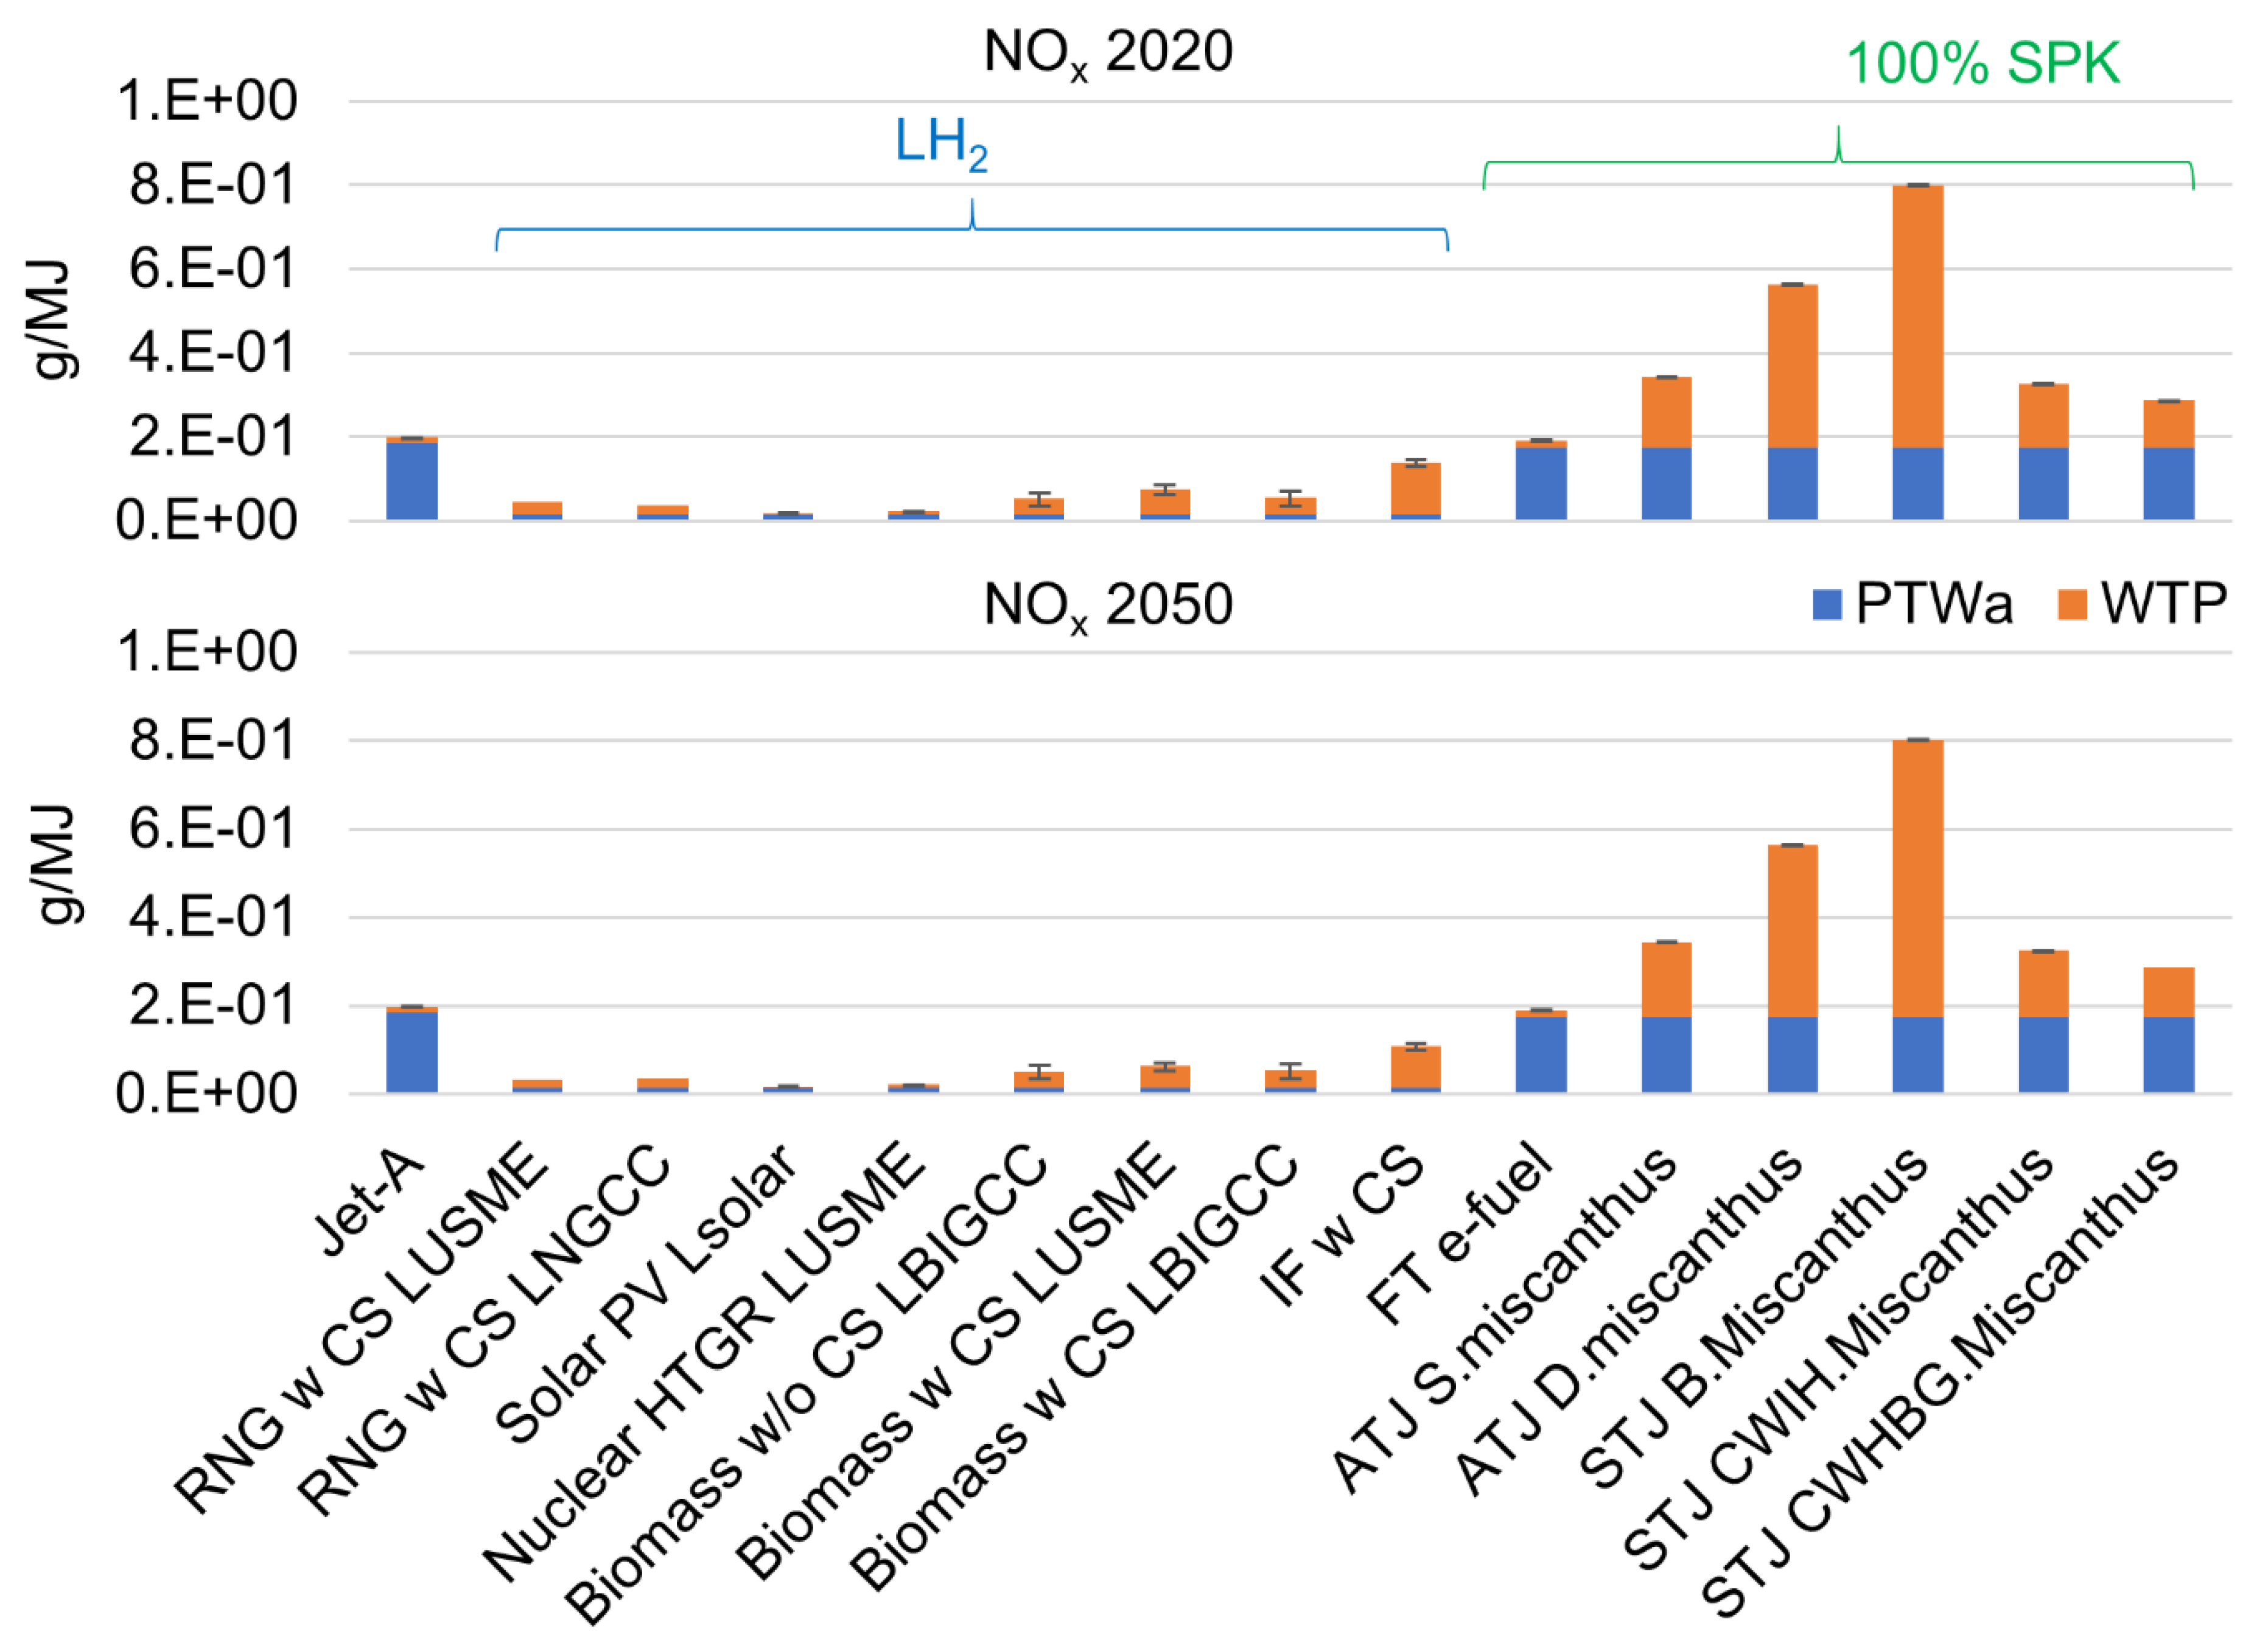
Figure 8.
WTWa PM10 emission comparison for different LH2 and 100% SPK feedstock and pathways for 2020 and 2050 US energy mix scenarios.
Figure 8.
WTWa PM10 emission comparison for different LH2 and 100% SPK feedstock and pathways for 2020 and 2050 US energy mix scenarios.
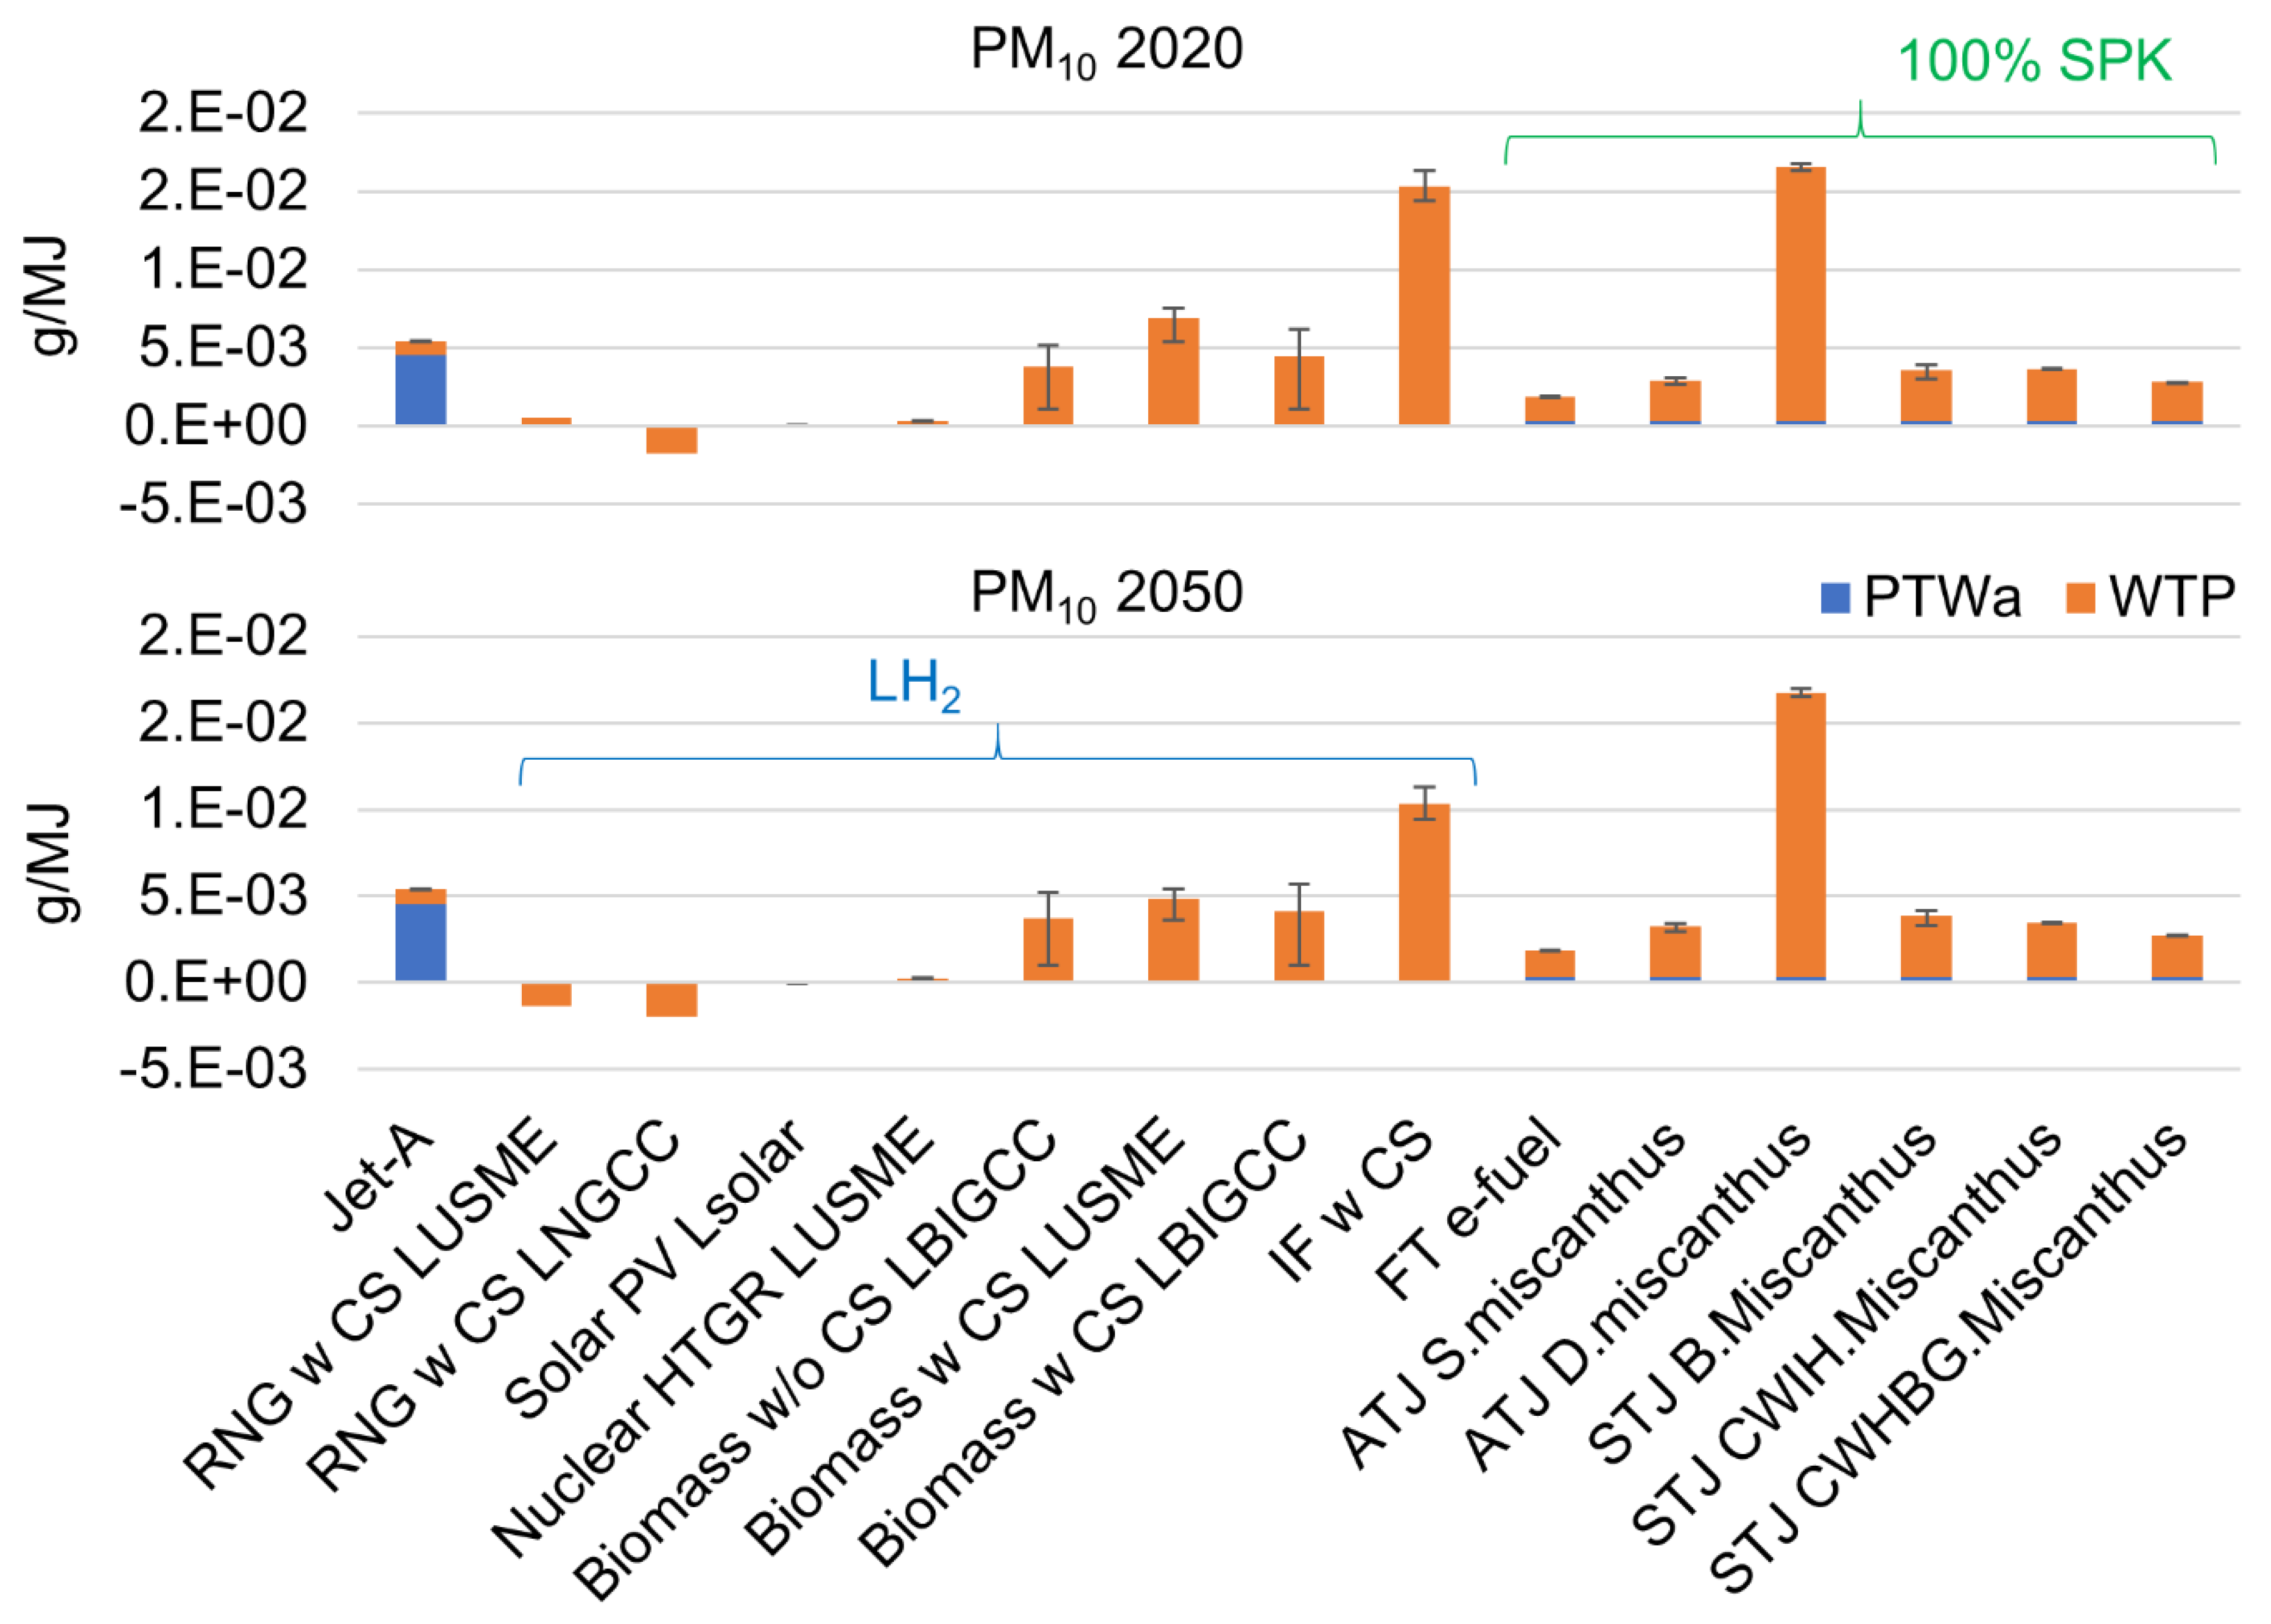
Figure 9.
WTWa PM2.5 emission comparison for different LH2 and 100% SPK feedstock and pathways for 2020 and 2050 US energy mix scenarios.
Figure 9.
WTWa PM2.5 emission comparison for different LH2 and 100% SPK feedstock and pathways for 2020 and 2050 US energy mix scenarios.
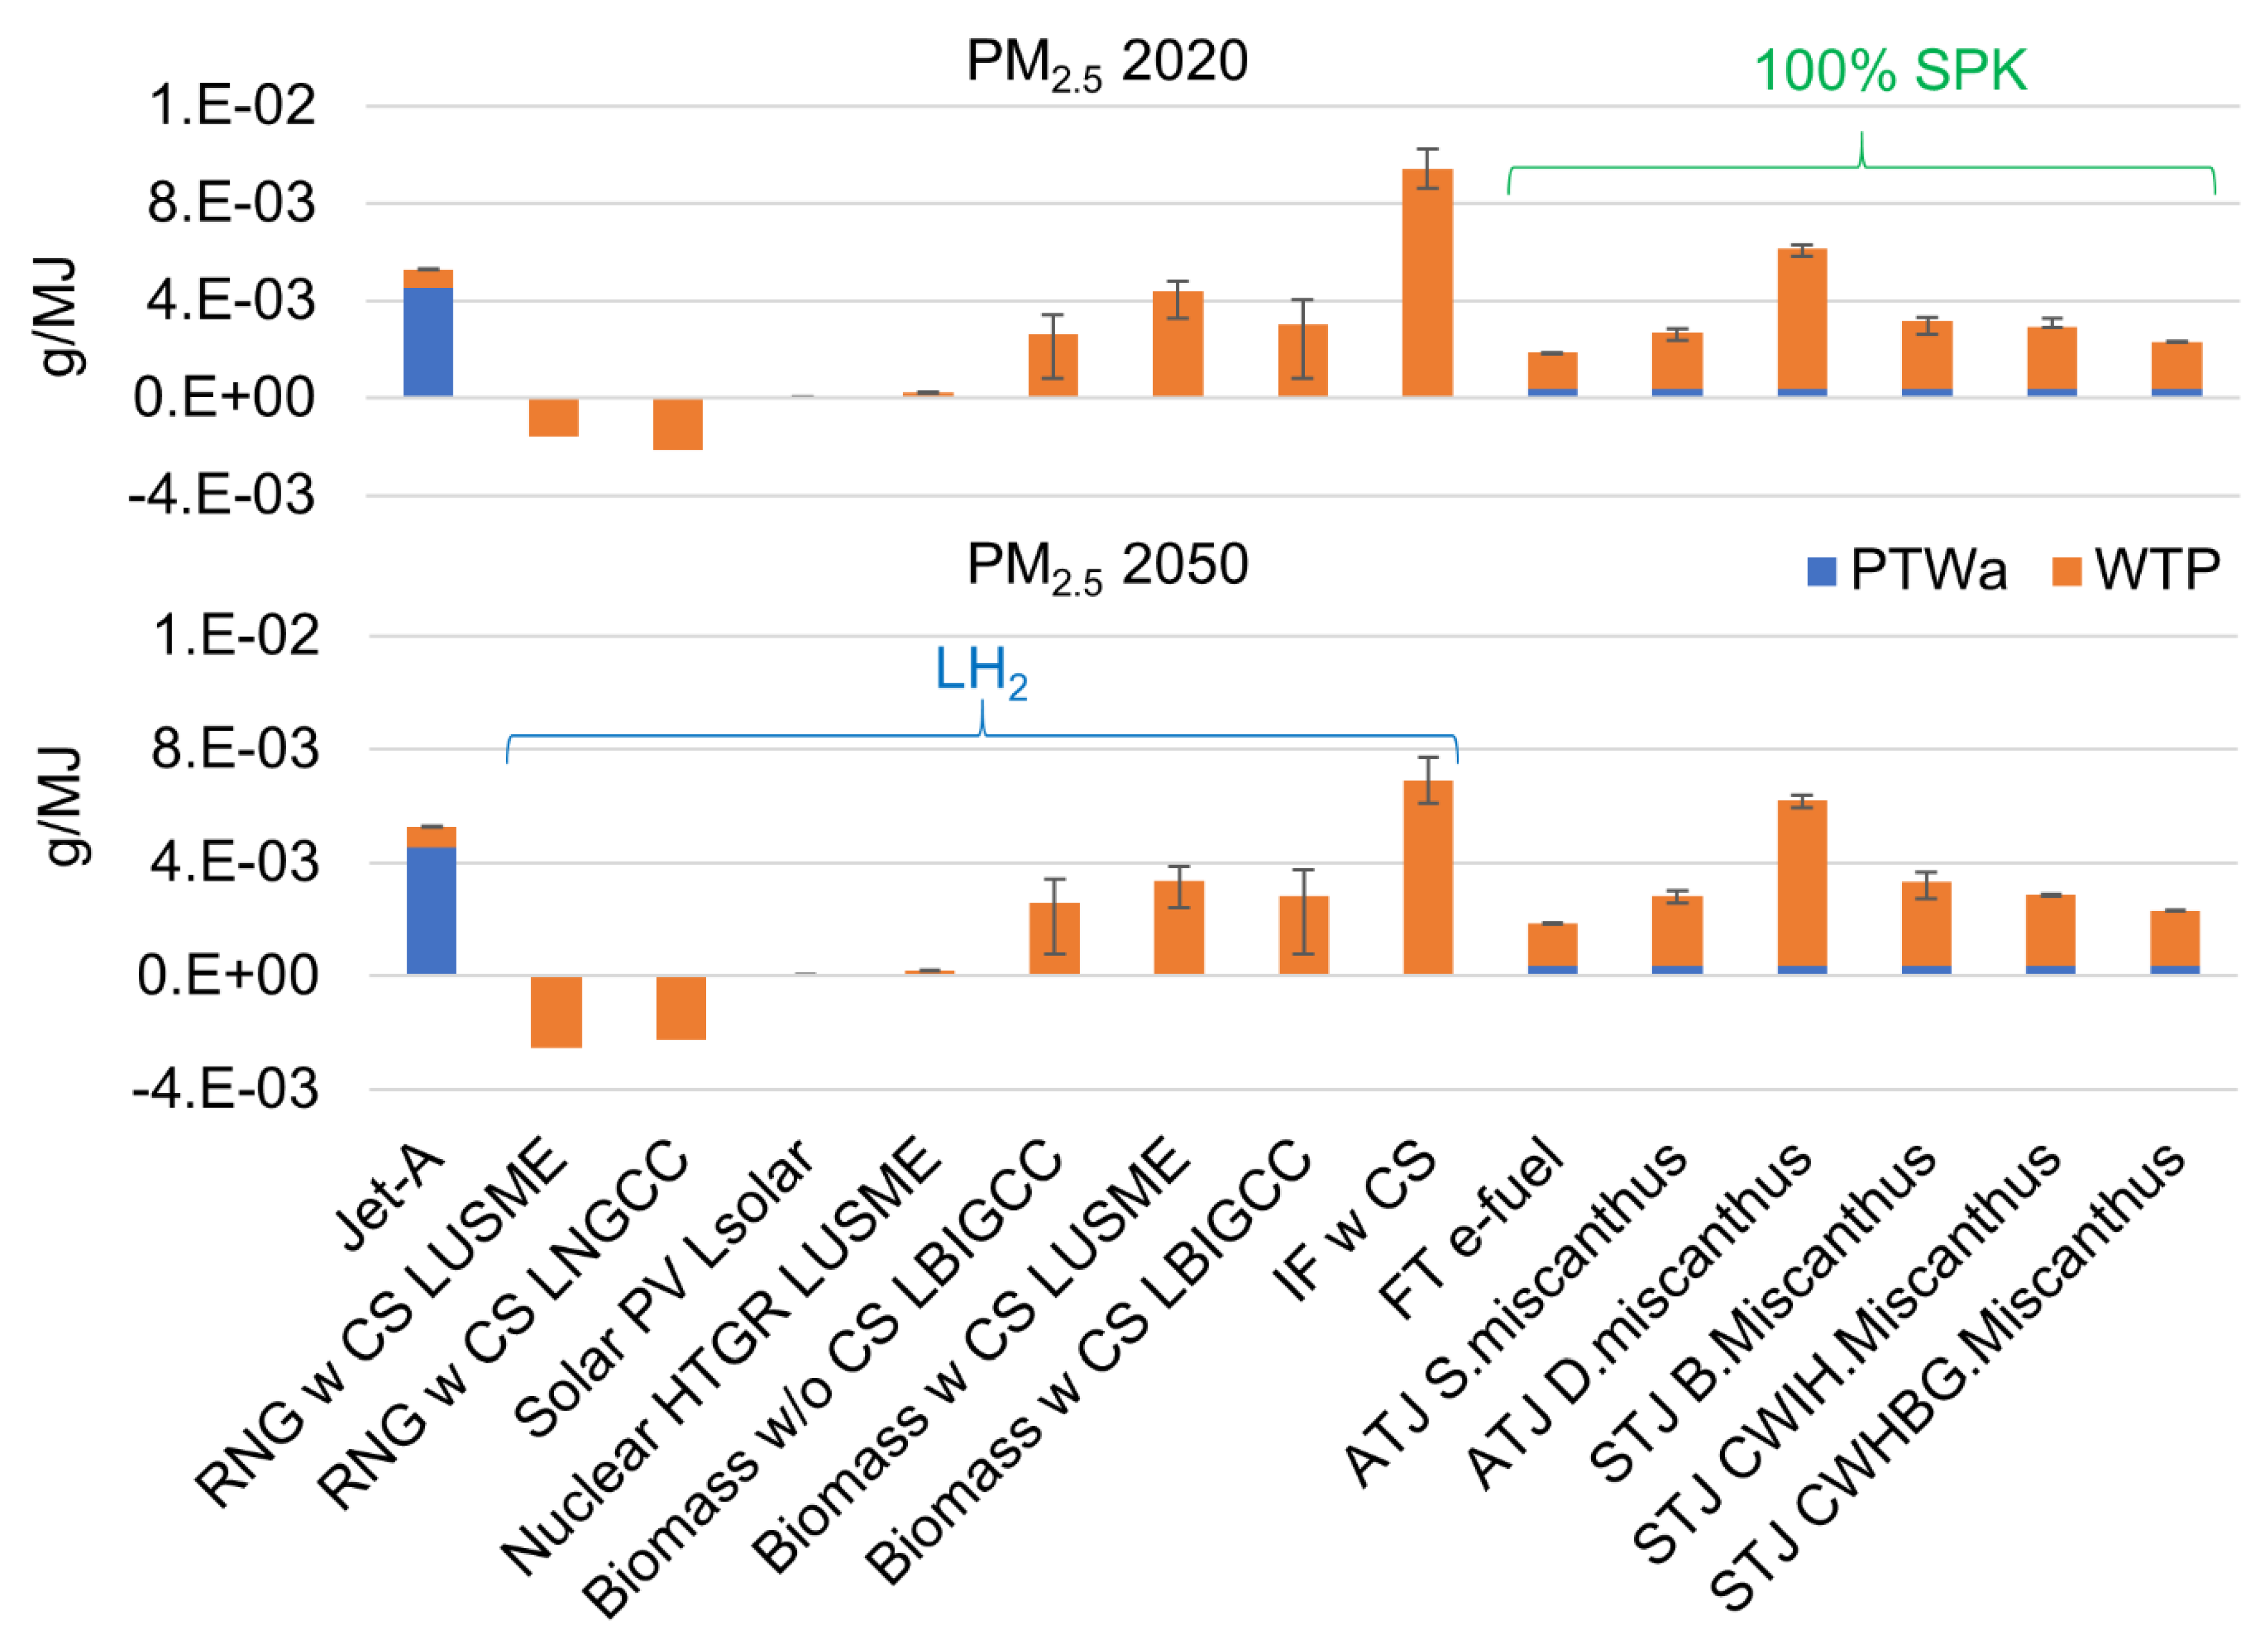
Figure 10.
WTWa SOx emission comparison for different LH2 and 100% SPK feedstock and pathways for 2020 and 2050 US energy mix scenarios.
Figure 10.
WTWa SOx emission comparison for different LH2 and 100% SPK feedstock and pathways for 2020 and 2050 US energy mix scenarios.
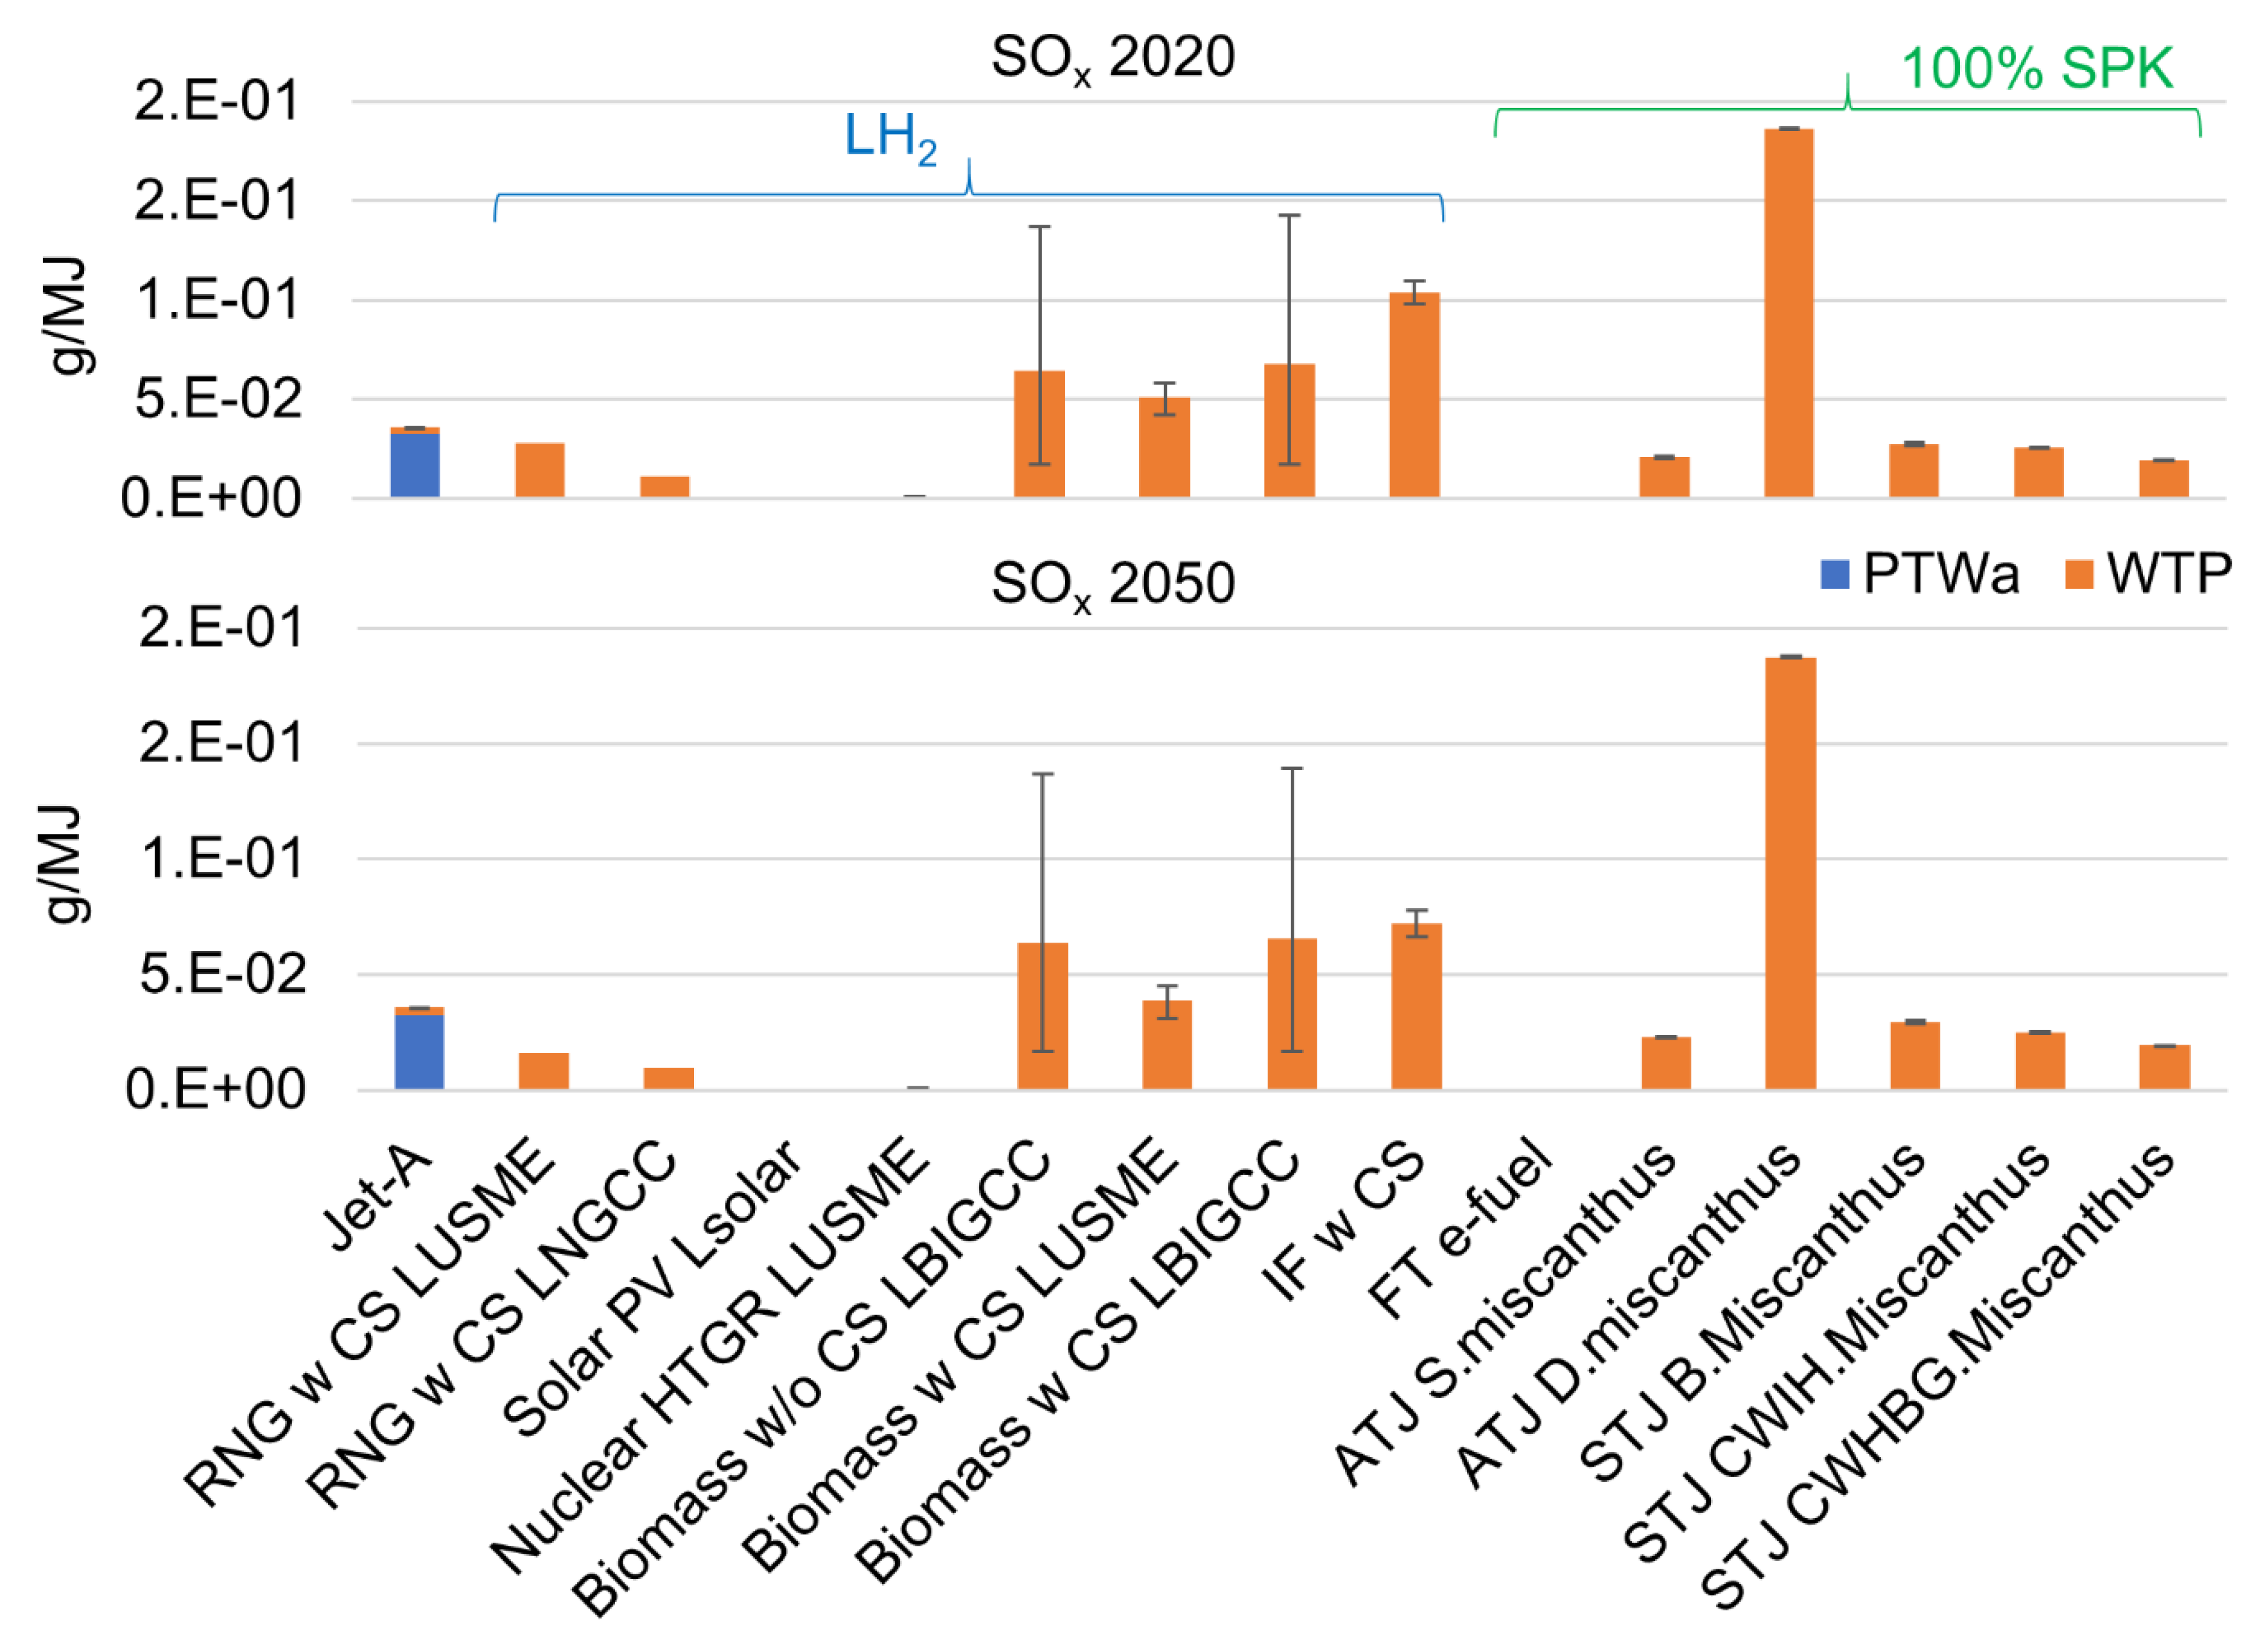
Figure 11.
WTWa BC emission comparison for different LH2 and 100% SPK feedstock and pathways for 2020 and 2050 US energy mix scenarios.
Figure 11.
WTWa BC emission comparison for different LH2 and 100% SPK feedstock and pathways for 2020 and 2050 US energy mix scenarios.

Figure 12.
WTWa OC emission comparison for different LH2 and 100% SPK feedstock and pathways for 2020 and 2050 US energy mix scenarios.
Figure 12.
WTWa OC emission comparison for different LH2 and 100% SPK feedstock and pathways for 2020 and 2050 US energy mix scenarios.
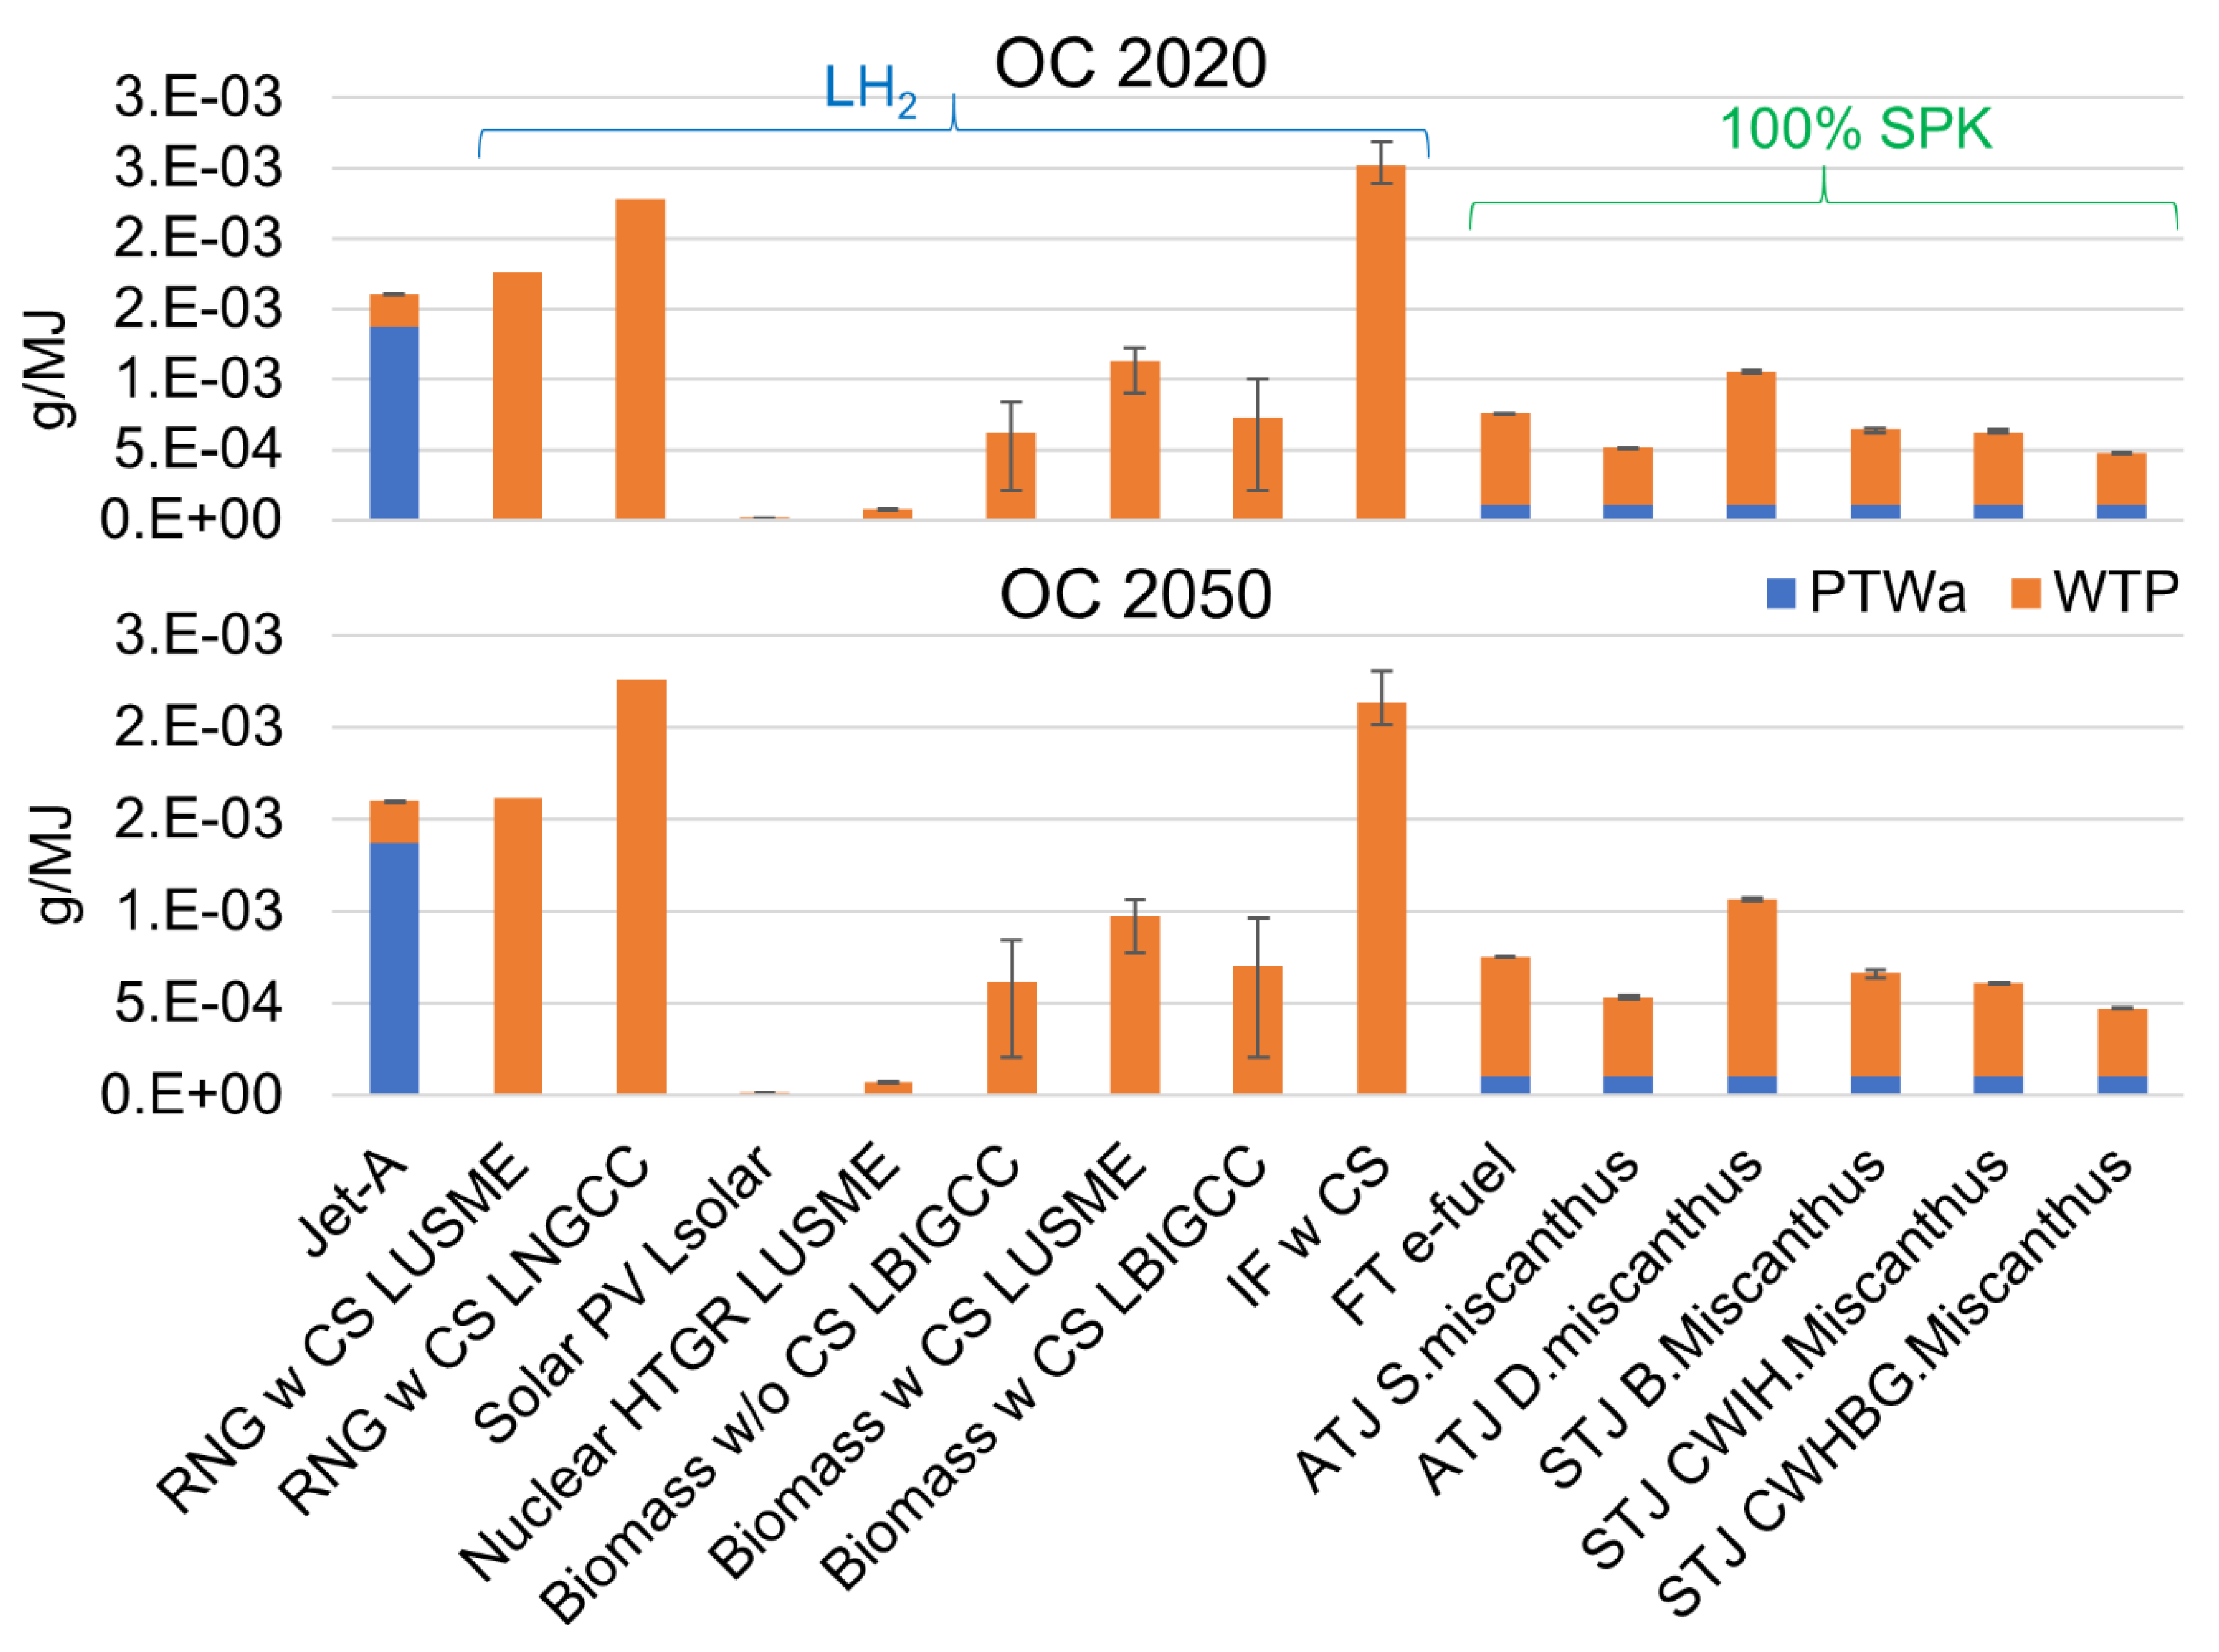
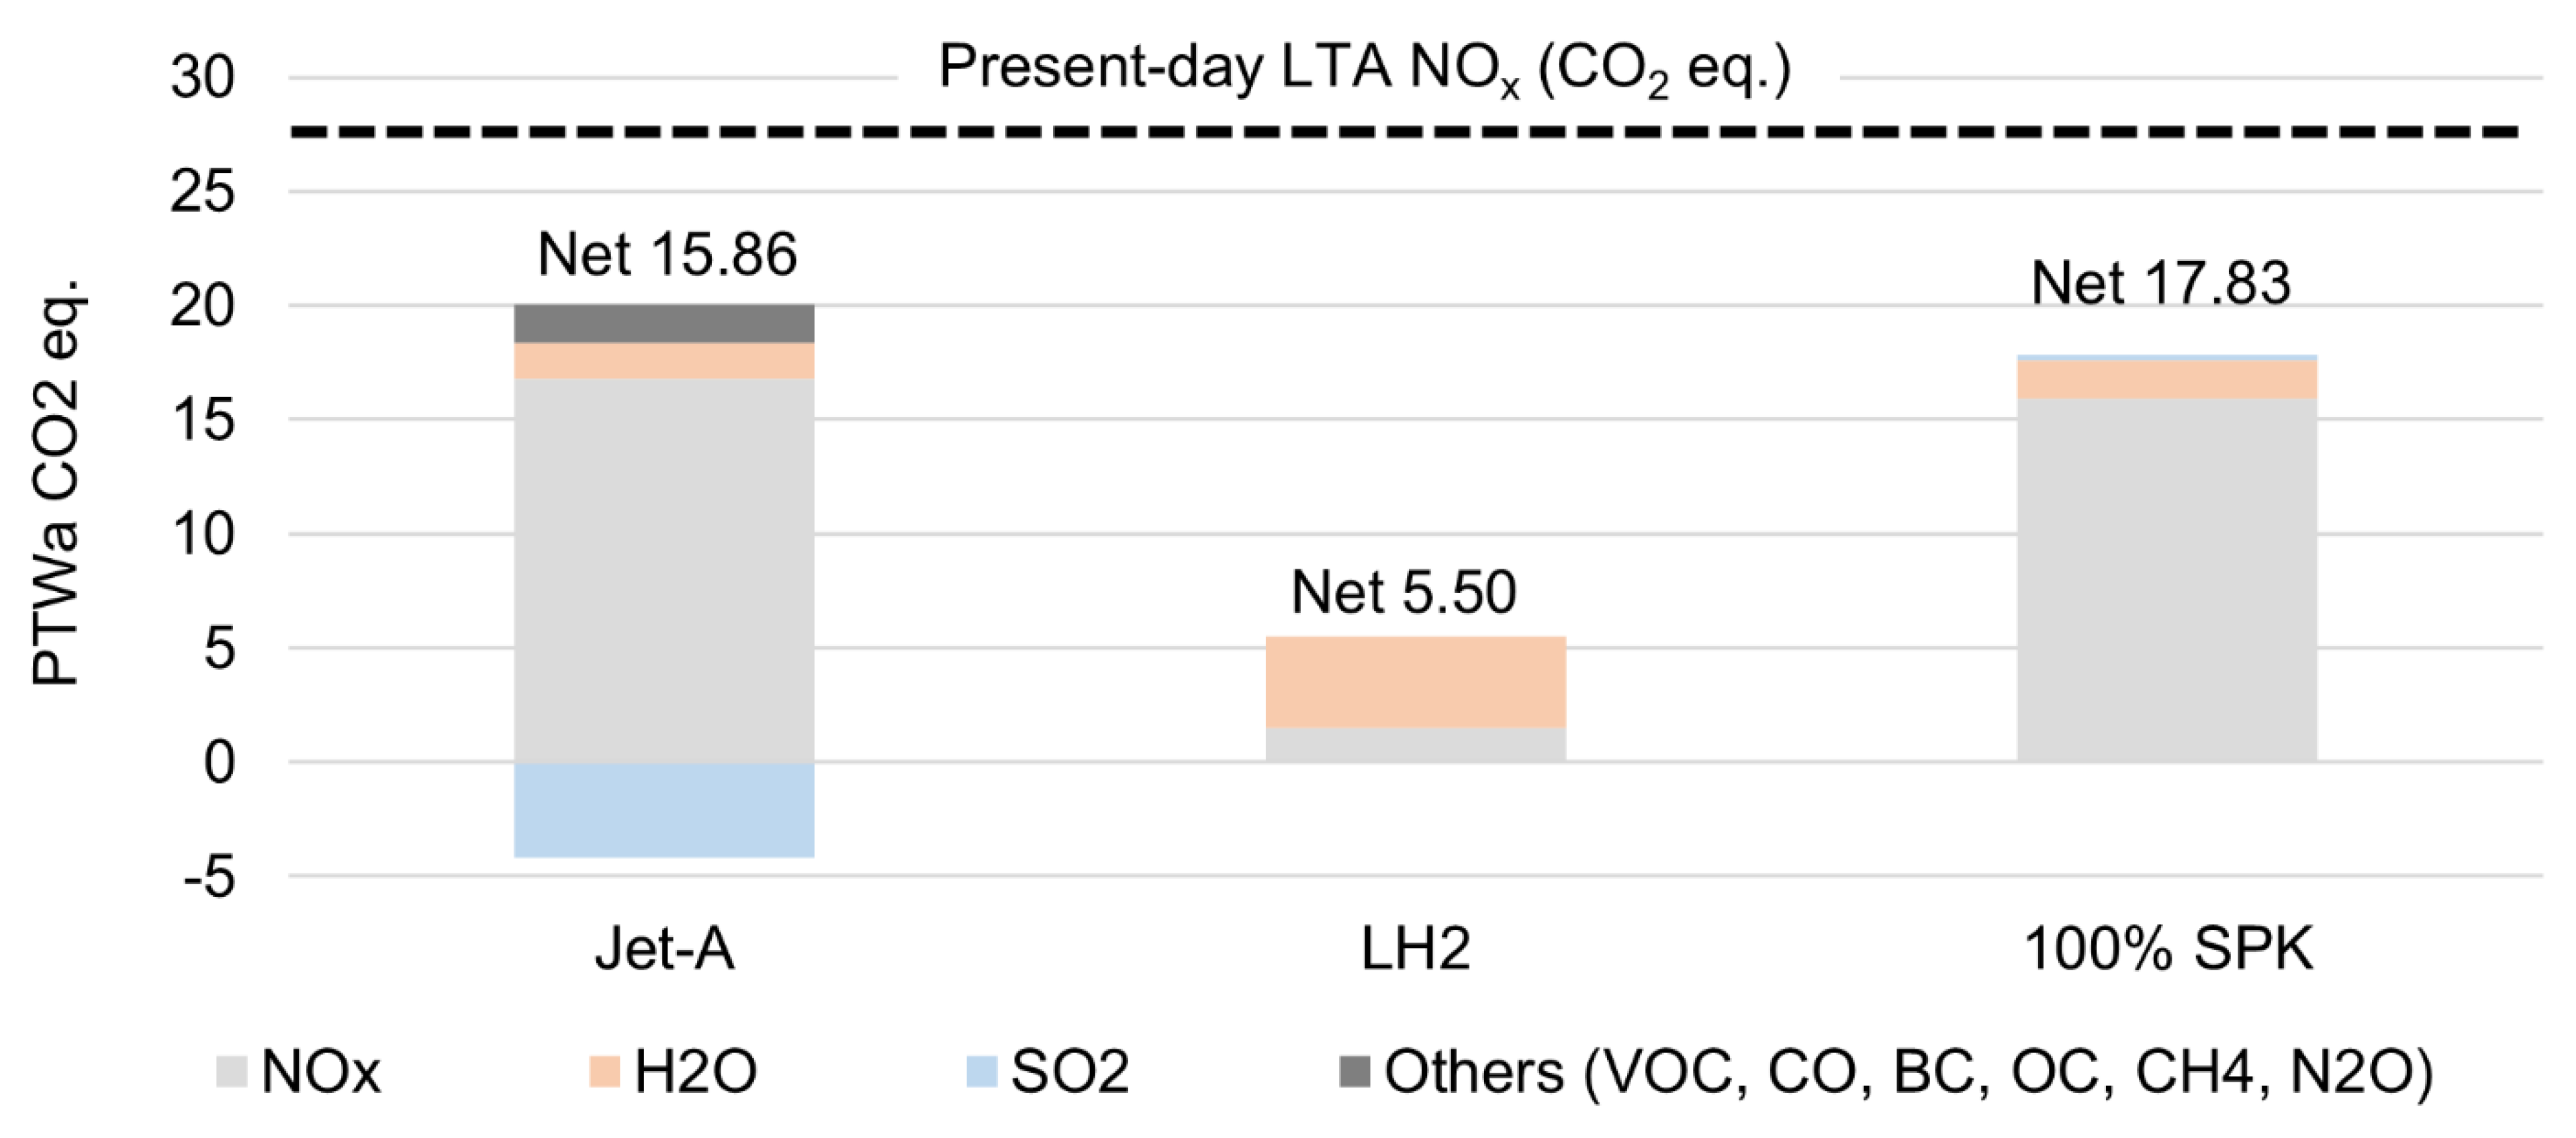
Figure 13.
Comparative analysis of PTWa NOx, H2O, SO2 and other emissions (CO2 equivalent) for Jet-A, LH2 and 100% SPK (present-day LTA NOx emission is known from GREET and cruise GWP is known from Table 9).
Figure 13.
Comparative analysis of PTWa NOx, H2O, SO2 and other emissions (CO2 equivalent) for Jet-A, LH2 and 100% SPK (present-day LTA NOx emission is known from GREET and cruise GWP is known from Table 9).
More information
First author’s other research work can be found in [6,11,12,13,14,15,16,17,18,19,20,21,22,23,24,25,26,27,28,29,30,31,32,33,34,35,36,37,38,39,40,41,42,43,44,45,46,47,48,49,50,51,52,53,54,55,56,57,58,59,60,61,62,63,64,65,66,67,68,69,70,71,72,73,74,75,76,77,78,79,80,81,82,83,84,85,86,87,88,89,90,91,92,93,94,95,96,97,98,99,100,101,102,103,104,105,106,107,108,109,110,111,112,121,122,123,124,125].
Nomenclature
| ASTM | American Society for Testing and Materials | LUSME | Liquefication using US mix electricity |
| ATJ | Alcohol-to-jet | L-Nuclear | Liquefication using electricity from nuclear energy |
| B. | Biological plant type | ||
| BC | Black carbon | L-Solar | Liquefication using electricity from solar energy |
| BWB | Blended wing body | MSW | Municipal solid waste |
| CH4 | Methane | MW | Molecular weight |
| CO | Carbon monoxide | NBC | Non-biogenic carbon |
| CO2 | Carbon dioxide | NGL | Natural gas liquid |
| COG | Coke oven gas | NOx | Oxides of nitrogen |
| CORSIA | Carbon offsetting and reduction scheme for international aviation | N2O | Nitrous oxide |
| CS | Carbon sequestration | OC | Organic carbon |
| CWHBG | Catalytic with H2 from biomass gasification plant type | Ambient pressure (in Pa) | |
| CWIH | Catalytic with in-situ H2 plant type | PFAD | Palm fatty acid distillate |
| CWM | Corn wet mill | PM | Particulate matter |
| D. | Distributed | PtL | Power-to-liquid |
| or FAR | Fuel air ratio | PTWa | Pump-to-wake |
| FT | Fischer–Tropsch | PV | Photovoltaics |
| GEMIS | Global emission model for integrated systems | Combustor inlet pressure (in MPa) | |
| GHG | Greenhouse gas | RNG | Renewable natural gas |
| GREET | Greenhouse Gases, Regulated Emissions, and Energy Use in Technologies | SMR | Steam methane reformation |
| GWP | Global warming potential | SOEC | Solid oxide electrolysis cell |
| HEFA | Hydro-processed esters and fatty acids | SOx | Oxides of sulphur |
| HRJ | Hydro-processed renewable jet fuel | SO2 | Sulphur Dioxide |
| HTE | High temperature electrolysis | SPK | Synthetic paraffinic kerosene |
| HTGR | High temperature gas reactor | STJ | Sugar-to-jet fuel |
| HTL | Hydrothermal liquefaction | S. | Standalone |
| ICAO | International Civil Aviation Organization | Ambient temperature (in K) | |
| IF | Integrated fermentation | Combustor inlet temperature (in K) | |
| ILUC | Indirect land-use change | UCO | Used cooking oil |
| LBIGCC | Liquefied using electricity from biomass integrated gasification combined cycle | VOC | Volatile organic compound |
| LCA | Life cycle assessment | w CS | With carbon sequestration |
| LH2 | Liquid hydrogen | WTP | Well-to-pump |
| LNG | Liquid natural gas | WTWa | Well-to-wake |
| LNH3 | Liquid ammonia | w/o CS | Without carbon sequestration |
| LNGCC | Liquification using power from natural gas combined cycle | Φ | Equivalence ratio |
| Combustor residence time |
References
- D. S. Lee, “The current state of scientific understanding of the non-CO2 effects of aviation on climate,” Manchester Metropolitan University, 2018. https://assets.publishing.service.gov.uk/government/uploads/system/uploads/attachment_data/file/813342/non-CO2-effects-report.pdf (accessed Jan. 02, 2020).
- D. S. Lee et al., “The contribution of global aviation to anthropogenic climate forcing for 2000 to 2018,” Atmos. Environ., vol. 244, p. 117834, Jan. 2021. [CrossRef]
- D. S. Lee, M. R. Allen, N. Cumpsty, B. Owen, K. P. Shine, and A. Skowron, “Uncertainties in mitigating aviation non-CO 2 emissions for climate and air quality using hydrocarbon fuels,” Environ. Sci. Atmos., vol. 3, no. 12, pp. 1693–1740, Dec. 2023. [CrossRef]
- Boeing, “COMMERCIAL MARKET OUTLOOK 2024–2043,” 2024. https://www.boeing.com/commercial/market/commercial-market-outlook#overview (accessed Oct. 02, 2024).
- J. Hupe, “Setting the Scene-Aviation and Climate Change,” ICAO_Aviation_Green_Recovery_Seminar, 2020. https://www.icao.int/Meetings/GreenRecoverySeminar/Documents/1.1 ICAO AGR - Setting the scene.pdf (accessed Jun. 05, 2021).
- S. S. Jagtap, P. R. N. Childs, and M. E. J. Stettler, “Energy performance evaluation of alternative energy vectors for subsonic long-range tube-wing aircraft,” Transp. Res. Part D Transp. Environ., vol. 115, p. 103588, Feb. 2023. [CrossRef]
- M. V Chester and A. Horvath, “Environmental assessment of passenger transportation should include infrastructure and supply chains,” Environ. Res. Lett., vol. 4, no. 2, p. 024008, Apr. 2009. [CrossRef]
- ANL, “GREET 2021,” Argonne National Laboratory, 2021. https://greet.es.anl.gov/.
- “Carbon Markets, Low Carbon and Sustainable Aviation Fuels with ATAG 2019 Global Sustainable Aviation Forum,” International Air Transport Association, 2019. http://aozhounum.buzz/contentassets/d13875e9ed784f75bac90f000760e998/training-talg84-carbon-saf-atag.pdf (accessed Apr. 19, 2020).
- World Economic Forum, “Target True Zero Unlocking Sustainable Battery and Hydrogen-Powered Flight - Insight Report,” 2022. Accessed: Aug. 05, 2022. [Online]. Available: https://www3.weforum.org/docs/WEF_Target_True_Zero_Aviation_ROUND_2022.pdf.
- S. S. Jagtap, P. R. N. Childs, and M. E. J. Stettler, “Performance sensitivity of subsonic liquid hydrogen long-range tube-wing aircraft to technology developments,” Int. J. Hydrogen Energy, vol. 50, pp. 820–833, Jan. 2024. [CrossRef]
- S. S. Jagtap, P. R. N. Childs, and M. E. J. Stettler, “Conceptual design-optimisation of a future hydrogen-powered ultrahigh bypass ratio geared turbofan engine,” Int. J. Hydrogen Energy, vol. 95, pp. 317–328, Dec. 2024. [CrossRef]
- S. S. Jagtap, P. R. N. Childs, and M. E. J. Stettler, “Conceptual design-optimisation of a subsonic hydrogen-powered long-range blended-wing-body aircraft,” Int. J. Hydrogen Energy, vol. 96, pp. 639–651, Dec. 2024. [CrossRef]
- S. S. Jagtap, “Sustainability assessment of hydro-processed renewable jet fuel from algae from market-entry year 2020: Use in passenger aircrafts,” in 16th AIAA Aviation Technology, Integration, and Operations Conference, Jun. 2016. [CrossRef]
- S. S. Jagtap, “Assessment of feedstocks for blended alcohol-to-jet fuel manufacturing from standalone and distributed scheme for sustainable aviation,” in AIAA Propulsion and Energy 2019 Forum, 2019. [CrossRef]
- S. S. Jagtap, “Comparative assessment of manufacturing setups for blended sugar-to-aviation fuel production from non-food feedstocks for green aviation,” in AIAA Propulsion and Energy 2019 Forum, 2019. [CrossRef]
- S. S. Jagtap, “Evaluation of blended Fischer-Tropsch jet fuel feedstocks for minimizing human and environmental health impacts of aviation,” in AIAA Propulsion and Energy 2019 Forum, 2019. [CrossRef]
- P. Proesmans and R. Vos, “Comparison of future aviation fuels to minimize the climate impact of commercial aircraft,” AIAA Aviat. 2022 Forum, 2022. [CrossRef]
- P. Proesmans and R. Vos, “Hydrogen, medium-range airplane design optimization for minimal global warming impact,” CEAS Aeronaut. J., pp. 1–26, May 2024. [CrossRef]
- S. Pinheiro Melo et al., “Sustainability Assessment and Engineering of Emerging Aircraft Technologies—Challenges, Methods and Tools,” Sustainability, vol. 12, no. 14, p. 5663, Jul. 2020. [CrossRef]
- D. Keiser, L. H. Schnoor, B. Pupkes, and M. Freitag, “Life cycle assessment in aviation: A systematic literature review of applications, methodological approaches and challenges,” J. Air Transp. Manag., vol. 110, p. 102418, Jul. 2023. [CrossRef]
- P. Su-ungkavatin, L. Tiruta-Barna, and L. Hamelin, “Methodological framework for Life Cycle Assessment of sustainable aviation (SA) systems,” Sci. Total Environ., vol. 885, p. 163881, Aug. 2023. [CrossRef]
- B. W. Kolosz, Y. Luo, B. Xu, M. M. Maroto-Valer, and J. M. Andresen, “Life cycle environmental analysis of ‘drop in’ alternative aviation fuels: a review,” Sustain. Energy Fuels, vol. 4, no. 7, pp. 3229–3263, Jun. 2020. [CrossRef]
- H. Wei, W. Liu, X. Chen, Q. Yang, J. Li, and H. Chen, “Renewable bio-jet fuel production for aviation: A review,” Fuel, vol. 254. Elsevier Ltd, p. 115599, Oct. 15, 2019. [CrossRef]
- N. Pavlenko, S. Searle, and A. Christensen, “The cost of supporting alternative jet fuels in the European Union,” International Council on Clean Transportation. https://theicct.org/sites/default/files/publications/Alternative_jet_fuels_cost_EU_20190320.pdf (accessed Jul. 13, 2019).
- S. De Jong et al., “Life-cycle analysis of greenhouse gas emissions from renewable jet fuel production,” Biotechnol. Biofuels, vol. 10, no. 1, pp. 1–18, Mar. 2017. [CrossRef]
- M. Prussi et al., “CORSIA: The first internationally adopted approach to calculate life-cycle GHG emissions for aviation fuels,” Renew. Sustain. Energy Rev., vol. 150, p. 111398, Oct. 2021. [CrossRef]
- INTERNATIONAL CIVIL AVIATION ORGANIZATION, “CORSIA Default Life Cycle Emissions Values for CORSIA Eligible Fuels,” INTERNATIONAL CIVIL AVIATION ORGANIZATION, Mar. 2021. https://www.icao.int/environmental-protection/CORSIA/Documents/ICAO document 06 - Default Life Cycle Emissions - March 2021.pdf.
- Elisabeth van der Sman, Bram Peerlings, Johan Kos, Rogier Lieshout, and Thijs Boonekamp, “Destination 2050 – A route to net zero European Aviation - SEO Economisch Onderzoek,” NLR – Royal Netherlands Aerospace Centre, 2021. https://www.seo.nl/en/publications/destination-2050-a-route-to-net-zero-european-aviation/ (accessed May 31, 2022).
- T. Miller, “Environmental Assessments of Capital-Intensive Product Systems,” Yale Grad. Sch. Arts Sci. Diss., Apr. 2021, Accessed: Jun. 03, 2022. [Online]. Available: https://elischolar.library.yale.edu/gsas_dissertations/240.
- S. Job, M. Campbell, B. Hall, Z. Hamadache, and N. Kumar, “SUSTAINABILITY REPORT - The Lifecycle Impact of Hydrogen-Powered Aircraft,” 2022. Accessed: Jun. 05, 2022. [Online]. Available: https://www.ati.org.uk/wp-content/uploads/2022/03/FZO-STY-REP-0005-FlyZero-Sustainability-Report.pdf.
- J. I. C. Lau et al., “Emerging technologies, policies and challenges toward implementing sustainable aviation fuel (SAF),” Biomass and Bioenergy, vol. 186, p. 107277, Jul. 2024. [CrossRef]
- M. Braun, W. Grimme, and K. Oesingmann, “Pathway to net zero: Reviewing sustainable aviation fuels, environmental impacts and pricing,” J. Air Transp. Manag., vol. 117, p. 102580, May 2024. [CrossRef]
- P. J. Ansell, “Review of sustainable energy carriers for aviation: Benefits, challenges, and future viability,” Prog. Aerosp. Sci., vol. 141, p. 100919, Aug. 2023. [CrossRef]
- F. Afonso et al., “Strategies towards a more sustainable aviation: A systematic review,” Prog. Aerosp. Sci., vol. 137, p. 100878, Feb. 2023. [CrossRef]
- Z. Song, Z. Li, and Z. Liu, “Comparison of Emission Properties of Sustainable Aviation Fuels and Conventional Aviation Fuels: A Review,” Appl. Sci. 2024, Vol. 14, Page 5484, vol. 14, no. 13, p. 5484, Jun. 2024. [CrossRef]
- “Net zero aviation fuels: resource requirements and environmental impacts | Royal Society.” https://royalsociety.org/news-resources/projects/low-carbon-energy-programme/net-zero-aviation-fuels/ (accessed Aug. 02, 2024).
- D. M. Saad, T. Terlouw, R. Sacchi, and C. Bauer, “Life Cycle Economic and Environmental Assessment of Producing Synthetic Jet Fuel Using CO2/Biomass Feedstocks,” Environ. Sci. Technol., vol. 58, no. 21, pp. 9158–9174, May 2024, doi: 10.1021/ACS.EST.4C01578/SUPPL_FILE/ES4C01578_SI_001.PDF. [CrossRef]
- C. Penke, C. Falter, and V. Batteiger, “Pathways and Environmental Assessment for the Introduction of Renewable Hydrogen into the Aviation Sector,” Sustain. Prod. Life Cycle Eng. Manag., pp. 41–52, 2021. [CrossRef]
- S. Delbecq, T. Planès, A. Salgas, F. Pollet, and V. Budinger, “Climate and energy impact analysis of electric, hybrid-electric and hydrogen aircraft in prospective scenarios for air transport,” 2024. https://hal.science/hal-04659593 (accessed Aug. 04, 2024).
- A. Fantuzzi, N. M. Paola A. Saenz Cavazos, M. High, M. Bui, and I. von H. A. William Rutherford, “Low-carbon fuels for aviation,” Briefing Paper No 9, Institute for Molecular Science and Engineering, 2023. https://core.ac.uk/download/pdf/554493568.pdf (accessed Aug. 01, 2024).
- L. Dray et al., “Cost and emissions pathways towards net-zero climate impacts in aviation,” Nat. Clim. Chang. 2022 1210, vol. 12, no. 10, pp. 956–962, Sep. 2022. [CrossRef]
- G. Quante, N. Bullerdiek, S. Bube, U. Neuling, and M. Kaltschmitt, “Renewable fuel options for aviation – A System-Wide comparison of Drop-In and non Drop-In fuel options,” Fuel, vol. 333, p. 126269, Feb. 2023. [CrossRef]
- K. Kossarev, A. E. Scholz, and M. Hornung, “Comparative environmental life cycle assessment and operating cost analysis of long-range hydrogen and biofuel fueled transport aircraft,” CEAS Aeronaut. J., vol. 14, no. 1, pp. 3–28, Jan. 2023. [CrossRef]
- K. Kossarev, A. E. Scholz, P. Egerer, and M. Hornung, “Comparison of Environmental Life Cycle Impact Assessment Methods for Future Aircraft Designs,” AIAA Aviat. 2022 Forum, 2022. [CrossRef]
- P. Schmidt, V. Batteiger, A. Roth, W. Weindorf, and T. Raksha, “Power-to-Liquids as Renewable Fuel Option for Aviation: A Review,” Chemie Ing. Tech., vol. 90, no. 1–2, pp. 127–140, Jan. 2018. [CrossRef]
- German-Environment-Agency, “Power-to-Liquids Potentials and Perspectives for the Future Supply of Renewable Aviation Fuel,” German Environment Agency, 2016. https://www.umweltbundesamt.de/sites/default/files/medien/377/publikationen/161005_uba_hintergrund_ptl_barrierrefrei.pdf (accessed Mar. 10, 2019).
- R. G. Grim et al., “Electrifying the production of sustainable aviation fuel: the risks, economics, and environmental benefits of emerging pathways including CO2,” Energy Environ. Sci., vol. 15, no. 11, pp. 4798–4812, Nov. 2022. [CrossRef]
- R. Sacchi et al., “How to make climate-neutral aviation fly,” Nat. Commun. 2023 141, vol. 14, no. 1, pp. 1–17, Jul. 2023. [CrossRef]
- V. Papantoni et al., “Life Cycle Assessment of Power-to-Liquid for Aviation: A Case Study of a Passenger Aircraft,” in 10th International Conference on Life Cycle Management, LCM 2021, 2022. [CrossRef]
- M. Micheli, D. Moore, V. Bach, and M. Finkbeiner, “Life-Cycle Assessment of Power-to-Liquid Kerosene Produced from Renewable Electricity and CO2 from Direct Air Capture in Germany,” Sustain., vol. 14, no. 17, p. 10658, Sep. 2022. [CrossRef]
- J. Klenner, M. T. Lund, H. Muri, and A. H. Strømman, “Combining Fleetwide AviTeam Aviation Emission Modeling with LCA Perspectives for an Alternative Fuel Impact Assessment,” Environ. Sci. Technol., vol. 58, no. 21, pp. 9135–9146, May 2024. [CrossRef]
- A. Vanlandingham, “Environmental and Economic Impact of Transport Aircraft Using Sustainable Aviation Fuel or Liquid-Hydrogen as Alternative Fuels,” Penn State, 2024. Accessed: Jul. 03, 2024. [Online]. Available: https://etda.libraries.psu.edu/catalog/32384avv5448.
- VanLandingham and D. K. Hall, “Conceptual Design Optimization of Liquid-Hydrogen-Fueled Transport Aircraft for Environmental and Economic Performance,” Jun. 2023. [CrossRef]
- P. Prashanth et al., “Near-zero environmental impact aircraft,” Sustain. Energy Fuels, 2024. [CrossRef]
- Koroneos, A. Dompros, G. Roumbas, and N. Moussiopoulos, “Advantages of the use of hydrogen fuel as compared to kerosene,” Resour. Conserv. Recycl., vol. 44, no. 2, pp. 99–113, May 2005. [CrossRef]
- S. R. Pereira, T. Fontes, and M. C. Coelho, “Can hydrogen or natural gas be alternatives for aviation? - A life cycle assessment,” in International Journal of Hydrogen Energy, Aug. 2014, vol. 39, no. 25, pp. 13266–13275. [CrossRef]
- Y. Bicer and I. Dincer, “Life cycle evaluation of hydrogen and other potential fuels for aircrafts,” Int. J. Hydrogen Energy, vol. 42, no. 16, pp. 10722–10738. [CrossRef]
- S. V. Ratner, C. Yuri, and N. H. Hien, “Prospects of Transition of Air Transportation to Clean Fuels: Economic and Environmental Management Aspects,” Int. Energy J., vol. 19, no. 3, 2019, Accessed: May 30, 2022. [Online]. Available: http://www.rericjournal.ait.ac.th/index.php/reric/article/view/2084.
- Siddiqui and I. Dincer, “A comparative life cycle assessment of clean aviation fuels,” Energy, vol. 234, p. 121126, Nov. 2021. [CrossRef]
- J. Mukhopadhaya and D. Rutherford, “Performance analysis of evolutionary hydrogen-powered aircraft,” International Council on Clean Transportation, 2022. https://theicct.org/publication/aviation-global-evo-hydrogen-aircraft-jan22/ (accessed Jun. 04, 2022).
- K. Mazur, M. Saleh, and M. Hornung, “Integrating Life Cycle Assessment in Conceptual Aircraft Design: A Comparative Tool Analysis,” Aerosp. 2024, Vol. 11, Page 101, vol. 11, no. 1, p. 101, Jan. 2024. [CrossRef]
- T. R. Miller, M. Chertow, and E. Hertwich, “Liquid Hydrogen: A Mirage or Potent Solution for Aviation’s Climate Woes?,” Environ. Sci. Technol., vol. 57, no. 26, pp. 9627–9638, Jul. 2023. [CrossRef]
- P. Su-ungkavatin, L. Tiruta-Barna, and L. Hamelin, “Biofuels, electrofuels, electric or hydrogen?: A review of current and emerging sustainable aviation systems,” Prog. Energy Combust. Sci., vol. 96, p. 101073, May 2023. [CrossRef]
- E. Cabrera and J. M. M. de Sousa, “Use of Sustainable Fuels in Aviation—A Review,” Energies 2022, Vol. 15, Page 2440, vol. 15, no. 7, p. 2440, Mar. 2022. [CrossRef]
- S. Tveitan, “Life cycle assessment of hydrogen fuel in aviation,” University of Bergen, 2020. Accessed: Aug. 04, 2024. [Online]. Available: https://bora.uib.no/bora-xmlui/bitstream/handle/1956/23149/Stine-Tveitan_Life-cycle-assessment-of-hydrogen-fuel-in-aviation_2020-06-15.pdf?sequence=1&isAllowed=y.
- J. L. Chan, Y. Sun, and H. Smith, “Conceptual Designs of Blended Wing Body Aircraft for the Application of Alternative Fuels,” in AIAA AVIATION FORUM AND ASCEND 2024, 2024. [CrossRef]
- K. Alsamri, J. J. De la Cruz, M. Emmanouilidi, J. L. Huynh, and J. Brouwer, “Methodology to Assess Emissions and Performance Trade-Offs for a Retrofitted Solid Oxide Fuel Cell Hybrid and Hydrogen Powered Aircraft,” Jan. 2023. [CrossRef]
- K. Alsamri, J. D. la Cruz, M. Emmanouilidi, J. Huynh, and J. Brouwer, “Methodology for Assessing Retrofitted Hydrogen Combustion and Fuel Cell Aircraft Environmental Impacts,” https://doi.org/10.2514/1.B39405, pp. 1–16, Apr. 2024. [CrossRef]
- S. S. Jagtap, “Systems evaluation of subsonic hybrid-electric propulsion concepts for NASA N+3 goals and conceptual aircraft sizing,” Int. J. Automot. Mech. Eng., vol. 16, no. 4, pp. 7259–7286, 2019. [CrossRef]
- S. S. Jagtap, “An Apparatus for Exchanging Heat with Flow in an Annulus,” J. Eng. Sci. Technol. Rev., vol. 10, no. 1, pp. 173–176, 2017, Accessed: Jan. 11, 2019. [Online]. Available: http://www.jestr.org/downloads/Volume10Issue1/fulltext241012017.pdf.
- S. S. Jagtap, “A heat recovery system designed for shaft-powered aircraft gas turbine engines,” 2016.
- IATA, “IATA - Fly Net Zero,” 2024. https://www.iata.org/en/programs/sustainability/flynetzero/ (accessed Oct. 02, 2024).
- Nikita Pavlenko and Stephanie Searle, “Assessing the sustainability implications of alternative aviation fuels,” International Council on Clean Transportation, 2021. https://theicct.org/publication/assessing-the-sustainability-implications-of-alternative-aviation-fuels/ (accessed Jun. 09, 2022).
- K. Lokesh, “Techno-economic environmental risk analysis of advanced biofuels for civil aviation,” Cranfield University, 2015. Accessed: Jan. 11, 2019. [Online]. Available: https://dspace.lib.cranfield.ac.uk/handle/1826/9243.
- IATA, “Sustainable Aviation Fuels Sustainable Aviation Fuels: Fact Sheet 2,” International Air Transport Association, 2020. https://www.iata.org/contentassets/d13875e9ed784f75bac90f000760e998/saf-technical-certifications.pdf (accessed Apr. 06, 2020).
- Karlijn de Vries, “Contribution of Sustainable Aviation Fuels Towards Net Zero 2050 – Using Life Cycle Analysis,” University of Groningen, 2022. Accessed: Jul. 02, 2022. [Online]. Available: https://fse.studenttheses.ub.rug.nl/26595/1/IP_Final_upload.pdf.
- “Hydrogen Production: Natural Gas Reforming | Department of Energy.” https://www.energy.gov/eere/fuelcells/hydrogen-production-natural-gas-reforming (accessed Jul. 10, 2022).
- “Hydrogen Production: Biomass Gasification,” Hydrogen and Fuel Cell Technologies Office, Department of Energy, USA. https://www.energy.gov/eere/fuelcells/hydrogen-production-biomass-gasification (accessed Jul. 05, 2022).
- “Coke Oven Gas.” http://compressormash.ru/en/products/compressible_gas/coke_oven_gas/ (accessed Jul. 10, 2022).
- K. Yang et al., “Hydrogen production via chemical looping reforming of coke oven gas,” Green Energy Environ., vol. 6, no. 5, pp. 678–692. [CrossRef]
- “U.S. Energy Information Administration - EIA - Independent Statistics and Analysis.” https://www.eia.gov/todayinenergy/detail.php?id=5930 (accessed Jul. 10, 2022).
- Y. Lee and A. Elgowainy, “By-product hydrogen from steam cracking of natural gas liquids (NGLs): Potential for large-scale hydrogen fuel production, life-cycle air emissions reduction, and economic benefit,” Int. J. Hydrogen Energy, vol. 43, no. 43, pp. 20143–20160, Oct. 2018. [CrossRef]
- “Hydrogen Basics - Solar Production.” http://www.fsec.ucf.edu/en/consumer/hydrogen/basics/production-solar.htm (accessed Jul. 10, 2022).
- Viktor Sivertsson, “Hydrogen production using high temperature nuclear reactors : A feasibility study,” 2010. Accessed: Jul. 08, 2022. [Online]. Available: https://uu.diva-portal.org/smash/get/diva2:303943/FULLTEXT01.pdf.
- Q. Dai, A. Elgowainy, J. Kelly, J. Han, and M. Wang, “Life Cycle Analysis of Hydrogen Production from Non-Fossil Sources,” Argonne National Laboratory, 2016. https://greet.es.anl.gov/files/h2-nonfoss-2016 (accessed Jul. 05, 2022).
- Acar and I. Dincer, “3.1 Hydrogen Production,” Compr. Energy Syst., vol. 3–5, pp. 1–40, Jan. 2018. [CrossRef]
- K. Tennakone, “Hydrogen from brine electrolysis: A new approach,” Int. J. Hydrogen Energy, vol. 14, no. 9, pp. 681–682, Jan. 1989. [CrossRef]
- Boeing, “777 Flight Crew Training Manual Qatar Airways,” 2007. http://virtavia.online/wp-content/uploads/wpforo/attachments/1/975-B777-FCTM.pdf (accessed Jun. 16, 2022).
- “AIRBUS A350-900 - SKYbrary Aviation Safety.” https://www.skybrary.aero/index.php/A359 (accessed Jan. 21, 2021).
- “What do you know about take-off speed? V1, Vr, and V2.” https://www.aviationnepal.com/what-do-you-know-about-take-off-speed-v1-vr-and-v2/ (accessed Jun. 16, 2022).
- “Airbus A350-800 - Price, Specs, Photo Gallery, History - Aero Corner.” https://aerocorner.com/aircraft/airbus-a350-xwb/ (accessed Jun. 16, 2022).
- Digital-Dutch, “1976 Standard Atmosphere Calculator,” Digital Dutch, 1999. https://www.digitaldutch.com/atmoscalc/ (accessed Feb. 09, 2021).
- Wu, “Models, Optimal Performances and Sensitivities of Commercial Flight Trajectory in the Air Traffic System,” UNIVERSITY OF MINNESOTA, 2012. Accessed: Jun. 10, 2022. [Online]. Available: https://conservancy.umn.edu/bitstream/handle/11299/144391/Wu_umn_0130E_13330.pdf?sequence=1&isAllowed=y.
- M. Oak, A. Fabre, M. Delavenne, E. N. Van, E. Benard, and S. Defoort, “Spectral project - application of FAST-OAD code to the conceptual design of a hydrogen fuelled commercial aircraft,” IOP Conf. Ser. Mater. Sci. Eng., vol. 1226, no. 1, p. 012027, Feb. 2022. [CrossRef]
- Caiazzo, A. Agarwal, R. L. Speth, and S. R. H. Barrett, “Impact of biofuels on contrail warming,” Environ. Res. Lett., vol. 12, no. 11, p. 114013, Nov. 2017. [CrossRef]
- Svensson, “Potential of reducng the environmental impact of civil subsonic aviation by using liquid hydrogen,” Cranfield University, 2005. Accessed: Jun. 17, 2022. [Online]. Available: https://dspace.lib.cranfield.ac.uk/handle/1826/10726.
- D. Gielen, E. Taibi, and R. Miranda, “HYDROGEN: A RENEWABLE ENERGY PERSPECTIVE,” International Renewable Energy Agency, 2019. https://www.irena.org/-/media/Files/IRENA/Agency/Publication/2019/Sep/IRENA_Hydrogen_2019.pdf (accessed Jul. 01, 2022).
- A. I. Osman et al., “Hydrogen production, storage, utilisation and environmental impacts: a review,” Environ. Chem. Lett., vol. 20, no. 1, pp. 153–188, Feb. 2021. [CrossRef]
- International Atomic Energy Agency, “Hydrogen Production Using Nuclear Energy,” International Atomic Energy Agency No. NP-T-4.2, 2011. http://www.iaea.org/Publications/index.html (accessed Jul. 01, 2022).
- P. Spath, A. Aden, T. Eggeman, M. Ringer, B. Wallace, and J. Jechura, “Biomass to Hydrogen Production Detailed Design and Economics Utilizing the Battelle Columbus Laboratory Indirectly-Heated Gasifier,” 2005. Accessed: Jul. 01, 2022. [Online]. Available: https://www.nrel.gov/docs/fy05osti/37408.pdf.
- International Air Transport Association, “Industry Statistics Fact Sheet 2024,” International Air Transport Association, 2024. https://www.iata.org/en/iata-repository/pressroom/fact-sheets/industry-statistics/ (accessed Oct. 02, 2024).
- S. S. Jagtap, M. E. J. Stettler, and P. R. N. Childs, “Data in brief: Energy performance evaluation of alternative energy vectors for subsonic intercontinental tube-wing aircraft”.
- S. Jagtap, A. Strehlow, M. Reitz, S. Kestler, and G. Cinar, “Model-Based Systems Engineering Approach for a Systematic Design of Aircraft Engine Inlet,” in AIAA SCITECH 2025 Forum, 2025. [CrossRef]
- S. S. Jagtap, “Non-food feedstocks comparison for renewable aviation fuel production towards environmentally and socially responsible aviation,” in 2019 AIAA Propulsion & Energy Forum, 2019.
- B. Emerson, S. Jagtap, J. M. Quinlan, M. W. Renfro, B. M. Cetegen, and T. Lieuwen, “Spatio-temporal linear stability analysis of stratified planar wakes: Velocity and density asymmetry effects,” Phys. Fluids, vol. 28, no. 4, p. 045101, Apr. 2016. [CrossRef]
- B. L. Emerson, S. Jagtap, and T. C. Lieuwen, “Stability Analysis of Reacting Wakes: Flow and Density Asymmetry Effects,” in 53rd AIAA Aerospace Sciences Meeting, Jan. 2015. [CrossRef]
- S. S. Jagtap, “A heat recovery system for shaft-driven aircraft gas turbine engines,” Oct. 29, 2014.
- S. S. Jagtap, “Evaluation of technology and energy vector combinations for decarbonising future subsonic long-range aircraft,” Imperial College London.
- S. S. Jagtap, M. E. J. Stettler, and P. R. N. Childs, “Data in brief: Performance sensitivity of subsonic liquid hydrogen long-range tube-wing aircraft to technology developments”.
- S. S. Jagtap, M. E. J. Stettler, and P. R. N. Childs, “Data in brief: Conceptual design-optimisation of futuristic hydrogen powered ultrahigh bypass ratio geared turbofan engine”.
- S. S. Jagtap, M. E. J. Stettler, and P. R. N. Childs, “Data in brief: Conceptual design-optimisation of a subsonic hydrogen-powered long-range blended-wing-body aircraft”.
- S. S. Jagtap, “Aero-thermodynamic analysis of space shuttle vehicle at re-entry,” IEEE Aerosp. Conf. Proc., vol. 2015-June, Jun. 2015. [CrossRef]
- S. Jagtap and S. Bhandari, “Solar Refrigeration,” Sardar Patel Int. Conf., 2012, [Online]. Available: https://papers.ssrn.com/sol3/papers.cfm?abstract_id=2103115.
- S. Jagtap and S. Bhandari, “Solar Refrigeration using Triple Fluid Vapor Absorption Refrigeration and Organic Rankine Cycle,” in Sardar Patel International Conference SPICON 2012 Mechanical, 2012.
- N. Komerath, S. Jagtap, and N. Hiremath, “Aerothermoelastic Tailoring for Waveriders,” in US Air Force Summer Faculty Fellowship Program, 2014.
- S. S. Jagtap, “Exploration of sustainable aviation technologies and alternative fuels for future inter-continental passenger aircraft.
- S. S. Jagtap, “Identification of sustainable technology and energy vector combinations for future inter-continental passenger aircraft.
- S. S. Jagtap, “Heat recuperation system for the family of shaft powered aircraft gas turbine engines,” US10358976B2, 2019 [Online]. Available: https://patents.google.com/patent/US10358976B2/en.
- S. S. Jagtap, “Heat recovery system for shaft powered aircraft gas turbine engines”.
- S. S. Jagtap and S. Bhandari, “Systems design and experimental study of a solar parabolic trough for solar refrigeration”.
- S. S. Jagtap, “Conceptual aircraft sizing using systems engineering for N+3 subsonic hybrid-electric propulsion concepts”.
- S. S. Jagtap, P. R. N. Childs, and M. E. J. Stettler, “Data in brief: Comparing alternative fuels for a futuristic subsonic long-range aircraft on a life cycle basis,” 2025.
- S. S. Jagtap, P. R. N. Childs, and M. E. J. Stettler, “Comparing alternative fuels for a futuristic subsonic long-range aircraft on a life cycle basis,” 2025.
- S. S. Jagtap, P. R. N. Childs, and M. E. J. Stettler, “Comparative life cycle evaluation of alternative fuels for a futuristic subsonic long-range aircraft,” Sustain. Prod. Consum., 2025.
Figure 1.
Comparison of feedstock and fuel type considering the levelized production cost and (WTWa) direct life cycle emissions (data source [25]).
Figure 1.
Comparison of feedstock and fuel type considering the levelized production cost and (WTWa) direct life cycle emissions (data source [25]).
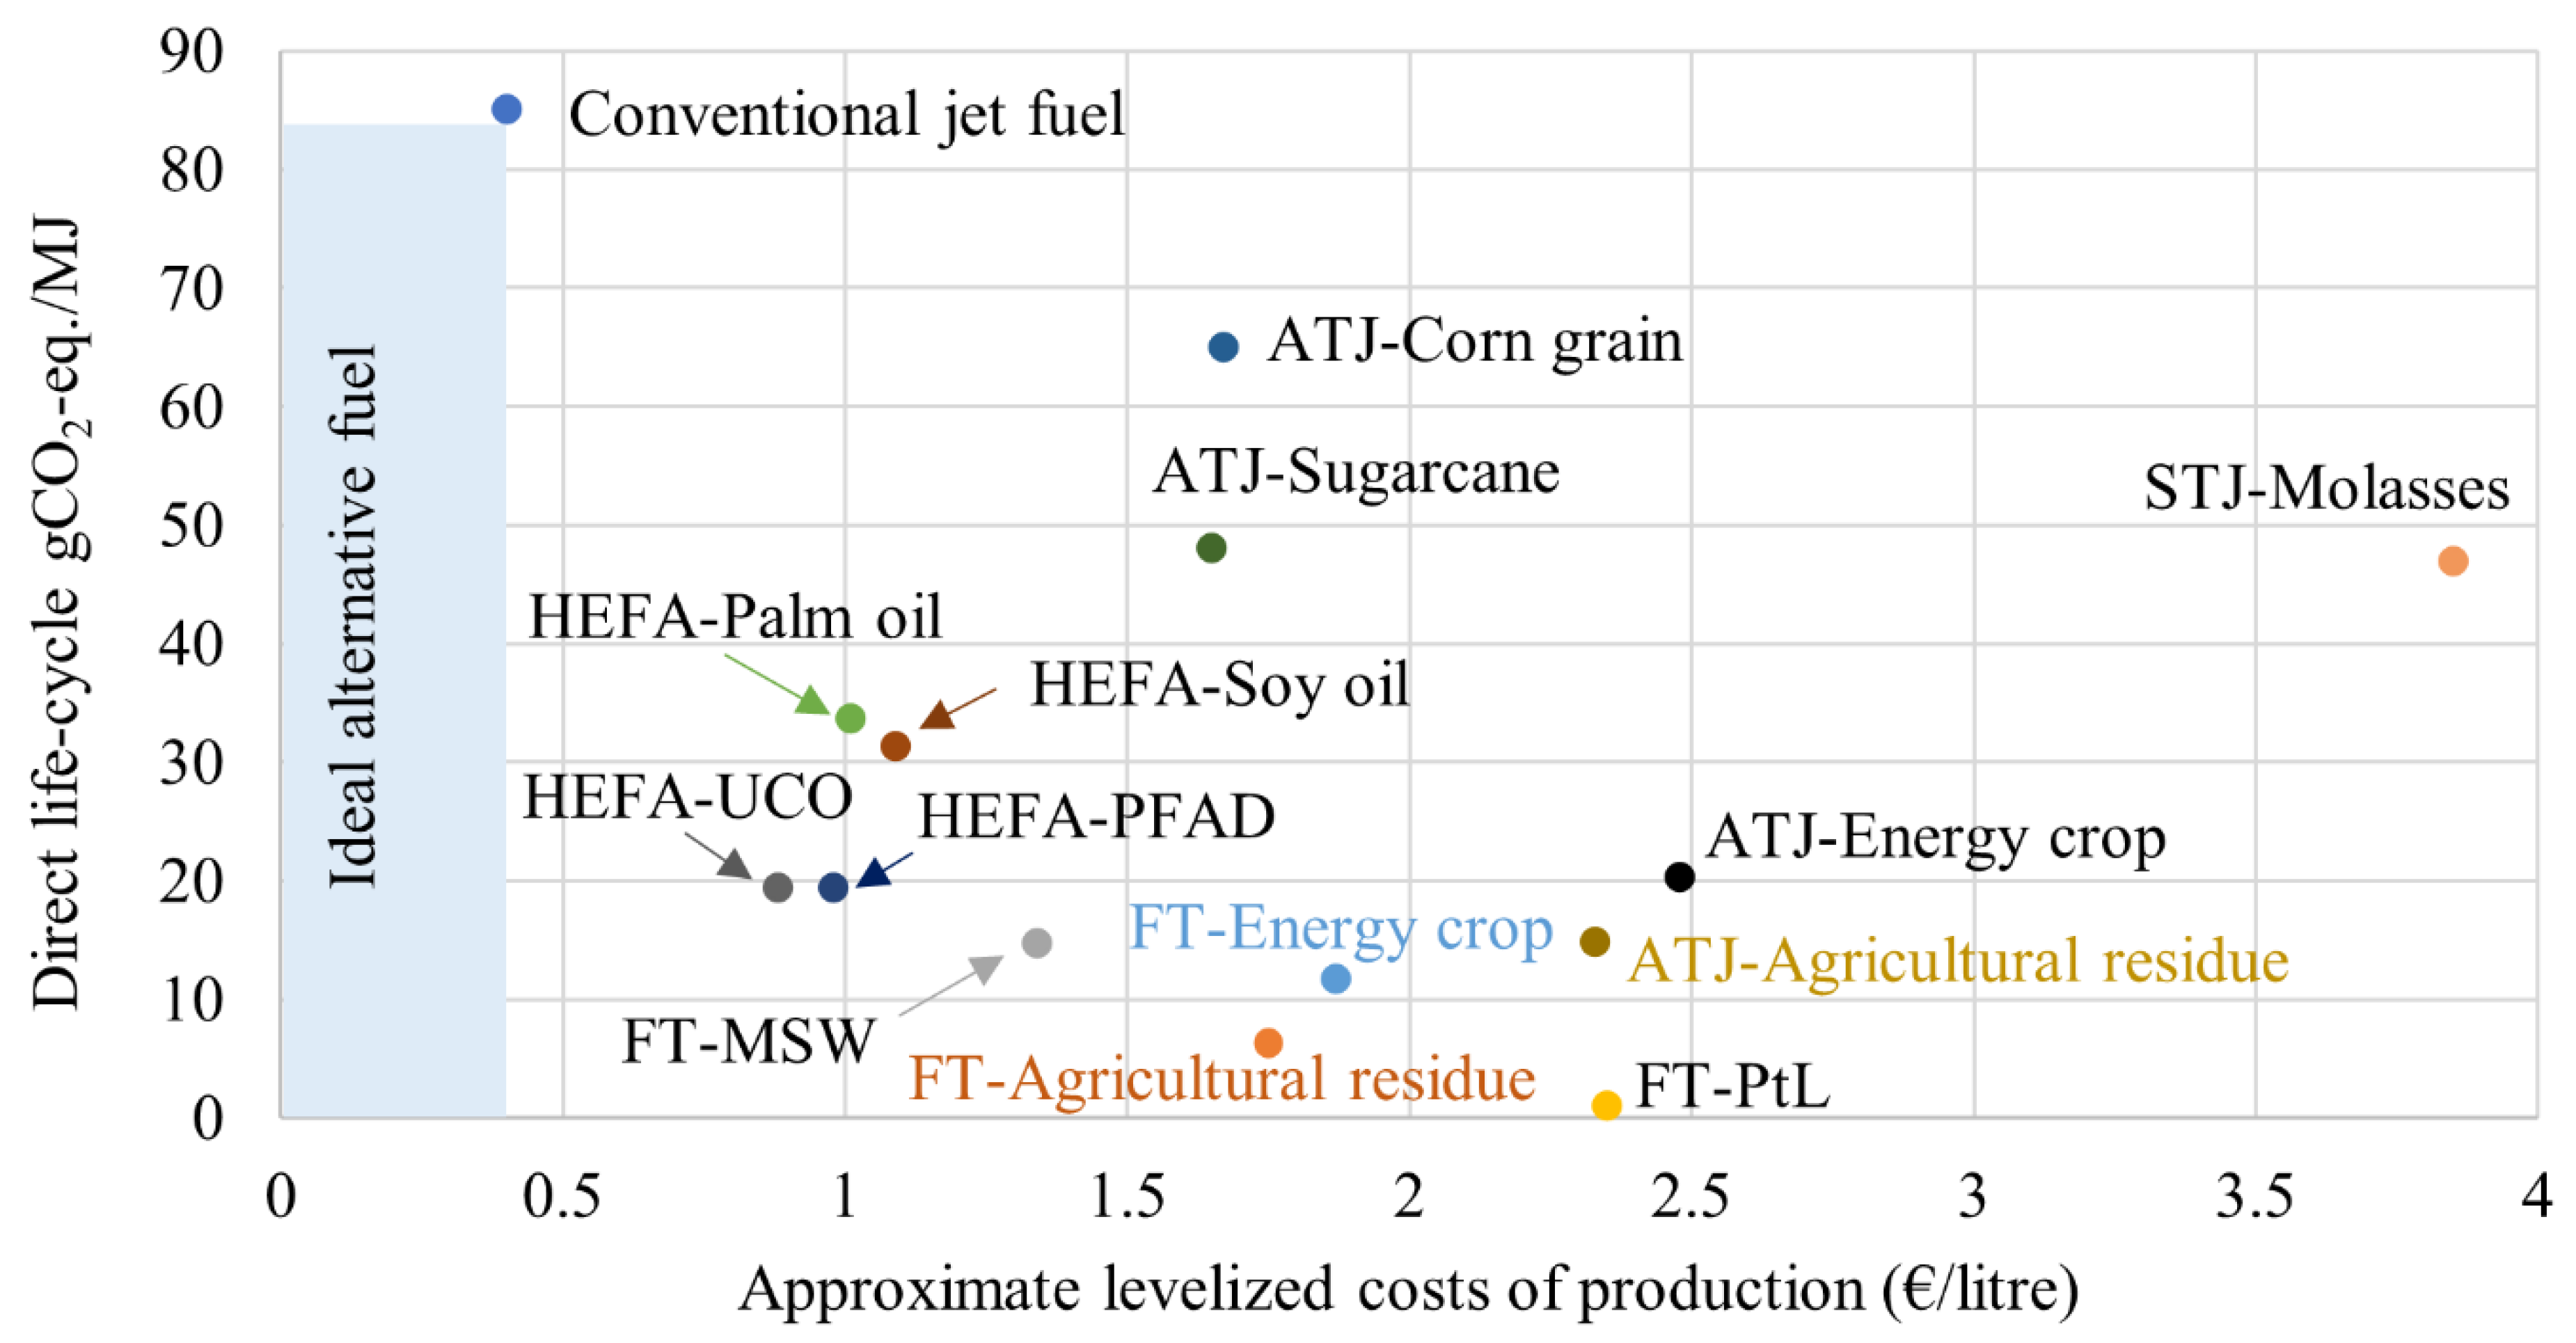
Figure 2.
Comparison of feedstock and fuel type considering the levelized production cost and carbon intensity (data source [25]).
Figure 2.
Comparison of feedstock and fuel type considering the levelized production cost and carbon intensity (data source [25]).
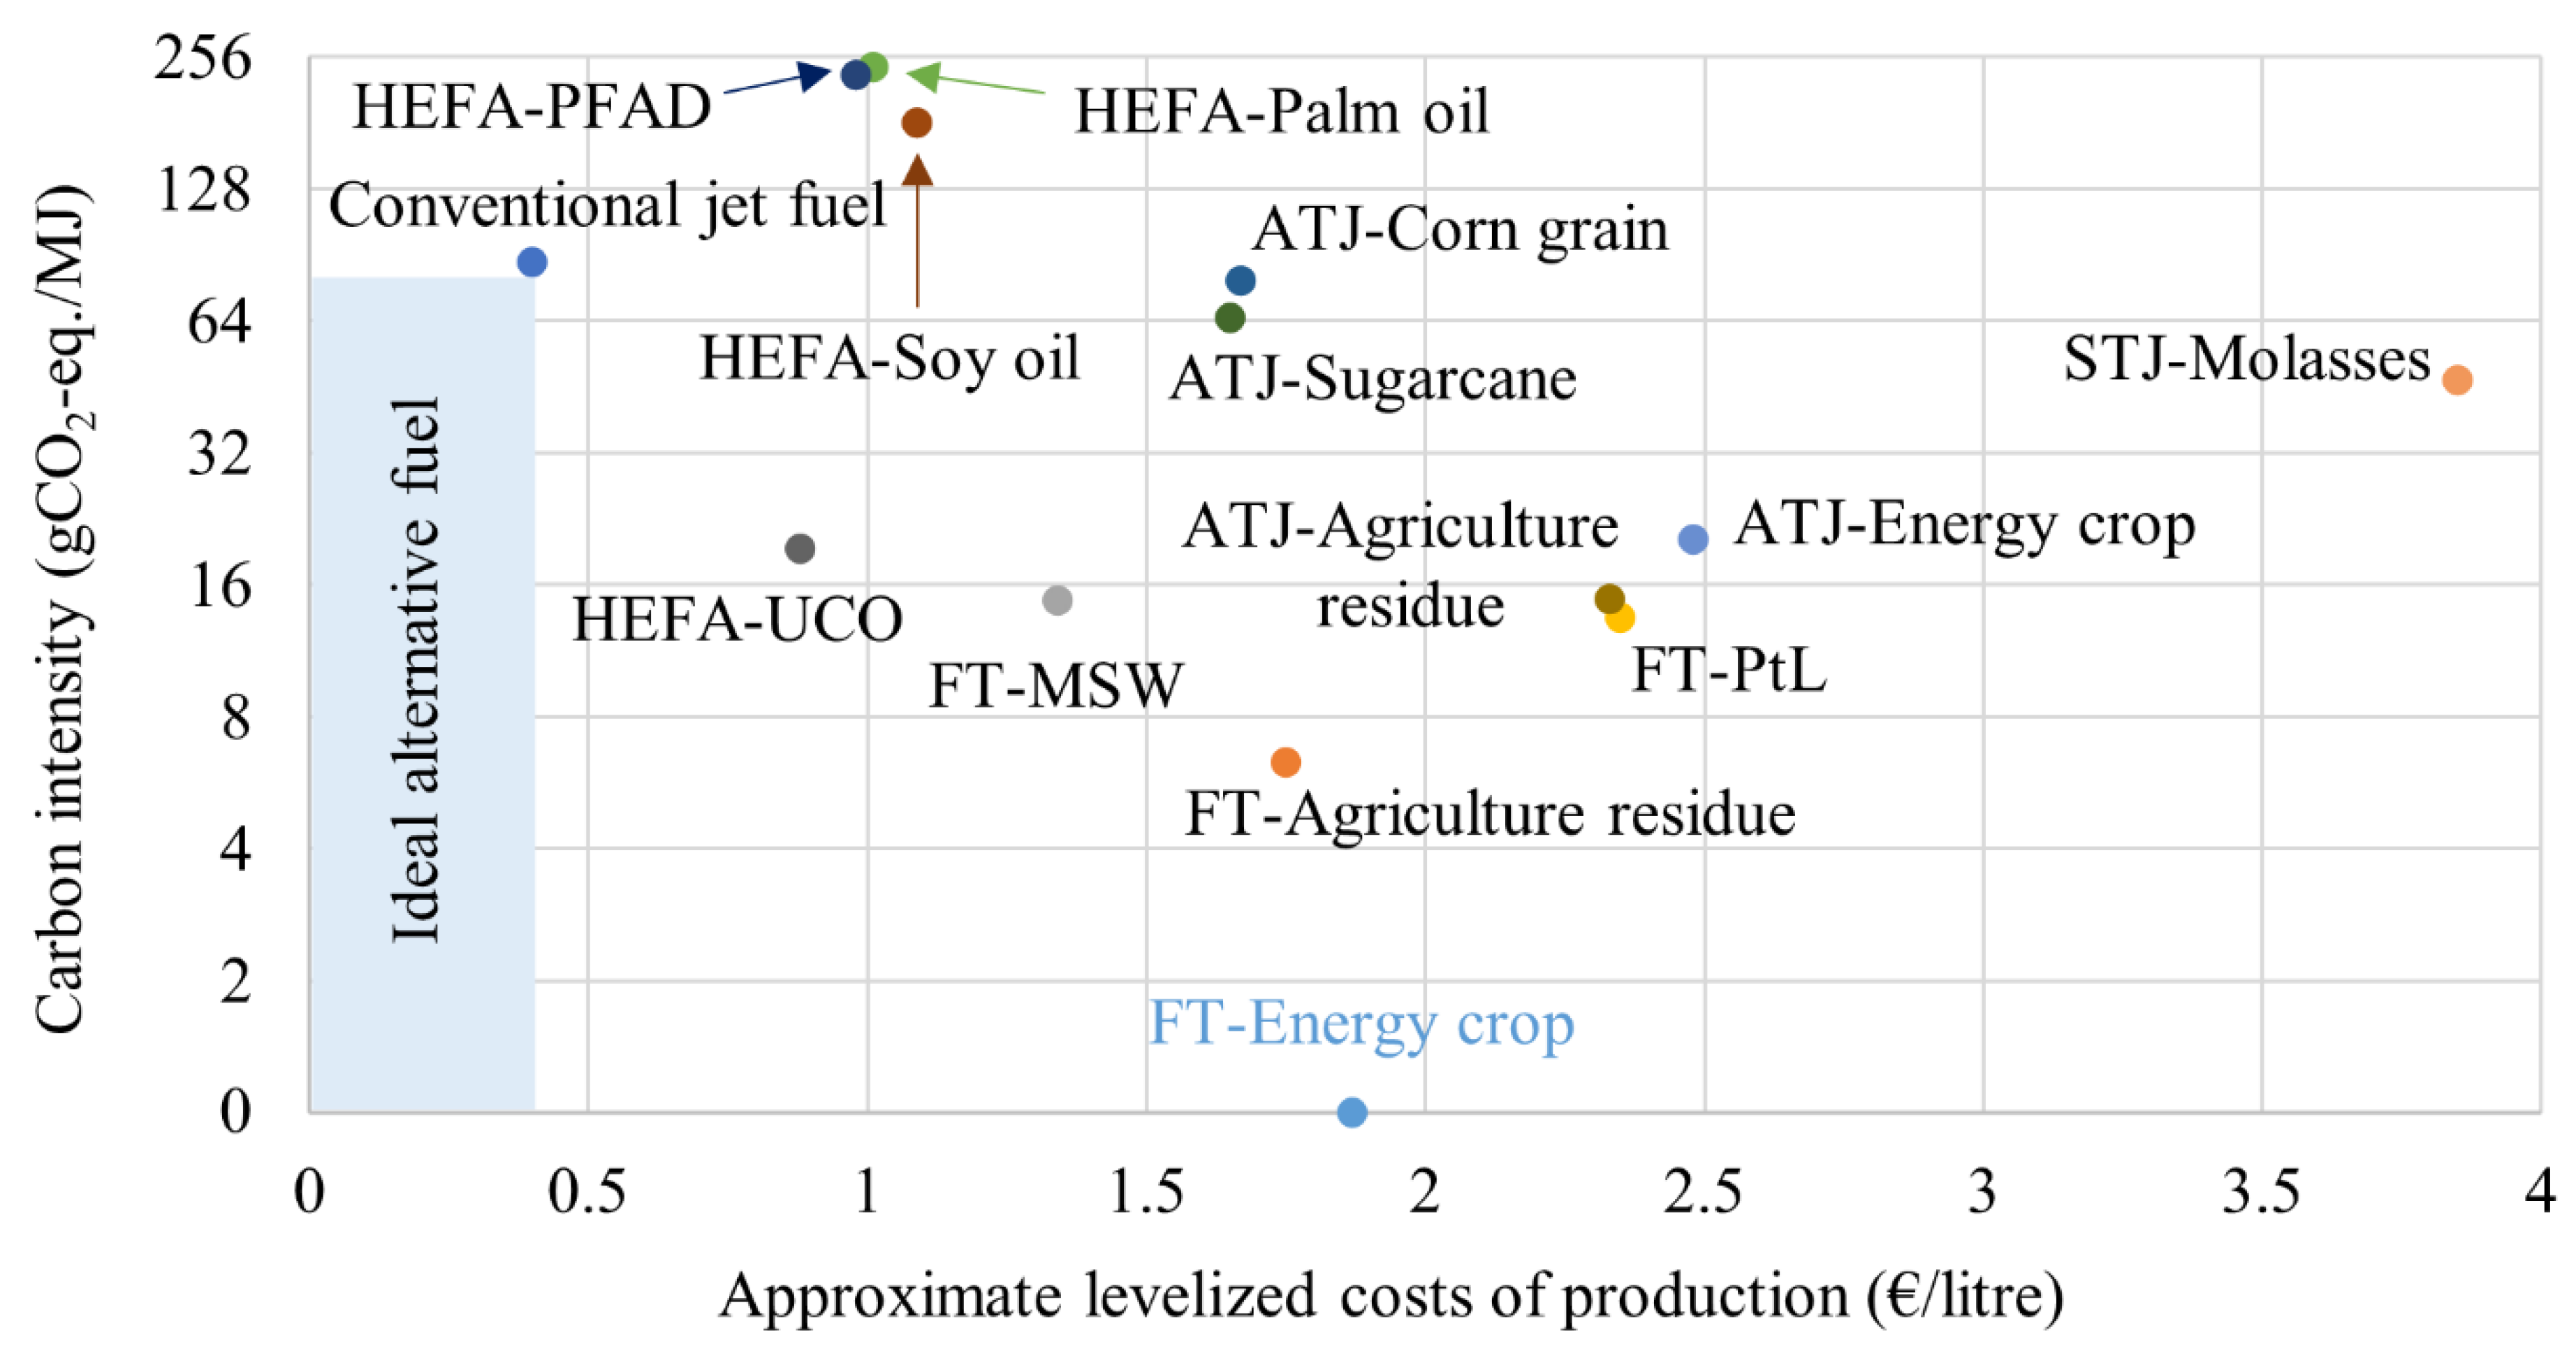
Figure 3.
Comparison of fossil fuel use for different LH2 and 100% SPK feedstock and pathways for 2020 and 2050 US energy mix scenarios.
Figure 3.
Comparison of fossil fuel use for different LH2 and 100% SPK feedstock and pathways for 2020 and 2050 US energy mix scenarios.
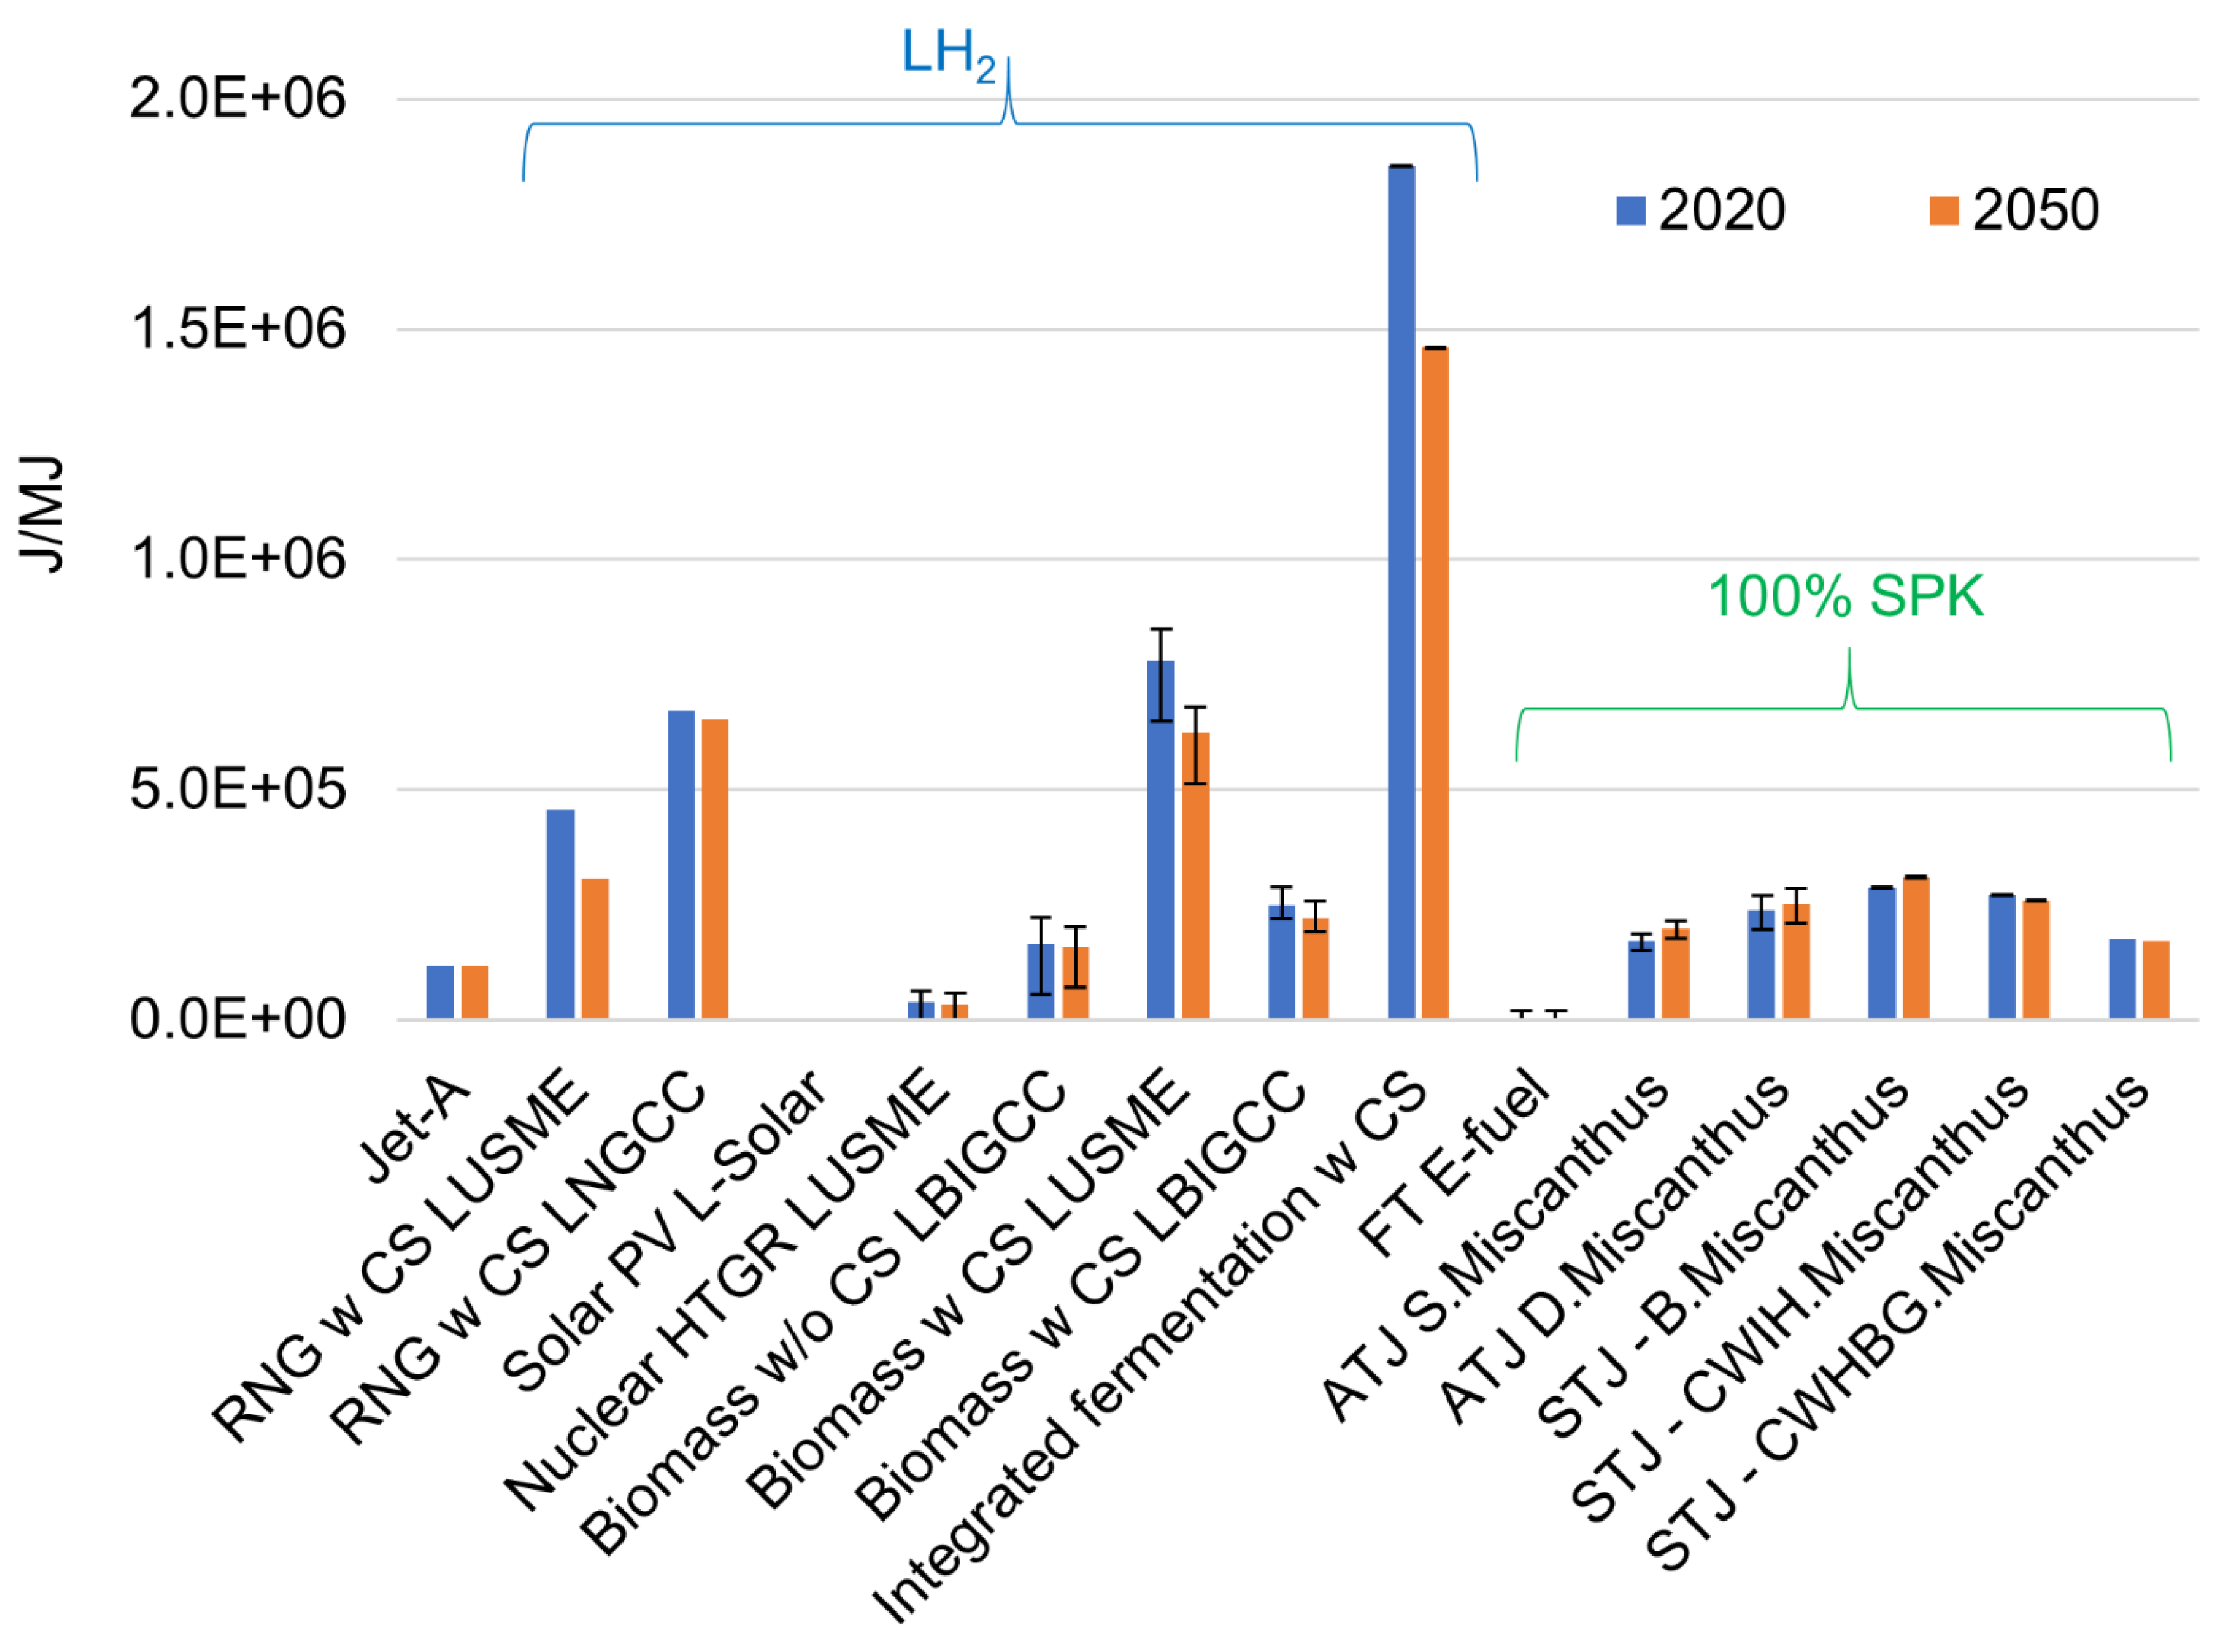
Figure 4.
Comparison of water consumption for different LH2 and 100% SPK feedstock and pathways for 2020 and 2050 US energy mix scenarios.
Figure 4.
Comparison of water consumption for different LH2 and 100% SPK feedstock and pathways for 2020 and 2050 US energy mix scenarios.
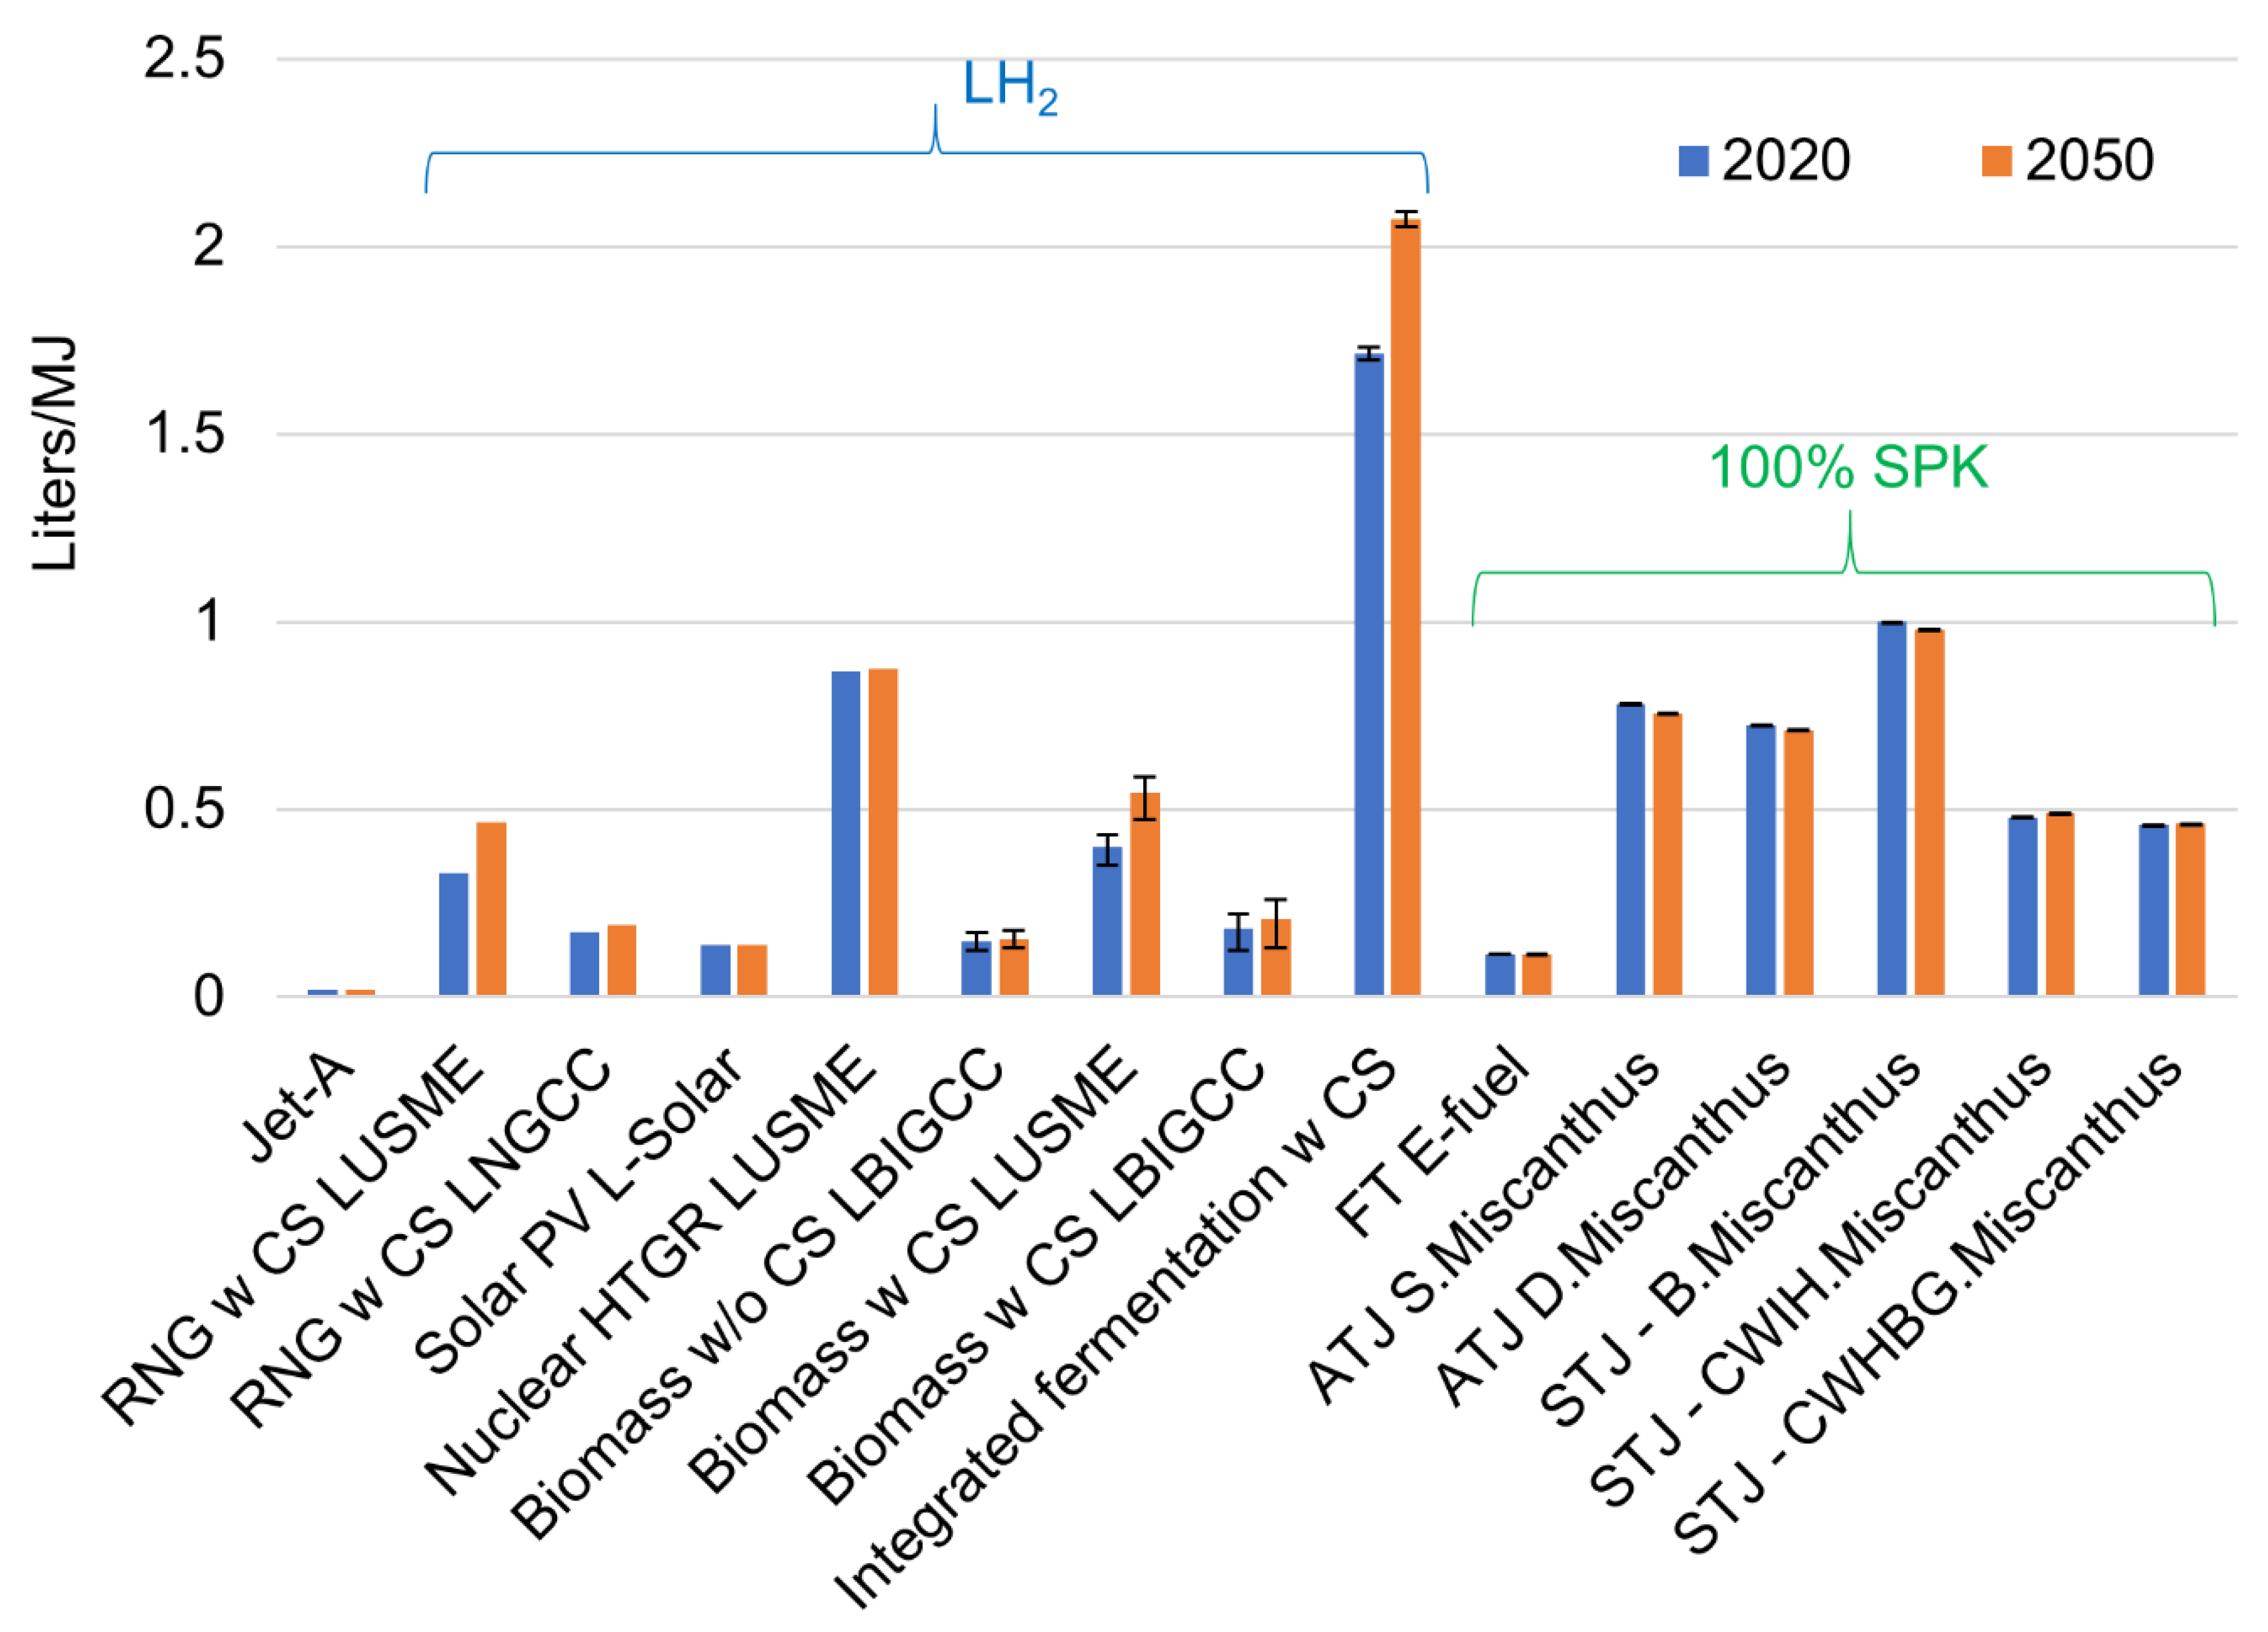
Figure 5.
WTWa VOC emission comparison for different LH2 and 100% SPK feedstock and pathways for 2020 and 2050 US energy mix scenarios.
Figure 5.
WTWa VOC emission comparison for different LH2 and 100% SPK feedstock and pathways for 2020 and 2050 US energy mix scenarios.
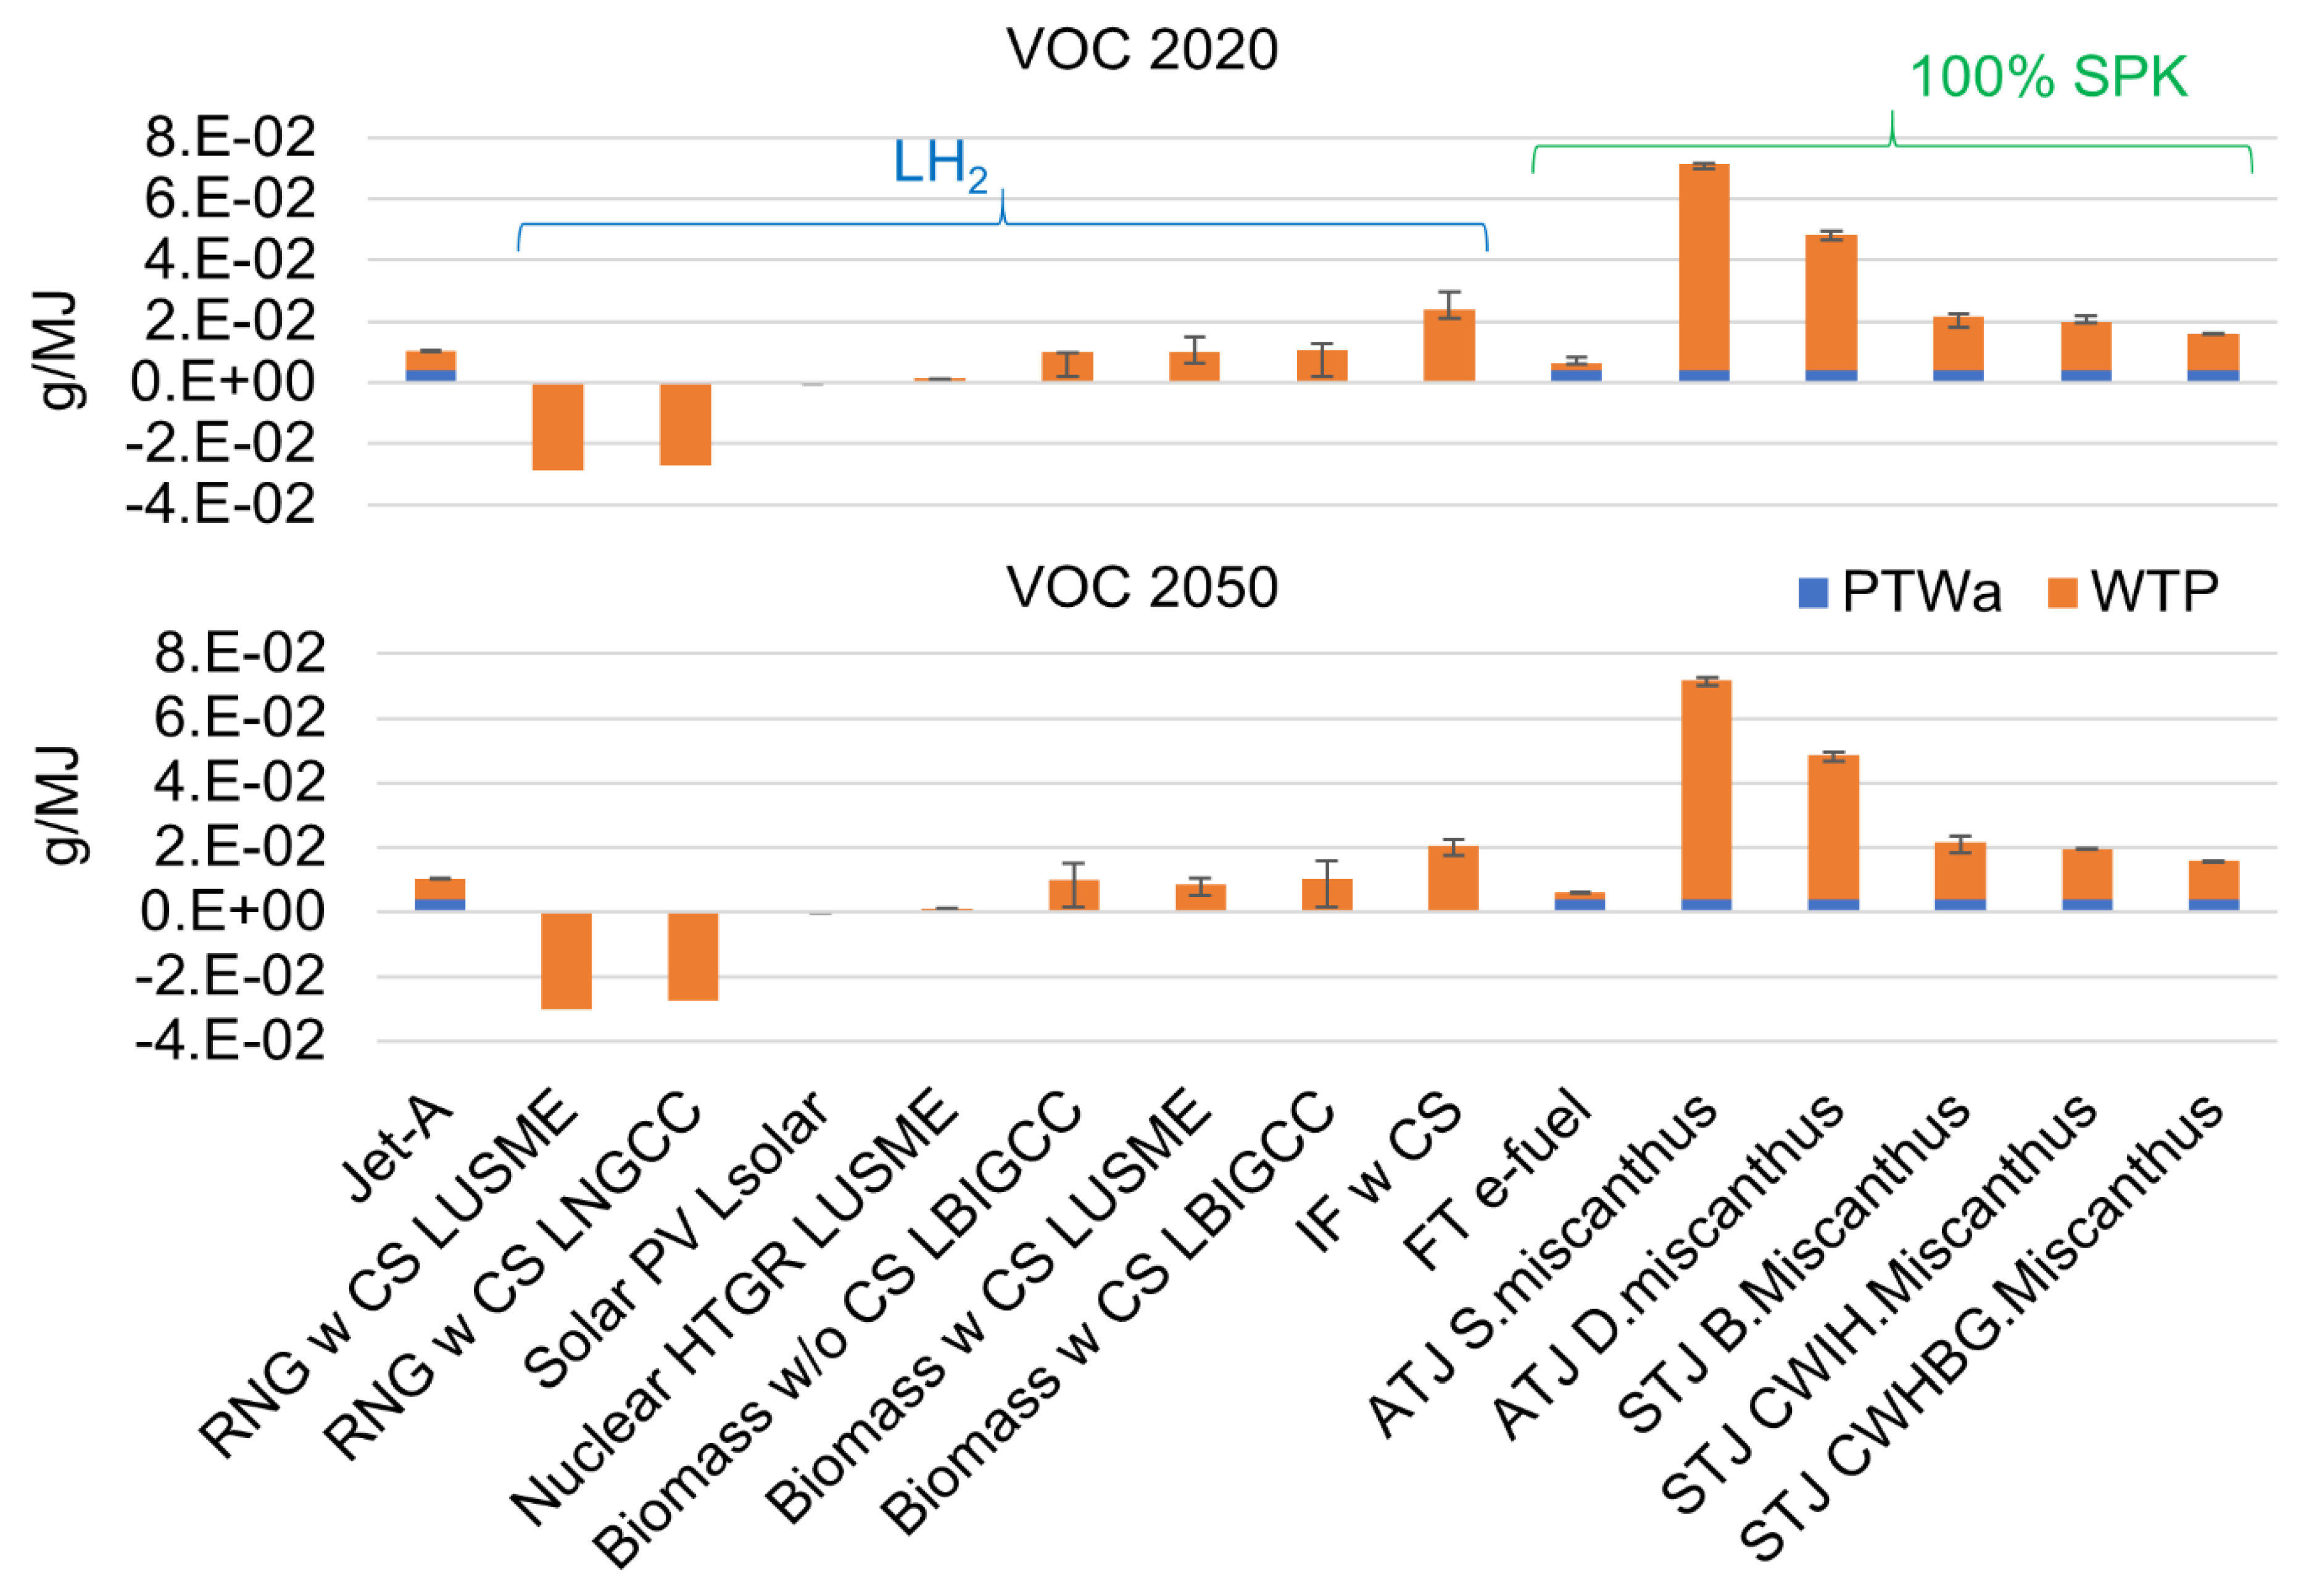
Table 1.
Comparison of GHG emission for the fuel type and feedstock combinations.
| Use-phase GHG emissions (without the effect of contrails) from GREET 2021 [8] | ||
| Fuel | Use-phase GHG (g CO2-eq/MJ) | |
| Conventional jet fuel (petroleum) | 73.2 | |
| 100% SPK | 70.4 | |
| WTWa GHG emissions (information source [24]) | ||
| Fuel | GHG (g CO2-eq/MJ) | |
| Conventional jet fuel (petroleum) | 90 | |
| Fuel type | Feedstock | GHG (g CO2-eq/MJ) |
| FT | Lignocellulose | −1.60 to 18.20 |
| HEFA | Microalgae | 27.00 to 38.00 |
| Camelina oil | 3.06 to 53.10 | |
| Waste oils and animal fat | 16.80 to 21.40 | |
| Jatropha | 33.00 to 40.00 | |
| ATJ | Corn grain | 47.5 to 117.50 |
| Sugar cane | −27.00 to 19.70 | |
| Poplar | 32.00 to 73.00 | |
| Switchgrass | 11.70 to 89.80 | |
| STJ | Sugar cane | 22.00 to 80.00 |
Table 2.
Cost comparison of fuel type and feedstock combinations(information source [24]).
Table 2.
Cost comparison of fuel type and feedstock combinations(information source [24]).
| Fuel | Cost (€/litre) | |
| Conventional jet fuel (petroleum) | 0.47 (in 2018) | |
| Fuel type | Feedstock | Cost MJSP (€/litre) |
| FT | Lignocellulose | 1.24 – 1.51 |
| HEFA | Microalgae | 6.36 |
| Camelina oil | 0.33 – 0.92 | |
| Waste oils and animal fat | 0.47 – 0.94 | |
| Soybean oil | 0.76 – 0.88 | |
| Jatropha | 1.1 – 1.15 | |
| ATJ | Lignocellulose (thermochemistry) | 1.46 – 1.56 |
| Sugar cane (biochemistry) | 0.73 – 1.61 | |
| Corn grain (biochemistry) | 0.77 – 1.32 | |
| Lignocellulose (biochemistry) | 0.86 – 2.17 | |
| STJ | Lignocellulose | 3.61 – 4.86 |
| Sugar cane | 1.43 | |
Table 3.
Comparison of complete life cycle GHG emissions (three measures) and levelized production cost for the fuel type and feedstock combinations (source [25])
Table 3.
Comparison of complete life cycle GHG emissions (three measures) and levelized production cost for the fuel type and feedstock combinations (source [25])
| Fuel | Carbon intensity (gCO2-eq./MJ) | Approximate wholesale cost (€/litre) | |||
| Conventional jet fuel | 87 | 0.4 | |||
| Fuel type | Feedstock | Direct life cycle emissions (WTWa) | ILUC emissions |
Carbon intensity | Approximate levelized costs of production |
| (gCO2-eq./MJ) | (€/litre) | ||||
| FT | Agricultural residue | 6.3 | – | 6.3 | 1.75 |
| Municipal solid waste (MSW) | 14.8 | – | 14.8 | 1.34 | |
| Power-to-liquids (solar) | 1.0 | 12.5* | 13.5 | 2.35 | |
| Energy crop | 11.7 | – 12.0 | – 0.3 | 1.87 | |
| HEFA | Palm oil | 30.8 to 36.5 | 231.0 | 216.8 to 267.5 | 1.01 |
| Palm fatty acid distillate (PFAD) |
19.4 | 213.0 | 232.4 | 0.98 | |
| Soy oil | 27.9 to 34.9 | 150.0 | 177.8 to 184.9 | 1.09 | |
| Used cooking oil (UCO) | 19.4 | – | 19.4 | 0.88 | |
| ATJ | Agricultural residue | 14.9 | – | 14.9 | 2.33 |
| Corn grain | 65.0 | 14.0 | 79.0 | 1.67 | |
| Sugarcane | 48.1 | 17.0 | 65.1 | 1.65 | |
| Energy crop | 20.3 | – | 20.3 | 2.48 | |
| STJ | Molasses | 47.0 | – | 47.0 | 3.85 |
| * emissions attributable to infrastructure required for new renewable electricity generation | |||||
Table 4.
WTWa CO2 equivalent values for different renewable jet pathways (source [26])
Table 4.
WTWa CO2 equivalent values for different renewable jet pathways (source [26])
| Technology | Feedstock | CO2 equivalent (g/MJ) |
| FT | Forestry residues | 6 |
| Poplar | -6 to 10 | |
| Corn Stover | 13 | |
| Willow | 0 | |
| HEFA/HRJ | Camelina | 44 to 47 |
| Used cooking oil | 28 | |
| Jatropha | 21 to 55 | |
| STJ (10% blend) | Sugarcane | 47 to 49 |
| STJ (increased blend level) | Sugarcane | 76 to 79 |
| ATJ | Sugarcane | 31 |
| Corn Stover | 22 to 35 | |
| Corn | 54 to 71 | |
| Pyrolysis (in situ) | Forestry residues | 22 |
| Pyrolysis (ex situ) | Forestry residues | 37 to 41 |
| Hydrothermal Liquefaction (HTL) (in situ) | Forestry residues | 18 |
| HTL (ex situ) | Forestry residues | 21 |
Table 5.
CORSIA default values based on the core life cycle emissions and indirect land use change emissions (source [27,28])
| Fuel Conversion Process | Region | Fuel Feedstock | Core LCA Value | Indirect land use change LCA Value | Net emissions (gCO2e/MJ) |
| HEFA | Global | Tallow | 22.5 | 0 | 22.5 |
| Global | Used cooking oil | 13.9 | 13.9 | ||
| Global | Palm fatty acid distillate | 20.7 | 20.7 | ||
| Global | Corn oil (from dry mill ethanol plant) | 17.2 | 17.2 | ||
| USA | Soybean oil | 40.4 | 24.5 | 64.9 | |
| Brazil | Soybean oil | 40.4 | 27 | 67.4 | |
| EU | Rapeseed oil | 47.4 | 24.1 | 71.5 | |
| Malaysia and Indonesia | Palm oil – closed pond | 37.4 | 39.1 | 76.5 | |
| Malaysia and Indonesia | Palm oil – open pond | 60 | 39.1 | 99.1 | |
| Brazil | Brassica carinata (grown as a secondary crop that avoids other crops displacement) | 34.4 | -20.4 | 14 | |
| USA | Brassica carinata (grown as a secondary crop that avoids other crops displacement) | 34.4 | -21.4 | 13 | |
| FT | Global | Agricultural residues | 7.7 | 0 | 7.7 |
| Global | Forestry residues | 8.3 | 8.3 | ||
| Global | Municipal solid waste (MSW), 0% non-biogenic carbon (NBC) | 5.2 | 5.2 | ||
| Global | MSW (NBC given as a percentage of the non-biogenic carbon content) | NBC*170.5 + 5.2 | NBC*170.5 + 5.2 | ||
| USA | Poplar (short-rotation woody crops) | 12.2 | -5.2 | 7 | |
| USA | Miscanthus (herbaceous energy crops) | 10.4 | -32.9 | -22.5 | |
| EU | Miscanthus (herbaceous energy crops) | 10.4 | -22 | -11.6 | |
| USA | Switchgrass (herbaceous energy crops) | 10.4 | -3.8 | 6.6 | |
| Alcohol (ethanol) to jet | Brazil | Sugarcane | 24.1 | 8.7 | 32.8 |
| USA | Corn grain | 65.7 | 25.1 | 90.8 | |
| Global | Agricultural residues (standalone conversion design) | 39.7 | 0 | 39.7 | |
| Global | Agricultural residues (integrated conversion design) | 24.6 | 24.6 | ||
| Global | Forestry residues (standalone conversion design) | 40 | 40 | ||
| Global | Forestry residues (integrated conversion design) | 24.9 | 24.9 | ||
| USA | Miscanthus (herbaceous energy crops) standalone conversion design | 43.3 | -42.6 | 0.7 | |
| USA | Miscanthus (herbaceous energy crops) integrated conversion design | 28.3 | -42.6 | -14.3 | |
| EU | Miscanthus (herbaceous energy crops) standalone conversion design | 43.3 | -23.3 | 20 | |
| EU | Miscanthus (herbaceous energy crops) integrated conversion design | 28.3 | -23.3 | 5 | |
| USA | Switchgrass (herbaceous energy crops) standalone conversion design | 43.9 | -10.7 | 33.2 | |
| USA | Switchgrass (herbaceous energy crops) integrated conversion design | 28.9 | -10.7 | 18.2 | |
| Alcohol (isobutanol) to jet (ATJ) | Global | Agricultural residues | 29.3 | 0 | 29.3 |
| Global | Forestry residues | 23.8 | 23.8 | ||
| Brazil | Sugarcane | 24 | 7.3 | 31.3 | |
| USA | Corn grain | 55.8 | 22.1 | 77.9 | |
| USA | Miscanthus (herbaceous energy crops) | 43.4 | -54.1 | -10.7 | |
| EU | Miscanthus (herbaceous energy crops) | 43.4 | -31 | 12.4 | |
| USA | Switchgrass (herbaceous energy crops) | 43.4 | -14.5 | 28.9 | |
| Synthesised iso-paraffins | Brazil | Sugarcane | 32.8 | 11.3 | 44.1 |
| EU | Sugar beet | 32.4 | 20.2 | 52.6 |
Table 6.
Engine parameters required to estimate during cruise for different fuels (source: [12])
Table 6.
Engine parameters required to estimate during cruise for different fuels (source: [12])
| BWB fuel cases | (MPa) | (K) | (ms) | of combustion products | ||
| Jet-A | 2.11 | 838 | 0.0241 | 0.351 | 0.854 | 28.86 |
| 100% SPK | 2.11 | 838 | 0.0236 | 0.343 | 0.854 | |
| LH2 (case 3) | 2.16 | 843 | 0.0061 | 0.206 | 0.842 | 27.45 |
Table 11.
Production capacities of different fuels and production feedstocks/pathways (per plant)
| Fuel | Feedstock/pathway | tonne/day | Source |
| H2 (gas) | SMR with CS (H-vision initiative) | 360 – 480 | [98] |
| Solar PV (hypothetical case estimation) | 1,233 | [98] | |
| Renewable source (solar, wind), plant for 2025 | 650 | [99] | |
| Nuclear HTGR | 230 | [100] | |
| Biomass | 2,000 | [101] | |
| Global hydrogen liquefaction capacity 290 tonnes/day [100] | |||
| 100% SPK | Neste/HEFA | 933 | [25] |
| EU sub-group (HEFA) | 1,348 | [25] | |
| FT | 456 | [25] | |
| 187 | [25] | ||
| 249 | [25] | ||
| ATJ | 477 | [25] | |
| STJ | 127 | [25] | |
| Jet-A (2019, Global) | Petroleum | 7,90,165 | [102] |
Table 12.
Summary of other unintended life cycle environmental and social impacts
| Ranking colour scheme | ||||||
| 1 | 2 | 3 | 4 | |||
| Aspects | Jet-A | LH2 | ||||
| Biomass w CS LUSME | Biomass w CS LBIGCC | IF w CS | ||||
| Fossil fuel use | ||||||
| Water consumption | ||||||
| WTWa VOC | ||||||
| WTWa CO | ||||||
| WTWa NOx | ||||||
| WTWa PM10 | ||||||
| WTWa PM2.5 | ||||||
| WTWa SOx | ||||||
| WTWa BC | ||||||
| WTWa OC | ||||||
Disclaimer/Publisher’s Note: The statements, opinions and data contained in all publications are solely those of the individual author(s) and contributor(s) and not of MDPI and/or the editor(s). MDPI and/or the editor(s) disclaim responsibility for any injury to people or property resulting from any ideas, methods, instructions or products referred to in the content. |
© 2025 by the authors. Licensee MDPI, Basel, Switzerland. This article is an open access article distributed under the terms and conditions of the Creative Commons Attribution (CC BY) license (http://creativecommons.org/licenses/by/4.0/).
Copyright: This open access article is published under a Creative Commons CC BY 4.0 license, which permit the free download, distribution, and reuse, provided that the author and preprint are cited in any reuse.


