
Submitted:
16 April 2025
Posted:
17 April 2025
You are already at the latest version
Abstract
One of the methods to lower CO2 emissions from an existing coal plant is the implementation of biomass co-firing. Thus the carbon emission level of gas-fired power plants (550 kg/MWh) can be achieved. The result is a significant increase of the fuel volumes that are acquired, handled and finally supplied to the power plant units. A necessary extension of a complex logistic system for transporting biomass may increase noise emissions. Environmental regulations require to analyze the impact of this expansion on possible exceedance of the allowed noise thresholds. For a comprehensive assessment of the concept of expanding the power plant's biofuel supply system (BSS), a digital simulation model was built to dimension system elements and verify its correctness of the proposed solutions. Then, a dedicated noise emission model was built for the purposes of mandatory environmental impact assessment procedures for the planned expansion of the BSS, which showed the possibility of exceeding the permissible noise levels at night in selected locations. The article presents the results of a simulation analysis of the efficiency of the BSS in a power plant located in an urbanized environment, taking into account optional shutdowns of facilities generating too much noise at night. The results of the simulation indicate the possibility of securing fuel supplies also under strict restrictions. The use of digital, spatial simulation models of a complex, cyclical-continuous transport system to control its operation in conditions of constraints is an effective method of solving environmental conflicts at the design stage of the extension of industrial installations in urbanized areas.
Keywords:
industrial biomass transportation
; belt conveyors
; noise emission
; simulations
; environmental constraints
1. Introduction
Decarbonization of electricity production in many European countries is a complex process, in which it is necessary to ensure a secure supply of electric energy in the transition period when the fossil fueled power plants are being phased out [1]. One of the methods of a systematic reduction of CO2 emissions from an existing coal plant is its conversion to a multi-commodity one that burns biomass mixed with coal [2]. Because biomass is classified as a renewable energy source (RES), the CO2 emissions from burning it is not included into carbon limits. The biomass and coal mix therefore helps to achieve the level of 550 kg of emitted CO2 per MWh – the provisional threshold value of carbon emission (derived from gas-fired power plants indexes) accepted in 2017 by the European energy companies that entitles any European power plant to obtain public support or financing from the banking sector [3]. The replacement of coal with biomass results in a significant (2-3 times) increase in the volume of fuel supplied to the power plant units. These volumes of troublesome and even dangerous material (biomass is prone to fire and explosion or dampness) have to be unloaded from cargo trains or trucks, sampled to assign with the actual quality parameters [2], safely stored in dedicated depots or silos and eventually conveyed to the power units bunkers for burning with regard to the necessary proportion of the mixed types of biomass (eg. wooden or agricultural pellet, industrial grain, seeds, etc.) to ensure the required calorific value and safe burning. An extensive internal system for transporting in addition to logistic problems may increase noise emissions [4,5]. Growing environmental requirements make it necessary to analyze the impact of this expansion on possible exceedance of the permissible levels. For a comprehensive assessment of the concept of expanding the materials handling feeding system of the undergoing conversion hard coal power plant, implementing the new multi-commodity warehouses equipped with portal scraper reclaimers, belt conveyors and silos (Figure 1), a digital simulation model was built. The model was used to dimension system elements and verify the correctness of the solutions used [2]. Then, a dedicated noise emission model was built for the purposes of mandatory environmental impact assessment procedures for the planned expansion of the transport system, which showed the possibility of exceeding the permissible noise levels at night in selected locations [5].
The growing requirements for reducing CO2 emissions are accompanied by other, increasingly stringent environmental requirements, which result from [6]. In accordance with the IED Directive, the environmental impact of energy plants is limited by integrated permits for fuel combustion installations issued by the competent environmental protection authorities. They define emission limits in relation to, among others: dust, SOx, NOx, HCL, HF and Hg. The values indicated in the integrated permits result from the BAT (Best Available Techniques) Conclusions for large combustion plants [7] in accordance with [6]. The BAT conclusions apply primarily to combustion installations with a total rated thermal power supplied as fuel of 50 MW or more. The fuels included in the BAT conclusions are in particular solid, biomass, liquid and gaseous. The techniques described in the BAT conclusions are not prescriptive, other methods may be used provided they ensure at least an equivalent level of environmental protection. Energy plants must therefore adapt their functioning to the BAT Conclusions dedicated to emissions to air and water (BAT-AELs), waste management, noise emissions and energy efficiency. Subsequent publications of BAT conclusions for large combustion plants are systematically more restrictive, forcing energy producers to constantly take actions aimed at meeting the growing environmental requirements. Combined with these requirements are EU Directives setting the outlines for promoting the energy efficiency of the industry [8,9,10].
In this article, the authors propose the application of discrete event simulation method (DES) to analyze the impact of the proposed technological solution on the surroundings of the power plant. Discrete event simulation is most commonly used in the analysis of logistical and industrial processes, primarily for identifying bottlenecks and evaluating system modification scenarios. It has been extensively utilized in the mining sector to address the complex challenges associated with the transportation of bulk materials.
Most publications on discrete event simulation focus on the analysis of specific case studies. In the field of biomass transportation, analysis can, due to the specific characteristic of this fuel, be conducted at multiple process levels, ranging from simple technological systems such as machine cooperation within power plants to international transportation and broader economic evaluations assessing process efficiency. Biomass supply chain has been analyzed for numerous type of fuel and across various economies to examine different technological and financial factors. The transportation of biomass using different type of vehicles (truck, train, barge) was analyzed by Zahraee et al [11] to estimate costs of delivery and greenhouse emissions in a case study conducted in Malaysia. Model indicated that the best solution would be a combination of three modes of transport. The authors proposed an analysis period of nearly 50 years. Similar problem for Canadian power plant was presented in the study of Mobini et al. [12] where a model for biomass procurement, transport and processing was developed for a 20-year analysis period of estimating costs.
A biomass supply chain model from raw material production (wood chips) to delivery to the power plant, was proposed by Pinho et al [13]. The model analyzed the impact of deviations in delivery execution caused by system component failure on the achievement of the plan outcomes focusing on a case study of a power plant located in Finland. It served to support decision-making regarding the allocation of resources necessary the required quantity of biomass. Another example analyzed in Finland was a transportation chain model that considered the moisture content of biomass and transportation distance as key factors [14]. These parameters significantly influenced the economics of the biomass procurement process in a system comprising of one chipper and two trucks.
A comprehensive review of publications on biomass transport and delivery has been conducted in [15]. The authors, based on changes in the Bill of Materials, analyzed emissions and financial KPIs. On this basis, they drew general conclusion regarding potential adjustments to the biomass supply chain in Vietnam such as the need for optimizing feedstock locations.
A similar issue was addressed using Dijkstra’s algorithm to analyze the optimal location for pellet delivery in Eastern Poland [16]. In this context, a simulation model was not used, but it was demonstrated that suboptimal location choices could increase transportation costs by up to 75%. An analysis of the production and supply variant for wood pellets was also conducted for a Canadian case study, where the supply chain was examined in a top-down manner [17]. This approach started with the destination of transportation and market price at the port, followed by an evaluation of transportation options and potential plant location ultimately determining profitability for a facility with potential production capacities ranging from 50,000 to 150,000 tonnes per year.
The solution presented in this article, regarding the determination of the required system workload during nighttime hours, is the first known case to the authors of applying a DES model to such a complex system within a single comprehensive model. Additional distinctive elements of the analysis presented in this study include the integration of biomass co-firing with coal as an option to reduce taxable emissions and extend the operational lifespan of powerplant.
2. Materials and Methods
The analyzed coal plant Polaniec was converted to a coal & biomass plant some years ago by adding a new biomass Green Unit and co-firing a relatively small amount of biomass with coal in the old Coal Units. In order to achieve the required level of 550 kg of emitted CO2 per MWh (measured for each power unit independently) almost half of the chemical energy of the fuel should be obtained from RES in Coal Units. These units should be retrofitted for this purpose. The planned schedule of upgrading Coal Units to burn increased amounts of biomass was included to the list of constraints for the development of the biofuel supply system (BSS) [2]. The required increase of capacity of the BSS was addressed by the proposal of new warehouses, belt conveyors and silos that are presented together with the existing ones on the conceptual model (Figure 1 and Figure 2). The performance of the final BSS and its interim (during the planned investment period) layouts were analyzed with the use of simulation methods [18]. The dedicated model was created using Flexsim v. 22 and was developed based on several sub-models of individual processes, with the most significant ones being:
- Truck deliveries (including the queue at the entrance gate, gate service, weighing, biomass quality sampling, unloading at the dedicated yard, re-weighing of the emptied truck and leaving the power plant site),
- Train deliveries (containing the train’s entrance to the Polaniec railway station, logistical operations on railroad tracks until the arrival of freight wagons at the dedicated ramps for unloading),
- Belt conveyors operations with accompanying devices (silos, adjustable transfer stations),
- An object work management model,
- A stream calculation algorithm.
The final model’s layout is shown on Figure 2. The thicker black lines represent the railroad tracks for train deliveries, the thin lines with nodes at the connections indicate transportation routes for truck deliveries while the grey, inclined or containing the vertical curvatures straps show the 3-D belt conveyor routes.
Different colors represent distinct types of biomass - red (fine) and green (coarse) for wood chips, gray for wood pellets and yellow for agriculture biomass. Rectangular white areas represent empty storage spaces while black areas are excluded from storage for technological reasons such as maneuvers of technological vehicles. Cubic shapes denote system installation objects. Some objects shown in the drawing exist only in the model because they are either planned or used to establish the working logic of the model.
In addition to the model space, a special control panel was created (see Figure 3). It allows a freely adjusting fuel flow settings and determining the parameters of the transport system. The calculation for biomass flow for each simulation variant begins with determining the parameters of power units including capacity, efficiency and load. In subsequent model variants capacity and efficiency of the unit was considered as a constant parameter. However, the flexibility of the model allows for adjusting these parameters as well. The parameter that directly influenced the flows is the unit load. In the simulation, depending on the specific model analyses, the regulation varied in scope up to 92% and 73% of the maximum capacity for the Green Unit and Coal Units respectively (these limits were set according to plant production records [2]).
In the same section, quality parameters of fuels were defined. The proportions of individual fuel types allowed for the determining the hourly (or daily) fuel flow to individual units. In the base scenario, the sum of the biomass flow to the blocks corresponded to the total required delivery which, after simply calculation, allowed to determine the number of trains and trucks arriving at the powerplant. When testing subsequent solutions the panel (in the Delivery Planning section) allowed for periodic adjustments to the number of trains (increasing or decreasing) by a specific percentage, making it possible to include cyclical changes in the number of train deliveries resulting from factors such as the biomass purchase and delivery plan or limitations in the capacity of the railway system.
The control panel also enables defining unloading locations. For train deliveries considered unloading location were the existing ramp near storage yard, which handles deliveries to the Green Unit (marked as 1 on Figure 2) and a proposal to construct a new unloading system in the northern part of the plant area (marked as 2 on Figure 2).
An essential system regulation prior to model deployment was establishing the ratio of biomass deliveries transported by trucks to those delivered by trains as this indicator was crucial for determining the quantity of trucks and freight trains in the system.
Quantities of transport machines defined in the model were generated during the simulation in accordance with their daily and weekly biomass deliver frequencies. Deliveries by trucks were characterized by an increased number of arrivals in the morning and early afternoon with fewer deliveries on non-working days. The example of daily truck deliveries calculation shown in Figure 3 is based on a truck delivery share of 25%. This share corresponds to 126 vehicles entries, categorized into 3 types of transported biomass. The biomass truck generators in the model were based on an exponential distribution, which with a specified frequency (parameter λ), varied for each hour of the day and each day of the week appearing at the power plant gate (Figure 4).
The railway delivery cycle was generated in a somewhat different way due to the fact that railway deliveries are dependent on the railway traffic management system based on the train timetable. Consequently, railway deliveries contain a deterministic component, which in the model had to, for example, prevent the random appearance or two or more trains within a short time period. The solution to this issue was to generate railway deliveries based on individual railcars so that the time required to assemble the train correspond to the delivery interval.
The regulation defined prior to the simulation, regarding the quantity of biomass and the locations of its unloading, determined the load on specific points within the system, directly impacting noise emissions at those locations. One of the tasks of the simulation model should, therefore, be the assessment of the impact of environmental protection constraints on the ability to handle the required biomass streams.
The analysis of possible noise emissions [5] proved that some machinery equipment objects (belt conveyors) and some handling processes (unloading freight wagons) that are located in the northern area (marked 2 on the Figure 2) can exceed allowable limits in night hours. The BSS should therefore be analyzed against the needs of freezing any operations in the area 2 in night hours (since 10 p.m. till 6 a.m.). The simulations should help to investigate the actual performance of the BSS with the forced night stops of the significant part of the planned BSS.
Object-oriented simulation models focus on queue analysis. In case of insufficient capacity at a specific point in the system a queue emerges, indicating a mismatch in the system, pointing an issue that requires correction. In the analyzed model the crucial element is the freight wagons queue, which forms when there is a lack of capacity for unloading freight wagons at the ramps. The queue of railway carriages, while is not inherently an object of analysis, serves as indicator that from logistics perspective, there are performance-related challenges within the system at subsequent stages.
The essence of the process, which is analyzed in the model has been depicted in Figure 5. The unloading of containers from railway platforms is a bottleneck in the projected system because the pace of it determines the speed of handling subsequent trains. The model features a significantly high number of input parameters, with the most critical ones being the hourly or shift-based performance metrics of reachstackers. This, in turn, depends on the durations of individual technological activities such as the speed of lifting, dumping and lowering containers as well as the distance of maneuvering movements. All of these variables are related to noise emissions so they should be minimized during each work period.
3. Results
In order to maintain an acceptable noise level generated by the unloading machines, conveyor belts system and the safety system, especially the dust extraction, a solution was tested in the model involving periodic shutdown of the system. In the initial model assumption, a continuous 24-hour operation of the system was assumed. Incorporating environmental factors (previously described) necessitated the adoption of a new assumption and, consequently, their verification within model.
The proposed unloading system at the northern ramp involved the use or three unloading points where three reach stackers, commonly referred to as ‘kalmar’ machines worked simultaneously. The loud operation of these machines results in their night-time shutdown. This leads to the shutdown of the planned biomass conveyor system and biomass stacking system. As a consequence, the ability to absorb the assumed biomass streams decreases. In mass service systems, the measure of system inefficiency is the queue in front of the service station. A similar assumption was made in the analysis of the biomass transport system, where the measure of the ability to handle deliveries was the queue of trains at the station.
The simulation was performed for a two-week delivery time. The modified parameters included setting the working time of unloading yards. Three operations modes of the biomass transport unloading system were considered:
- -
- M1: the restriction of night time operation
- -
- M2: the restriction of night time operation only on the northern yard (No 2)
- -
- M3: unrestricted (around the clock) unloading at southern yard (No 1 – existing storage) and northern yard (No 2 – planned storage)
For each of the three systems, a simulation was carried out with 15 supply scenarios, which marked biomass flow level related to demand level. The minimum supply level was set to 30% of the maximum load of power units up to the biomass quantity covering the load of operating blocks at their maximum capacity. Operating blocks at the maximum capacity for an extended period is not feasible. However, the experiment does not aim to test the combustion system’s efficiency but rather the delivery system. The reference point for the biomass stream in the model has always been the reported demand from the block operator.
As a result, the quantities of biomass corresponding to scenarios 10-15 should be considered improbable. However, they did confirm the model’s adequacy for analyzing various, including extreme, scenarios.

Table 1.
Average biomass and vehicle stream for different scenarios in daily delivery (25% share of biomass delivered by trucks).
Table 1.
Average biomass and vehicle stream for different scenarios in daily delivery (25% share of biomass delivered by trucks).
| Scenario No | Biomass stream level* | Biomass flow in rail transport [m3] | Daily No of trains | Daily No of trucks |
|---|---|---|---|---|
| S1 | 30 | 4 985 | 2,50 | 46,86 |
| S2 | 35 | 5 816 | 2,91 | 54,67 |
| S3 | 40 | 6 647 | 3,33 | 62,48 |
| S4 | 45 | 7 478 | 3,74 | 70,29 |
| S5 | 50 | 8 309 | 4,16 | 78,09 |
| S6 | 55 | 9 140 | 4,58 | 85,90 |
| S7 | 60 | 9 971 | 4,99 | 93,71 |
| S8 | 65 | 10 802 | 5,41 | 101,52 |
| S9 | 70 | 11 632 | 5,83 | 109,33 |
| S10 | 75 | 12 463 | 6,24 | 117,14 |
| S11 | 80 | 13 294 | 6,66 | 124,95 |
| S12 | 85 | 14 125 | 7,07 | 132,76 |
| S13 | 90 | 14 956 | 7,49 | 140,57 |
| S14 | 95 | 15 787 | 7,91 | 148,38 |
| S15 | 100 | 16 618 | 8,32 | 156,19 |
- referred to maximum load (73% for coal unit and 92% for green unit)
The following figures (Figure 6) will present the simulation results for main unloading arrangements. The first step of the experiment was to deactivate all unloading yards at night. The model’s response indicates that up to the level of the third scenario (biomass stream determined as 40% of maximum, the wagons are still being unloaded continuously. After exceeding the 40% maximum load capacity, each subsequent increase of 5% in biomass stream generates an increase in the queue by 3 trains (120 freight wagons).
The above chart shows that in the case of a significantly limited output of the power plant (due to the rising increase of RES share in the domestic power mix) the BSS operations of unloading freight wagons could be stopped for night hours in the case of deliveries smaller than those for Scenario 4, corresponding to the entry of average 3.7 trains and 70 trucks carrying biomass per day.
The difference between the model with the southern yard operating 24/7 (M2) and the model with its shutdown (M1) did not cause significant changes in queues. This results from the adopted assumption regarding the distribution of specific types of biomass to particular yards, allowing for detailing monitoring of delivery locations. Another reason is that the model was constructed for the existing system, and relative changes in the consumption of fuel types are not proportional (coal boilers are not adopted for the mass combustion of wood chips, while an increase in energy production from co-firing was assumed). This leads to situations where southern yard (SY1) does not receive deliveries because it becomes blocked by track occupancy or freight handlers due to the deliveries that can be only unloaded at the northern yard, which are waiting because operations are halted during quiet hours. In consequence, in the case of nighttime shutdown of the northern yard, train sets cannot be reliably unloaded using the FIFO method.
The third model (M3) indicates the ability to accept train sets in the case of implementing a night shift at the level of Scenario 8. Considering the capacity of the siding at the station before powerplant and the possibility of retaining deliveries at the level of several train sets, the limit of acceptance capacity, given the adopted technical parameter of the model is around Scenario 11, which corresponds to a capacity of 13,300 cubic meters of biomass per day.
The bottleneck in the system is the unloading of biomass from freight cars using reachstackers. For the scenarios shown in the table, the machine operating modes have been summarized in a simplified manner. Seven operating modes have been distinguished ie. travel empty, loading, travel loaded, unloading, and two offset mode for loading and unloading , and these have been summed up as time marked as work mode. Subsequently for the entire simulation period, this work mode time was accumulated and in relation to the clock time, it indicated the total operating time of the machine.
An example of the dashboard from the running simulation has been presented on Figure 7. For the 5 reachstackers: two at storage yard 1 and three for the north ramp the workload for each working hour over two weeks of simulation was shown. On the presented example, the daily work cycle of the machines for the northern ramp is clearly visible in the form of 14 equal intervals.
The collected simulation results for workload for all variants across the successive scenarios is shown on the Figure 8. The two graph on the left show the workload of the reach stackers for the northern ramp (NR, upper half of the graph, and storage yard 1 (SY1, lower half) in the case of nighttime shutdown of the machines. The simulation results for the northern ramp are significantly more stable (smaller range). This is related to the fact of a dedicated workstation with high capacity and relative short transport distance.
Yard 1 handles deliveries of wood chips, the quantity of which does not significantly increase. The access route for the railway cars is much longer and takes more time (shifting split freight trains into 10-car sets). The variability in deliveries in the case of accumulation or a lack of deliveries over an extended period leads to a greater range of simulation outcomes.
The workloads of Kalmars on the yard 1 and yard 2 differ. Due to the deactivating of night operations on the yard 2 there are regular breaks on the charts generated for Kalmars 3, 4 and 5. During daily shifts, however, these Kalmars operate almost continuously due to the carefully designed other logistic equipment of the BSS: easy access to freight wagons, conveniently located feeding points of receiving conveyors (Figure 4), flexible layout of belt conveyor system that deliver the unloaded biomass either to the high capacity warehouses or directly to the silos before the coal units (Figure 2). Kalmars 1 and 2 on the yard 1 workloads depend on less regular arrivals of trains with wood chips, predominantly delivered by trucks.
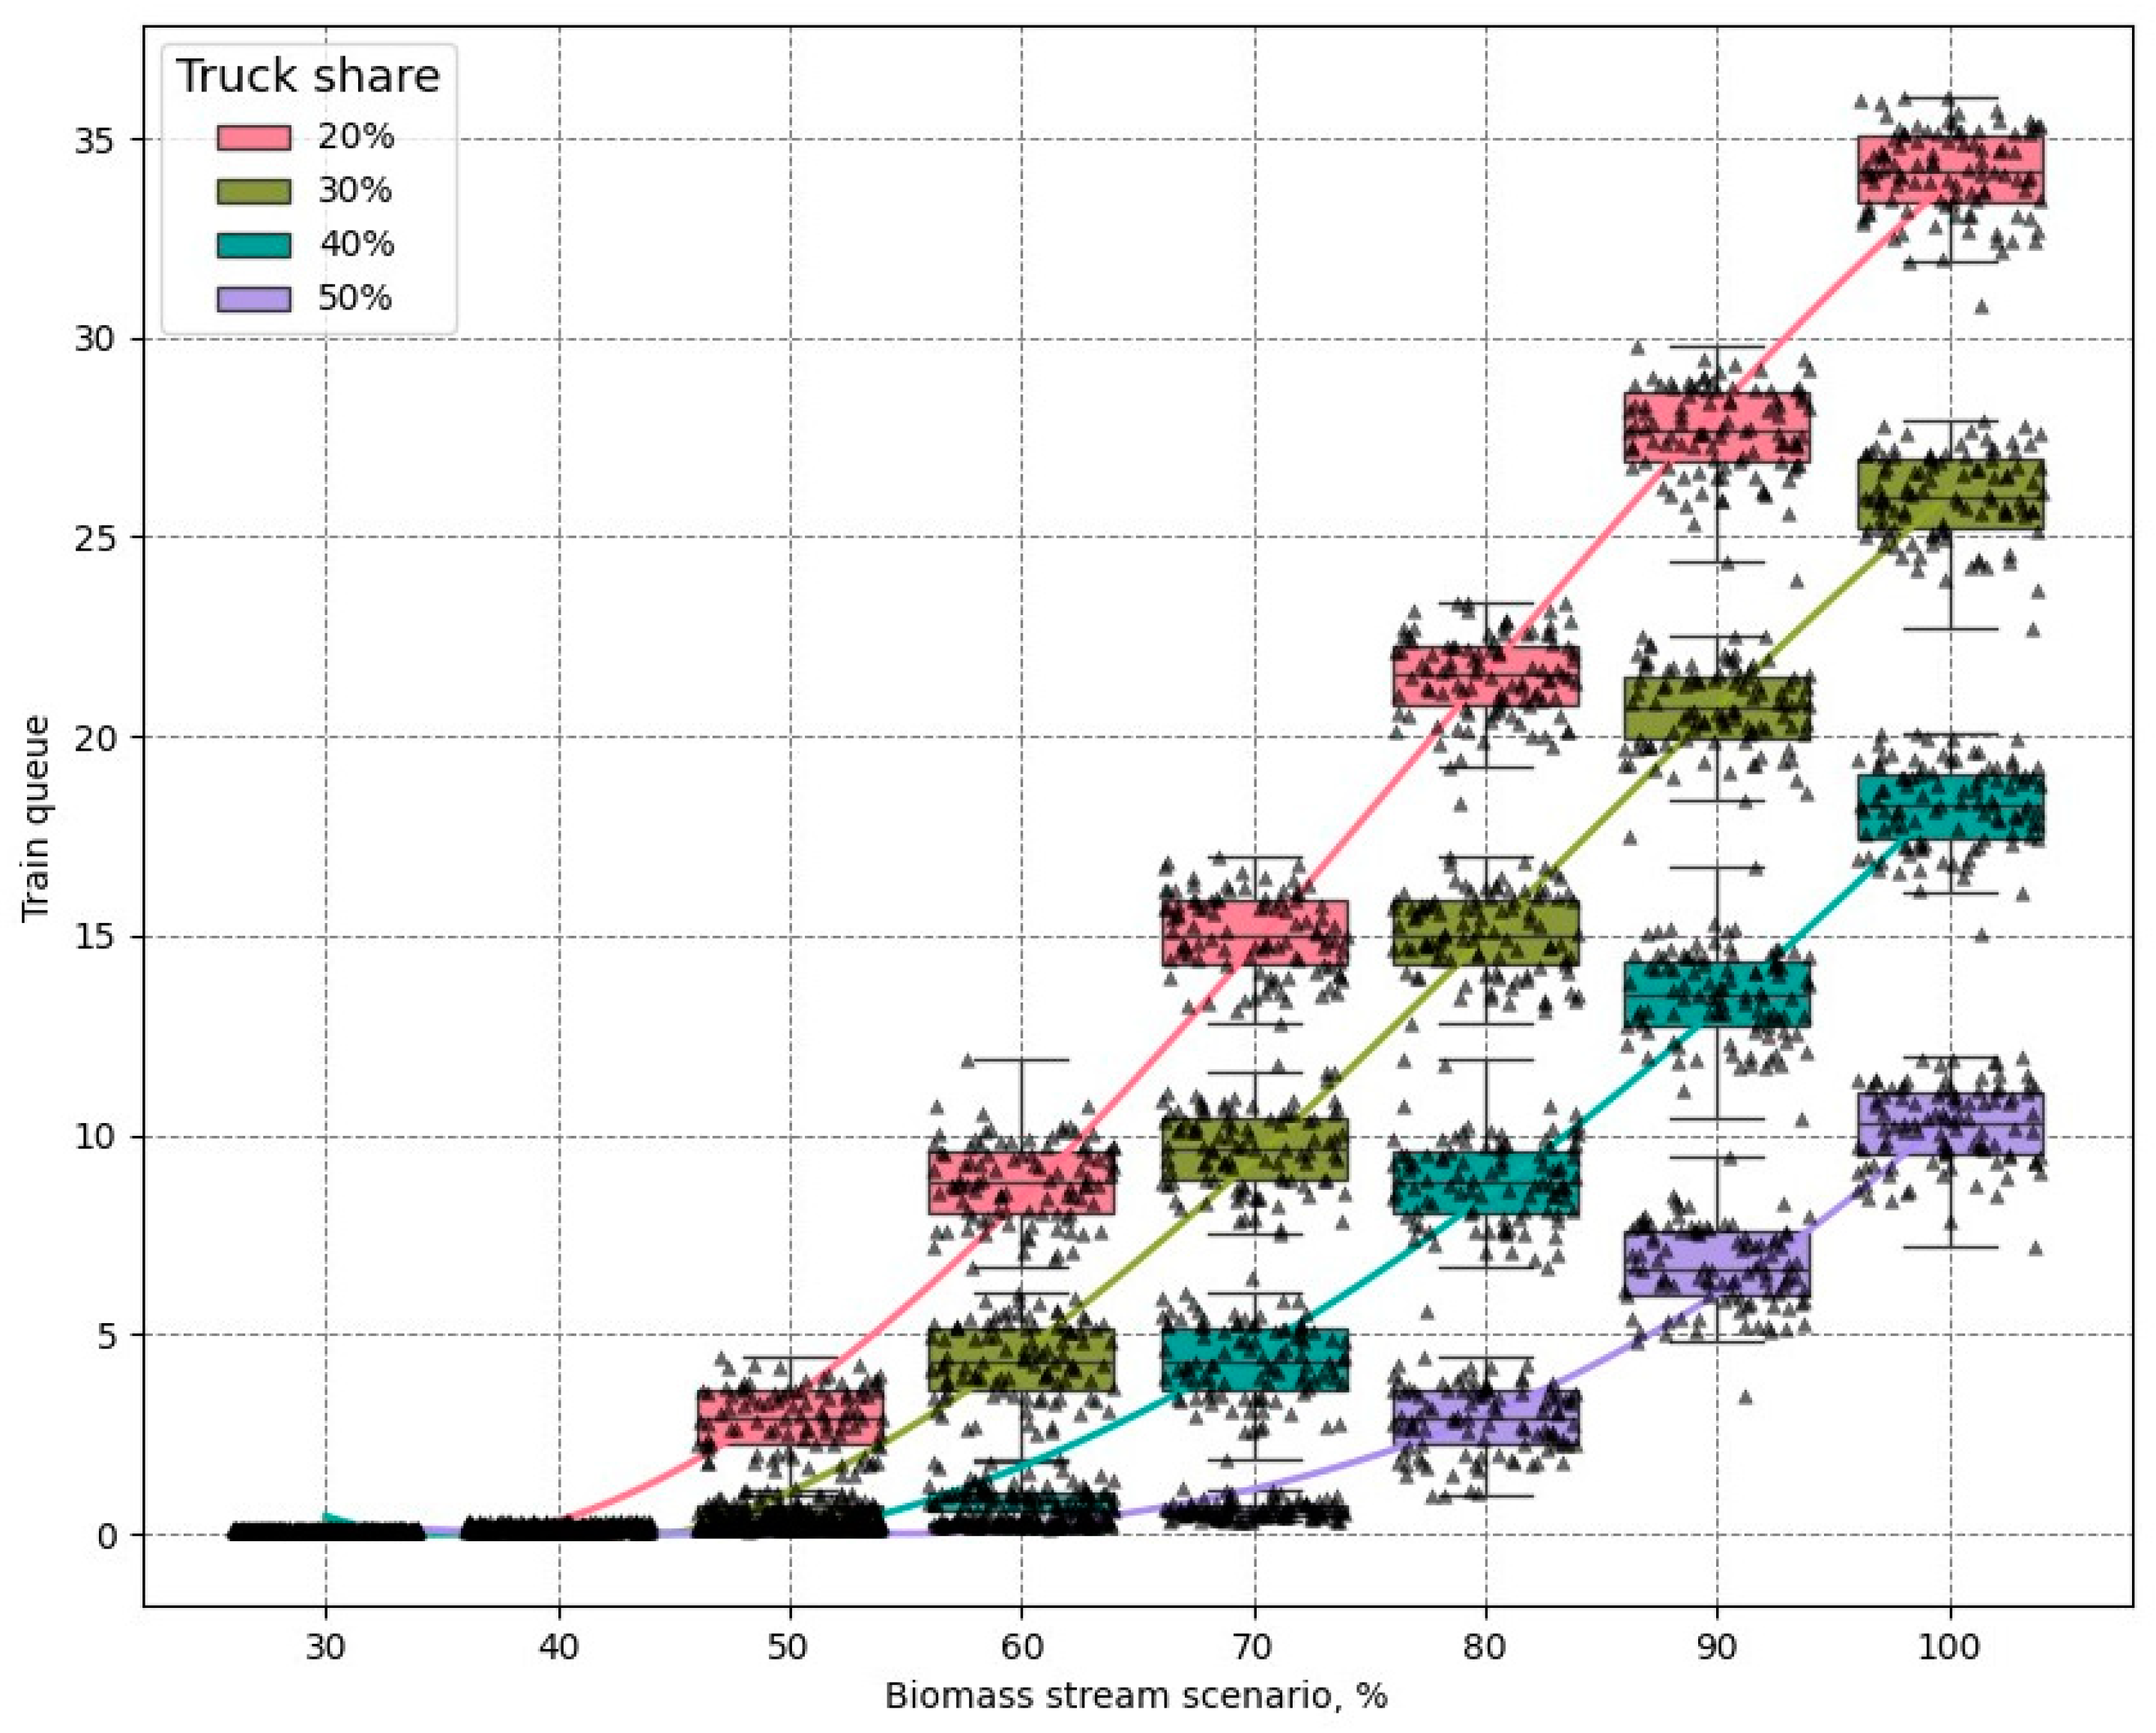
The all above results of simulations were made for the fixed proportion of truck and rail deliveries of biomass (1:3). However the proportion can vary and is subjected to the actual policy of orders of biomass suppliers [2]. Following to the (less probable) needs of exceeding the level of S8 scenario of biomass stream level, the managers of Polaniec can increase the orders for truck deliveries. Truck deliveries are more flexible than the train ones and can be considered as a supply reserve available on demand.
The results presented on box-and-whisker plots of the number of unloaded biomass freight wagons (Figure 6 and Figure 9) need to be compared with one another because they seem to be very similar. In order to distinguish the differences between these modes of night shifts the most interesting scenarios S3 ÷ S9 which correspond to the most expected range of biomass volume supply (according to [3,6,7]) are shown in the table below. The red color indicates the scenarios that exceed capacity to accept the given biomass flow, while the gray color represents the threshold at which an increasing queue can be observed, which, after a prolonged period of increased delivery flow, will lead to surprising the railway siding capacity.
The unloading ramp bottleneck simulation results considering flexible delivery load planning are presented in Table 3. Increasing the share of truck deliveries ensures the daily biomass flow at the level on scenario 9. An analogous color scheme was used to indicate the acceptable delivery level. The difference related to the option of flexibility in changing mode of transport allows for an increase in deliveries by approximately 1700 m3 of biomass per day.
Table 2.
Simulation results of the queue of unloaded trains after two weeks for different flows and unloading variant (at the 25% share of biomass delivered by trucks).
Table 2.
Simulation results of the queue of unloaded trains after two weeks for different flows and unloading variant (at the 25% share of biomass delivered by trucks).
| Unloaded train | ||||||||
| Scenario No | S3 | S4 | S5 | S6 | S7 | S8 | S9 | |
| Train to unload per day | 3,33 | 3,74 | 4,16 | 4,58 | 4,99 | 5,41 | 5,83 | |
| median | ||||||||
|
Technological variant |
M1 | 0,28 | 0,92 | 2,98 | 5,96 | 9,03 | 12,03 | 15,05 |
| M2 | 0,27 | 0,67 | 2,68 | 5,48 | 8,32 | 11,31 | 14,48 | |
| M3 | 0,14 | 0,16 | 0,19 | 0,22 | 0,26 | 0,51 | 2,13 | |
| max | ||||||||
| M1 | 0,32 | 1,86 | 4,07 | 7,20 | 10,05 | 13,16 | 16,47 | |
| M2 | 0,30 | 1,83 | 3,84 | 7,13 | 10,05 | 12,91 | 16,20 | |
| M3 | 0,14 | 0,16 | 0,22 | 0,25 | 0,30 | 6,41 | 6,54 | |
Table 3.
Simulation results of the queue of unloaded trains after two weeks for different biomass flows and truck share in transport.
Table 3.
Simulation results of the queue of unloaded trains after two weeks for different biomass flows and truck share in transport.
| Scenario No/Biomass flow [m3] | |||||||
| S3 | S4 | S5 | S6 | S7 | S8 | S9 | |
| 6 647 | 7 478 | 8 309 | 9 140 | 9 971 | 10 802 | 11 632 | |
| Truck share [%] | median | ||||||
| 20 | 0,27 | 0,67 | 2,68 | 5,48 | 8,32 | 11,31 | 14,48 |
| 30 | 0,15 | 0,18 | 0,54 | 1,93 | 3,87 | 6,48 | 9,13 |
| 40 | 0,11 | 0,16 | 0,25 | 0,23 | 0,67 | 2,20 | 3,87 |
| 50 | 0,09 | 0,11 | 0,12 | 0,15 | 0,25 | 0,27 | 0,54 |
| max | |||||||
| 20 | 0,3 | 1,83 | 3,84 | 7,13 | 10,05 | 12,91 | 16,2 |
| 30 | 0,15 | 0,21 | 1,09 | 2,9 | 5,48 | 8,37 | 10,88 |
| 40 | 0,11 | 0,18 | 0,29 | 0,3 | 1,83 | 3,31 | 5,48 |
| 50 | 0,09 | 0,11 | 0,13 | 0,16 | 0,29 | 0,31 | 1,09 |
4. Discussion
The simulation model of the BSS allows to investigate various modes of deliveries with regard to known or expected constraints. The results of noise emission analysis [5] were used to check whether the BSS can provide the required tonnages of biomass in the case of forced night stoppages of train deliveries unloading. Instead, the Polaniec plant can undertake efforts to maintain unloading trains on both yards around the clock by addressing the excessive noise emission. There are available solutions to decrease the level of the noise emitted by belt conveyors [19] and to monitor the belt conveyor parameters with the help of additional gauges or dedicated systems for on-line automatic inspection [20,21,22].
Night stoppages of the BSS would also have a positive consequence as all elements of the machinery equipment would need to work at a higher capacity during daily hours which raises their energy efficiency [23,24].
The assumed proportion of various types of biomass (panel “Biomass Stream in Delivery” on Figure 3) were taken from the historical data but the large share of the least energetic wood chips generates the demand for the biggest values of biomass volumes that need to be supplied to the units. If these chips are replaced with the more energetic biofuel (agriculture, wood pellets) then more electric energy could be generated from the same biomass volumes (compare the Table 1).
5. Conclusions
The article presents the results of a simulation analysis of the efficiency of the biomass transport system in a power plant located in an urbanized environment, taking into account potential shutdowns of facilities generating too much noise at night. The use of digital, spatial simulation models of a complex, cyclical and continuous transport system to control its operation in conditions of constraints is an effective method of solving environmental conflicts at the design stage of the extension of industrial installations in urbanized areas.
With the use of the dedicated simulation model of the biofuel supply system (BSS) in the Polaniec plant, the alternative modes of its work (with forced night stoppages of the selected part of the BSS) were analyzed. The simulation results showed the shortages of the BSS with these circumstances which should be further analyzed.
Depending on the actual needs of the production of electric energy by the Polaniec plant the verified scenarios (Table 1) either can fulfill the plant’s requirements of the biomass volumes or the increased level of required biomass volumes need to be addressed by additional technical solutions mentioned in the discussion.
Author Contributions
Conceptualization, Witold Kawalec and Paweł Szczeszek; Funding acquisition, Paweł Szczeszek; Investigation, Andrzej Jastrząb and Zbigniew Krysa; Methodology, Andrzej Jastrząb, Witold Kawalec, Zbigniew Krysa and Paweł Szczeszek; Resources, Andrzej Jastrząb; Software, Zbigniew Krysa; Validation, Paweł Szczeszek; Visualization, Witold Kawalec and Zbigniew Krysa; Writing – original draft, Witold Kawalec, Zbigniew Krysa and Paweł Szczeszek; Writing – review & editing, Witold Kawalec. All authors have read and agreed to the published version of the manuscript.
Funding
This research was partly funded by Enea Polaniec Power Plant S.A., “Study on the development of a biomass supply system at Enea Polaniec Power Plant S.A.”
Data Availability Statement
The additional detailed results of simulations are attached.
Conflicts of Interest
The authors declare no conflict of interest. The funders had no role in the design of the study; in the collection, analyses, or interpretation of data; in the writing of the manuscript or in the decision to publish the results except of the general decision of the disclosure of the information on the power plant Polaniec available in the paper.
References
- Jaeger, J. These 10 Countries Are Phasing Out Coal the Fastest, Report from World Resources Institute, November 30, 2023. https://www.wri.org/insights/countries-phasing-out-coal-power-fastest.
- Study on the development of a biomass supply system at Enea Polaniec Power Plant S.A., Department of Mining, Wrocław University of Science and Technology, consultancy report (in Polish, not published, classified), Wroclaw 2022.
- Nouicer, A.; Meeus, L. The EU Clean Energy Package (2019 ed.), European University Institute. [CrossRef]
- Lilić, N. et al., Environmental Noise Management in the Area of Opencast Mines, Tehnika – Rudarstvo, Geologija i Metalurgija 68 (2017) 1. [CrossRef]
- Inventory of noise sources and analysis of the acoustic impact of ENEA EP on the environment, taking into account the planned investment " the Development of a biomass supply system at Enea Elektrownia Połaniec S.A.", Energopomiar S.A., consultancy report (in Polish, not published, classified), Gliwice, 2022.
- Directive 2010/75/Eu Of The European Parliament And Of The Council of 24 November 2010 on industrial emissions (integrated pollution prevention and control), Official Journal of the European Union, L334/17.
- Commission Implementing Decision (Eu) 2017/1442 of 31 July 2017 establishing best available techniques (BAT) conclusions, under Directive 2010/75/EU of the European Parliament and of the Council, for large combustion plants, Official Journal of the European Union, L212/1.
- Directive 2012/27/EU of the European Parliament and of the Council of 25 October 2012 on energy efficiency, amending Directives 2009/125/EC and 2010/30/EU and repealing Directives 2004/8/EC and 2006/32/EC Text with EEA relevance.
- Directive (EU) 2018/ 2002 of the European Parliament and of the Council - of 11 December 2018 - amending Directive 2012/27/ EU on energy efficiency.
- Directive 2009/125/EC of the European Parliament and of the Council of 21 October 2009 establishing a framework for the setting of ecodesign requirements for energy-related products (recast) (Text with EEA relevance).
- Zahraee, S. M.; Golroudbary, S. R.; Shiwakoti, N.; Stasinopoulos, P.; Kraslawski, A. Economic and environmental assessment of biomass supply chain for design of transportation modes: Strategic and tactical decisions point of view. Procedia CIRP, 2021, 100.
- Mobini, M.; Sowlati, T.; Sokhansanj, S.; Forest biomass supply logistics for a power plant using the discrete-event simulation approach. Applied Energy 2011, vol. 88, no. 4,. [CrossRef]
- Pinho, T. M., Coelho, J. P., Moreira, A. P., Bonaventura-Cunha, J. Modelling a biomass supply chain through discrete-event simulation. IFAC-PapersOnLine 2016, 49(2). [CrossRef]
- Windisch, J., Väätäinen, K., Anttila, P., Nivala, M., Laitila, J., Asikainen, A., Sikanen, L., Discrete-event simulation of an information-based raw material allocation process for increasing the efficiency of an energy wood supply chain. Applied Energy, vol. 149, 2015. [CrossRef]
- Bui-Duy, L., Le, L.T, Vu-Thi-Minh, N., Hoang-Huong, G., Bui-Thi-Thanh N., Nguyen, P. N., Economic and environmental analysis of biomass pellet supply chain using simulation-based approach. Asia Pacific Management Review 2023, vol. 28, no. 4. [CrossRef]
- Bochniak, A.; Stoma, M. Estimating the Optimal Location for the Storage of Pellet Surplus. Energies 2021, 14, 6657. [Google Scholar] [CrossRef]
- Boukherroub, T.; LeBel, L.; Lemieux, S. An integrated wood pellet supply chain development: Selecting among feedstock sources and a range of operating scales. Applied Energy 2017, 198. [Google Scholar] [CrossRef]
- Krysa, Z.; Bodziony, P.; Patyk, M. Discrete Simulations in Analyzing the Effectiveness of Raw Materials Transportation during Extraction of Low-Quality Deposits. Energies 2021, 14, 5884. [Google Scholar] [CrossRef]
- Morley D., M. Lu; S. AbouRizk, Utilizing simulation derived quantitative formulas for accurate excavator hauler fleet selection, 2013 Winter Simulations Conference (WSC), Washington, DC, USA, 2013, pp. 3018-3029. [CrossRef]
- Attajer, A. et al. Benchmarking Simulation Software Capabilities Against Distributed Control Requirements: FlexSim Vs AnyLogic. Service Oriented, Holonic and Multi-Agent Manufacturing Systems for Industry of the Future, Proceedings of SOHOMA 2020, Springer, 2021, 9783030693732. [CrossRef]
- Stanci, A.C.; Tataru, D.; Stanci, A. Attenuation of Noise Pollution Produced by Band Conveyors. Int. Journal of Emerging Engineering Research and Technology 2015, 3(1), 45–50. [Google Scholar]
- Schütz, D. L., Risk Control Services: Special Hazard Belt Conveyors & Related Equipment, SCOR The Art & Science of Risk, August 2023.
- Szrek, J.; Jakubiak, J.; Zimroz, R. , A Mobile Robot-Based System for Automatic Inspection of Belt Conveyors in Mining Industry. Energies 2022, 15, 327. [Google Scholar] [CrossRef]
- Alharbi, F. Luo, S., A Review of Fault Detecting Devices for Belt Conveyor Idlers, Journal of Mechanical Engineering Science and Technology, Vol. 8, No. 1, July 2024, pp. 39-53. [CrossRef]
Figure 1.
Perspective view on the 3-D conceptual model of the planned warehouses (transparent light brown covers), conveyors (lines of green – existing, blue -planned and violet - optional) and silos (vertical, tubular red solids) forming altogether the high capacity biomass handling and feeding system in the Polaniec plant [2].
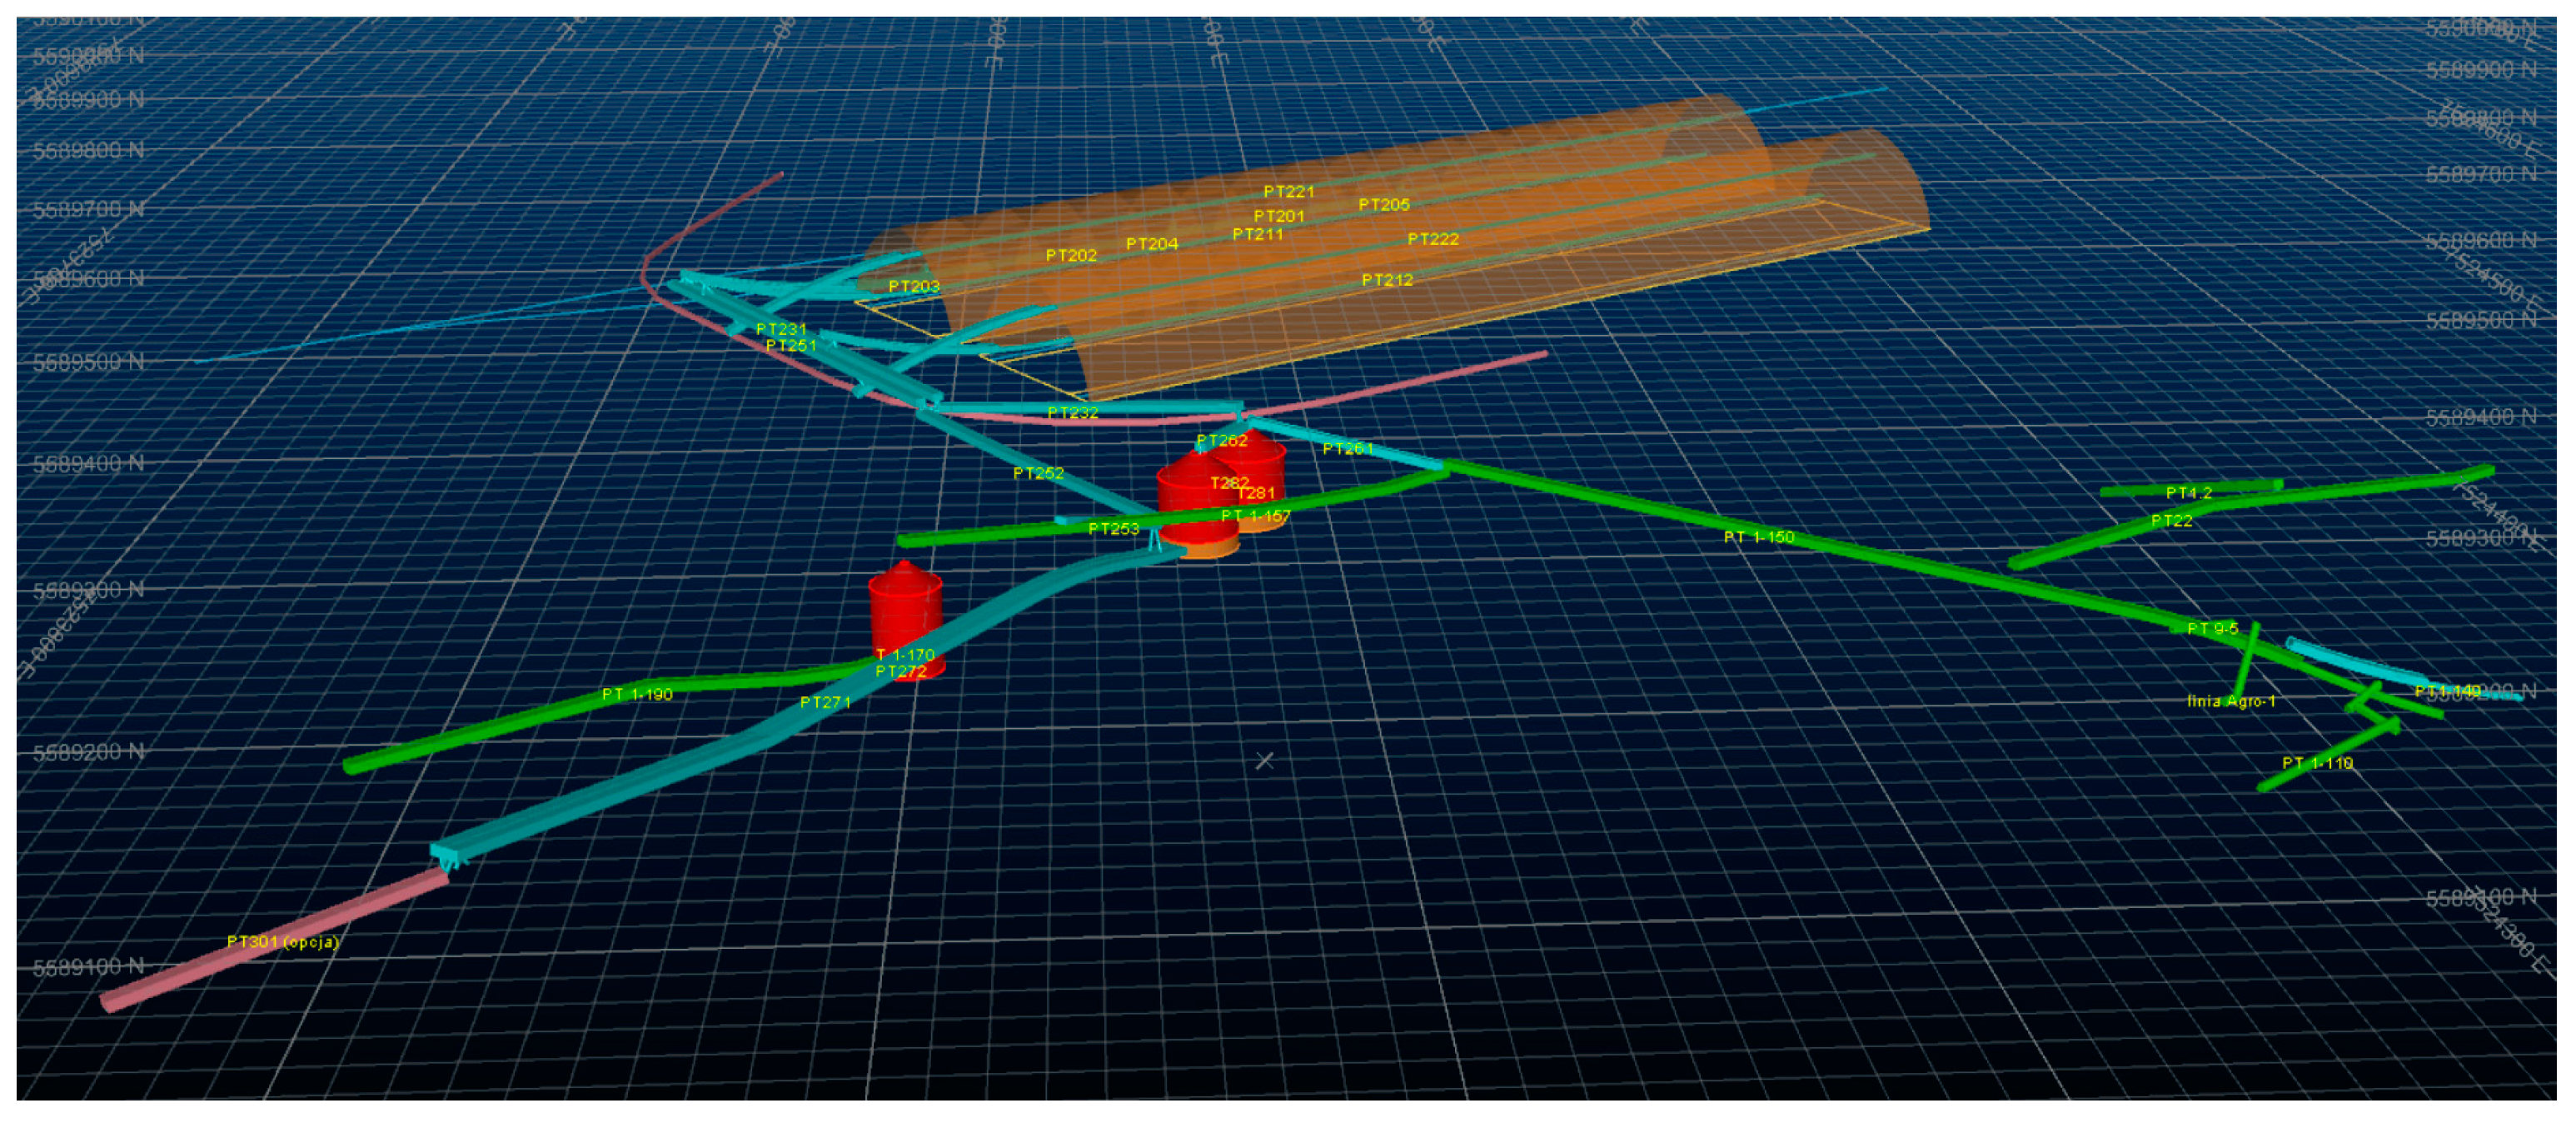
Figure 2.
Perspective view on the model of transportation and storage system in Polaniec power plant (FlexSim).
Figure 2.
Perspective view on the model of transportation and storage system in Polaniec power plant (FlexSim).
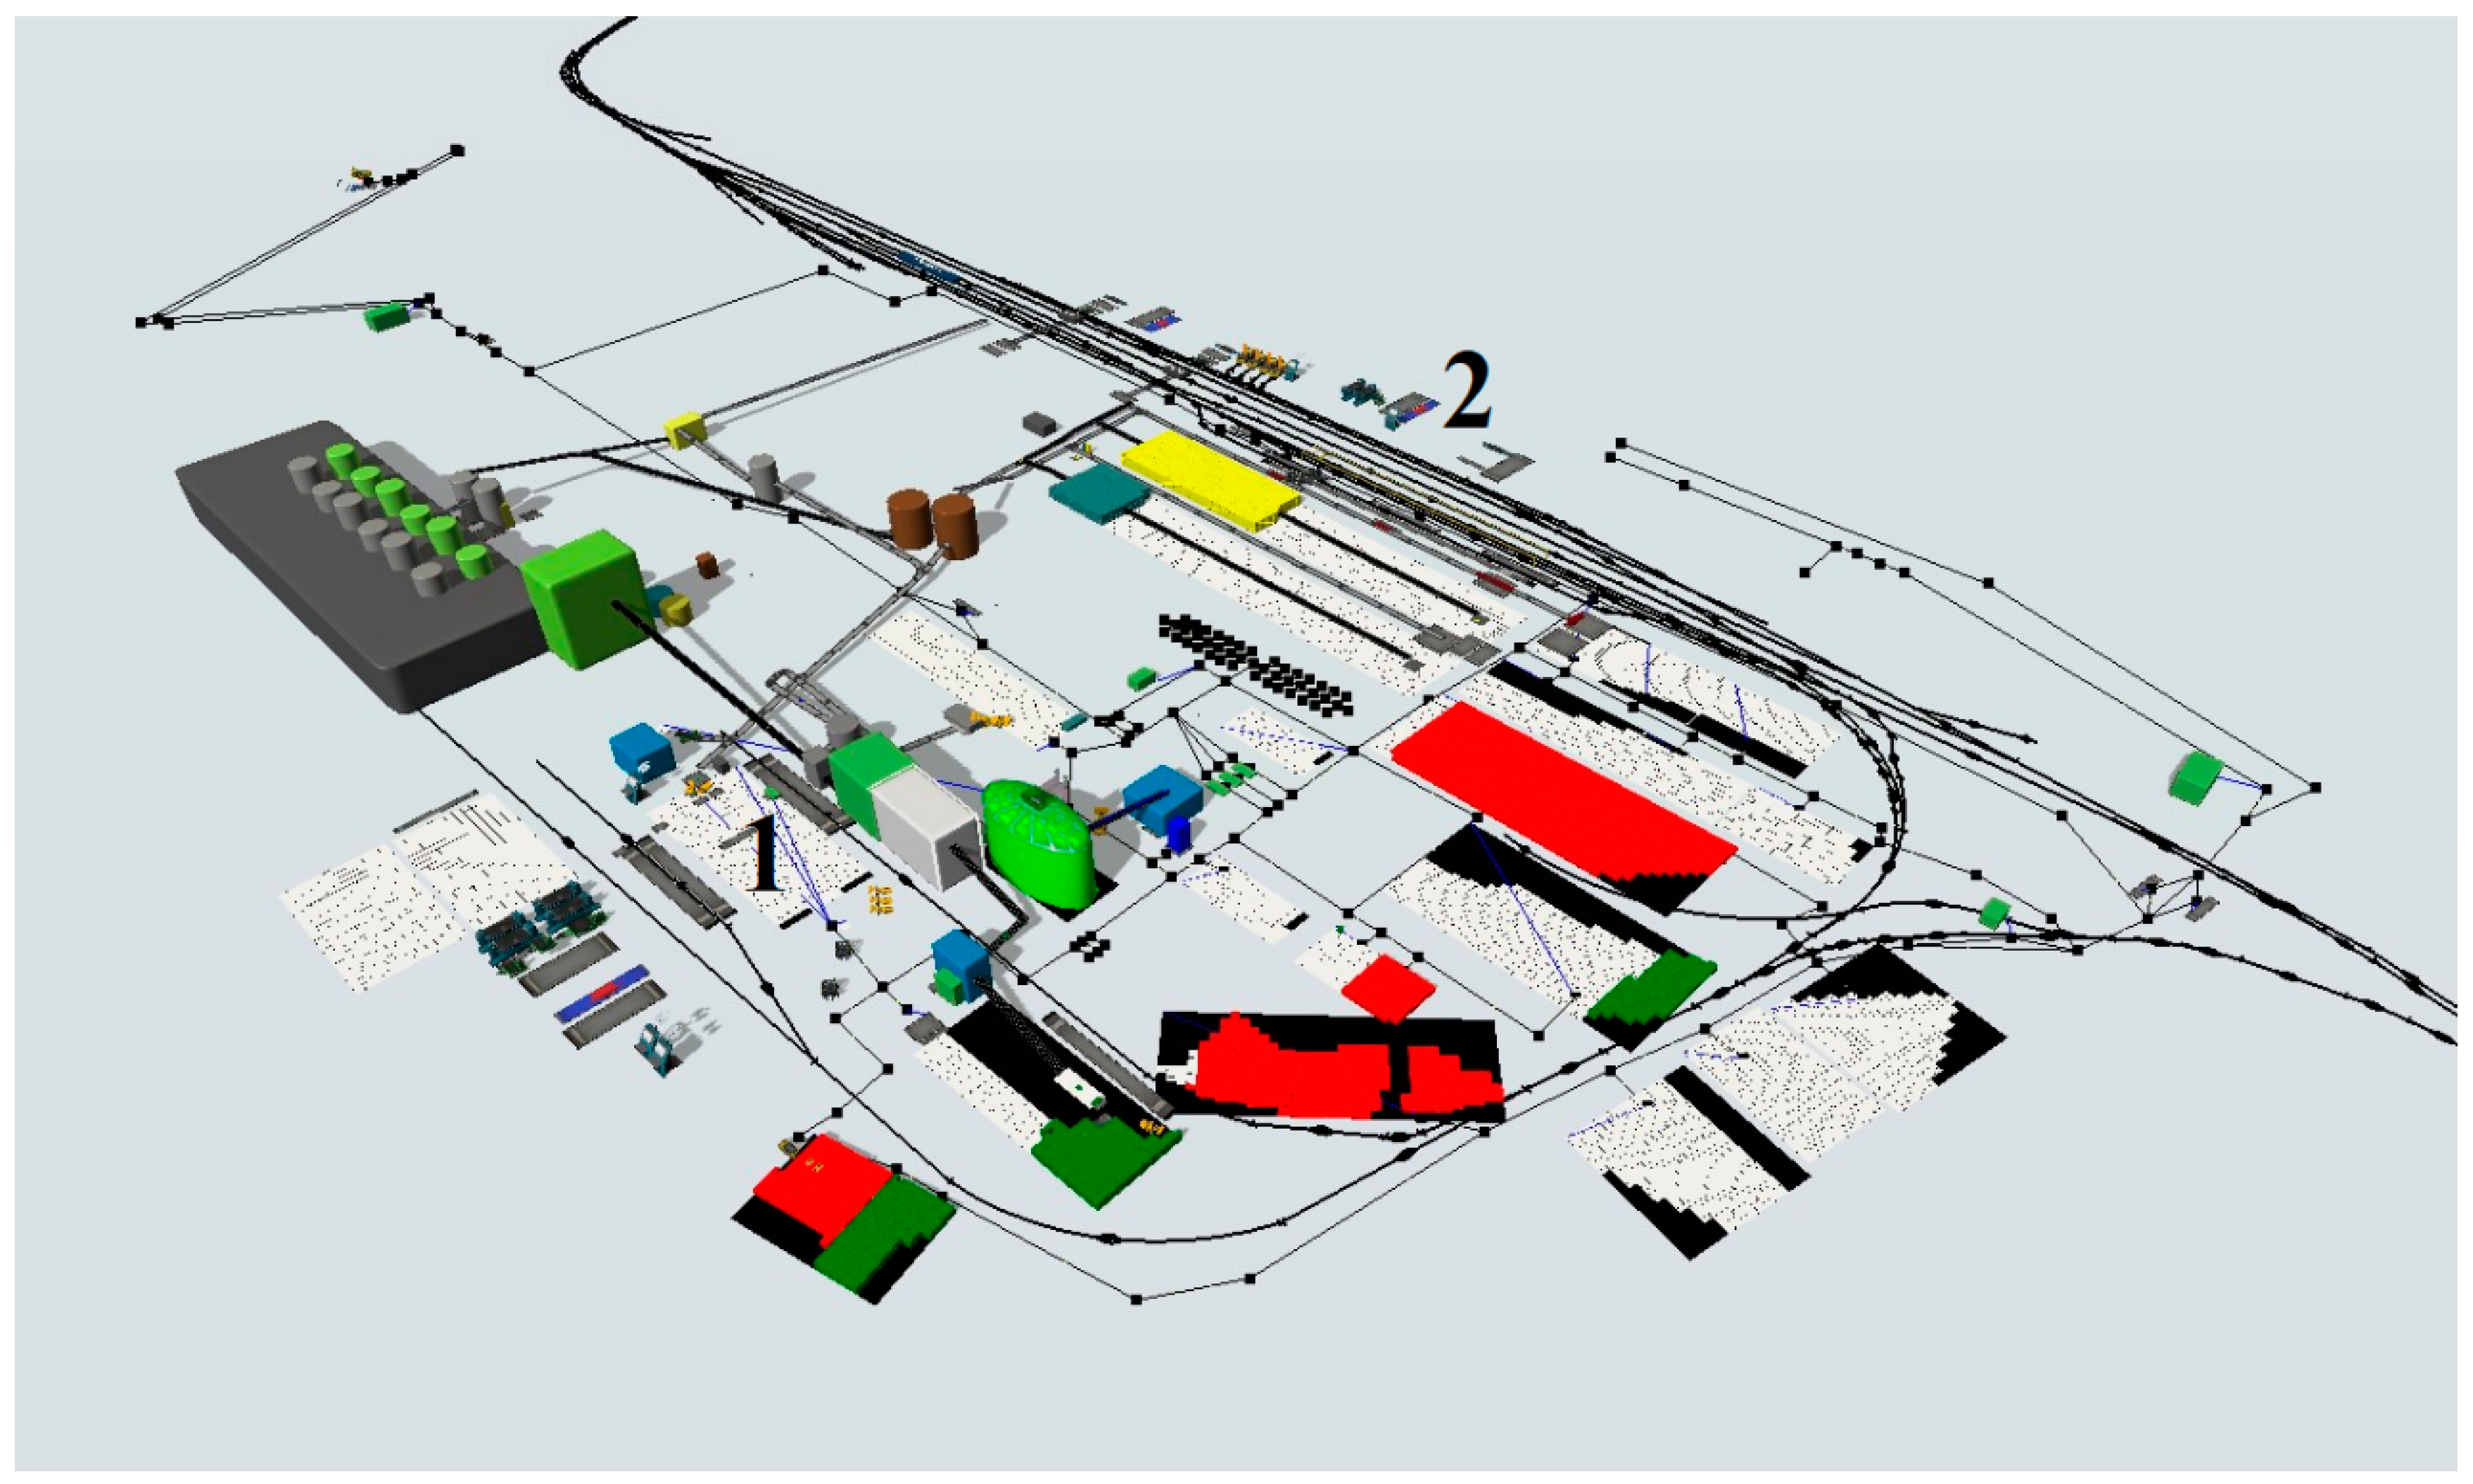
Figure 3.
Model control panel: biomass streams and calculating the quantity of rail and truck vehicles.
Figure 3.
Model control panel: biomass streams and calculating the quantity of rail and truck vehicles.
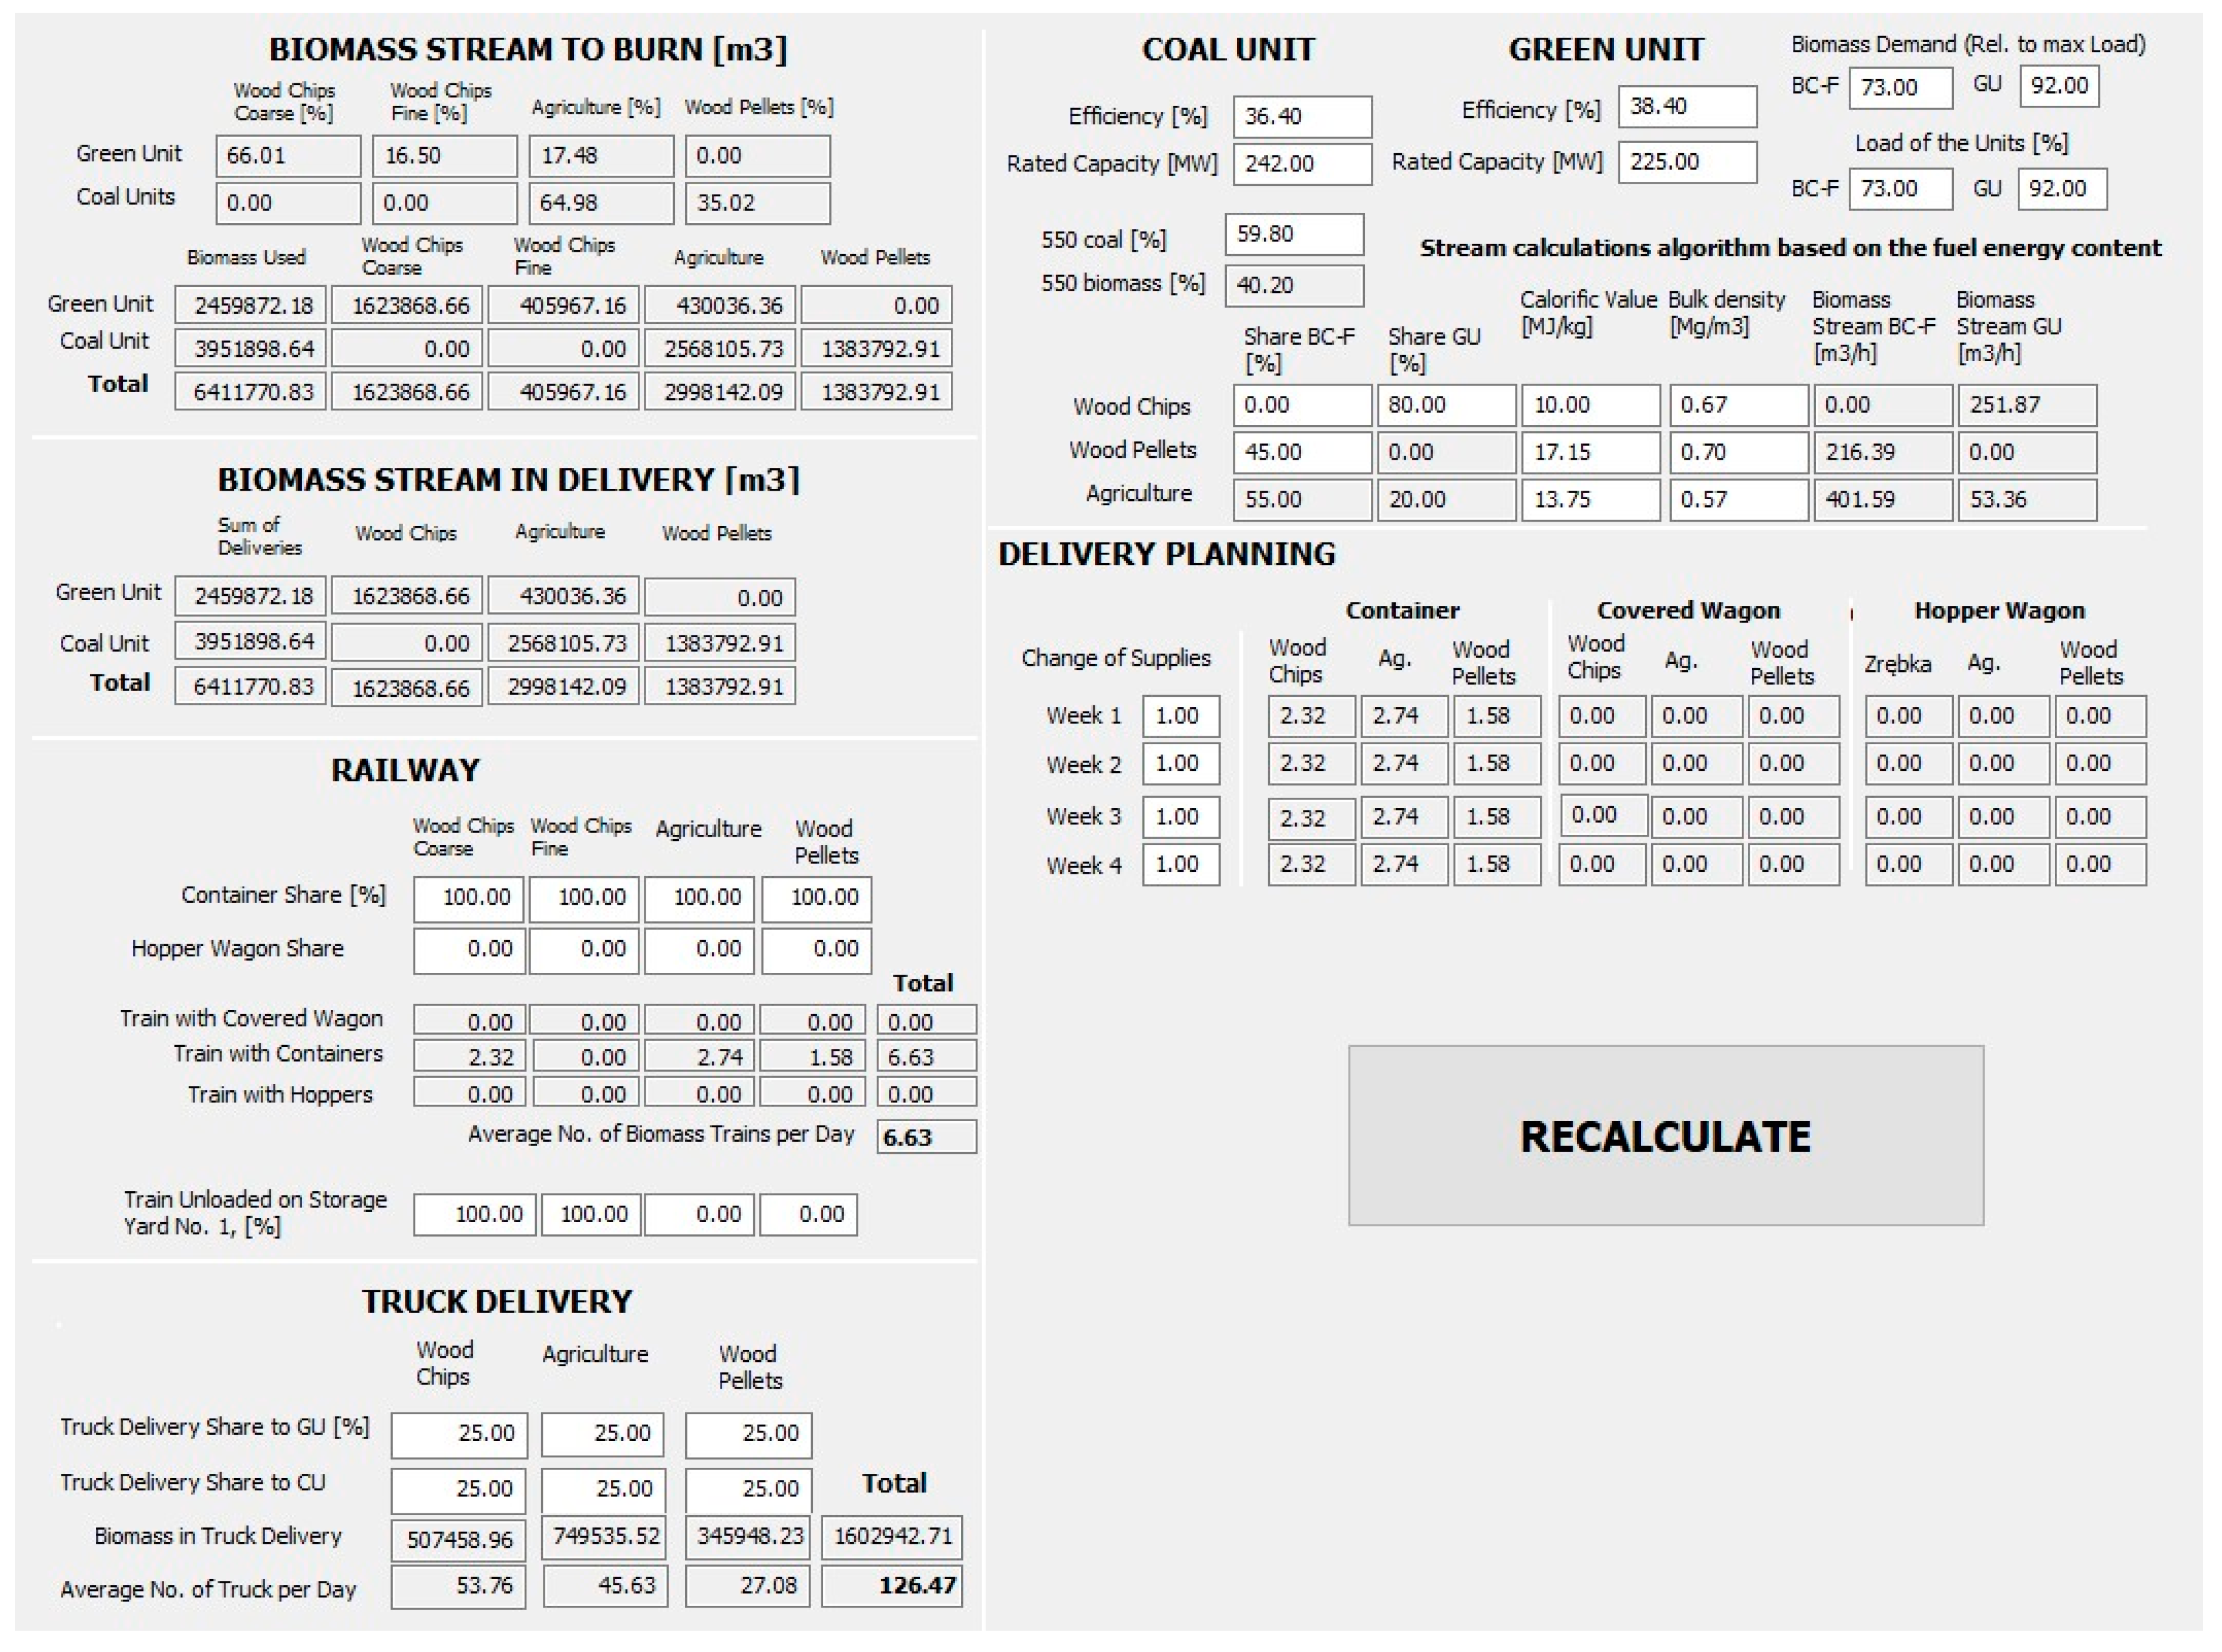
Figure 4.
The value of the Lambda parameter for subsequent hours and days of the week in truck deliveries for different type of cargo.
Figure 4.
The value of the Lambda parameter for subsequent hours and days of the week in truck deliveries for different type of cargo.
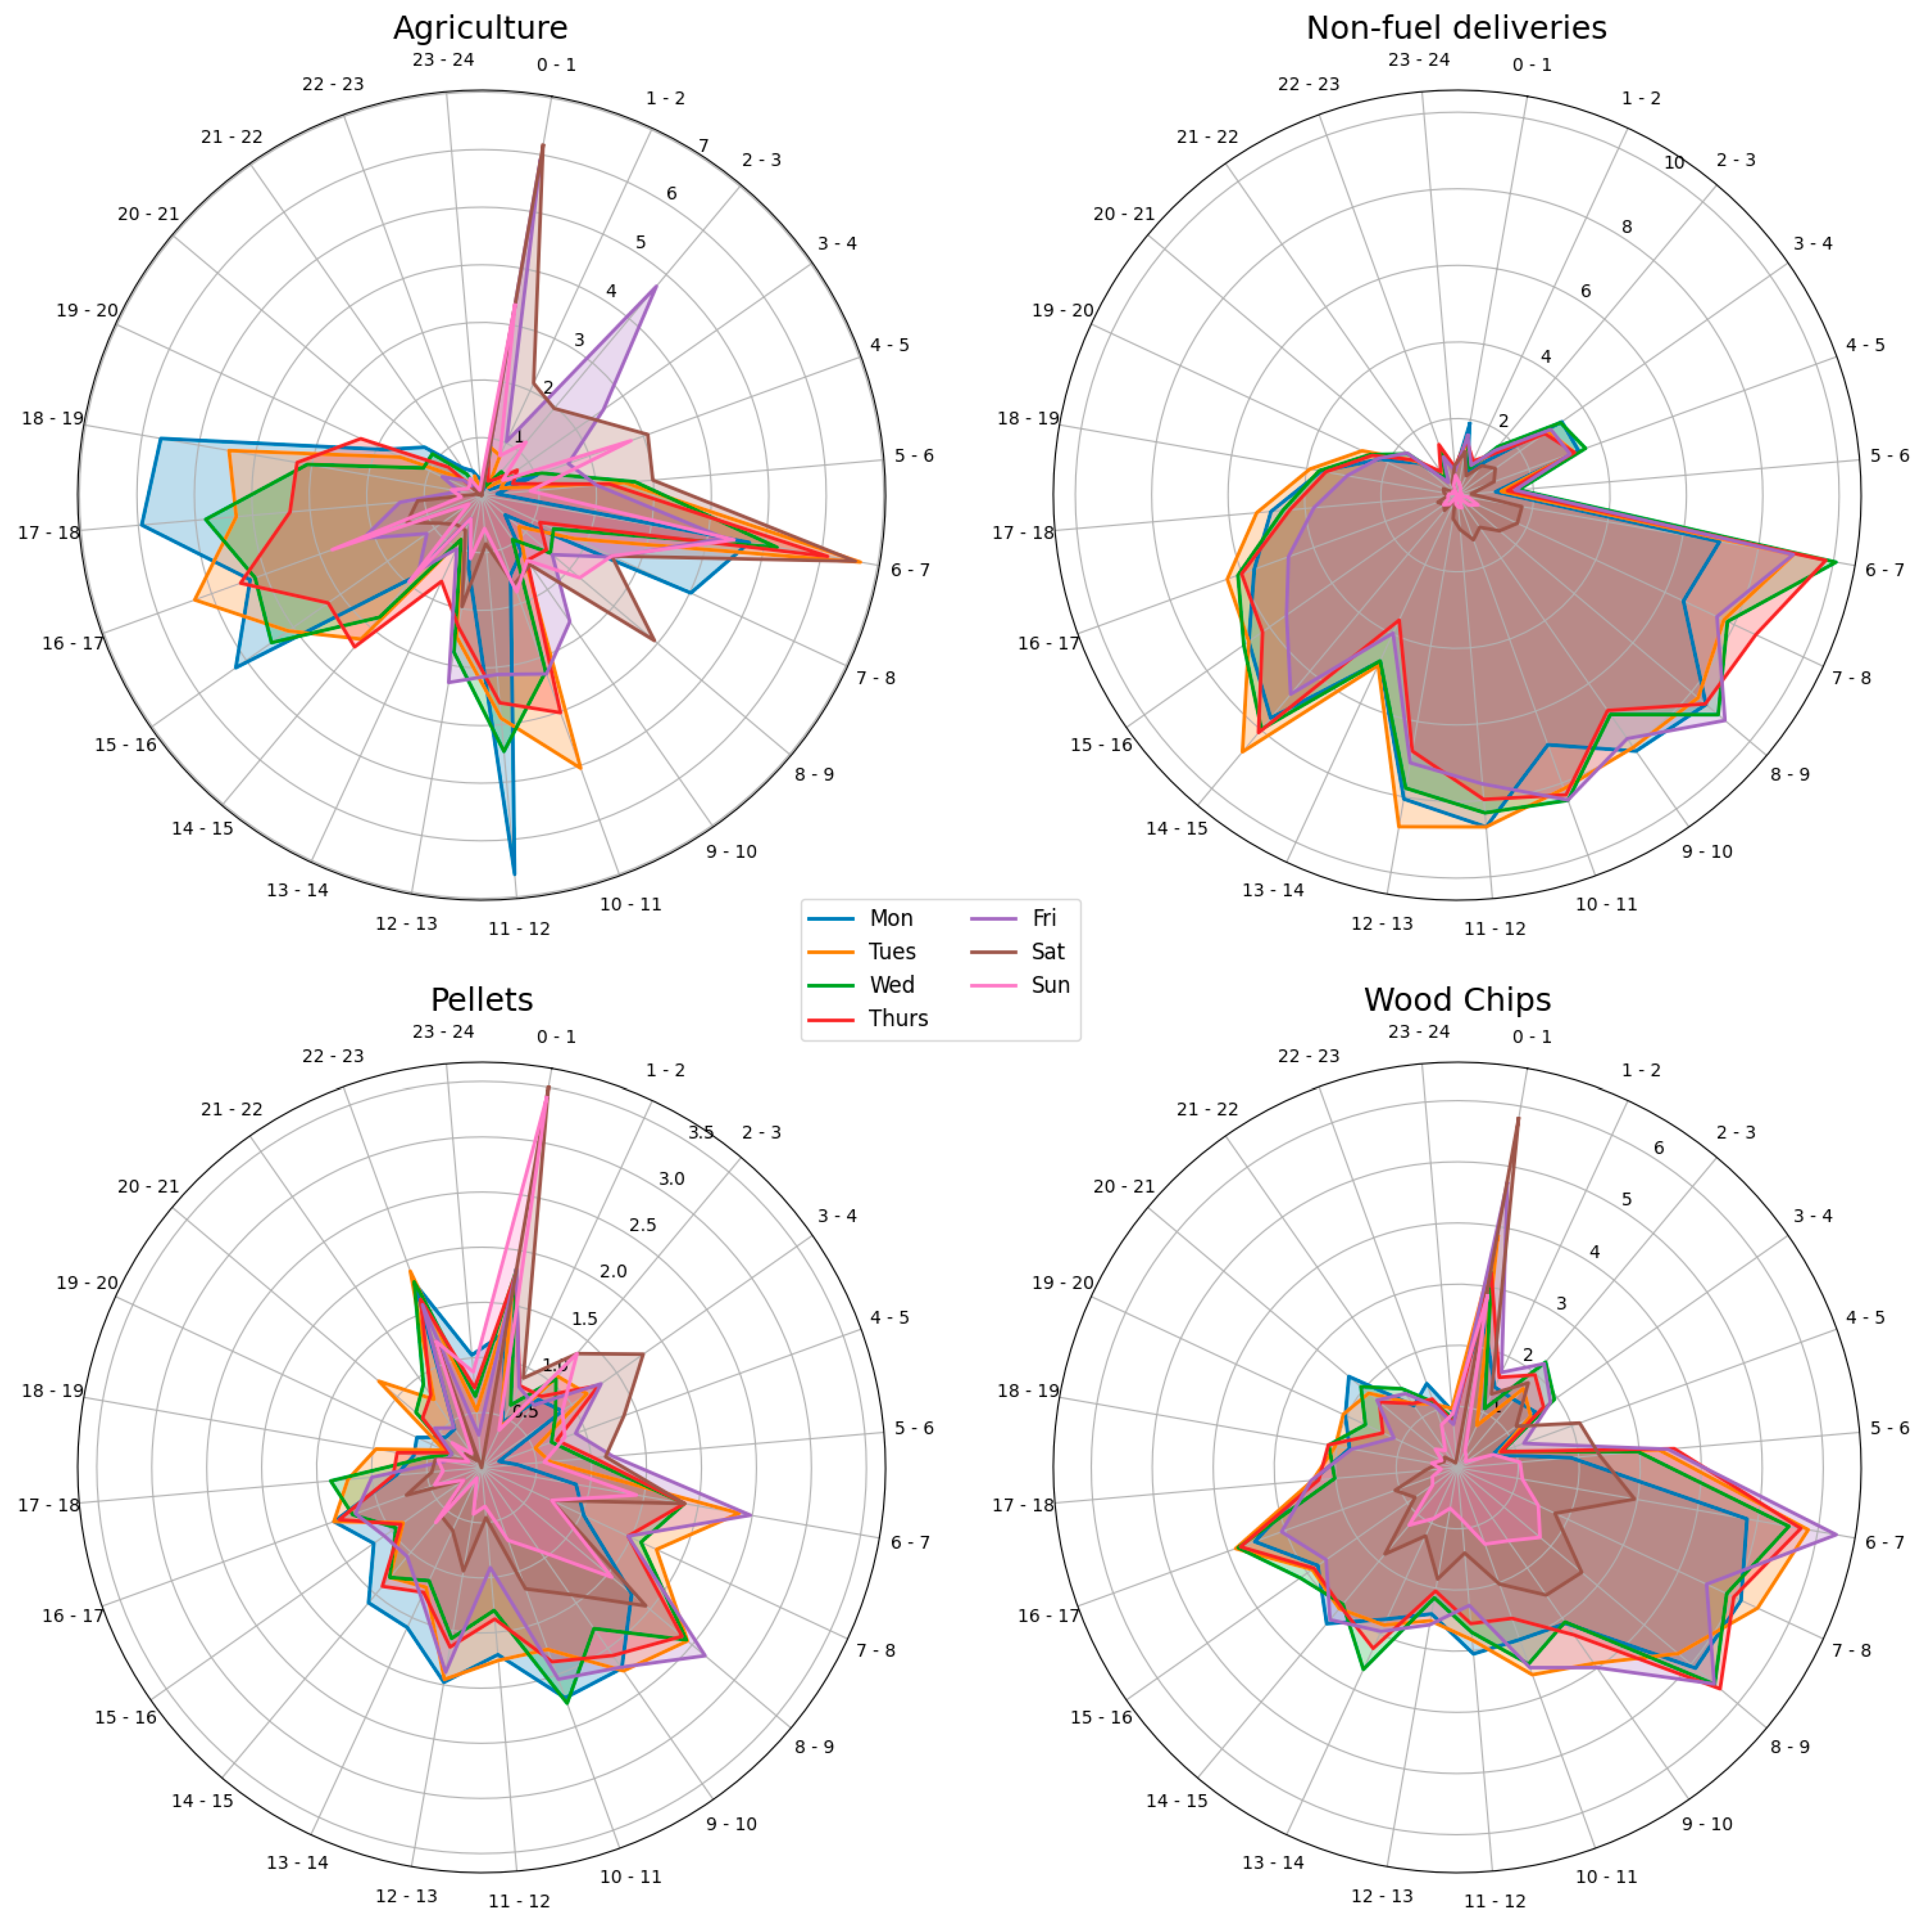
Figure 5.
The view on modelled operation of the unloading system at the Northern Ramp (see: area 2 on the Figure 2).
Figure 5.
The view on modelled operation of the unloading system at the Northern Ramp (see: area 2 on the Figure 2).
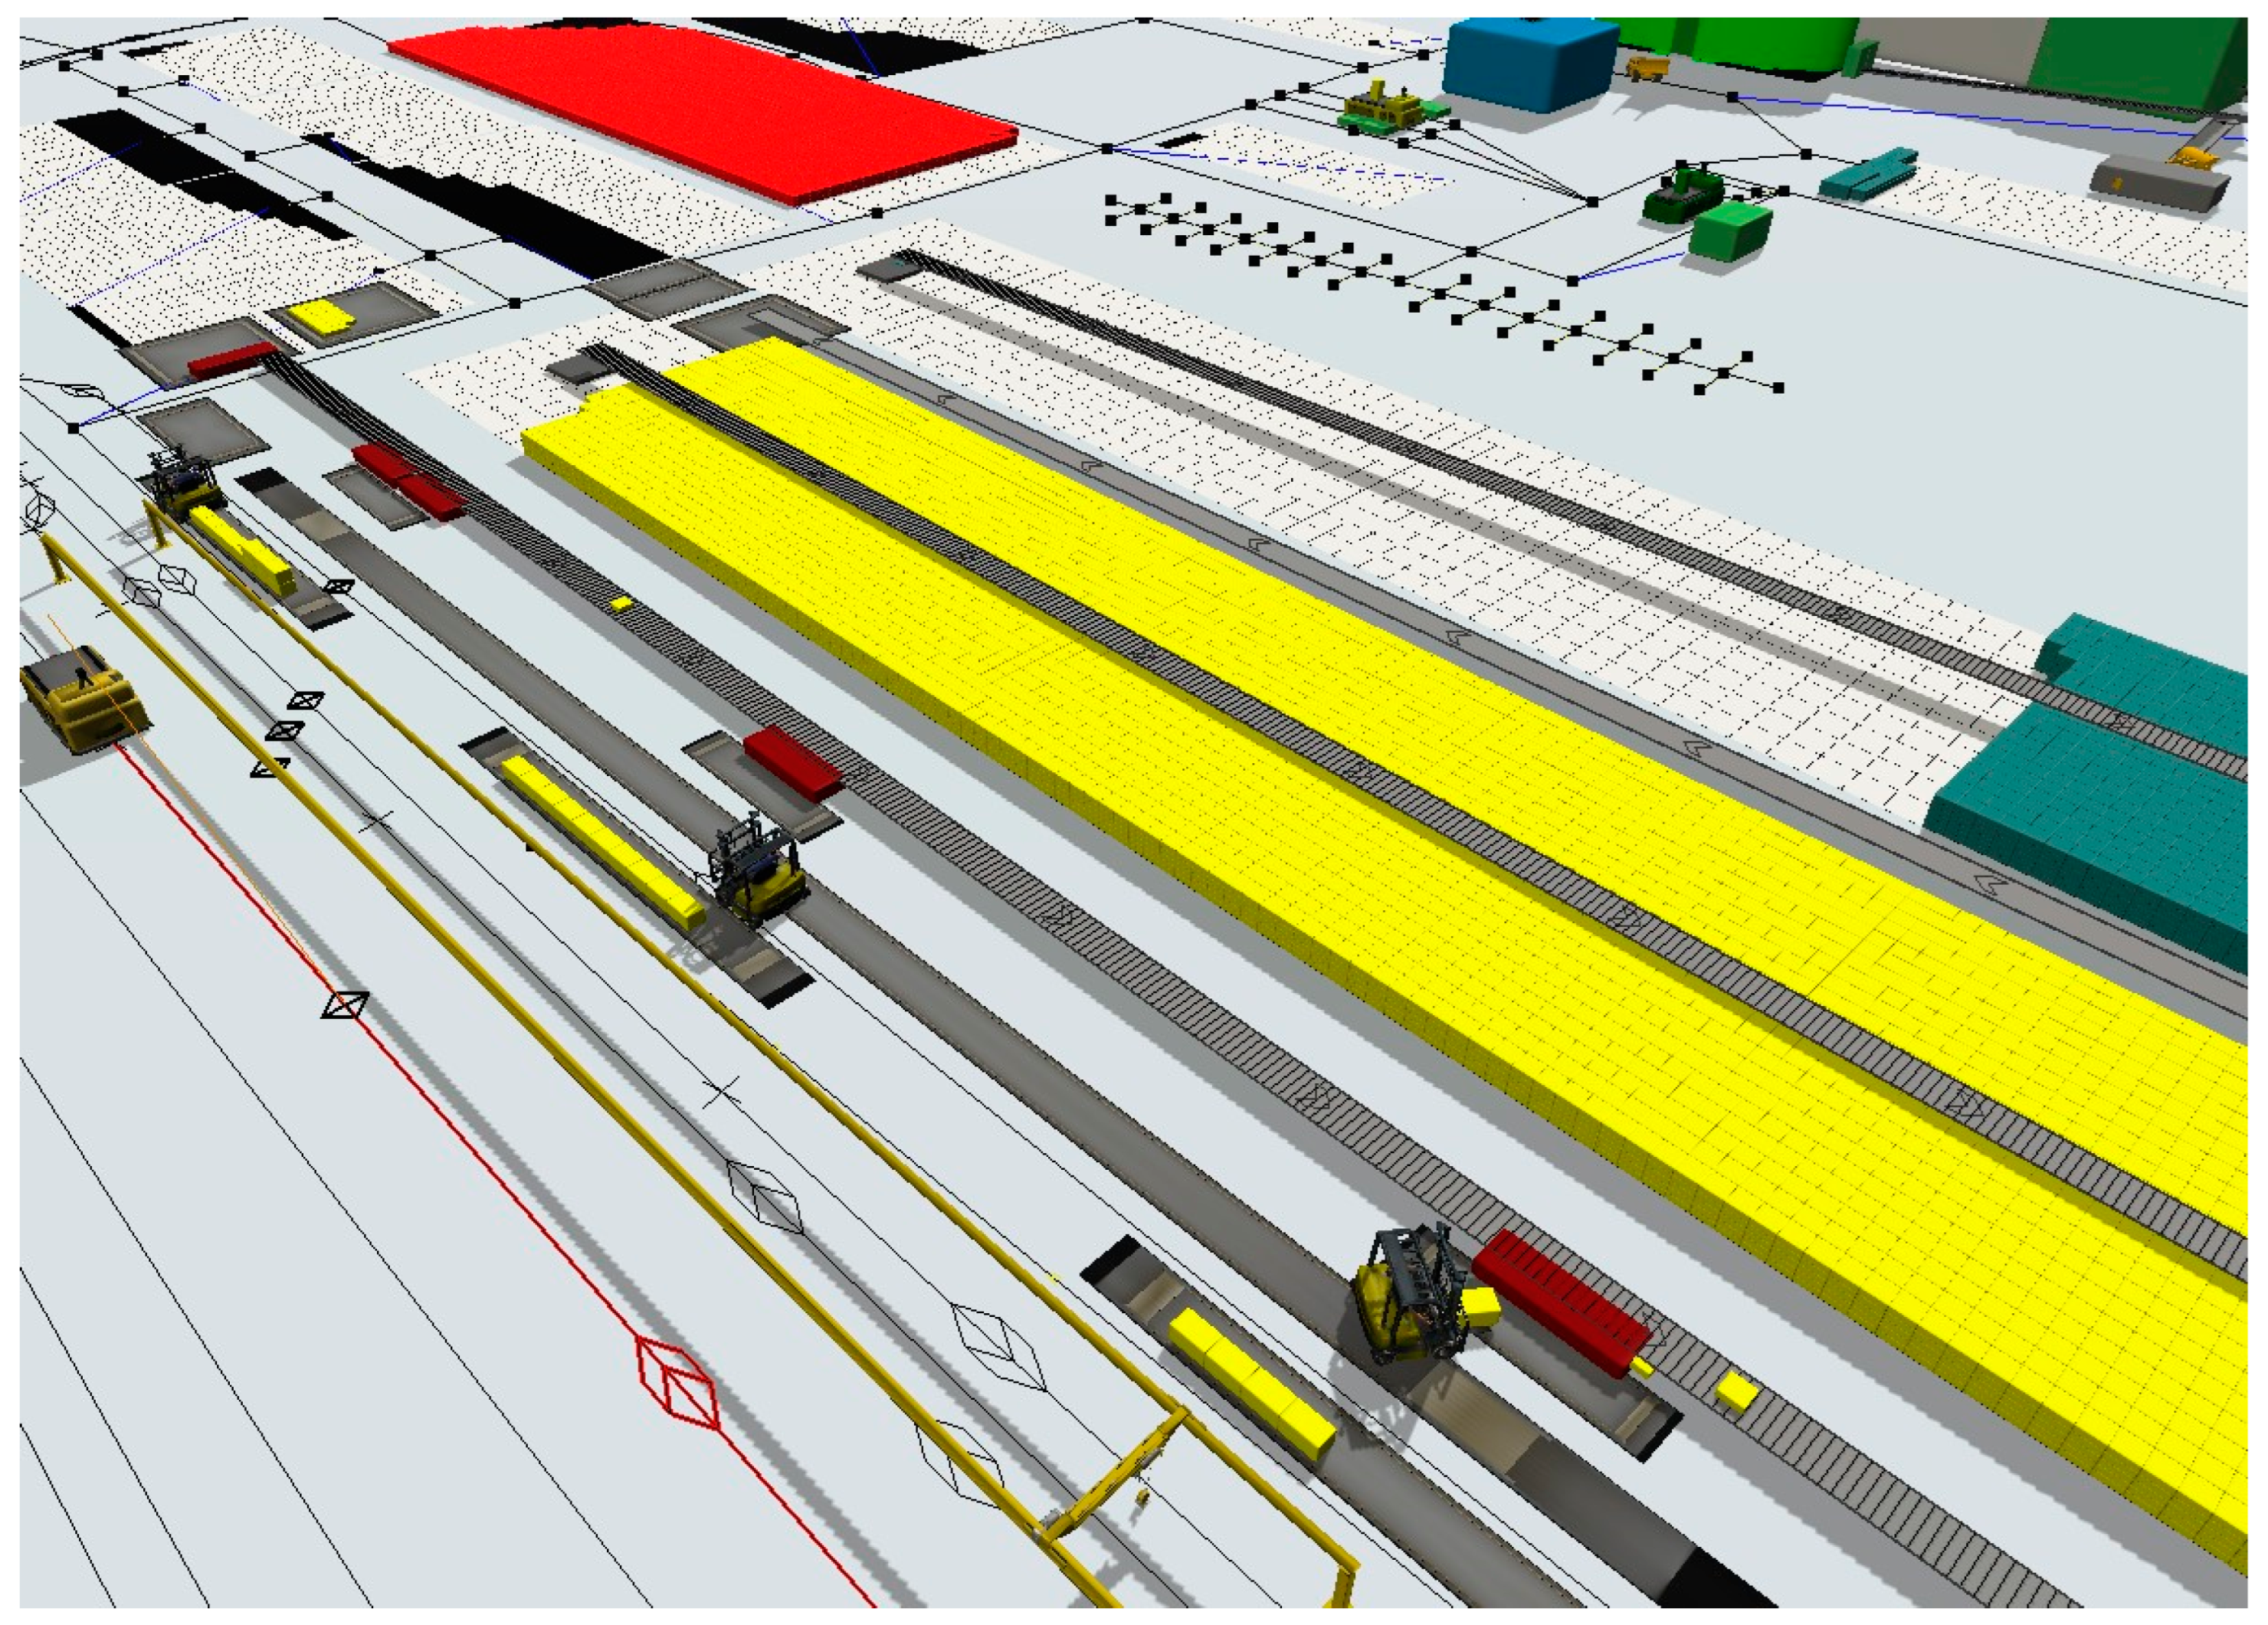
Figure 6.
Number of unloaded biomass freight wagons for three considered operations mode.
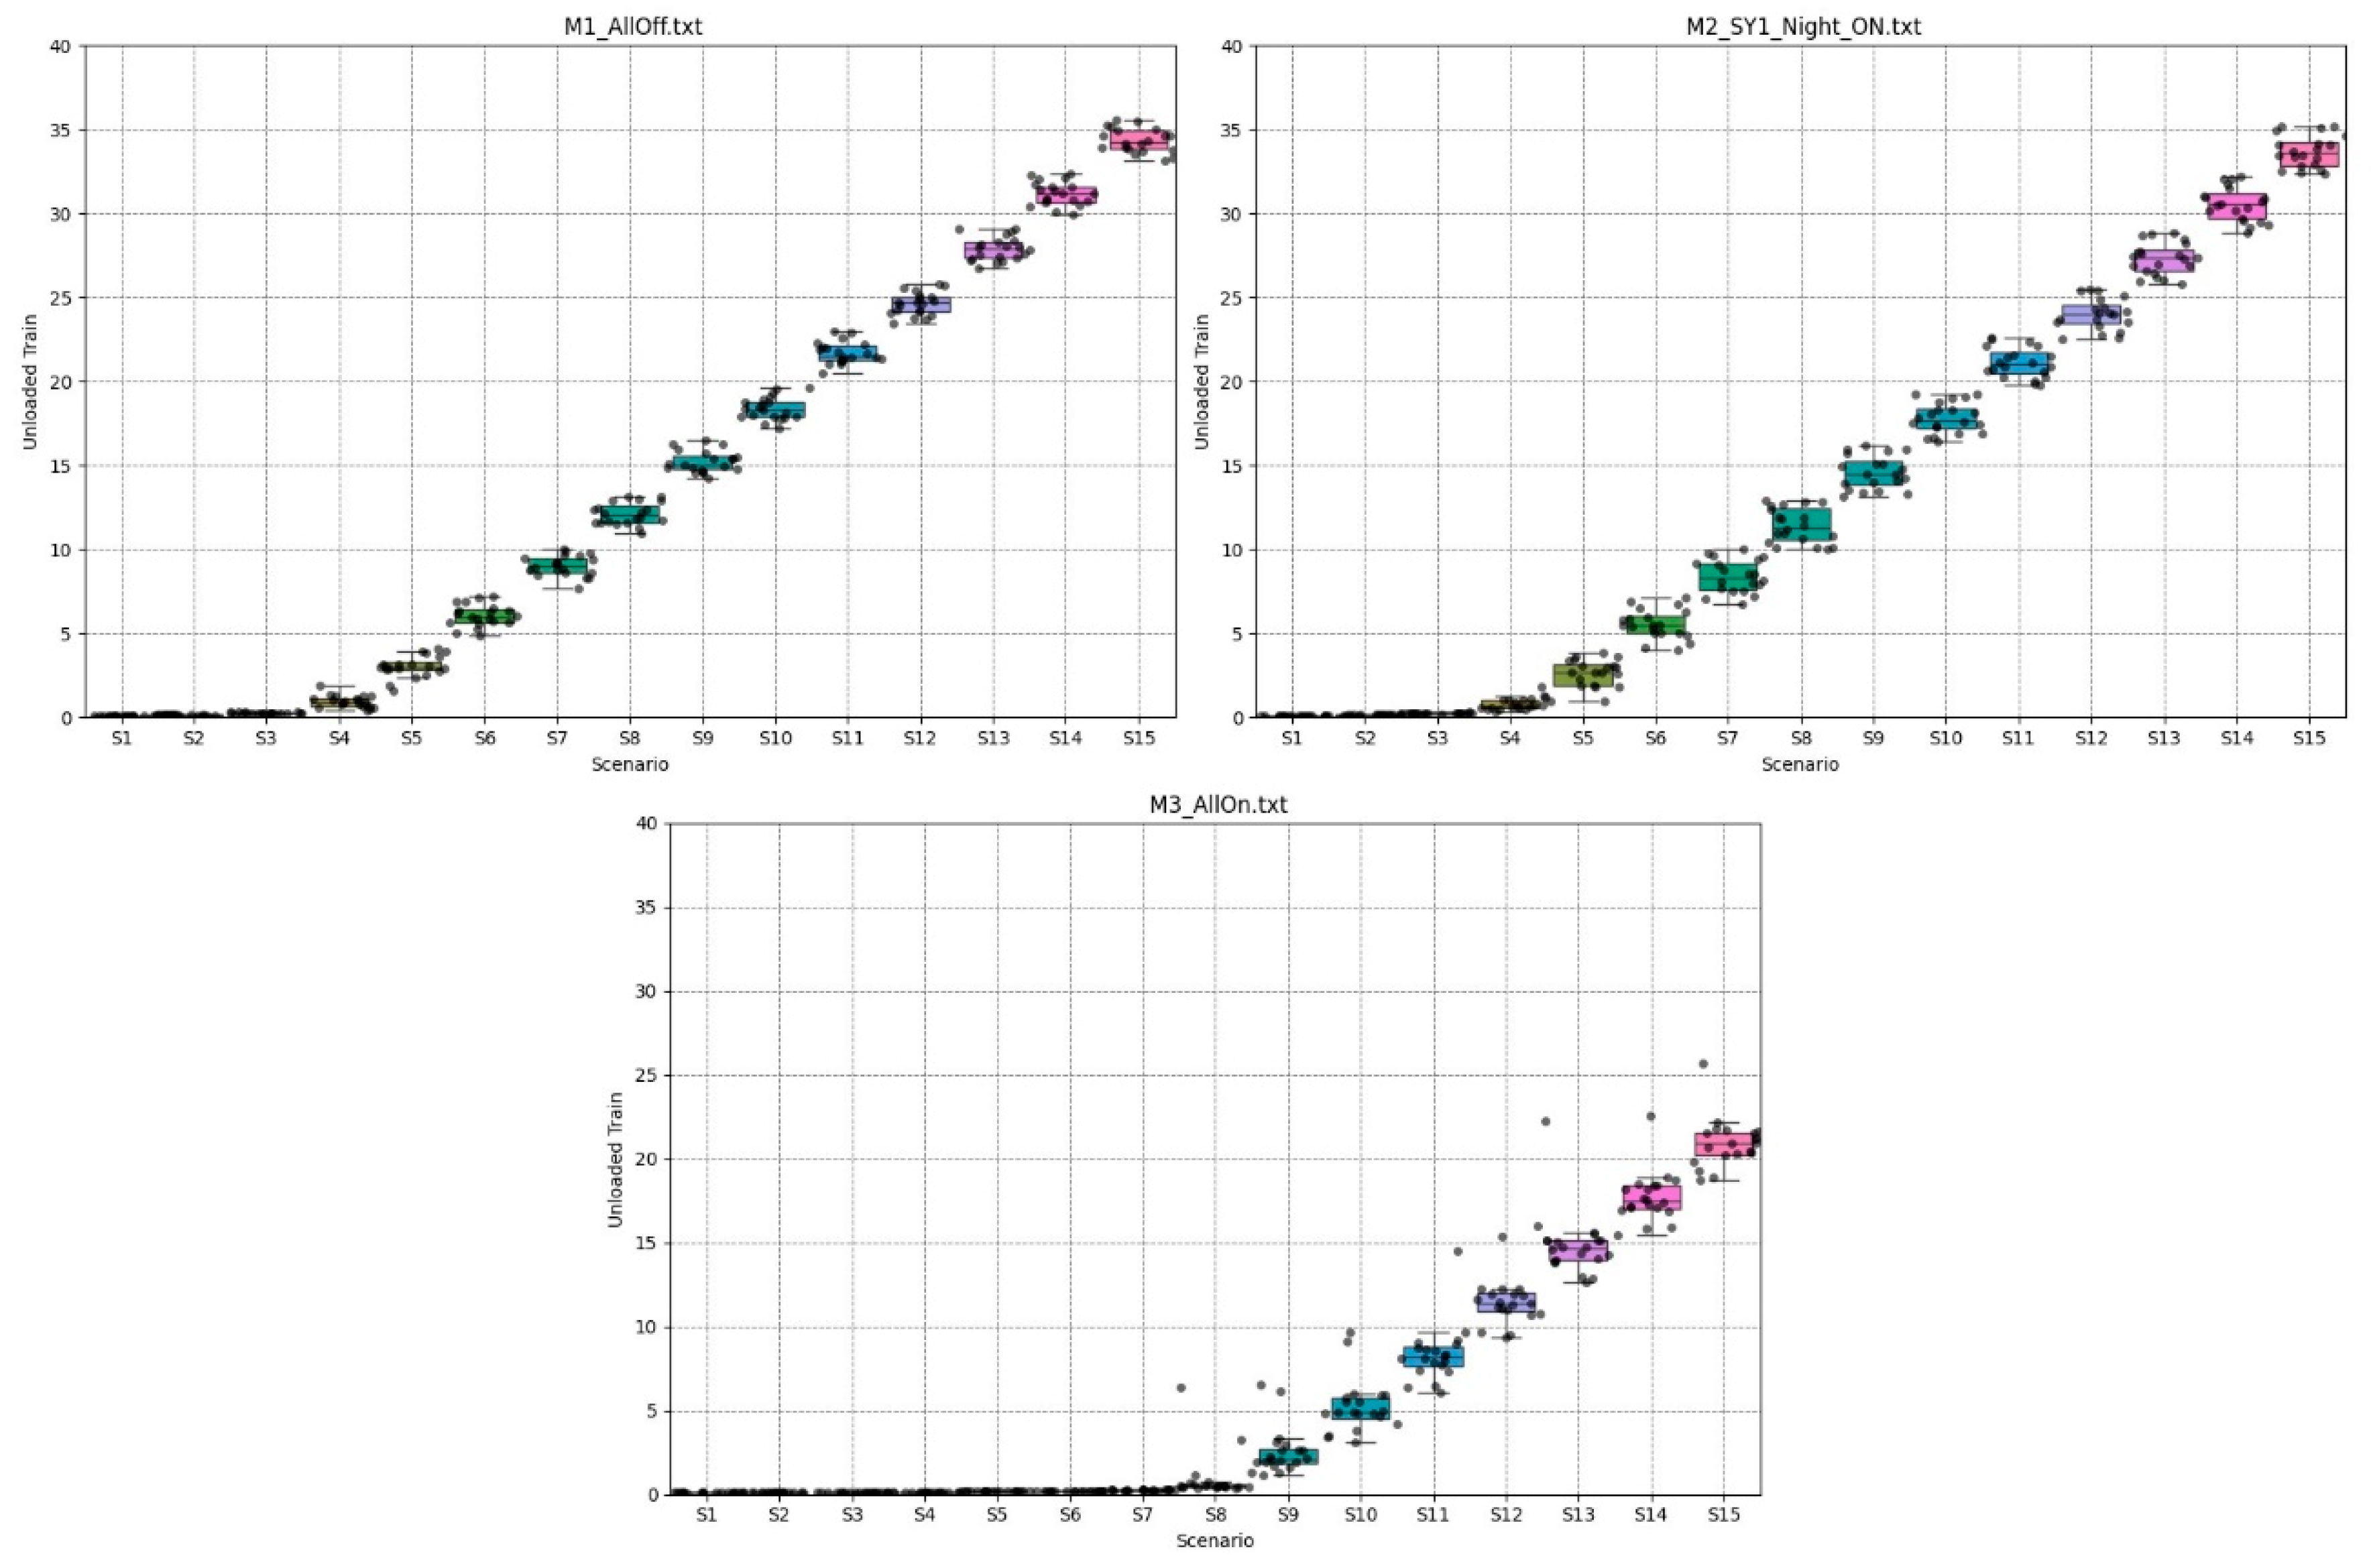
Figure 7.
Workload of Kalmars for a scenario ensuring biomass unloading with the nighttime shift disabled at the northern ramp.
Figure 7.
Workload of Kalmars for a scenario ensuring biomass unloading with the nighttime shift disabled at the northern ramp.
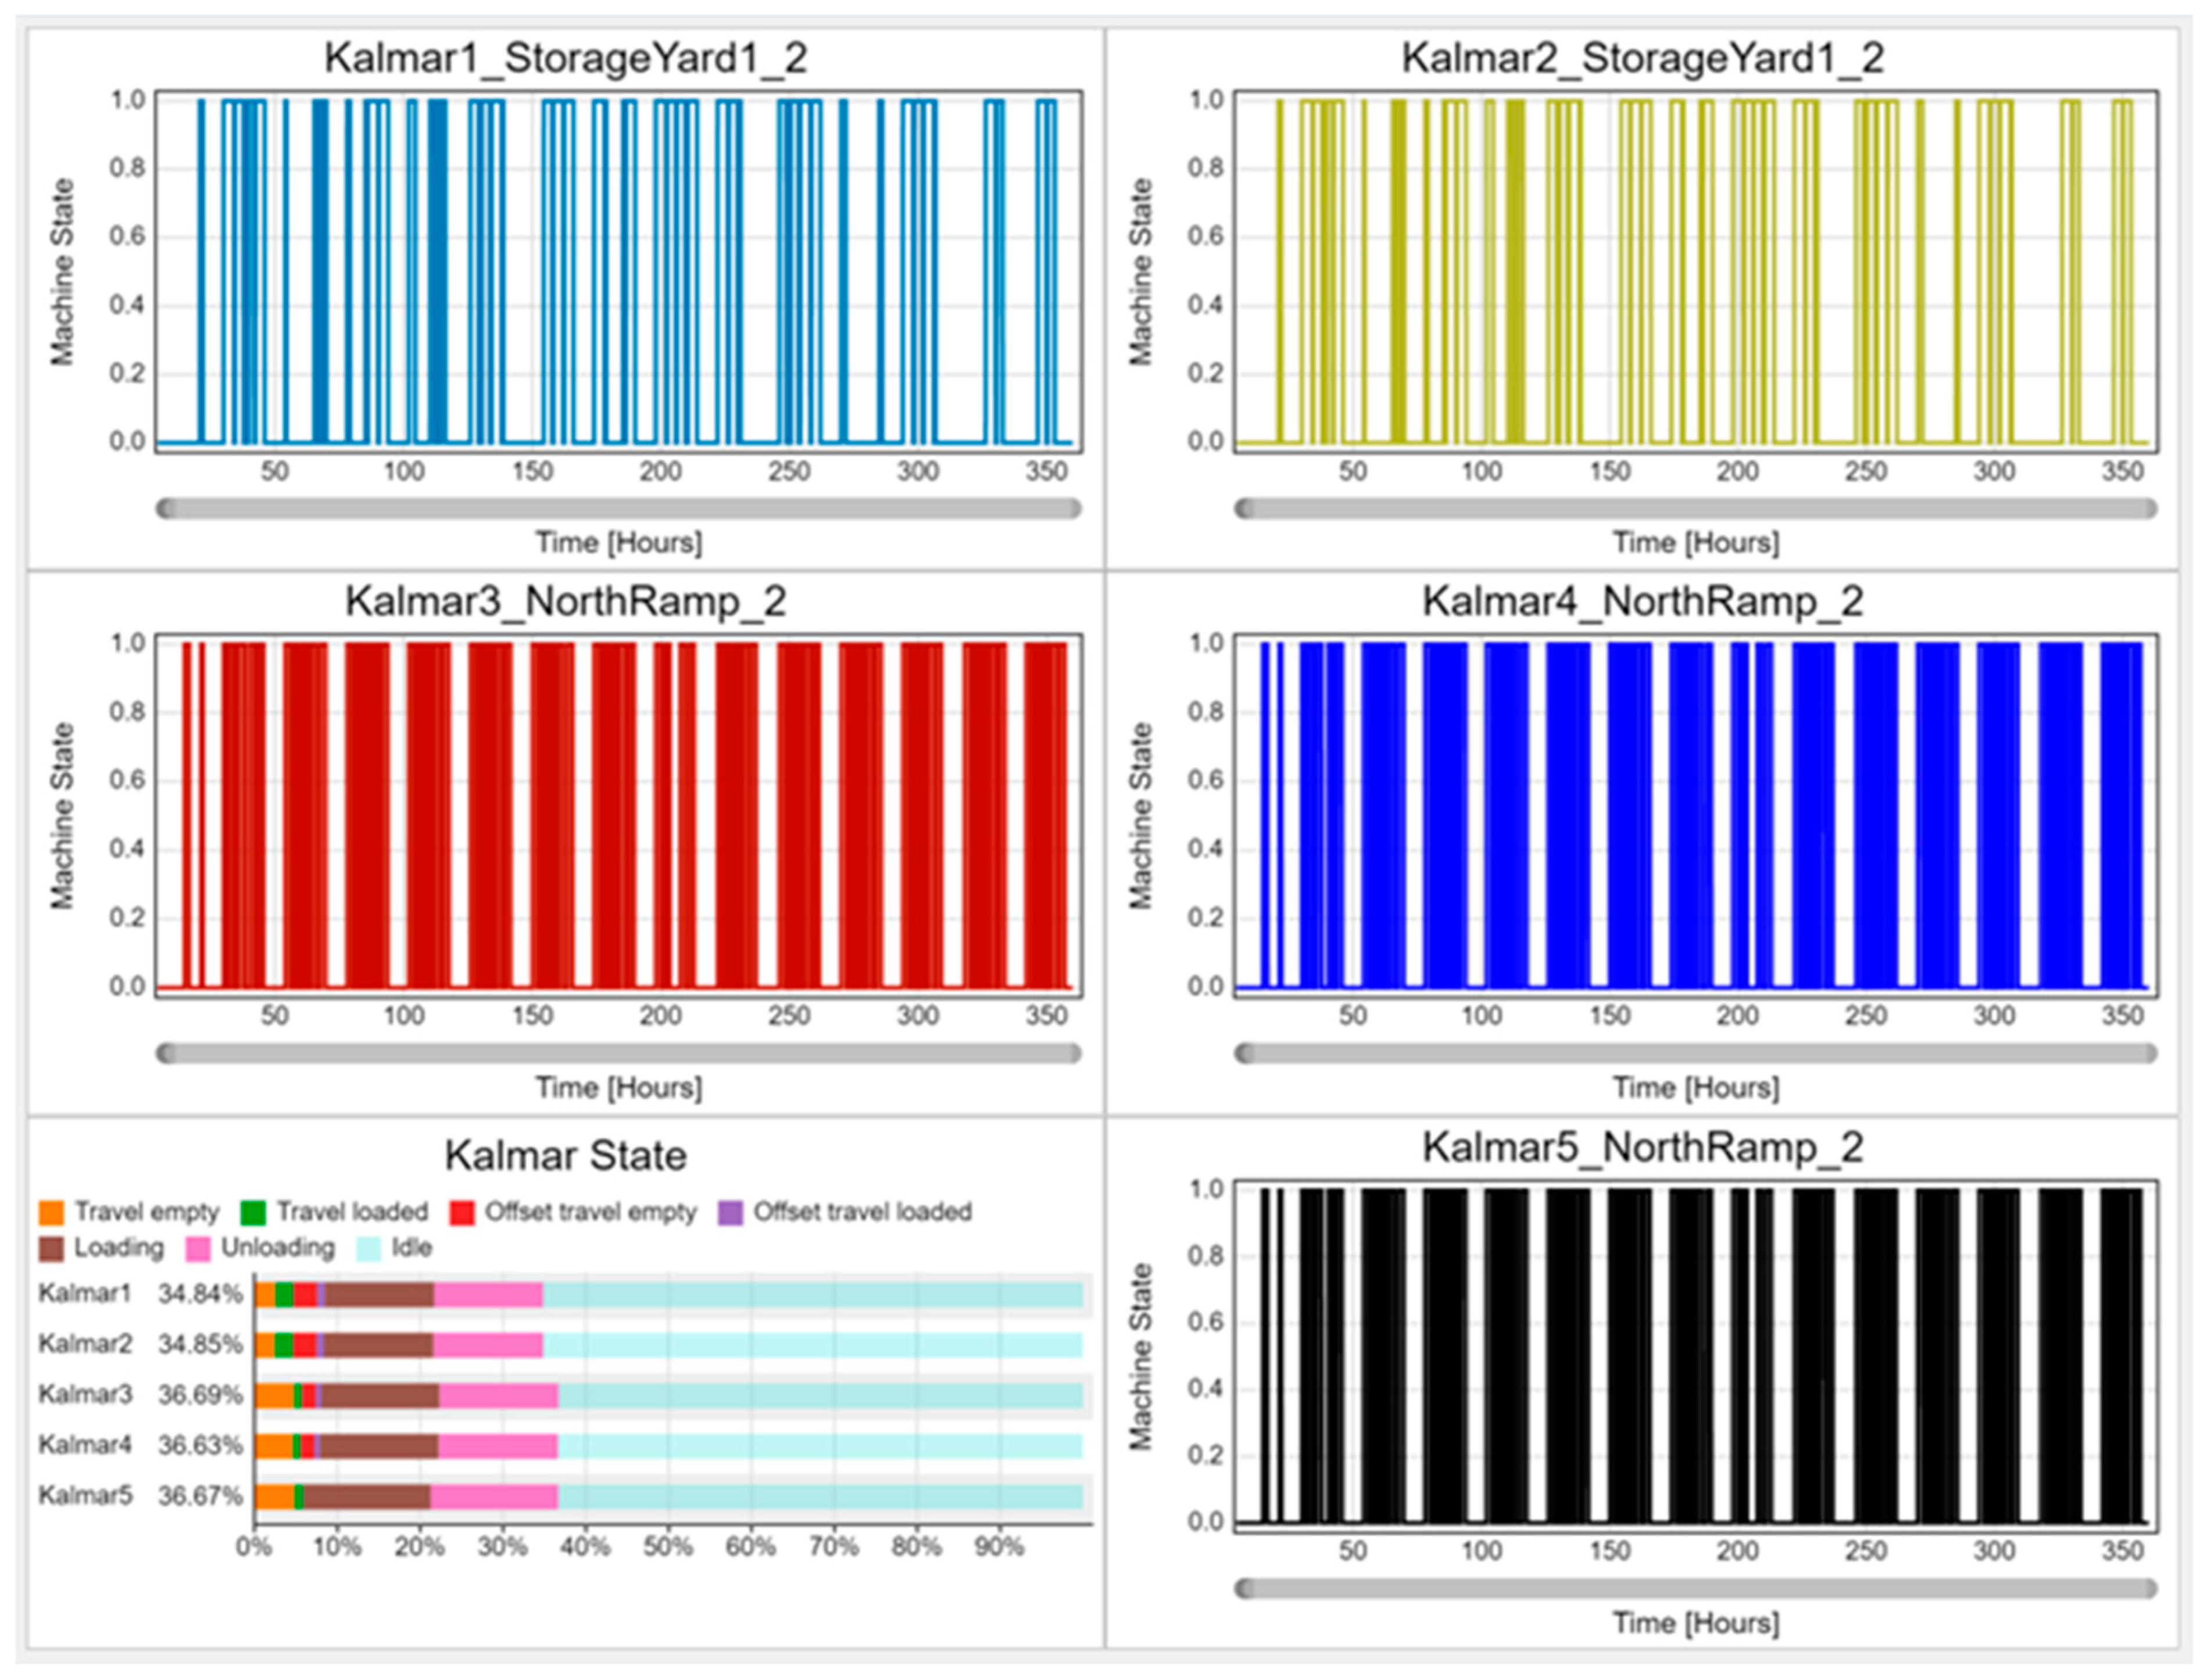
Figure 8.
Workload of reach stackers - Kalmars for a scenario ensuring biomass unloading with the nighttime shift disabled at the northern ramp.
Figure 8.
Workload of reach stackers - Kalmars for a scenario ensuring biomass unloading with the nighttime shift disabled at the northern ramp.
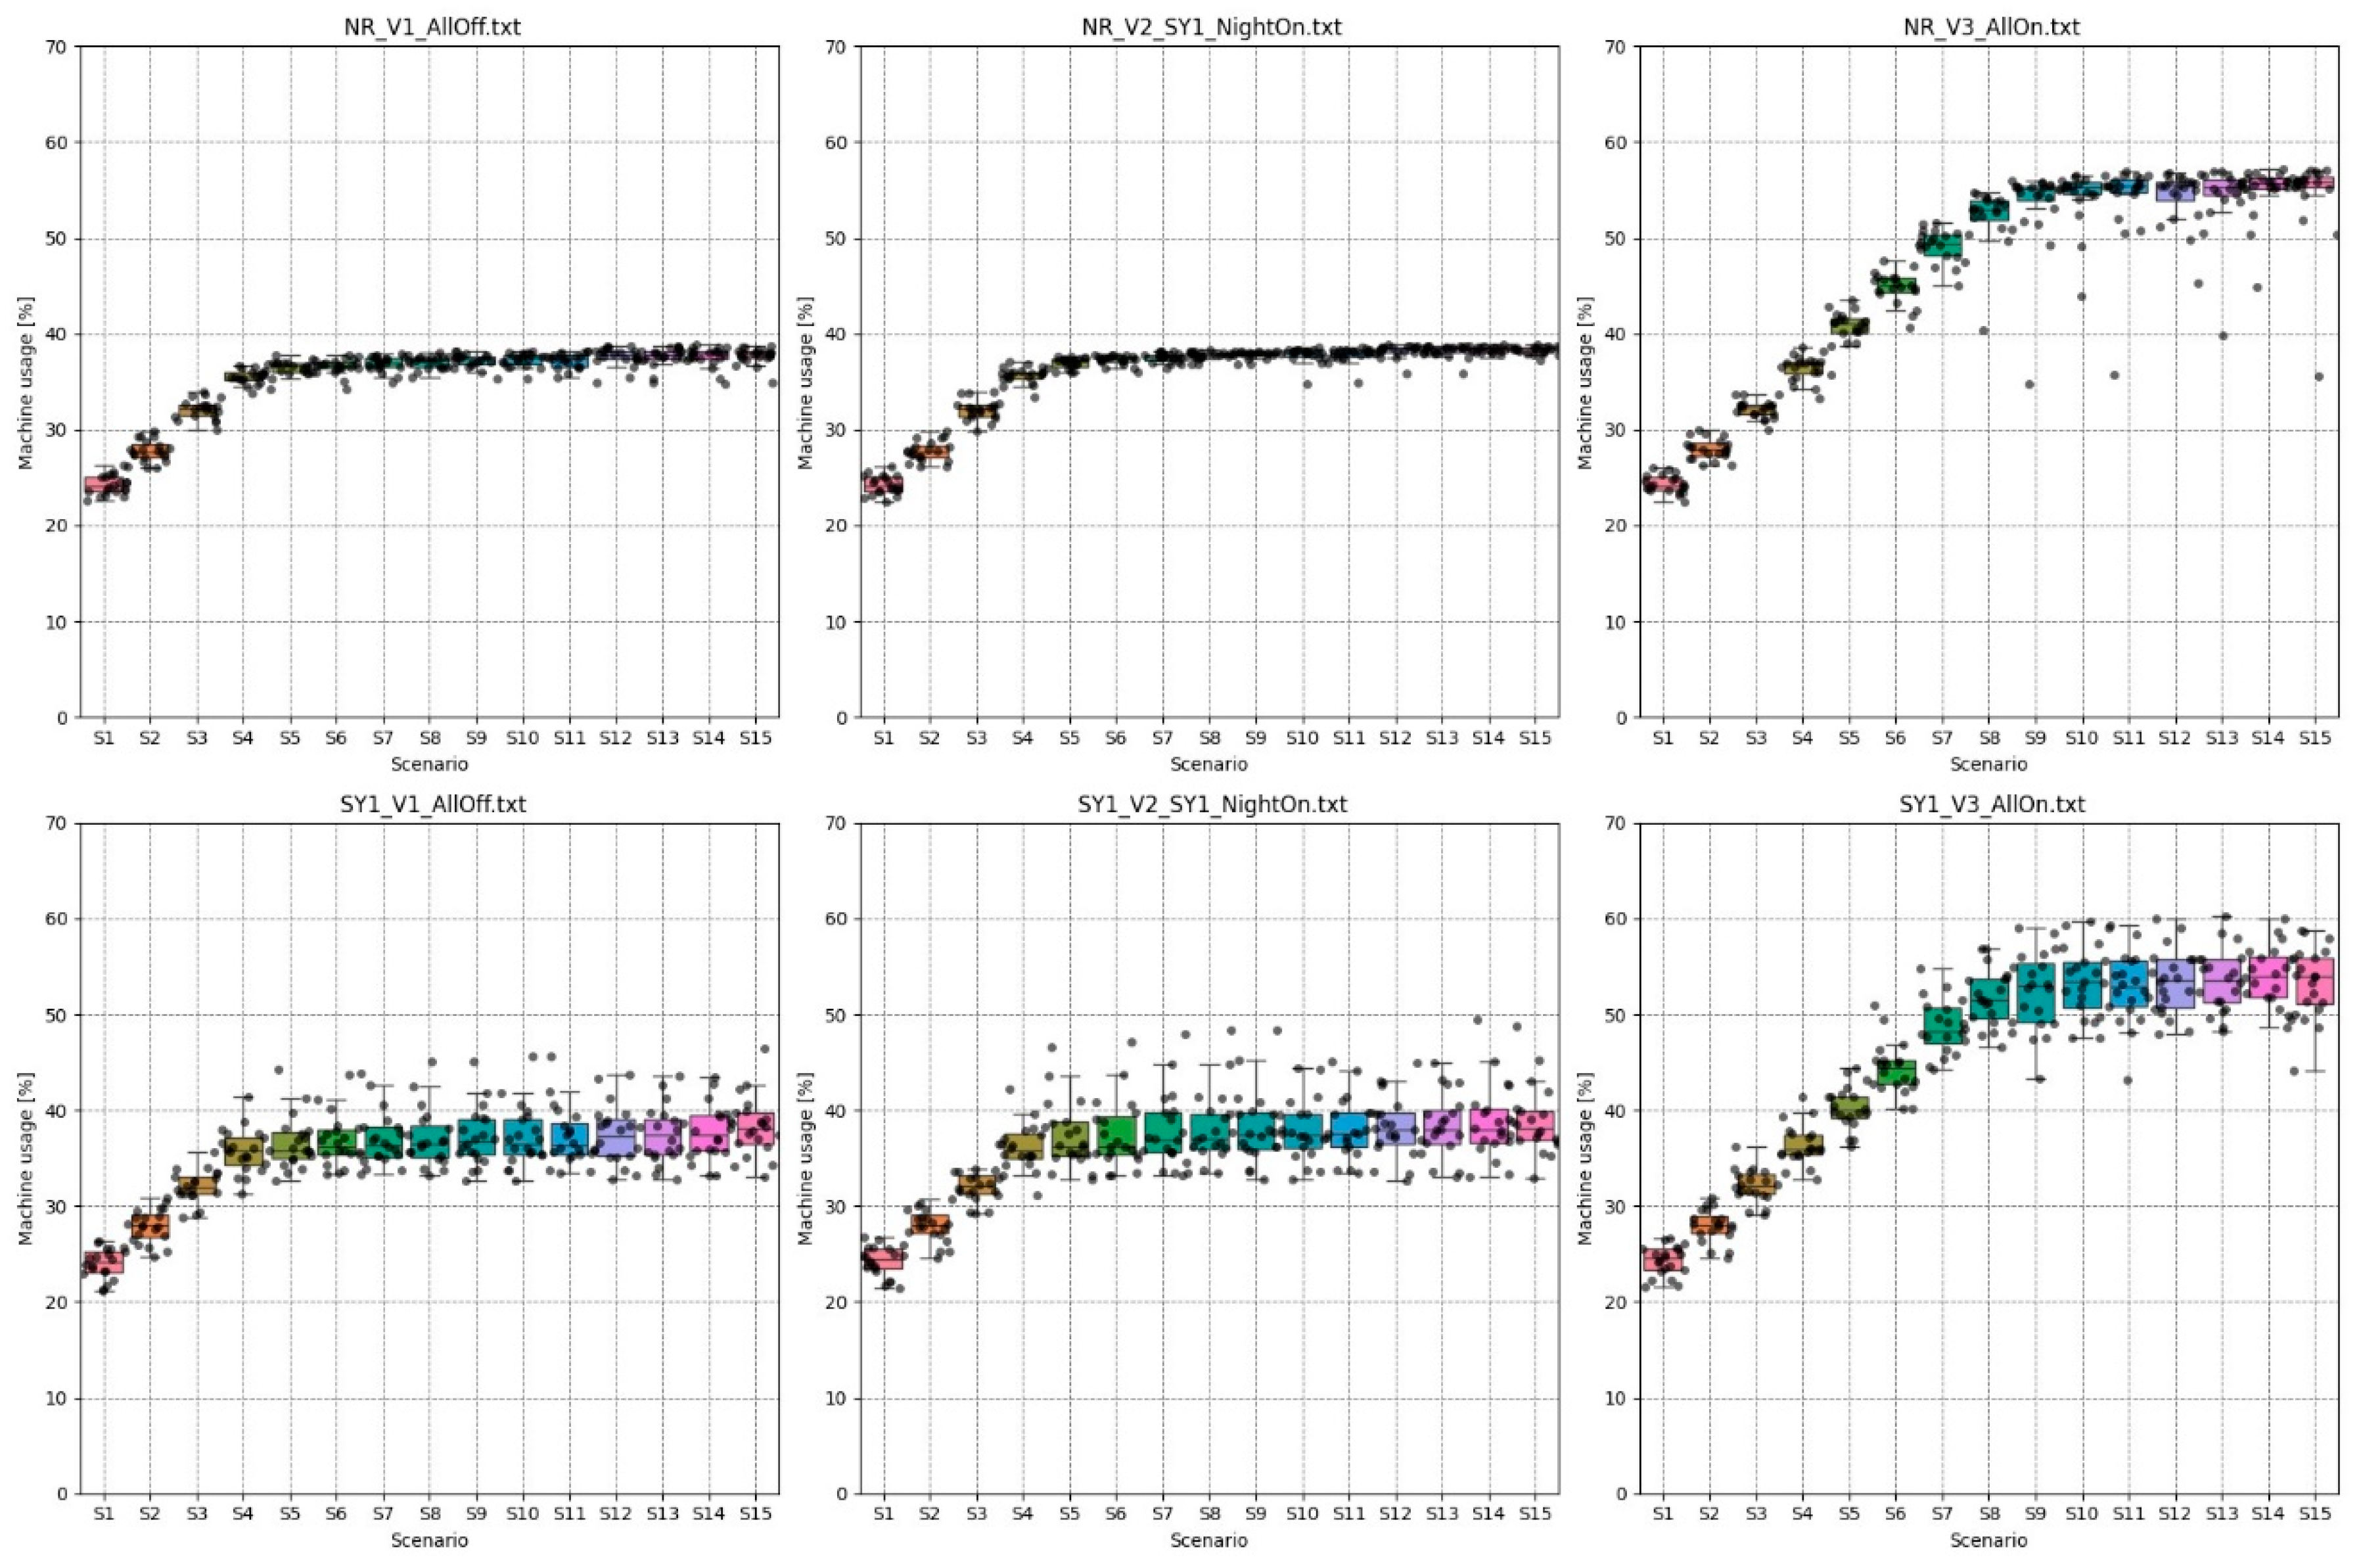
Figure 9.
Train queue as a function of truck deliveries share for different load scenarios.
Disclaimer/Publisher’s Note: The statements, opinions and data contained in all publications are solely those of the individual author(s) and contributor(s) and not of MDPI and/or the editor(s). MDPI and/or the editor(s) disclaim responsibility for any injury to people or property resulting from any ideas, methods, instructions or products referred to in the content. |
© 2025 by the authors. Licensee MDPI, Basel, Switzerland. This article is an open access article distributed under the terms and conditions of the Creative Commons Attribution (CC BY) license (http://creativecommons.org/licenses/by/4.0/).
Copyright: This open access article is published under a Creative Commons CC BY 4.0 license, which permit the free download, distribution, and reuse, provided that the author and preprint are cited in any reuse.


