
Submitted:
17 April 2025
Posted:
21 April 2025
You are already at the latest version
Abstract
There is a lack of studies that relate the physical and physicochemical characteristics of onion genotypes to their suitability for different uses. This study aimed to characterize onion genotypes and associate their properties with suitability for processing, storage, or fresh consumption. The experiment used a completely randomized design with 10 genotypes and 5 replicates. We evaluated traits including dry matter, firmness, color, soluble solids, titratable acidity, antioxidant potential, and pyruvic acid content. Principal component analysis (PCA) and hierarchical clustering were applied to classify genotypes according to use. The results showed significant differences among genotypes. Genotypes 13, 21, 23, and 41 were better suited for fresh consumption due to their low pungency and high sugar content. Genotypes 45 and 71 presented traits desirable for processing, such as high dry matter and pyruvic acid content. Genotypes 41 and 83 were suitable for storage due to firmness and resistance indicators. These results show that physical and chemical parameters are effective for discriminating onion genotypes and selecting the most appropriate types for specific uses. This approach contributes to the improvement of postharvest handling, processing efficiency, and strategic cultivar recommendations.
Keywords:
onion grouping
; onion postharvest
; onion suitability
1. Introduction
In Brazil, onion farming is distributed across the South, Southeast, and Northeast regions, with Santa Catarina being the state with the largest production [1]. Despite the increase in national production rates since the 2000s, onion farming in Brazil still faces significant challenges in the postharvest phase. These challenges are marked by a lack of information on storage potential, inadequate infrastructure, and the need for genotypes better suited for processing [2].
Postharvest quality is related to the set of physical and chemical attributes or properties that make agricultural products desirable as food [3]. These attributes, in turn, are determined by the cultivar, pre- and postharvest treatments, and the appropriate harvest time, which aim primarily to ensure the maintenance of the chemical quality and physical integrity of the bulbs [4]. These factors also play a crucial role in cultivar selection and acceptance by the consumer market, whether for fresh consumption, processing, or storage, helping to take advantage of strategic market opportunities [5].
Among the physical and chemical characteristics used to evaluate the postharvest quality of vegetables, the following attributes stand out: loss of fresh matter, color, firmness, total soluble solids, total titratable acidity, antioxidant potential, and pyruvic acid [6]. These parameters can be used to characterize and classify onions into different quality categories and assist in selecting the right products for each purpose. Onions suitable for storage are generally smaller, firmer, and more pungent, with well-adhered protective scales, high resistance to postharvest diseases, and a long dormant period, enabling them to withstand several months of storage. Due to their strong flavor, they are mainly used to enhance the taste of cooked foods. Onion breeding programs in Brazil have traditionally focused on developing cultivars for this purpose. Onions for fresh consumption are generally larger, less firm, sweeter, with a mild flavor, crunchy texture, and preferably a single center. Cultivars with these characteristics have a short market window due to limited harvest and postharvest life. In general, mild and sweet onions contain less than 4 mmol of pyruvic acid per gram of fresh matter and at least 6% sugar [7]. Onions for processing have a high dry matter content, high pyruvic acid levels, low reducing sugar content, and white pulp and scales. These onions are used by the processing industry to produce onion paste, dehydrated onions, pickled onions, and other products. For high industrial yield and quality processing, onions with specific characteristics are sought, such as high dry matter and pyruvic acid content, low reducing sugar content, and white scales. These traits add value to the product and favor raw material processing. For onion ring production, white onions are preferred due to their milder flavor, sweeter taste, crispier texture, and high pungency, resulting in excellent industrial yield. Additionally, the bulbs can be used for various other purposes, such as dehydrated onions, pickled onions, onion paste, onion powder, and fried onions [8,9].
Given the lack of knowledge and scarcity of literature regarding the criteria used to categorize onions based on their use, combined with the underdevelopment of the onion industry and challenges in postharvest storage in Brazil, it is crucial to conduct research aimed at characterizing onion genotypes, improving quality and postharvest conservation, and promoting diversification and strengthening of the production chain. This is a fundamental strategy to boost the onion sector in Brazil, overcome existing challenges, and achieve the desired sustainability and competitiveness.
Thus, the objectives are to (a) physically and chemically characterize onion genotypes to identify and distinguish the quality attributes that categorize them for different specific uses; (b) identify the primary quality attributes that differentiate onion genotypes and enable categorization for fresh consumption, processing, or storage; (c) correlate and validate these quality attributes as practical indicators for distinguishing genotypes by intended use; and (d) provide scientific information and guidance to recommend onion genotypes suitable for various applications, contributing to the sustainable development of the onion production chain.
2. Materials and Methods
2.1. Plant Material and Experimental Design
Ten open-pollinated and hybrid onion genotypes, produced in a commercial area in Ituporanga, Santa Catarina, Brazil (27°25′30″ S, 49°36′4″ W), and identified as 13, 21, 23, 41, 43, 45, 52, 71, 81, and 83 (Figure 1), were harvested during the 2022/2023 crop year. The bulbs were cured in the field at 22.5 °C and 65% relative humidity (RH) for five days. After curing, the bulbs were bagged (20 kg per bag) and transported to the laboratory at room temperature over a 24-hour period.
The experiment followed a completely randomized design with 10 treatments (genotypes), five replicates, and two bulbs per replicate.
2.2. Experimental Procedure
The physical and physicochemical characterization of the 10 onion genotypes was conducted using selected bulbs, excluding those showing symptoms of disease, physiological defects, or physical/mechanical damage. The response variables evaluated were:
a) Firmness: four measurements were taken in the equatorial region of the bulbs using a bench penetrometer (Fruit Hardness Tester FR-5120) equipped with a 5 mm diameter probe. The pressure required for penetration was recorded in Newton [1].
b) Color: the external color of the bulbs was evaluated using the parameters L* (0 = black and 100 = white), a* (green to red), and b* (blue to yellow). Measurements were taken with a MINOLTA CR-200b colorimeter (Osaka, Japan) [2].
c) Number and thickness of cataphylls: determined by image analysis software (CorelDRAW and Corel PHOTO-PAINT) (Figure 2).
d) Format: measured using a caliper in longitudinal (DL) and transverse (DT) directions. The shape index was DL/DT.
e) Dry matter (%): a quarter of the bulb was weighed, dried at 65 °C for 72 h, and reweighed. % DM = (DM/MF) × 100.
f) Water content: calculated as [(MF - DM)/MF] × 100.
g) Soluble solids content: determined via refractometry using homogenized bulb extract in deionized water (1:1), filtered, and read in a digital refractometer (Atago PR-201α).
h) Titratable acidity: determined from the same extract as soluble solids, using titration with 0.01 N NaOH.
i) SS/TA ratio: calculated by dividing soluble solids by titratable acidity [3].
j) Non-structural carbohydrates:
k) Phenolic compounds: determined using the Folin–Ciocalteu method, with results expressed in mg gallic acid/100 mg sample [6].
l) Total flavonoids: determined by reaction with aluminum chloride and read at 420 nm [7].
m) Pyruvic acid: analyzed as per Metrani et al. (2017), with final reading at 420 nm and standard curve using sodium pyruvate [8].
2.3. Statistical Analysis
The data were subjected to normality (Shapiro–Wilk) and homogeneity (Bartlett) tests. ANOVA and mean grouping (Scott–Knott, p ≤ 0.05) were performed using the ExpDes.pt package [9]. PCA with cluster analysis was used to evaluate the relationship between variables and treatments. All analyses were performed using R software (version 4.1.2) [10].
3. Results
3.1. Physical and Physicochemical Characterization
The firmness of the onion genotypes ranged from 6.8 to 9.3 N. Firmer bulbs were observed in genotypes 43, 81, and 83, while genotypes 23 and 71 had the lowest values. Dry matter content ranged from 10.6% to 13.0%, with higher values found in genotypes 41, 43, 81, and 83. No significant differences in water content were observed among the genotypes, with an average of 88%.
The number of cataphylls ranged from 6.8 to 9.2, with higher values in genotypes 43, 71, and 83. The thickness of the cataphylls varied from 4.6 to 6.2 mm, being greater in genotypes 13, 41, and 71. Genotype 83 presented more homogeneous cataphyll thickness, while in the other genotypes the thickness increased in intermediate layers and decreased in the innermost and outermost layers.
Regarding color attributes, the brightness (L*) ranged from 40.8 to 62.5. The L* was highest in genotypes 13, 21, and 23 and lowest in 45 and 71. The red-green coordinate (a*) ranged from 18.0 to 32.9, with genotype 45 showing the most intense red color. The yellow-blue coordinate (b*) ranged from 7.4 to 26.8, with the highest values observed in genotypes 13 and 41. There was no significant difference in shape among genotypes, with DL/DT values close to 0.9 for all.
The soluble solids (SS) content was significantly higher in genotypes 21, 23, 41, 43, 81, and 83. Titratable acidity (TA) was highest in genotype 83, while the SS/TA ratio was higher in genotypes 21, 41, and 43, and lower in 83.
In the carbohydrate analysis, total soluble sugars (TSS) and non-reducing sugars (NRS) were highest in genotype 21 and lowest in 43, 45, and 81. Reducing sugars (RS) were higher in genotypes 13, 21, and 83, and lowest in genotype 81.
Phenolic compounds (PC) and total flavonoids (TF) were highest in genotype 52, while lower values were observed in genotypes 13, 21, 41, 45, and 71. No statistical differences were found in pyruvic acid content among genotypes.

Table 1.
Physical characteristics of onion genotypes. F (N)= firmness; DM (%)= dry matter; WC (%)= water content; No. CAT= number of cataphylls; CAT Thk= thickness of cataphylls; L*= brightness on the color scale; a*= color coordinate representing the intensity of red-green tones; b*= color coordinate representing the intensity of yellow-blue tones; DL/DT: shape indicated by the relationship between the longitudinal diameter and the transverse diameter.
| Genotype | F (N) | DM (%) | WC (%) | No. CAT | CAT Thk (mm) | Color | DL/DT | ||
| L* | a* | b* | |||||||
| 13 | 7.6 c | 10.9 b | 89.1 a | 6,8 b | 6,0 a | 61.6 a | 19.7 f | 26.8 a | 0.9 a |
| 21 | 8.0 b | 11.8 b | 89.1 a | 8,0 b | 4,0 c | 62.0 a | 18.0 f | 24.9 c | 1.0 a |
| 23 | 6.7 d | 11.4 b | 88.5 a | 8,0 b | 5,0 b | 62.5 a | 18.6 f | 24.3 c | 0.9 a |
| 41 | 8.3 b | 12.3 a | 87.6 a | 8,0 b | 6,0 a | 59.8 b | 23.2 e | 26.0 a | 0.9 a |
| 43 | 8.9 a | 12.6 a | 88.3 a | 9,2 a | 4,0 c | 54.7 c | 29.5 b | 23.9 c | 0.9 a |
| 45 | 8.5 b | 10.6 b | 88.9 a | 7,6 b | 5,0 b | 40.8 f | 32.9 a | 7.4 e | 0.9 a |
| 52 | 8.4 b | 11.7 b | 88.4 a | 7,4 b | 5,0 b | 55.2 c | 27.6 c | 23.5 c | 0.9 a |
| 71 | 6.7 d | 11.7 b | 89.0 a | 9,2 a | 6,0 a | 43.5 e | 29.6 b | 10.0 d | 0.9 a |
| 81 | 9.3 a | 12.6 a | 87.3 a | 7,2 b | 5,0 b | 51.4 d | 25.4 d | 25.2 b | 0.9 a |
| 83 | 9.0 a | 12.9 a | 87.0 a | 9,0 a | 1,0 d | 54.4 c | 23.8 e | 23.9 c | 0.9 a |
| CV | 4.29 % | 9.88 % | 2.09 % | 10,61 % | 8,29 % | 7.94 % | 4.82 % | 9.46 % | 7.12 % |
CV= coefficient of variation expressed as a percentage, indicates the relative variation of the data. Means followed by the same letter in the column do not differ by the Scott-Knott test at a 5% significance.
Table 2.
Physicochemical characterization of onion genotypes. SS= soluble solids; TA (%)= titratable acidity; SS/TA= ratio of soluble solids to titratable acidity; TSS (%)= total soluble sugars; RS (%)= reducing sugars; ANR (%)= non-reducing sugars; PC (mg 100 g-1)= phenolic compounds; TF (mg 100 g-1)= total flavonoids; PA= pyruvic acid (nmol g-1).
| Genotype | SS (oBrix) |
TA (%) |
SS/TA | TSS (%) |
RS (%) |
NRS (%) |
PC (mg 100 g-1) |
TF (mg 100 g-1) |
PA (nmol g-1) |
| 13 | 11.1 b | 0.1 c | 62.4 b | 1.1 b | 0.6 a | 0.5 c | 58.0 c | 22.8 c | 362.1 a |
| 21 | 11.9 a | 0.1 c | 67.5 a | 1.4 a | 0.5 a | 0.9 a | 57.5 c | 20.4 d | 318.1 a |
| 23 | 11.9 a | 0.1 b | 62.2 b | 1.0 b | 0.4 b | 0.6 b | 68.0 b | 28.7 b | 370.7 a |
| 41 | 11.4 a | 0.1 c | 67.4 a | 1.0 b | 0.4 b | 0.6 b | 58.4 c | 22.2 c | 348.0 a |
| 43 | 11.5 a | 0.1 c | 69.5 a | 0.4 d | 0.3 b | 0.1 e | 65.1 b | 29.7 b | 363.7 a |
| 45 | 11.1 b | 0.1 c | 62.3 b | 0.4 d | 0.3 b | 0.0 e | 60.7 c | 19.4 d | 339.3 a |
| 52 | 10.8 b | 0.1 c | 61.9 b | 1.0 b | 0.3 b | 0.6 b | 93.8 a | 44.8 a | 359.8 a |
| 71 | 10.5 b | 0.1 c | 61.4 b | 1.1 b | 0.4 b | 0.7 b | 56.6 c | 19.8 d | 371.4 a |
| 81 | 11.6 a | 0.2 b | 59.5 b | 0.3 d | 0.2 c | 0.0 e | 65.1 b | 24.6 c | 423.6 a |
| 83 | 11.8 a | 0.2 a | 48.6 c | 0.7 c | 0.5 a | 0.2 d | 63.1 b | 30.2 b | 377.9 a |
| CV | 4.75 % | 8.68 % | 8.91 % | 18,87 % | 12,13 % | 13,52 % | 6,22 % | 9,59 % | 16.55 % |
CV= coefficient of variation expressed as a percentage, indicates the relative variation of the data. Means followed by the same letter in the column do not differ by the Scott-Knott test at a 5% significance.
3.2. Principal Component and Correlation Analysis
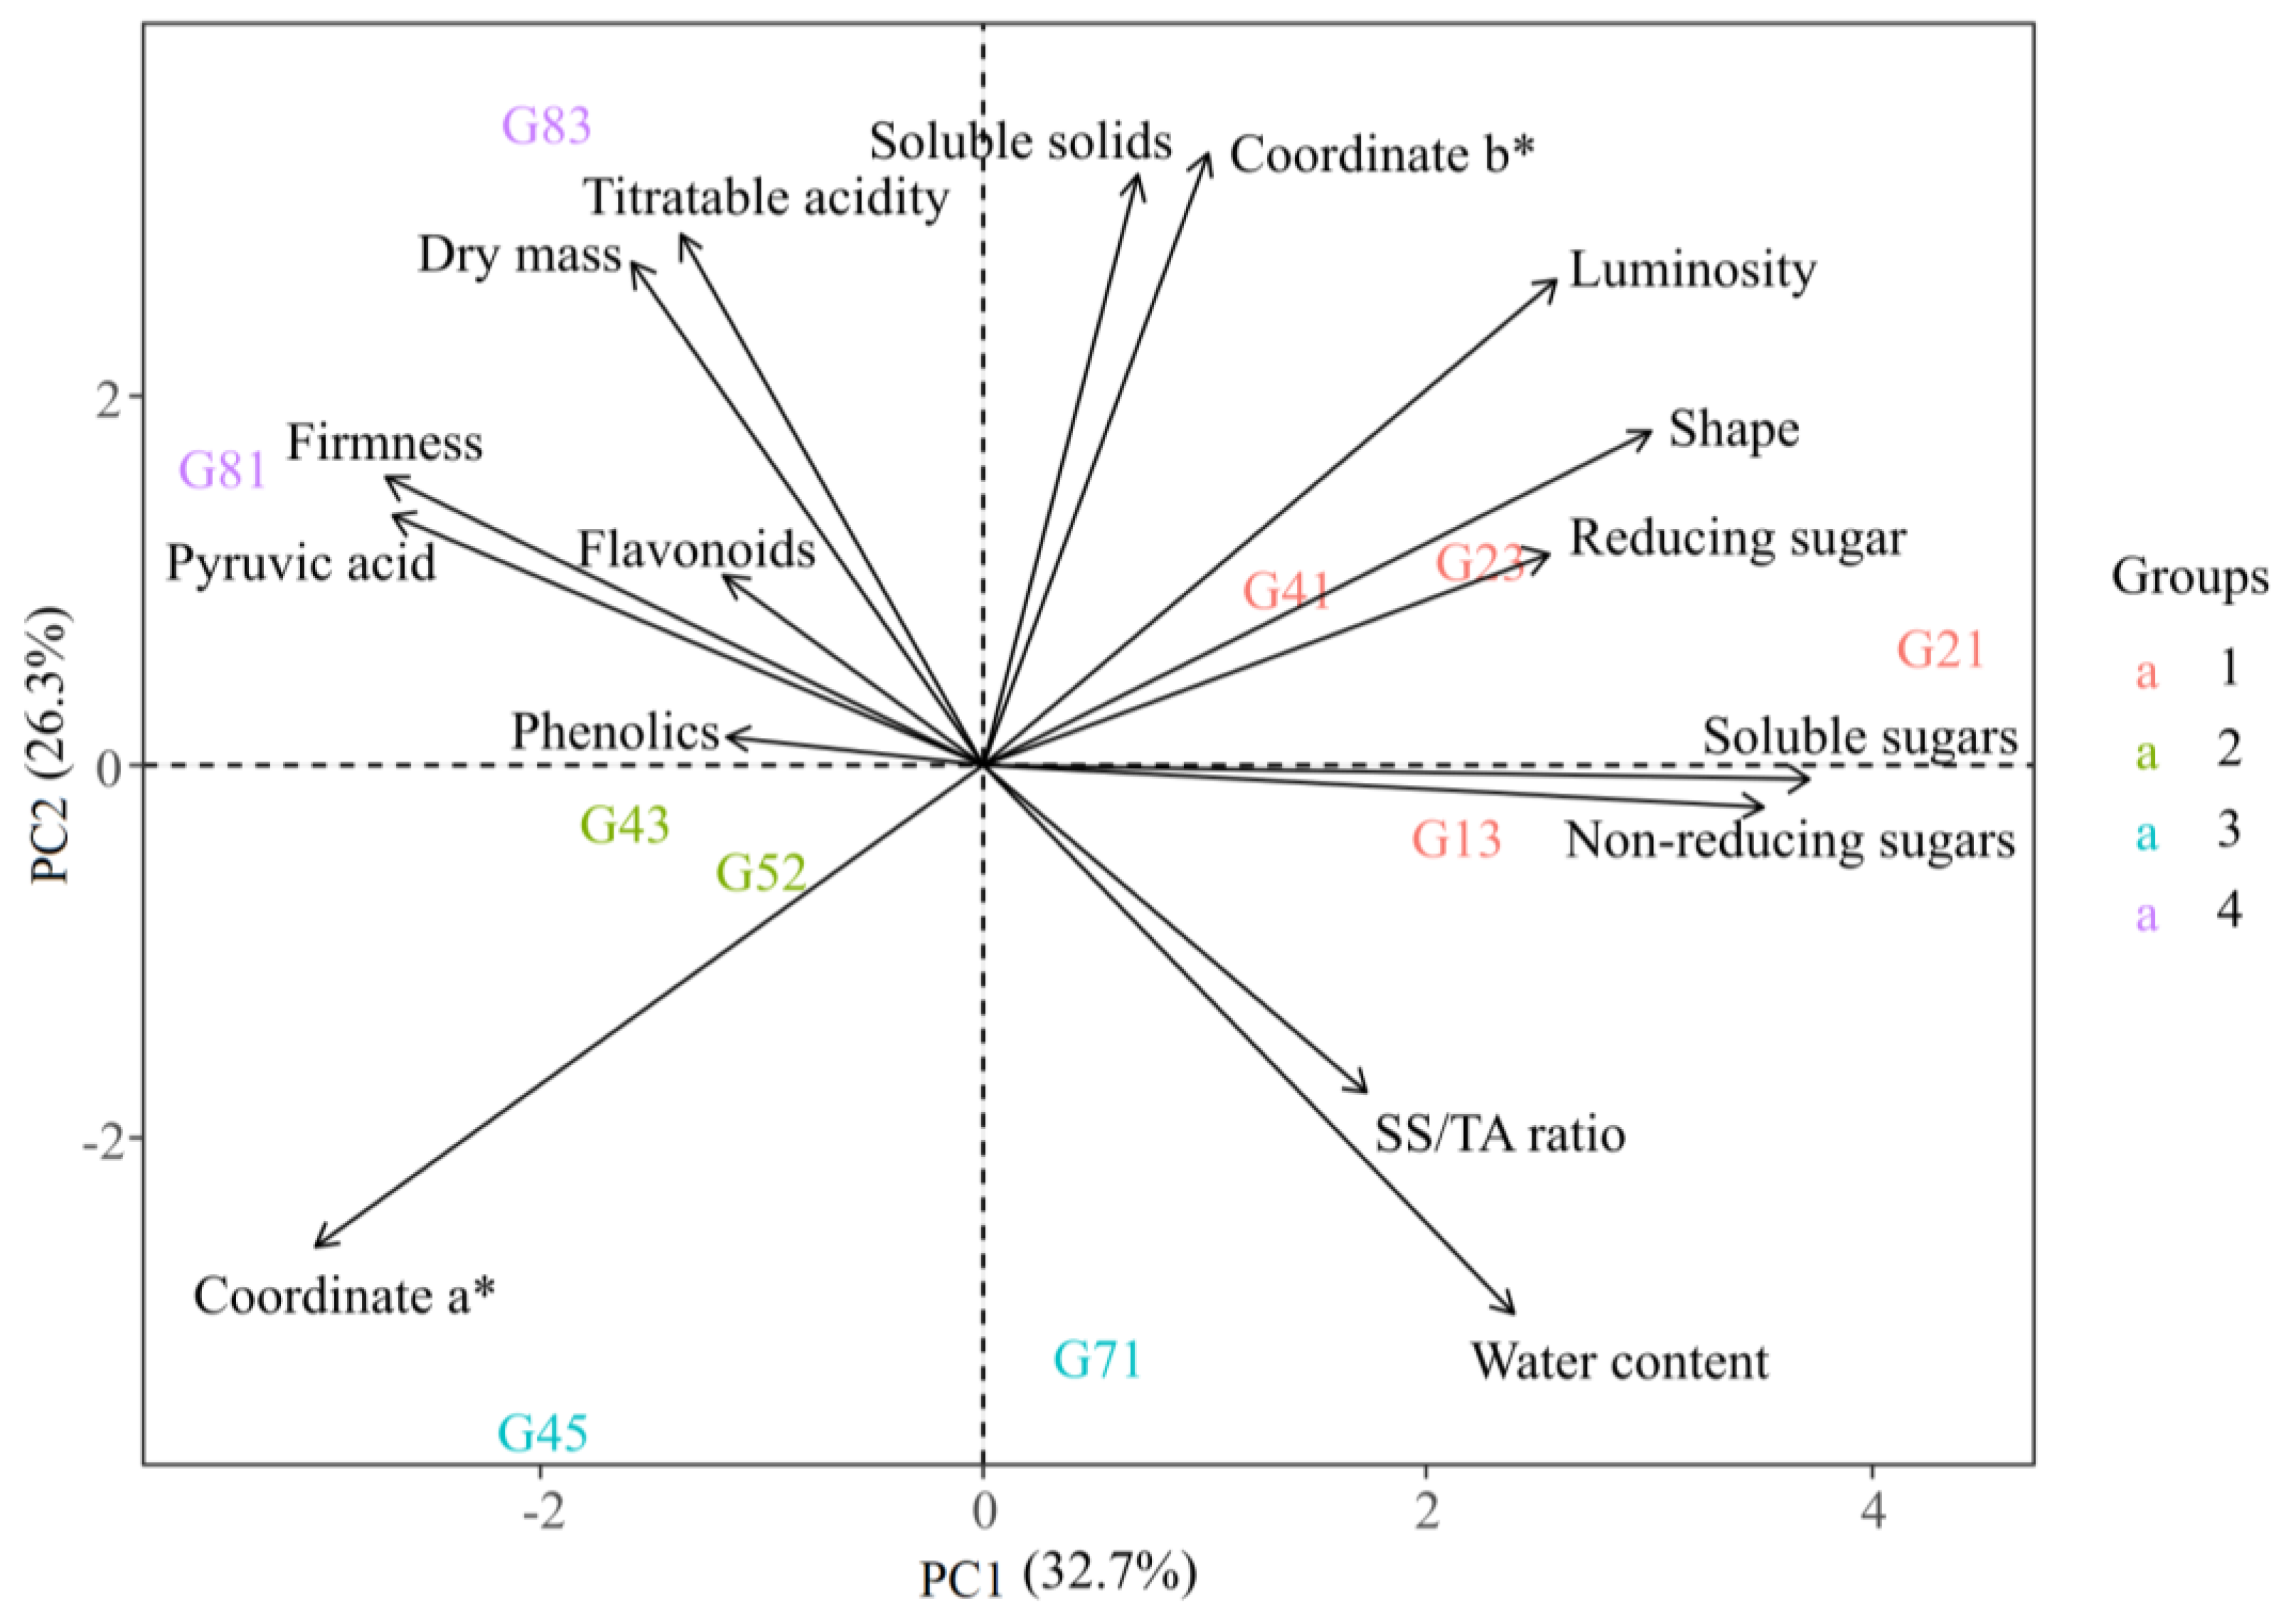
Correlation analysis revealed a positive association between the L* value and the contents of soluble solids (SS), total soluble sugars (TSS), reducing sugars (RS), and non-reducing sugars (NRS) (Figure 3). This suggests that lighter onion genotypes tend to have a higher sugar content and, consequently, a sweeter flavor. This relationship may serve as a phenotypic indicator for selecting genotypes suitable for fresh consumption. These findings are supported by the principal component analysis (PCA) (Figure 4), which showed that genotypes with higher lightness—such as 13 and 21—also presented higher sugar contents and were grouped together with other genotypes indicative of fresh market preference.
The a* color index showed a negative correlation with SS/TA, SS, TSS, RS, and NRS, and a positive correlation with firmness. This implies that onion genotypes with more intense purple coloration tend to have lower sugar contents and greater firmness. PCA results corroborated this trend, showing that genotypes 45 and 71, which stood out for their intense coloration and high firmness, were grouped with other genotypes identified as suitable for processing.
Firmness also showed a positive correlation with dry matter (DM) and a negative correlation with SS/TA, TSS, and NRS. Firmer genotypes—such as 43, 81, and 83—had lower sugar contents and SS/TA ratios, making them more appropriate for storage. These traits may be used as selection criteria for onion genotypes intended for long-term conservation.
Principal component analysis (PCA) explained 60% of the total variance, based on the first two principal components (PC1 and PC2) (Figure 4). The cluster analysis grouped the onion genotypes into four distinct clusters:
- Group 1 was strongly related to TSS, RS, NRS, SS, shape, L*, and b* values, indicating sweeter onions with lighter coloration.
- Group 2 showed strong association with a*, indicating a more intense red/purple hue.
- Group 3 correlated with SS/TA and water content.
- Group 4 was related to titratable acidity, DM, firmness, flavonoids, pyruvic acid, and phenolic compounds, suggesting a group with firmer texture and quality-related biochemical traits.
Based on these clusters, genotypes were categorized by their suitability for different uses:
- Group 1 (13, 21, 23, and 41): ideal for fresh consumption due to their sweet taste and lighter color.
- Group 3 (45 and 71): recommended for processing, owing to their high DM and pyruvic acid and low sugar content.
- Group 4 (81 and 83): better suited for storage, as their firmness and biochemical profile enhance postharvest conservation.
These groupings provide valuable insights for breeding, commercial selection, and genotype recommendation based on market needs and postharvest goals.
4. Discussion
The physicochemical differences observed among the onion genotypes are supported by previous studies and reflect the influence of both genetic and environmental factors. Dry matter, fresh matter, firmness, cataphyll structure, and water content have been reported as interrelated variables in onion quality assessment [11]. In the present study, genotypes 43, 81, and 83 exhibited greater firmness and dry matter content, suggesting a positive association between these traits. This is expected, as dry matter reflects the concentration of solid compounds, while firmness can be linked to cellular turgor and structural composition [20].
Although the number and thickness of cataphylls can contribute to bulb firmness and protective layering, no clear relationship was observed between these traits and dry matter content. Cataphylls, being modified leaves that constitute the bulb structure, vary in number and thickness depending on genetic background and growth conditions [22]. Previous studies have shown that certain genotypes tend to accumulate more dry matter in specific bulb layers, which may not always correspond to cataphyll metrics [24]. Nutritional management, particularly involving nitrogen, phosphorus, potassium, and boron, is also known to influence dry matter accumulation [8].
Regarding bulb coloration, distinct variations were observed among genotypes. The L* coordinate, which measures lightness, was higher in genotypes 13, 21, and 23, indicating a lighter skin color. Conversely, genotypes 45 and 71 showed lower L* values, reflecting a deeper purple tone. This observation aligns with the a* values, where genotype 45 exhibited the highest value, indicating a stronger presence of red pigmentation, commonly associated with purple-skinned onions. Genotypes with higher b* values, such as 13 and 41, showed greater yellow hue intensity, reinforcing their lighter appearance. These color variations reflect intrinsic genetic traits and may serve as visual indicators for selection based on market preferences.
The higher soluble solids (SS) content observed in genotypes 21, 23, 41, 43, 81, and 83 may be associated with a greater accumulation of sugars, contributing to higher pungency and enhanced flavor intensity. The SS content is widely recognized as a key indicator of quality in fruits and vegetables. In onions, it plays an important role in both fresh consumption and processing, as high SS levels reduce water evaporation time during processing, leading to lower energy consumption and higher yield [16].
Genotype 83 stood out for its higher titratable acidity (TA), a trait considered favorable for industrial processing. Acidity in onions is often used as an indirect measurement of flavor-related compounds, especially pyruvic acid, which is responsible for the characteristic pungency and aroma [12]. Pyruvic acid is released enzymatically upon tissue rupture, and its concentration is a function of both the genotype and environmental conditions [14]. The SS/TA ratio is frequently used to evaluate overall flavor, offering a more balanced representation of sensory perception than isolated measurements of sugars or acidity [15]. In the present study, genotypes with a higher SS/TA ratio, such as 21, 41, and 43, are more likely to offer a sweeter taste and milder pungency, favoring their recommendation for fresh consumption. On the other hand, the lower SS/TA ratio observed in genotype 83, combined with its higher acidity and pyruvic acid content, reinforces its suitability for processing.
Sugars, particularly glucose and fructose, are the main constituents of SS in onions. These reducing sugars possess free carbonyl or ketone groups, contributing not only to sweetness but also to Maillard reactions during cooking or dehydration processes [18,19]. Non-reducing sugars, such as sucrose, also contribute to flavor but are less reactive in thermal processing contexts.
In addition to sugars and acidity, phenolic compounds and flavonoids are crucial for the nutritional and antioxidant profile of onions. Genotype 52 exhibited the highest levels of total phenolics (TP) and total flavonoids (TF), suggesting greater antioxidant potential. These compounds are known for their bioactivity and health-promoting properties, including free radical scavenging [4]. Their presence may also enhance the functional value of onion cultivars and serve as additional quality indicators for breeding programs focused on health-conscious markets.
Overall, the chemical composition of onion genotypes reveals distinct patterns that can guide cultivar recommendations. Genotypes with high SS, favorable SS/TA ratios, and moderate acidity are ideal for fresh consumption. Those with high dry matter, low sugar content, and greater pungency are better suited for processing. Genotypes with higher firmness, dry matter, and antioxidant compound content may be more appropriate for storage or functional food applications.
5. Conclusions
Physicochemical characteristics can be used as indicators to recommend and group genotypes according to their suitability or intended use. Genotypes 13, 21, 23, and 41 were grouped according to characteristics of lower firmness, higher sugar content, mild flavor, crunchy texture, and preferably single center, showing suitability for consumption in natura. Genotypes 45 and 71 were grouped according to characteristics of high dry matter content, high pyruvic acid, and low reducing sugar content, indicating potential for processing. Genotypes 41 and 83 were grouped according to characteristics of resistance and higher soluble solids content, being suitable for storage.
Author Contributions
Conceptualization, P.V.d.S.R. and J.V.d.S.M.; methodology, P.V.d.S.R. and L.d.S.M.; validation, W.S.R.; formal analysis, T.I.d.S.; investigation, P.V.d.S.R.; writing—original draft preparation, P.V.d.S.R.; writing—review and editing, all authors; supervision, W.S.R. All authors have read and agreed to the published version of the manuscript.
Funding
This research received no external funding.
Data Availability Statement
The data presented in this study are available on request from the corresponding author.
Acknowledgments
The authors would like to thank the Federal University of Viçosa (UFV) and the Department of Agronomy (DAA) for providing the infrastructure and institutional support necessary to carry out this research. Special thanks are extended to the colleagues who contributed through discussions and suggestions during the development of this study.
Conflicts of Interest
The authors declare no conflict of interest.
References
- Anace. Brazilian Association of Onion Producers. 2018. Articles. Available online: http://www.anacebrasil.com.br/artigos/ (accessed on 15 October 2022).
- Vilela, N.J.; Makishima, M.; Oliveira, V.R.; Costa, N.D.; Madail, J.C.M.; Camargo Filho, W.P.; Boeing, G.; Melo, P.C.T. Challenges and opportunities for the onion agribusiness in Brazil. Hortic. Bras. 2005, 23, 1029–1033. [Google Scholar] [CrossRef]
- Palumbo, M.; Attolico, G.; Capozzi, V.; Cozzolino, R.; Corvino, A.; Chiara, M.L.V.; et al. Emerging Postharvest Technologies to Enhance the Shelf-Life of Fruit and Vegetables: An Overview. Foods 2022, 11, 3925. [Google Scholar] [CrossRef] [PubMed]
- Chitarra, M.I.F.; Chitarra, A.B. Postharvest of Fruits and Vegetables: Physiology and Handling; UFLA: Lavras, Brazil, 2005. [Google Scholar]
- Grangeiro, L.C.; Souza, J.O.; Aroucha, E.M.M.; Nunes, G.H.S.; Santos, G.M. Qualitative characteristics of onion genotypes. Ciênc. Agrotec. 2008, 32, 1087–1091. [Google Scholar] [CrossRef]
- Major, N.; Išić, N.; Kovačević, T.K.; Anđelini, M.; Ban, D.; et al. Size does matter: the influence of bulb size on the phytochemical and nutritional profile of the sweet onion landrace “Premanturska Kapula” (Allium cepa L.). Antioxidants 2023, 12, 1596. [Google Scholar] [CrossRef] [PubMed]
- Islam, M.N.; Wang, A.; Pedersen, J.S.; Sørensen, J.N.; Körner, O.; Edelenbos, M. Online measurement of temperature and relative humidity as marker tools for quality changes in onion bulbs during storage. PLoS ONE 2019, 14, e0210577. [Google Scholar] [CrossRef] [PubMed]
- Boyhan, G.; Torrance, R.L.; Hill, C.R. Effects of doses of nitrogen, phosphorus and fertilizer sources on onion productivity. HortScience 2007, 3, 653–660. [Google Scholar] [CrossRef]
- Sansan, O.C.; Ezin, V.; Ayenan, M.A.T.; et al. Onion (Allium cepa L.) and Drought: Current Situation and Perspectives. Scientifica 2024, Article ID 6853932. [CrossRef]
- Dodgen, L.K.; Ueda, A.; Wu, X.; Parker, D.R.; Gan, J. Effect of transpiration on plant accumulation and translocation of PPCP/EDCs. Environ. Pollut. 2015, 198, 144–153. [Google Scholar] [CrossRef] [PubMed]
- Scalisi, A.; O’Connell, M.G. Relationships between soluble solids and dry matter in stone fruit pulp at harvest. Analytica 2021, 2, 14–24. [Google Scholar] [CrossRef]
- Chagas, S.J.R.; Resende, M.R.; Pereira, L.V. Qualitative characteristics of onion cultivars in South of Minas Gerais. Ciênc. Agrotec. 2004, 28, 102–106. [Google Scholar] [CrossRef]
- Chitarra, M.I.F.; Chitarra, A.B. Pós-colheita de frutas e hortaliças: fisiologia e manuseio; UFLA: Lavras, Brazil, 1990. [Google Scholar]
- Randle, W.M. Pyruvic acid and onion pungency. J. Food Compos. Anal. 1997. [Google Scholar]
- Pinheiro, R.V.R.; Marteleto, L.O.; Souza, A.C.G.; Casali, W.D.; Condé, A.R. Productivity and quality of guava fruits. Rev. Ceres 1984, 31, 360–387. [Google Scholar]
- Oliveira, V.R.; Boiteux, L.S.; Santos, C.A.F.; Leite, D.L.; Souza, R.B. Concentration of total soluble sugars in onion cultivars. Acta Hortic. 2006. [Google Scholar]
- Silva, R.N.; Monteiro, V.N.; Alcanfor, J.X.; Assis, E.M.; Asquieri, E.R. Comparison of methods for the determination of reducing and total sugars in honey. Ciênc. Tecnol. Aliment. 2003, 23, 337–341. [Google Scholar] [CrossRef]
- Angelo, P.M.; Jorge, N. Phenolic compounds in food. J. Inst. Adolfo Lutz 2007, 66, 1–9. [Google Scholar] [CrossRef]
- Liu, Q.; Luo, L.; Zheng, L. Lignins: Biosynthesis and biological functions in plants. Int. J. Mol. Sci. 2018, 19, 335. [Google Scholar] [CrossRef] [PubMed]
- Corrêa, N.S. Physiological and biochemical quality of onion cultivars subjected to sodium chloride concentrations; Thesis, 2012.
- Oliveira, V.R.; Marouelli, W.A.; Madeira, N.R. Influence of climatic factors on onion production. Hort. Bras. 2014. [Google Scholar]
Figure 1.
General appearance of onion genotypes produced in a commercial area in Ituporanga, Santa Catarina, Brazil and harvested in the 2022/2023 harvest.
Figure 1.
General appearance of onion genotypes produced in a commercial area in Ituporanga, Santa Catarina, Brazil and harvested in the 2022/2023 harvest.
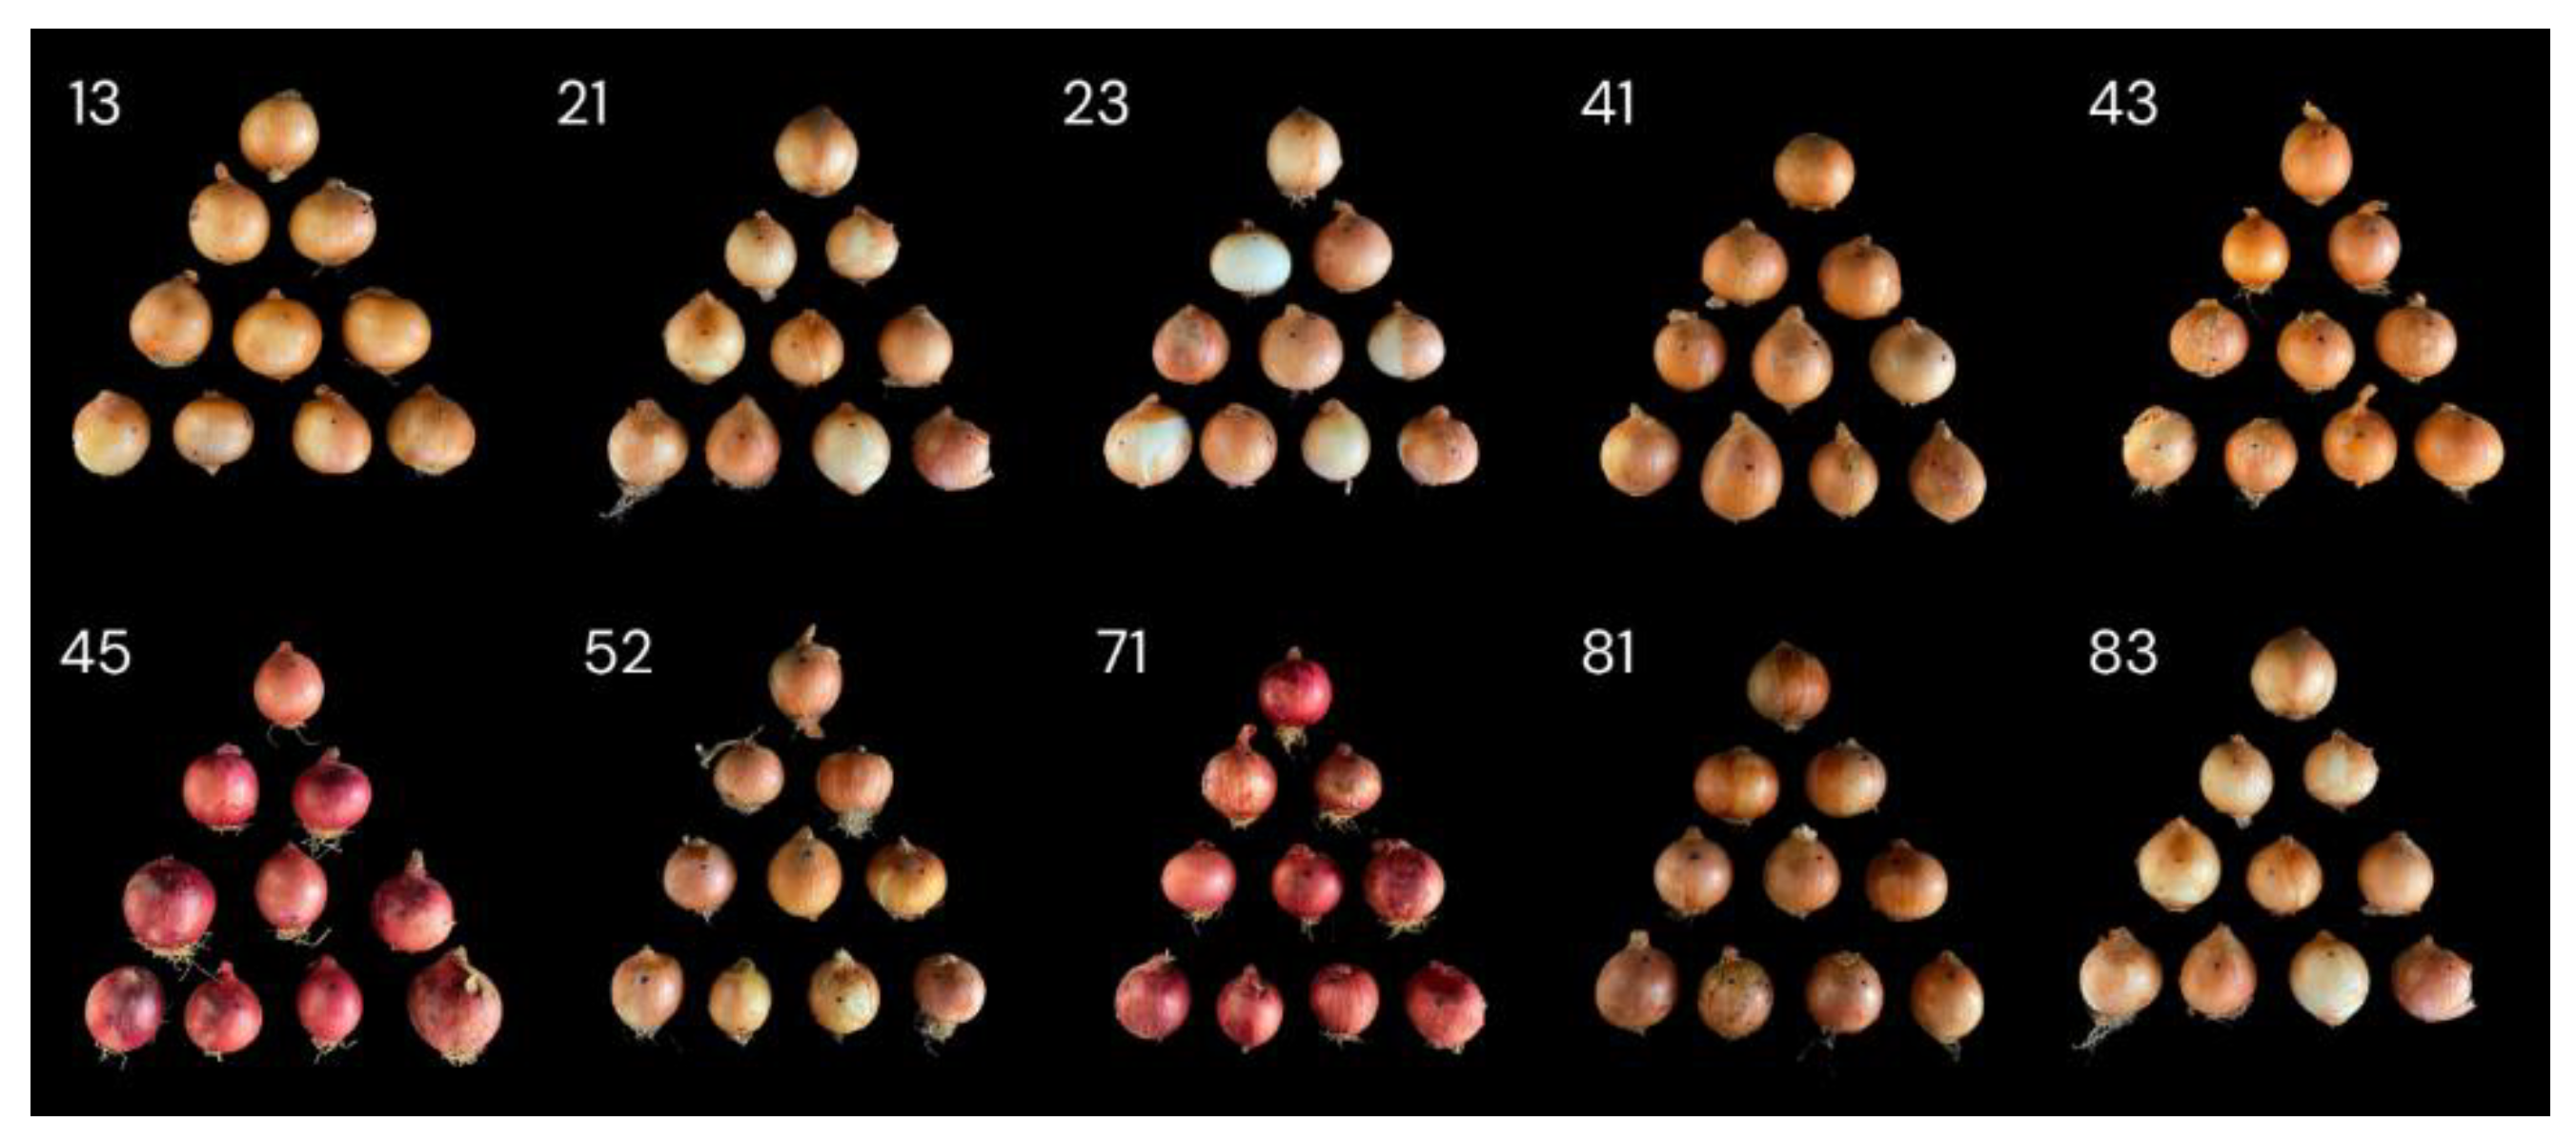
Figure 2.
Illustrative diagram of the distribution of cataphylls, highlighting the image analysis method used for counting and measuring thickness.
Figure 2.
Illustrative diagram of the distribution of cataphylls, highlighting the image analysis method used for counting and measuring thickness.
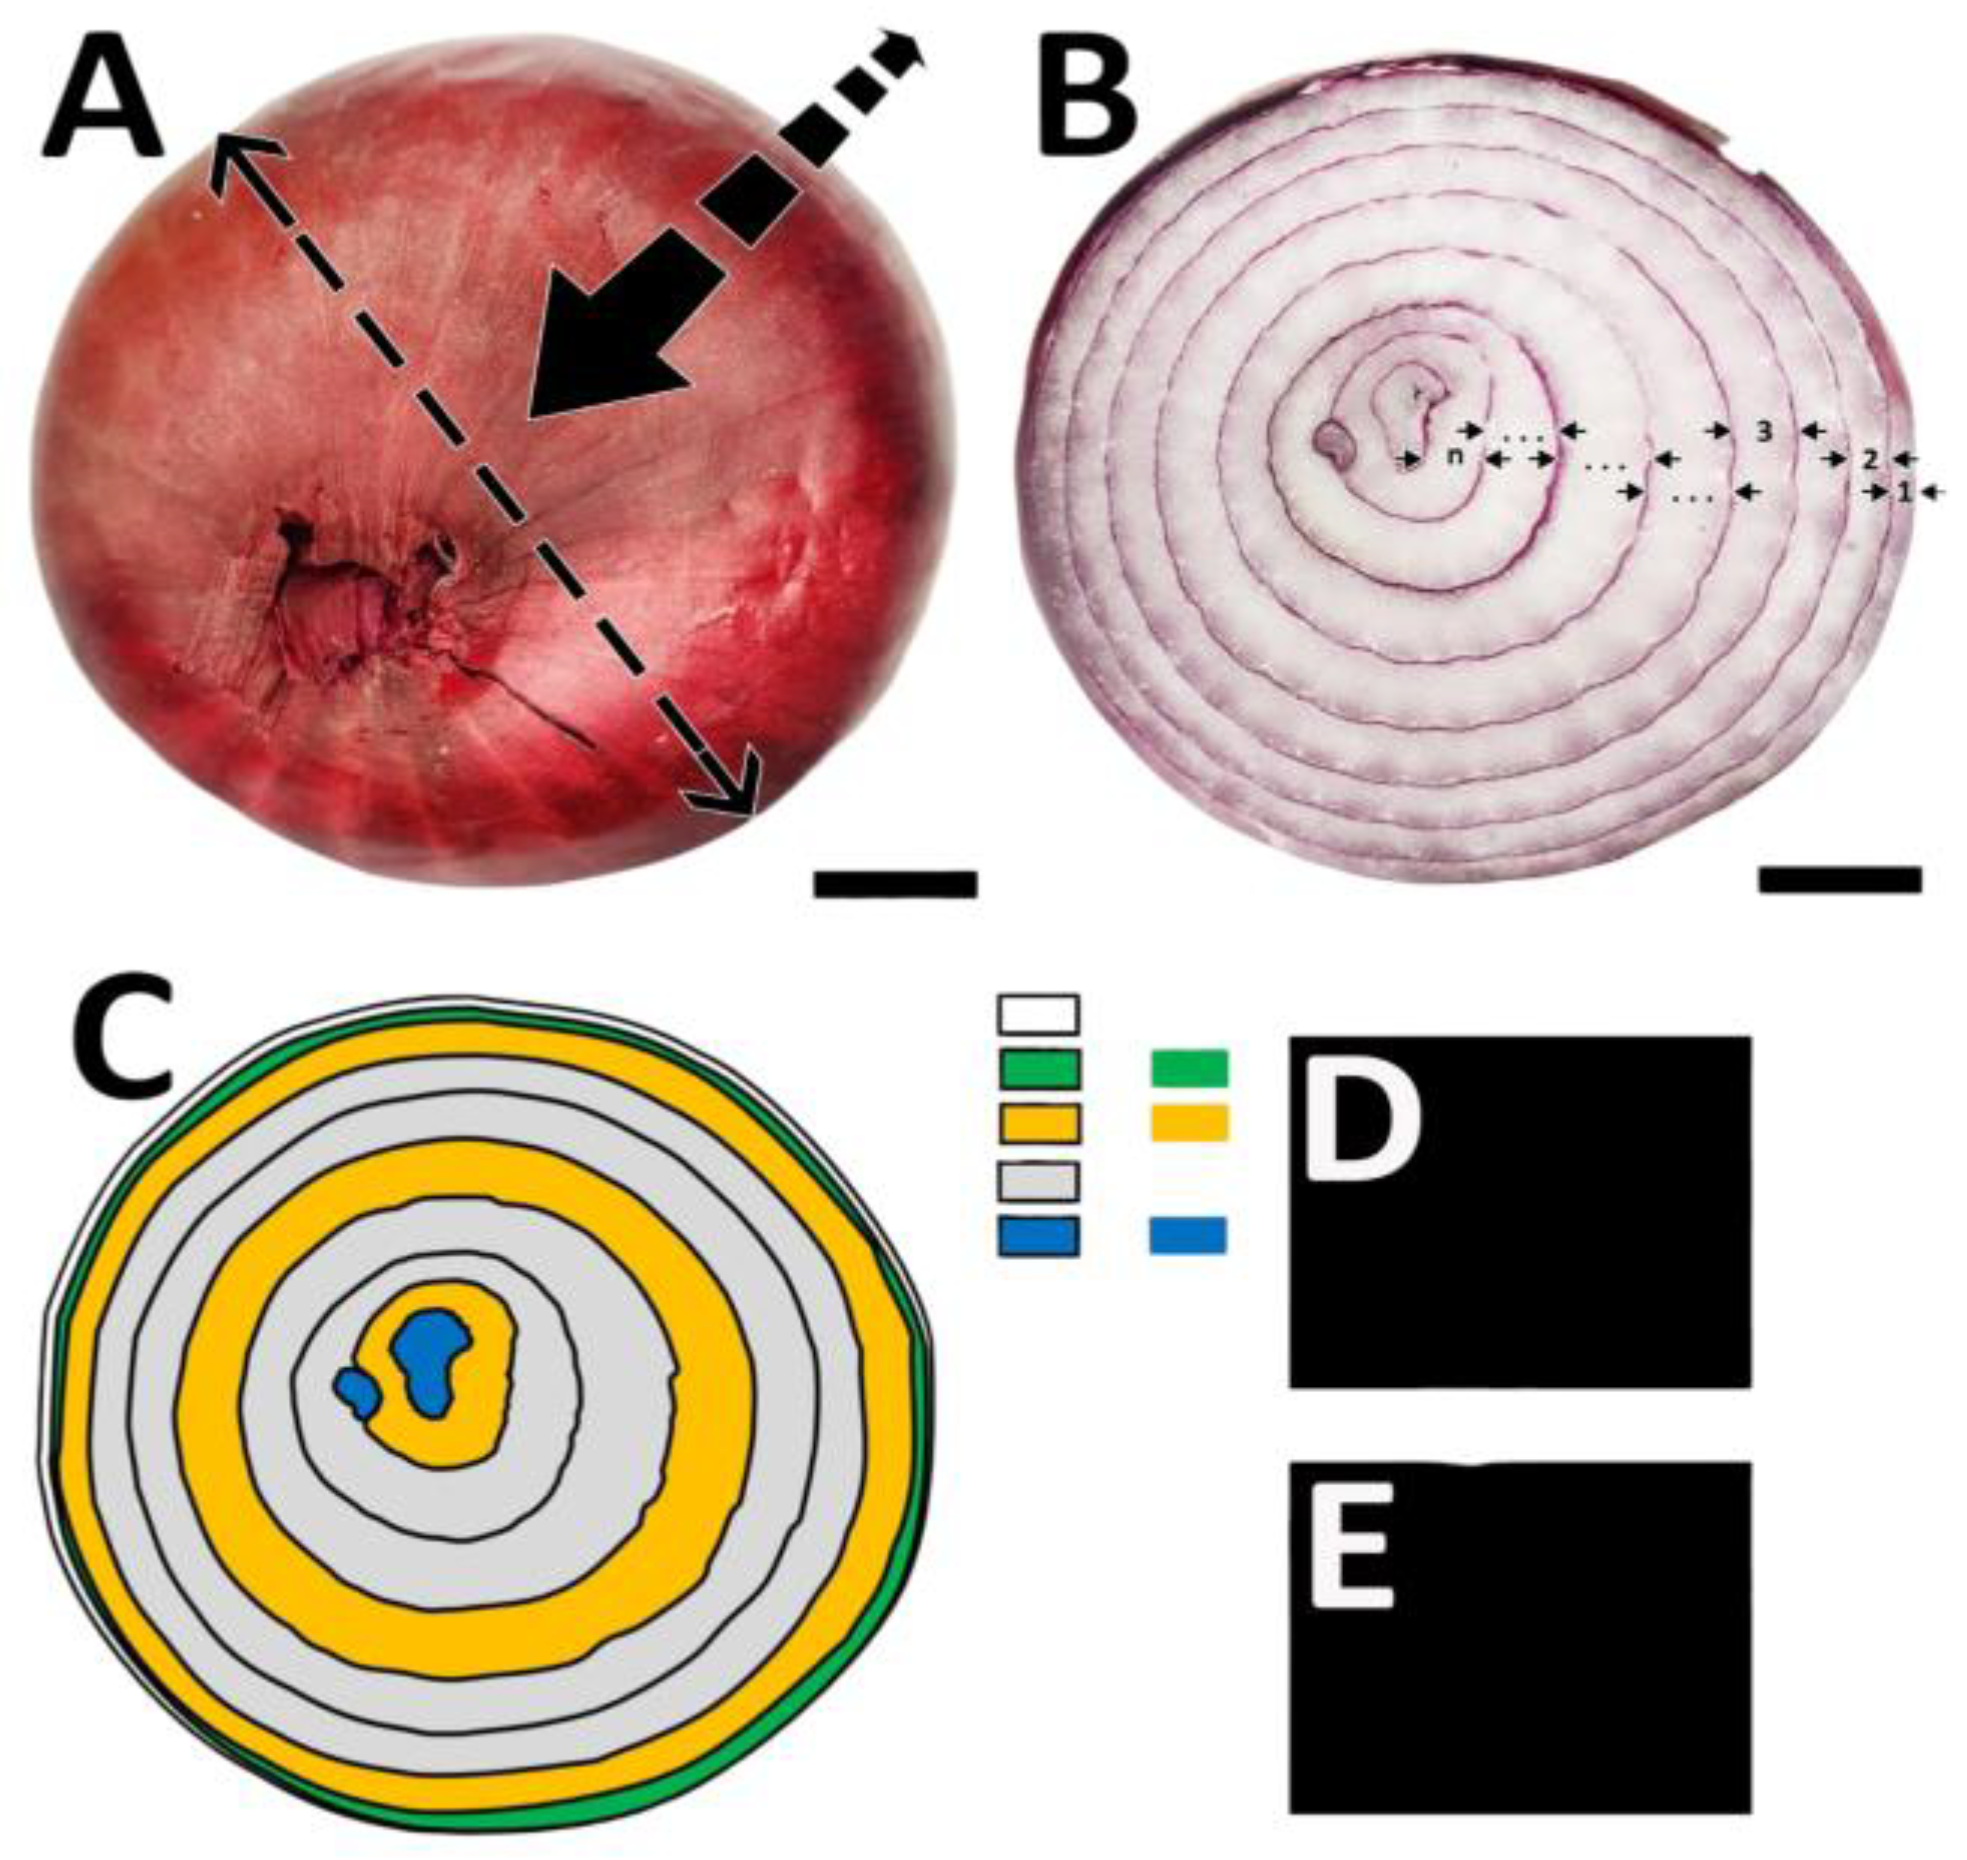
Figure 3.
Correlation analysis between physical-chemical variables of onion genotypes.
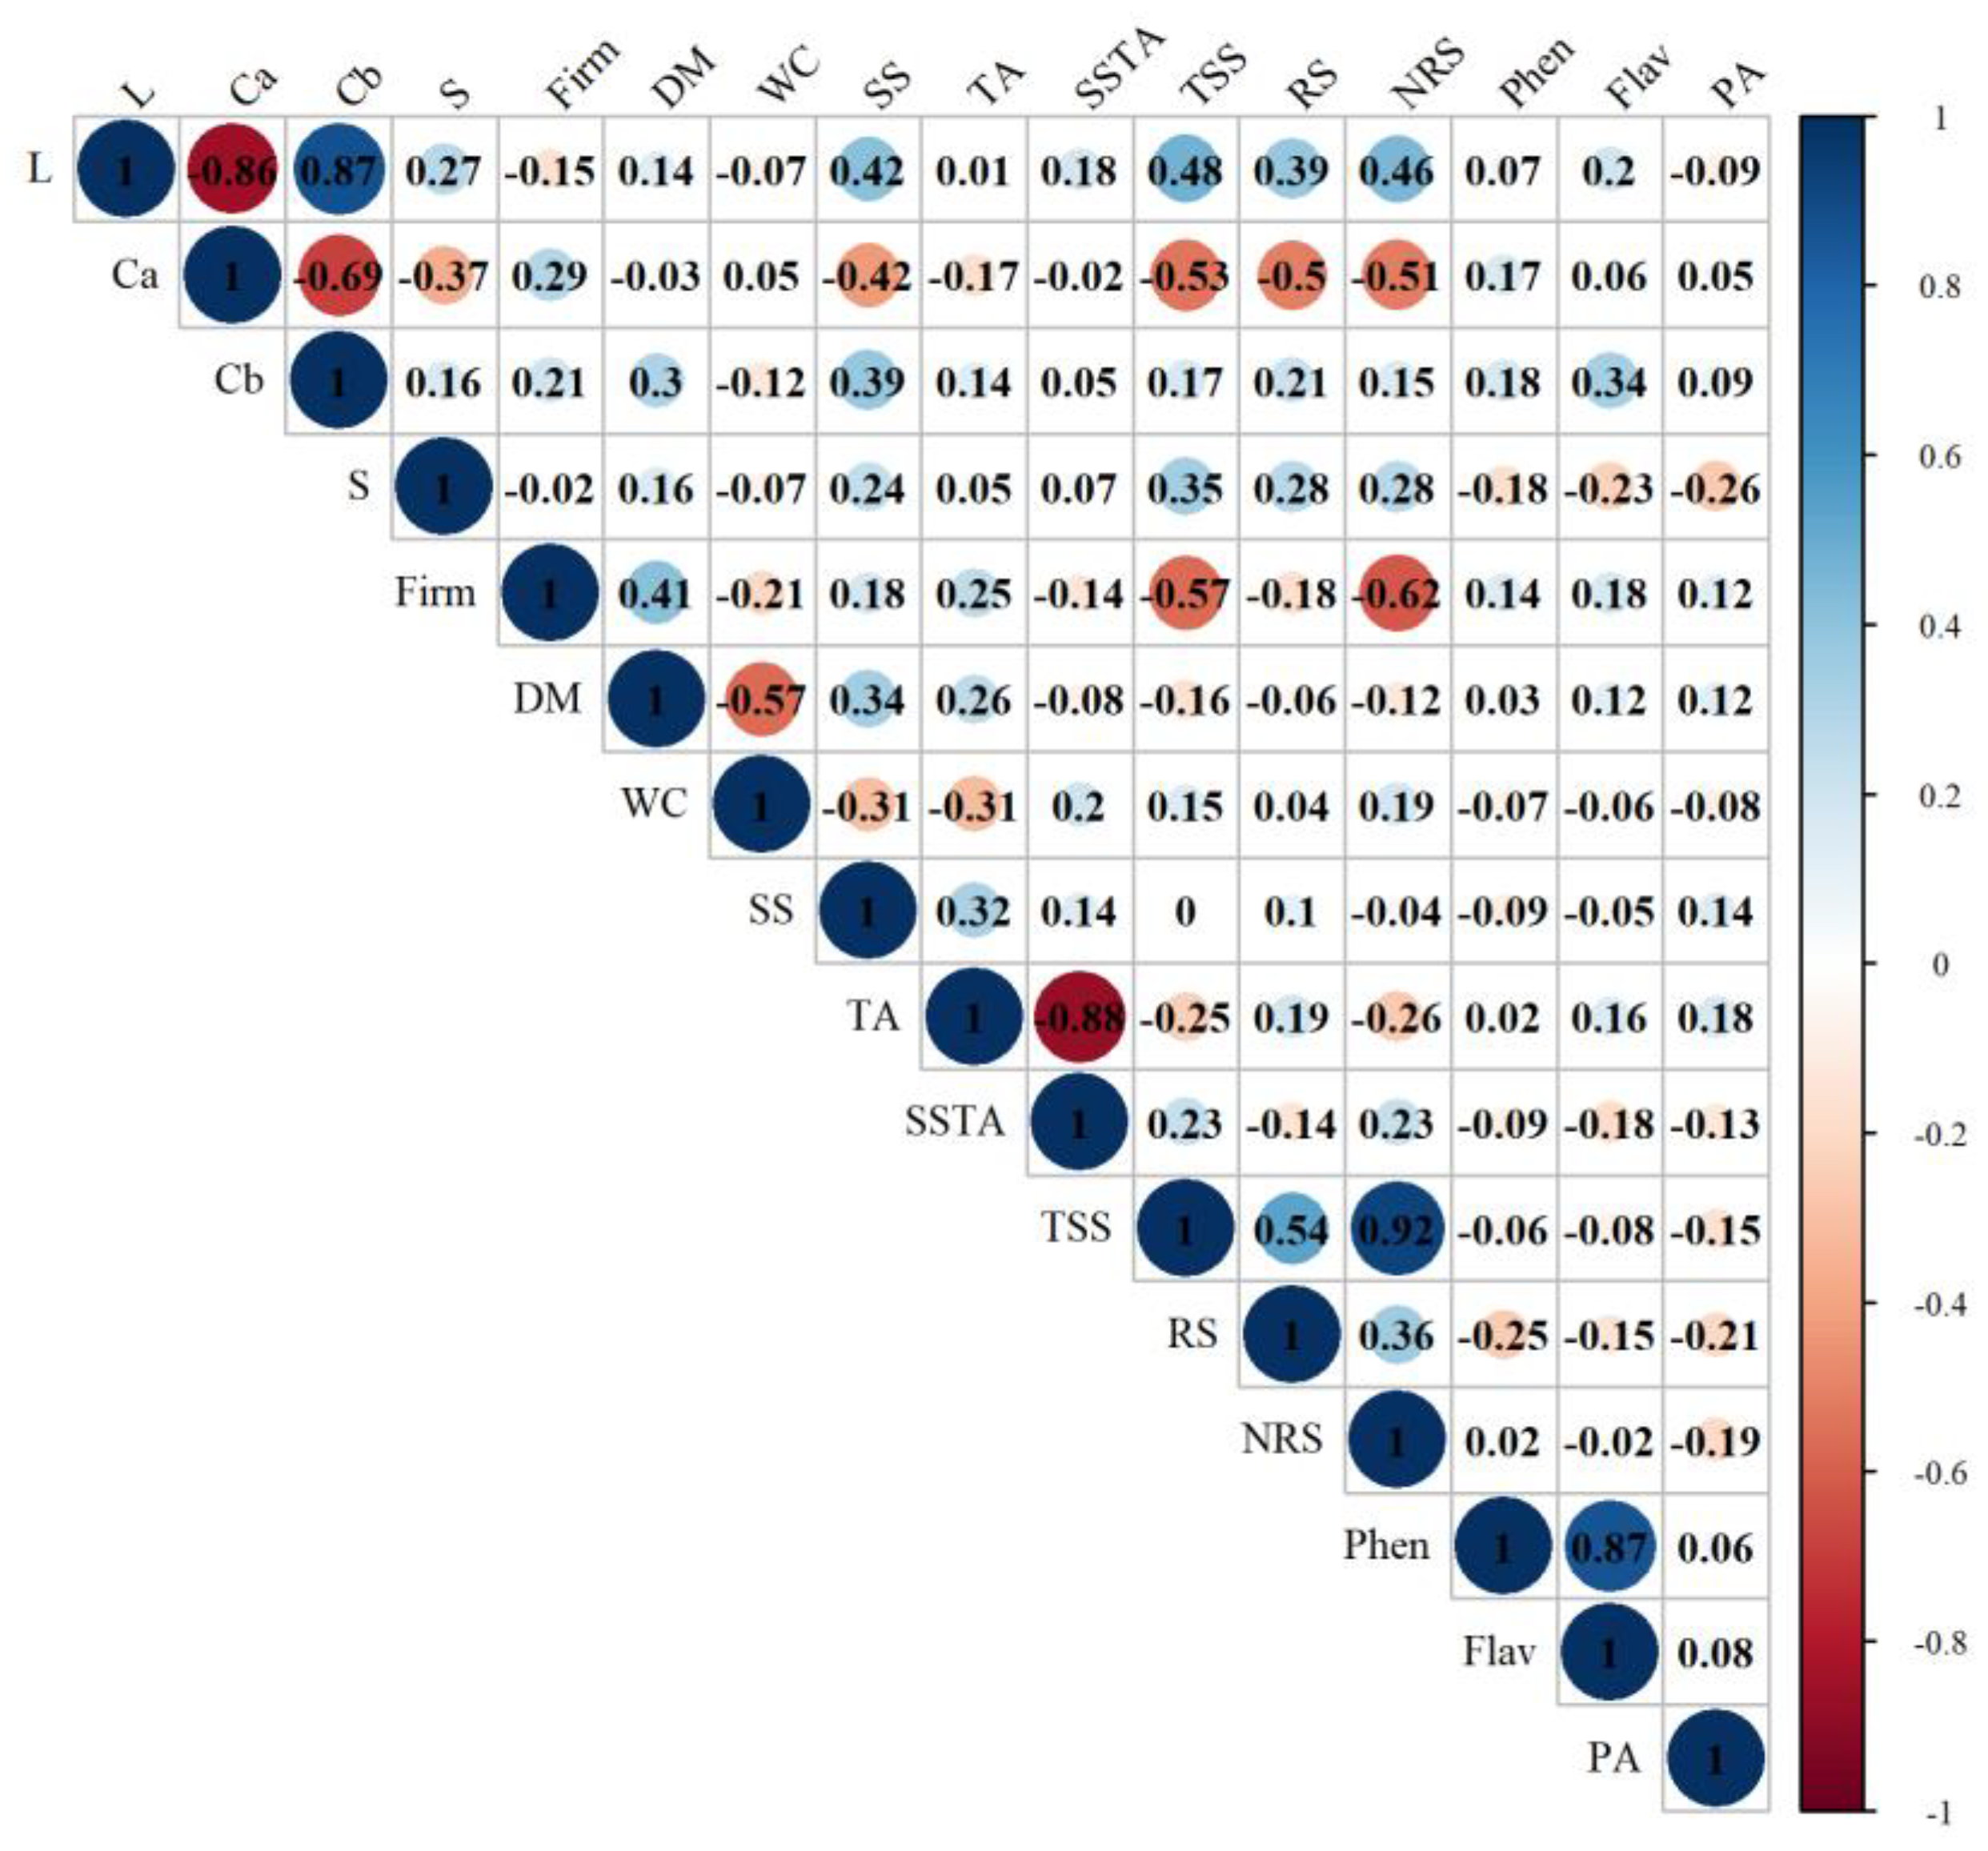
Figure 4.
Principal Component Analysis (PCA) with Cluster Clustering of onion genotypes.
Disclaimer/Publisher’s Note: The statements, opinions and data contained in all publications are solely those of the individual author(s) and contributor(s) and not of MDPI and/or the editor(s). MDPI and/or the editor(s) disclaim responsibility for any injury to people or property resulting from any ideas, methods, instructions or products referred to in the content. |
© 2025 by the authors. Licensee MDPI, Basel, Switzerland. This article is an open access article distributed under the terms and conditions of the Creative Commons Attribution (CC BY) license (http://creativecommons.org/licenses/by/4.0/).
Copyright: This open access article is published under a Creative Commons CC BY 4.0 license, which permit the free download, distribution, and reuse, provided that the author and preprint are cited in any reuse.


