
Submitted:
17 April 2025
Posted:
21 April 2025
You are already at the latest version
Abstract
This study aimed to isolate and optimize cellulase production by Nigrospora oryzae from decaying wood. N.oryzae was screened for cellulase enzymes production using carboxyl methyl cellulase congo red. Cellulase enzymes production was carried out using maize cobs and sugarcane bagasse as substrates and optimize using one variable at a time procedure. Maximum total cellulase activity (Fpase) were 11.3±0.94 IU/ml and 8.9±0.47IU/ml on maize cobs and sugarcane bagasse respectively after 9 days of incubation. Highest endoglucanase activity were 19.7±1.74 IU/ml and 15.5±0.76 IU/ml of maize cobs and sugarcane bagasse respectively after 12days of incubation. Maximum exoglucanase activity were 3.46 ±0.25IU/ml and 2.06±0.11IU/ml on maize cobs and sugarcane bagasse after 9 and 15 days of incubation respectively. Effect of pH on cellulase production varied on the substrates after 3 and 6 days of incubation. Inorganic nitrogen sources (NH4)2SO4 and NH4N03 organic peptone and urea significantly increased cellulase production. Several soluble carbon sources such as fructose, mannitol, galactose, sucrose and glucose also enhance cellulase enzyme production. A mixture substrate ratio of 1:2.5to 1:3.0 resulted in maximum cellulase production. Enzyme laoding of 5% and substrate loading of 15% for maize cobs and 10% sugarcane bagasse resulted. In maximum reducing sugars production Maximum ethanol was obtained with substrate concentration 5%, 10% and 15% by simultaneous saccharification and fermentation with saccharomyces cerevisaie and 10FPu enzymes.
Keywords:
maize cobs
; sugarcane bagasse
; Nigrospora oryzae
; fermentation
; enzymes production
; pH
; incubation time moisture
; nitrogen and carbon supplementation
; surfactants
; saccharification
; ethanol production
1. Introduction
Energy and a clean ecosystem are the key ingredient of human life in the world. Currently there is a worldwide energy insufficient problematic , extremely in developing countries (Sulyman et al.,2020) brought about by global fossil fuel demand-supply problems, such as excessive exploitation and utilization, brutality and economic and government disasters around the supply regionals, increasing severe pollution, and climate change make renewable energy responses more necessary now than before. Applying renewable energy source to replace fossil fuels reducing world warming and ecosystem degradation, since about 85% of the annual greenhouse gas emission due to fossil energy use. On the opposite, proper use of biomass e.g lignocellulose biomass does not result in ecosystem degradation, making biomass strengthen energy source with great accessibility (Amaefule et al., 2023).
Lignocellulose plant biomass is one of the most abundant, economic and renewable resource that can be using in production value added products such as biofuels and as substrates for the enzymes production of such as cellulases (Kim, et al., 2014; Visser, et al., 2015). Lignocellulose is the main compound of the plant cell wall and is essentially major unit of cellulose (35-50%), hemicellulose (25-30%) and lignin (25-30%) (Mostafa et al, 2024). Lignocellulose is efficiently hydrolyzed and recycled in nature by microorganism that produce 3 classes of enzymes-hydrolases, that can involve cellulases and hemicellulases; lyases and oxidoreductases, that can be involved the lignin degrading enzymes (Christopher, et al., 2023). Cellulose is a polysaccharide of glucose monomers linked by β-1,4-glycosidic bonds. Cellulose can be hydrolyzed to glucose by acid treatment or by cellulase enzymes. Cellulases are a complex of three types of enzymes namely endoglucanse, cellobiohydrolase (exoglucanase) and β-glycosidase it works cooperatively to hydrolyze cellulose to glucose (Escuder-Rodríguez et al., 2018). Endoglucanases randomly cleave the β-1,4-D-glycosidic affinity to generate new reducing and non-reducing ends of cellulose molecules. Exoglucanases further break down cellulose chains into cellobiose units at their ends. Finally, β-glucosidases hydrolyze glucose dimers and oligomers into individual glucose molecules completing the hydrolysis process (Deswal, et al., 2011).
Production of cellulase has been produced from a broad different microorganism including bacteria and fungi. Therefore, filamentous fungi are more suitable commercial enzyme production, due to their amount of the enzymes that can be produced by these cultivation great than those found from yeast and bacteria. Industrially fundamental cellulase enzymes traditionally have been found in submerged fermentation (SmF) due to ease of manipulation , high control of environmental factors such as temperature and pH, using cellulose of different purity as substrates, which leads to high costs of the product because of low concentration of the enzyme and additional cost of downstream purification processes (Yoo, et al., 2014). Therefore, solid state fermentation (SSF) method ameliorated production and reducing the cost of enzyme produced. Filamentous fungi are the most common utilized microorganisms in SSF due to easy possibility to grow on solid materials with low water content. However a number of records describing utilizing agro industrial wastes in production of cellulase enzyme including wheat straw, wheat bran and rice straw as substrates. Filamentous fungi have been shown to grow well on these solid materials which resembles the conditions of their natural habitat (Mostafa, et al., 2024) and secrete the enzymes extracellularly (Behera and Ray, 2016). The other benefits of SSF include high productivity, simple method to use; little cost investment, little energy required and less water output, great product recovery and absence of foam build up and is recorded to be preferable proper procedure for cellulase enzyme production in developing countries (MaMrudula, 2011). Currently there is a great demand for cellulases in many industries such as food, paper and pulp, textiles, pharmaceuticals, alcoholic beverages, starch processing, and biofuel production (Boondaeng, 2024 ).
Cellulases is the 3rd largest industrial enzymes and its demand is projected to grow strongly in the future due to commercial biofuel production ( Szijártó, et al., 2013; Rodrigues and Odaneth, 2021). However, this will require a reduction in the cost of enzyme production to make the process economically feasible (Bhardwaj et al., 2021). Cellulase enzymes production is an inducible process affected by biochemical and physical parameters namely, microbial species, carbon source, incubation period, temperature, pH,etc., (Kuhad et al., 2011 ; Sharada et al., 2013 ; Patel et al., 2014). Different cellulase producing microorganisms require optimization of nutritional parameters such as carbon, nitrogen and mineral sources and physical parameters include pH and temperature (Sethi et al., 2013) for enhanced enzyme production. When the enzyme is produced, the cellulase enzyme can be practiced for different purposes such as saccharification of lignocellulose in production of glucose that can be fermented to bioethanol (Srivastava et al., 2023). In this study, Nigrospora oryzae was isolated and identified from decaying wood, and used to produce cellulases under SSF using locally sourced maize cobs and sugarcane bagasse as substrates. Various nutritional and physical chemical parameters were evaluated the maximum cellulase production using one variable at time (OVAT) approach. Factors contributing to high cellulase enzyme production were applied in enzyme production and whole fermented broth obtained was used for saccharification of maize cobs and sugarcane bagasse for production of ethanol utilized simultaneous saccharification and fermentation with Saccharomyces cerevisiae.
2. Materials and Methods
2.1. Collection of Samples
Decaying wood specimens were collected from Kenyatta university environments. Samples were taken to the Laboratory of Microbial Biotechnology, Kenyatta University and stored at appropriate required temperature.
2.2. Isolation of Fungi
The decaying wood samples were sectioned into 1cm×2cm pieces. Each specimen were sterilized using 1% sodium hypochlorite for 1 min and rinsed five times with sterile distilled water and then both dried with sterilize filter paper. Samples were directly plated on 1% carboxymethycellulose (CMC)-congo red agar plates supplemented with 200 mg/l gentamycin. The plates were incubated at accepted temperature and monitored daily for fungal growth. Emerging calories were sub-cultured into CMC agar media for isolation of cellulase decaying fungi.
2.3. Subculturing Cellulolytic Fungi
Samples growing on CMC- Congo red agar were subculture on potato dextrose agar (PDA) medium prepared from an infusion of 200 g of red potato, 40 g of dextrose and 15 g of agar and sterilized at 1210C,15 Psi for 15 minutes. The medium was supplemented with 200 mg/l gentamycin to inhibit bacterial growth.
2.4. Molecular Identification of Nigrospora oryzae
Total genome DNA was isolated as described by Xin and chen j (2012). The ITS sequence of Nigrospora aryzae was amplified by PCR utilizing ITS4R (5-TCCTCCGCTTATTGATATGC-3’) and ITS86F(5-GTGAATCATCGAATCTTTGAA-3’) primers (Op deBeeck et al, 2014). Total volume of 22 ul PCR reaction mixture was used consisting of 10.6 ul ad H20 ,2 ul forward, primers, 2 ul reverse primers ,4 ul myTaq buffer ,04 units 0.4 ul) of myTaq polymerase (bioline USA) and 3 ng template DNA. PCR conditions were as follow cycle at 950C initial denaturation for 3 minutes; 35 cycles of 950c denaturation for 3 seconds ,550C annealing for 30 seconds and extension for 1 minute at 720C. A final extension at 720C for 10 minutes and holding stage at 50C. The PCR products were resolved on 1.2% agarose gel. The PCR products were cleared and sent for sequencing using sanger dideoxy sequencing by Microgen Inc (Netherlands).
2.5. Solid State Fermentation (SSF) for Cellulase Enzymes Production
2.5.1. Cellulosic Substrates
Sugarcane bagasse and maize cobs were locally sourced and evaluated as substrates production of cellulase enzymes. The cellulase substrate were ground using electric mill and sieved through a 2 mm sieve.
2.5.2. Solid State Fermentation (SSF) for Cellulase Enzymes Production
SSF was used for cellulase enzymes production in 350ml bottles. Five (5) g of substrate (sugarcane bagasse and maize cobs) were placed in the bottles and moistened with 10 ml of Bushnell-Hans solution [(w/v) 0.02 g CaCl2 ,0.2 MgSO4•7H2O g, 1g KH2PO4 ,0.1g FeCl3, 1g NH4NO3, 1g peptone, pH5.3]. The contain within the bottles were autoclaved at 1210C, 15 psi for 15 minutes. The bottles were inoculated with inoculum after cooling to room temperature.
2.5.3. Preparation of Inoculum
Seven (7) day old cultures of N. oryzae cultured on PDA were used to prepare inoculum. The fungal mycelium was scrapped from the plates and mixed with sterile physiological saline solution and then blended for 30 seconds. The mycelia mixture was used as SSF inoculum.
2.5.4. Enzyme Extraction
Crude cellulase enzyme was extracted by adding 50 ml of 50 mM citrate buffer pH 4.8 to each bottle. The bottles were vigorously shaken and left standing at the room temperature for 2 hours to extract the enzyme. The crude enzymes extract was filtered through a muslin cloth and a centrifuged at 10,000rpm for 10 minutes. The enzyme extract was stored at -200C until used for bioassays.
2.6. Cellulase Enzyme Assays
The crude enzyme extracts were utilized to determine Total cellulase activity (Fpase), Endoglucanase and exoglycanase activity as described by Kamande, et al., (2024). One unit of Fpase, endoglucanase and exoglucanase was described as the amount of enzymes releasing 1umol of reducing sugar per minute, under assay conditions.
2.7. Optimization of Culture Conditions for Enzyme Production
Production of cellulase enzyme was optimized by one variable at a time (OVAT) approach. Effect of time of incubation on cellulase enzyme production was determined by taking samples at 3 days intervals up 18 days and determining enzyme activity. Effect of pH was determined by adjusting initial pH of Bushenell-Haas, solution to pH (2-8) before dispensing to bottles with substrates. Effect of moisture was determined by adding Bushnell-Haas solution at the following ratios (w/v): 1:1, 1:1.5, 1:2.0, 1:2.5, 1:3.0, 1:3.5, 1:4.0 and 1:4.5 to substrate containing bottles. Effect of Nitrogen were determined by supplementing Bushnell-Hass solution with peptone, urea, asparagine, yeast extract, NH4N03, (NH4)2SO4, and NaNO3, and dispensing 10 ml to substrate containing bottles at final concentration of 20 mM and 80 mM. Concentration of yeast extract and peptone were determined using their percentage nitrogen content. Effect of supplemental carbon was done by adding glucose, galactose, fructose, sucrose, mannitol and maltose at 20 mM, and 80mM. Effect of surfactants was determined by incorporating 0.4% and 1.2% Tween-20, Triton X-100 and Sodium dodecyl sulfate (SDS). For effect of nitrogen, carbon and surfactants, bottles without supplementation were used as control and samples were taken on the 3rd and 6th days for enzyme bioassays.
2.8. Production of Cellulase Enzymes for Saccharification and Ethanol Production
The time of incubation and various physiochemical and nutritional parameters giving maximum enzyme activity were used to produce cellulases for saccharification and ethanol production using maize cobs and sugarcane bagasse. The produced cellulases were concentrated five-fold by freeze drying.
2.9. Effect of Enzymes Loading on Reducing Sugar Production Utilizing Maize Cobs and Sugarcane Bagasse Substrates and Nigrospora oryzae Cellulase Enzyme Extract
The effect of cellulase enzyme loading on reducing sugar production from maize cobs and sugarcane bagasse was determined using 5% maize cobs and sugarcane bagasse and 1%,2%,3%,4% and 5% enzymes loading over 72 hour incubation period. The total saccharification mixture of 25 ml contained substrate, enzyme, 100 mg/l gentamycin and fluconazole. Samples were taken at 12 hour intervals and the amount of reducing sugars produced were determined by the DNS method (Kamande, et al., 2024).
2.10. Effect of Substrate Loading on Reducing Sugar Production by Nigrospora oryzae Cellulase Enzymes
The effect of different substrate loading on reducing sugar production from maize cobs and sugarcane bagasse using Nigrospora oryzae cellulase enzymes, were determined by using 1%, 5%, 10% and 15% substrate loading over a 72-hour incubation period. Samples were taken at 12hour intervals and reducing sugars produced determined by the DNS method (Kamande, et al., 2024).
2.11. Simultaneous Saccharification and Fermentation of Maize Cobs and Sugarcane Bagasse Using Nigrospora oryzae Cellulase and Saccharomyces cerevisiae
Simultaneous saccharification fermentation was used to produce ethanol from maize cobs and sugarcane bagasse using Nigrospora oryzae cellulase and Saccharomyces cerevisiae with over a 72-hour period. The fermentation mixture contained, the substrate, the optimized cellulase enzyme titer, 1x10⁶ ml yeast cells, and 100mg/l gentamycin in a total volume of 25 ml using Falcon tubes. Five (5) FPU of commercial cellulase was used as positive control. Samples were taken at 12 hours’ interval and ethanol produced determined by the Potassium dichromate method (Caputi, et al., 1968) and quantified using an ethanol standard curve.
2.12. Statistical Analysis
Enzyme activity absorbance data was transformed into international units (IU/ml) utilizing glucose standard curves as detailed Rahnama et al.2024. Ethanol produced found in triplicates was typed in Excel spreadsheet and transformed into mg/ml of ethanol. The data was imported in R software version 3.5.1 (2018) and evaluated for normality utilizing Shapiro-Wilk and equality of variance utilizing Levene's test. Data in triplicates were statistically analyzed utilizing one-way ANOVA at P ≤ 0.05 significant level. Any significant varied in the factors affecting enzyme and ethanol product were determined by Tukey's HSD Post Hoc test. Molecular analysis sequences were compared with the sequences in the nucleotide database (NCBI) utilized BLAST technique. The MEGA software version X program was utilized for phylogenetic analysis and multiple alignments utilized CLUSTAL (Horiike, T ;2016). Tables and figures were utilized to present the data.
3. Results
3.1. Isolation of Nigrospora Oryzae
The ability of the fungus designated as KU_05 to grow on 1% carboxymethyl cellulose and congo red (Figure 1A) was used to determine its cellulolytic activity (Figure 1B)
Molecular Identification of Nigrospora oryzae
Nigrospora oryzae was identified based on the internal transcribed spacer region (ITS) sequence located between the 18S rRNA and 5.8S rRNA coding genes. This regional is widely utilizing for analyzing fungal diversity (Rittenour, et al., 2014). The alignment of the ITS fragment (574bp) in the NCBI database by the BLASTN program reported that it was Nigrospora oryzae (97.5% identity). The result of the nucleotide sequence of 5.8S rRNA were deposited in the GeneBank database under the accession number PQ896652.
The evolutionary history of Nigrospora oryzae was inferred using the Neighbor-Joining technique (Saitou et al., 1987). The percentage of replicate trees that can be associated with taxa clustered cooperation in the bootstrap test (1000 replicates) are indicated above the branches (Felsenstein; 1985). The evolutionary distances were computed utilizing the Kimura 2-parameter method (Kimura M.; 1980) and are in the units of the number of base substitutions per site. The rate of variation between sites was modeled with a gamma distribution (shape parameter = 1). Evolutionary analyses were carry out inMEGA11 (Tamura et al., 2021) (Figure 2)
3.2. Effect of Incubation in Production of Celluloses Enzymes by Nigrospora oryzae
Incubation time take a key fundamentals of metabolic activity of microorganisms since it is directly associated to the production of enzymes and various metabolites. Fpase production increased from 3rd day of incubation and reached a maximum on the 9th day at 11.3 ±0.94 IU/ml for maize cobs and decreasing 2.6 fold by the 18th day of cultivation. On sugarcane bagasse, the highest Fpase was reported on the 9th day which however was not significantly higher than that reported on the 3rd and 6th days of cultivation. Fpase production on the two substrate did not differ significantly except on the 15th day of incubation (Table 1). Endoglucanase production on maize cobs reached a maximum at 19.7±1.74IU/ml on the 12th of cultivation which did not differ significantly from that reported on the 3rd and 15th days of incubation. On sugarcane bagasse, the highest endoglucanase activity was reported of 15.5 ±0.76 IU/ml on the 12th day of cultivation which was only significantly higher than that reported on the 6th and 18th day of incubation (Table 1). Endoglucanase activities between the two substrates were significantly different only the 18th day of incubation. Exoglucanase production on maize cobs peaked at 3.46±0.25IU/ml on the 9th day of cultivation but was not significantly higher than that reported on the 3rd and 6th days of incubation. On sugarcane bagasse, the highest exoglucanase activity was 1.96 ±0.16 IU/ml which was only significantly higher than that reported on the 18th day of cultivation. Significantly higher exoglucanase activities were reported on maize cobs compared to sugarcane bagasse over the incubation period except on the 12th day of cultivation at which they did not significantly differ (Table 1).
3.3. Effect of pH on Production of Cellulase Enzymes by Nigrospora oryzae
pH is fundamentals key element in production of cellulase enzymes. The control of pH during the growth cellulase producing microorganisms is important as it affects the morphology of the microorganisms and their ability to secrete cellulase enzymes. The highest Fpase activities were recorded on the 3rd day of incubation and were 19.0±1.33 IU/ml for maize cobs and 19.1±1.0 IU/ml for sugarcane bagasse recorded at pH 7 and 3 respectively (Table 2). These Fpase activities did not differ significantly from those recorded with the other pH values. On the 6th day of cultivation, the highest Fpase activity on maize cobs was 18.6±1.62 IU/ml recorded with pH 5.0 which was only significantly higher that reported at pH 2, 3 and 8. On sugarcane bagasse, the highest Fpase recorded on the pH 2 on the 6th day. Nigrospora oryzae produced endoglucanase activities that did not differ significantly over the pH values on the 3rd day of incubation when cultivated on maize cobs (Table 2). On sugarcane bagasse, the highest endoglucanase activity of 42.6±0.86 IU/ml was produced at pH 4 and was significantly higher compared to the other pH values. On the 6th day of cultivation the highest endoglucanase activity on maize cobs was 33.4±1.27 IU/ml recorded on pH 2 and was only significantly higher than that reported at pH 3. On sugarcane bagasse, the highest endoglucanase activity on the 6th day of cultivation was 33.0±1.160IU/ml reported on pH 2 and was only significantly higher than that recorded at pH 7. Exoglucanase activities on maize cobs and sugarcane bagasse showed interesting trends at the different pHs tested. On maize cobs the highest exoglucanase activity was 6.02 ±0.03 IU/ml on the 3rd day of cultivation which however did not differ significantly from those reported on the other pH values. For sugarcane bagasse the highest exoglucanase activity of 7.85 ±0.31 IU/ml was reported at pH 8 on the 3rd day of cultivation and was only significantly higher than that reported on the pH 7. On the 6th day of cultivation the highest exoglucanase activity of 7.58 ±0.47 IU/ml reported on maize cobs at pH 2.0 was not significantly varied from those reported on the other pH values. On sugarcane bagasse highest exoglucanase of 9.13 ±0.68 IU/ml at pH 2.0 was not significantly higher than that reported with pH 6 after 6 days of incubation.
3.4. Effect of Nitrogen Supplementation on Production of Cellulase Enzymes by Nigrospora oryzae
The type of and amount of nitrogen are fundamentals factors in the synthesis and secretion of enzymes and other microbial proteins. Therefore, the best nitrogen source is the one that initiate enzymes synthesis and secretion. In this study seven different kinds of nitrogen sources were investigated for the production of cellulase by Nigrospora oryzae at two concentrations (20 mM and 80 mM) at two incubation periods (3 and 6). The results are summarized in Table 3a–f The highest Fpase activity on maize cobs supplemented with 20mM was 24.413 ±3.26 IU/ml using (NH4)2SO4 which was not significantly different to with Fpase recorded with asparagine, peptone and urea after 3 days of incubation. Increasing the concentration to 80mM resulted in the highest Fpase activity of 25.4 ±0.95 IU/ml with urea supplementation which was not significantly higher than supplementation with asparagine, NH4N03, peptone and yeast extract. On sugar cane bagasse the highest Fpase activity was 19.6±1.66 IU/ml with 20 mM supplementation with (NH4)2SO4 which was only significantly higher than supplementation with asparagine and NaNO3. Increasing the concentration of nitrogen to 80 mM resulted in highest Fpase activity of 23.0±1.42 IU/ml with (NH4)2SO4 which was statistically comparable to that produced by peptone and yeast extract on maize cobs. On the 6th day of incubation supplementation with 20 mM and 80 mM of (NH4)2SO4 resulted in the highest Fpase activities of 23.3±1.64 IU/ml and 24.5±1.46 IU/ml on maize cobs respectively. On sugarcane bagasse the highest Fpase activities of 18.9 ±0.78 IU/ml and 20.8±1.15 IU/ml were reported with 20mM (NH4)2SO4 and 80mM urea respectively. Endoglucanase activity produced by Nigrospora oryzae varied with the type of nitrogen and substrate used. The highest endoglucanase activity recorded on the 3rd day of incubation was 45.3 ±1.47 IU/ml recorded with 20 mM NH4N03 which was significantly higher compared to those produced by the other nitrogen sources and control. Similarly increasing the nitrogen concentration to 80 mM resulted in the highest endoglucanase activity of 38.4±1.160 IU/ml with NH4N03 which was only significantly higher than that recorded with urea supplementation and in the control. On sugarcane bagasse the highest endoglucanase activities of 31.2 ±0.30 IU/ml and 42.1±0.81 IU/ml were reported with 20mM peptone and 80 mM (NH4)2SO4 respectively. These endoglucanase activities were significantly higher compared with that recorded in control and with the other nitrogen sources. On the 6th day of incubation 20 mM urea and 80 mM peptone produced the highest endoglucanase activity of 42.7 ±1.52 IU/ml and 40.1±1.33 IU/ml accordingly on maize cobs. On sugarcane bagasse 20 mM NH4N03 and 80 mM NaN03 supplementation resulted in the highest endoglucanase activities of 33.5±0.95 IU/ml and 37.3±0.56 IU/ml respectively. The highest exoglucanase activities on maize cobs on 3rd day of incubation were 9.66±1.12 IU/ml and 8.8±0.57 IU/ml recorded with 20 mM and 80 mM supplementation with NH4N03. On sugarcane bagasse 20 mM peptone and 80 mM (NH4)2SO4 supplementation resulted in exoglucanase activities of 8.70±0.65 IU/ml and 8.62±0.32 IU/ml respectively. On the 6th day of incubation the highest exoglucanase activity on maize cobs was 8.96 ±0.78 IU/ml with 20 mM yeast extract which was only significantly higher than that recorded with 20 mM asparagine, NaN03 and in control. Increasing the concentration to 80 mM resulted in the highest exoglucanase activity of 7.92±0.46 IU/ml in control which was only significantly higher that supplementation with 80mM (NH4)2SO4. On sugarcane bagasse the highest exoglucanase activity was achieved on the control which was only significantly higher compared to supplemented with 20 mM urea, peptone and yeast extract. Increasing the concentration of nitrogen supplementation to 80 mM resulted in the highest exoglucanase of 7.18±0.22 IU/ml with NaN03 which was only significantly higher compared with supplementation with NH4N03.

Table 3a.
Filter paper activity after Nitrogen supplementation at 3rd day of incubation.
| Substate | Nitrogen | Mean ± sem | Mean ± sem |
| 20 mM | 80 mM | ||
| Control | 16.3 ± 1.08a | 11.2 ± 0.78c | |
| (NH4)2SO4 Asparagine |
23.6 ± 3.26a 20.2 ± 1.33a |
11.8 ± 0.45c 20.4 ± 0.97ab |
|
| Maize cobs | NaNO3 NH4NO3 Peptone |
17.6 ± 1.26a 17.4 ± 1.67a 18.3 ± 0.76a |
19.8 ± 1.42b 24.1 ± 1.80ab 21.2 ± 1.08ab |
| Urea | 20.1 ± 1.49a | 25.4 ± 0.95a | |
| Yeast Extract | 17.8 ± 1.29a | 25.1 ± 1.18ab | |
| Control | 16.3 ± 0.80ab | 10.7 ± 0.25d | |
| (NH4)2SO4 Asparagine |
19.6 ± 1.66a 11.8 ± 1.20b |
23.0 ± 1.42a 15.4 ± 0.90c |
|
| Sugarcane bagasse | NaNO3 NH4NO3 Peptone |
13.6 ± 1.24b 19.6 ± 1.43a 16.2 ± 0.90ab |
16.4 ± 0.49c 18.5 ± 0.74bc 19.4 ± 0.96abc |
| Urea | 16.6 ± 0.97ab | 17.8 ± 0.49c | |
| Yeast Extract | 13.7 ± 0.80ab | 22.3 ± 1.06ab |
Note: Treatments with means of varied letter in the similar columns for substrate are significantly varied at p≤0.05.
Table 3b.
Filter paper activity after Nitrogen supplementation at 6th day of incubation.
| Substate | Nitrogen | Mean ± sem | Mean ± sem |
| 20 mM | 80 mM | ||
| Control | 14.8 ± 0.83b | 16.2 ± 1.21bc | |
| (NH4)2SO4 Asparagine |
18.1 ± 1.61ab 16.7 ± 1.06b |
18.5 ± 0.65b 16.8 ± 0.88bc |
|
| Maize cobs | NaNO3 NH4NO3 Peptone |
17.4 ± 1.19ab 23.3 ± 1.64a 20.3 ± 0.85ab |
19.2 ± 0.84b 24.5 ± 1.46a 20.7 ± 1.22ab |
| Urea | 16.5 ± 1.12b | 13.6 ± 0.92cd | |
| Yeast Extract | 19.2 ± 1.18ab | 10.4 ± 0.40d | |
| Control | 16.7 ± 1.39ab | 12.0 ± 0.47d | |
| (NH4)2SO4 Asparagine |
16.1 ± 0.14ab 10.2 ± 0.46d |
16.4 ± 0.15bc 17.1 ± 0.94bc |
|
| Sugarcane bagasse | NaNO3 NH4NO3 Peptone |
13.8 ± 0.70bc 18.9 ± 0.78a 15.8 ± 0.46ab |
12.8 ± 0.52d 19.8 ± 0.80ab 14.4 ± 0.70cd |
| Urea | 13.6 ± 0.35bcd | 20.8 ± 1.15a | |
| Yeast Extract | 12.0 ± 0.58cdb | 17.9 ± 0.98abc |
Note: Treatments with means of varied letter in the similar columns for substrate are significantly varied at p≤0.05.
Table 3c.
Endoglucanase activity after Nitrogen supplementation at 3rd day of incubation.
| Substate | Nitrogen | Mean ± sem | Mean ± sem |
| 20 mM | 80 mM | ||
| Control | 29.3 ± 1.38cd | 21.0 ± 0.27c | |
| (NH4)2SO4 Asparagine |
24.7 ± 1.39de 35.7 ± 1.78b |
38.2 ± 3.45a 33.4 ± 1.93ab |
|
| Maize cobs | NaNO3 NH4NO3 Peptone |
33.1 ± 1.19bc 45.3 ± 1.47a 35.0 ± 0.57bc |
31.4 ± 0.59ab 38.4 ± 1.60a 32.8 ± 1.05ab |
| Urea | 33.0 ± 0.94bc | 27.2 ± 0.84bc | |
| Yeast Extract | 20.4 ± 0.50e | 32.2 ± 1.43ab | |
| Control | 23.8 ± 0.66b | 25.5 ± 1.60cd | |
| (NH4)2SO4 Asparagine |
20.8 ± 0.98bc 15.7 ± 0.24de |
27.5 ± 0.94bc 29.8 ± 0.40b |
|
| Sugarcane bagasse | NaNO3 NH4NO3 Peptone |
15.0 ± 0.58e 18.1 ± 0.43cde 31.2 ± 0.3a |
19.6 ± 0.31e 42.1 ± 0.81a 21.6 ± 0.73de |
| Urea | 18.5 ± 0.92cd | 15.4 ± 0.20f | |
| Yeast Extract | 16.5 ± 0.80de | 25.4 ± 0.88cd |
Note: Treatments with means of varied letter in the similar columns for substrate are significantly varied at p≤0.05.
Table 3d.
Endoglucanase activity after Nitrogen supplementation at 6th day of incubation.
| Substate | Nitrogen | Mean ± sem | Mean ± sem |
| 20 mM | 80 mM | ||
| Control | 28.7 ± 1.15bc | 26.5 ± 0.74bc | |
| (NH4)2SO4 Asparagine |
27.2 ± 1.71c 33.8 ± 1.65b |
35.5 ± 4.82ab 25.7 ± 0.63bc |
|
| Maize cobs | NaNO3 NH4NO3 Peptone |
27.3 ± 0.34bc 27.5 ± 0.89bc 28.2 ± 0.58bc |
28.6 ± 1.35abc 27.3 ± 1.00bc 40.1 ± 1.23a |
| Urea | 42.7 ± 1.52a | 30.7 ± 0.93ab | |
| Yeast Extract | 26.5 ± 1.39c | 17.9 ± 0.48c | |
| Control | 24.8 ± 0.97c | 18.7 ± 1.18d | |
| (NH4)2SO4 Asparagine |
30.9 ± 1.43ab 17.0 ± 0.68d |
24.0 ± 0.98c 29.7 ± 0.86b |
|
| Sugarcane bagasse | NaNO3 NH4NO3 Peptone |
31.3 ± 1.28ab 33.5 ± 0.95a 22.2 ± 0.54cd |
37.3 ± 0.56a 18.9 ± 0.77d 28.4 ± 1.01bc |
| Urea | 27.3 ± 1.12bc | 35.8 ± 1.25a | |
| Yeast Extract | 30.6 ± 1.44ab | 33.1 ± 1.19ab |
Note: Treatments with means of varied letter in the similar columns for substrate are significantly varied at p≤0.05.
Table 3e.
Exoglucanase activity after Nitrogen supplementation at 3rd day of incubation.
| Substate | Nitrogen | Mean ± sem | Mean ± sem |
| 20 mM | 80 mM | ||
| Control | 7.33 ± 0.29ab | 5.48 ± 0.09bc | |
| (NH4)2SO4 Asparagine |
6.61 ± 0.48b 6.92 ± 0.04b |
5.11 ± 0.43c 7.15 ± 0.61ab |
|
| Maize cobs | NaNO3 NH4NO3 Peptone |
9.66 ± 1.12a 5.14 ± 0.65b 6.96 ± 0.35b |
8.80 ± 0.57a 6.91 ± 0.28abc 7.77 ± 0.36a |
| Urea | 7.58 ± 0.48ab | 7.34 ± 0.21ab | |
| Yeast Extract | 5.34 ± 0.13b | 8.01 ± 0.27a | |
| Control | 6.22 ± 0.23b | 5.36 ± 0.18bc | |
| (NH4)2SO4 Asparagine |
6.33 ± 0.27b 6.07 ± 0.35b |
8.62 ± 0.32a 6.79 ± 0.30b |
|
| Sugarcane bagasse | NaNO3 NH4NO3 Peptone |
5.72 ± 0.50b 5.17 ± 0.10b 8.70 ± 0.65a |
5.42 ± 0.30bc 6.02 ± 0.42bc 6.80 ± 0.34b |
| Urea | 4.52 ± 0.26b | 5.28 ± 0.38bc | |
| Yeast Extract | 5.62 ± 0.31b | 4.50 ± 0.24c |
Note: Treatments with means of varied letter in the similar columns for substrate are significantly varied at p≤0.05.
Table 3f.
Exoglucanase activity after Nitrogen supplementation at 6th day of incubation.
| Substate | Nitrogen | Mean ± sem | Mean ± sem |
| 20 mM | 80 mM | ||
| Control | 5.16 ± 0.40b | 7.92 ± 0.46a | |
| (NH4)2SO4 Asparagine |
6.97 ± 1.32ab 4.97 ± 0.06b |
4.50 ± 0.25b 7.38 ± 0.63a |
|
| Maize cobs | NaNO3 NH4NO3 Peptone |
4.45 ± 0.86b 7.10 ± 0.77ab 7.71 ± 0.35ab |
7.36 ± 0.47a 7.38 ± 0.61a 7.32 ± 0.67a |
| Urea | 6.34 ± 0.37ab | 5.72 ± 0.27ab | |
| Yeast Extract | 8.96 ± 0.78a | 7.34 ± 0.05a | |
| Control | 8.21 ± 0.71a | 5.92 ± 0.47ab | |
| (NH4)2SO4 Asparagine |
6.89 ± 0.45ab 5.75 ± 0.41ab |
7.15 ± 0.20a 6.70 ± 0.53ab |
|
| Sugarcane bagasse | NaNO3 NH4NO3 Peptone |
6.80 ± 0.53ab 7.47 ± 0.37ab 7.01 ± 0.28b |
7.18 ± 0.22a 4.90 ± 0.48b 5.96 ± 0.38ab |
| Urea | 5.78 ± 0.25b | 5.53 ± 0.48ab | |
| Yeast Extract | 5.65 ± 0.30b | 5.29 ± 0.30ab |
Note: Treatments with means of varied letter in the similar columns for substrate are significantly varied at p≤0.05.
3.5. Effect of Supplementation of Carbon on Cellulase Enzyme Production by Nigrospora oryzae
The carbon elements supplied to microorganisms influence production and suppression of cellulase enzymes production at the gene level. Table 4a–f shows the outcomes of supplement of soluble carbon sources of cellulase enzymes produced by Nigrospora oryzae. On maize cobs the highest Fpase activities were 17.1 ±0.51 IU/ml and 18.0±1.33 IU/ml recorded with 20mM mannitol and 80 mM maltose respectively on the 3rd day of incubation. On the 6th day of incubation 20 mM sucrose and 80 mM fructose produced the highest Fpase activities of 23.7±1.03 IU/ml and 25.1±1.59 IU/ml respectively. On sugarcane bagasse the highest Fpase of 24.0±1.61 IU/ml and 16.7±1.43 IU/ml were recorded with supplementation of 20 mM and 80 mM mannitol accordingly. Supplementation with the different soluble carbon sources produced varied endoglucanase activities on both maize cobs and sugarcane bagasse on the 3rd and 6th days of incubations. For maize cobs supplementation with 20 mM fructose and 80 mM mannitol resulted in the highest endoglucanase activities of 28.3±1.00 IU/ml and 42.6±2.06 IU/ml respectively on the 3rd day of incubation, while on the 6th day of culturing 20 mM sucrose and 80 mM glucose resulted in the highest endoglucanase activities of 35±1.34 IU/ml and 32.8±0.98 IU/ml accordingly. Supplementation of sugarcane bagasse with 20 mM galactose and 80 mM sucrose resulted in the highest endoglucanase activity of 31.6±1.17 IU/ml and 34.6±2.11 IU/ml respectively on the 3rd days of incubation, while 20 mM glucose and 80 mM mannitol resulted in the highest endoglucanase activities of 41.9±0.62 IU/ml and 36.3±2.08 IU/ml on the 6th day of incubation. Influence of supplementation of maize cobs and sugarcane bagasse with soluble carbon source on exoglucanase activity varied depending on the concentration and types of carbon source and incubation period. On maize cobs 20 mM mannitol and 80mM fructose resulted in the highest exoglucanase activities of 8.95±0.55 IU/ml and 8.39±0.28 IU/ml on the 3rd day of incubation. On sugarcane bagasse the highest exoglucanase activities was 6.87 ±0.40 IU/ml recorded with 20 mM galactose supplementation which however was not significantly higher compared to that produced with 20 mM fructose, glucose, mannitol and control. There was no influence on exoglucanase production when concentration of the sugars were increased to 80 mM on sugarcane bagasse on the 3rd day of incubation. On the 6th day of incubation supplementation of maize cobs with 20 mM mannitol resulted in the highest exoglucanase activities of 6.53±0.26 IU/ml which however was not significantly higher than supplementation with 20 mM fructose, glucose, maltose, sucrose and control. Increasing the concentration of the sugar to 80 mM resulted in the highest exoglucanase activities of 10.40±0.67 IU/ml with addition of sucrose which however was not significantly higher than that produced with 80 mM mannitol. On sugarcane bagasse addition of 20 mM glucose resulted in the highest exoglucanase activity of 7.47±0.37 IU/ml which was only higher than that recorded with 20 mM galactose. The highest exoglucanase activity of 8.55±0.45 IU/ml was recorded with 80 mM fructose on sugarcane bagasse on 6th day of incubation.
Table 4a.
Filter Paper activity after carbon supplementation at 3rd day of incubation.
| Substate | Carbon | Mean ± sem | Mean ± sem |
| 20 mM | 80 mM | ||
| Control | 16.6 ± 0.90ab | 11.0 ± 0.88c | |
| Fructose | 10.2 ± 0.68c | 12.9 ± 0.69bc | |
| Galactose | 15.6 ± 1.15ab | 16.3 ± 1.45ab | |
| Maize cobs | Glucose | 12.4 ± 0.87bc | 10.9 ± 0.47c |
| Maltose | 14.1 ± 0.78abc | 18.0 ± 1.33a | |
| Mannitol | 17.1 ± 0.51a | 17.0 ± 0.51ab | |
| Sucrose | 15.8 ± 1.32ab | 13.3 ± 1.18abc | |
| Control | 16.3 ± 0.80a | 10.3 ± 0.55bc | |
| Fructose | 13.4 ± 0.08ab | 11.4 ± 0.71abc | |
| Galactose | 15.2 ± 0.47a | 12.7 ± 1.03abc | |
| Sugarcane bagasse | Glucose | 12.7 ± 1.28b | 9.18 ± 0.72c |
| Maltose | 13.0 ± 0.79a | 11.4 ± 0.89abc | |
| Mannitol | 6.13 ± 0.40c | 14.8 ± 0.44a | |
| Sucrose | 6.93 ± 0.22a | 14.3 ± 1.33ab |
Note: Treatments with means varied letter in the similar columns for substrate are significantly varied at p≤0.05.
Table 4b.
Filter Paper activity after carbon supplementation at 6the day of incubation.
| Substate | Carbon | Mean ± sem | Mean ± sem |
| 20 mM | 80 mM | ||
| Control | 15.2 ± 0.55b | 16.8 ± 0.77bc | |
| Fructose | 14.2 ± 0.92bc | 25.1 ± 1.59a | |
| Galactose | 13.3 ± 0.58bc | 13.9 ± 0.71cd | |
| Maize cobs | Glucose | 9.5 ± 0.18d | 13.6 ± 0.82cd |
| Maltose | 10.9 ± 0.86cd | 14.0 ± 0.95cd | |
| Mannitol | 20.3 ± 0.92a | 19.1 ± 1.03b | |
| Sucrose | 23.7 ± 1.03a | 9.4 ± 0.53d | |
| Control | 15.2 ± 0.55b | 11.5 ± 0.95bcd | |
| Fructose | 14.2 ± 0.92bc | 7.25 ± 0.58d | |
| Galactose | 13.3 ± 0.58bc | 15.8 ± 1.06ab | |
| Sugarcane bagasse | Glucose | 9.5 ± 0.18d | 15.1 ± 0.31abc |
| Maltose | 10.9 ± 0.86cd | 10.9 ± 1.05cd | |
| Mannitol | 20.3 ± 0.92a | 16.7 ± 1.43a | |
| Sucrose | 23.7 ± 1.03a | 10.2 ± 0.65d |
Note: Treatments with means of varied letter in the similar columns for substrate are significantly varied at p≤0.05.
Table 4c.
Endoglucanase activity after carbon supplementation at 3rd day of incubation.
| Substate | Carbon | Mean ± sem | Mean ± sem |
| 20 mM | 80 mM | ||
| Control | 27.1 ± 0.79a | 21.0 ± 0.27de | |
| Fructose | 28.3 ± 1.00a | 25.8 ± 1.34cd | |
| Galactose | 18.4 ± 0.89bc | 29.5 ± 1.51bc | |
| Maize cobs | Glucose | 15.2 ± 0.72c | 17.1 ± 0.68e |
| Maltose | 20.3 ± 1.30b | 32.8 ± 0.74b | |
| Mannitol | 27.3 ± 1.22a | 42.6 ± 2.06a | |
| Sucrose | 21.1 ± 0.78b | 22.4 ± 1.69de | |
| Control | 23.8 ± 0.66bc | 25.5 ± 1.6bc | |
| Fructose | 28.1 ± 1.24ab | 23.7 ± 1.94bc | |
| Galactose | 31.6 ± 1.17a | 18.3 ± 0.55bc | |
| Sugarcane bagasse | Glucose | 22.8 ± 1.16c | 21.8 ± 0.99c |
| Maltose | 26.3 ± 1.00bc | 25.3 ± 2.15bc | |
| Mannitol | 15.9 ± 1.02d | 30.2 ± 0.93ab | |
| Sucrose | 23.9 ± 1.15bc | 34.6 ± 2.11a |
Note: Treatments with means of varied letter in the similar columns for substrate are significantly varied at p≤0.05.
Table 4d.
Endoglucanase activity after carbon supplementation at 6th day of incubation.
| Substate | Carbon | Mean ± sem | Mean ± sem |
| 20 mM | 80 mM | ||
| Control | 25.0 ± 0.70b | 26.0 ± 1.12abc | |
| Fructose | 21.1 ± 1.07b | 31.2 ± 2.19a | |
| Galactose | 25.3 ± 1.29b | 21.9 ± 1.48bc | |
| Maize cobs | Glucose | 13.6 ± 0.48c | 32.8 ± 0.98a |
| Maltose | 32.9 ± 1.43a | 28.5 ± 1.13ab | |
| Mannitol | 33.1 ± 1.51a | 31.7 ± 1.84a | |
| Sucrose | 35.5 ± 1.34a | 21.2 ± 1.00c | |
| Control | 24.1 ± 1.48cd | 19.6 ± 0.76c | |
| Fructose | 18.7 ± 0.65d | 14.0 ± 0.83d | |
| Galactose | 12.1 ± 1.15e | 31.3 ± 0.85ab | |
| Sugarcane bagasse | Glucose | 41.9 ± 0.62a | 22.8 ± 1.25c |
| Maltose | 28.1 ± 1.36bc | 29.6 ± 1.02b | |
| Mannitol | 33.0 ± 1.77b | 36.3 ± 2.08a | |
| Sucrose | 26.5 ± 1.39c | 18.4 ± 0.05cd |
Note: Treatments with means of varied letter in the similar columns for substrate are significantly varied at p≤0.05.
Table 4e.
Exoglucanase activity after carbon supplementation at 3rd day of incubation.
| Substate | Carbon | Mean ± sem | Mean ± sem |
| 20 mM | 80 mM | ||
| Control | 7.36 ± 0.26b | 5.11 ± 0.16c | |
| Fructose | 4.99 ± 0.19c | 8.39 ± 0.28a | |
| Galactose | 4.22 ± 0.14c | 4.95 ± 0.39c | |
| Maize cobs | Glucose | 7.65 ± 0.41abc | 6.93 ± 0.56ab |
| Maltose | 7.13 ± 0.12b | 6.60 ± 0.36abc | |
| Mannitol | 8.95 ± 0.55a | 5.76 ± 0.50bc | |
| Sucrose | 6.51 ± 0.27b | 6.20 ± 0.17bc | |
| Control | 6.37 ± 0.16a | 4.77 ± 0.46a | |
| Fructose | 5.71 ± 0.46ab | 5.31 ± 0.27a | |
| Galactose | 6.87 ± 0.40a | 4.40 ± 0.09a | |
| Sugarcane bagasse | Glucose | 5.43 ± 0.39abc | 5.18 ± 0.22a |
| Maltose | 3.91 ± 0.12c | 4.93 ± 0.35a | |
| Mannitol | 5.42 ± 0.34abc | 4.02 ± 0.31a | |
| Sucrose | 4.57 ± 0.26bc | 4.16 ± 0.05a |
Note: Means expressed of varied letter in the similar columns for substrate are significantly varied at p≤0.05.
Table 4f.
Exoglucanase activity after carbon supplementation at 6th day of incubation.
| Substate | Carbon | Mean ± sem | Mean ± sem |
| 20 mM | 80 mM | ||
| Control | 5.27 ± 0.34ab | 7.70 ± 0.57bc | |
| Fructose | 5.56 ±0.14a | 5.18 ± 0.12d | |
| Galactose | 3.97 ±0.09b | 5.62 ± 0.23cd | |
| Maize cobs | Glucose | 5.60 ±0.44a | 4.54 ± 0.25d |
| Maltose | 5.25 ±0.45ab | 3.77 ± 0.18d | |
| Mannitol | 6.53 ±0.26a | 8.79 ± 0.67ab | |
| Sucrose | 6.41 ±0.32a | 10.40 ± 0.89a | |
| Control | 7.23 ± 0.74ab | 6.17 ± 0.31bc | |
| Fructose | 5.83 ± 0.17a | 8.55 ± 0.45a | |
| Galactose | 5.09 ± 0.06b | 4.43 ± 0.23c | |
| Sugarcane bagasse | Glucose | 7.47 ± 0.37a | 6.40 ± 0.26b |
| Maltose | 7.24 ± 0.39ab | 5.40 ± 0.37bc | |
| Mannitol | 6.16 ± 0.58a | 5.10 ± 0.41bc | |
| Sucrose | 6.93 ± 0.22a | 5.53 ± 0.45bc |
Note: Treatments with means of varied letter in the similar columns for substrate are significantly varied at p≤0.05.
3.6. Effect of Moisture Levels on Production of Cellulase Enzymes by Nigrospora oryzae
Moisture content is very interested key element in SSF process since it affect the ability of growing of microorganisms, biosynthesis and secretion of cellulase enzymes. In this regard the effect of moisture on cellulase enzymes production was investigate by adjusting the substrate to moisture of ratios between 1:1 to 1:4.5 on the 3rd and 6th days of incubation and the outcomes are summarized in Table 5). The highest Fpase activities on maize cobs on the 3rd and 6th days of incubation were 17.4±0.30 IU/ml and 18.6±0.83 IU/ml respectively with substrate: moisture ratios of 1:30 which however were not significantly different from those reported with a substrate moisture ratio of 1:2 and 1:2.5 on both days. On sugarcane bagasse, the highest Fpase activities were 16.8±0.44I U/ml and 20.0±0.72 IU/ml on the 3rd and 6th days of respectively with a substrate moisture ratio of 1:2.5. The highest Fpase activity reported on the 6th of incubation was not significantly varied compared to that reported with substrate to moisture ratios of 1:3.0. The highest endoglucanase activities on maize cobs were 28.2 ±0.36 IU/ml and 28.3±0.35 IU/ml with substrate to moisture ratios of 1:2.5 and 1:30 for 3rd and 6th days of incubation accordingly. Endoglucanase activity produced on maize cobs with substrate to moisture ratios 1:2.0, 1:2.5 and 1:3.0 on the 3rd day of incubation and 1:1.5, 1:2.0, 1.2.5 and 1:3.0 on the 6th day of incubation were not significantly varied. On sugarcane bagasse, the highest endoglucanase activities were obtained with. substrate to moisture ratio of 1:3.0 of 26.2±0.54 IU/ml on the 3rd day of incubation which was not significantly different from endoglucanase obtained with ratio 1:2.5 and 31.8±0.5 IU/ml on the 6th of incubation which was not significantly different from those obtained with 1:2.0 and 1.25 ratios. The substrate moisture ratio of 1:3.0 on maize cobs resulted in the highest exoglucanase activities of 8.8±0.12 IU/ml and 8.47±0.03 IU/ml on the 3rd and 6th days of incubation respectively. Exoglucanase activities produced on maize cobs with substrate to moisture ratios of 1:2.5 and 1:3.0 on the 3rd day and 1:2.0, 1:2.5 and 1:3.0 on the 6th day of incubation were not significantly varied. On sugarcane bagasse, the highest exoglucanase activities were 9.64±0.21 IU/ml and 9.57±0.07 IU/ml reported with substrate to moisture ratios of 1:3.0 and 1.2.5 on the 3rd and 6th days of incubation respectively. Exoglucanse activities recorded with substrate to moisture ratios of 1:2.5 and 1:3.0 on the 6th day of incubation were not significantly varied.
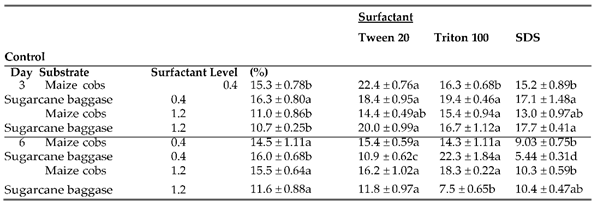
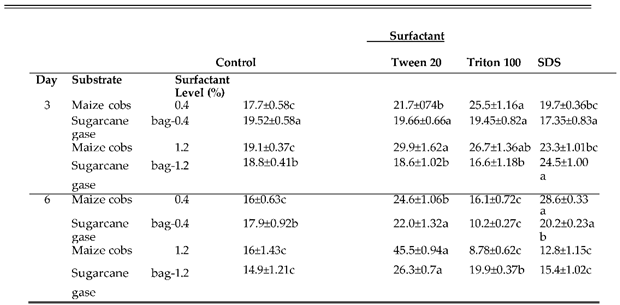
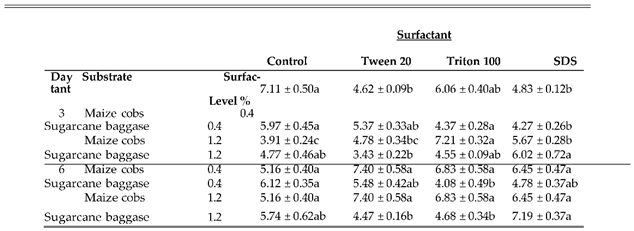
3.7. Effect of Surfactant Levels on Production of Cellulase Enzymes by Nigrospora oryzae
Surfactants are amphiphilic molecules with the capacity to reduce surface tension and modify the composition of plant biomass. In this study the results of surfactants on cellulase enzymes producing by Nigrospora oryzaie cultivated on maize cobs and sugarcane bagasse was evaluated by incorporating Tween-20, Triton X-100 and SDS at 0.4% and 1.2%. The results are summarized in Table 6a–c). The highest Fpase activities on maize cobs and sugarcane bagasse were 22.4±0.76 IU/ml and 19.4±0.46 IU/ml with 0.4% Tween-20 and Triton X-100 accordingly after 3 days of incubation. However, the trend was reversed when the surfactants concentration was increased to 1.2% in which the highest Fpase activities were 15.4±0.94 IU/ml and 20.0±0.99 IU/ml with Triton X-100 and Tween-20 for maize cobs and sugarcane bagasse respectively. On the 6th day of incubation, the highest Fpase activities for maize cobs were 15.4 ±0.29 IU/ml and 18.3±0.22 IU/ml with 0.4% Tween-20 and 1.2% Triton X-100. The trend was reversed on sugarcane bagasse with highest Fpase activities of 22.3±1.84 IU/ml and 11.8±0.97 IU/ml with 0.4% Triton X-100 and 1.2% Tween 20 respectively. The results of surfactants on endoglucanase producing varied with the highest activity on maize cobs of 25.5±1.16 IU/ml and 29.9±1.62 IU/ml recorded with 0.4% Tritonx-100 and Tween-20 respectively on the 3rd day of incubation. For sugarcane bagasse the highest endoglucanase activities were 19.66 ±0.66 IU/ml and 24.5±1.00 IU/ml with 0.4% Tween-20 and SDS on 3rd day of incubation. On the 6th day of incubation, the highest endoglucanase activities on maize cobs were 28.6±0.33 IU/ml and 45.5±0.94 IU/ml with 0.4 SDS and 1.2% Tween-20 respectively. For sugarcane bagasse 0.4% and 1.2% Tween-20 resulted in production of highest endoglucanase activities of 22.0±1.32Iu/ml and 26.3±0.7 IU/ml respectively. The highest exoglucanase activities with both maize cobs and sugarcane bagasse were recorded on control compared with addition of 0.4% surfactants while increasing surfactants concentration to 1.2% resulted in exoglucanase activities of 7.21±0.32 IU/ml and 6.0±0.72 IU/ml with Triton X-100 and SDS on maize cobs and sugarcane bagasse respectively on the 3rd day of incubation. On the 6th day of incubation, the highest exoglucanase activities on maize cobs were 7.40±0.58 IU/ml and 9.0±0.51 IU/ml with 0.4% Tween-20 and 1.2% SDS respectively. For sugarcane bagasse the highest exoglucanase activities were 6.12±0.35 IU/ml and 7.19±0.3 IU/ml in the control and 1.2% SDS.
Table 6a.
Effect of Surfactants on Fpase Activity by Nigrospora oryzaie cultured on Maize cobs and Sugarcane bagasse.
Table 6a.
Effect of Surfactants on Fpase Activity by Nigrospora oryzaie cultured on Maize cobs and Sugarcane bagasse.
 |
Note: Treatments with means of varied letter in the similar columns for substrate are significantly varied at p≤0.05.
Table 6b.
Effect of Surfactants on Endoglucanse Activity by Nigrospora oryzaie cultured on Maize cobs and Sugarcane bagasse.
Table 6b.
Effect of Surfactants on Endoglucanse Activity by Nigrospora oryzaie cultured on Maize cobs and Sugarcane bagasse.
 |
Note: Treatments with means of varied letter in the similar columns for substrate are significantly varied at p≤0.05.
Table 6c.
Effect of Surfactants on Exoglucanase Activity by Nigrospora oryzae cultured on Maize cobs and Sugarcane bagasse.
Table 6c.
Effect of Surfactants on Exoglucanase Activity by Nigrospora oryzae cultured on Maize cobs and Sugarcane bagasse.
 |
Note: Treatments with means varied letter in the similar columns for substrate are significantly varied at
p≤0.05.
3.8. Effect of Enzymes Loading on Reducing Sugar Production Using Maize cobs and Sugarcane Bagasse Substrates and Nigrospora oryzae Cellulase Enzyme Extract
Methodical enzymatic hydrolysis is determined by the optimal ratio between enzyme and substrate. Therefore, the impact of the different quantity of the enzymes on reducing sugar producing was evaluated in this study on different concentrations 1% ,2%,3%,4% and 5% enzymes loading over 72 hours’ incubation period. The results are summarized in Table 7, the highest reducing sugar produced from both maize cobs and sugarcane bagasse occurred with 5% enzyme concentration after 72 hours of incubation. There was increase in the quantity of reducing sugars produced from 12 hours to 72 hours for both maize cobs and sugarcane bagasse for all the enzymes concentration tested with highest recorded after 72 hours of incubation.
3.9. Effect of Substrate Loading on Reducing Sugar Production by Nigrospora oryzae Cellulase Enzymes
The impact of the different quantity of the substrate on reducing sugar producing was evaluated in this study by utilizing different quantity 1%, 5%, 10% and 15% over a 72-hour incubation period. For maize cobs the highest amounts of reducing sugars were produced with 15% substrate loading over the 72-hour incubation which were significantly higher compared to 1%, 5%, 10% and control except at 24 and 72 hours at which the reducing sugars from 10% substrate loading were not significantly different compared to 15% substrate loading. The lowest reducing sugars were produced with 1% substrate loading (Table 8). For sugarcane bagasse, the highest reducing sugars were produced using 10% substrate loading except at 36 and 48 hours of incubation and 72 hours at which reducing sugars produced with 5%, 10%, 15 % and control and 10% and control were not significantly different. The lowest reducing sugars were produced with 1% substrate loading. (Table 8).
3.10. Simultaneous Saccharification and Fermentation of Maize Cobs and Sugarcane Bagasse Using Nigrospora oryzae Cellulase and Saccharomyces cerviceaie
The fermentability of the saccharification results were further investigated by utilizing S. cerevisiae as the fermenting specimen over a period of 72 hours. S. cerevisiae was selected as it is an efficient ethanolic fermenter, able fermenting glucose from the breakdown of cellulose (Shukla et al.,2023). Ethanol from simultaneous saccharification and fermenting of maize cobs and sugarcane bagasse increased from 12 hours of incubation and peaked at 72 hours for the different substrate and enzyme concentrations, similar simultaneous saccharification and fermentation of sugarcane bagasse with 5 FPU resulted in significantly comparable ethanol production between 60 and 72 hours for 10% and 15% substrate concentration. Simultaneous saccharification and fermenting of maize cobs and sugarcane bagasse with 10 FPU resulted in significantly higher ethanol production using 10% substrate concentration after 72 hours of incubations (Table 9).
4. Discussions
4.1. Effect of Incubation Period on Enzyme Production
Incubation period plays a significantly positive influence in the metabolic activity of microorganisms and cellulase enzymes production. Incubation time is directly related to the producing of enzymes and other metabolites. Enzymes being the primary metabolites are synthesized during the logarithm phase of fungal growth cycle (Munyasi, et al., 2024). The producing of the component of cellulase by Nigrospora oryzae varied depending on the substrate used. Maximum Fpase production for both maize cobs and sugarcane bagasse occurred on the 9th day of incubation with no significant difference in FPase reported on the 6th day for maize cobs and 3rd and 6th days for on sugarcane bagasse. These results agrees with observations by many workers that maximum Fpase occurs between 5-7 days of incubation. For instance (Bharti,,et al, (2018) cultured Talamyces stipitatus on Parthenium hysterophorus substrate and obtained maximum Fpase of 2.85 FPU gds on the 5th day of cultivation. Similarly, by Boondaeng, et al. (2024) recorded maximum Fpase of 0.25±0.02 U/g on soybean residue on the 5th day of cultivation using Aspergillus sp Ezecho et al. (20219) cultured Trichoderma asperellium on raw oil palm ford leaves and recorded the highest Fpase of 15. ±0.02 U/g on the 3rd day of incubation. The producing of endoglucanase by Nigrospora oryzae on maize cobs and sugarcane bagasse did not significantly differ on the 3rd, 12th and 15th days of incubation with maximum production occurring on the 12 day incubation. Narra, et al. (2014) cultured Aspergillus terreus for 11 days and obtained maximum endoglucanase of 11.18±0.625IU/ml on microcellulose on day 5, 9.97±0.169IU/ml on corn stalk on day 5 and 8.15±0.13IU/ml and 3.96±0.72 IU/ml on wheat straw and rice straw respectively on day 8. Exoglucanase production by Nigrospora oryzae remained relatively constantly between the 3 and 9th day and 3rd and 15 days of incubation on maize cobs and sugarcane bagasse respectively. Exoglucanase continuously catalyzes the hydrolysis of cellulose from reducing and non-reducing leads to release cellobiose (Munyasi, et al., 2024), describing its relatively constant production by Nigrospora oryzae observed in our study. Other workers have observed maximum exoglucanase at different time periods of incubations. Sharada, et al. (2013) observed maximum exoglucanase production by Emericella niveus cultured on rice straw and wheat bran under SSF occurred on the 3rd day of cultivation. Seratale, et al. (2014) obtained the highest exoglucanase activity of 24.22 U/g on the 5th day of cultivation when Phanerochaete chrysosporium was cultivated on grass powder. The decrease on Fpase, endoglucanase and exoglucanase production with increase in incubation time reported in our study could be attributed to heterogenicity of the substrate, change in pH during fermentation, production of inhibitory by-products and diminishment of nutrient in the medium (Narra, et al.,2014).
4.2. Effect of pH on Cellulase Enzyme Production
Among physical/chemical element the pH of the growing medium plays a significant positive impact role by inducing morphologically change in microorganisms and enzymes production (Gupta, et al; 2016). The optimum pH for cellulase enzymes producing varies among microorganism and substrate used. Cellulase enzyme production using maize cobs and sugarcane bagasse was evaluated by adjusting the pH of the moistening agent between 2-8 and culturing at for 3 and 6 days. FPase production by N. oryzaie was not influenced by pH on the 3rd day of incubation on both maize cobs and sugarcane bagasse. On the 6th day of cultivation maximum Fpase was recorded at pH 4,6 and 7, while culture of N. oryzae on sugarcane bagasse produced comparable amounts of FPase over the tested pHs. These observations are similar to Tai,et al. (2018) who noted that initial pH ranges of 4.5 to 8.5 had no significant effect on FPase production when Aspergillus niger DWAB was cultured on oil palm for between 1 and 8 days. These observations are contrary to several studies which identifies specific pH at which maximum FPase is produced. A study by Boondaeng et al. (2024) recorded the highest FPase of 0.24 ±0.00IU/g at pH 7.0 when Asperigillus sp IN5 was cultured on soybean residue after 7 days of incubation. Aggawal et al (2024) cultured Penicillium citrinum on Parthenium hysterophorus and obtained highest FPase at pH 6 after 7 days of incubation. Similarly, Munyasi, et al. (2024) reported highest FPase at pH 5.0 by Chaetomium globosum cultured on maize cobs after 7 days of incubation. Nigrospora oryzae produced both endoglucanase and exoglucanase over a broad range of pH when cultured on maize cobs. These observations are contrary to observations made by several workers in which maximum endoglucanase and exoglucanase are attained at specific pHs. For instance, Munyasi et al. (2024) recorded maximum endoglucanase of 12.20±0.13IU/ml and 10.8±0.55IU/ml at pH 5 and 9 respectively when Chaetomium globosum was cultured on maize cobs for 7 days. Endoglucanase and exoglucanase production by Nigrospora oryzae on sugarcane bagasse was generally favored by acidic pH. Similar observation have been noted by Singla, et al. (2024) when Scytalidium thermophilum was cultured on agro wastes resulting in the highest endoglucanase at pH 5-6 and Li et al. (2013) who observed maximum exoglucanase at pH 5 for Fusarum oxysporium cultured on maize cobs.
4.3. Effect of Nitrogen Sources on Cellulase Enzymes Production
In solid state fermentation, the solid substrate is preferable factor in cellulase enzymes producing as it provides all the necessary nutrients in addition to providing on anchorage to the growing microorganisms. Therefore, there a number of the nutrients may be found in sub-optimal concentration or not even present in the solid substrate (Saratale et al., 2014). Therefore, maize cobs and sugarcane bagasse were supplemented with various nitrogen sources and their effect on cellulase enzymes evaluated. Previous studies have shown the nature and the amount of nitrogen sources are powerful key element that enhance cellulase producing by wood rotting basidiomycetes (Kachlishvili, et al., 2006). With varieties nitrogen sources significant increase in FPase production were recorded with addition of inorganic (NH4)2SO4 and NH4NO3 or organic peptone and Urea were added to maize cobs or sugarcane bagasse. Endoglucanase production by Nigrospora oryzae was enhanced by addition of inorganic (NH4)2SO4 or NH4NO3 or organic peptone or yeast extract. Supplementation of NaNo3 or peptone to maize cobs and (NH4)2SO4 or peptone to sugarcane bagasse lead to an increase in exoglucanase producing. These observations are in agreement with Saratale et al. (2016), Fernando et al. (2015) and Kalsoon et al. (2019) who observed that both organic and inorganic nitrogen sources observed significant results on cellulase enzyme producing from various microorganisms.
4.4. Effect of Carbon Supplementation on Cellulase Enzyme Production
Microorganisms cultured under SSF for cellulase enzymes production derive their nutrients by hydrolysis of organic compounds such as cellulose are within the solid substrate. With the complex and recalcitrant nature of these lignocellulose substrates usually offer limited nutrients to induce microbial growth (Tai et al., 2019). Therefore, the supplementation of the lignocellulose substrates with soluble carbohydrates may have an inductive result on cellulase enzyme production. In our study addition of 20 mM maltose, 80mm mannitol, 20 mM and 80 mM mannitol to maize cobs and sugarcane bagasse also increased FPase production by Nigrospora oryzae. Endoglucanase production was enhanced by addition of fructose, mannitol, galactose, sucrose and glucose mannitol. These observations suggested enhancement of cellulase production on the two substrate by the soluble carbon sources occurred in a substrate dependents manner. In addition, some soluble carbon sources seemed to have had a repressive effect on cellulase enzyme production in some substrate. Similar observations have been recorded by Saini and Aggarwal (2019) who noted the addition of fructose, lactose and starch to Parthenium hysterophorus enhanced cellulase production by Steptomyces sp. NAA2 but glucose and galactose strongly repressed cellulase production whereas cellobiose, sucrose and mannitol had an inhibitory effect. Tai et al. (2019) reported that none of the soluble carbon sources tested in their study induced higher cellulase production by Aspergillus niger DWA8 cultured on oil palm food contrary to the observation in the current study. Domingues et al. (2000) indicated that lactose acted as an inducer in cellulase producing by Trichoderma reesii RUTC-30 and Aspergillus nidulans.
4.5. Effect of Moisture on Cellulase Enzymes Production
Moisture component is one of interested key elements in SSF procedure because it affect the ability lead growing of microorganisms and the biosynthesis and secretion of enzymes (Munyasi, et al., 2024). In addition moisture enables microorganisms to uptake nutrients from the solid substrate. In our study we determined the effect of different substrate to moisture ratios on FPase, endoglucanase and exoglucanase production by N. oryzae. The optimum substrate to moisture ratio varied among the substrates. Optimum substrate to moisture ratio for FPase and endoglucanase ranged from 1:2.0 to 1:3.0 for maize cobs and 1:2.5 for FPase and 1:2.5 to 1:3.0 for endoglucanse on sugarcane bagasse. Optimum substrate to moisture ratio for maximum exoglucanase production were 1:1.25 to 1:3.0 for maize cobs and sugarcane bagasse. Our observations are in agreement with Kalsoomet et al. (2019) who reported 75% (1:3.0 substrate to moisture ratio) moisture content as optimum for cellulase production by Trichoderma sp. cultured on Kallargrass, cotton stalk and rice husks. Tai et al. (2019) and Li et al. (2013) recorded the optimum moisture of 75% for the production cellulase by Aspergillus niger DWA8 Aspergillus niger USM AI1 respectively. Our observation differ from those of Munyasi, et al. (2024) who reported a substrate to moisture ratios of 1:2.0 as optimum for cellulase production by Chretomium globosum cultured on maize cobs and sugarcane bagasse. Aita et al. (2019) reported a 40% moisture levels as being optimum for endoglucanase and exoglucanase production by Metarhizium anisopliae IBCB 348 cultured on white rice, malt bagasse and sugarcane bagasse. Therefore, fungi require appropriate moist environment facilitated easily growing enhance cellulase enzymes production. Low moisture content in SSF may cause reduction in solubility of nutrients, cause low degree swelling and high water tension of the solid substrate. High moisture content leads to decrease in porosity, changes particles structures of the substrate, promotes the developments of stickness all of which lowers oxygen transfer (Saratali et al., 2014) resulting in a decrease in enzyme production due to depletion of contact surface of substrate particles (Munyasi, et al., 2024).
4.6. Effect of Surfactant on Cellulase Enzymes Production
Surfactants have been shown to have a beneficial impact facilitating enzymes activities particularly in SSF by increasing the surface area (Nanjundaswamy, et al., 2020). Several surfactants such as Tween-80, Tween-20, Triton X-100 and many others have been evaluated for their effect on cellulase enzymes production by fungi under SSF. In our study, Tween-20, TritonX-100 and SDS were investigated for their effect on cellulase enzymes production by Nigrospora oryzae using maize cobs and sugarcane bagasse substrate at 0.4% and 1.2%, Tween-20 and TritonX-100 enhanced FPase production when incorporated into maize cobs and sugarcane bagasse at 0.4% respectively. Increasing the concentration to 1.2% revised the effect with Triton X-100 enhancing FPase production in maize cobs and Tween-20 in sugarcane bagasse on the 3rd day of incubation. The same trend was reported on the 6th day of culturing. Endoglucanase production by Nigrospora oryzae was highest with incorporate of Tween-20, Though high activity was also recorded with Tritnx-100 and SDS on sugarcane bagasse at 1.2% on 3rd day and 0.4% on 6th day. Effect of the surfactant on exoglucanase production did not follow any specific pattern a through the 3 surfactants lead to maximum production at different concentration on different days of incubation and on differently on the two substrates. These observations mirror observations by other researchers. For instance, Saratale et al., (2024) evaluated addition of PEG-1500-6000, Tween-20, Tween-80 and Triton X-100 and noted that increase in molecular weight of PEG lead to a gradual increase in FPase as the molecular weight increased, while the other surfactants showed a slight positive effect on enzyme production. Kshirsagar, et al., (2017) tested PEG -4000 Tween-20, Tween-80, Triton X-100 and SDS at 1% and noted that Tween -80 resulted in the production of 2.28±0.04 IU/ml FPase, 21.56±0.21 IU/ml exoglucanase and 78±0.55IU/ml endoglucanase but Triton X-100 showed lower yield of cellulase enzyme activities due to inhibition of Nocardiopsis sp KNUC. Triton X-100 has been shown to inhibit growth of microorganisms and thereby cellulase production (Pardo;1996). Kalsoon et al; (2019) tested the effect of Tween -20 and Tween-80 on cellulase enzyme production by Trichoderma sp cultured on Kallargrass, cotton Stalk and rice husk and noticed that Tween-20 at 0.4% resulted in optimum cellulase production of 1.073 IU/ml. The enhancement of cellulase production by surfactants has been attributed to their ability to reduce pellet formation increases cellulase production since the fungus becomes more active in degradation of cellulase (Kalsoon,et al., 2019). In addition, surfactants have been shown to increase permeability of the cell membrane allowing more rapid secretion of enzymes and release of cell bound enzymes (Kshirsagar, et al., 2017). Surfactants may also increasing enzyme production during SSF by increased penetration of water into solid substrate matrix and increase the surface regional for microbial growth (Chugh, et al., 2016).
4.7. Effect of Enzymes Loading on Reducing Sugar Production Using Maize Cobs and Sugarcane Bagasse Substrates and Nigrospora oryzae Cellulase Enzyme Extract
The cost of saccharification of lignocellulose biomass using cellulases is proportional to the cost of cellulases. Therefore, enzymes loading plays an important role in enzymes hydrolysis lignocellulose. There it is suggested to use minimal enzymes loading in the saccharification process (Zhang et al., 2018). On this account we investigated the effect of enzymes loading on production of reducing sugars from maize cobs and sugarcane bagasse at different concentration 1%,2%,3%,4% and 5% over a 72 hour incubation period. The study recorded an increasing in the quantity of reducing sugars resulted from 12 hours to 72 hours for both maize cobs and sugarcane bagasse. The highest reducing sugars were produced using 5% enzymes loading over the 72 hours incubations period. Similarly, Munyasi et al. (2024) recorded an increasing in the production of reducing sugars from maize cobs and sugarcane bagasse with increase in enzymes loading using crude cellulases produced by Chaetomium globosum. Interesting between the 60 and 72 hours of incubations cellulases of Nigrospora oryzae at 4%, 5% and control did not lead to significant increase in reducing sugar production. Similarity at 72 hours of incubation, enzymes loading of 3%;4%;5% and control resulted in production of reducing sugars that did not differ significantly. This observation could be due to limited substrate availability for hydrolysis with increase in enzymes concentration (Deng, et al., 2018). The observations are also in agreement with those of Alabdalall, et al. (2021) who used cellulases produced by Aspergillus niger under SSF and noted an increase in reducing sugar producing with an increasing in enzymes loading.
4.8. Effect of Substrate Loading on Reducing Sugar Production by Nigrospora oryzae Cellulase Enzymes
Saccharification to produce reducing sugars is faced with challenges due to insolubility and heterogeinity of lignocellulose materials (Robak, et al., 2018). Therefore there is a need to determine concentration of biomass that will support optimal and efficient conversion of biomass to produce high content of ethanol or chemicals per volume (Wang, et al., 2019). The study therefore sought to determine the substrate concentration which could produce the highest reducing sugars from maize cobs and sugarcane bagasse using 1%, 5%,10% and 15%. The substrate loading for production of high amount of reducing sugars differed between the two lignocellulose biomass substrate loading of 15% and 10% resulted in highest production of reducing sugars from maize cobs and sugarcane bagasse respectively. These difference in substrate loading for production of highest amount of reducing sugars could be due to technical challenges such as rheological challenges due to unable in mixing, lack of free water for enzymatic reactions resulting in increasing inhibitors concentrations and insufficient heat and mass transfer (Robert, et al., 2011). The lack of free water could also be caused by the absorption capacity of different lignocellulose biomass which could result in the sugar monomers and oligomers produced during hydrolysis to be in close proximity with enzymes causing feedback inhibition (Agrawal et al., 2021).
4.9. Simultaneous Saccharification and Fermentation of Maize Cobs and Sugarcane Bagasse Using Nigrospora oryzae Cellulases and Saccharomyces cerevisiae
Maize cobs and sugarcane bagasse at substrate loading of 1%,5%,10% and 15% were saccharifized by 5 FPU and 10 FPU of Nigrospora oryzae cellulase enzymes and the hydrolysates fermented to ethanol by simultaneous saccharifications and fermentations using Saccharomyces cerevisiae. In simultaneous saccharifications and fermentations, the substrate is hydrolyzed and the resulting glucose is simultaneous fermented to ethanol by the yeast (Dearman, et al., 2022). The amount of ethanol produced increased with increased substrate loading and enzymes loading as the glucose generated is utilized by yeast and converted to ethanol simultaneously thus removing feedback inhibition due to accumulation of glucose on β-glucosidase (Singhania, et al., 2011). However at 72 hours of fermentations ethanol production using 5%; 10% and 15% substrate loading were not significantly. Similar observation have been made by Abada et al. (2018) who observed an increased in ethanol production with fermentation time of sesame seed residue saccharifized by cellulase enzymes produced by Bacillus cereus. The reduction in ethanol production at high solid loading as fermentation time increases has also be reported by Zhu et al., (2012) who noted that simultaneous saccharification and fermenting of cassava palp above 16% substrate loading lead to a decrease in fermentation efficiency which could have been due to difficult of heat and mass transfer at high solid loading record and inhibition of enzymes by increasing concentrations of glucose and/or ethanol (Nguyen et al., 2017). The increase in ethanol production observed with high solid leading also requires the use of yeast that are resistant to ethanol concentration (Singhania et al., 2011). Therefore decrease in ethanol production as substrate loading increased could have been caused by the use of yeast not resistant to increase in ethanol concentration.
5. Conclusions
In this study, Nigrospora oryzaie successfully isolate from decaying wood, identified using molecular techniques and evaluated for its cellulase enzyme production using maize cobs and sugarcane bagasse as substrate. Cellulase enzyme production was conducted and utilizing one variable at a time (OVAT) by considering effect of incubation time, pH, supplementation carbon and moisture content, nitrogen and surfactant. The optimized parameters were used to produce cellulase enzymes that were used for saccharification of maize cobs and sugarcane bagasse for ethanol production by simultaneous saccharification and fermentation using Saccharomyces cerevisiae.
Author Contributions
DUKUZIMANA OLIVIER and George Isanda Omwenga study designing and revising manuscript; DUKUZIMANA OLIVIER samples collection and drafting research data, Mathew Piero Ngugi revised the entire document. All authors revised, understood and confirmed the entire document before publishing.
Funding
This study did not receive any funding.
Ethical approval
This study did not involve human subjects. All data used in this are present in this paper.
Acknowledgments
The authors thanks every one, I am very grateful for the help from Department of Biochemistry, Microbiology and biotechnology, school of pure and applied sciences Kenyatta university Kenya and the National commission for science and technology granted permission to conducted this study in KENYA. Special thanks go to Dr. George I. Omwenga and Prof Mathew P. Ngugi for invaluable support during my research. Special thanks also go to my parent BUTUTIRE and MUNDANIKURE for invaluable moral support and encouragement, special thanks go to NTAKIRUTIMANA FRANCOIS SAVIER for their support during my research. I can’t forget my colleagues and friends from Kenyatta University for their help. Finally GOD IS GOOD ALL THE TIME lead me from the start up to end.
Conflicts of Interest
The author has no conflicts of interest in this paper's research, authorship, or publishing.
References
- Abada, K. A. M., Attia, A. M. F., & Zyton, M. A. L. (2018). Management of pepper Verticillium wilt by combinations of inducer chemicals for plant resistance, bacterial bioagents and compost. Journal of Applied Biotechnology, 5, 117-127. [CrossRef]
- Agrawal, R.; Verma, A.; Singhania, R.R.; Varjani, S.; Di Dong, C.; Patel, A.K. Current understanding of the inhibition factors and their mechanism of action for the lignocellulosic biomass hydrolysis. Bioresour. Technol. 2021, 332, 125042. [CrossRef]
- Agrawal, S., Chavan, P., & Badiger, A. (2024). Marine Fungi of the Genera Aspergillus and Penicillium: A Promising Reservoir of Chemical Diversity for Developing Anti-Viral Drug Candidates. The Microbe, 100081. [CrossRef]
- Aita, B. C., Spannemberg, S. S., Schmaltz, S., Zabot, G. L., Tres, M. V., Kuhn, R. C., & Mazutti, M. A. (2019). Production of cell-wall degrading enzymes by solid-state fermentation using agroindustrial residues as substrates. Journal of Environmental Chemical Engineering, 7(3), 103193. [CrossRef]
- Alabdalall, A. H., Almutari, A. A., Aldakeel, S. A., Albarrag, A. M., Aldakheel, L. A., Alsoufi, M. H.,... & Elkomy, H. M. (2023). Bioethanol production from lignocellulosic biomass using Aspergillus niger and Aspergillus flavus hydrolysis enzymes through immobilized S. cerevisiae. Energies, 16(2), 823.
- Amaefule, D., Nwakaire, J., Ogbuagu, N., Anyadike, C., Ogenyi, C., Ohagwu, C., & Egbuhuzor, O. (2023). Effect of production factors on the bioethanol yield of tropical sawdust. International Journal of Energy Research, 2023(1), 9983840. [CrossRef]
- Behera, S. S., & Ray, R. C. (2016). Solid state fermentation for production of microbial cellulases: recent advances and improvement strategies. International journal of biological macromolecules, 86, 656-669. [CrossRef]
- Bharti, A. K., Kumar, A., Kumar, A., & Dutt, D. (2018). Exploitation of Parthenium hysterophorous biomass as low-cost substrate for cellulase and xylanase production under solid-state fermentation using Talaromyces stipitatus MTCC 12687. Journal of radiation research and applied sciences, 11(4), 271-280.
- Boondaeng Antika, Jureeporn Keabpimai, Chanaporn Trakunjae, Pilanee Vaithanomsat, Preeyanuch Srichola, Nanthavut Niyomvong, Cellulase production under solid-state fermentation by Aspergillus sp. IN5: Parameter optimization and application, Heliyon, Volume 10, Issue 5, 2024, e26601. [CrossRef]
- Christopher, S., Vikram, M. P., Bakli, C., Thakur, A. K., Ma, Y., Ma, Z.,... & Singh, P. (2023). Renewable energy potential towards attainment of net-zero energy buildings status–a critical review. Journal of Cleaner Production, 405, 136942. [CrossRef]
- Chugh, P., Soni, R. & Soni, S.K. Deoiled Rice Bran: A Substrate for Co-Production of a Consortium of Hydrolytic Enzymes by Aspergillus niger P-19. Waste Biomass Valor 7, 513–525 (2016). [CrossRef]
- Deng, Y., Butré, C. I., & Wierenga, P. A. (2018). Influence of substrate concentration on the extent of protein enzymatic hydrolysis. International Dairy Journal, 86, 39-48. [CrossRef]
- Deswal, D., Khasa, Y. P., & Kuhad, R. C. (2011). Optimization of cellulase production by a brown rot fungus Fomitopsis sp. RCK2010 under solid state fermentation. Bioresource technology, 102(10), 6065-6072. [CrossRef]
- Domingues, F. C., Queiroz, J. A., Cabral, J. M. S., & Fonseca, L. P. (2000). The influence of culture conditions on mycelial structure and cellulase production by Trichoderma reesei Rut C-30. Enzyme and Microbial Technology, 26(5-6), 394-401. [CrossRef]
- Escuder-Rodríguez, J. J., DeCastro, M. E., Cerdán, M. E., Rodríguez-Belmonte, E., Becerra, M., & González-Siso, M. I. (2018). Cellulases from thermophiles found by metagenomics. Microorganisms, 6(3), 66. [CrossRef]
- Felsenstein, J. (1985). Confidence limits on phylogenies: an approach using the bootstrap. evolution, 39(4), 783-791.
- Fernando, T. N., Aruggoda, A. G. B., Ariadurai, S. A., Disanayaka, C. K., & Kulathunge, S. (2015). Evaluation of alkaline peroxide pretreatment for extraction of cellulose from selected plant biomasses.
- Gautam, S. P., Bundela, P. S., Pandey, A. K., Khan, J., Awasthi, M. K., & Sarsaiya, S. (2011). Optimization for the production of cellulase enzyme from municipal solid waste residue by two novel cellulolytic fungi. Biotechnology research international, 2011(1), 810425. [CrossRef]
- Gupta, K., Garg, S., Singh, J., & Kumar, M. (2014). Enhanced production of napthoquinone metabolite (shikonin) from cell suspension culture of Arnebia sp. and its up-scaling through bioreactor. 3 Biotech, 4, 263-273. [CrossRef]
- Gupta, V. K., Kubicek, C. P., Berrin, J. G., Wilson, D. W., Couturier, M., Berlin, A.,... & Ezeji, T. (2016). Fungal enzymes for bio-products from sustainable and waste biomass. Trends in biochemical sciences, 41(7), 633-645. [CrossRef]
- Horiike, T. (2016). An introduction to molecular phylogenetic analysis. Reviews in Agricultural Science, 4, 36-45. [CrossRef]
- Kachlishvili, E., Penninckx, M. J., Tsiklauri, N., & Elisashvili, V. (2006). Effect of nitrogen source on lignocellulolytic enzyme production by white-rot basidiomycetes under solid-state cultivation. World Journal of Microbiology and Biotechnology, 22, 391-397. [CrossRef]
- Kalsoom, R., Ahmed, S., Nadeem, M., Chohan, S., & Abid, M. (2019). Biosynthesis and extraction of cellulase produced by Trichoderma on agro-wastes. International Journal of Environmental Science and Technology, 16, 921-928. [CrossRef]
- Kamande, S. M., Omwenga, G. I., & Ngugi, M. P. (2024). Production of cellulases by Xylaria sp. and Nemania sp. using lignocellulose substrates for bioethanol production from maize cobs. Heliyon, 10(17). [CrossRef]
- Kim, I. J., Lee, H. J., Choi, I. G., & Kim, K. H. (2014). Synergistic proteins for the enhanced enzymatic hydrolysis of cellulose by cellulase. Applied microbiology and biotechnology, 98, 8469-8480. [CrossRef]
- Kimura, M. (1980). A simple method for estimating evolutionary rates of base substitutions through comparative studies of nucleotide sequences. Journal of molecular evolution, 16, 111-120. [CrossRef]
- Kshirsagar, S. D., Bhalkar, B. N., Waghmare, P. R., Saratale, G. D., Saratale, R. G., & Govindwar, S. P. (2017). Sorghum husk biomass as a potential substrate for production of cellulolytic and xylanolytic enzymes by Nocardiopsis sp. KNU. 3 Biotech, 7, 1-10. [CrossRef]
- Kuhad, R. C., Gupta, R., & Singh, A. (2011). Microbial cellulases and their industrial applications. Enzyme research, 2011(1), 280696. [CrossRef]
- Kumar Amit Bharti, Amit Kumar, Alok Kumar, Dharm Dutt, Exploitation of Parthenium hysterophorous biomass as low-cost substrate for cellulase and xylanase production under solid-state fermentation using Talaromyces stipitatus MTCC 12687, Journal of Radiation Research and Applied Sciences, Volume 11, Issue 4, 2018, Pages 271-280. [CrossRef]
- Kumar, S., Stecher, G., Li, M., Knyaz, C., & Tamura, K. (2018). MEGA X: molecular evolutionary genetics analysis across computing platforms. Molecular biology and evolution, 35(6), 1547-1549. [CrossRef]
- Li, C., Yang, Z., Zhang, R. H. C., Zhang, D., Chen, S., & Ma, L. (2013). Effect of pH on cellulase production and morphology of Trichoderma reesei and the application in cellulosic material hydrolysis. Journal of Biotechnology, 168(4), 470-477. [CrossRef]
- Mostafa, F. A., Wehaidy, H. R., Sharaf, S., El-Hennawi, H. M., Mahmoud, S. A., & Saleh, S. A. (2024). Aspergillus awamori MK788209 cellulase: production, statistical optimization, pea peels saccharification and textile applications. Microbial Cell Factories, 23(1), 11. [CrossRef]
- Mrudula, S., & Murugammal, R. (2011). Production of cellulase by Aspergillus niger under submerged and solid state fermentation using coir waste as a substrate. Brazilian Journal of Microbiology, 42, 1119-1127. [CrossRef]
- Munyasi, K. M., Omwenga, G. I., & Mwamburi, F. M. (2024). Production and characterization of cellulolytic enzymes by chaetomium globosum for biomass saccharification and ethanol production. [CrossRef]
- Nanjundaswamy, A., & Okeke, B. C. (2020). Comprehensive optimization of culture conditions for production of biomass-hydrolyzing enzymes of Trichoderma SG2 in submerged and solid-state fermentation. Applied Biochemistry and Biotechnology, 191, 444-462. [CrossRef]
- Narra M, Dixit G, Divecha J, Kumar K, Madamwar D, Shah AR (2014). Production, purification and characterization of a novel GH 12 family endoglucanase from Aspergillus terreus and its application in enzymatic degradation of delignified rice straw. International Biodeterioration and Biodegradation 88:150-161. [CrossRef]
- Nguyen, T. Y., Cai, C. M., Kumar, R., & Wyman, C. E. (2017). Overcoming factors limiting high-solids fermentation of lignocellulosic biomass to ethanol. Proceedings of the National Academy of Sciences, 114(44), 11673-11678. [CrossRef]
- Op De Beeck, M., Lievens, B., Busschaert, P., Declerck, S., Vangronsveld, J., & Colpaert, J. V. (2014). Comparison and validation of some ITS primer pairs useful for fungal metabarcoding studies. PloS one, 9(6), e97629. [CrossRef]
- Pardo, A. G. (1996). Effect of surfactants on cellulase production by Nectria catalinensis. [CrossRef]
- Patel, K., Patel, H., & Shah, G. (2014). Production and optimiza tion of cellulase enzymes from newly isolated fungi. Journal of Pure and Applied Microbiology, 8(5), 4163-4169.
- Prasanna H N, G Ramanjaneyulu, B Rajasekhar Reddy. Optimization of cellulase production by Penicillium sp. 3 Biotech. 2016 Aug 9;6(2):162. [CrossRef]
- Rahnama, N., Foo, H. L., Abdul Rahman, N. A., Ariff, A., & Md Shah, U. K. (2014). Saccharification of rice straw by cellulase from a local Trichoderma harzianum SNRS3 for biobutanol production. BMC biotechnology, 14, 1-12. [CrossRef]
- Rittenour WR, Ciaccio CE, Barnes CS, Kashon ML, Lemons AR, Beezhold DH et al (2014) Internal transcribed spacer rRNA gene sequencing analysis of fungal diversity in Kansas City indoor environments. Environ Sci Process Impacts 16(1):33–43. [CrossRef]
- Robak, K., & Balcerek, M. (2018). Review of second generation bioethanol production from residual biomass. Food technology and biotechnology, 56(2), 174. [CrossRef]
- Roberts, K.M.; Lavenson, D.M.; Tozzi, E.J.; McCarthy, M.J.; Jeoh, T. The efects of water interactions in cellulose suspensions on mass transfer and saccharifcation efciency at high solids loadings. Cellulose 2011, 18, 759–773.
- Rodrigues, V. J., & Odaneth, A. A. (2021). Industrial application of cellulases. In Current Status and Future Scope of Microbial Cellulases (pp. 189-209). Elsevier.
- Saini, A., Aggarwal, N.K. Saccharification of Parthenium hysterophorus biomass using cellulase from Streptomyces sp. NAA2. Ann Microbiol 69, 685–694 (2019). [CrossRef]
- Saitou, N., & Nei, M. (1987). The neighbor-joining method: a new method for reconstructing phylogenetic trees. Molecular biology and evolution, 4(4), 406-425. [CrossRef]
- Saratale, G.D., Kshirsagar, S.D., Sampange, V.T. et al. Cellulolytic Enzymes Production by Utilizing Agricultural Wastes Under Solid State Fermentation and its Application for Biohydrogen Production. Appl Biochem Biotechnol 174, 2801–2817 (2014). [CrossRef]
- Saratale, R. G., Ponnusamy, V. K., Piechota, G., Igliński, B., Shobana, S., Park, J. H., & Kumar, G. (2023). Green chemical and hybrid enzymatic pretreatments for lignocellulosic biorefineries: Mechanism and challenges. Bioresource technology, 387, 129560. [CrossRef]
- Sethi, S., Datta, A., Gupta, B. L., & Gupta, S. (2013). Optimization of cellulase production from bacteria isolated from soil. International Scholarly Research Notices, 2013(1), 985685. [CrossRef]
- Sharada, R., Venkateswarlu, G., Venkateshwar, S., & Rao, M. A. (2013). PRODUCTION OF CELLULASE-A REVIEW. International Journal of Pharmaceutical, Chemical & Biological Sciences, 3(4).
- Sharada, R., Venkateswarlu, G., Venkateshwar, S., & Rao, M. A. (2013). PRODUCTION OF CELLULASE-A REVIEW. International Journal of Pharmaceutical, Chemical & Biological Sciences, 3(4).
- Singhania, R.R.; Sukumaran, R.K.; Rajasree, K.P.; Mathew, A.; Gottumukkala, L.D.; Pandey, A. Properties of a major β-glucosidase-BGL1 from Aspergillus nigerNII-08121 expressed differentially in response to carbon sources. Proc. Biochem. 2011, 46, 1521–1524. [CrossRef]
- Singla, D., & Kapoor, K. (2024). Diverse Cellulase Sources and Their Potential for Conversion of Paddy Straw into Bioethanol via Contribution of Nanocatalyst. In Agricultural Biomass Nanocatalysts for Green Energy Applications (pp. 81-102). Singapore: Springer Nature Singapore.
- Srivastava, N., Singh, R., Singh, P., Ahmad, I., Singh, R. P., Rai, A. K.,... & Gupta, V. K. (2023). Recent advances on lignocellulosic bioresources and their valorization in biofuels production: Challenges and viability assessment. Environmental Technology & Innovation, 29, 103037. [CrossRef]
- Sulyman, A. O., Igunnu, A., & Malomo, S. O. (2020). Isolation, purification and characterization of cellulase produced by Aspergillus niger cultured on Arachis hypogaea shells. Heliyon, 6(12). [CrossRef]
- Szijártó, N., Faigl, Z., Réczey, K., Mézes, M., & Bersényi, A. (2004). Cellulase fermentation on a novel substrate (waste cardboard) and subsequent utilization of home-produced cellulase and commercial amylase in a rabbit feeding trial. Industrial Crops and Products, 20(1), 49-57. [CrossRef]
- Tai, W. Y., Tan, J. S., Lim, V., & Lee, C. K. (2019). Comprehensive studies on optimization of cellulase and xylanase production by a local indigenous fungus strain via solid state fermentation using oil palm frond as substrate. Biotechnology progress, 35(3), e2781. [CrossRef]
- Tamura, K., Stecher, G., & Kumar, S. (2021). MEGA11: molecular evolutionary genetics analysis version 11. Molecular biology and evolution, 38(7), 3022-3027. [CrossRef]
- Visser, E. M., Leal, T. F., de Almeida, M. N., & Guimarães, V. M. (2015). Increased enzymatic hydrolysis of sugarcane bagasse from enzyme recycling. Biotechnology for biofuels, 8, 1-9. [CrossRef]
- Wang, X., Feng, Y., Zhou, C., Sun, Y., Wu, B., Yagoub, A. E. A., & Aboagarib, E. A. A. (2019). Effect of vacuum and ethanol pretreatment on infrared-hot air drying of scallion (Allium fistulosum). Food Chemistry, 295, 432-440. [CrossRef]
- Xin, Z., & Chen, J. (2012). A high throughput DNA extraction method with high yield and quality. Plant methods, 8, 1-7. [CrossRef]
- Yoo, D., Provchy, J., Park, C., Schulz, C., & Walker, K. (2014). Automated high-throughput protein purification using an ÄKTApurifier and a CETAC autosampler. Journal of chromatography A, 1344, 23-30. [CrossRef]
- Zhang, H., Wei, W., Zhang, J., Huang, S., & Xie, J. (2018). Enhancing enzymatic saccharification of sugarcane bagasse by combinatorial pretreatment and Tween 80. Biotechnology for biofuels, 11, 1-12. [CrossRef]
- Zhu, L., Yang, X., Xue, C., Chen, Y., Qu, L., & Lu, W. (2012). Enhanced rhamnolipids production by Pseudomonas aeruginosa based on a pH stage-controlled fed-batch fermentation process. Bioresource technology, 117, 208-213. [CrossRef]
- Zunsheng Wang, Hui Xin Ong, Anli Geng, Cellulase production and oil palm empty fruit bunch saccharification by a new isolate of Trichoderma koningii D-64, Process Biochemistry, Volume 47, Issue 11, 2012, Pages 1564-1571. [CrossRef]
Figure 1.
Growth of Nigrospora Oryzae on Carboxymethyl cellulose (A) and Potato dextrose agar (B).
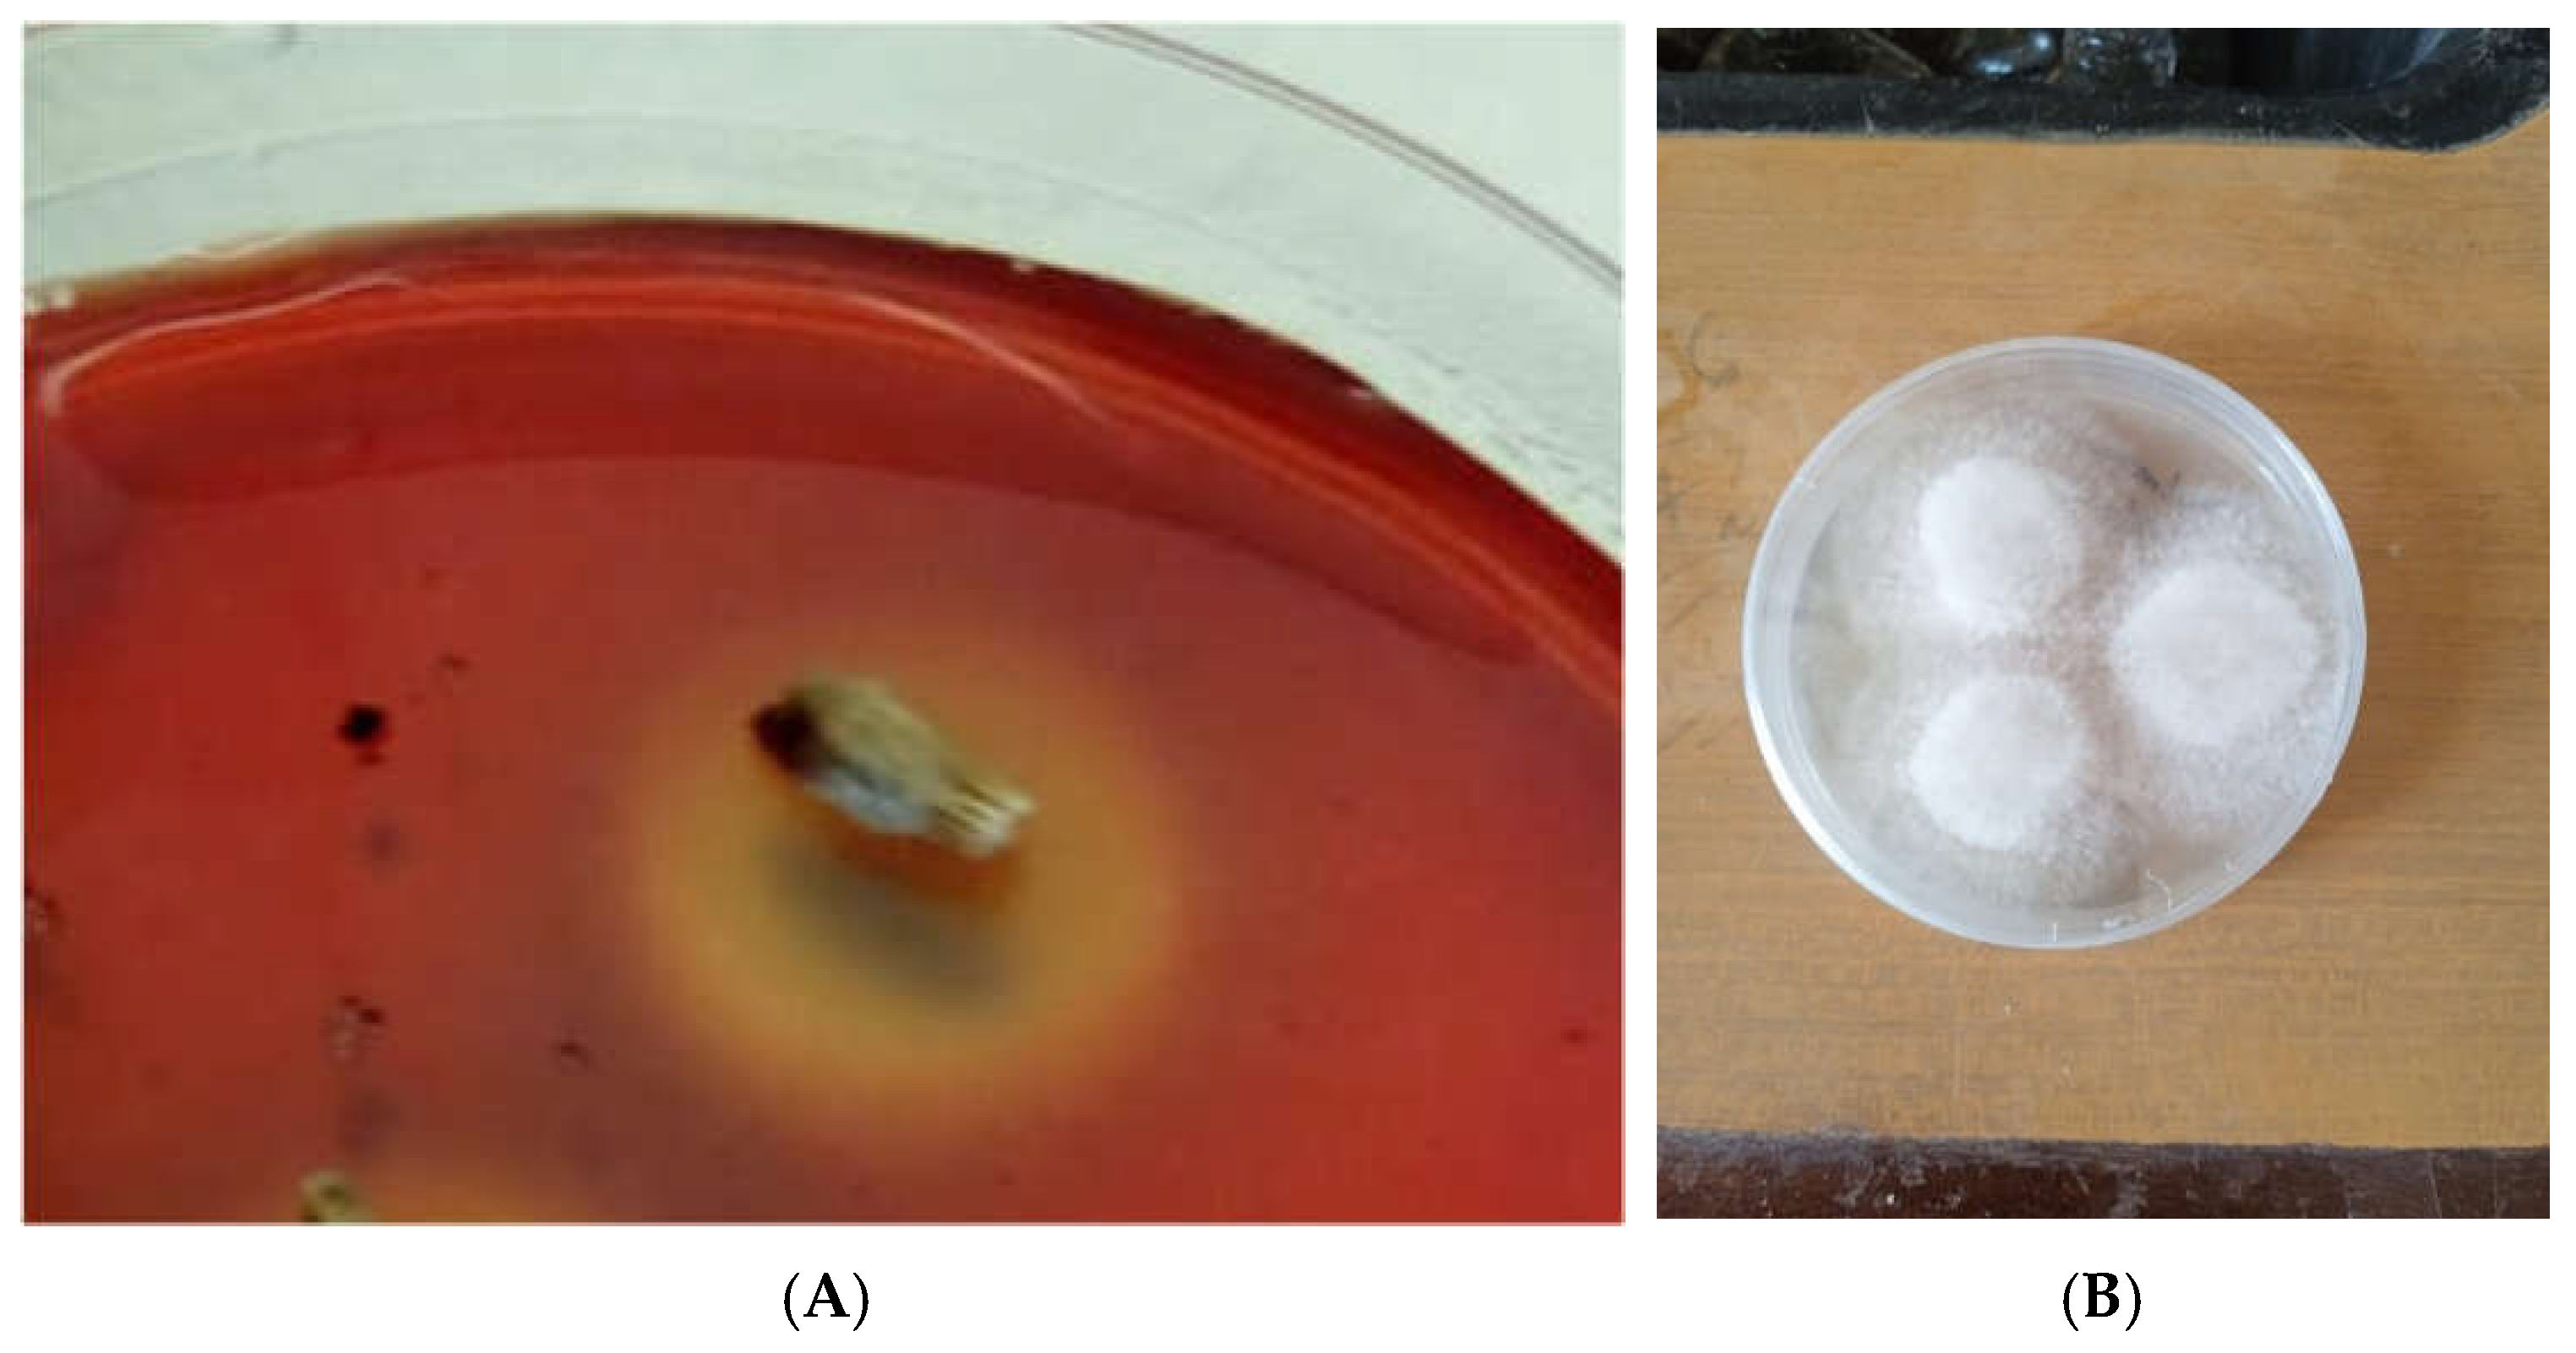
Figure 2.
Phylogenetic analysis of 16S rRNA sequence of Nigrospora oryzae KU-05.
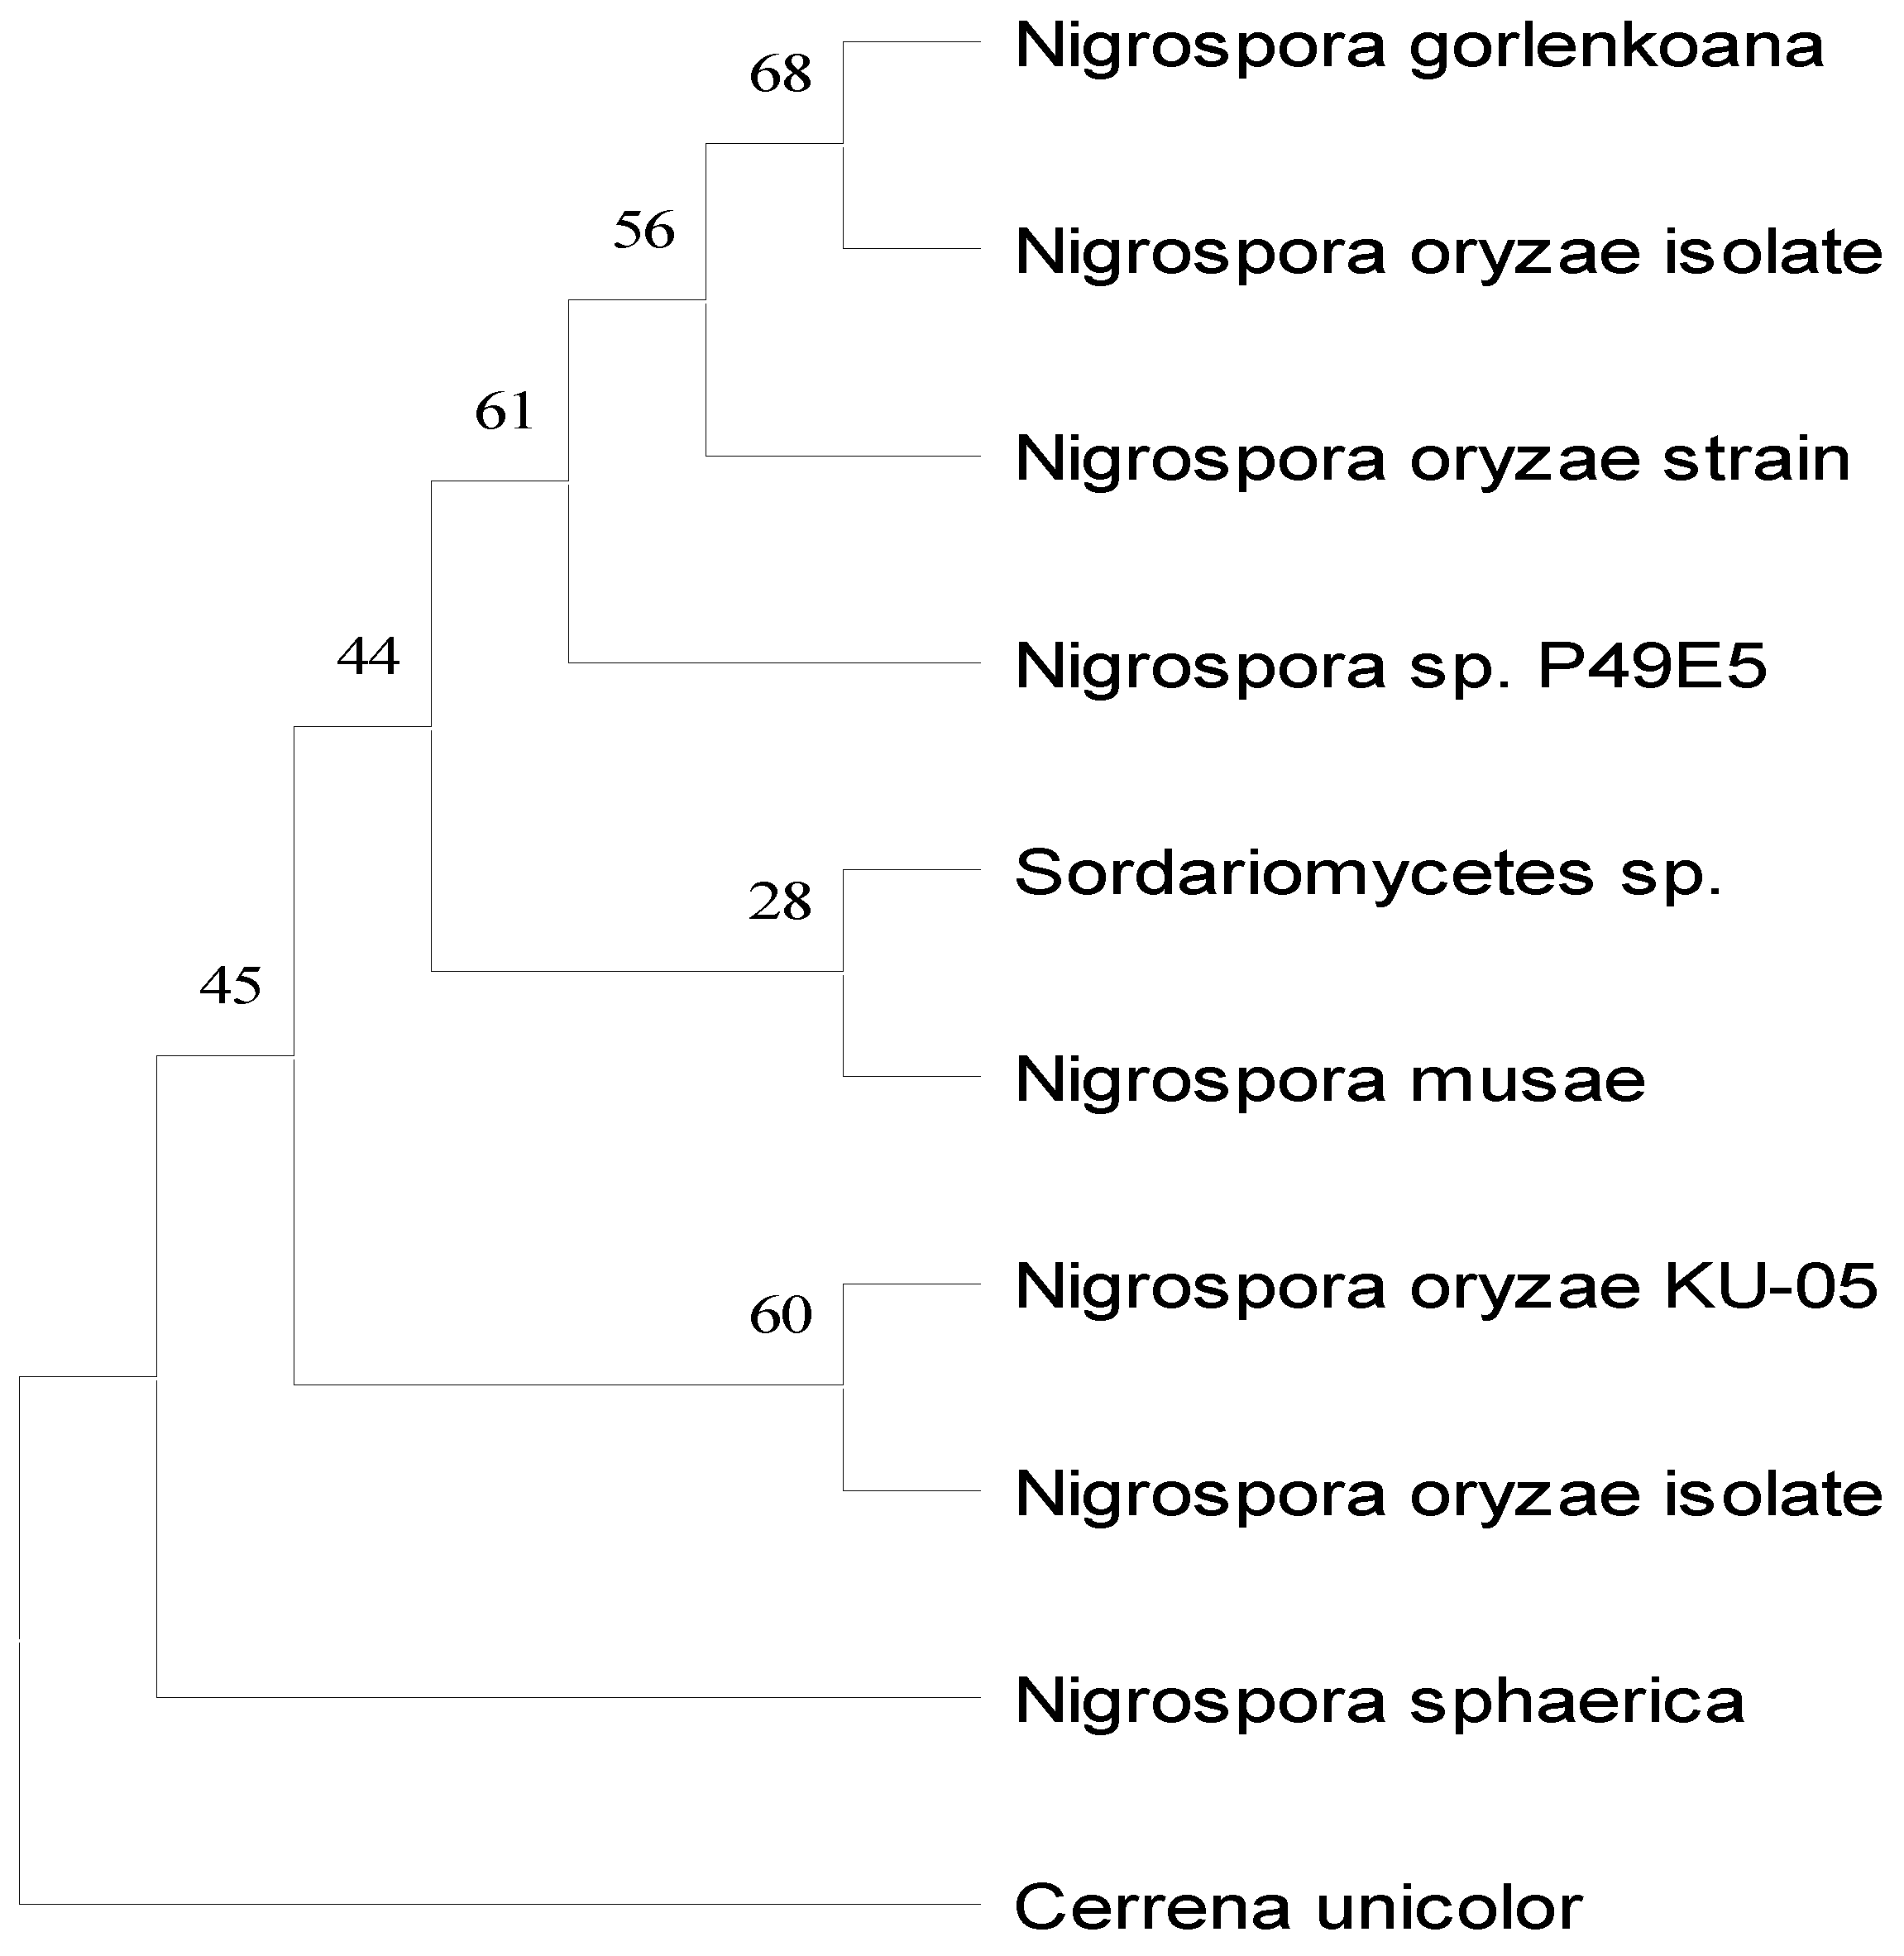
Table 1.
Time of Incubation on FPase, Endoglucanase and Exoglucanase Activities.
| substrate | Day | Fpase | Endoglucanase | Exoglucanase |
| 3 | 8.3 ± 0.64b | 13.7 ± 1.79abc | 3.31 ± 0.25ab | |
| 6 | 10.3 ± 0.87ab | 12.3 ± 1.01bc | 3.11 ± 0.16abc | |
| 9 | 11.3 ± 0.94a | 12.5 ± 1.73bc | 3.46 ± 0.25a | |
| Maize cobs | 12 | 2.8 ± 0.36c | 19.7 ± 1.74a | 2.19 ± 0.15d |
| 15 | 4.0 ± 0.11c | 18.9 ± 1.44ab | 2.53 ± 0.08bcd | |
| 18 | 4.4 ± 0.18c | 7.0 ± 0.16c | 2.42 ± 0.15cd | |
| 3 | 8.7 ± 0.26a | 14.6 ± 0.97ab | 1.77 ± 0.11ab | |
| 6 | 8.8 ± 0.36a | 10.4 ± 0.72b | 1.80 ± 0.10ab | |
| 9 | 8.9 ± 0.47a | 15.2 ± 0.74ab | 1.72 ± 0.10ab | |
| Sugarcane bagasse | 12 | 2.8 ± 0.11c | 15.5 ± 0.76a | 1.96 ± 0.16a |
| 15 | 2.5 ± 0.05c | 14.1 ± 1.90ab | 2.06 ± 0.11a | |
| 18 | 4.6 ± 0.04b | 11.1 ± 0.37b | 1.40 ± 0.06b |
Note: Treatments with means of varied letter in the same columns for substrate are significantly varied at p≤0.05.
Table 2.
FPase, Endoglucanase and Exoglucanase Activities Under different pH.
| substrate | pH | Fpase | Fpase | Endoglucanase | Endoglucanase | Exoglucanase | Exoglucanase |
| Day 3 | Day 6 | Day 3 | Day 6 | Day 3 | Day 6 | ||
| 2 | 17.1 ± 1.62a | 13.0 ± 1.67b | 33.5 ± 1.76a | 33.4 ± 1.27a | 6.02 ± 0.03a | 7.58 ± 0.47a | |
| 3 | 16.3 ± 1.26a | 11.3 ± 1.05b | 31.9 ± 1.33a | 24.5 ± 0.83b | 5.24 ± 0.31a | 5.79 ± 0.44a | |
| 4 | 16.7 ± 0.96a | 14.6 ± 0.92ab | 28.5 ± 1.09a | 32.0 ± 1.69a | 4.84 ± 0.41a | 6.05 ± 0.35a | |
| Maize cobs | 5 | 16.2 ± 1.37a | 18.6 ± 1.62a | 34.1 ± 1.05a | 30.0 ± 1.92ab | 5.72 ± 0.06a | 7.22 ± 0.78a |
| 6 | 15.9 ± 0.84a | 14.6 ± 0.68ab | 29.4 ± 3.09a | 29.2 ± 0.17ab | 4.95 ± 0.43a | 6.85 ± 0.21a | |
| 7 | 19.0 ± 1.33a | 15.4 ± 0.45ab | 28.8 ± 0.49a | 30.8 ± 1.21ab | 5.75 ± 0.59a | 5.98 ± 0.16a | |
| 8 | 17.2 ± 0.65a | 12.7 ± 0.51b | 32.9 ± 1.18a | 32.8 ± 1.49a | 5.58 ± 0.36a | 7.04 ± 0.48a | |
| 2 | 17.9 ± 0.24a | 17.6 ± 1.17a | 29.3 ± 0.45cd | 33.0 ± 1.60a | 5.94 ± 0.36ab | 9.13 ± 0.68a | |
| 3 | 19.1 ± 1.01a | 16.2 ± 1.18a | 25.0 ± 1.32d | 31.1 ± 1.49a | 6.75 ± 0.53ab | 6.71 ± 0.24bc | |
| 4 | 18.7 ± 1.58a | 14.7 ± 0.66a | 42.6 ± 0.86a | 32.0 ± 1.64a | 5.99 ± 0.27ab | 6.65 ± 0.46bc | |
| Sugarcane bagasse | 5 | 18.0 ± 0.46a | 15.5 ± 0.76a | 35.7 ± 1.50bc | 27.9 ± 1.00ab | 8.16 ± 0.87a | 5.98 ± 0.47c |
| 6 | 17.7 ± 0.55a | 14.9 ± 0.91a | 36.0 ± 1.77b | 28.1 ± 0.96ab | 6.57 ± 0.40ab | 8.23 ± 0.54ab | |
| 7 | 18.9 ± 1.21a | 15.8 ± 1.17a | 31.2 ± 1.27bcd | 23.2 ± 1.61b | 4.53 ± 0.21b | 6.53 ± 0.41bc | |
| 8 | 18.6 ± 1.31a | 16.3 ± 1.71a | 31.9 ± 1.57bc | 32.1 ± 1.70a | 7.85 ± 0.31a | 6.14 ± 0.34bc |
Note: Treatments with means of varied letter in the same columns for substrate are significantly varied at p≤0.05.
Table 5.
FPase, endoglucanse and exoglucanase activities of Nigrospora oryzae cellulases at different substrate to moisture levels.
Table 5.
FPase, endoglucanse and exoglucanase activities of Nigrospora oryzae cellulases at different substrate to moisture levels.
| substrate | Moisture | Fpase | Fpase | Endoglucanase | Endoglucanase | Exoglucanase | Exoglucanase |
| Ratio | Day3 | Day6 | Day3 | Day6 | Day3 | Day6 | |
| 1:1.0 | 10.8 ± 0.36de | 10.7 ± 0.90b | 11.7 ± 0.11de | 13.2 ± 0.86b | 4.77 ± 0.18cde | 5.43 ± 0.13b | |
| 1:1.5 | 14.1 ± 0.55bc | 12.3 ± 0.79b | 23.8 ± 0.06bc | 25.8 ± 0.47a | 5.90 ± 0.30bc | 6.25 ± 0.13b | |
| 1:2.0 | 16.2 ± 0.29ab | 16.2 ± 0.13a | 24.3 ± 0.71ab | 25.7 ± 0.73a | 6.63 ± 0.31b | 8.23 ± 0.06a | |
| Maize cobs | 1:2.5 | 16.7 ± 0.06ab | 16.7 ± 0.44a | 28.2 ± 0.36ab | 28.1 ± 0.34a | 8.08 ± 0.09a | 8.22 ± 0.03a |
| 1:3.0 | 17.4 ± 0.30a | 18.6 ± 0.83a | 28.0 ± 0.27a | 28.3 ± 0.35a | 8.81 ± 0.12a | 8.47 ± 0.33a | |
| 1:3.5 | 13.2 ± 0.16cd | 12.7 ± 0.35b | 17.1 ± 0.36cd | 13.9 ± 0.49b | 4.50 ± 0.39e | 5.79 ± 0.17b | |
| 1:4.0 | 11.3 ± 1.24cde | 12.3 ± 0.59b | 15.0 ± 0.33cde | 14.1 ± 0.89b | 5.78 ± 0.28bcd | 5.59 ± 0.37b | |
| 1:4.5 | 9.6 ± 0.65e | 10.2 ± 0.96b | 17.6 ± 0.70e | 27.0 ± 0.55ab | 4.56 ± 0.28de | 3.85 ± 0.18c | |
| 1:1.0 | 9.33 ± 0.57d | 11.6 ± 0.28d | 11.8 ± 0.45d | 15.1 ± 0.39f | 3.29 ± 0.26e | 4.10 ± 0.26e | |
| 1:1.5 | 13.7 ± 0.23bc | 15.3 ± 0.47c | 16.6 ± 0.10c | 20.5 ± 0.09de | 4.81 ± 0.13d | 5.27 ± 0.05d | |
| 1:2.0 | 14.1 ± 0.73b | 17.5 ± 0.31b | 22.1 ± 1.02b | 30.1 ± 0.86ab | 6.74 ± 0.18c | 7.99 ± 0.26b | |
| Sugarcane bagasse | 1:2.5 | 16.8 ± 0.44a | 20.0 ± 0.72a | 22.5 ± 0.29ab | 28.0 ± 0.82b | 8.09 ± 0.17b | 9.57 ± 0.07a |
| 1:3.0 | 12.7 ± 0.25bc | 19.6 ± 0.49a | 26.2 ± 0.54a | 31.8 ± 0.57a | 9.64 ± 0.21a | 9.03 ± 0.14a | |
| 1:3.5 | 14.3 ± 0.37b | 15.5 ± 0.21bc | 20.1 ± 1.54bc | 23.8 ± 0.77c | 6.07 ± 0.15c | 6.97 ± 0.14c | |
| 1:4.0 | 11.8 ± 0.67c | 13.8 ± 0.19c | 16.8 ± 0.80c | 17.7 ± 0.54ef | 4.62 ± 0.26d | 5.67 ± 0.31d | |
| 1:4.5 | 13.1 ± 0.12bc | 13.9 ± 0.43c | 18.8 ± 0.42bc | 21.1 ± 0.77c | 4.49 ± 0.30d | 5.18 ± 0.14d |
Note: Treatments with means of varied letter in the similar columns for substrate are significantly varied at p≤0.05.
Table 7.
Effect of Enzymes of loading using maize cobs and Sugarcane Bagasse and Nigrospora oryzae in production of reducing sugar.
Table 7.
Effect of Enzymes of loading using maize cobs and Sugarcane Bagasse and Nigrospora oryzae in production of reducing sugar.
| Enzymes concentration | |||||||||||||||
| Substrate | Time(h) | 1% | 2% | 3% | 4% | 5% | Control | ||||||||
| Mc | 12 | 8.39±0.62dE | 26.1±0.42eD | 30.0±0.41dC | 34.5±0.17cdA | 33.7±1.24cAB | 8.39±0.62bBC | ||||||||
| Mc | 24 | 21.6±0.56cD | 27.5±0.32deC | 34.3±0.61cB | 39.9±1.31bA | 39.4±0.5cA | 21.6±0.56bAB | ||||||||
| Mc | 36 | 24.8±1.02cD | 29.9±0.11dC | 31.2±0.2cdC | 33.9±1.2dBC | 45.4±0.44abA | 24.8±1.02bB | ||||||||
| Mc | 48 | 32.1±0.74bE | 35.3±0.24cD | 39.8±0.34bC | 39.7±0.59bcC | 48.0±0.41aA | 32.1±0.74aB | ||||||||
| Mc | 60 | 38.1±0.86aC | 38.4±1.27bC | 41.0±1.06bBC | 43.9±1.43abABC | 50.5±2.56aA | 38.1±0.86aAB | ||||||||
| Mc | 72 | 38.6±0.66aC | 41.3±0.27aBC | 45.1±1.21aABC | 49.1±1.37aA | 52.9±3.11aA | 38.6±0.66aAB | ||||||||
| Note: Treatments with means of varied letter in the similar columns for substrate are significantly varied at p≤0.05. | |||||||||||||||
| Enzymes | |||||||||||||||
| concentration | |||||||||||||||
| Substrate | Time | 1 | 2 | 3 | 4 | 5 | Control | ||||||||
| Sb | 12 | 16.4±0.91cAB | 17.5±0.34dA | 15.1±1.51dAB | 5.89±0.7dB | 9.90±0.59cAB | 8.3±0.47bAB | ||||||||
| Sb | 24 | 21.8±0.27cB | 34.3±2.24cA | 35.0±2.52cA | 42.3±2.62cA | 38.0±0.19bA | 21.2±3.23bB | ||||||||
| Sb | 36 | 35.0±3.39bB | 48.9±2.13bB | 46.3±1.39bB | 48.1±1.23bcAB | 62.7±0.56aA | 42.3±2.83aB | ||||||||
| Sb | 48 | 37.2±1.17abC | 53.0±0.64abB | 49.3±1.91abB | 49.8±0.32bB | 62.0±1.34aA | 44.2±0.10ab B | ||||||||
| Sb | 60 | 43.2±0.3aD | 55.0±0.39abB | 53.5±0.87abBC | 52.2±0.61abBC | 62.7±1.06aA | 48.7±1.97aC | ||||||||
| Sb | 72 | 44.0±0.41aC | 58.2±1.23aAB | 55.3±1.65aB | 58.0±1.19AB | 63.8±0.44aA | 49.0±1.95aC | ||||||||
Note. Note: Treatments with means of varied letter in the similar columns for substrate are significantly varied at p≤0.05.
Table 8.
Effect of substrate loading using Maize Cobs and Nigrospora oryzae in production of reducing sugar.
Table 8.
Effect of substrate loading using Maize Cobs and Nigrospora oryzae in production of reducing sugar.
| Substrate concentration | ||||||||||||
| Substrate | Time | 1 | 5 | 10 | 15 | Control | ||||||
| Mc | 12 | 3.35±0.8bD | 7.69±0.37cC | 11.6±0.29cB | 13.8±0.48dA | 6.84±0.18dC | ||||||
| Mc | 24 | 3.33±0.39bC | 9.24±0.35bcB | 13.6±0.2bA | 15.0±0.11cA | 8.06±0.44cdB | ||||||
| Mc | 36 | 3.97±0.12bE | 10.2±0.19bC | 14.3±0.16bB | 15.6±0.2bcA | 8.84±0.37cD | ||||||
| Mc | 48 | 4.29±0.18bD | 10.4±0.06C | 15.2±0.25abB | 16.3±0.16abA | 10.9±0.21bC | ||||||
| Mc | 60 | 4.45±0.2abD | 10.8±0.06abC | 15.30.05abB | 16.6±0.2abA | 11.6±0.42bC | ||||||
| Mc | 72 | 5.70±0.33aC | 11.9±0.57aB | 17.0±0.79aA | 17.2±0.06aA | 13.9±0.6aB | ||||||
| Note: Treatments with means of varied letter in the similar columns for substrate are significantly varied at p≤0.05. | ||||||||||||
| Substrate concentration | ||||||||||||
| substrate | Time | 1 | 5 | 10 | 15 | Control | ||||||
| Sb | 12 | 3.41±0.04dD | 7.99±0.75dAB | 9.15±0.39eA | 6.19±0.21cBC | 5.93±0.42eC | ||||||
| Sb | 24 | 4.26±0.09cC | 10.1±83cdAB | 11.2±0.6dA | 8.27±0.3bcB | 9.23±0.4dAB | ||||||
| Sb | 36 | 5.04±0.006bB | 12.2±0.14bcA | 12.9±0.2cA | 10.0±1.4bA | 11.4±0.42cdA | ||||||
| Sb | 48 | 5.45±0.23bC | 12.3±0.38bcB | 14.4±0.26bcA | 13.9±0.56aAB | 13.0±0.52BCAB | ||||||
| Sb | 60 | 6.53±0.17aC | 14.6±0.26abAB | 15.4±0.28abA | 14.3±0.1aB | 14.0±0.21bB | ||||||
| Sb | 72 | 7.29±0.3aC | 16.6±0.25aA | 16.7±0.23aA | 15.2±0.25aB | 17.0±0.4aA | ||||||
Note: Treatments of similar lower case letter in similar column are not significantly varied. Treatments with the similar upper case letter across each row are not significantly varied at p≤0.05.
Table 9.
simultaneous saccharification fermentation of maize cobs and sugarcane bagasse using Nigrospora oryzae cellulase and Saccharomyces cervisaie.
Table 9.
simultaneous saccharification fermentation of maize cobs and sugarcane bagasse using Nigrospora oryzae cellulase and Saccharomyces cervisaie.
| Substrate concentration 5 FPU | ||||||||||||||||||||||||||||||||||
| Substrate | Incubation Time | 1 | 5 | 10 | 15 | Control | ||||||||||||||||||||||||||||
| Mc | 12 | 1.85±0.03c | 6.32±0.47d | 6.64±0.4d | 7.61±0.6b | 4.37±0.34e | ||||||||||||||||||||||||||||
| Mc | 24 | 2.16±0.009c | 7.01±0.6d | 8.03±0.14c | 7.77±0.62b | 4.42±0.26e | ||||||||||||||||||||||||||||
| Mc | 36 | 5.14±0.26b | 8.46±0.16c | 8.16±0.56bc | 8.40±0.94b | 6.39±0.21d | ||||||||||||||||||||||||||||
| Mc | 48 | 5.42±0.29b | 8.85±0.14bc | 9.06±0.43abc | 8.98±0.42ab | 7.97±0.47c | ||||||||||||||||||||||||||||
| Mc | 60 | 7.22±0.28a | 9.71±0.26ab | 9.4±0.74ab | 10.2±0.52a | 9.64±0.39b | ||||||||||||||||||||||||||||
| Mc | 72 | 7.21±0.24 | 9.88±0.06a | 10.1±0.46a | 10.2±0.13a | 11.4±0.62a | ||||||||||||||||||||||||||||
| Substrate concentration 10 FPU | ||||||||||||||||||||||||||||||||||
| Substrate | Incubation Time | 1 | 5 | 10 | 15 | Control | ||||||||||||||||||||||||||||
| Mc | 12 | 2.05±0.03e | 6.92±0.7c | 6.92±0.7c | 6.32±0.46c | 4.87±0.17d | ||||||||||||||||||||||||||||
| Mc | 24 | 2.21±0.16e | 7.50±1.14 | 7.50±1.14 | 7.16±0.89c | 5.95±0.47c | ||||||||||||||||||||||||||||
| Mc | 36 | 5.23±0.18d | 9.34±0.6ab | 9.34±0.6ab | 9.11±0.25b | 9.01±0.42b | ||||||||||||||||||||||||||||
| Mc | 48 | 6.2±0.14c | 10.6±0.47a | 10.6±0.47a | 9.34±0.09b | 9.38±0.4ab | ||||||||||||||||||||||||||||
| Mc | 60 | 7.69±0.44b | 10.5±0.89a | 10.5±0.89a | 9.99±0.69ab | 9.59±0.53ab | ||||||||||||||||||||||||||||
| Mc | 72 | 9.19±0.16a | 10.9±0.87a | 10.9±0.87a | 11.0±0.29a | 10.1±0.23a | ||||||||||||||||||||||||||||
| Substrate concentration 5 FPU | ||||||||||||||||||||||||||||||||||
| Substrate | Incubation Time | 1 | 5 | 10 | 15 | Control | ||||||||||||||||||||||||||||
| Sb | 12 | 3.30±0.39c | 7.29±0.22b | 6.60±0.33c | 4.38±0.36d | 4.37±0.34e | ||||||||||||||||||||||||||||
| Sb | 24 | 3.38±0.22c | 7.59±0.35ab | 7.98±0.51b | 7.90±0.86c | 4.42±0.26e | ||||||||||||||||||||||||||||
| Sb | 36 | 4.96±0.79b | 7.87±0.58ab | 8.74±0.3b | 8.21±0.27c | 6.39±0.21e | ||||||||||||||||||||||||||||
| Sb | 48 | 5.07±0.17b | 9.92±0.72ab | 8.97±o.4b | 9.06±0.21bc | 7.97±0.47d | ||||||||||||||||||||||||||||
| Sb | 60 | 5.97±0.3ab | 8.36±0.44ab | 8.99±.42b | 10.0±0.2ab | 9.64±0.39b | ||||||||||||||||||||||||||||
| Sb | 72 | 6.99±0.65a | 8.78±0.13a | 11.7±0.64a | 11.1±1.26a | 11.4±0.62a | ||||||||||||||||||||||||||||
| Substrate concentration 10FPU | ||||||||||||||||||||||||||||||||||
| Substrate | Incubation Time | 1 | 5 | 10 | 15 | Control | ||||||||||||||||||||||||||||
| Sb | 12 | 4.88±0.39c | 6.01±0.41d | 6.01±0.41d | 6.93±0.3d | 6.72±0.29b | ||||||||||||||||||||||||||||
| Sb | 24 | 4.96±0.24c | 8.17±0.16c | 8.17±0.16c | 6.27±0.49d | 6.74±0.67b | ||||||||||||||||||||||||||||
| Sb | 36 | 6.62±0.58b | 9.02±0.43bc | 9.02±0.43bc | 7.85±0.43c | 6.76±0.79b | ||||||||||||||||||||||||||||
| Sb | 48 | 8.65±0.29a | 9.47±0.35b | 9.47±0.35b | 9.17±0.5b | 8.9±0.84a | ||||||||||||||||||||||||||||
| Sb | 60 | 9.18±0.39a | 10.9±0.33a | 10.9±0.33a | 9.0±0.48bc | 9.58±0.61a | ||||||||||||||||||||||||||||
| Sb | 72 | 9.37±0.28a | 11.0±0.48a | 11.0±0.48a | 10.8±0.27a | 9.89±0.44a | ||||||||||||||||||||||||||||
| Incubation Time 5FPU | ||||||||||||||||||||||||||||||||||
| Substrate | Substrate Conc |
12 | 24 | 36 | 48 | 60 | 72 | |||||||||||||||||||||||||||
| Sb | 1 | 3.30±0.39c | 3.38±0.22b | 4.96±0.79b | 5.0±0.17b | 5.97±0.3c | 6.99±0.65c | |||||||||||||||||||||||||||
| Sb | 5 | 7.29±0.22a | 7.59±0.35a | 7.87±0.58a | 7.92±0.72a | 8.36±0.44b | 8.78±0.13bc | |||||||||||||||||||||||||||
| Sb | 10 | 6.60±0.33a | 7.98±0.51a | 8.74±0.3a | 8.97±0.4a | 8.99±0.42ab | 11.7±0.64a | |||||||||||||||||||||||||||
| Sb | 15 | 4.38±0.36b | 7.90±0.86a | 8.21±0.27a | 9.06±0.21a | 10.0±0.2a | 11.1±1.26a | |||||||||||||||||||||||||||
| Sb | control | 5.18±0.15b | 7.68±0.99a | 8.05±1.47a | 8.52±0.68a | 9.88±0.61a | 10.3±0.46ab | |||||||||||||||||||||||||||
| Incubation Time 10FPU | ||||||||||||||||||||||||||||||||||
| Substrate | Substrate Conc |
12 | 24 | 36 | 48 | 60 | 72 | |||||||||||||||||||||||||||
| Sb | 4.88±0.39c | 4.96±0.24c | 6.62±0.58b | 8.65±0.29a | 9.18±0.39b | 9.37±0.28c | ||||||||||||||||||||||||||||
| Sb | 5 | 7.80±0.8a | 8.66±0.45a | 8.63±0.93a | 9.73±0.37a | 9.57±0.49b | 10.3±0.11ab | |||||||||||||||||||||||||||
| Sb | 10 | 6.01±0.41bc | 8.17±0.16a | 9.0±0.43a | 9.47±0.35a | 10.9±0.33a | 11.0±0.48a | |||||||||||||||||||||||||||
| Sb | 15 | 5.93±0.3bc | 6.27±0.49b | 7.85±0.43ab | 9.17±0.5a | 9.0±0.48b | 10.8±0.27ab | |||||||||||||||||||||||||||
| Sb | control | 6.72±0.29ab | 6.74±0.67b | 6.76±0.79b | 8.9±0.84a | 9.58±0.61b | 9.89±0.44bc | |||||||||||||||||||||||||||
| Incubation Time 5FPU | ||||||||||||||||||||||||||||||||||
| Substrate | Substrate Conc |
12 | 24 | 36 | 48 | 60 | 72 | |||||||||||||||||||||||||||
| Mc | 1 | 1.85±0.03d | 2.16±0.09c | 5.14±0.26b | 5.42±0.29c | 7.22±0.28b | 7.21±0.24c | |||||||||||||||||||||||||||
| Mc | 5 | 6.32±0.47b | 7.01±0.6a | 8.46±0.16a | 8.85±0.14ab | 9.71±0.26a | 9.88±0.06b | |||||||||||||||||||||||||||
| Mc | 10 | 6.64±0.4ab | 8.03±0.14a | 8.16±0.56a | 9.06±0.43a | 9.4±0.74a | 10.1±0.46b | |||||||||||||||||||||||||||
| Mc | 15 | 7.61±0.6a | 7.77±0.62a | 8.40±0.94a | 8.98±0.42a | 10.2±0.52a | 10.2±0.13b | |||||||||||||||||||||||||||
| Mc | control | 4.37±0.34c | 4.42±0.26b | 6.39±0.21b | 7.97±0.47a | 9.64±0.39a | 11.4±0.62a | |||||||||||||||||||||||||||
| Incubation Time 10FPU | ||||||||||||||||||||||||||||||||||
| Substrate | Substrate Conc |
12 | 24 | 36 | 48 | 60 | 72 | |||||||||||||||||||||||||||
| Mc | 1 | 2.05±0.03c | 2.21±0.16b | 5.23±0.18c | 6.2±0.14d | 7.69±0.44b | 9.19±0.16b | |||||||||||||||||||||||||||
| Mc | 5 | 6.53±0.38a | 7.38±0.28a | 7.26±0.1b | 7.36±0.24c | 7.92±0.31b | 9.06±0.47b | |||||||||||||||||||||||||||
| Mc | 10 | 6.92±0.7a | 7.50±1.14a | 9.34±0.6a | 10.6±0.47a | 10.5±0.89a | 10.9±0.87a | |||||||||||||||||||||||||||
| Mc | 15 | 6.32±0.46a | 7.16±0.89a | 9.11±0.25a | 9.34±0.09b | 9.99±0.69a | 11.0±0.29a | |||||||||||||||||||||||||||
| Mc | control | 4.87±0.17b | 5.95±0.47a | 9.01±0.42a | 9.38±0.4b | 9.59±0.53a | 10.1±0.23ab | |||||||||||||||||||||||||||
Note: Treatments with similar lower case letter in the similar column are not significantly varied. Treatments with the similar upper case letter across each raw are not significantly varied.
Disclaimer/Publisher’s Note: The statements, opinions and data contained in all publications are solely those of the individual author(s) and contributor(s) and not of MDPI and/or the editor(s). MDPI and/or the editor(s) disclaim responsibility for any injury to people or property resulting from any ideas, methods, instructions or products referred to in the content. |
© 2025 by the authors. Licensee MDPI, Basel, Switzerland. This article is an open access article distributed under the terms and conditions of the Creative Commons Attribution (CC BY) license (http://creativecommons.org/licenses/by/4.0/).
Copyright: This open access article is published under a Creative Commons CC BY 4.0 license, which permit the free download, distribution, and reuse, provided that the author and preprint are cited in any reuse.


