
Submitted:
18 April 2025
Posted:
21 April 2025
You are already at the latest version
Abstract
This study seeks to determine the genetic diversity among two cassava populations for total carotene content, dry matter, and hydrogen cyanide using single nucleotide polymorphic (SNP) markers. 376 cassava genotypes from two populations were assayed with nine trait-linked SNP markers. Data collected were subjected to marker (Minor Allele Frequency-MAF; Gene Diversity-GD; Heterozygosity-He; and Polymorphic Information Content-PIC) and principal components (PCA) analyses. A high call rate of 96 to 100% was observed across the populations. Discriminate analysis of PCA and hierarchical cluster dendrogram using the SNP markers categorized the genotypes into three clusters with 257, 88 and 15 genotypes in clusters 1, 2, and 3, respectively. The variation explained by the first two PCs was 39.1%. The level of genetic diversity observed in this study indicates sufficient variation in the two populations, hence promising for the pyramiding of genes for the three traits. The SNP markers used for this study were highly informative and polymorphic and revealed good estimates of genetic diversity. Clustering patterns of the genotypic backgrounds along the PC axis reflect an intense exchange of genetic backgrounds among the populations studied. Results from this study may contribute significantly to cassava breeding and germplasm conservation programs.
Keywords:
SNP marker
; cassava
; genetic diversity
; hydrocyanic acid
; total carotenoid
; dry matter content
; biofortification
INTRODUCTION
Cassava (Manihot esculenta Crantz; Euphobiecae) is the fourth most important crop in the world, after rice, wheat and maize (Mtunguja et al., 2019), playing a central role in food security and income generation for smallholder farmers especially in sub-Saharan Africa (SSA) (Mohidin et al., 2023). It is a perennial woody shrub with a starchy edible root that is widely cultivated and well adapted to the farming system of small-scale farmers (Ceballos et al., 2011; Esuma et al., 2016). The flexibility in planting, harvesting time and drought tolerance ability makes cassava popular among low-income earners with the ability to grow and produce on low nutrient soils and poor climatic conditions (Immanuel et al., 2024). Over 800 million people in sub-Saharan Africa (SSA), Asia and Latin America (Adebayo, 2023) depend on cassava as a staple and important source of dietary energy (Ferguson et al., 2019). Approximately, 178 million tonnes of cassava are produced in Africa (FAOSTAT, 2019). Cassava serves several purposes which include rural food staples, a cash crop for urban consumption, raw materials for industries, famine reserve, animal feed and foreign exchange (Tumuhimbise et al., 2014). Over the years, a lot of improved cassava varieties have been developed including the yellow root cassava (Kongsil et al., 2024).
However, most clones cultivated in SSA are deficient in essential micronutrients which pose major health challenges of nutritional insecurity (Ceballos et al., 2017; Balogun, 2022). Significant attempts have been made to develop cassava genotypes with combined traits such as provitamin A carotenoids (pVAC), dry matter content (DMC) and low hydrogen cyanide (HCN), but very little is known about their genetic diversity (Kamara, 2018). This makes it difficult to explore useful alleles for population improvement. Knowledge of the extent of genetic diversity is a prerequisite in providing an opportunity to broaden the genetic base to produce new and also permit the detection of genetic differences among closely related individuals (Tiago et al., 2016). Genetic analysis of cassava is essential to enhance the genetic yield and nutritional potential and maximum utilization of the desirable characters for synthesizing any ideal genotypes (Andrade et al., 2017). The assessment of genetic diversity among cassava populations is measured by using biochemical, morphological and molecular characterization (Okogbenin et al., 2012). However, morphological markers have several defects that reduce the ability to estimate genetic diversity in cassava as it is highly dependent on the environment for expression (Xiao et al., 2025).
The use of modern breeding tools such as molecular markers has provided useful insight for genetic characterization (Ren et al., 2013; Xiao et al., 2025). This permits the detection of genetic polymorphisms among cassava genotypes by revealing useful alleles that can be exploited in cassava biofortification breeding (Rabbi et al., 2014; Udoh et al., 2017). Such information guides the breeder to select unique clones to broaden the genetic base and produce superior varieties since the information revealed is based on the plant genotypes and also independent of environmental variation. Several different markers have been used over the years to characterize cassava germplasm for genetic variation (Ceballos et al., 2015; Karim et al., 2020). Single Nucleotide Polymorphism (SNP) markers are increasingly becoming markers of choice for genetic diversity studies and plant breeding applications (Rabbi et al., 2020; Amoah et al., 2025). SNPs are useful in detecting and identifying specific genetic differences even in a low-diverse population (Ferri et al., 2010). A marker system based on SNPs provides extra advantages due to the low genotyping cost, abundance in the genomes, biallelic nature, and their amenability for high-throughput detection formats and platforms (de Oliveira et al., 2012). These advantages of SNPs call for their application in genetic diversity research (Welsch et al., 2010; Karim et al., 2020). Thus, the objective of the present study was to assess the genetic diversity and relationships among two cassava populations using SNP markers to explore useful alleles to broaden the population base.
MATERIALS AND METHODS
Description of Plant Material
A total of 376 cassava genotypes from two populations: 277 genotypes (pop 1) derived from open-pollinated crosses among 23 progenitors of advanced breeding lines from IITA which combine high carotenoid content, high dry matter, high starch, and Cassava Mosaic Virus (CMD) resistance, and 76 genotypes from University of Ibadan (UIC, pop 2) with variability in storage root colour ranging from cream to deep yellow were used for this study. Parent materials for pop 2 are yellow-root cassava varieties (IITA-TMS 1070593, IITA-TMS 1011371, IITA-TMS 1070539, IITA-TMS 1011368, and IITA-TMS-1011412) selected for their high β-carotene content, CMD resistance/tolerance and storage root yield.
Experimental Layout and Management
Botanical seeds for population 1 were sown in the greenhouse, and the germinated seedlings (20–25 cm tall) were transplanted on the field. The plants were harvested 8 months after planting (MAP). The population 1 trial was established using augmented design and spacing of 1m between rows and 0.25 m within rows with clone TMEB117 as a common check. The seedlings were transplanted to the field in the first week of November 2024 at IITA, Ibadan, Nigeria (7°24′ N, 3°54′ E; 200 m above the sea level). Population 2 was established in May 2024 using Randomized Complete Block Design (RCBD) at the Teaching and Research Farm (longitude 3°45ʹE and latitude 7°27ʹN) of the Department of Crop and Horticultural Sciences, University of Ibadan, Oyo State, Nigeria. Twenty stem cuttings were planted in each plot measuring 20 m2 at a spacing of 1 m × 1 m with two replications. Field management practices were performed according to standards and technical recommendations for cassava at both experimental stations.
Molecular Characterization
Genotyping
A total of three hundred and seventy-six (376) cassava genotypes from vigorously growing plants: IITA-derived clones (Pop 1) (261 genotypes), University of Ibadan derived-UIC (pop 2) (76 genotypes) and 23 parents were used to generate the population 1 were assayed using the nine (9) trait-linked KASP markers (Udoh et al., 2017; Ogbonna et al., 2020; Rabbi et al., 2020) (Table 1). The genotyping process started with the leaf sample collection where four-leaf disk punches (6 mm diameter) were collected from 376 samples into 96 well- plates. Single-hole punchers and forceps were used to punch and placed the punches in wells of the plate. The sample plates were labeled with a tape and marker pen to identify each plate. The plates were covered with paraffin oil and then stored in Bioscience Center at IITA using LABCONCO FreeZone 18 Liter -50°C freeze-dryer (Labconco, Kansas city, MO, USA). The samples were freeze-dried at a temperature of -51°C and pressure of 5.0 pas for at least 72 hours until completely dry. The freeze-dried samples were shipped to Intertek lab, Australia where genotyping using the Kompetitive Allele-Specific PCR (KASP) method was carried out. Two non-template controls (NTC) were included in each plate. Detailed procedures for setting up and executing KASP genotyping reactions can be found in the KASP user guide (Genomics LGC, 2013). In brief, genotyping was performed using a high-throughput PCR SNP line platform with a reaction volume of 1 μL per well in 384-well plates. Each KASP reaction included three main components: genomic DNA from the sample, a marker-specific assay mix containing allele-specific primers, and the KASP-TF™ Master Mix. The master mix incorporates two universal FRET-based fluorescent cassettes (FAM and HEX), a reference dye (ROX™), Taq DNA polymerase, dNTPs, and MgCl₂ in a proprietary buffer. Each marker assay mix was uniquely tailored with two allele-specific forward primers and a shared reverse primer. After thermal cycling, fluorescence was measured and genotyping calls were made using KRAKEN™ software.
Data Analysis
Genotypic Data and Marker-Trait Association Analysis
The genotyping file containing the call for each SNP was generated by the SNP viewer. A raw Hap Map genotypic data file was generated using R Statistical Software (R Core Team, 2013), which was imported into TASSEL 5.0 (Bradbury et al., 2007) to calculate various summary SNP statistics such as the call rate, the minor allele frequency (MAF), polymorphic information content (PIC) gene diversity (GD) and heterozygous proportion (He). These were the key genetic diversity indices used to determine the extent of genetic differences between the two populations alongside the parental. Principal component analysis (PCA) was performed using the prcomp function in R Statistical Software (R Core Team, 2013) based on the nine markers. A phylogenic relationship among the genotypes (a pairwise genetic distance Identity-by-state matrix) was estimated via the PLINK software (Purcell et al., 2007), and Ward’s minimum variance hierarchical cluster dendrogram was generated from the IBS matrix using the analyses of phylogenetic and evolution (ape) package in R software (Paradis et al., 2004) for the nine (9) SNP markers across the three traits studied. This was done by calculating the pairwise population differentiation statistics (FST) using variant call format tools (Danecek et al., 2011) to estimate the genetic distance between the genotypes in Population 1 (IITA-derived) and Population 2 (UIC).
Diversity Assessment Among Genotypes in Two Breeding Populations; Population 1 and 2
The summary statistic of the nine (9) SNP markers used to estimate the minor allele frequencies (MAF), gene diversity (GD), level of heterozygosity (He), and the polymorphic information content (PIC) values are presented in Table 2. The MAF, PIC, He, and GD are key population genetic indices that measure the informativeness of a marker and genetic differences among any studied populations. Genetic variability was observed among the 360 cassava genotypes across the two populations including 23 progenitors.
The minor allele frequencies (MAF) ranged from 0.11 (S1_24197219) to 0.45 (S5_3387558) with an average of 0.25 and 0.00 (S1_24197219, S1_24155522) to 0.41 (S16_773999) with an average value of 0.28 across the SNP markers in population 2 and 1, respectively. The progenitors MAF ranged from 0.00 to 0.5 having a mean of 0.29. The MAF values obtained agree with previous reports by Nielsen et al. (2012) and Prempeh et al. (2020) who observed MAF values between 0.01 to 0.5.
The mean heterozygosity (He) for all loci were 0.41 and 0.42, varying from 0.15 (S1_24197219) to 0.88 (S5_3387558) and 0.00 (S1_24197219, S1_24155522) to 0.73 within populations 2 and 1, respectively. Maximum heterozygosity was present at SNP S5_3387558 (0.88). Gene diversity (GD) was highest (0.50) for SNP S5_3387558, S16_773999 and the lowest (0.00) for S1_24197219 and S1_24155522 with the mean GD of 0.36 across the populations.
The average gene diversities obtained for the two populations including the progenitors were lower than the mean heterozygosity observed. The polymorphic information content values (PIC) ranged from 0.17 (S1_24197219) to 0.37 (S5_3387558, S130543962) (mean, 0.45); 0.00 (S1_24197219, S1_24155522) to 0.37 (S16_773999, S8_25598183) (mean, 0.27) in both populations 2 and 1, respectively. The PIC values in the parents ranged from 0.00 to 0.37 with an average of 0.27 (Table 2). About 78% of SNP markers used in this study recorded a PIC > 0.28, indicating that the markers were relatively more informative than those below. The GD, level of He, and PIC followed the same pattern among the SNP markers used for the study. Different PIC values were observed across the SNP loci for the entire population.
The PIC, MAF, He, and GD values observed for different markers were high among the clones except for markers S1_24197219 and S1_24155522, which had 0.00 for all genetic diversity parameters within population 1 as well as the progenitors. According to the genetic diversity parameters, levels of diversity for dry matter and HCN were highest in population 1, followed by population 2 with the progenitors having the least diversity.
Figure 1 represents the population structure of cassava genotypes characterized by PCA and diversity among 360 cassava genotypes based on the nine (9) markers across the two populations and the progenitors. The total amount of variation explained by the first two (2) PCs was 39.1%. The first and second PCs (PC1 and PC2) explain 22.3% and 16.8%, respectively of the total variation observed across the populations. From Figure 1, there are no distinct cluster patterns along the two PCs based on the genotype background or source. Estimation of cluster membership (Figure 2) convened the entire genotypes into three (3) distinct groups.
Cluster 3 had the highest number (257) of genotypes, followed by cluster 2 (88) with cluster 1 being the least (15). Cluster 1 members are only made of clones in population 2 while clusters 2 and 3 contain the mixture of the two populations and the progenitors. The highest genetic distance was observed between IBASN201136_3 (pop 1) and TMEB3 (pop 2), while the lowest was recorded between IBASN201098_20 and IBASN201098_27 (derived from cross IITA-TMS-IBA154810/IITA-TMS-IBA180158), and between IBASN201089_7 and IBASN201089_14 (derived from cross IITA-TMS-IBA150605/IITA-TMS-IBA150815). Genotypes in cluster 1 had low cyanide potential (min = 9.31mg/100g, max = 49 mg/100g, mean = 27.18) and low TCC (min = 0.59 μg/g, max = 7.15 μg/g, mean = 4.40 μg/g) with low to moderate DMC compared to group 1 and 2 members. The dry matter content ranged from 16% (TMEB3) to 30.9% (UIC-17-646) with an average of 23.94. In terms of the marker properties, group 1 members are either heterozygotes (each copy of favourable and unfavourable alleles) or homozygotes (two copies of unfavourable) for the four markers linked with pVAC; likewise, locus S14_6050078 (AA and AG) which is HCN marker. Cluster 2 members are comprised of two progenitors (IITA-TMS-IBA141092 and IITA-TMS-IBA180158), three clones from pop 2 (UIC-17-5, UIC-17-1842, and UIC-17-1972) with the remaining 83 coming from the pop 1. Variety IITA-TMS-IBA141092 was used as a female in the cross to generate IBASN201149 (pop 1) which are both in clusters 2 and 3.
A similar clustering pattern was observed for variety IITA-TMS-IBA180158 when used as female to generate IBASN201160 (pop1). However, when variety IITA-TMS-IBA180158 was used as male (IITA-TMS-IBA154810/IITA-TMS-IBA180158), all the progenies (family IBASN201098) were grouped in cluster 3. The majority of the parents used as both males and females were found in cluster 3, including their progenies. Cluster 2 members are generally high cyanogenic potential genotypes with high carotenoids and dry matter content.
Cluster 3 is the largest consisting of clones from both populations and the progenitors (21 out of 23) of pop 1. The genotypes consist of low, moderate, and high TCC, dry matter, and HCN content. All three genotype classes for 7 SNP markers were observed within cluster 3 except markers S1_24155522 (AA) and S1_24197219 (TT) which had only one type of genotype class.
Discussion
Single Nucleotide Polymorphism markers (SNPs) were used to estimate the genetic divergence and also determine the extent of genetic variation for dry matter, carotenoid content, and hydrogen cyanide among two different cassava populations; Population 2 (UIC-derived) and population 1 (IITA-derived) alongside the progenitors used to generate population 1. The efficient use of population in crop improvement is largely dependent on the knowledge of the genetic difference and the amount of variation that exists in such population. The different MAF values observed across the SNP markers arose from the different populations used in the study and this concord with a previous report by Ioannidis (2009). These values indicate that the SNP markers used in the present study are polymorphic.
The quality of a SNP marker as confirmed by Wang et al. (2009) is defined by the values of both the minor allele frequency and heterozygous proportion. A lower average gene diversities obtained suggests some form of outcrossing or heterozygote excess which is contrary to expectations for a natural population under the Hardy-Weinberg equation. Due to the propensity of cassava for natural interspecific hybridization, the crop is highly heterozygous (Alves, 2002; Janick and Byrne, 1984). Over 78% of SNP markers used in this study recorded a PIC > 0.28 which indicate the markers were relatively more informative since Polymorphic information content measures the discrimination power and informativeness of SNP marker; thus, quantifying the degree of polymorphism among genotypes for an SNP locus used in diversity analysis (Ganapathy et al., 2012; Makueti et al., 2015; Prempeh et al., 2020). Therefore, the quality of these markers could be said to be high enough to detect variation among cassava genotypes (Oliveira et al. 2014). Different PIC values observed across alleles could result from factors such as breeding behavior of the species, evolutionary pressure and mutation rate in a population over a given period genetic diversity in the collection, size of the collection, the sensitivity of the genotyping method, location of primers in the genome used for study, etc. (Choudhury et al., 2013; Ogbonna et al., 2021).
The bi-allelic nature of SNPs leads to relatively low PIC values, reported to range from 0 to 0.5 as opposed to SSRs which are multi-allelic and can have a PIC value that goes above 0.50 to 1.0 (Choudhury et al., 2013; Prempeh et al., 2020). Hence the two populations studied showed moderate to high genetic diversity for carotenoid content, dry matter content, and hydrogen cyanide content for high PIC, GD, and He values recorded (Prempeh et al., 2020; Olasanmi et al., 2021). This suggests the availability of useful alleles that could be exploited in cassava biofortification programmes. The determination of the extent of genetic diversity for traits among breeding populations using SNPs is hence, highly recommended (Wolfe et al., 2016; Andrade et al. 2017). Markers with relatively higher PIC revealed high GD and He, as also reported by Olasanmi et al. (2021). The polymorphism and the distribution of DNA segments across the genome differ among different marker types for the genotypic background.
The values observed (Table 4.1) for markers S1_24197219 and S1_24155522 were expected since the two markers co-segregated in the studied population due to physical linkage on chromosome 1, which was also observed by Zhang et al. (2015). A genome-wide association study (GWAS) report by Rabbi et al. (2020) found the two SNP loci in the same position on chromosome 1. Although, the markers used in this study were mainly designed for marker-assisted selection (MAS), however, they can be used for genetic diversity studies.
Clustering patterns of the genotypic backgrounds along the PC axis reflect an intense exchange of genetic backgrounds among the populations studied. Principal Component Analysis is a key technique used to identify plant traits that contribute most to the observed variation within a group of 360 cassava genotypes. The strong relatedness between the two populations, and a bottleneck in the breeding history of progenitors (IITA lines), could be among the factors underpinning the clustering pattern. Clones from the UIC breeding programme (pop 2) and the IITA HarvestPlus clones (pop) are closely related. The presence of the parents used as both males and females in cluster 3, including their progenies, signifies maternal effect in inheritance as shown in reciprocal crosses (Akinwale et al., 2010). The different genotype classes observed explains why the phenotypic values for the assessed traits ranged from low to high. Moreover, the presence of the two populations with the progenitors in clusters 2 and 3 indicate the extent and the exchange of genomic regions between the IITA-derived (pop 1) and the UI-derived (pop 2). The majority of the progenitors and the pop 1 observed in group 3 confirms the fact that they were the pedigrees used to derive population 1. The clustering pattern observed in these studies could in part be influenced by the source of the genotypes as those with the same parental clones were found within the same cluster (1 and 2) (Kawuki et al., 2009).
Conclusion
This study concluded that about 90 percent of the SNP markers were highly informative and polymorphic to distinguish among the cassava populations. The PIC, MAF, He, and GD values observed for different markers were high among the clones except for markers S1_24197219 and S1_24155522 which appear recorded at 0.00 for all genetic diversity parameters within pop 1 and progenitors. The remaining SNPs could therefore be used for future genetic diversity studies in cassava. In addition, SNP markers were able to separate the genotypes into different clusters. Genetic diversity parameters indicate sufficient genetic variation exists among the two populations genotyped for the assessed traits, hence, the presence of useful alleles that could be exploited in the biofortification breeding programme. The high allelic richness coupled with estimates of gene diversity designate a moderate to high genetic diversity among the studied cassava population. The genetic differentiation revealed by the SNP markers in the two populations including the progenitors ranged from moderate to high for the assessed traits. Hence, the inclusion of such genotypes during breeding programs would enhance the development of low HCN clones with high carotenoid content and DMC that will be easily adopted by farmers and other stakeholders along the value chain.
Acknowledgements
The authors extend their colossal gratitude to the Pan African University of Earth and Life Science (including Health and Agriculture), University of Ibadan, and the International Institute of Tropical Agriculture.
Funding Acknowledgment
The study was funded by African Union [Grant No. PAU020110MB].
Statement of Conflicting Interests
We the authors of this manuscript declare that we have no conflict of interest.
References
- Akinwale, M., Aladesanwa, R., Akinyele, B., Dixon, A. & Odiyi, A. (2010). Inheritance of ßcarotene in cassava (Manihot esculenta Crantz). International Journal of Genetics and Molecular Biology, 2: 198-201.
- Alves, A.A.C. (2002). Cassava botany and physiology, Chapter 5, in Hillocks, R.J., J.M. Thresh and A.C. Bellotti (eds.), Cassava: Biology, Production, and Utilization, CABI, Wallingford, United Kingdom, pp. 67-89.
- Adebayo, W. G. (2023). Cassava production in africa: A panel analysis of the drivers and trends. Heliyon, 9(9), e19939. [CrossRef]
- Andrade, E.K.V., Andrade, J.V.C., Laia, M.L., Fernandes, J.S.C., Oliveira, A.J.M. & Azevedo, A.M. (2017). Genetic dissimilarity among sweet potato genotypes using morphological and molecular descriptors. Acta Scientiarum- Agronomy, 39:447–455.
- Amoah, P., Adetimirin, V.O., Anokye, B., llesanmi, O.J., Unachukwu, N., & Aprova, E.I. (2025). Characterization of carotenoid profiles and presence of functional markers in sub-tropical maize (Zea mays L.) inbred lines. Czech Journal of Genetics and Plant Breeding, (1), 1–14. [CrossRef]
- Azmach, G., Gedil, M., Menkir, A., & Spillane, C. (2013). Marker-trait association analysis of functional gene markers for provitamin A levels across diverse tropical yellow maize inbred lines. BMC Plant Biology, 13:227. [CrossRef]
- Bradbury, P.J., Zhang, Z., Kroon, D.E., Casstevens, T.M., Ramdoss, Y., & Buckler, E.S. (2007). TASSEL: software for association mapping of complex traits in diverse samples. Bioinformatics, 1;23(19):2633-5. [CrossRef]
- Balogun, I. A. (2022). Addressing challenges in adoption of improved varieties of cassava and its associations with household food security and dietary diversity among smallholder cassava farming households in Nigeria. March.
- Ceballos, H., Davrieux, F., Talsma, E.F., Belalcazar, J., Chavarriaga, P., & Andersson, M.S. (2017). Carotenoids in Cassava Roots. In: Carotenoids. InTech Publisher, pp 189-221.
- Ceballos, H., Hershey, C. & Becerra-López-Lavalle, L.A. (2011). New approaches to cassava breeding. Plant Breeding Reviews. 36:427-504.
- Ceballos, H., Kawuki, R.S., Gracen, V.E., Yencho. G.C., & Hershey, C.H. (2015). Conventional breeding, marker-assisted selection, genomic selection and inbreeding in clonally propagated crops: a case study for cassava. Theoretical and Applied Genetics, 128:1647–1667. [CrossRef]
- Choudhury, B., Khan, M.L. & Dayanandan. S. (2013). Genetic structure and diversity of Indigenous Rice varieties (Oryza sativa) in the Eastern Himalayan region of Northeast India. Springer Plus, 2: 228–237. [CrossRef]
- Danecek, P., Auton, A., Abecasis, G., Albers, C. A., Banks, E., DePristo, M. A., Handsaker, R. E., Lunter, G., Marth, G. T., Sherry, S. T., McVean, G., & Durbin, R. (2011). The variant call format and VCFtools. Bioinformatics, 27(15), 2156–2158. [CrossRef]
- De Oliveira, E. J., Vilela de Resende, M. D., da Silva Santos, V., Fortes Ferreira, C., Alvarenga Fachardo Oliveira, G., Suzarte da Silva, M., & Aguilar-Vildoso, C. I. (2012). Genome-wide selection in cassava. Euphytica, 187: 263–276.
- Esuma, W., Herselman L., Labuschagne M.T., Ramu P., Lu F., & Baguma Y., et al. (2016). Genome-wide association mapping of provitamin A carotenoid content in cassava. Euphytica, 212.1:97-110. [CrossRef]
- Ferguson, M.E., Hearne, S.J., Close T.J., Wanamaker, S., Moskal, W.A., Town, C.D., de Young, J., Marri, P.R., Rabbi, I.Y. & de Villiers, E.P. (2011). Identification, validation, and high-throughput genotyping of transcribed gene SNPs in cassava. Theoretical and Applied Genetics, 124.4: 685–695. [CrossRef]
- Ferri, L., Perrin, E., Campana, S., Tabacchioni, S., Taccetti, G., Cocchi, P., Ravenni, N., Dalmastri, C., Chiarini, L., Bevivino, A., Manno, G., Mentasti, M. & Fani R. (2010). Application of multiplex single nucleotide primer extension (mSNuPE) to the identification of bacteria: the Burkholderia cepacia complex case. Journal of Microbiological Methods, 80: 251–256. [CrossRef]
- Ganapathy, K.N., Gomashe, S.S., Rakshit, S. & Prabhakar, B. (2012). Genetic diversity revealed the utility of SSR markers in classifying parental lines and elite genotypes of sorghum (Sorghum bicolour L. Moench). Australian Journal of Crop Sciences, 6.11: 1486–1493.
- Harjes, C.E., Rocheford, T. R., Bai, L., Brutnell, T. P., Vallabhaneni, R., Williams, M., Wurtzel, E. T., Kandianis, C. B., Sowinski, S. G., Stapleton, A. E., Yan J., & Buckler, E. S. (2008). Natural genetic variation in lycopene epsilon cyclase tapped for maize biofortification. Science, 319:330–3. [CrossRef]
- Ige, A. D., Olasanmi, B., Mbanjo, E. G. N., Kayondo, I. S., Parkes, E. Y., Kulakow, P., Egesi, C., Bauchet, G. J., Ng, E., Lopez-Lavalle, L. A. B., Ceballos, H., & Rabbi, I. Y. (2021). Conversion and validation of uniplex snp markers for selection of resistance to cassava mosaic disease in cassava breeding programs. Agronomy, 11(3), 1–17. [CrossRef]
- Ioannidis, J.P.A. (2009). Population-wide generalizability of genome-wide discovered associations. Journal of the National Cancer Institute,101.19: 1297-1299. [CrossRef]
- Immanuel, S., Jaganathan, D., Prakash, P., & Sivakumar, P. S. (2024). Cassava for Food Security, Poverty Reduction and Climate Resilience: A Review. Indian Journal of Ecology, February. [CrossRef]
- Janick, J. & D. Byrne (1984). Breeding cassava, Chapter 3, in Plant Breeding Reviews, 2: 73-133,.
- Kamara, L., Kassoh, F.A., Kamara, E.G., Masssaquoi, F.B., Yila, K.M. & Contech, A.R. (2018). Evaluation of Improved Cassava Genotypes for storage root yield and post traits in the Njala soil series. Journal of interdisciplinary Biosciences, 2.2: 12-20. [CrossRef]
- Kongsil, P., Ceballos, H., Siriwan, W., Vuttipongchaikij, S., Kittipadakul, P., Phumichai, C., Wannarat, W., Kositratana, W., Vichukit, V., Sarobol, E., & Rojanaridpiched, C. (2024). Cassava Breeding and Cultivation Challenges in Thailand: Past, Present, and Future Perspectives. Plants, 13(14), 1–29. [CrossRef]
- Karim, K. Y., Ifie, B., Dzidzienyo, D., Danquah, E. Y., Blay, E. T., Whyte, J. B. A., Kulakow, P., Rabbi, I., Parkes, E., Omoigui, L., Norman, P. E., & Iluebbey, P. (2020). Genetic characterization of cassava (Manihot esculenta Crantz) genotypes using agro-morphological and single nucleotide polymorphism markers. Physiology and Molecular Biology of Plants, 26(2), 317–330. [CrossRef]
- Kawuki, R., Ferguson, M., Labuschagne, M., Herselman, L., & Kim, D. J. (2009). Identification, characterization, and application of single nucleotide polymorphisms for diversity assessment in cassava (Manihot esculenta Crantz). Molecular Breeding, 23:669–684. [CrossRef]
- Makueti, T.J., Gordon, O., Zac, T., Alice, M., Alain, T., Ebenezer, A., & Robert, K. (2015). Genetic diversity of Dacryodes edulis provenances used in controlled breeding trials. Journal of Plant Breeding and Crop Sciences, 7.12: 327–339. [CrossRef]
- Mtunguja, M.K., Beckles, D.M. Laswai, H.S., Ndunguru, J.C., & Sinha, N.J. (2019). Opportunities to commercialize cassava production for poverty alleviation and improved food security in Tanzania. African Journal of Food Agriculture, Nutrition and Development, 19 (1) pp. 13928-13946. [CrossRef]
- Mohidin, S. R. N. S. P., Moshawih, S., Hermansyah, A., Asmuni, M. I., Shafqat, N., & Ming, L. C. (2023). Cassava (Manihot esculenta Crantz): A Systematic Review for the Pharmacological Activities, Traditional Uses, Nutritional Values, and Phytochemistry. Journal of Evidence-Based Integrative Medicine, 28. [CrossRef]
- Ogbonna, A. C., de Andrade, L.R.B., Mueller, L.A, de Oliveira, E.J. & Bauchet, J.G. (2021). Comprehensive genotyping of Brazilian Cassava (Manihot esculenta Crantz) Germplasm Bank: insights into diversification and domestication, Theoretical and Applied Genetics, 134:1343–1362.
- Ogbonna, A. C., de Andrade, L. R. B., Rabbi, I. Y., Mueller, L. A, de Oliveira, E. J. & Bauchet, G. (2020). A large-scale genome-wide association study, using historical data, identifies the conserved genetic architecture of cyanogenic glucoside content in cassava (Manihot esculenta Crantz) root. Plant Journal, 105.3: 754-770.
- Okogbenin, E., Egesi, C. N., Olasanmi, B., Ogundapo, O., Kahya, S., Hurtado, P., Marin, J., Akinbo, O., Mba, C., Gomez, H., de Vicente, C., Baiyeri, S., Uguru, M., Ewa, F., & Fregene, M. (2012). Molecular marker analysis and validation of resistance to cassava mosaic disease in elite cassava genotypes in Nigeria. Crop Science, 52: 2576–2586. [CrossRef]
- Olasanmi, B., Kyallo, M. and Yao, N. (2021). Marker-assisted selection complements phenotypic screening at the seedling stage to identify cassava mosaic disease-resistant genotypes in African cassava populations. Scientific Reports, 11: 2850. [CrossRef]
- Oliveira, E.J., De Ferreira, C.F., Santos, V.S., Jesus, O.N., Oliveira, G.A.F. and Silva, M.S. (2014). Potential of SNP markers for the characterization of Brazilian cassava germplasm. Theoretical and Applied Genetics, 127:1423-1440.
- Paradis, E., Claude, J., & Strimmer, K. (2004). APE: Analyses of Phylogenetics and Evolution in R language. Bioinformatics, 20(2), 289–290. [CrossRef]
- Prempeh, R.N., Manu-Aduening, J., Quain M.D., Asante, I.K., Samuel Kwasi Offei, S.K., & Danquah E.Y. (2020). Assessment of genetic diversity among cassava landraces using single nucleotide polymorphic markers. African Journal of Biotechnology, 19.6:383–391.
- Purcell, S., B. Neale, K. Todd-Brown, L. Thomas, M.R. Ferreira, D. Bender, J. Maller, P. Sklar, P.I.W. de Bakker, M.J. Daly, & P.C. Sham. (2007). PLINK: a tool set for whole-genome association and population-based linkage analyses. American Journal of Human Genetics, 559–575. [CrossRef]
- R Development Core Team. (2020). R: A language and environment for statistical computing. Vienna, Austria: R Foundation for Statistical computing. Available at https://www.R-project.org/ (accessed 21 September 1, 2019).
- Bourne, R. Adelson, J. & Flaxman, S. (2020). Trends in prevalence of blindness and distance and near vision impairment over 30 years and contribution to the global burden of disease in 2020. Lancet Global Health, 9.2: e130-e143.
- Rabbi, I., Hamblin, M., Gedil, M., Kulakow, P., Ferguson, M., kpan, I., Delphine, A. S. & Jean-Luc, J. (2014a). Genetic mapping using genotyping-by-sequencing in the clonally propagated cassava. Crop Science, 54:1384–1396. [CrossRef]
- Rabbi, I., Hamblin, M.T., Kumar, P.L., Gedil, M.A., Ipan, A.S., Jannink, J.L. and Kulakow, P.A .(2014b). High-resolution Genetic mapping of resistance to cassava mosaic geminiviruses in cassava using genome-by-sequencing and its implications for breeding. Virus Research, 186: 87-96. [CrossRef]
- Rabbi, I., Udoh L. I., Wolfe, M., Parkes, E.Y., Gedil, M.A., Dixon A., Ramu P., Jannink J., Kulakow P. (2017). Genome-Wide Association Mapping of Correlated Traits in Cassava: Dry Matter and Total Carotenoid Content. The Plant Genome, 10.3. [CrossRef]
- Rabbi, I.Y, Kayondo, S.I., Bauchet, G., Yusuf, M., Aghogho, C.I., Ogunpaimo, K., Uwugiaren, R., Smith, I.A., Peteti, P., Agbona, A., Parkes, E., Ezenwaka L., Wolfe, M., Jannink, J-L., Egesi, C. & Kulakow, P. (2020). Genome-wide association analysis reveals new insights into the genetic architecture of defensive, agro-morphological, and quality-related traits in cassava. Plant Molecular Biology, pp 1-19. [CrossRef]
- Ren, J., Sun, D., Chen, L., You, F.M., Wang, J., Peng, Y., Nevo, E., Sun, D., Luo, M.C. & Peng, J. (2013). Genetic diversity was revealed by single nucleotide polymorphism markers in a worldwide germplasm collection of durum wheat. International Journal of Molecular Sciences, 14: 7061–7088. [CrossRef]
- R Core Team. (2013): R: A language and environment for statistical computing. R Foundation for Statistical Computing, Vienna, Austria.URL https://www.R-project.org/.
- Tiago, A.V., Rossi, A.A.B., Tiago, P.V., Carpejani, A.A., Silva, B.M., Hoogerheide, E.S.S., & Yamashita, O.M. (2016). Genetic diversity in cassava landraces grown on farms in Alta Floresta-MT, Brazil A.V. Genetics and Molecular Research. 15(3):1-10. [CrossRef]
- Tumuhimbise, R., Shanahan, P., Melis, R. & Kawuki, R. (2014). Combining ability analysis of storage root yield and related traits in cassava at the seedling evaluation stage of breeding. Journal of Crop Improvement. 28(4):530-546. [CrossRef]
- Udoh, L.I., Maleku, G., Parkes, Y. E., Kulakow, P., Adesoye, A., Nwuba, C., & Rabbi, Y. I. (2017). Candidate gene sequencing and validation of SNP markers linked to carotenoid content in cassava (Manihot esculenta Crantz). Molecular breeding, 37:123.
- Wang, H.Z., Wu, Z.X., Lu, J.J., Shi, N.N., Zhao, Y., Zhang, Z.T., & Liu, J.J. (2009). Molecular diversity and relationships among Cymbidium goeringii cultivars based on inter-simple sequence repeat (ISSR) markers. Genetica, 136: 391–399. [CrossRef]
- Welsch, R., Arango, J., Bär, C., Salazar, B., Al-Babili, S., Beltrán, J., Chavarriaga, P., Ceballos, H., Tohme, J. & Beyer, P. (2010). Provitamin A accumulation in cassava (Manihot esculenta) roots is driven by a single nucleotide polymorphism in a phytoene synthase gene. Plant Cell, 22: 3348-3356. [CrossRef]
- Wolfe, M.D., Rabbi, I.Y., Egesi, C., Hamblin, M., Kawuki, R., Kulakow, P., Lozano, R., Del Carpio, D.P., Ramu, P., & Jannink, J. (2016). Genome-Wide Association and Prediction Reveal Genetic Architecture of Cassava Mosaic Disease Resistance and Prospects for Rapid Genetic Improvement. Plant Genome, 9: 1–13. [CrossRef]
- Xiao, L., Cheng, D., Ou, W., Chen, X., Rabbi, I. Y., Wang, W., Li, K., & Yan, H. (2025). Advancements and strategies of genetic improvement in cassava (Manihot esculenta Crantz): from conventional to genomic approaches. Horticulture Research, 12(3). [CrossRef]
- Zhang, X., Perez-Rodriguez, P., Semagn, K., Beyene, Y., Babu, R., Lopez-Cruz, M. A., F San Vicente, Olsen, M., Buckler, E., Jannink, J-L., Prasanna, B.M & Crossa, J. (2015). Genomic prediction in biparental tropical maize populations in water-stressed and well-watered environments using low-density and GBS SNPs. Heredity, 114: 291–299. [CrossRef]
Figure 1.
Principal component analysis of 360 cassava genotypes derived from nine (9) SNP markers.
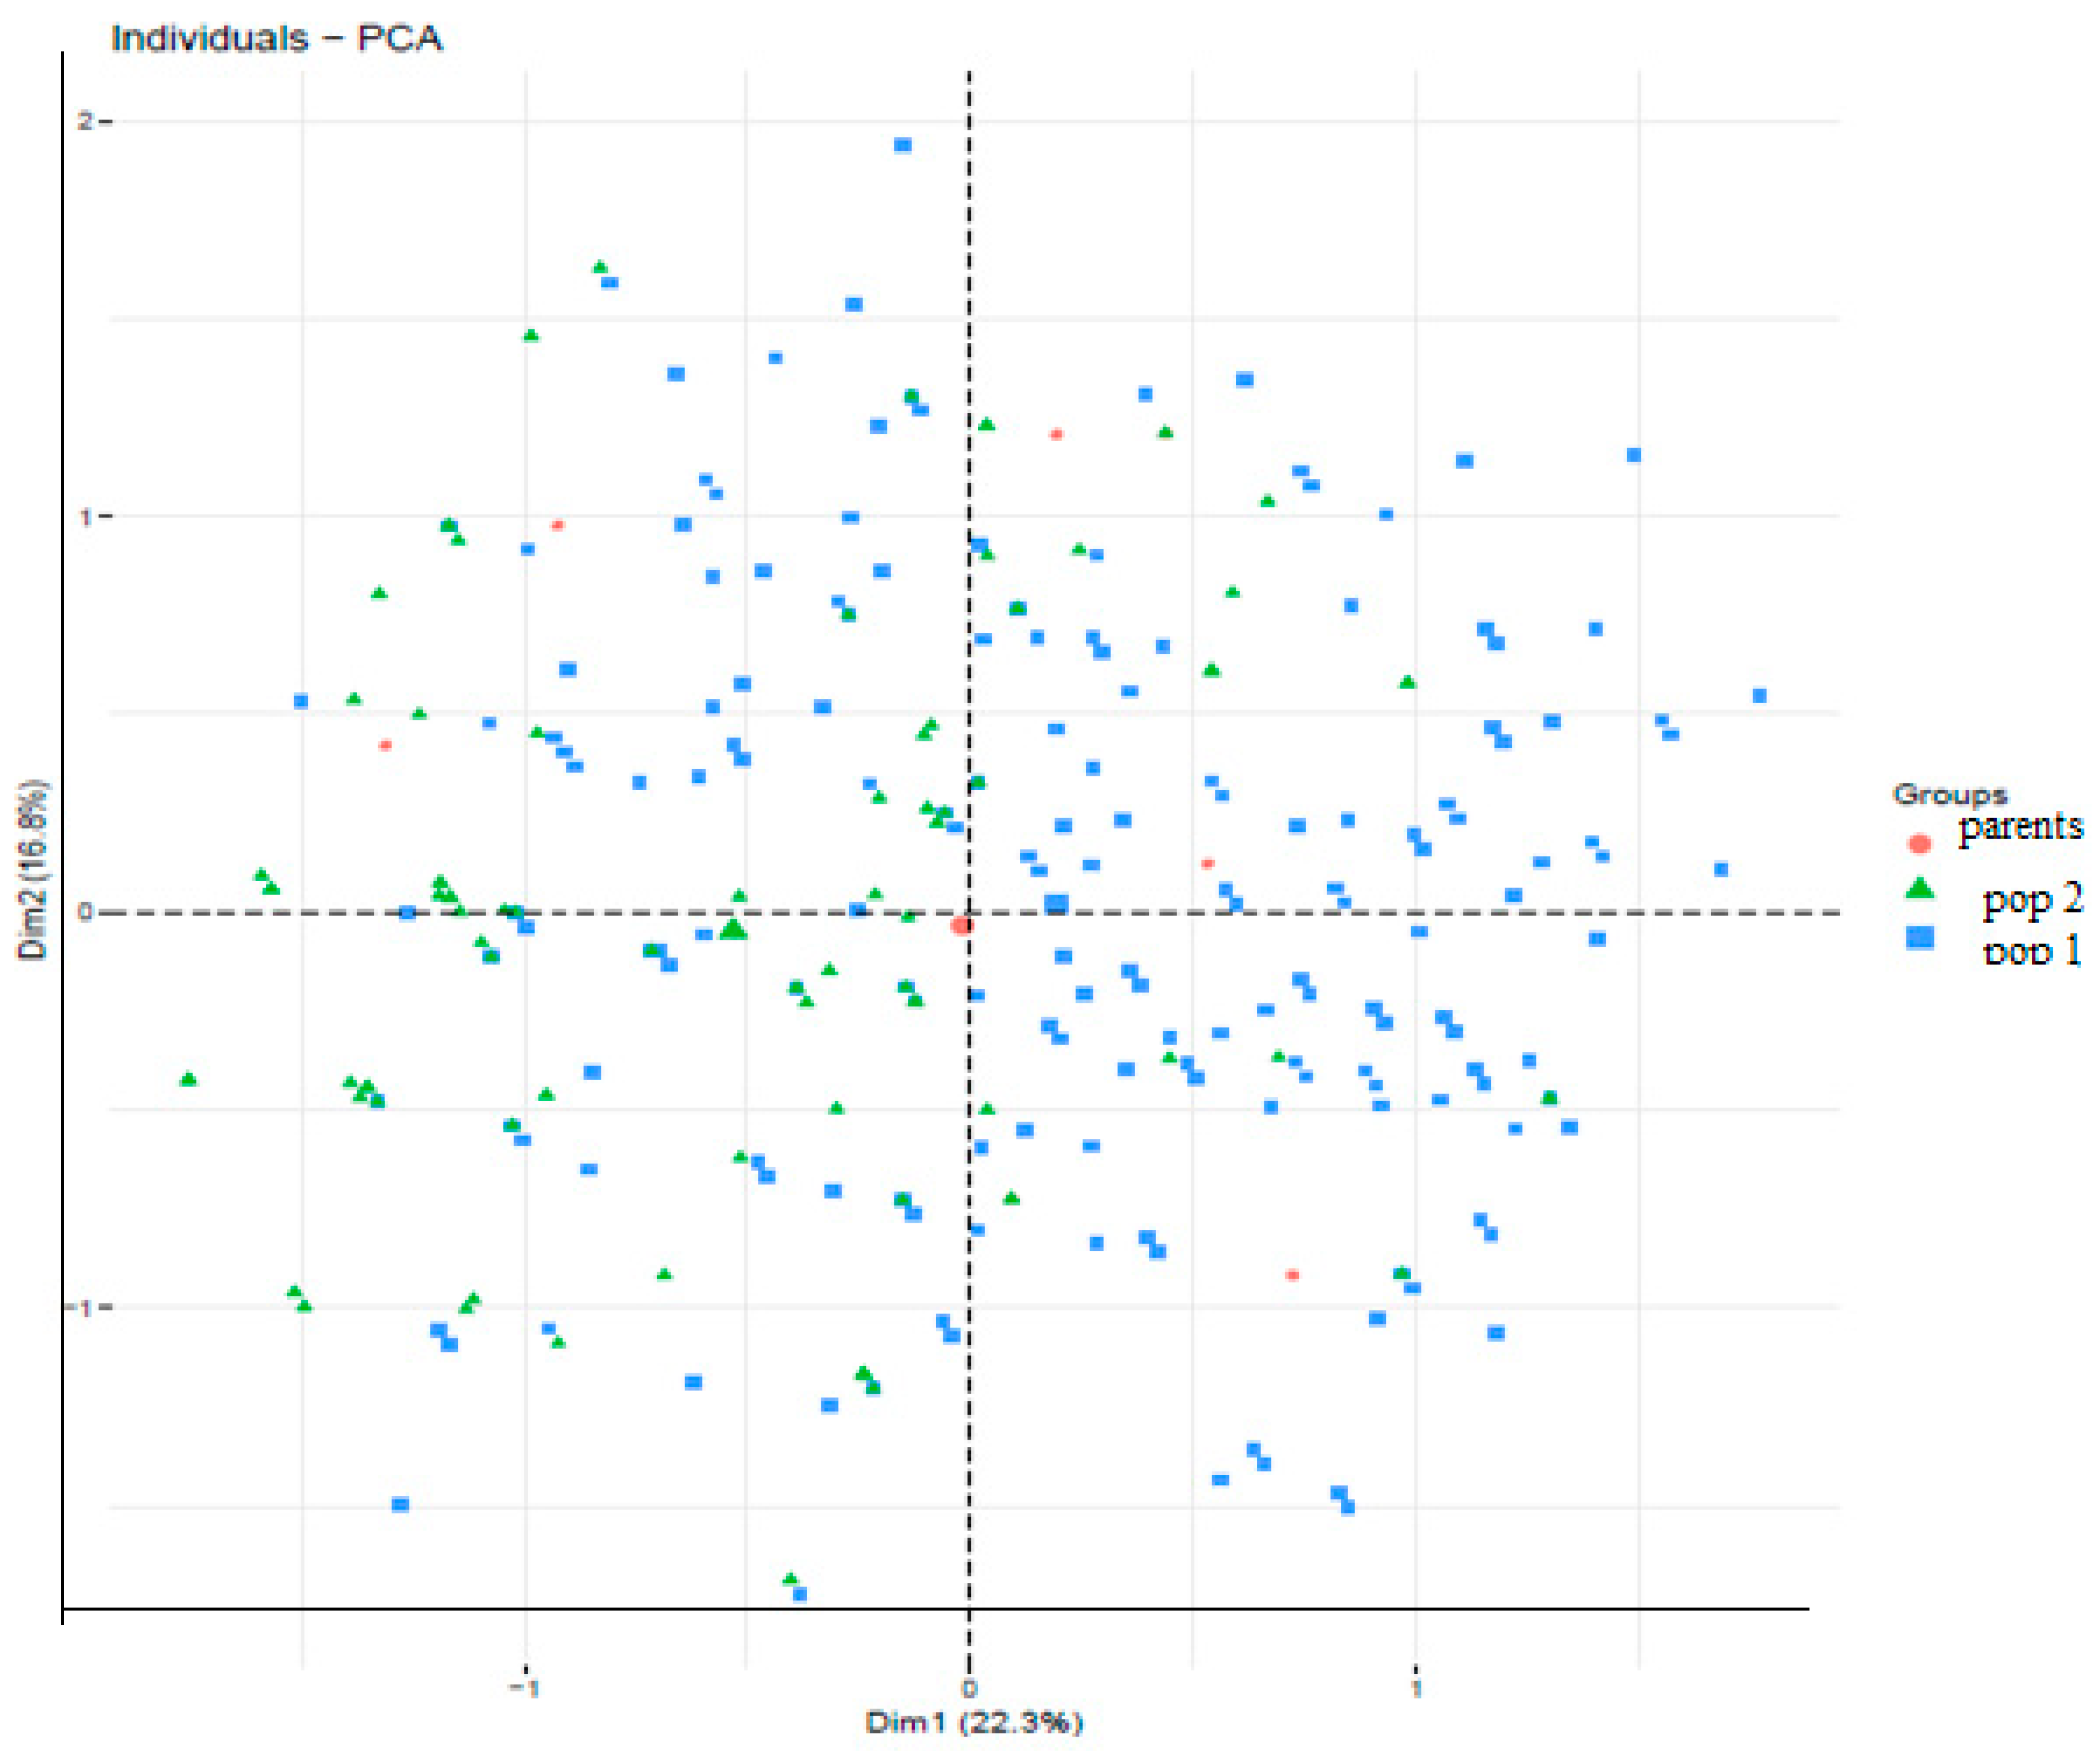
Figure 2.
Hierarchical cluster dendrogram showing the genetic relationship among the cassava genotypes for nine (9) SNP markers.
Figure 2.
Hierarchical cluster dendrogram showing the genetic relationship among the cassava genotypes for nine (9) SNP markers.
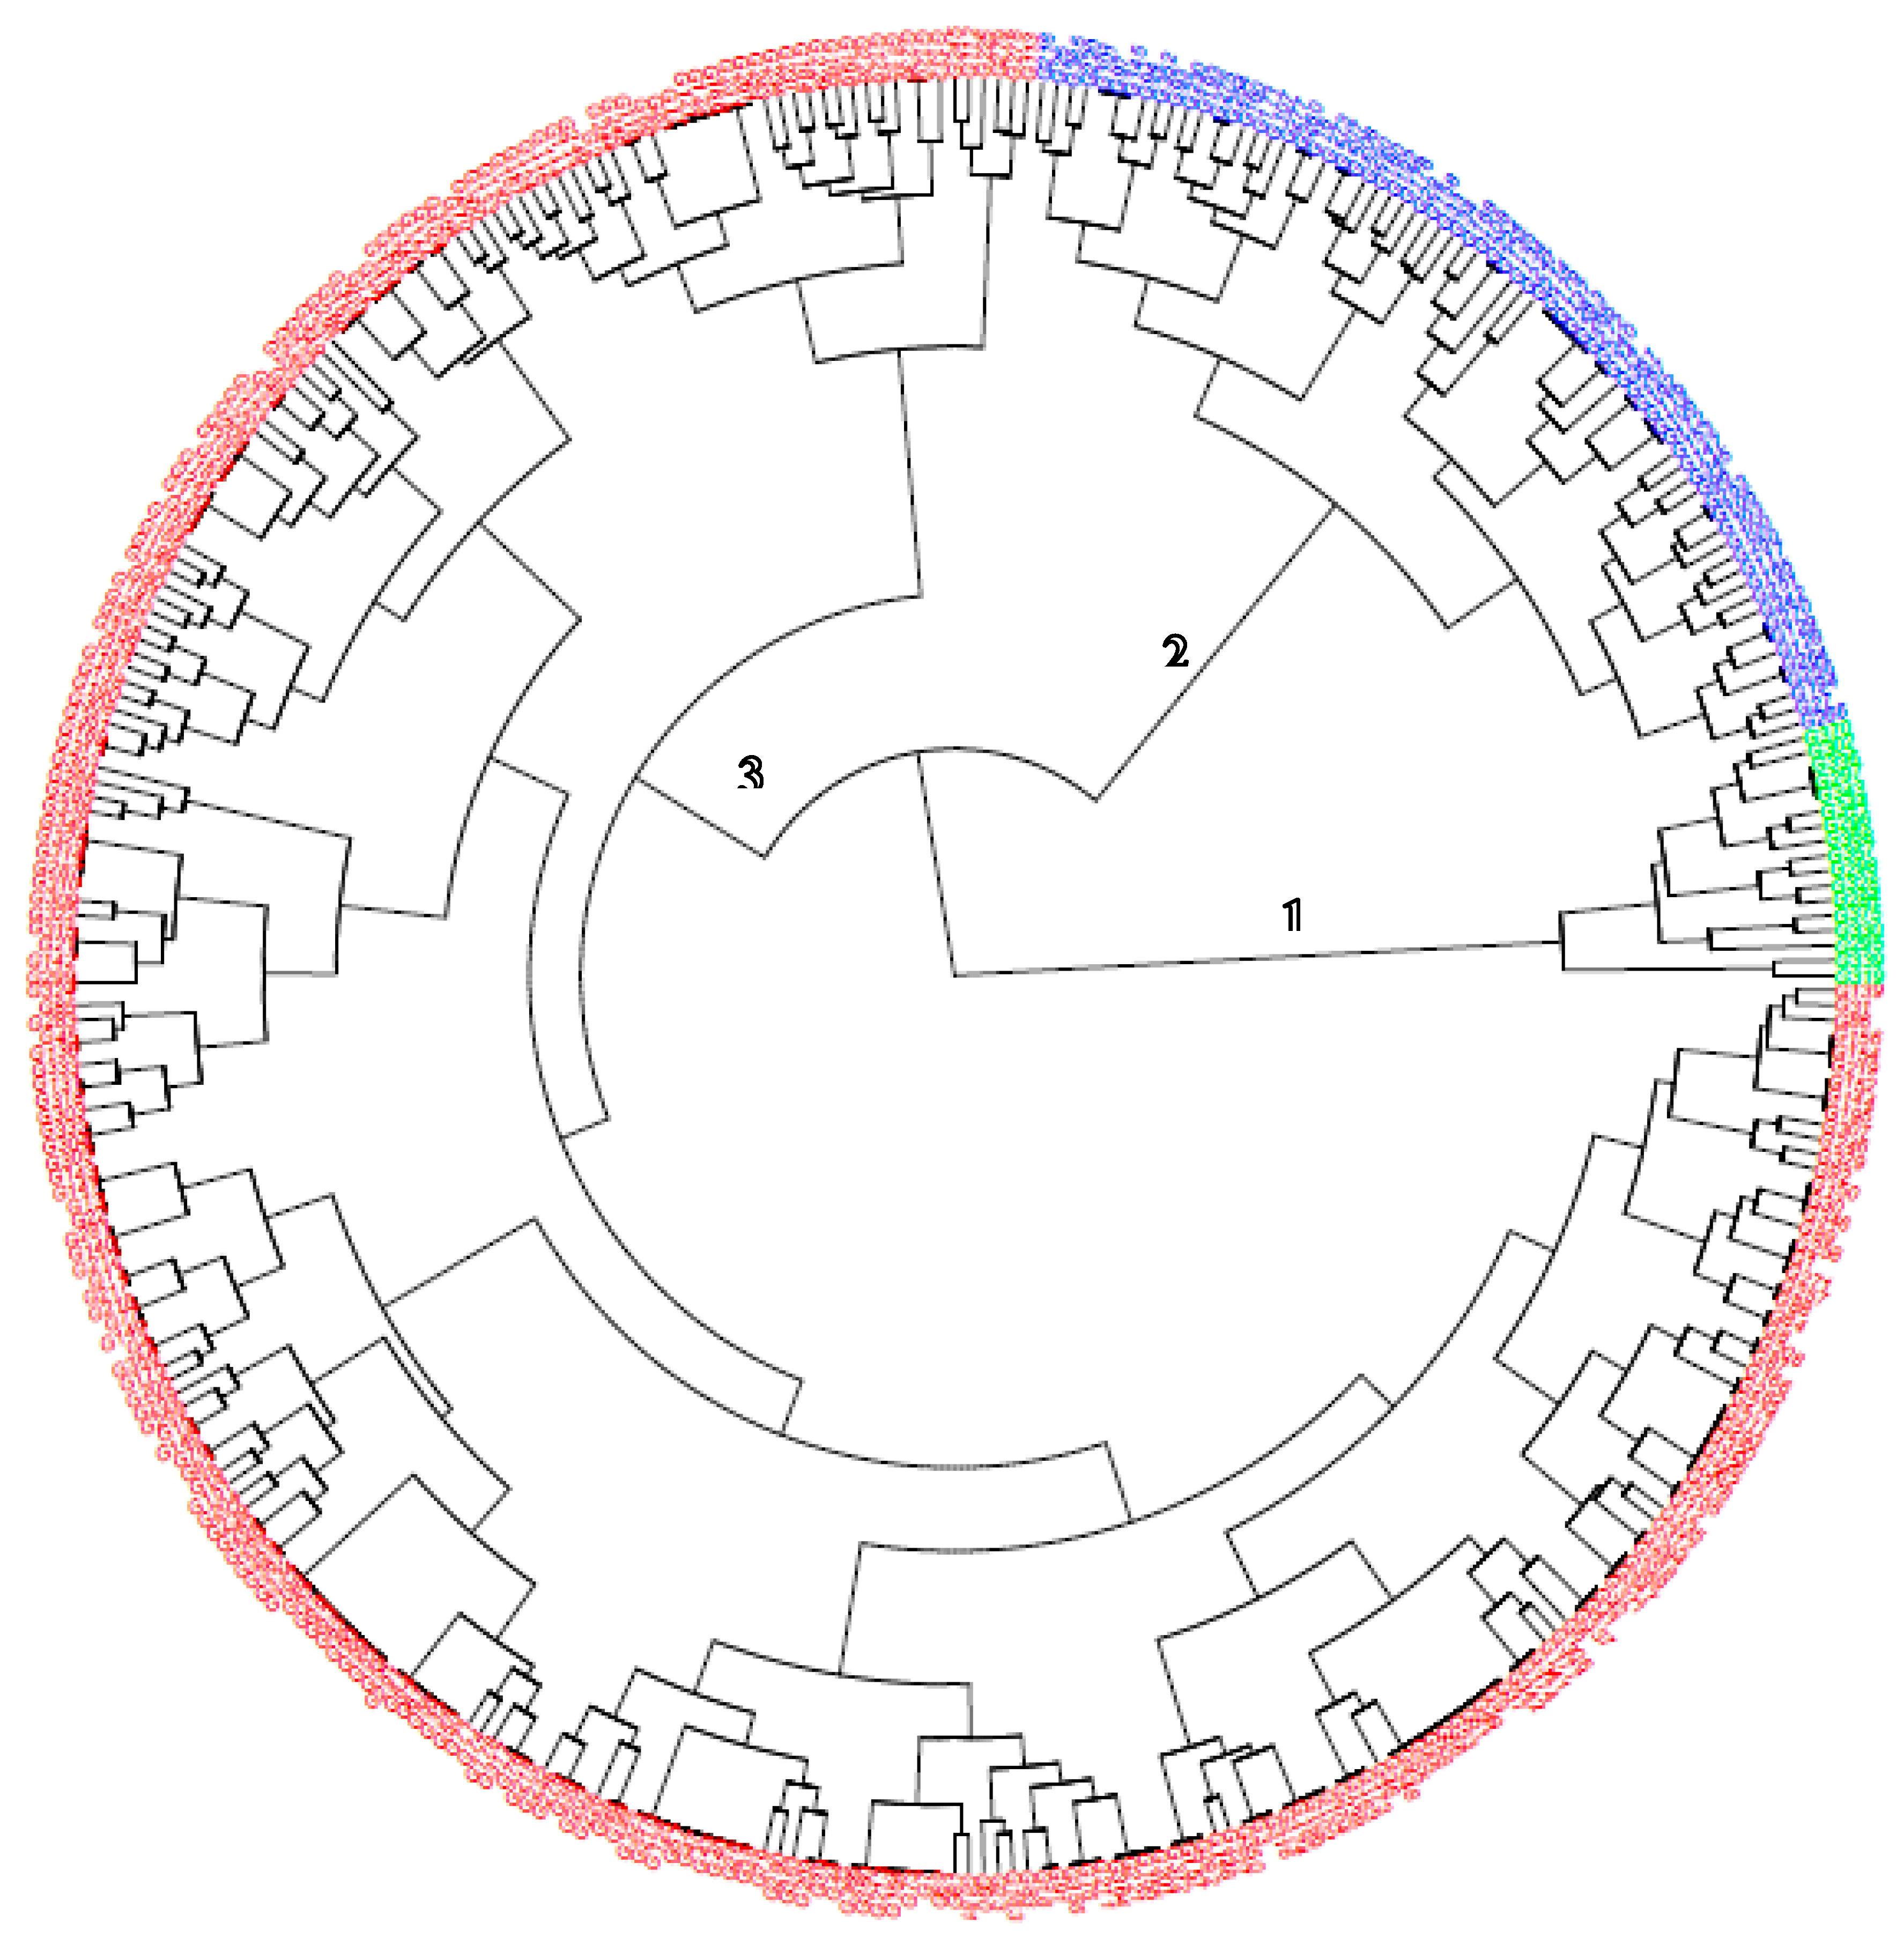

Table 1.
Markers and flanking sequences of the SNPs used for genotyping cassava genotypes in two populations.
Table 1.
Markers and flanking sequences of the SNPs used for genotyping cassava genotypes in two populations.
| Marker_allele_trait | Chr. | SNPs and Sequence |
|---|---|---|
| S1_24197219 (C/T) | 1 | GATGTAGGCATGTTACATATAAGGGCTACATACACATTAGCAGCTAAAATGAGACCCGGATACCGAGCAATGCCATCAATTGAGAGATGAACTCAGGGTG[C/T]CCTGGCCATGCAGCTCCAGTAACCAAATTTTCATGAGTGTAGCAACGATGTATTGGATCAGGTTCTAGCCATGTTGCCCCAGCCAAGACCACGTTAATCT |
| S6_20589894 (A/T) | 6 | ATTGATGATTTTTTATTCATGATATGTAGCTATCAAAGTTACTCAGCAATGTCCTTGTTTTAGCCATGCTAGCAGCATGTTTTGTTGCGACAACAGTTGG[A/G]AGTTGTATGAATATTGTTTTATCTTGTATGCAGAATATCATTGGGCAGGAAGCAGGGAAAAGCGTGATTGAGGAATATTTACGTCGTAGGGGTCACTCAG |
| S1_30543962 (A/G) | 1 | GGAGGTTTTTTTATGTGGCATTCTCAGCAGCTGCAGGAATCTCATTGTTCTTTACAATTCCAAGGCTCTTTCTTGCAATTAAAGGTGGGGAAGGTGCCCC[A/G]GACCTCTGGGGAACTGCTGGAAATGCTGCCATTAATATTGGTGGTAAATGCTTTAACCTTTCTCTGTCATATGAAGAAAATGAGTTAATTGATGTATAAT |
| S5_3387558 (C/T) | 5 | GTTACACTTAGACCCTTGTCATTAAACATTACTGAGGCTGCAGTTGAAGTGTAAACAACTCTTTTCACTGTCTTTGATTCCAAGCATGTCCTTAATATCC[C/T]TAGCAATCCATCCACGGCTATTTTGGTCACACTTTCTTCAGGTTCTTTTCCATAATGATCCATTGGGTGAGCCACATGGAAGACTCCAATACAACCTTCA |
| S8_25598183 (G/T) | 8 | TAAATTCTGACTGTCTTGGCATGACTGTCCAGGTAGTCCCCGAAAATGAGAATGCTGCTCTCTACTCCACTCATTCATTCAAGATTTTGTTCAAGGAAGG[G/T]GGTTGTGGAACCTTCATTCCGCTCTTTTTCAACTTGCTCTCTTCAGTAAGGCAATACAATCAGCAACAAACCTCTGGAATGGGGCCCCAGATGAACCCTT |
| S1_24155522 [A/C] | 1 | GACAGATGAGCTTGTTGATGGACCTAATGCTTCACACATAACGCCAACAG[A/C]TTTAGATAGGTGGGAAGCAAGGTTGGAAGATATGTTTCGAGGTCGTCCCT |
| S12_5524524 [T/C] | 12 | TGAATTATTTTAACTCTTTGATTGCTTCGCCAGTGCCTGGTCTCCAGAATGTGTGTGTTGCTTTGGTTTGTAGTTCCAAAGGTGAGCTGTGGCAATTTTA[T/C]TGCAGCCCCACTGGCATTAGACGCAGTAAATTATATCAGGACGAAGTAAGTTCATCCTTCAAAGGAAATGATAATGGTCAATTTGTGGGGAGCAAAGGTT |
| S16_773999 [A/G] | 16 | GTGAGCAACGAGCTAGGAGCAGGACATCCAAAATCAGCAGCATTTTCTGTGATAATTGTGAATCTATGCTCTTTCATTATCGCTGTWRTCGCAGCCATCRTCGTGATGATWTTGCGAGACTATCTCAGCTACGCTTTYACTGATGGTGAA[A/G]CTGTTTCCAAAGCRGTCTCCGATCTYACCCCCTWCTTGGCTGYCACCCTCATTCTAAATGGSGTGCAGCCTGTTTTGTCCGGTRAGATAATYYCCCCAACCTCCCCCCTGTTCCCTGTTATTATTAYGATTCCTTCATAGCAGTACTTTT |
| S14_6050078 [G/A] | 14 | CTCKGCAGGTATCTTACCCATAATTTTTTTTAWAAGGAAATACRGAGACTAAGATTTTCAAATATTTTATTCATATATGYCTAAYGTMTTAAAAATTGGCAAATTTATAGGAGCATTTGCAGCAATGGCAATATTCGGAAAGATGGACCA[A/G]TTACTTGCGCCTAAAGGAATTTCTATGACAATTGCGCCCTTAGGAGCTGTTTGTGCCGTCCTCTTTGCCACTCCTTCCTCYCCTGCTGCTCGGGTACCCTCCWCTGCTCYGTTTTATGGCAGTAGATAAAAATGAGAACTTTTTAACTTT |
_*Chr. = chromosome positionRESULTS.
Table 2.
Summary statistics of the nine (9) SNP markers for genetic diversity studies of the three studied populations 1 & 2 and the progenitors.
Table 2.
Summary statistics of the nine (9) SNP markers for genetic diversity studies of the three studied populations 1 & 2 and the progenitors.
| Population 1 | Population 2 | Parents of pop1 | ||||||||||
|---|---|---|---|---|---|---|---|---|---|---|---|---|
| SNP Marker | MAF | GD | He | PIC | MAF | GD | He | PIC | MAF | GD | He | PIC |
| S1_24155522 | 0.14 | 0.24 | 0.22 | 0.21 | 0.00 | 0.00 | 0.00 | 0.00 | 0.00 | 0.00 | 0.00 | 0.00 |
| S1_24197219 | 0.11 | 0.19 | 0.15 | 0.17 | 0.00 | 0.00 | 0.00 | 0.00 | 0.00 | 0.00 | 0.00 | 0.00 |
| S1_30543962 | 0.43 | 0.49 | 0.63 | 0.37 | 0.37 | 0.47 | 0.52 | 0.36 | 0.37 | 0.47 | 0.57 | 0.36 |
| S5_3387558 | 0.45 | 0.50 | 0.88 | 0.37 | 0.36 | 0.46 | 0.73 | 0.36 | 0.46 | 0.49 | 0.91 | 0.37 |
| S6_20589894 | 0.40 | 0.48 | 0.41 | 0.36 | 0.34 | 0.45 | 0.53 | 0.35 | 0.32 | 0.43 | 0.36 | 0.34 |
| S8_25598183 | 0.24 | 0.36 | 0.39 | 0.30 | 0.43 | 0.49 | 0.57 | 0.37 | 0.37 | 0.47 | 0.48 | 0.36 |
| S12_5524524 | 0.15 | 0.26 | 0.30 | 0.22 | 0.37 | 0.46 | 0.58 | 0.35 | 0.37 | 0.46 | 0.64 | 0.36 |
| S14_6050078 | 0.21 | 0.33 | 0.36 | 0.28 | 0.28 | 0.38 | 0.40 | 0.31 | 0.20 | 0.31 | 0.39 | 0.27 |
| S16_773999 | 0.29 | 0.41 | 0.37 | 0.32 | 0.41 | 0.49 | 0.42 | 0.37 | 0.50 | 0.50 | 0.48 | 0.38 |
| Mean | 0.28 | 0.36 | 0.41 | 0.29 | 0.28 | 0.36 | 0.42 | 0.27 | 0.29 | 0.35 | 0.43 | 0.27 |
MAF = Minor allele frequency; GD = Gene diversity; He = Heterozygosity; PIC = Polymorphic information content; pop = population.
Disclaimer/Publisher’s Note: The statements, opinions and data contained in all publications are solely those of the individual author(s) and contributor(s) and not of MDPI and/or the editor(s). MDPI and/or the editor(s) disclaim responsibility for any injury to people or property resulting from any ideas, methods, instructions or products referred to in the content. |
© 2025 by the authors. Licensee MDPI, Basel, Switzerland. This article is an open access article distributed under the terms and conditions of the Creative Commons Attribution (CC BY) license (http://creativecommons.org/licenses/by/4.0/).
Copyright: This open access article is published under a Creative Commons CC BY 4.0 license, which permit the free download, distribution, and reuse, provided that the author and preprint are cited in any reuse.


