Submitted:
21 April 2025
Posted:
21 April 2025
Read the latest preprint version here
Abstract
In this study, an Acid-etching surface treatment technique is proposed for treating the surface of Carbon Fiber/Epoxy Composites(CF/EP) to optimize its surface energy and chemical bonding ability for good bonding with thermoplastic resins (PA6), and consequently for high-quality resistance welding of CF/EP. It was shown that treatment of CF/EP surfaces with concentrated sulfuric acid for 45 min at 50°C significantly increased the single lap shear strength (LSS) of CF/EP welded joints to 21.47 ± 1.2 MPa, which is 163.11% ± 14% higher than that of the welded joints of untreated samples. The Acid-etching surface treatment technique proposed in this study is low-cost, simple, easy to reproduce, and combines innovation, feasibility, and economy. By analyzing the surface morphology, wettability and chemical groups of the surface-treated samples, it can be seen that Acid-etching at appropriate temperature and reasonable time can improve the surface energy of the laminate and introduce oxygen-containing chemical groups on the surface of the laminate to enhance the physical embedding and chemical bonding ability of the laminate surface.
Keywords:
surface treatment
; Thermoset Composites
; resistance welding
1. Introduction
Carbon fiber/epoxy composites (hereinafter referred to as CF/EP) has become an indispensable key material in modern industry due to its excellent mechanical properties such as light weight, high strength and high modulus. This material is used in a wide range of applications in many fields such as aerospace, high-performance automotive and military industries. For example, the proportion of CF/EP in the fuselage material of Airbus A380 aircraft reaches 22% [1], the proportion of CF/EP in the material of Boeing 787-8 aircraft is as high as 50% [2], and the amount of CF/EP in the Boeing 777 and A350XWB airplanes is 12% [3] and 53% [4], and the amount of CF/EP on the F-22, a fifth-generation fighter produced by Lockheed Martin, is 23% [5]. This speaks volumes about the centrality of CF/EP in the cutting edge of modern industry. With the increasing demand for lightweight and high-performance materials in modern industry, it is expected that the application scale and proportion of CF/EP will be further expanded in the future, becoming an important driving force for technological progress in the industry.
However, despite the significant performance advantages of CF/EP, the development of its high-quality connection technology has been the key bottleneck restricting its large-scale application. Traditional joining methods mainly include mechanical joining and adhesive bonding, but both methods have obvious defects [6]. Although mechanical connection (such as bolts or rivets) is simple and easy to use, it inevitably introduces stress concentration, which leads to localized reduction of material strength and even causes problems such as fatigue cracks. Although bonding avoids the problem of stress concentration, its process is complicated, the requirements for surface treatment are extremely high, and the bonding strength is greatly affected by environmental factors (such as temperature, humidity, etc.), and the reliability and durability are difficult to meet the requirements of top modern industrial products. Therefore, the development of an efficient and reliable CF/EP joining technology suitable for mass production has become an important problem to be solved in the field of composite materials. In recent years, the rise of composite welding technology has provided new possibilities for solving this problem, among which resistance welding has attracted much attention due to its high efficiency and controllability [7].
As a thermoset composite material, the resin matrix of CF/EP is not meltable after curing and has a smooth and chemically inert surface, which poses a great challenge to the development of welding technology . Nevertheless, CF/EP remains the most in-demand composite material in modern industry due to its technological maturity, excellent thermal and chemical stability, dimensional stability, and relatively economical production costs [8]. In recent years, research on CF/EP resistance welding has focused on two main directions: surface plasticization and surface treatment. Surface plasticization is achieved by introducing a thermoplastic layer on the CF/EP surface [9]-[10], but it is complex, technically difficult and extremely hard to reproduce, and is not sufficient to meet the high efficiency and consistency requirements of modern industrial production. Surface treatment, on the other hand, utilizes some specialized equipment to treat the surface of CF/EP in order to improve the surface properties of CF/EP and achieve high-quality resistance welding of CF/EP. Existing technologies include plasma treatment of the CF/EP surface using a plasma emitter [11], laser etching of the surface using a laser emitter [12], and mechanical grinding of the CF/EP surface using a high-precision grinding machine [13]. Surface treatment is simpler and easier to reproduce than surface plasticization, and therefore has a broader prospect of industrializability.
However, these existing surface treatment techniques are usually costly and inefficient. This is mainly due to the fact that existing surface treatment technologies rely on expensive, specialized equipment to treat materials, which not only requires long periods of specialized training to learn how to use, but also requires frequent maintenance. For example, an industrial grade laser etcher can cost tens of thousands of dollars (Universal Laser Systems PLS6.150D, priced at 40,000 USD; Universal Laser Systems, 2024) [14], and an industrial grade plasma transmitter can cost tens or even hundreds of thousands of dollars (Plasma Etch BT series, priced at 90,000 USD, Plasma Etch Inc., 2024; Anatech SCE series, priced at 125,000 USD, Anatech USA, 2023) [15]-[16], and an industrial-grade, high-precision mechanical grinder can cost hundreds of thousands of dollars (Barnes Aerospace Horizontal Material Grinders, primarily used for surface treatment of aerospace materials, priced at 200,000 to 800,000 USD, Barnes Aerospace, 2024) [17]. Therefore, due to the strict requirements of the existing surface treatment technology on equipment and the strict control of costs in the modern industrial field, it is difficult for the existing surface treatment technology to meet the requirements of modern industrial production for large-area, continuous production at controlled costs, and therefore seriously limits the further promotion and application of surface treatment technology in modern industrialized scenarios.
In order to solve the technical pain point that the existing surface treatment technology is costly and not easy to operate, this study proposes a low-cost surface treatment technology: Acid-etching surface treatment technology, i.e., the use of concentrated sulfuric acid to treat the surface of CF/EP to realize high-quality resistance welding with polyamide 6 (PA6).PA6, with its excellent mechanical properties, thermal stability, and low production cost, is an ideal companion material [18]. Specifically, the technique significantly improves the surface roughness, wettability, and chemical activity of CF/EP by etching its surface with concentrated sulfuric acid under mild conditions (45 min at 50°C), thereby enhancing the physical embedding and chemical bond strength with PA6. The experimental results showed that after the Acid-etching treatment, the single lap shear strength (LSS) of the CF/EP welded joints with PA6 increased significantly by 163.11% ± 14% to 21.47 ± 1.2 MPa from the initial value.
Compared with the existing surface treatment technologies, the Acid-etching surface treatment technology in this study has the following significant advantages:
Bulleted lists look like this:
- Low cost: The technique only requires the use of concentrated sulfuric acid as the main treatment medium, and does not require expensive additional equipment (e.g., plasma emitting equipment, high-precision mechanical grinding equipment, or laser etching equipment), which greatly reduces the cost of the treatment (the purchasing price of the industrial-grade concentrated sulfuric acid is about 57 143 USD per ton).
- Ease of operation: mild treatment conditions (50°C, 45 minutes), low equipment requirements, easy control of process parameters, and seamless integration into existing production processes.
- Scalability: Since the etching area can be freely selected, the Acid-etching technology can easily realize large-area, continuous surface treatment, which is particularly suitable for the needs of large-scale industrialized production.
The Acid-etching surface treatment technology proposed in this study is innovative, economical and feasible, and opens up a broad prospect for the industrialized application of CF/EP resistance welding. In modern industry, this technology can provide a reliable solution for efficient resistance welding of CF/EP components to meet lightweight design and high performance requirements. In summary, the Acid-etching surface treatment technology in this study solves the key difficulties of CF/EP resistance welding and provides a new idea for the industrial application of composite joining technology. This technology is expected to promote the wider application of CF/EP in modern industry and other fields, and also lays a solid foundation for the future development of high-performance composite material joining technology, which has important academic value and industrial application prospects.
2. Experimental Methods
2.1. Raw Materials
The commercially available industrial-grade concentrated sulfuric acid (hereinafter referred to as concentrated sulfuric acid) was supplied by Nanjing Chemical Reagent Co. Ltd., Nanjing, China, at a concentration of 98%.Baking soda(NaHCO) was supplied by JKChemical Reagent Co. Ltd., Beijing, China, at a concentration of 10%.The commercially available CF/EP laminate (T300) was provided by Rhyxeon General Aviation Co. Ltd., Liaoning, China. The thickness of the laminate was 2.5 mm with [0] layup. Stainless-steel metal mesh (SUS 304, wire diameter 0.15 mm, wire spacing 0.164 mm) was supplied by Jingfeng Stainless-Steel Material Co. Ltd., Guangzhou, China. The PA6 resin layer was 1 mm thick and was supplied by Intamsys Co. Ltd., China. In order to match the standard size of the laminate and to facilitate electrode clamping, the stainless-steel metal mesh was cut to length × width of 25.4 mm × 70 mm. To match the standard size of the laminate and the size of the metal mesh, the PA6 was cut to length × width of 25.4 mm × 25.4 mm.
2.2. Material Preparation
The experimental composite laminates were cut to a length × width × thickness of 101.6 mm × 25.4 mm × 3 mm according to the standard dimensions in the ASTM D5868 regulations. To match the dimensions of the resistance welding fixture, the stainless-steel metal mesh was cut to a length × width of 25.4 mm × 70 mm. For the present study, a PA6 was used as the resistance welding filler material, cut to a length × width of 25.4 mm × 25.4 mm. The above materials were ultrasonically cleaned twice with anhydrous ethanol for 20 min each time, and then dried in an oven at 60 °C for 6 h. The materials were then dried for 6 h at 60 °C.
2.3. Material Preparation
In this study, a self-built resistance welding platform, as shown in Figure 1(a), was used for resistance welding. To provide a sufficient amount of resin to the welding area during welding, two pieces of PA6 with the dimensions of 25.4 mm × 25.4 mm were placed on the upper and lower sides of a stainless-steel metal mesh (dimensions: 25.4 mm × 70 mm) to form a sandwich structure. This sandwich structure is called the heating element, and the PA6 serves as the resin layer of the heating element. The heating element was placed between the welding areas of two standard-sized laminates to form a pre-welded part. The pre-welded part was placed onto the insulated platform of the self-built resistance welding platform (as shown in Figure 1(a)) and pressurized using a hand-held pressure regulator. After fixation, copper electrodes were clamped on both sides of the metal mesh, and the power supply was activated to perform resistance welding; the welding process is illustrated in Figure 1(b). Upon completion, the welded part was obtained and tested on a universal testing machine to determine its single lap shear strength (LSS).
ASTM D5868 is a reference standard used to evaluate the LSS mechanical properties of various welded joints [19]. Resistance welded parts were tested in tension using an INSTRON Series 5980 Universal Testing Machine (UK) with a maximum load of 75 kN. The LSS of welded joints were measured three times for each set of welded parts, and the average value was recorded as the final result. The LSS was calculated based on the following relationship:
where T denotes the shear strength, L is the overlap length, b is the lap width, and Fmax is the maximum tensile force.
In this study, MP-41 transmission reflectance polarizing microscope and ZEISS Sigma-300 field emission scanning electron microscope were used to observe the micro-morphological changes of CF/EP surface before and after Acid-etching, and Thermo Scientific ESCALAB Xi+ X-ray photoelectron spectroscopy was used to analyze the changes in chemical element content and acid-groups content of CF/EP surface before and after Acid-etching. The changes in chemical element content and chemical groups content of CF/EP surface before and after Acid-etching were analyzed using Thermo Scientific ESCALAB Xi+ X-ray photoelectron spectroscopy, and the changes in wettability of CF/EP surface before and after Acid-etching were analyzed using Dataphysics OCA-20 optical interface analyzer.
2.4. Determine the Resistance Welding Process Parameters
The resistance welding parameters consist of Welding Power, Welding Time, and Welding Pressure, which directly determine the welding quality [20]. Welding Power and Welding Time determine the heat generation of the heating element, while Welding Pressure determines the degree of contact at the welding surface. Excessively high or low heat generation (e.g., too high Welding Power and too long Welding Time or too low Welding Power and too short Welding Time) will lead to ablation damage of the resin layer in the heating element or incomplete melting. Similarly, excessive or insufficient Welding Pressure may extrude molten resin out of the weld zone and damage the laminate, or result in poor resin-laminate contact. Therefore, optimized welding parameters combination provide appropriate heat and pressure to ensure the thermoplastic resin flows adequately without overheating or decomposition, thereby forming a strong bond with the laminate surface.
In this study, orthogonal experiments and Taguchi’s method were used to determine the optimum combination of parameters. First, considering that edge effects [21] can make the heat distribution in the welding area uneven, a K-type thermal probe was buried directly into the weld area at three different points to detect the average heat generation in the weld area during resistance welding. Different welding powers and corresponding welding times were recorded when the average temperature of the welded area reached 220°C (melting temperature of PA6), so as to preliminarily determine the appropriate welding power and welding time parameter intervals, and the temperature measurement method is shown in Figure 2, and the results of the temperature measurement are shown in Table 1. During this period, according to the relevant research on CF/EP resistance welding [22], the welding pressure was initially set to 0.8MPa.
Based on the temperature measurements shown in Table 1 and taking into account the time cost, the welding power and welding time parameter intervals were set and the welding pressure parameter intervals were set according to the relevant CF/EP resistance welding research. The welding parameter intervals are shown in Table 2.
The Taguchi method involves three stages: experimental design, signal-to-noise (S/N) analysis and optimization. In the experimental design phase, a set of control input parameters for an orthogonal experimental system is designed and the corresponding outputs are observed. The signal-to-noise analysis phase involves calculating the ratio of the signal representing each experiment (the desired output) relative to the noise (the undesirable output), a process that determines which input parameters produce the most desirable output.The Taguchi method is a powerful tool for improving the quality and reliability of products and processes, and it has been adopted by a wide range of industries, including manufacturing, engineering, and quality control. [23] Based on the resistance welding parameter intervals listed in Table 2, an L9 orthogonal experiment was designed as shown in Table 3 to measure the weld quality based on the S/N of the welded joint LSS.
The larger the LSS of the CF/Epoxy composite resistance welding joint, the better the quality of the weld, so the signal-to-noise ratio is used to look forward to the large formula.
Where S/N is the quality characteristic of the sample joint; X is the LSS (MPa) of the ith sample joint; the number of repetitions is expressed by n, and 3 sets of repetitive samples are taken in this experiment (n=3).
According to the main effect plot of process parameters in Figure 3, we can determine the optimal combination of resistance welding parameters as: welding pressure 0.8 MPa, welding power 330 W, welding time 30 s. These parameters correspond to the maximum signal-to-noise ratio of each factor. The CF/Epoxy composite resistance weld joint obtained with this optimum process parameters is 8.16 ± 0.81 MPa.
3. Acid-Etching Surface Treatment and Characterization of Mechanical Property of Treated Welded Joint
In order to realize Acid-etching surface treatment in specific surface areas, an Acid-etching method was designed for the laminates: A 25.4 mm × 25.4 mm area was reserved as the etching area at one end of a standard-size laminate, and a 30 mm wide, 0.6 mm thick PTFE tape was placed to cover the rest of the laminate. An acid corrosion-resistant pipette was used to drop 0.5–1 mL of 98% concentrated sulfuric acid into the etching area. The excess acid is gently scraped off with a Teflon spatula and the sample is placed in an oven at a certain temperature for 30 minutes to control the degree of etching.Use four different ovens and set their temperatures to 25°C, 50°C, 75°C and 100°C. The degree of etching was adjusted by placing the sample with acid into these different temperature ovens for 30 min. After etching, the samples were removed from the oven, the PTFE tapes were removed, and the etching area was rinsed with a slow water stream for 30 s to dilute residual acid. Baking soda (NaHCO) at 10% concentration was prepared as a neutralizing solution, and the samples were immersed to completely remove residual acid. During neutralization, the samples were removed every 1 min to test the pH of the etched area using pH paper until neutrality. The fully neutralized samples were rinsed with purified water and dried in an oven for 30 min. Finally, a set of etched laminate samples with fixed etching time and variable temperature (hereafter referred to as the Temperature-variable experimental groups) was obtained. The Acid-etching method is shown in Figure 4(a).
As observed in Figure 4(b), when the etching time was fixed at 30 min, the etched area remained within the target 25.4 mm × 25.4 mm at lower temperatures (e.g., 25 °C). However, at 75 °C and above, the etched area expanded beyond the target region due to accelerated acid activity and PTFE tape deformation under heat, allowing the concentrated sulfuric acid seepage.
By etching the laminate surface with concentrated sulfuric acid at 25 °C for 30 min (hereafter referred to as 25 °C/30 min), the epoxy was partially removed from the etched area, but fiber clarity was low. Acid-etching at 50 °C for 30 min (hereinafter referred to as 50 °C/30 min) resulted in a stable fiber structure in the surface layer and improved fiber clarity compared to the previous groups. Acid-etching at 75 °C for 30 min (hereinafter referred to as 75 °C/30 min), the fiber clarity in the etched area was further improved, but the fibers at the edges showed loosening and visible burrs. Acid-etching at 100 °C for 30 min (hereinafter referred to as 100 °C/30 min) caused structural damage to the surface fibers, characterized by mutual debonding and abnormally loose bare fibers, indicating the delamination damage of the laminate.
Resistance welding of the samples with etching temperature as a variable at the optimum combination of parameters (Welding Power:330 W, Welding Time: 30 sec, Welding Pressure: 0.8 MPa) yielded different weldments. The LSS of these weldments were tested using an electronic universal test system.
As shown in Figs. Figure 4(d) and (e), the LSS data plots demonstrate the performance of welded joints under different Acid-etching parameters, along with the corresponding percentage increases.From Figs. Figure 4(d) and (e), the highest-quality welded joints were achieved with the 50 °C/30 min etching condition, yielding an LSS of 19.97 ± 1.03 MPa—an increase of 144.73% ± 13% compared to untreated parts.
Since the effect of concentrated sulfuric Acid-etching on the surface of CF/EP laminates is not only related to the etching temperature, but also related to the etching time. Therefore, in order to explore the effect of etching time on Acid-etching, four ovens were also set up, and their etching temperatures were fixed at 50 ℃, but their heating times were adjusted to 15 min, 30 min, 45 min and 60 min. In order to prevent other variables from affecting the experimental results, the rest of the experimental steps and experimental details were kept unchanged in line with those of the Temperature-variable experimental group. Finally, the etched laminate samples with fixed etching temperature and variable etching time (hereinafter referred to as the Time-variable experimental group) were obtained, as shown in Figure 4(c).
From Figure 4(c), further extension of the etching time did not lead to the expansion of the etched area when the etching temperature was fixed at 50 °C. Only when the etching time was elevated to 45 min and above, the etched area expanded to some areas along the edge of the laminate. In general, the effect of chemical reaction temperature on the chemical reaction rate follows the Arrhenius equation [24], i.e., the reaction rate shows a near-exponential increase with increasing temperature. However, the effect of chemical reaction time on chemical reaction rate tends to be linear, which means that an increase in chemical reaction time tends to have a more moderate effect on chemical reaction rate. Thus the phenomenon of acid seepage and the reaction rate of pickling as well as the warping effect of PTFE tape were milder in longer etching treatments.
Further observations showed that when the laminate surface was acid etched at 50 °C for 15 minutes (hereinafter referred to as 50 °C/15 minutes), the fiber definition in the etched area was low and a partial distribution of epoxy resin was still visible on the fibers. When the laminate surface was acid etched at 50 °C for 45 minutes (hereinafter referred to as 50 °C/45 minutes), the clarity of the etched fibers improved and a white powder covering of the surface could be observed. When the laminate surface was acid etched at 50 °C for 60 minutes (hereinafter referred to as 50 °C/60 minutes), the white coverage of the etched areas became faded and some of the fiber edges showed bumps and burrs.
Resistance welding of the samples with etching time as a variable at the optimum combination of parameters (Welding Power:330 W, Welding Time: 30 s, Welding Pressure: 0.8 MPa) yielded different weldments. The LSS of these weldments were tested using an electronic universal test system.As can be seen from Figs. Figure 4(f) and (g), the optimum Acid-etching time for resistance welding of 50 °C chemically etched treated laminates under the optimum resistance welding process parameters is 45 min, which resulted in an LSS of 21.47 ± 1.2 MPa, with an increase of 161% ± 14% compared to the untreated parts.
In this research, the optimum Acid-etching parameter for CF/EP surface treatment is 50 °C/45 min. The obtained LSS of the welded joints of the treated laminate was 21.47 ± 1.21 MPa, which increased by 163.11% ± 14% compared to the untreated parts.
4. Effect of Acid-Etching on the Physical Properties of Laminate Surfaces
4.1. Temperature-Variable Experimental Groups Micro Morphology and Roughness Analysis
The CF/EP samples were cut into 10 mm × 10 mm × 3 mm blocks using a miniature table saw. Acid-etching surface treatments with controlled etching time and adjusted etching temperature were performed as previously described to obtain block samples for the Temperature-variable experimental group. The etched surface morphology was observed by FE-SEM with a magnification of 40 , and the results and the corresponding etching mechanism are shown in Figure 5.
For the Temperature-variable experimental groups samples, when the etching condition is 25 °C/30 min, as seen in Figure 5(b), part of the epoxy resin on the laminate surface is removed by the etching of concentrated sulfuric acid, but the degree of etching is shallow, the groove structure of the laminate surface is not obvious, the roughness is low, and there are fewer anchorage sites available for the bonding of the molten PA6. When the etching condition is 50 °C/30 min, as seen in Figure 5(c), with the increase of the etching temperature, the groove structure of the laminate surface is deepened, the surface roughness is increased, and the fiber structure is clearly visible, which provides more anchoring and bonding sites for the molten PA6, and may also improve the wettability of the surface. When the etching condition is 75 °C/30 min, as seen in Figure 5(d), with the further increase of the etching temperature, the surface epoxy resin of the laminate is almost completely removed and the surface fibers are exposed. Observation of the fiber single bundle morphology shows that only some tiny epoxy resin debris remains on the surface fibers, which leads to a decrease in the surface roughness of the laminate. However, thanks to the sparse surface structure of the laminate at this time, its surface wettability may be improved [25]. When the etching condition is 100 °C/30 min, as seen in Figure 5(e), the surface fibers are not only separated in-plane, but also bulged and stabbed out in the vertical direction. From the observation of the morphology of single fibers, it can be seen that the surface fibers have almost no visible epoxy residue, which can be regarded as a pure fiber. Obviously, this is caused by the excessively fast chemical reaction rate. On the one hand, due to the accelerated etching effect of the acid, the surface epoxy layer was removed by wider and deeper etching, resulting in the removal of the epoxy debris remaining on the surface fibers as well, making the surface fibers appear excessively smooth. On the other hand, as the etching effect of the acid in the surface reaches saturation prematurely, it penetrates into the deeper structure of the laminate to further etch the epoxy structure of the lower layer, which directly leads to the delamination defects of the laminate and the vertical bulging of the surface fibers. It is worth mentioning that since the laminate at this point is not only sparsely structured in the surface layer, but also the upper and lower layers are separated from each other, it is favorable for the liquid to spread out and penetrate downwardly within the layer, and it is likely to further enhance the surface wettability of the laminate surface.
In summary, it is obvious that under the premise of fixed etching time, the increase of etching temperature can greatly accelerate the Acid-etching reaction rate and remove more epoxy resin in a deeper and wider range. The reaction mechanism of chemically etching the laminate surface is shown in Figure 5(f), from which it can be seen that the Acid-etching rate changes rapidly with the increase of the etching temperature, resulting in a large gap between the surface micro-morphology and roughness of the laminates surface that treated with different Acid-etching temperatures at a fixed etching time.
4.2. Time-Variable Experimental Groups Micro Morphology and Roughness Analysis
The CF/EP samples were cut into 10 mm × 10 mm × 3 mm blocks using a miniature table saw. Acid-etching surface treatments with controlled etching temperature and adjusted etching time were performed as previously described to obtain block samples for the Time-variable experimental group. The etched surface morphology was observed by FE-SEM with a magnification of 40 , and the results and the corresponding etching mechanism are shown in Figure 6.
For the Time-variable experimental groups, when the etching condition was 50 °C/15 min, as seen in Figure 6(b), the surface of the laminate showed obvious groove structures due to Acid-etching. Observation of the fiber bundles shows that the fiber clarity at this etching stage is significantly higher than that at 25 °C/30 min, which makes the roughness of the laminate surface at this time higher than the 25 °C/30 min experimental group. This will not only increase the anchoring and bonding sites of PA6 in the laminate surface, but also may enhance the wettability of the laminate surface. The microscopic morphology of the laminate surface when the etching condition is 50 °C/30 min has been described in the previous section, so it will not be repeated. When the etching condition is 50 °C/45 min, the epoxy resin on the surface of the fiber bundles and between the bundles is fractured and detached by further etching, forming a large number of large-grained debris, as seen in Figure 6(d). From a macroscopic point of view, these large particles are dispersed over the entire laminate surface, which explains why, in the previous section, when the etched area of the laminate was observed with the naked eye, it was found to be covered by a layer of white powder at this etching stage. From a microscopic viewpoint, the epoxy resin on the fiber bundles was etched into large irregularly shaped chips, which further enhanced the roughness of the laminate surface layer, and may also further improve the wettability of the laminate surface layer. When the etching condition was 50 °C/60 min, as seen in Figure 6(e), the epoxy resin on the surface fibers was shrunken and thinned due to long-time etching, and became short filamentary or long thread-like epoxy resin entangled in the surface layer of the fiber bundles and the inter-bundle. Observation of the single fiber bundle shows that the epoxy resin on the fiber bundle is further removed by etching at this time, and only some sporadic epoxy particles remain, which makes the surface roughness of the laminate reduced compared with the previous groups. However, thanks to the removal of the residual epoxy resin on the surface layer, the gap between the fiber bundles on the surface layer is enlarged, and the structure is more sparse, which may lead to a better material surface layer wettability compared with the previous groups.
In summary, when the etching temperature is constant, the extension of etching time can enhance the reaction rate of Acid-etching more gently, indicating that the reaction rate of the Acid-etching reaction is more insensitive to the change of etching time, and thus the etching effect can be fine-tuned by adjusting the etching time. The mechanism of the effect of Acid-etching on the surface roughness and microstructure of the laminate with etching time as a variable is shown in Figure 6(f), from which it can be seen that the epoxy removal degree of the laminate surface changes gradually with the extension of etching time.
4.3. Surface Wettability Analysis
In order to verify the conjecture of different etching stages on the wettability of the laminate surface, the CF/EP samples were cut into 10 mm × 10 mm × 3 mm block samples using a miniature table saw.The surface of the laminate was then acid etched according to the treatments and processes described in the previous section and block samples were obtained after treatment. Using deionized water as the liquid to be tested, droplets were placed at two different points on the laminate surface and the average value of the final static contact angle of the droplets was recorded using a Dataphysics OCA-20 Optical Interface Analyzer and the results are shown in Figure 7. For the same material, the smaller the static contact angle between the surface and deionized water, the better the hydrophilicity of the surface [26].
As shown in Figure 7(a), for the untreated laminate surface, the average static contact angle of deionized water droplets on it is 109.55° ± 1.25°, indicating that the laminate surface is a typical hydrophobic surface at this point. For the experimental group with variable temperature, as shown in Figure 7(b), after the surface Acid-etching treatment, the average contact angle on the laminate surface decreases rapidly as the etching temperature increases. This indicates that the hydrophilicity of the laminate surface increases rapidly with increasing etching temperature at a fixed etching time. As can be seen in Figure 7(b), after surface treatment, the average contact angle of the Temperature-variable experimental group decreased to = 81° ± 2.9°; = 44.15° ± 3.95°; = 19.4° ± 5.85°; and = 0°, respectively. Based on the relationship between the static contact angle and the hydrophilicity of a material, a material surface can be called superhydrophilic if a water droplet does not stabilize on the surface after contacting it, but spreads rapidly so that the final static contact angle is close to or reaches 0° [27]. This confirms the previous conjecture, indicating that the increase in etching temperature rapidly enhances the hydrophilicity of the laminate surface and ultimately leads to complete wetting of the water droplets on the surface.
For the Time-variable experimental group, the trends of the mean static contact angle on the laminate surface after surface etching treatment are similar to those of the Temperature-variable experimental group, both showing a decreasing trend. As can be seen in Figure 7(c), the average contact angle values of the Time-variable experimental group decreased to = 72.35° ± 0.8°; = 44.15° ± 3.95°; = 38.2° ± 3.55°; = 25.25° ± 1.83°, respectively, after the surface etching treatment. This result also verifies the corresponding conjecture in the previous section, indicating that the wettability of the material surface layer improves as the etching time increases. However, it is worth mentioning that the trend of the mean value of the static contact angle of the surface of the material with the increase of etching time shows that the effect of the increase of etching time on the improvement of the wettability of the surface of the laminate is relatively flat under the premise of controlling the etching temperature unchanged, and the mean value of the static contact angle of the surface of the processed laminate decreases by at most about 43% even if the etching time is doubled.
5. Effect of Acid-Etching on the Surface Chemistry of Laminates
5.1. Surface Chemical Element Content Analysis
X-ray Photoelectron Spectroscopy (XPS) is a method of using an electron spectrometer to measure the energy distribution of photoelectrons and electrons emitted from the surface of a sample when irradiated with X-ray photons. The principle of XPS is to irradiate a sample with X-rays, which results in the stimulated emission of electrons or valence electrons from the inner layers of atoms or molecules [28]. XPS can be used for qualitative or semi-quantitative analysis, generally through the peak position or shape of the XPS spectrum to obtain the distribution of chemical elements and groups on the material surface, and through the peak intensity to determine elemental content and concentration.
The XPS scans of elemental content on the laminate surface before and after Acid-etching treatment were divided into two groups: the Temperature-variable experimental groups and the Time-variable experimental groups. The results are shown in Figure 8.
For the Temperature-variable experimental groups, it can be observed from Figs. Figure 8(b) and (c) that when the fixed etching time is 30 min, the changes of C, N, and O elemental percentages on the laminate surface are as follows: the percentage of C elemental content decreases, then rises and then decreases again, the change of the percentage of O elemental content is exactly opposite to the change of the percentage of C elemental content, and the percentage of N elemental content decreases all the time. Since the N element content on the laminate surface is relatively small, the percentage of O element content and the percentage of C element content can almost be regarded as being affected only by the change of each other’s content. The mechanism of the effect of Acid-etching on the O element content of the laminate surface is complicated, On the one hand, since concentrated sulfuric acid is a strong oxidizing agent, some O elements are introduced to the laminate surface during the Acid-etching process. However, at the same time, the epoxy resin in the laminate surface itself contains O elements, so that the removal of the epoxy resin during the Acid-etching process also means that some O elements are lost. Therefore when the Acid-etching reaction occurs mainly between concentrated sulfuric acid and epoxy resin, the change in the percentage content of O elements on the surface of the laminate is actually determined by the race between the content of O elements introduced by the Acid-etching reaction and the content of O elements taken away by the Acid-etching reaction. As can be seen from Figs. Figure 8(b) and (c), when the etching temperature is lower than 50 °C, the O elements introduced by the Acid-etching reaction are more than those taken away by the Acid-etching reaction, so the percentage content of O elements on the laminate surface rises. However, as the etching temperature was further increased, the etching speed was accelerated, resulting in more epoxy being removed in the same etching time. At the same time, the excessively fast etching rate also leads to a rapid decrease in the number of reaction sites available for reaction on the laminate surface and premature saturation of the oxidation reaction, resulting in a decrease in the amount of introduced O elements. As a result, the percentage content of O elements decreases when the etching temperature is increased from 50 °C to 75 °C. However, as the etching temperature continued to increase, the etching rate continued to accelerate, resulting in the Acid-etching reaction prematurely removing a large portion of the epoxy resin from the surface of the laminate, so that the Acid-etching reaction changed from a reaction between the concentrated sulfuric acid and the epoxy resin to a reaction between the concentrated sulfuric acid and the carbon fibers at a certain point in time.Since concentrated sulfuric acid is a strong oxidizing agent, it will introduce some O elements when treating carbon fibers and cause them to adhere to the surface of the carbon fibers, so the percentage of O elements increases when the etching temperature is increased from 75 °C to 100 °C. For the N element, it comes from the amine curing agent added during the curing process of the epoxy resin. Since Acid-etching does not introduce elemental N to the surface of the laminate, it gradually decreases with the decomposition of the epoxy resin, as shown in Figure 8(c).
For the Time-variable experimental group, it can be seen from Figs. Figure 8(d) and (e) that when the etching temperature is fixed at 50 °C, the percentage changes of C, N and O elements on the laminate surface with the extension of etching time are as follows: the percentage of O elements increases and then decreases, the percentage change of C elements is in the opposite direction, and the N element decreases with the extension of etching time. The analysis of the percentage change of O element content shows that with the extension of etching time, O element slowly enters the laminate surface through oxidation reaction and reaches saturation at 45 min etching time. At this time, since the oxidation reaction is saturated and the Acid-etching reaction is not saturated, the Acid-etching reaction will continue to remove the epoxy resin, so that the content of the introduced O elements is gradually less than the content of the removed O elements, resulting in a decrease in the percentage of O elements when the etching time is extended from 45 min to 60 min. It is worth noting that, as can be seen in Figure 8(d), the percentage change in O and C element content not only has a simpler trend, but also a smoother change compared to the Temperature-variable group. This suggests that the Acid-etching reaction rate is more sensitive to the etching temperature than to the etching time for similar amounts of variation, and also implies that the chemical elements introduced can be more finely tuned by adjusting the etching time with a fixed etching temperature.
5.2. Surface Chemical Groups Content Analysis
To further investigate the percentage content of chemical groups on the surface of the laminates in the Temperature-variable experimental groups, Advantage V5.9922 analytical software was used to fit the high-resolution C 1s peaks on the surface of the as-is and chemically-etched-treated composite laminates to the full-spectrum charge-corrected peak at 284.6 eV, resulting in Figure 9. Figure 9(a) shows that the chemical groups on the surface of the laminate changed after Acid-etching, and the relative concentration of the fitted chemical groups is shown in Figure 9(b).
From Figure 9(a), it can be observed that C 1s has three peaks, which are C–C (284.8 eV), C–O (286 eV), and C=O (288.5 eV). At a fixed etching time(30 min), the relative content of C–C groups on the laminate surface decreases, then increases and then decreases again with the increase of etching temperature, whereas the opposite is true for C–O and C=O groups, where the content increases, then decreases and then increases again. This indicates that when the etching temperature is low, the strong oxidizing property of concentrated sulfuric acid will accelerate the breakage of C–C bond in the epoxy resin with the increase of etching temperature, so that a part of C–C groups is converted into C–O groups and C=O groups due to Acid-etching and oxidizing [29], which makes the content of this kind of oxygen-containing functional groups reach the peak value when the etching temperature is 50 °C. The presence of these oxygen-containing functional groups enhances the surface energy of the laminate and improves the bonding strength between the laminate surface and the PA6 resin.
When the etching temperature is raised to 75 °C and above, it is clear from the observation of the micro-morphology of the laminate surface under the corresponding etching conditions in the previous section that the epoxy resin on the laminate surface is almost completely removed at this stage, so the Acid-etching will be mainly converted from the etching of the epoxy resin by the concentrated sulfuric acid to the etching of the carbon fibers by the concentrated sulfuric acid. As the graphite layer in the carbon fiber will break the bond under acidic conditions, the local carbon atoms will combine with oxygen atoms and form more C–O groups and C=O groups [30]. Therefore, as seen in Figure 9(b), the percentage content of C–O groups and C=O groups decreases when the etching temperature is increased from 50 °C to 75 °C, but increases again when the etching temperature is increased from 75 °C to 100 °C.
Similarly, in order to further investigate the percentage content of chemical groups on the surface of the laminates in the Time-variable experimental groups, Advantage V5.9922 analysis software was used to fit the high-resolution C 1s peaks on the surface of as-is and chemically etched-treated composite laminates to the full-spectrum charge-corrected with C 1s at 284.6 eV as the reference peak to get Figure 11 . Figure 11(a) shows that the surface chemical matrix content of the laminates after the Acid-etching was performed the surface chemical groups changed, and the relative concentration of chemical groups is shown in Figure 11(b).
From Figure 10(a), it is also observed that C 1s has three peaks: C–C (284.8 eV), C–O (286 eV), and C=O (288.5 eV). At a fixed etching temperature(50 °C), the relative percentage content of C–C groups on the laminate surface decreases and then increases with the etching time, while the relative percentage content of C–O and C=O groups decreases and then increases. As can be seen from the previous micro-morphological observations of the laminate surface under the corresponding etching conditions, for the time-variant experimental groups, except for the 50 °C/60 min experimental group, the degree of carbon fiber exposure of the laminate surface under each etching condition is not high, and thus the Acid-etching is mainly an etching reaction between the concentrated sulfuric acid and the epoxy resin. As can be seen from Figure 10(b), except for the 50 °C/60 min experimental group and the untreated groups, the percentages of C–C groups are close to each other in the three experimental groups, but the percentages of C–O groups and C=O groups are different from each other.
In the 50 °C/15 min and 50 °C/30 min experimental group, the C=O content of the 50 °C/15 min experimental group was 36.4% of that of the 50 °C/30 min experimental group, while the C–O content was 90% of that of the 50 °C/30 min experimental group. It indicates that the 50 °C/15 min experimental group is inferior to the 50 °C/30 min experimental group in terms of the percentage content of different oxygen-containing functional groups. Therefore, the 50 °C/30 min experimental group is superior to the 50 °C/15 min experimental group in terms of surface chemical bonding ability. However, for the 50 °C/30 min and 50 °C/45 min experimental group, the contents of different oxygen-containing functional groups are better or worse than each other; the content of C=O groups in the 50 °C/30 min experimental group is 57.8% of that in the 50 °C/45 min experimental group, and the content of C–O groups is 127% of that in the 50 °C/45 min experimental group. In general, C=O bonds are very polar, while C–O bonds (e.g., ether bonds or alcohol hydroxyl groups) are also somewhat polar, but less polar than C=O bonds. This is due to the fact that the oxygen atom in the C=O group carries part of the , and the carbonyl atom carries part of the [31]. For example, the lone pair of electrons on the oxygen atom of the carbonyl group can form strong hydrogen bonds with the hydrogen atom in PA6, while the of the carbonyl group can have dipole-dipole interactions with the of PA6. These interactions are exothermic processes that release energy and favor PA6 adsorption and spreading on the material surface.While the oxygen atoms in the C–O bond can also form hydrogen bonds with PA6, the hydrogen bond strength is weaker than that formed between C=O and PA6, and the dipole-dipole interactions between C–O and PA6 are also weaker than those between C=O and PA6. Therefore, in terms of surface chemical bonding capacity, the 50 °C/45 min experimental group, which contains more C=O groups (42.2% more content than the 50 °C/30 min experimental group) and only contains slightly less C–O groups (27% less content than the 50 °C/30 min experimental group), is clearly superior.
5.3. Summary of the Effect of Acid-Etching on the Laminate Surface
From the previous analysis, it can be seen that among all experimental groups, the 50 °C/45 min experimental group has a significant advantage in surface roughness and surface active groups content under the premise that the laminate itself is structurally stable and no internal damage has occurred. In terms of surface wettability, the 75 °C/30 min experimental group, the 100 °C/30 min experimental group and the 50 °C/60 min experimental group were superior to the 50 °C/45 min experimental group. However, the surface structure of the 75 °C/30 min experimental group was unstable, and the fibers in the surface showed a tendency to separate from each other, and the content of active groups was low, and the roughness was poor. For the 100 °C/30 min experimental group, the internal delamination damage has occurred, the body structure is extremely unstable, and the surface roughness is low, and the active groups content on the surface is insufficient. For the 50 °C/60 min experimental group, its ontological structure is more stable than that of the 75 °C/30 min and 100 °C/30 min experimental group, but it is inferior to that of the 50 °C/45 min experimental group in terms of the surface roughness and the content of surface active groups. Therefore, in summary, the Acid-etching parameter of 50 °C/45 min is the best Acid-etching surface treatment parameter based on this study. Surface treatment of laminates under this Acid-etching parameter can not only improve the physical embedding ability and chemical bonding ability of the laminate surface layer at the same time, but also maximize the wettability of the laminate surface layer without causing the structural instability of the laminate surface layer and destroying the internal structure of the laminate.
6. Quality Analysis of Welded Joints
6.1. Quality Analysis of Welded Joints in Temperature-Variable Experimental Groups
There are three failure modes of composite resistance-welded joints, namely [32]: (1) interlayer failure; (2) interface failure; and (3) sample failure, as shown in Figure 11(a). These three failure modes are determined by the magnitude of several key strengths of the welded joints: (1) the strength of the metal mesh to damage: metal mesh strength; (2) the strength of the metal mesh combined with the thermoplastic resin layer: metal mesh-resin bonding strength; (3) the strength of the thermoplastic resin layer in contact with the surface of the laminate: interlayer strength; (4) Strength to pull out the surface structure of the laminate: pull-out strength; (5) Strength to cause damage to the laminate: laminate strength. As shown in Figure 11(b).
When the interlayer strength is less than the other strengths, it indicates that the interlayer strength is the weakest bonding strength and thus leads to interlayer failure of the welded joint. This failure mode indicates that the thermoplastic resin is not able to form a good bond with the surface of the laminate, often resulting in a low welded joint strength. When the interlayer strength is equal to or higher than any other strength or strengths, the failure interface is transformed into a mixture of multiple interfaces. This mixing of failure interfaces causes the failure mode to transform into an interface failure with a higher strength of the welded joint. For example, when the interlayer strength is higher than the metal mesh-resin bonding strength, a portion of the failure interface will be transferred to the interior of the heating element, resulting in peeling of the thermoplastic resin layer, creating a mixture of two failure interfaces (the contact surface of the thermoplastic resin layer with the laminate and the contact surface of the thermoplastic resin layer with the metal mesh). Since welded joint may experience a mixed failure of multiple failure interfaces, dispersing the tensile strength into multiple interfaces,therefore will lead a higher LSS for the welded joint. When the laminate strength is the only weakest strength, this indicates that the overall strength of the welded joint is higher than the laminate strength, and can lead to damage occurring in areas that are located within the laminate and away from the welded area,causes the sample failure. This failure mode does not give any information about the quality of the welded joint.
In addition, there are two failure modes in the metal mesh-resin interface: surface peeling and deep peeling, as shown in Figure 11(c). These two failure modes characterize different two metal mesh-resin bonding strengths. Surface peeling is a failure in which the outermost layer of the thermoplastic resin layer is torn off during tensile failure, and deep peeling is a failure in which the entire portion of the thermoplastic resin layer is torn off during tensile failure. Surface peeling indicates that the bonding strength between PA6 and the laminate surface is weaker than the bonding strength between PA6 and the metal mesh at the time of tensile failure, so that the thermoplastic resin layer cannot be peeled off from the heating element as a whole at the time of peeling. Deep peeling means that the bonding strength of PA6 to the laminate surface is stronger than the bonding strength of the metal mesh at the time of tensile failure, so that the PA6 is peeled off from the heating element as a whole. In general, the deep peel mode indicates that the failure interface is shifted from the contact surface of the thermoplastic resin and the laminate to the contact surface of the thermoplastic resin and the metal mesh, which results in a higher LSS.
A miniature table saw measuring 25.4 mm × 25.4 mm × 3 mm was used to cut the welded joint area of the Temperature-variable experimental group of welded samples with tensile failures to obtain the corresponding heating element failure parts and laminate failure parts. In order to simultaneously observe the surface morphology of the heating element and the internal morphology (PA6 and metal mesh bonding state), the heating element failure parts were placed under a transreflective polarized light microscope with a magnification scale of 300 . In order to observe the surface morphology of the laminate and the distribution of PA6, the laminate failure parts were placed in FE-SEM to observe the failure interface with a magnification scale of 300 to obtain Figure 12.
It can be observed that the surface of the untreated part was covered by epoxy resin, and PA6 could not find the groove structure or fine protruding structure on it to form an anchorage bond, and could only rely on the limited roughness of the laminate surface for a weak physical bonding, which resulted in a low physical embedment strength of the welded joint at this time. In addition, at this time, the surface chemical inertia of the laminate is also stronger, the relative content of oxygen-containing functional groups is lower, so the infiltration of the laminate surface is also poor, and it is unable to form a good chemical bond with the molten PA6, resulting in the chemical bonding strength of the welded joint at this time is also low. As shown in Figure 12(a1), the welded joints did not show laminate damage or heating element damage at failure. As seen in Figure 12(b1) and Figure 12(c1), the surface of the heating element failure part is smooth, with no traces of damage, and there are no traces of damage or PA6 residue on the surface of the laminate failure part, indicating that the failure interface is located between the thermoplastic resin layer and the surface of the laminate at this time, and that the failure mode belongs to the interlayer failure.
When the etching condition was 25°C/30 min, no damage to the laminate or damage to the heating element was detected when observing the welded joint failure interface, as shown in Figure 12(b1). Observation of the heating element failure part can be seen clear traces of fiber grain and a few pores distributed on it, as shown in Figure 12(b2). A small amount of speckled PA6 residue was observed on the surface of the laminate failure part, but no metal mesh pattern was seen on these residues, indicating that the peeling mode of PA6 was surface peeling, as shown in Figure 12(c2). Since there was no damage to the laminate and heating element at the time of failure, and the peeling mode of PA6 was surface peeling, Indicates that the failure interface is located at Contact surface between PA6 and laminate surface. Therefore the LSS of the welded joint at this time was not high, and the failure mode was interlayer failure.
When the etching condition was 50 °C/30 min, observation of the welded joint failure interface showed that the carbon fibers were pulled out and remained around the heating element during the tensile failure, as shown in Figure 12(a3). Observation of the heating element failure part revealed that a large number of pores appeared on the surface of the heating element, as shown in Figure 12(b3), which microscopically indicated the loss of the resin layer of the heating element. Observation of the surface morphology of the laminate failure part found that a large area of PA6 residue appeared on the surface of the laminate, and these PA6 residues have some metal mesh patterns on it, indicating that the PA6 was peeled off directly from the metal mesh, as shown in Figure 12(c3). At this time, the peeling mode of PA6 is deep peeling, and the carbon fibers in the laminate surface are pulled out, indicating that the failure interface is a mixture of three different interfaces – the contact surface between the laminate surface and fibers, the contact surface between PA6 and the metal mesh and the contact surface between PA6 and the laminate surface. At this time, the bond strength between the laminate surface and PA6 is greater than the bond strength between PA6 and metal mesh as well as the bond strength between the laminate surface and surface fibers, leading to the failure of these two interfaces during tensile failure. This is mainly due to the higher surface roughness and more reactive groups content of the laminate, as well as better surface wettability, which changes the failure mode of welded joints from interlayer failure to interface failure.
When the etching condition was 75 °C/30 min, the carbon fibers were pulled out during the tensile failure and the resin layer of the heating element became thin when observing the welded joint failure interface, as shown in Figure 12(a4). Observation of the heating element failure part can be seen obvious fiber grain, but no pores or grooves, indicating that there is no peeling of PA6, as shown in Figure 12(b4). Observation of the surface of the laminate failure part also did not find PA6 residue, as shown in Figure 12(c4). In summary, it indicates that the failure interface at this time is not located on the contact surface of PA6 and metal mesh, nor on the metal mesh body, but on the contact surface of the laminate surface with PA6 and laminate surface with surface fibers. It means that at this time the pull-out strength of the pulled-out fibers in the laminate surface is exactly equal to the interlayer strength at this time. The reason for this failure mode is: At this etching stage, the laminate surface fiber arrangement is sparse, low roughness, and low oxygen-containing functional groups content, is not conducive to the combination of PA6 and the laminate surface. Therefore, in the welding process, the molten PA6 can not form a good combination with the laminate surface, and is squeezed by the pressure to the left and right sides of the welding area. Due to the edge effect, the fluidity of the squeezed resin is enhanced at high temperatures. Thanks to the sparse fiber arrangement of the laminate surface at this etching stage, the squeezed resin penetrated into some of the edge fibers that were warped due to the loss of epoxy constraints and formed a stronger bond. While a small portion of the squeezed but unbound PA6 vaporized under the high temperature of the edge effect and left charred black residual traces of PA6 on both sides of the weld area. Thus at tensile failure, a portion of the actual failure occurred between the pulled out edge fibers and the laminate surface, where the molten PA6 formed a strong bond with the edge ends of the edge fibers and tore the edge fibers away from the laminate at tensile failure. As the interlayer strength at this time is exactly equal to the pull-out strength, the failure interface is a mixture of the two interfaces, so the failure mode at this time is the interface failure.
When the etching condition is 100 °C/30 min, observing the failure interface of the welded joints, a large number of fibers were pull out from the laminate and bonded to the heating element, and at this time, the same large number of disordered fibers still existed on the failure interface of the laminate failure part, as shown in Figure 12(a5). Observation of the heating element revealed a large number of laminate surface fibers that had been removed from the motherboard, as shown in Figure 12(b5). These surface fibers were stacked on top of each other, obstructing the field of view and making it impossible to observe the distribution of PA6 on the heating element. A large number of disordered fibers separated from each other and piled up on the failure interface were visible when observing the laminate failure parts, and no obvious PA6 residue was found, as shown in Figure 12(c5). This indicates that the failure interface of the welded joint is located inside the laminate alone, so the failure mode should be sample failure.
Observation of the laminate failure part shows that the failure interface is a bare fiber structure, and only a small amount of epoxy resin residue is visible. This means that the molten PA6 is almost not effectively connected to the failure interface, and the failure mode of the welded joint can be approximated as a sample failure with the bare fibers peeled off from the motherboard. This is probably caused by two reasons:
First, the amount of PA6 on the heating element is limited, excessive Acid-etching cause the deeper etching depth, so the limited PA6 can not fully penetrate into all the bare fibers to form a composite structure that can be stressed. Those bare fibers which are not forms bonds with PA6 transformed into internal defects of welded joints . These internal defects are dispersed in the vertical and horizontal directions, greatly destroying the stability of the welded joints, making it easy to be damaged internally by small forces and causing failure of the sample;
Secondly, a part of the Acid-etching in this stage acts directly on the carbon fibers themselves, which promotes an increase in the content of reactive groups of the carbon fibers in the surface, which is conducive to the bonding of the molten PA6 with the bare fibers of the surface. In addition, a large number of burrs and protruding structures appear on the laminate surface at this stage due to the loss of the main epoxy constraints in all directions, which improves the surface roughness of the laminate, and is also conducive to the bonding of the molten PA6 with the bare fibers in the surface. As a result, the surface fibers are not only more likely to form a better bond with the PA6, but also more likely to peel away from the motherboard, which naturally leads to failure within the laminate.
6.2. Quality Aanalysis of Welded Joints in Time-Variable Experimental Groups
A miniature table saw measuring 25.4 mm × 25.4 mm × 3 mm was used to cut the welded joint area of the Time-variable experimental group of welded samples with tensile failures to obtain the corresponding heating element failure parts and laminate failure parts. In order to simultaneously observe the surface morphology of the heating element and the internal morphology (PA6 and metal mesh bonding state), the heating element failure parts were placed under a transreflective polarized light microscope with a magnification scale of 300 . In order to facilitate the observation of the surface morphology of the laminate and the distribution of PA6, the laminate failure parts were placed in FE-SEM to observe the failure interface with a magnification scale of 300 to obtain Figure 13.
When the etching condition was 50 °C/15 min, the carbon fiber was pulled out at the lower right edge when observing the failure interface of the welded joint, as shown in Figure 13(a2). Observing the failure interface of the heating element failure part, the resin layer has obvious fiber lines and scattered pores, as shown in Figure 13(b2). Observation of the laminate failure part can be seen, the laminate surface covered with a little PA6 residues, and these PA6 residues have some metal mesh patterns on it, indicating that at this time the peeling mode of PA6 is deep peeling, as shown in Figure 13(c2). Since the peeling mode of PA6 is deep peeling, and the carbon fiber of the laminate surface has been pulled out during the tensile failure, the failure interface at this time is a mixture of three interfaces:the contact surface between the fibers of the laminate surface and the laminate surface, the contact surface between PA6 and the metal mesh and the contact surface between PA6 and the laminate surface. Therefore, the failure mode at this etching stage is interface failure. Comparing the failure interface morphology and failure mode of the 25 °C/30 min experimental group with the 50 °C/15 min experimental group , it can be seen that the bonding strength between PA6 and the laminate surface of the 50 °C/15 min experimental group is better than that of the former, which is mainly reflected in the damage mode of the heating element and the morphology of the PA6 residues. It is observed that in the 25 °C/30 min experimental group, the peeling mode of PA6 is surface peeling. While in the 50 °C/15 min experimental group, the peeling mode of PA6 is deep peeling. It indicates that the bonding strength between the laminate surface and PA6 in the 25 °C/30 min experimental group is not strong enough to make the PA6 detach from the heating element completely. In contrast, in the 50 °C/15 min experimental group, the bonding strength of the laminate surface with PA6 has been enhanced to the extent that it is sufficient to peel off PA6 from the metal mesh.
When the etching condition was 50 °C/45 min, the carbon fiber was pulled out and the thermoplastic resin layer became thinner and the metal mesh was torn when observing the failure interface of the welded joint, as shown in Figure 13(a4). Observation of the failure interface of the heating element failure part shows that the metal mesh is broken and there are a lot of pores on the resin layer, as shown in Figure 13(b4). Observation of the failure interface of the laminate failure part shows that a large number of PA6 residues with metal mesh patterns on it densely distributed on the surface of the laminate, as shown in Figure 13(c4). At this time, the failure interface is a mixture of four failure interfaces: the contact surface between the laminate surface fibers and the laminate surface, the contact surface between PA6 and the metal mesh, the contact surface between PA6 and the laminate, the metal mesh itself. In addition, due to the large amount of PA6 residues in the surface of laminate failure part, the area with no PA6 residue is significantly less than that with PA6 residues, indicating that the PA6-laminate surface contact surface is not the main failure interface. It shows that in tensile failure, the interlayer strength>metal mesh strength ≈ metal mesh-resin interface strength ≈ pull out strength, which is a proof that the strength of welded joints is close to its limit value.
When the etching condition is 50 °C/60 min, the observation of the failure interface of the welded joint shows no carbon fiber is pulled out, and the resin layer of the heating element is not significantly thinned, as shown in Figure 13(a5). Observing the failure interface of the heating element failure part, it can be seen that there are certain small pores in the resin layer of the heating element, as shown in Figure 13(b5). Observing the failure interface of the laminate failure part, there is a small amount of PA6 residues with metal mesh pattern on it distributed on the surface of the laminate, but the distribution is sparse, as shown in Figure 13(c5). In summary, the peeling mode of PA6 is deep peeling, but there is no phenomenon of carbon fiber being pulled out, so the failure interface at this time is a mixture of PA6 and laminate contact surface and PA6 and metal mesh contact surface, which means that the failure mode at this point is interface failure. From the LSS of the welded joints, it can be seen that the Acid-etching effect of the 50 °C/60 min experimental group should be intermediate between the 50 °C/45 min experimental group and the 75 °C/30 min experimental group, which is also reflected in the morphology of the failure interface. For the 50 °C/60 min experimental group, Acid-etching weakened its surface roughness and also reduced the content of surface active chemical groups. However, the surface epoxy is still remain on the fibers in a macroscopic form and has not almost disappeared due to excessive Acid-etching as in the 75 °C/30 min experimental group. Therefore, some of the epoxy debris may still accumulate with each other, leaving some areas of the laminate surface with considerable surface roughness. Moreover, it can be seen from the previous section that there are more oxygen-containing functional groups in the 50 °C/60 min experimental group than in the 75 °C/30 min experimental group. These reasons are coupled with each other, resulting in a better LSS of welded joints in the 50 °C/60 min experimental group than in the 75 °C/30 min experimental group.
6.3. Summary of the Effect of Acid-Etching on the Strength of Welded Joints
In this chapter, the intrinsic correlation between failure interface and failure mode was revealed. The experiments show that the 50 °C/45 min experimental group exhibits optimal LSS performance, and its core advantages are reflected in the following three aspects:
- bonding mechanism Surface treatment of laminates at 50 °C/45 min Acid-etching parameters results in the formation of a high-roughness structure on the laminate surface, with a significant increase in the content of reactive functional groups and the surface wettability, at the same time, avoids the problem of fiber destabilization caused by excessive etching.
- Unique failure interfaces CF/EP resistance-welded joints have a variety of failure interfaces. In addition to the failure interface within the laminate itself, which causes the sample failure and does not give any information about the quality of the welded joint, there are four types of failure interfaces, namely, interface between the laminate surface and the PA6, interface between the PA6 and the metal mesh, interface between the surface fibers and the laminate surface and the metal mesh itself. The failure interface of the 50 °C/45 min experimental group is a mixture of all possible failure interface except the failure interface within the laminate itself. This indicates that except the failure interface within the laminate itself, all other interfaces of the welded joints are involved in the tensile process, which is a direct manifestation of the welding joint LSS is close to its limit.
- Parameter optimization advantages 50 °C/45 min experimental group compared to short-term experimental groups or low-temperature experimental groups (such as 50 °C/15 min experimental group and 25 °C/30 min experimental group): Appropriate extension of the etching time and increase the etching temperature so that the Acid-etching is more adequate.50 °C/45 min experimental group compared with high-temperature experimental groups or a long period of time experimental groups (such as 75 °C/30 min experimental group and 50 °C/60 min experimental group): Reasonable control of etching time and etching temperature can effectively avoid the sparse arrangement of surface fibers, the decrease of surface roughness, and the loss of active chemical groups.50 °C/45 min experimental group compare with over-etching experimental groups (e.g., 100 °C/30 min experimental group): The structural integrity of the fibers is retained and the risk of internal defects is eliminated. The experimental data show that the LSS of the 50 °C/45 min experimental group is 21.47 ± 1.21 MPa, which is 161% ± 14% higher than that of the untreated samples, proving that the optimal Acid-etching parameter is 50 °C/45 min.
7. Conclusion
In this study, an Acid-etching surface treatment technique is proposed to treat a typical aerospace composite material, CF/EP, without the intervention of additional large-scale equipment, with inexpensive raw materials and simple technological steps, with the intention of enhancing the bonding strength of the CF/EP surface with thermoplastic resins to realize high-quality resistance welding of CF/EP. The results of this study show that after the surface treatment of CF/EP with concentrated sulfuric acid for 30 minutes at 45°C, the physical and chemical bonding strengths of CF/EP to the thermoplastic resin can be greatly enhanced while the laminate remains intact and the laminate structure remains undamaged, which makes it possible to realize high-quality resistance welding of CF/EP. This study and its results provide a low-cost and easily reproducible idea for the welding technology of thermosetting resin matrix fiber-reinforced composites, which is of some reference value for solving the welding problems in certain composite material fields.
Author Contributions
Conceptualization, P.C.; Data curation, P.C.; Formal analysis, P.C.; Funding acquisition, X.X.; Methodology, P.C.; Project administration, X.X.; Resources, X.X.; Validation, P.C.; Writing – original draft, P.C.; Writing – review and editing, X.X. All authors have read and agreed to the published version of the manuscript.
Funding
This research was funded by Liaoning General Aviation Research Institute, Shenyang Aerospace University. And the APC was funded by Liaoning General Aviation Research Institute Shenyang Aerospace University.
Data Availability Statement
The raw data supporting the conclusions of this article will be made available by the authors on request.
Conflicts of Interest
The authors declare no conflict of interest.
References
- Jerome, PORA. Composite materials in the airbus A380-from history to future. In Proceedings of the 13th International Conference on Composite Materials (ICCM-13); Beijing, China, 2001.
- Lu, B.; Wang, N. The Boeing 787 dreamliner designing an aircraft for the future. Journal of Young Investigators 2010, 4026, 34. [Google Scholar]
- Smith, B. The Boeing 777: The development of the Boeing 777 was made possible by the development of breakthrough materials. Advanced Materials & Processes 2003, 161, 41–45. [Google Scholar]
- Hanna, C.; Ienina, I.; Taruta, M. Use of composite materials in civil aviation. New Integrations of Modern Education in Universities 2023, 310. [Google Scholar]
- Lockheed Martin. F-22 RAPTOR: Air dominance for the 21st century. Advanced Materials & Processes 1998, 153. [Google Scholar]
- Ravichandran, B.; Balasubramanian, M. Joining methods for Fiber Reinforced Polymer (FRP) composites - A critical review. Composites Part A: Applied Science and Manufacturing, 2024; 108394. [Google Scholar]
- Cui, X.; Tian, L.; Wang, D.S.; Dong, J.P. Summary of thermosetting composite material welding. In Journal of Physics: Conference Series; 2021, 1765. [Google Scholar] [CrossRef]
- Rajak, D.K.; Pagar, D.D.; Kumar, R.; Pruncu, C.I. Recent progress of reinforcement materials: A comprehensive overview of composite materials. Journal of Materials Research and Technology 2019, 8, 6354–6374. [Google Scholar] [CrossRef]
- Brauner, C.; Nakouzi, S.; Zweifel, L.; Tresch, J. Co-curing behaviour of thermoset composites with a thermoplastic boundary layer for welding purposes. Advanced Composites Letters 2020, 29, 2633366X20902777. [Google Scholar] [CrossRef]
- Li, G.; Yin, L.; Wang, D.; Xiong, X.; Zhao, P.; Tan, C. The thermal and mechanical properties of thermosetting composites prepared for welding by the improved TP hybrid interlayer. Journal of Adhesion Science and Technology 2022, 36, 1135–1152. [Google Scholar] [CrossRef]
- Grace, J.M.; Gerenser, L.J. Plasma treatment of polymers. Journal of Dispersion Science and Technology 2003, 24, 24(3–4). [Google Scholar] [CrossRef]
- Srinivasan, V.; Smrtic, M.A.; Babu, S.V. Excimer laser etching of polymers. Journal of Applied Physics 1986, 59, 3861–3867. [Google Scholar] [CrossRef]
- Xu, S.; Shen, K.; Han, M.; Zhang, H.; Lan, J.; Lin, J.; Cao, H.; Zheng, G. Surface nano-crystallisation and mechanical properties of TiTa composite materials after surface mechanical grinding treatment. Materials Characterization 2023, 206, 113458. [Google Scholar] [CrossRef]
- Anatech USA. SCE Series Technical Specifications. Available online: https://www.anatechusa.com (accessed on 1 May 2024).
- Barnes Aerospace. Horizontal Material Grinders. Available online: https://www.barnesaero.com (accessed on 1 May 2024).
- Plasma Etch Inc. BT Series Plasma Transmitters. Available online: https://www.plasmaetch.com (accessed on 1 May 2024).
- Universal Laser Systems. PLS6.150D Industrial Etcher. Available online: https://www.ulsinc.com (accessed on 1 May 2024).
- Berglund, L.A. Thermoplastic resins. In Handbook of Composites; Publisher: Springer, 1998; pp. 115–130. [Google Scholar]
- ASTM International Standard Test Method for Lap Shear Adhesion for Fiber Reinforced Plastic (FRP) Bonding. ASTM D5868-01; 2023.
- Xiong, X.; Wang, D.; Wei, J. et al. Resistance welding technology of fiber reinforced polymer composites: a review. J. Adhes. Sci. Technol. 2021, 35, 1593–1619. [Google Scholar] [CrossRef]
- Barazanchy, D.; Pandher, J.; Van Tooren, M.J. The edge-effect in thermoplastic induction welding. In Proceedings of the AIAA Scitech 2021 Forum; 2021; p. 1890. [Google Scholar]
- Zhao, Y.; Zhao, G.; Li, M. et al. The effect of surface treatment on the resistance welding technology for carbon fiber/epoxy resin composites. Appl. Compos. Mater. 2024, 31, 201–221. [Google Scholar] [CrossRef]
- Karna, S.K.; Sahai, R. An overview on Taguchi method. Int. J. Eng. Math. Sci. 2012, 1, 1–7. [Google Scholar]
- Kohout, J. Modified Arrhenius equation in materials science, chemistry and biology. Molecules 2021, 26. [Google Scholar] [CrossRef]
- Azeem, M.; Boughattas, A.; Wiener, J. et al. Mechanism of liquid water transport in fabrics: a review. Fibres Text. 2017, 4, 58–65. [Google Scholar]
- Miyama, M.; Yang, Y.; Yasuda, T. et al. Static and dynamic contact angles of water on polymeric surfaces. Langmuir 1997, 13, 5494–5503. [Google Scholar] [CrossRef]
- Law, K.Y. Water–surface interactions and definitions for hydrophilicity, hydrophobicity and superhydrophobicity. Pure Appl. Chem. 2015, 87, 759–765. [Google Scholar] [CrossRef]
- Seah, M.P. The quantitative analysis of surfaces by XPS: a review. Surf. Interface Anal. 1980, 2, 222–239. [Google Scholar] [CrossRef]
- Hartung, J.; Gottwald, T.; Špehar, K. Selectivity in the chemistry of oxygen-centered radicals-the formation of carbon-oxygen bonds. Synthesis 2002, 2002, 1469–1498. [Google Scholar] [CrossRef]
- Teoh, W.C.; Yeoh, W.M.; Mohamed, A.R. Evaluation of different oxidizing agents on effective covalent functionalization of multiwalled carbon nanotubes. Fullerenes Nanotub. Carbon Nanostruct. 2018, 26, 846–850. [Google Scholar] [CrossRef]
- Glockler, G. Carbon–oxygen bond energies and bond distances. J. Phys. Chem. 1958, 62, 1049–1054. [Google Scholar] [CrossRef]
- Shi, H.; Villegas, I.F.; Bersee, H.E.N. Strength and failure modes in resistance welded thermoplastic composite joints: effect of fibre–matrix adhesion and fibre orientation. Compos. Part A Appl. Sci. Manuf. 2013, 55, 1–10. [Google Scholar] [CrossRef]
Figure 1.
Resistance welding platform and welding process. (a)Self-built resistance welding platform. (b)Resistance welding process.
Figure 1.
Resistance welding platform and welding process. (a)Self-built resistance welding platform. (b)Resistance welding process.
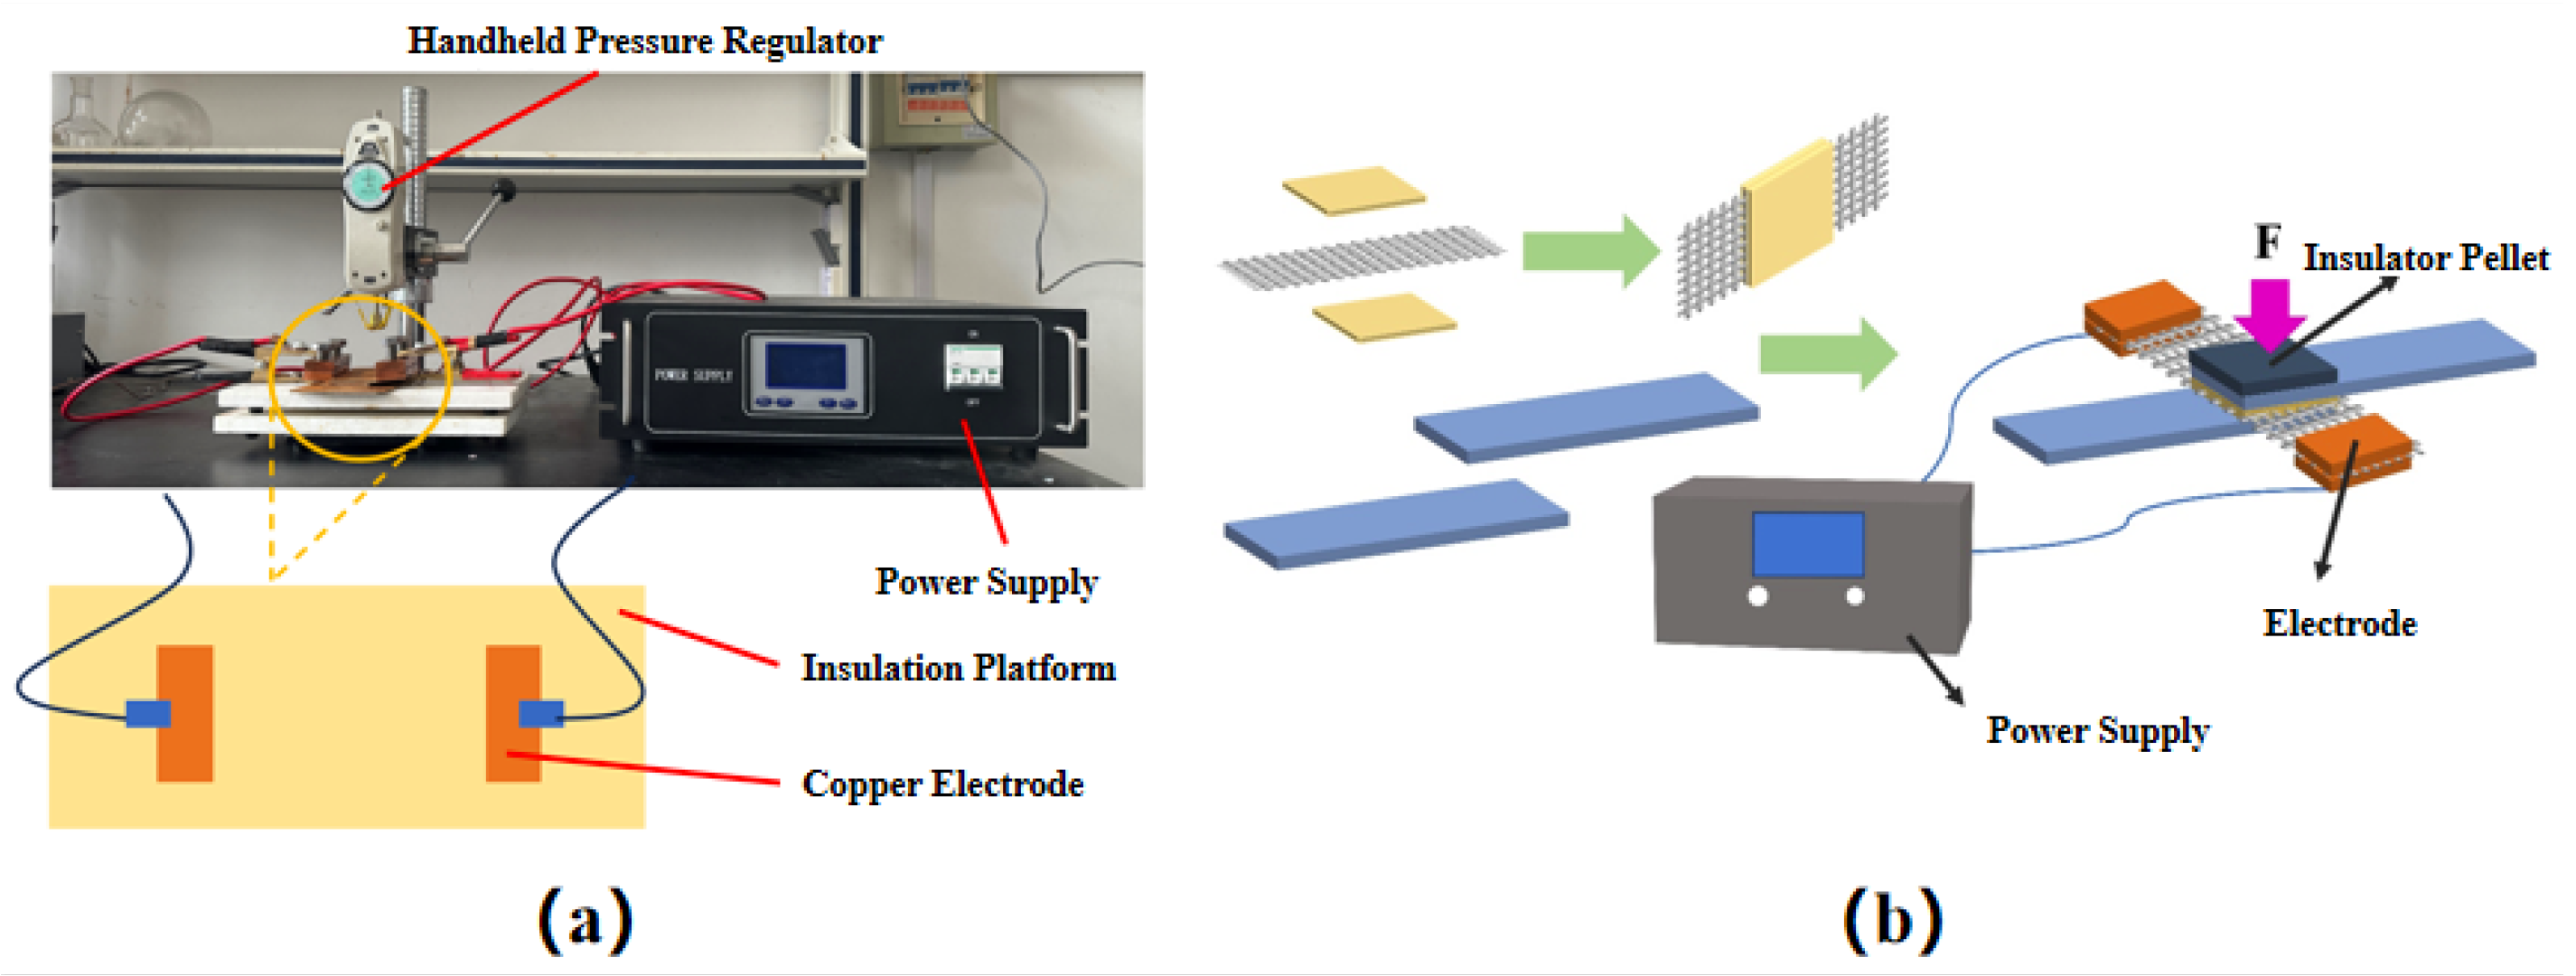
Figure 2.
Heat detection method.
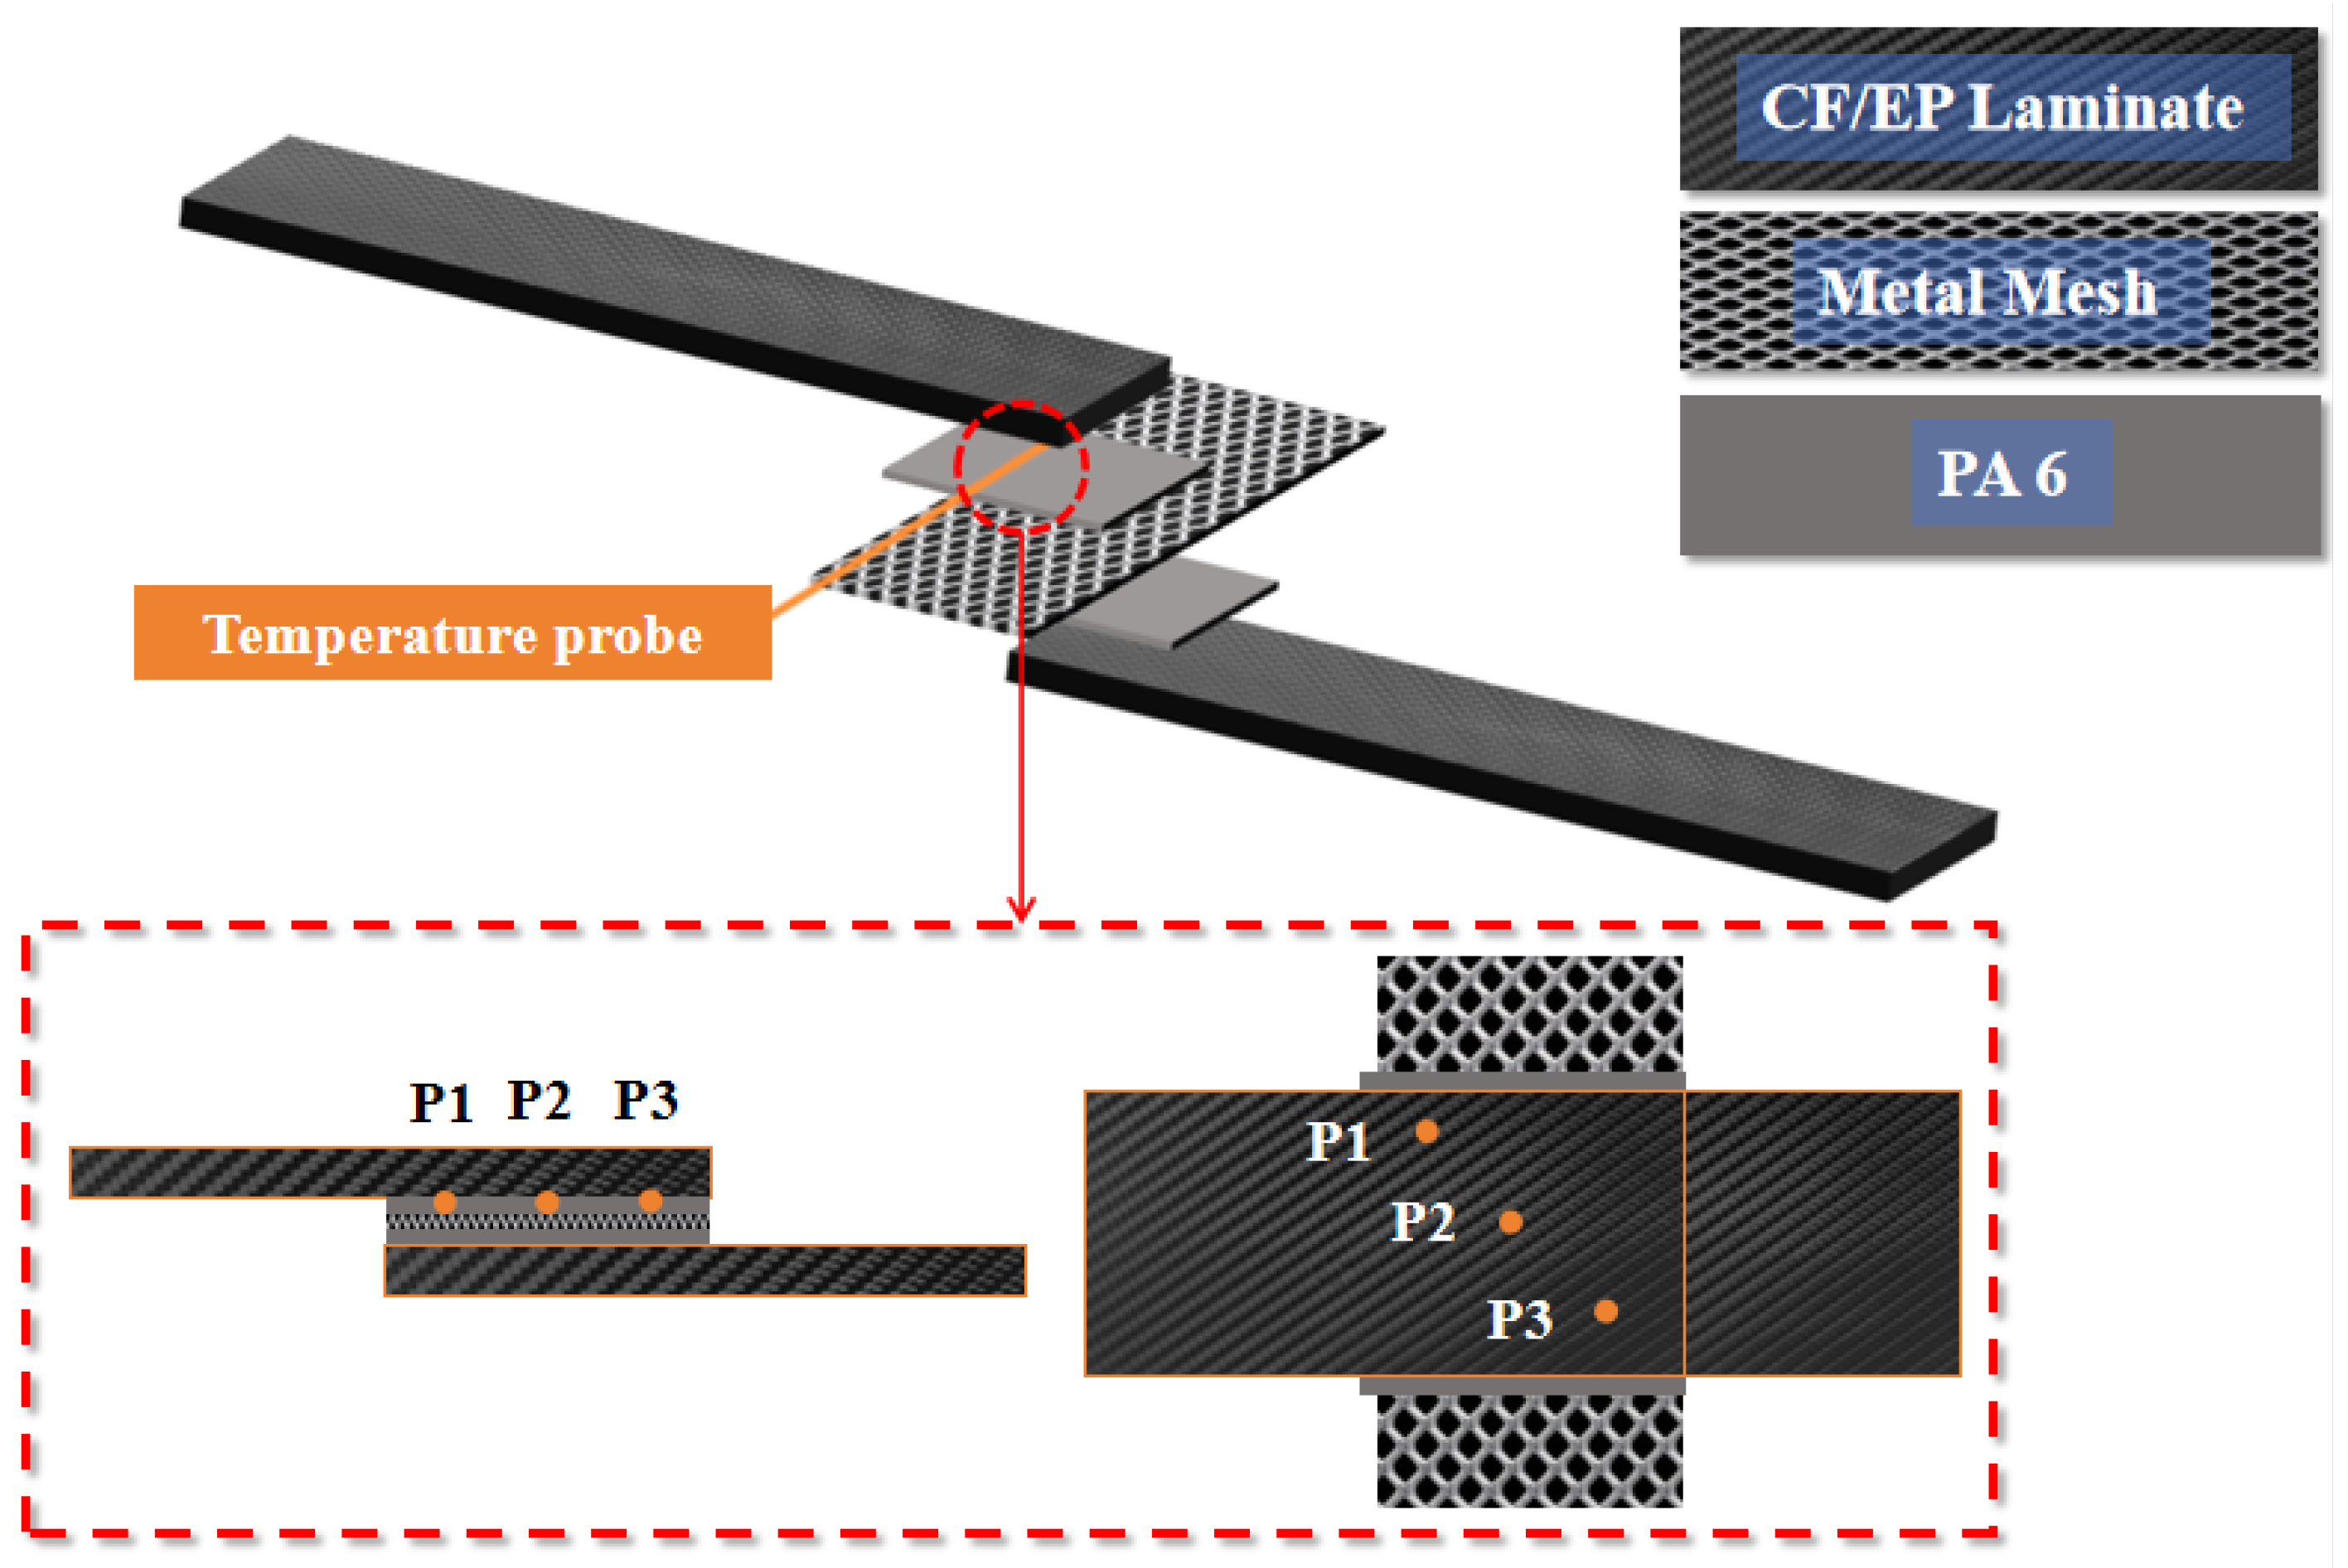
Figure 3.
Main effect diagram of single lap shear strength of CF/EP welded joints.
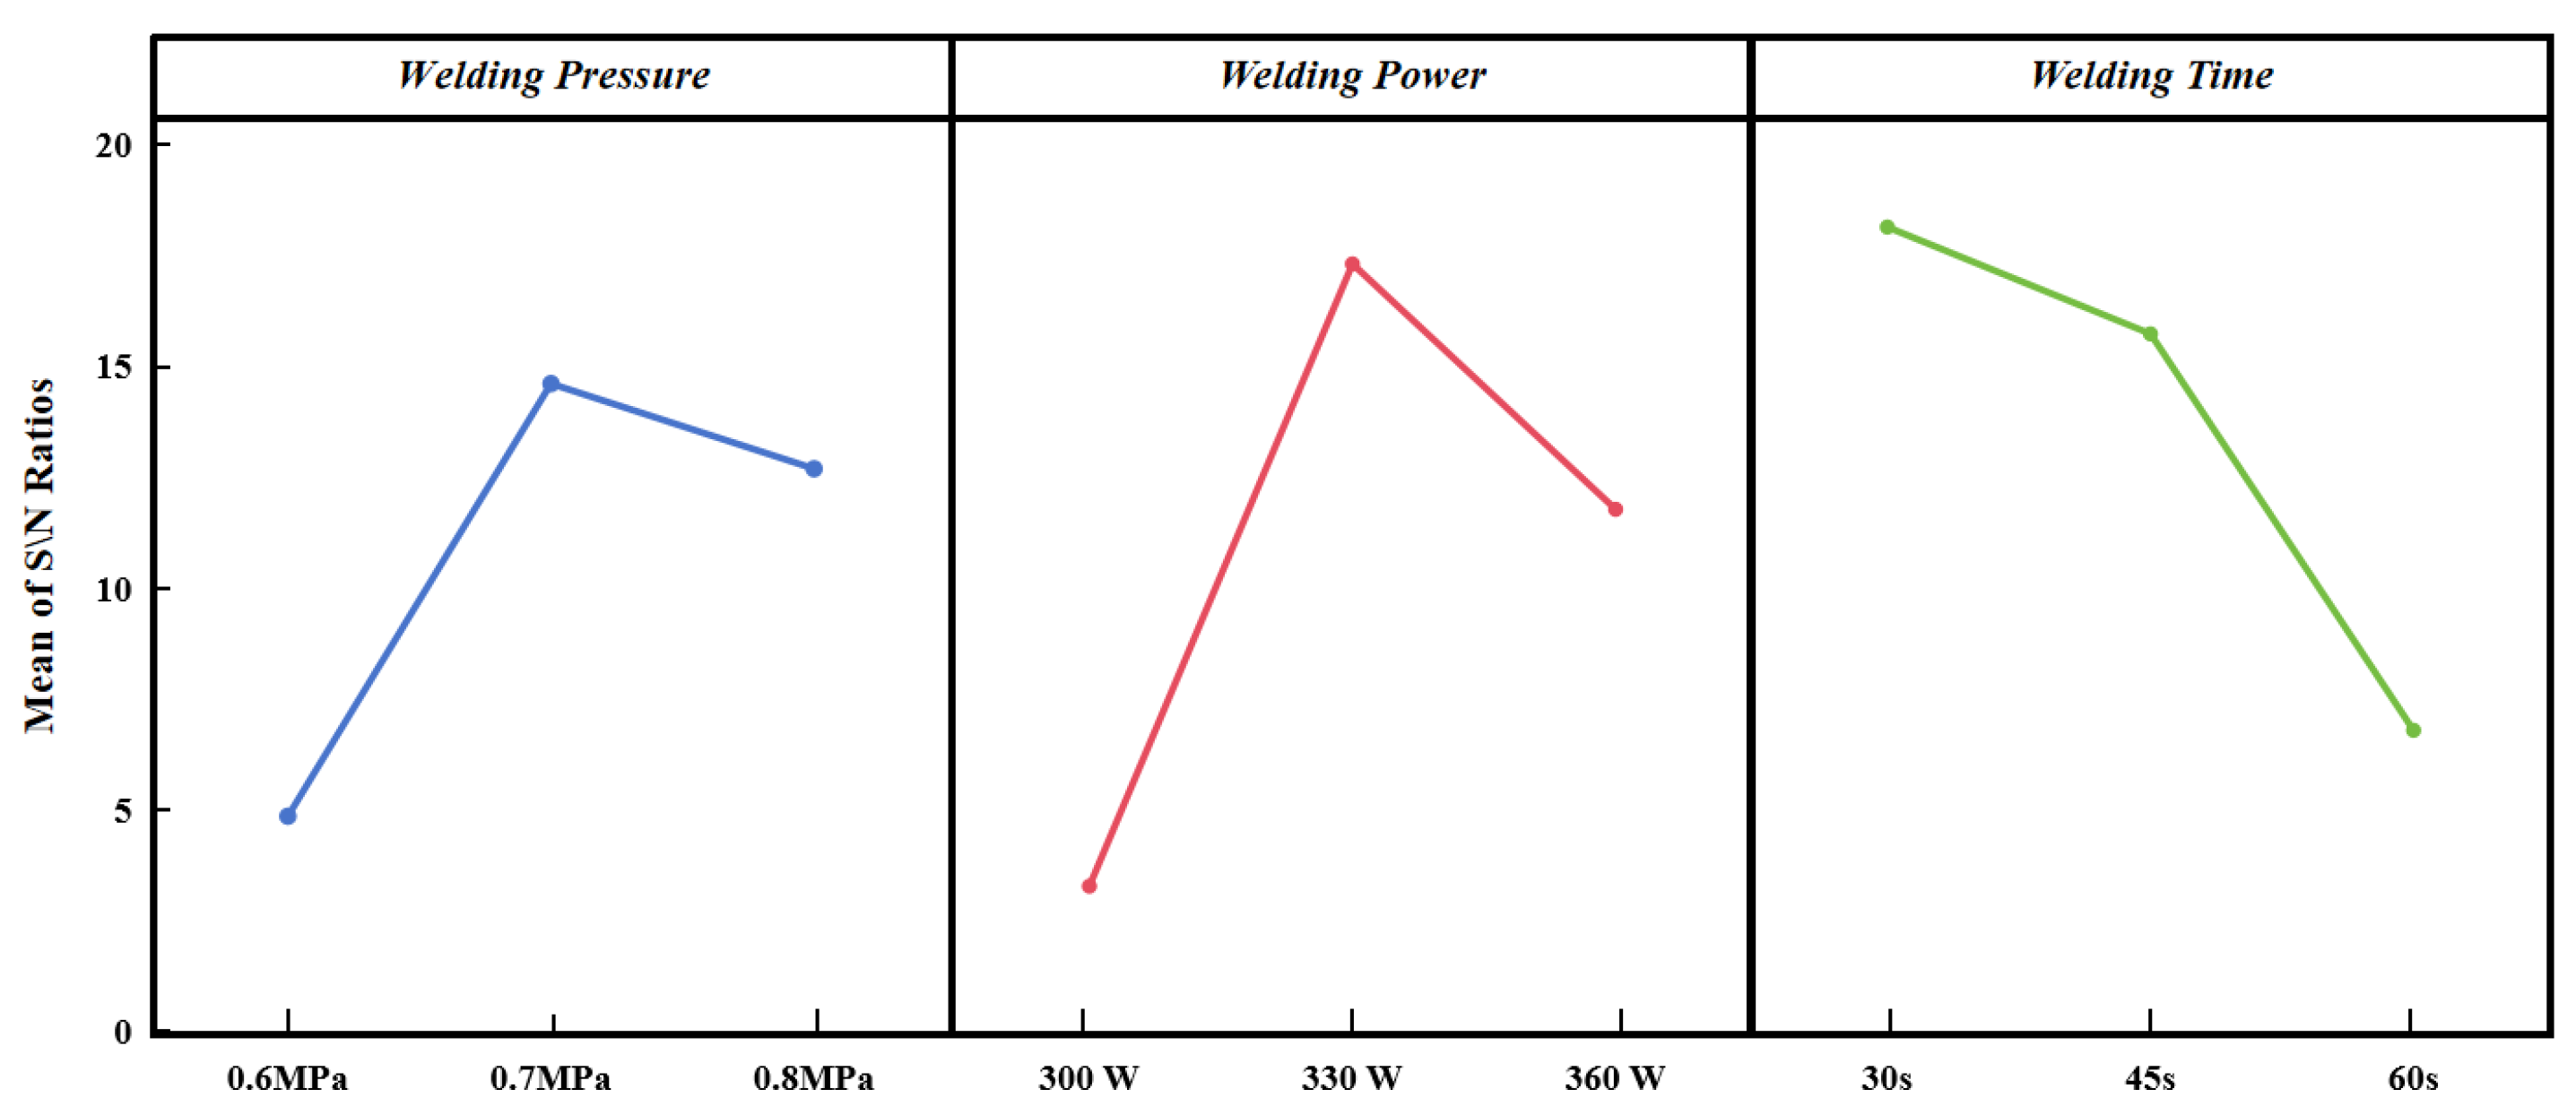
Figure 4.
Acid-etching treatment of CF/EP laminates. (a)Acid-etching method. (b)Surface morphology of laminates for Temperature-variable groups. (c)Surface morphology of laminates for Time-variable groups. (d)LSS for Temperature-variable groups. (e)Percentage of increase in LSS for Temperature-variable groups. (f)LSS for Time-variable groups. (g)Percentage of increase in LSS for Time-variable groups.
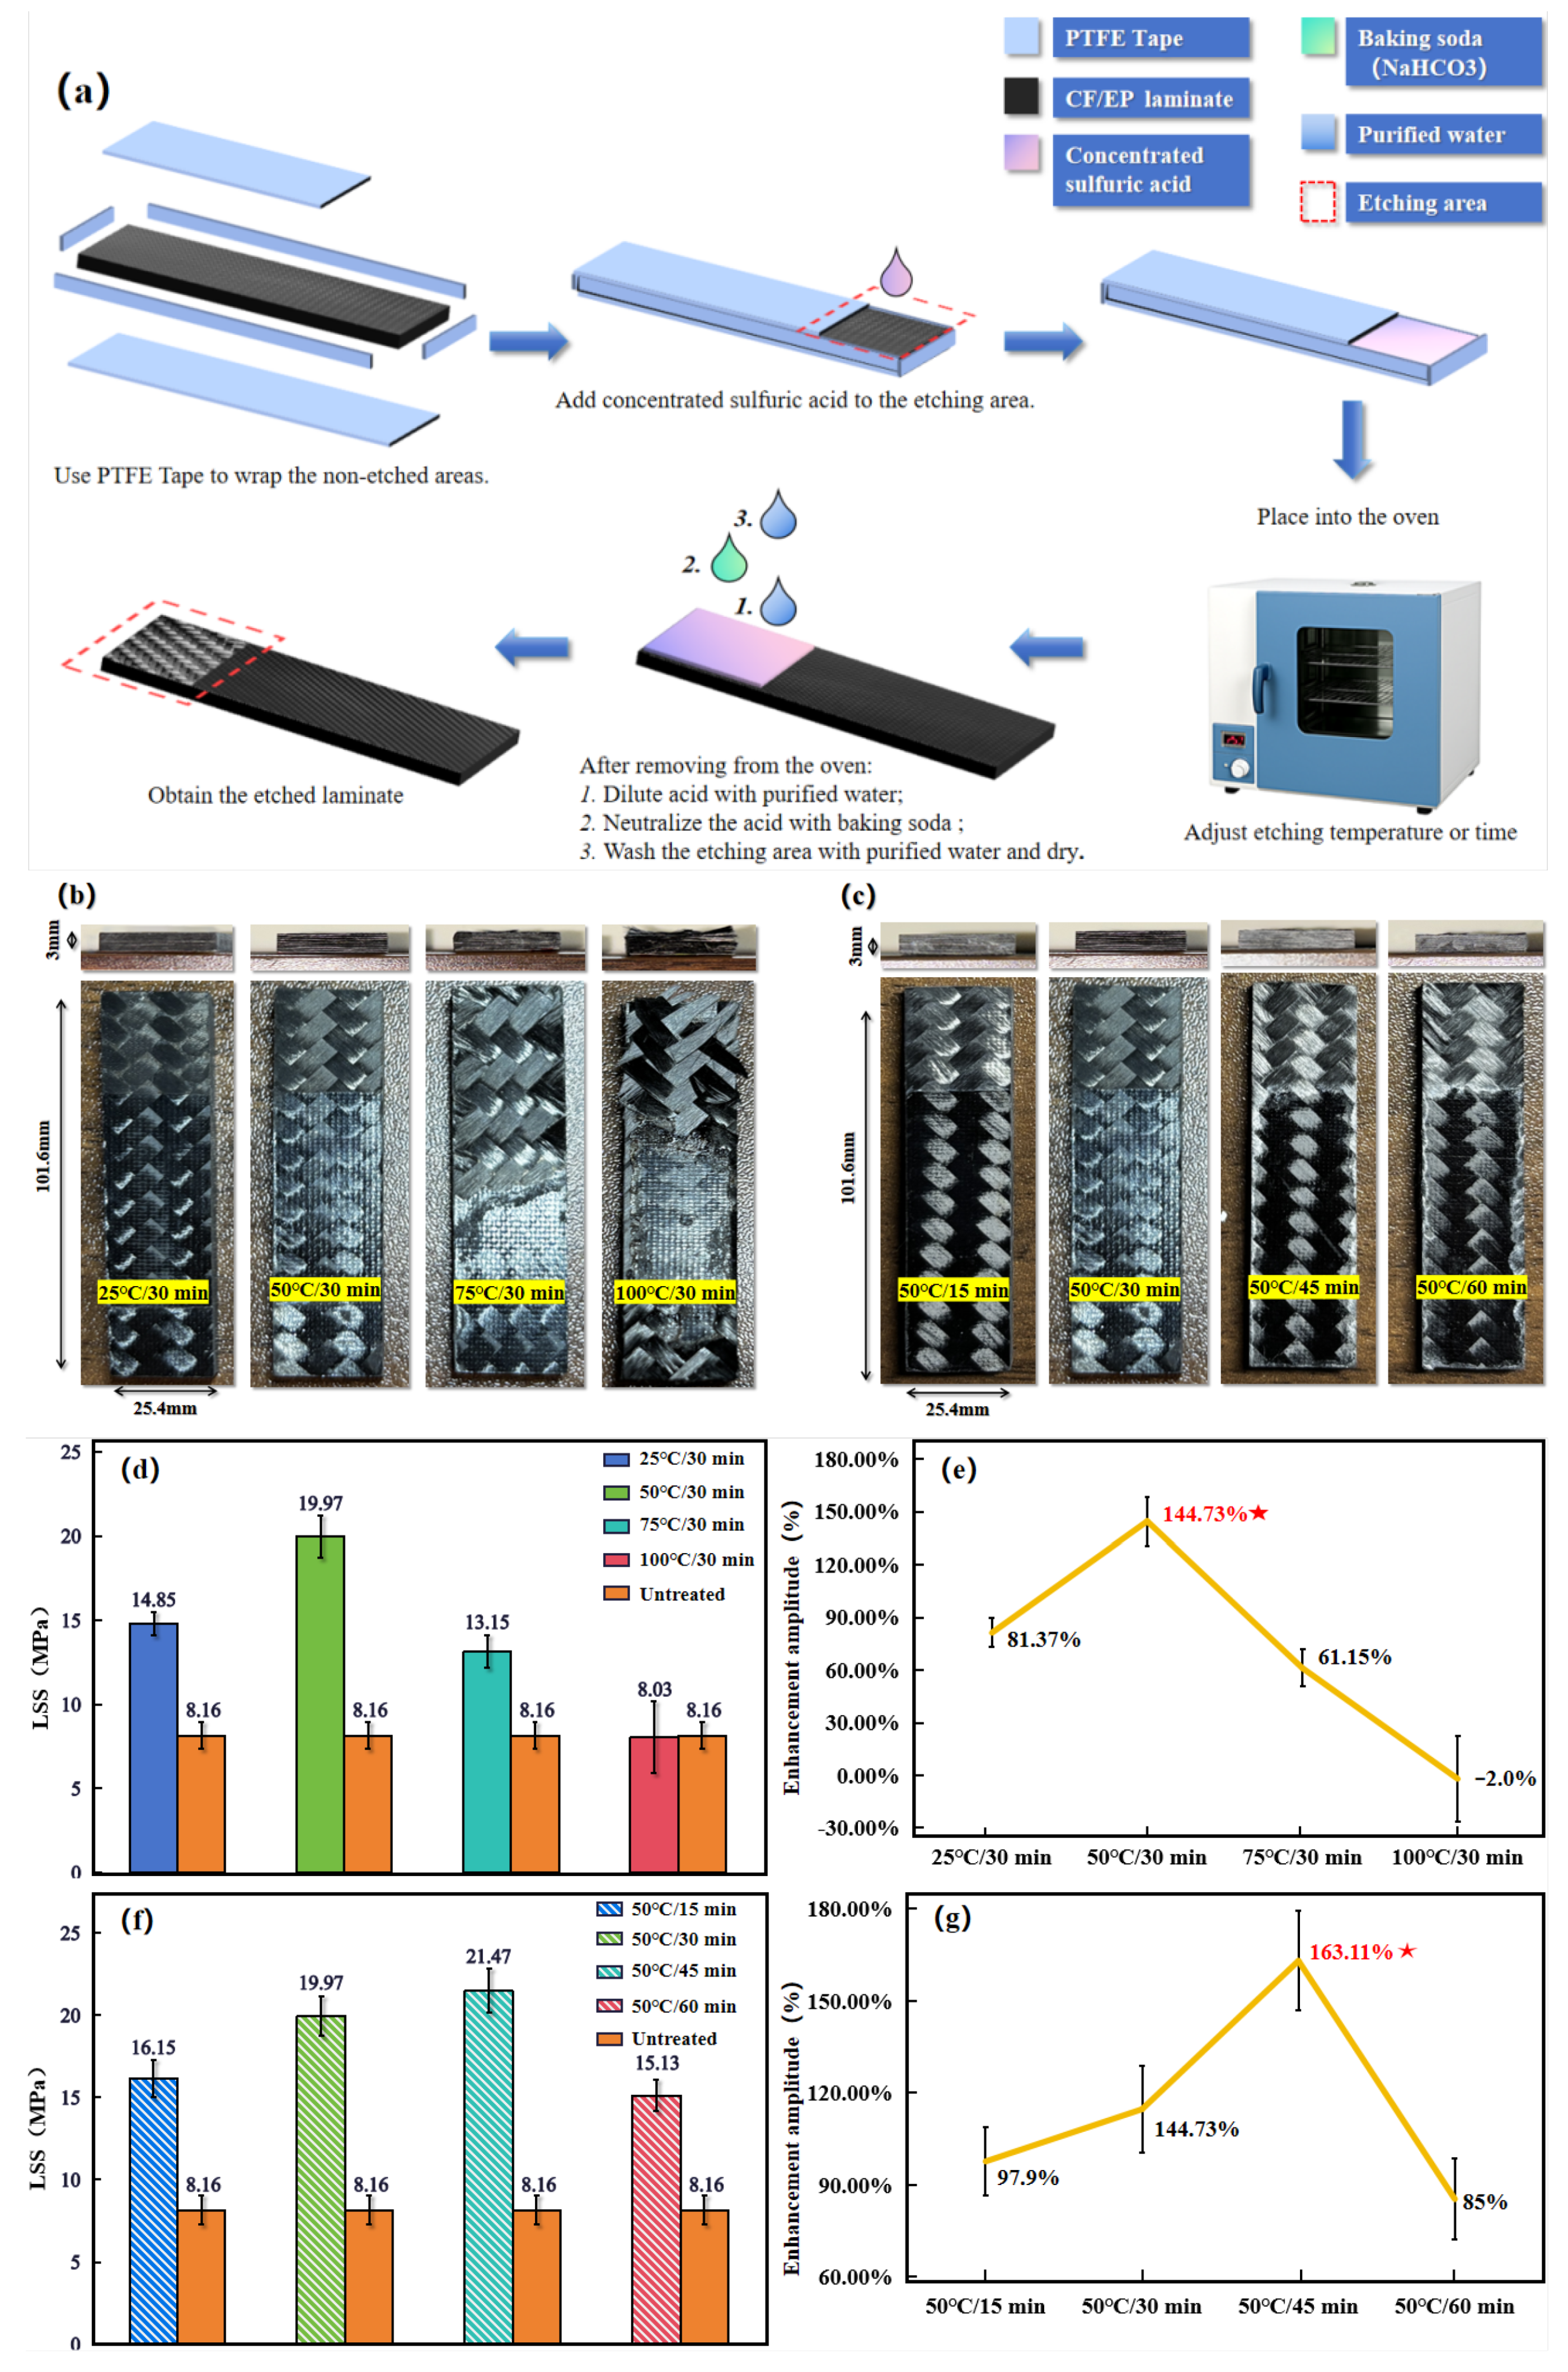
Figure 5.
FE-SEM observation of Acid-etching effect (Temperature-variable experimental groups). (a)Untreated sample. (b)25℃/30 min-treated sample. (c)50℃/30 min-treated sample. (d)75℃/30 min-treated sample. (e)100℃/30 min-treated sample. and (f)Mechanism diagram of Acid-etching action.
Figure 5.
FE-SEM observation of Acid-etching effect (Temperature-variable experimental groups). (a)Untreated sample. (b)25℃/30 min-treated sample. (c)50℃/30 min-treated sample. (d)75℃/30 min-treated sample. (e)100℃/30 min-treated sample. and (f)Mechanism diagram of Acid-etching action.
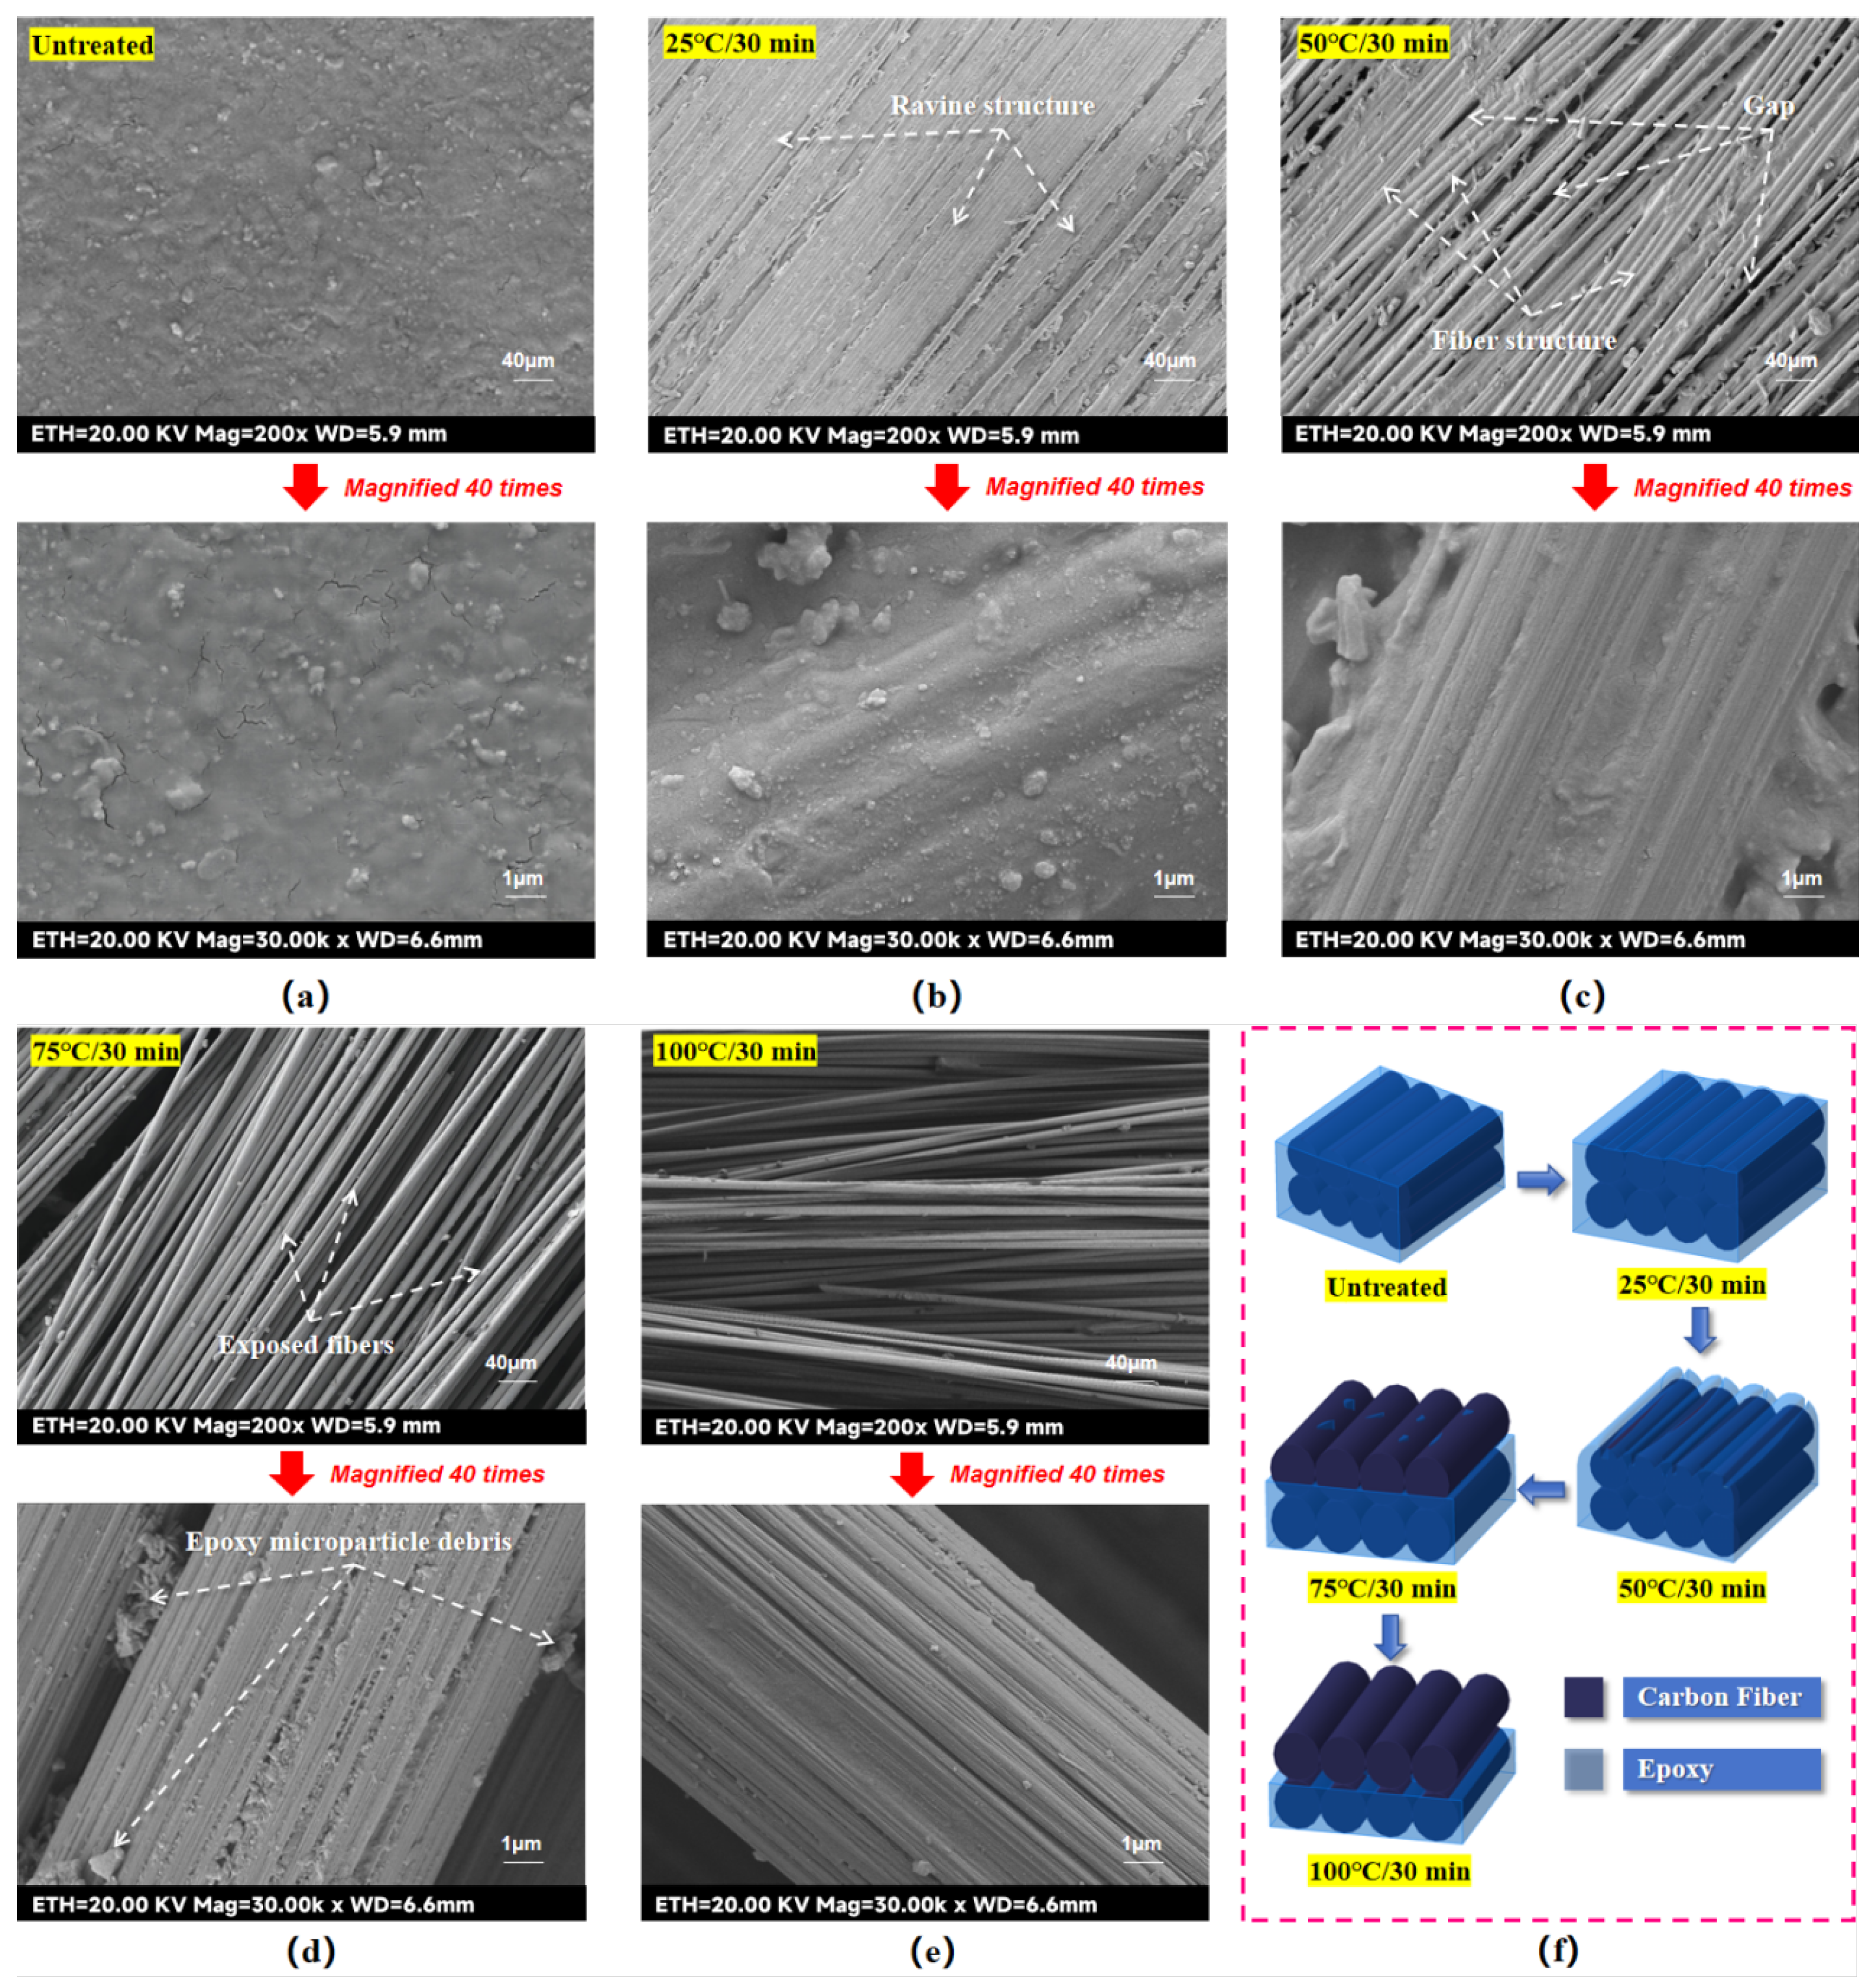
Figure 6.
FE-SEM observation of Acid-etching effect (Time-variable experimental groups). (a)Untreated sample. (b)50℃/15 min-treated sample. (c)50℃/30 min-treated sample. (d)50℃/45 min-treated sample. (e)50℃/60 min-treated sample. and (f)Mechanism diagram of Acid-etching action.
Figure 6.
FE-SEM observation of Acid-etching effect (Time-variable experimental groups). (a)Untreated sample. (b)50℃/15 min-treated sample. (c)50℃/30 min-treated sample. (d)50℃/45 min-treated sample. (e)50℃/60 min-treated sample. and (f)Mechanism diagram of Acid-etching action.
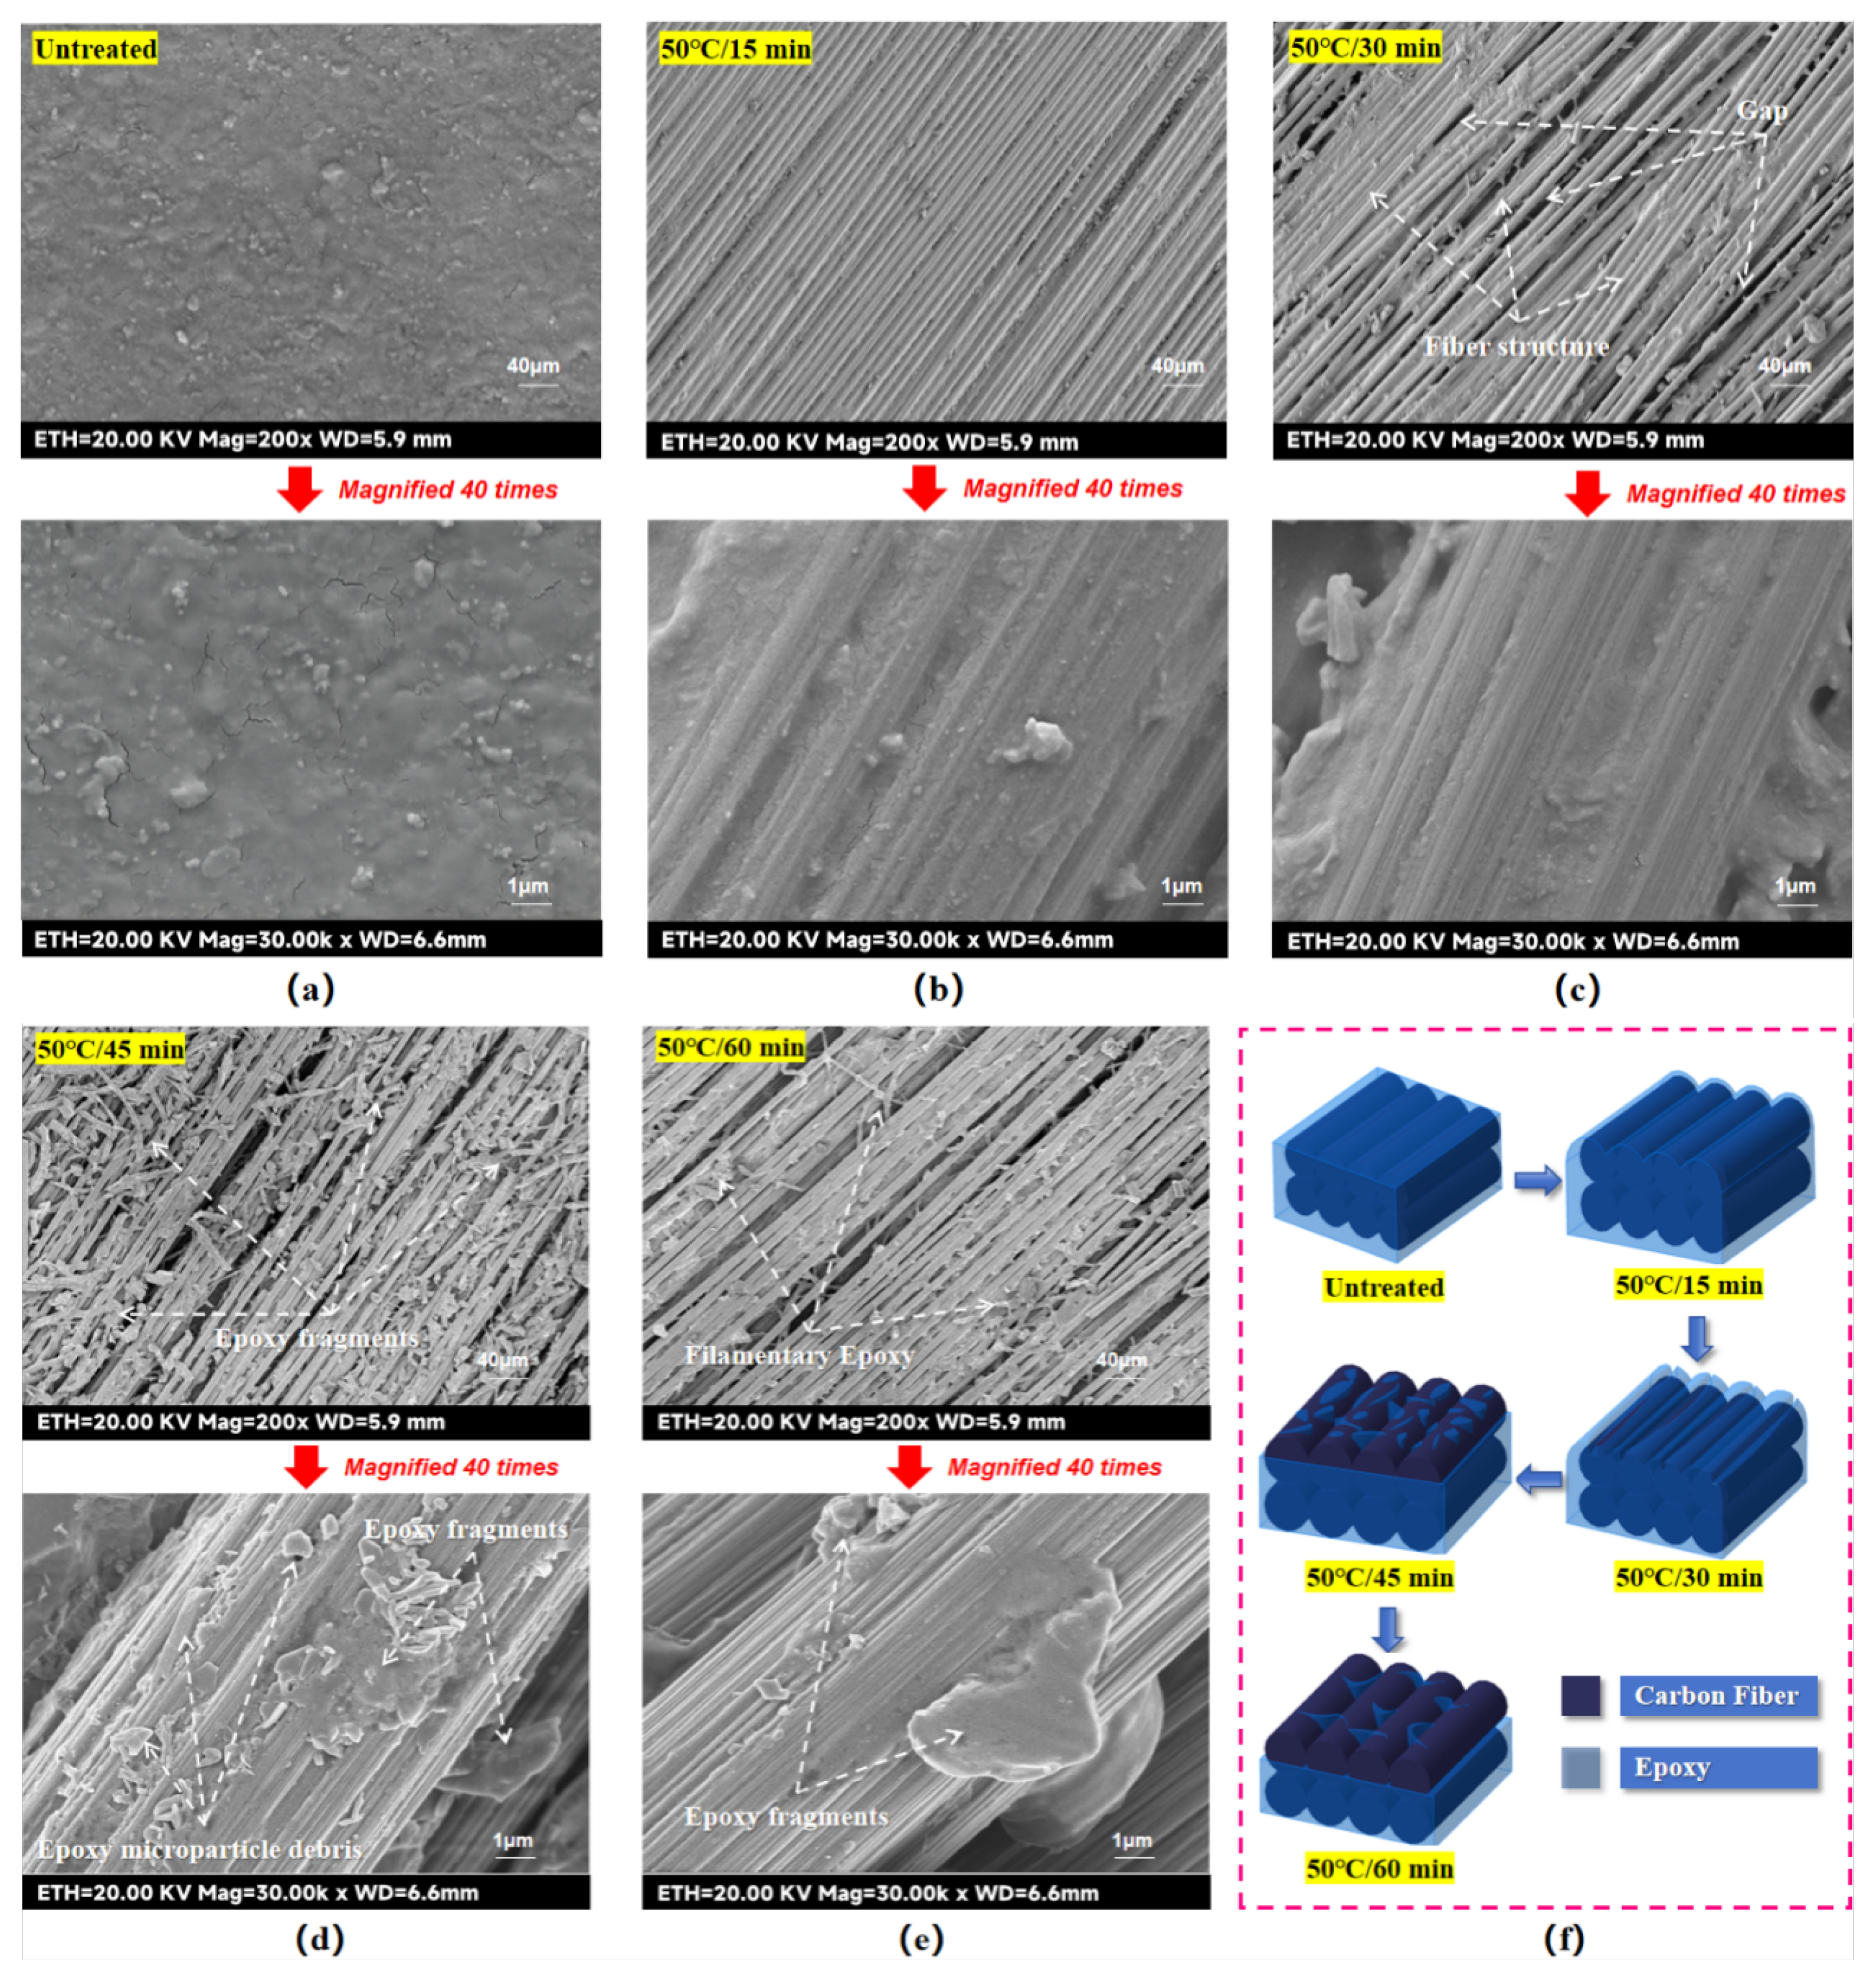
Figure 7.
Surface contact angle of materials after surface treatment with different variable (Time-variable, Temperature-variable) groups. (a)Surface contact angle of untreated parts. (b)Surface contact angle of Temperature-variable experimental groups. (c)Surface contact angle of Time-variable experimental groups.
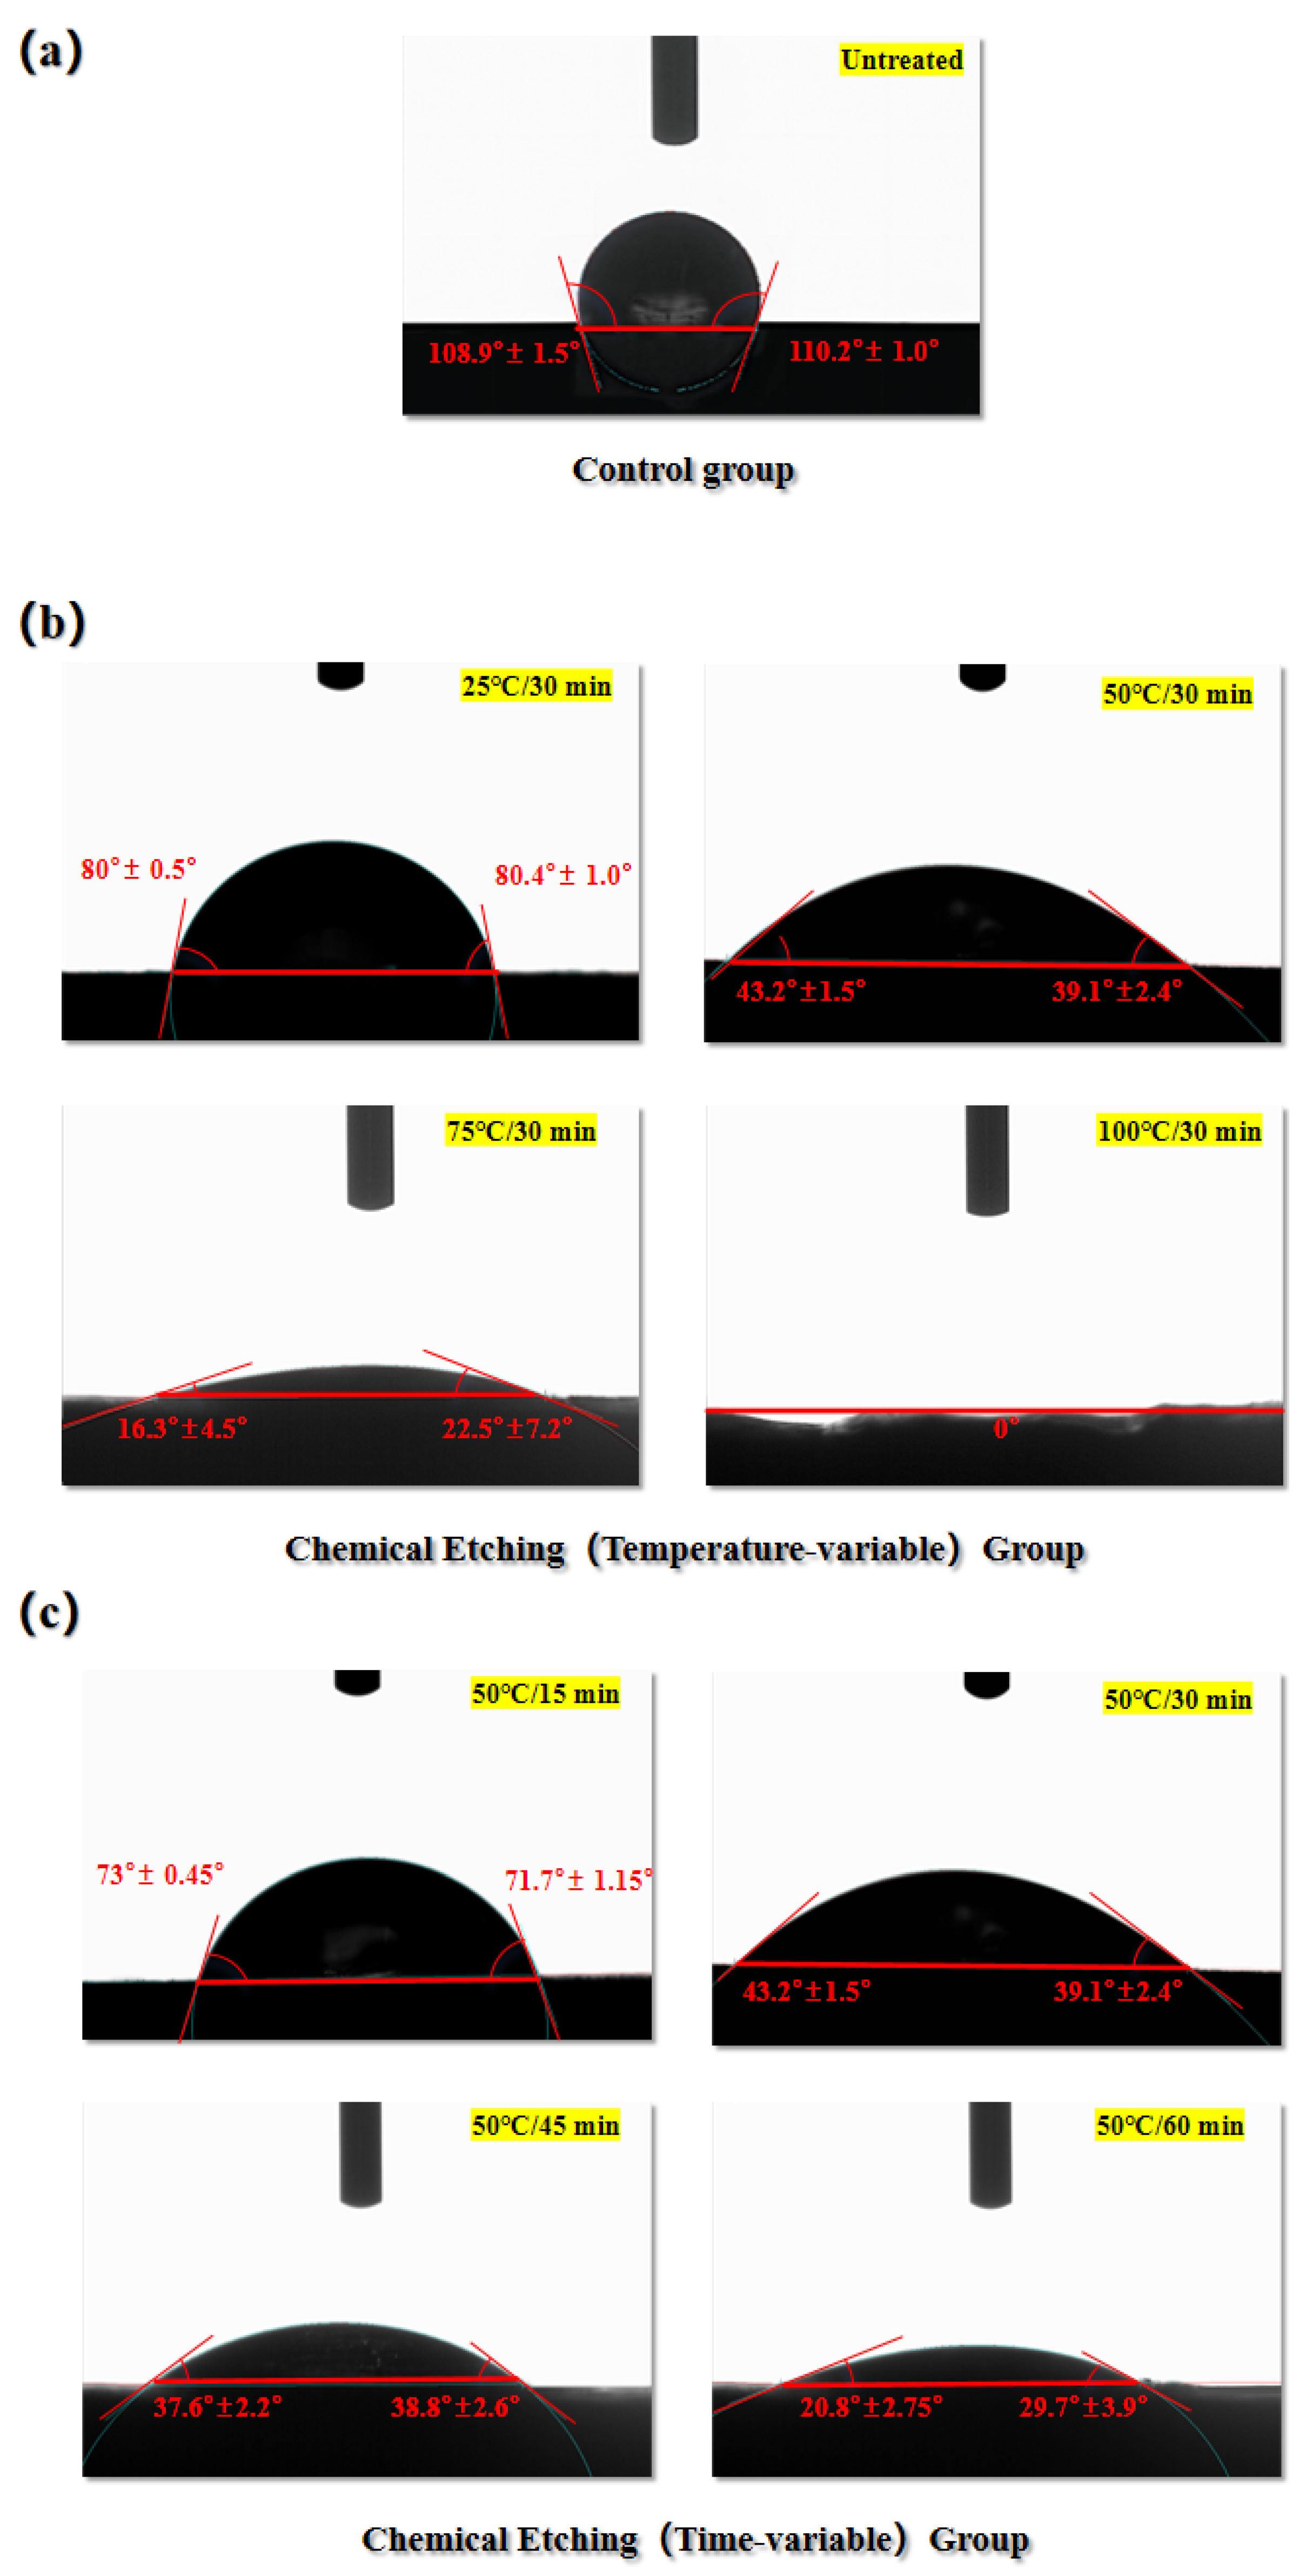
Figure 8.
Surface elemental content before and after Acid-etching. (a)XPS full spectrum of chemical elements in the surface of laminate (Temperature-variable experimental groups). (b)Percentage of elemental content of C and O in the surface of laminate (Temperature-variable experimental groups). (c)Percentage of elemental content of N in the surface surface of laminate (Temperature-variable experimental groups). (d)XPS full spectrum of chemical elements in the surface of laminate (Time-variable experimental groups). (e)Percentage of elemental content of C and O in the surface layer of laminate (Time-variable experimental groups). (f)Percentage of elemental content of N in the surface of laminate (Time-variable experimental groups).
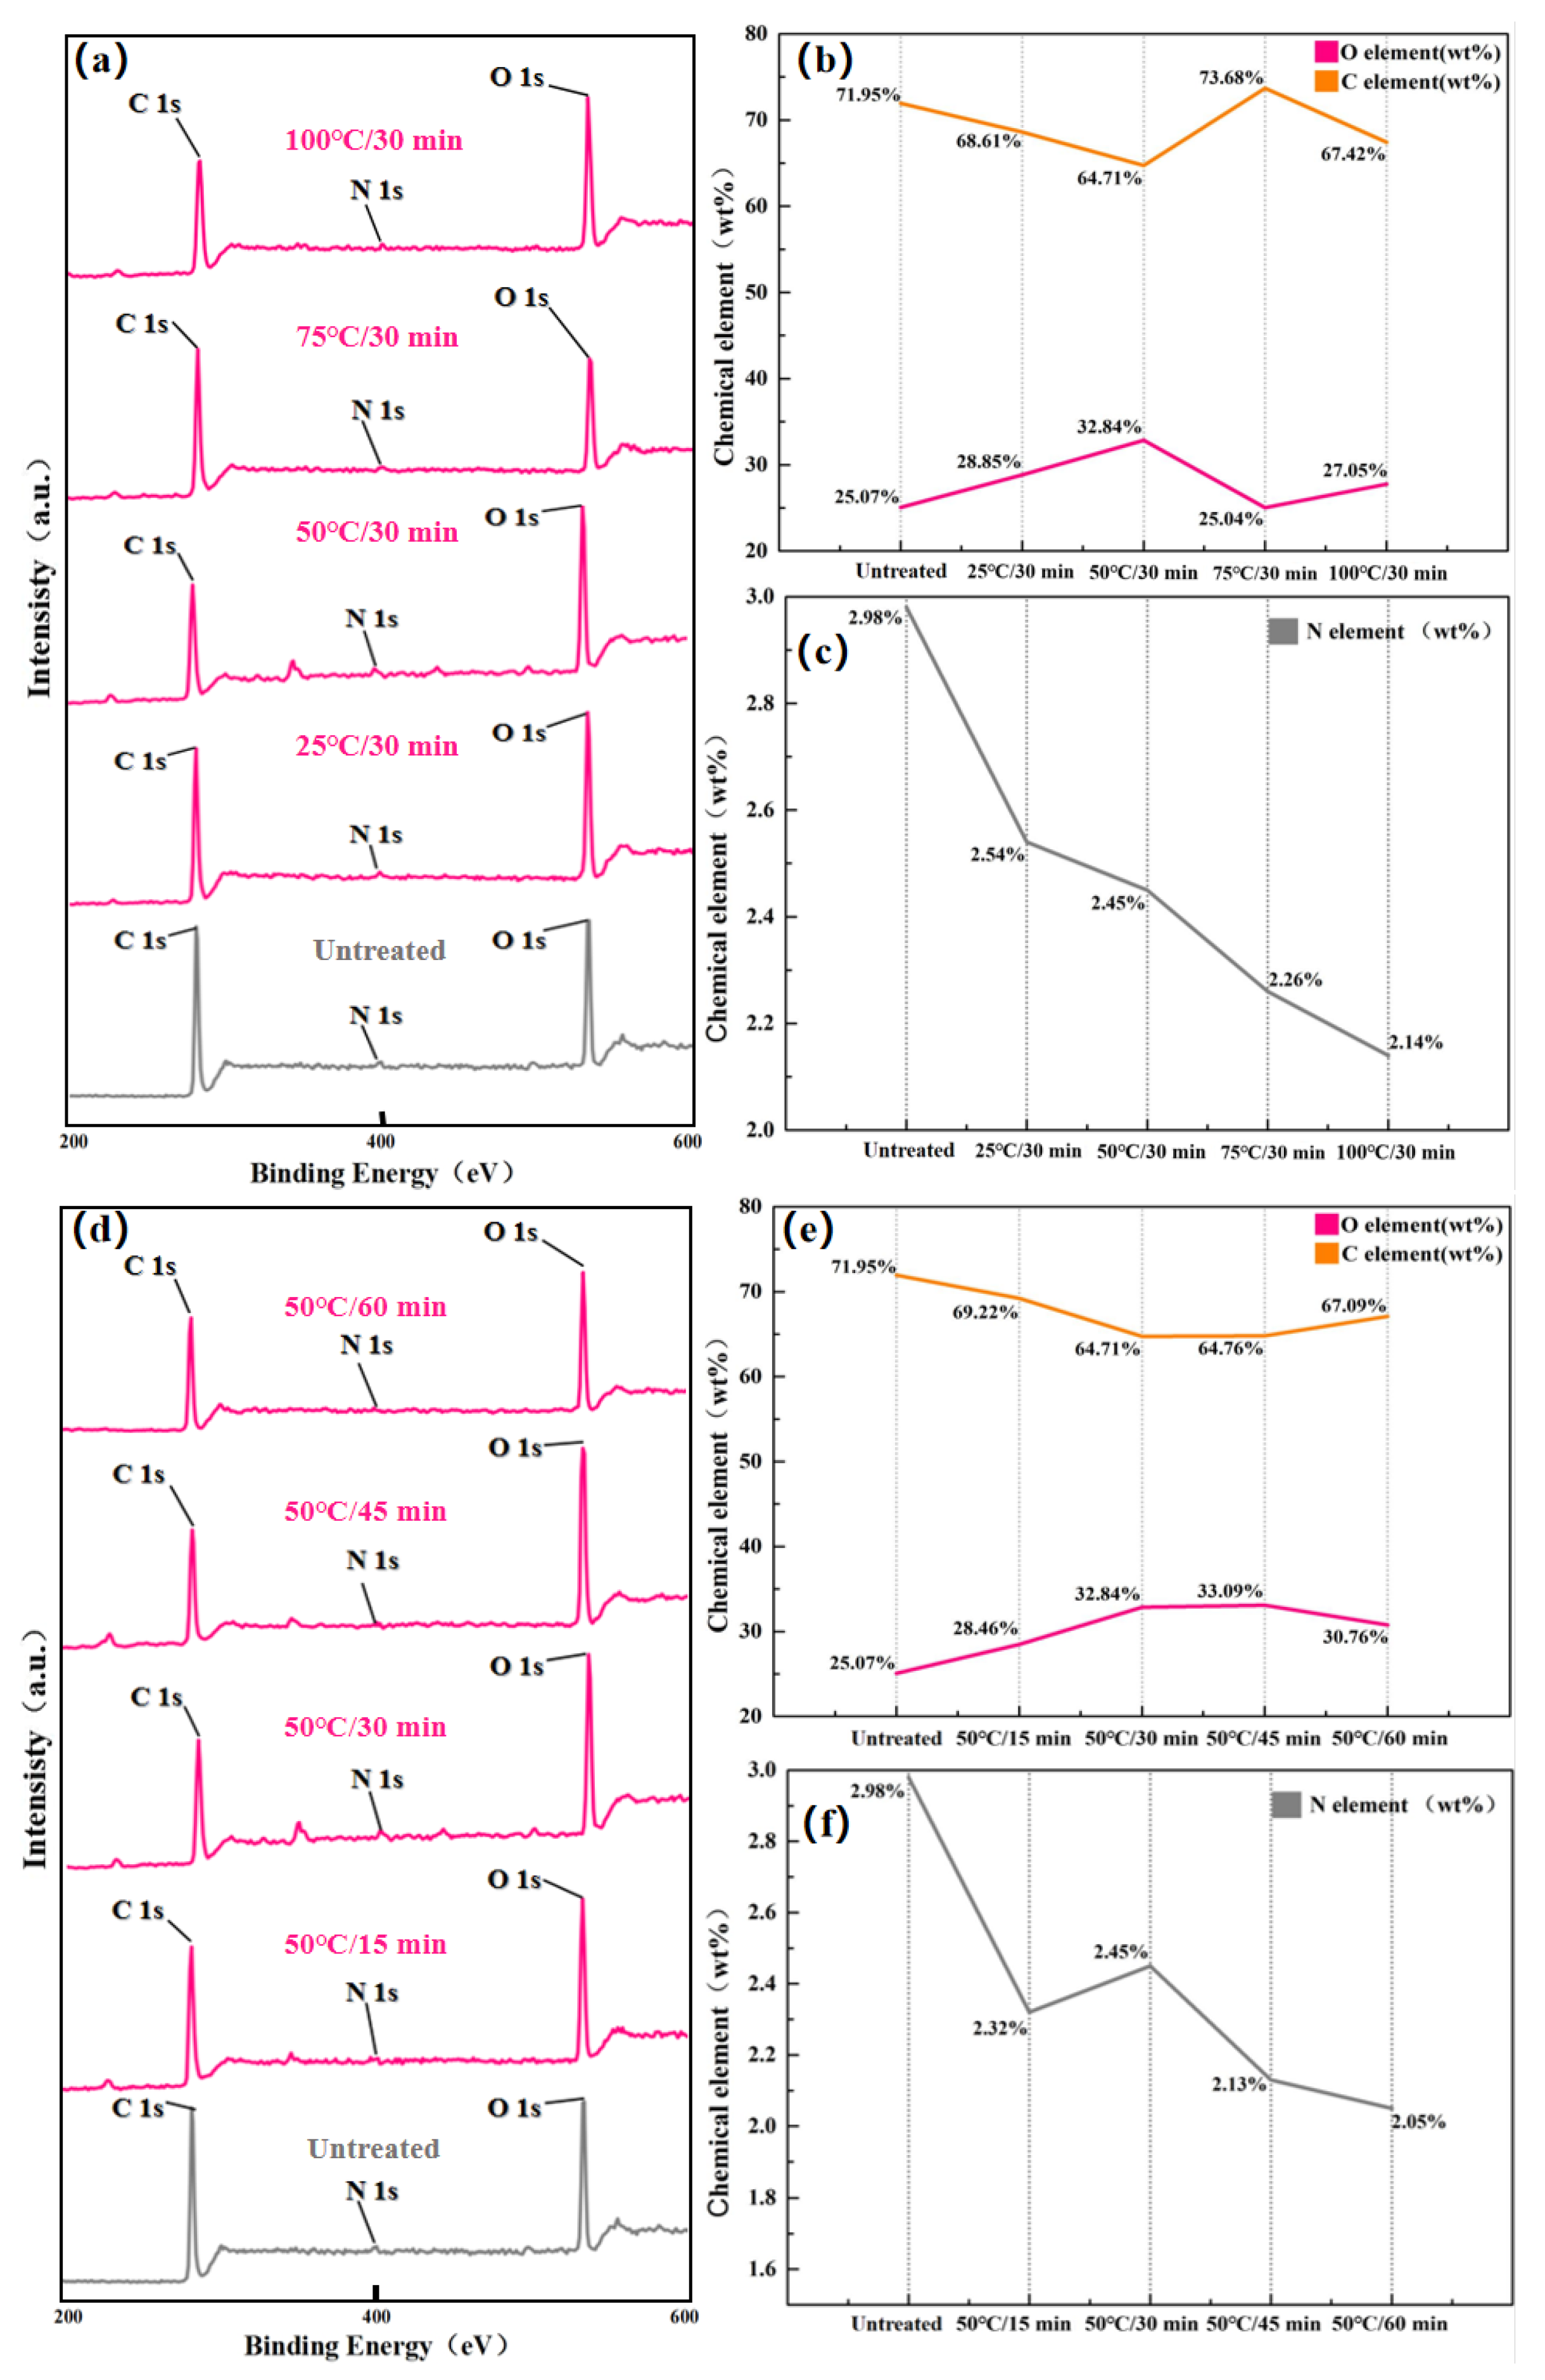
Figure 9.
Results of XPS analysis of samples (Temperature-variable experimental groups). (a)High-resolution C 1s fitted peaks of laminates. (b)Percentage of chemical groups content in the surface layer.
Figure 9.
Results of XPS analysis of samples (Temperature-variable experimental groups). (a)High-resolution C 1s fitted peaks of laminates. (b)Percentage of chemical groups content in the surface layer.
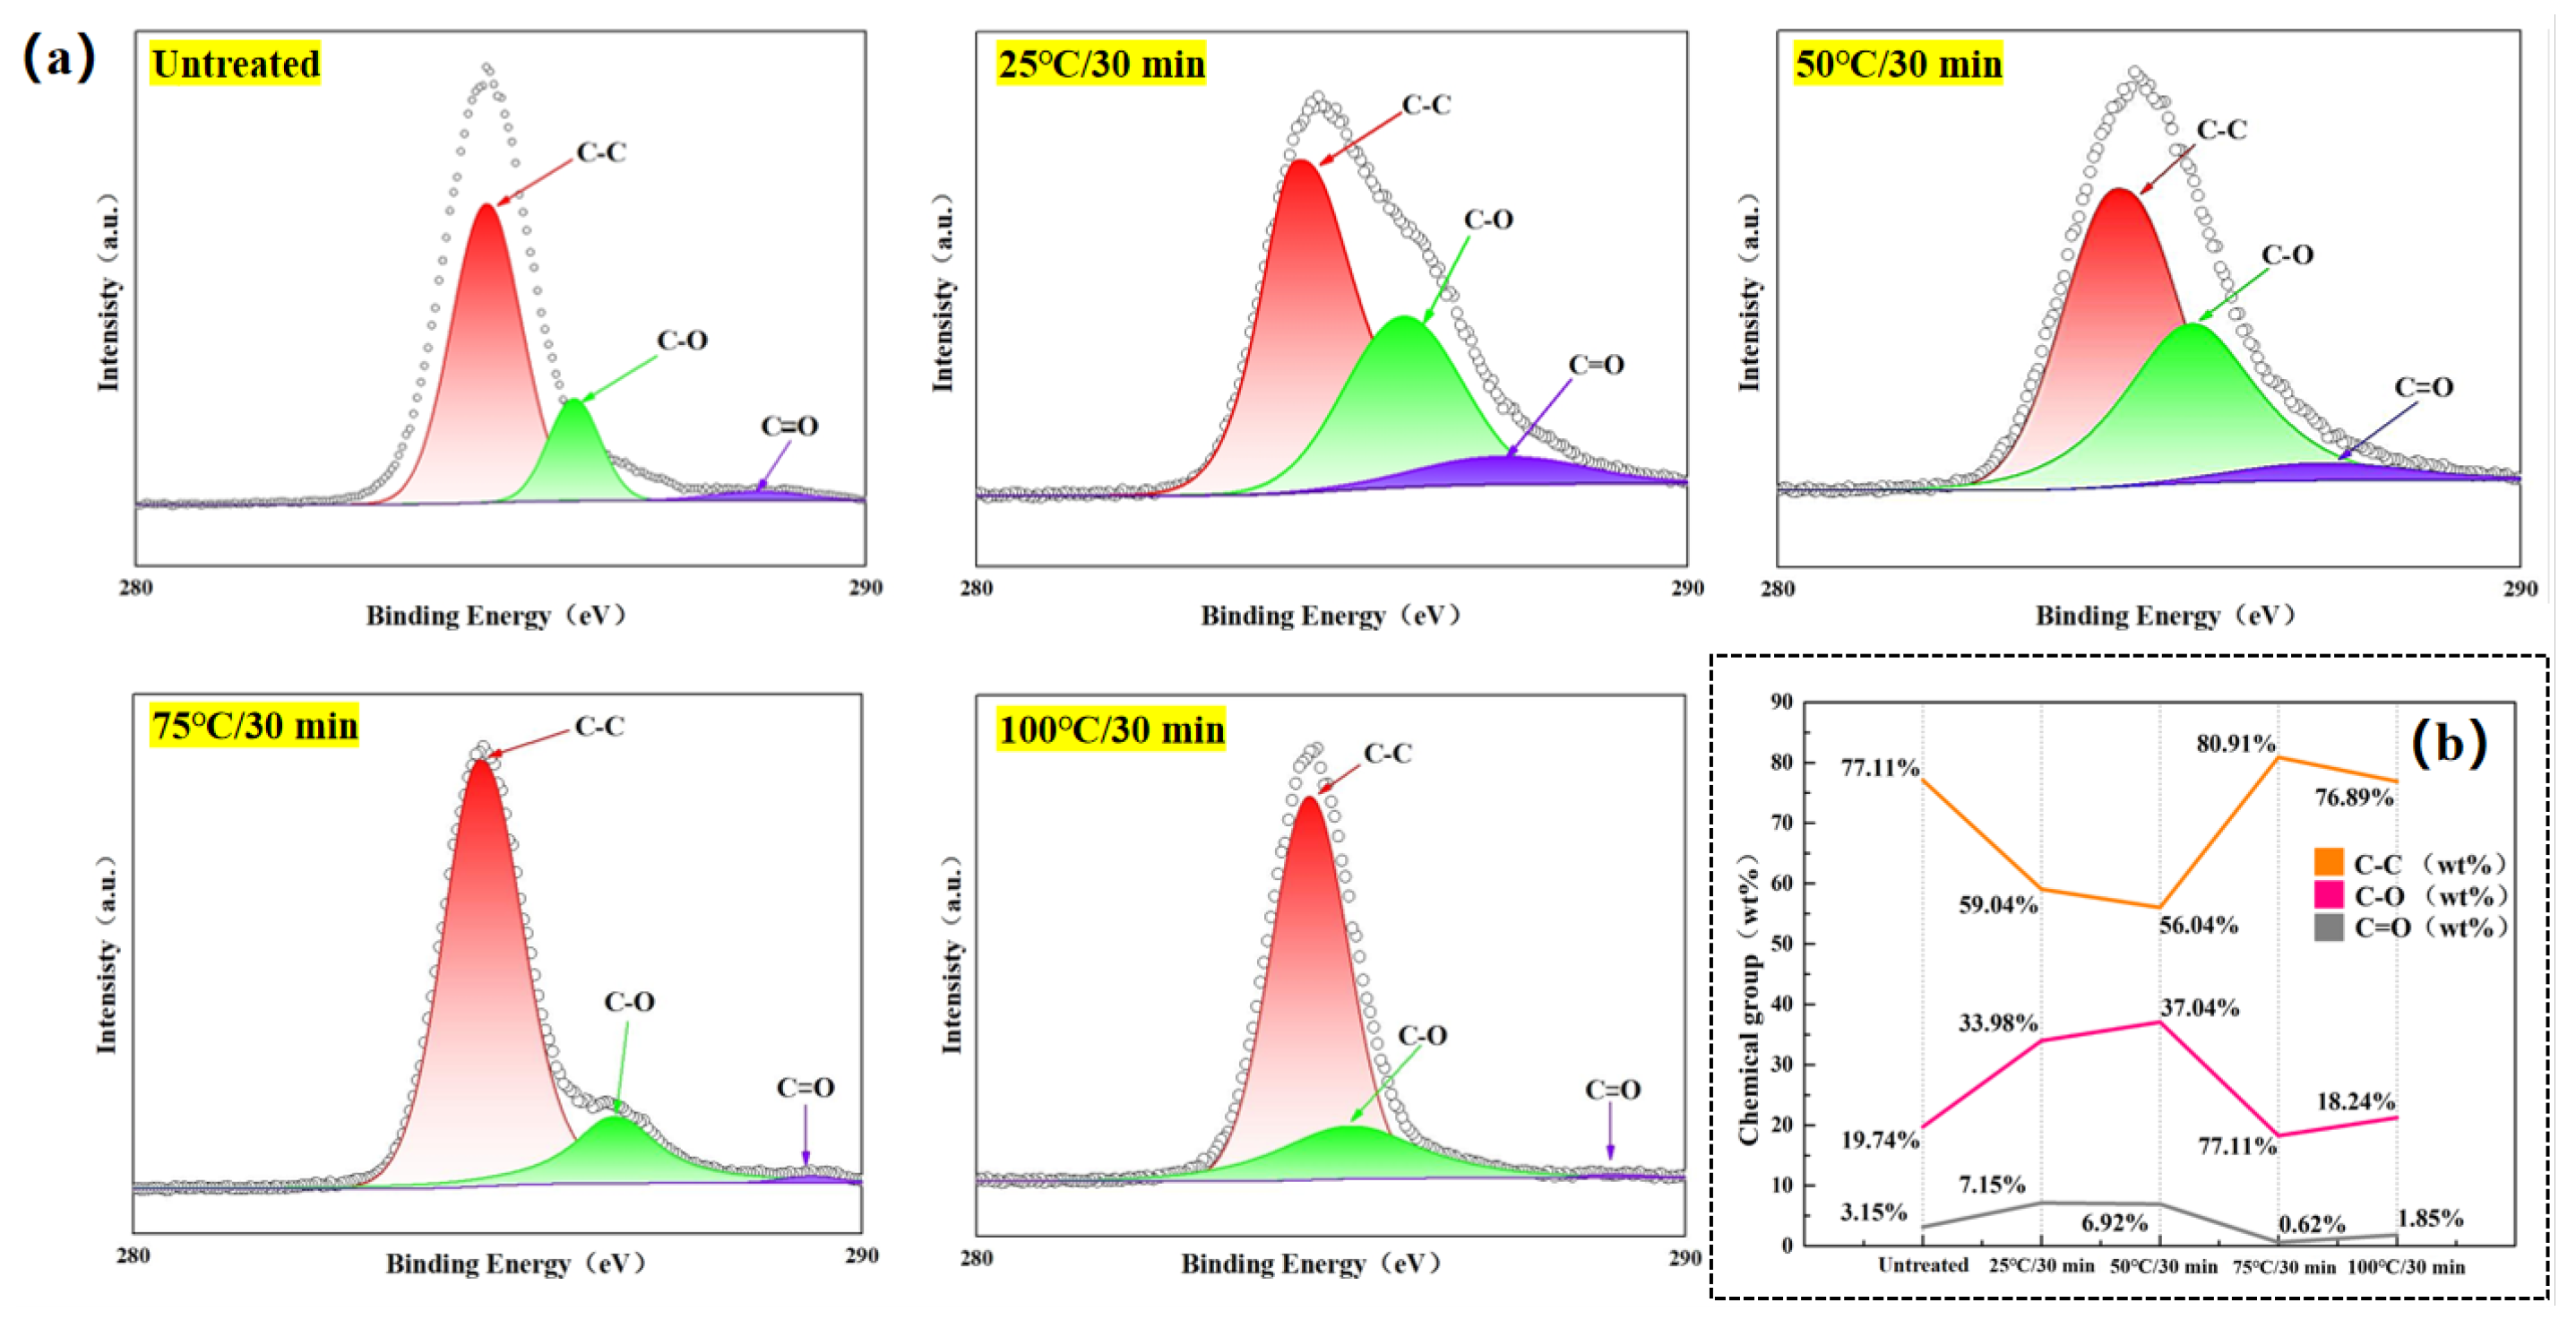
Figure 10.
Results of XPS analysis of samples (Time-variable experimental groups). (a)High-resolution C 1s fitted peaks of laminates. (b)Percentage of chemical groups content in the surface layer.
Figure 10.
Results of XPS analysis of samples (Time-variable experimental groups). (a)High-resolution C 1s fitted peaks of laminates. (b)Percentage of chemical groups content in the surface layer.
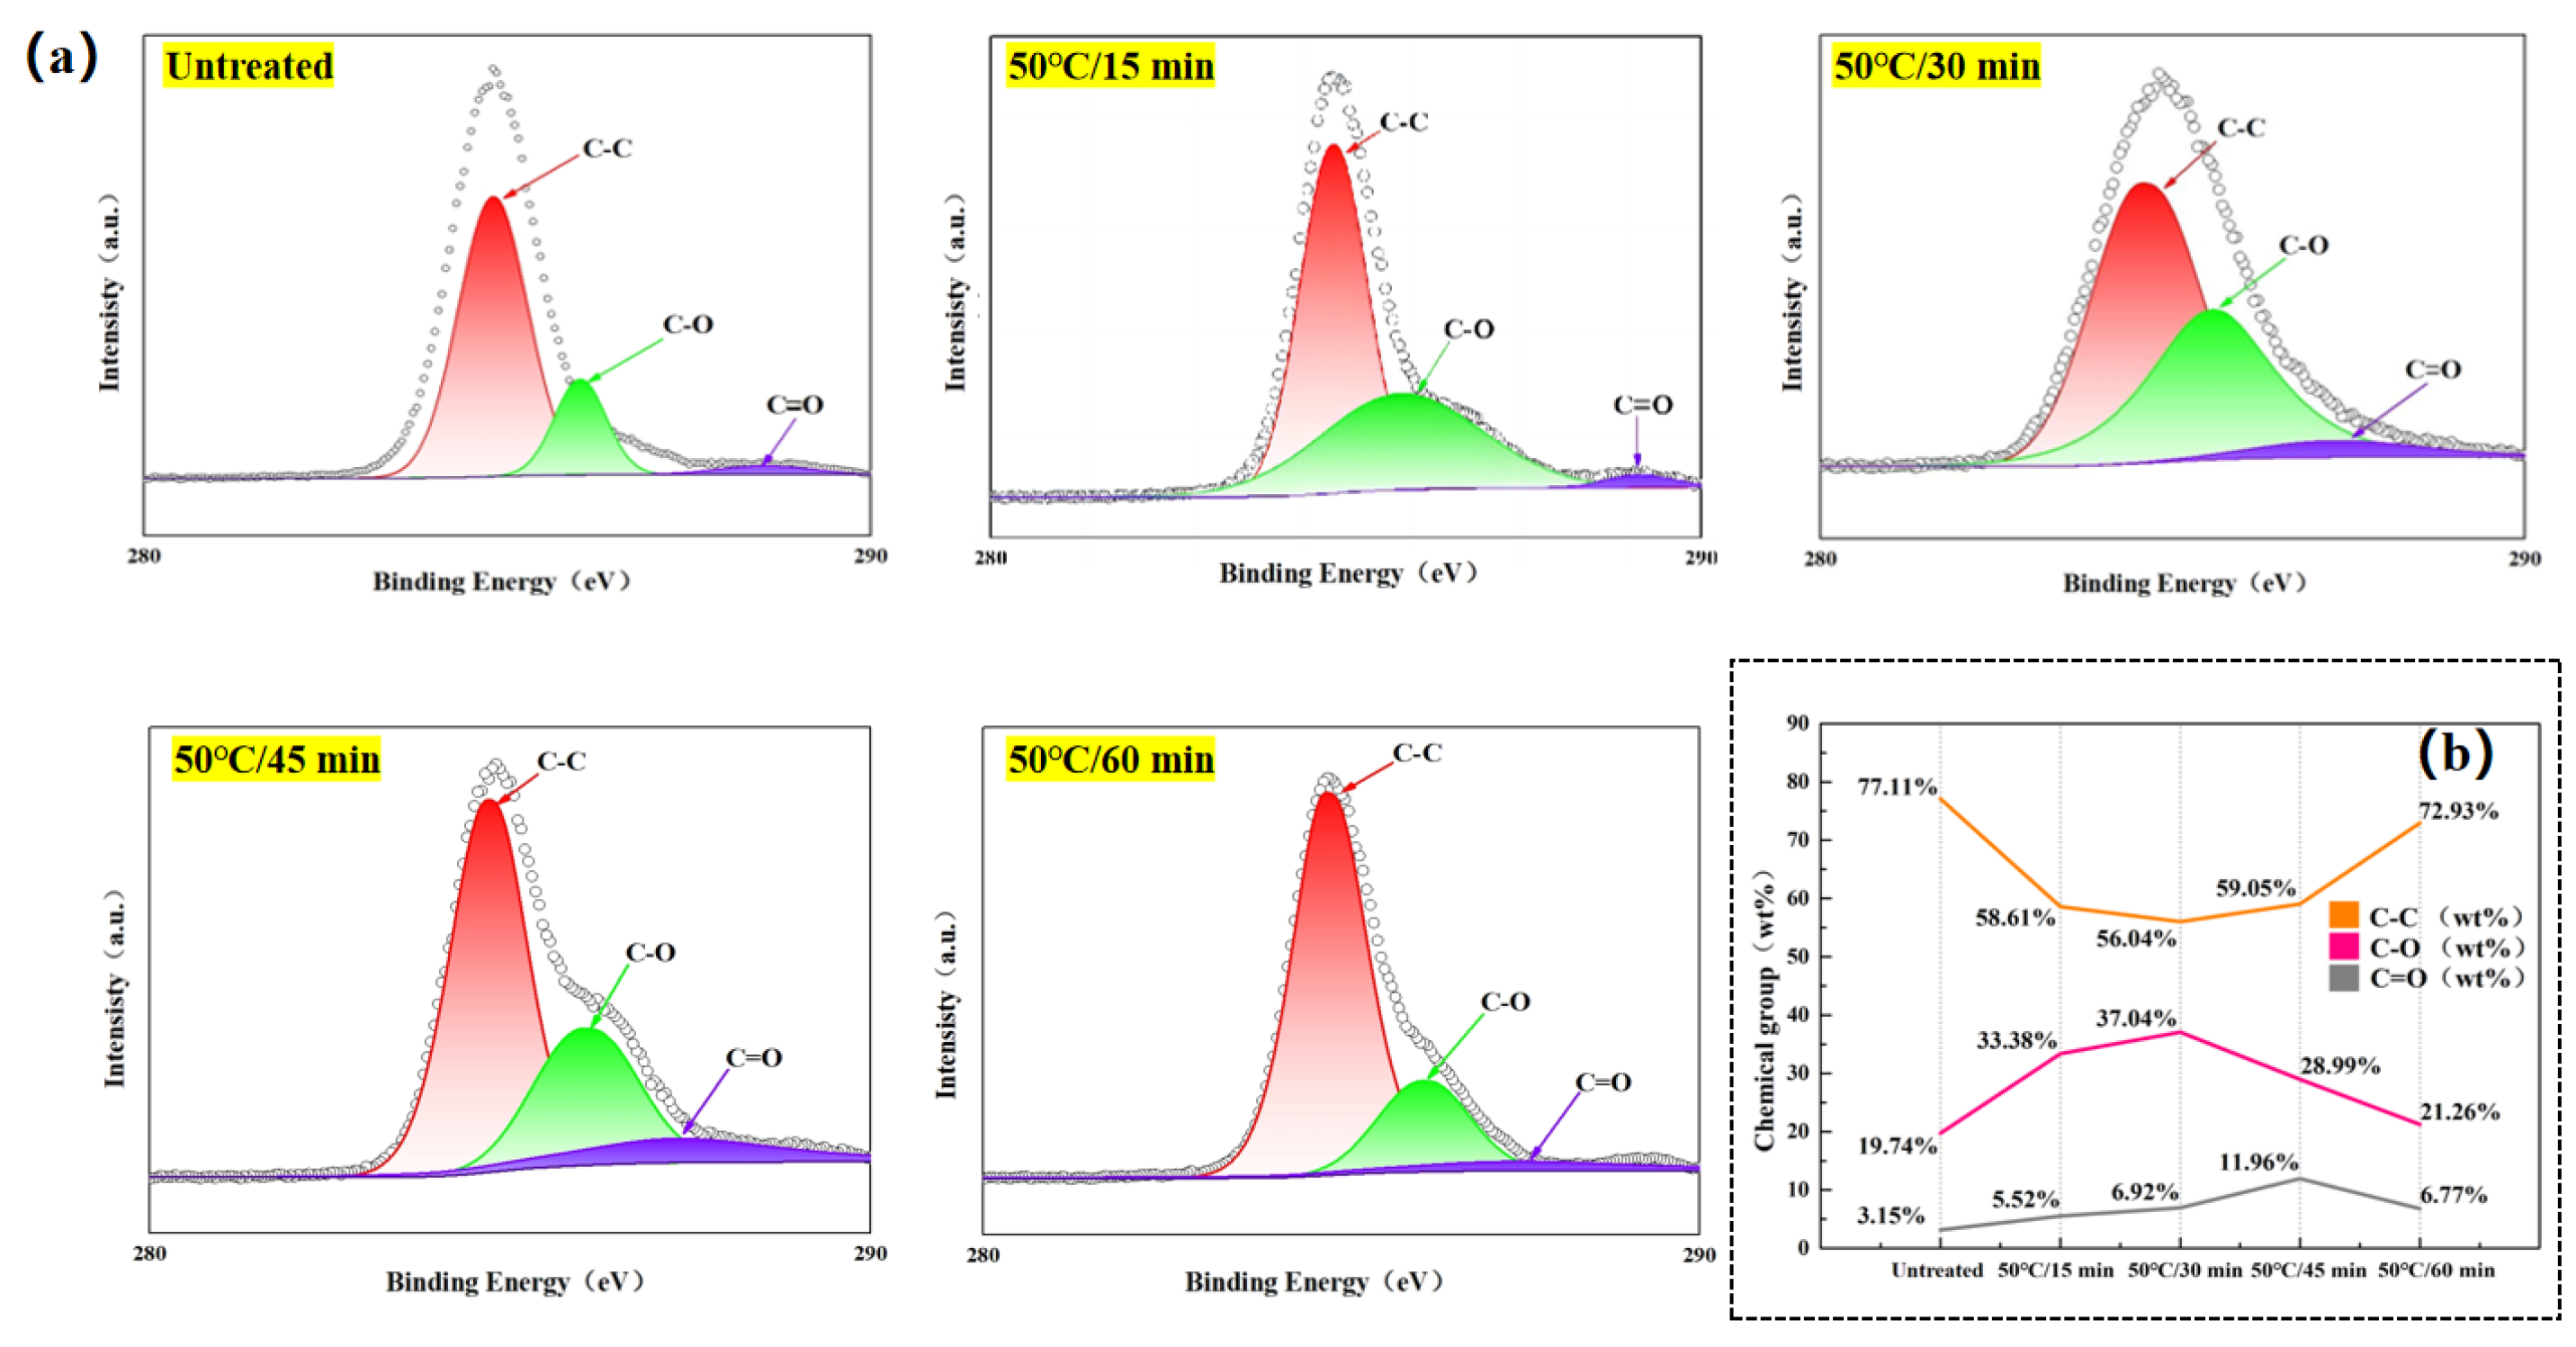
Figure 11.
(a)welded joint failure mode. (b)critical strength interface. (c)thermoplastic resin layer failure mode.
Figure 11.
(a)welded joint failure mode. (b)critical strength interface. (c)thermoplastic resin layer failure mode.
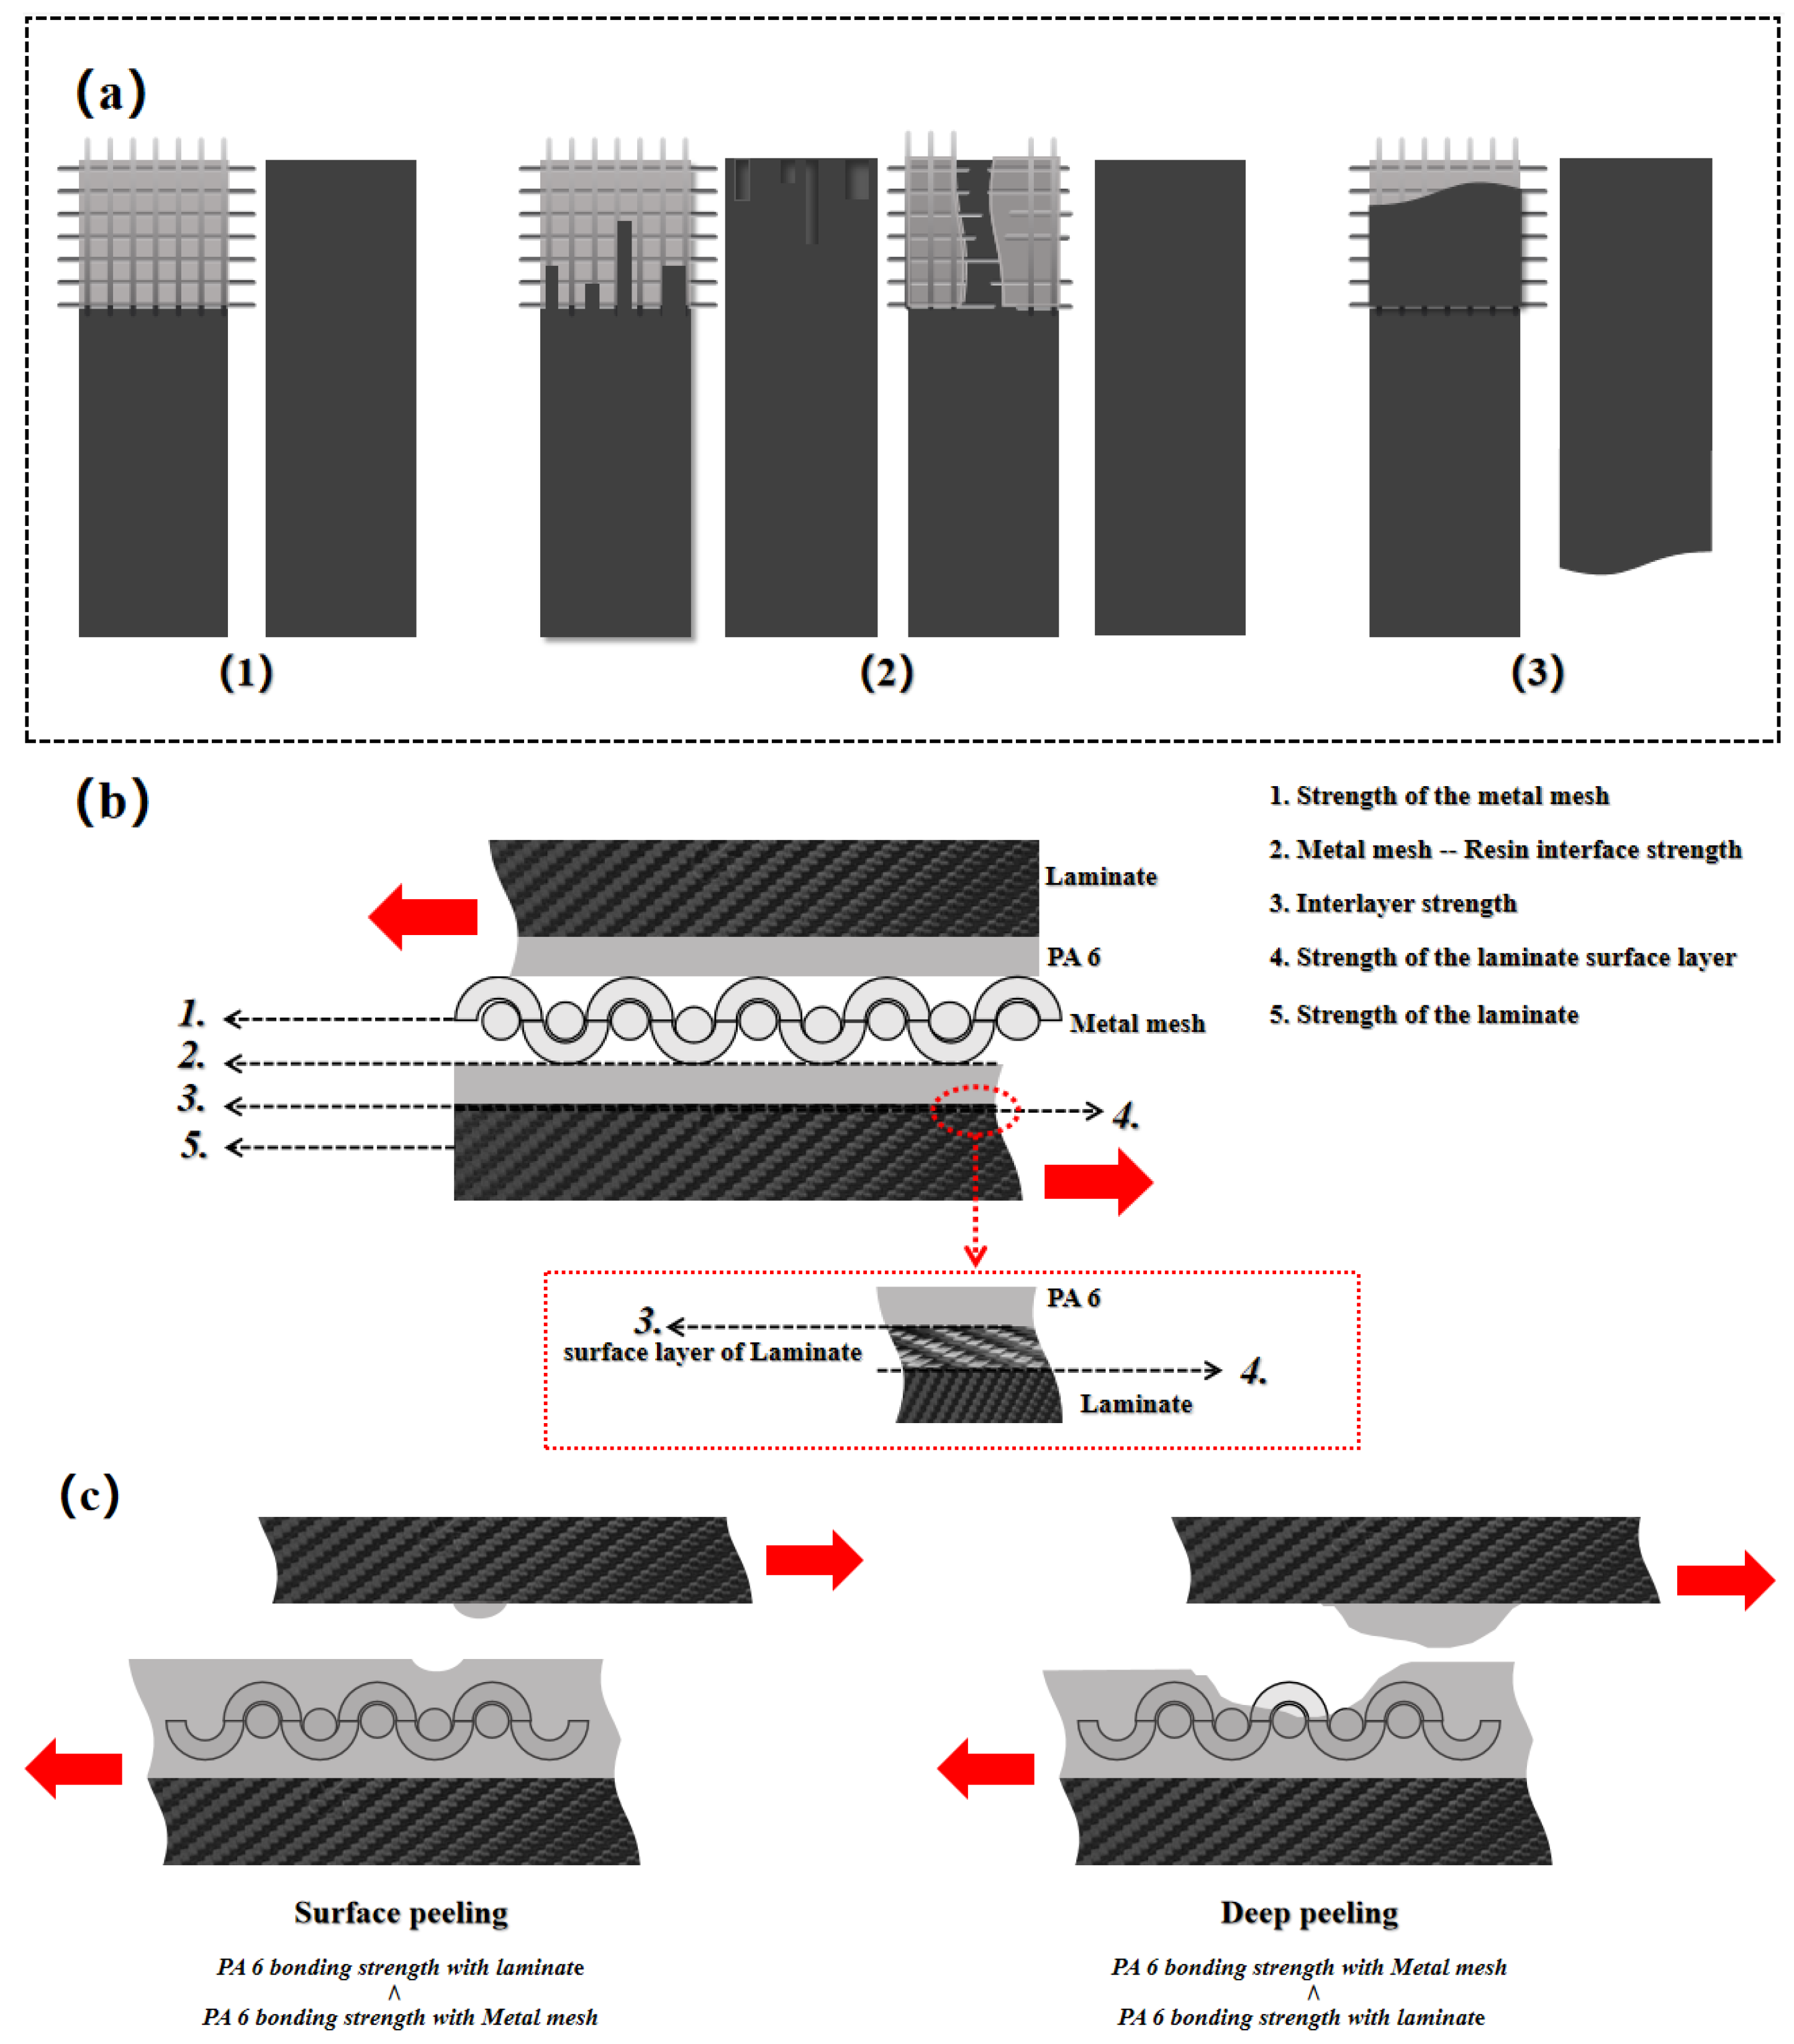
Figure 12.
Morphological observation of welded joint failure interface (Temperature-variable experimental groups). (a)welded joint failure interface. (b)heating element failure interface. (c)laminate failure interface.
Figure 12.
Morphological observation of welded joint failure interface (Temperature-variable experimental groups). (a)welded joint failure interface. (b)heating element failure interface. (c)laminate failure interface.
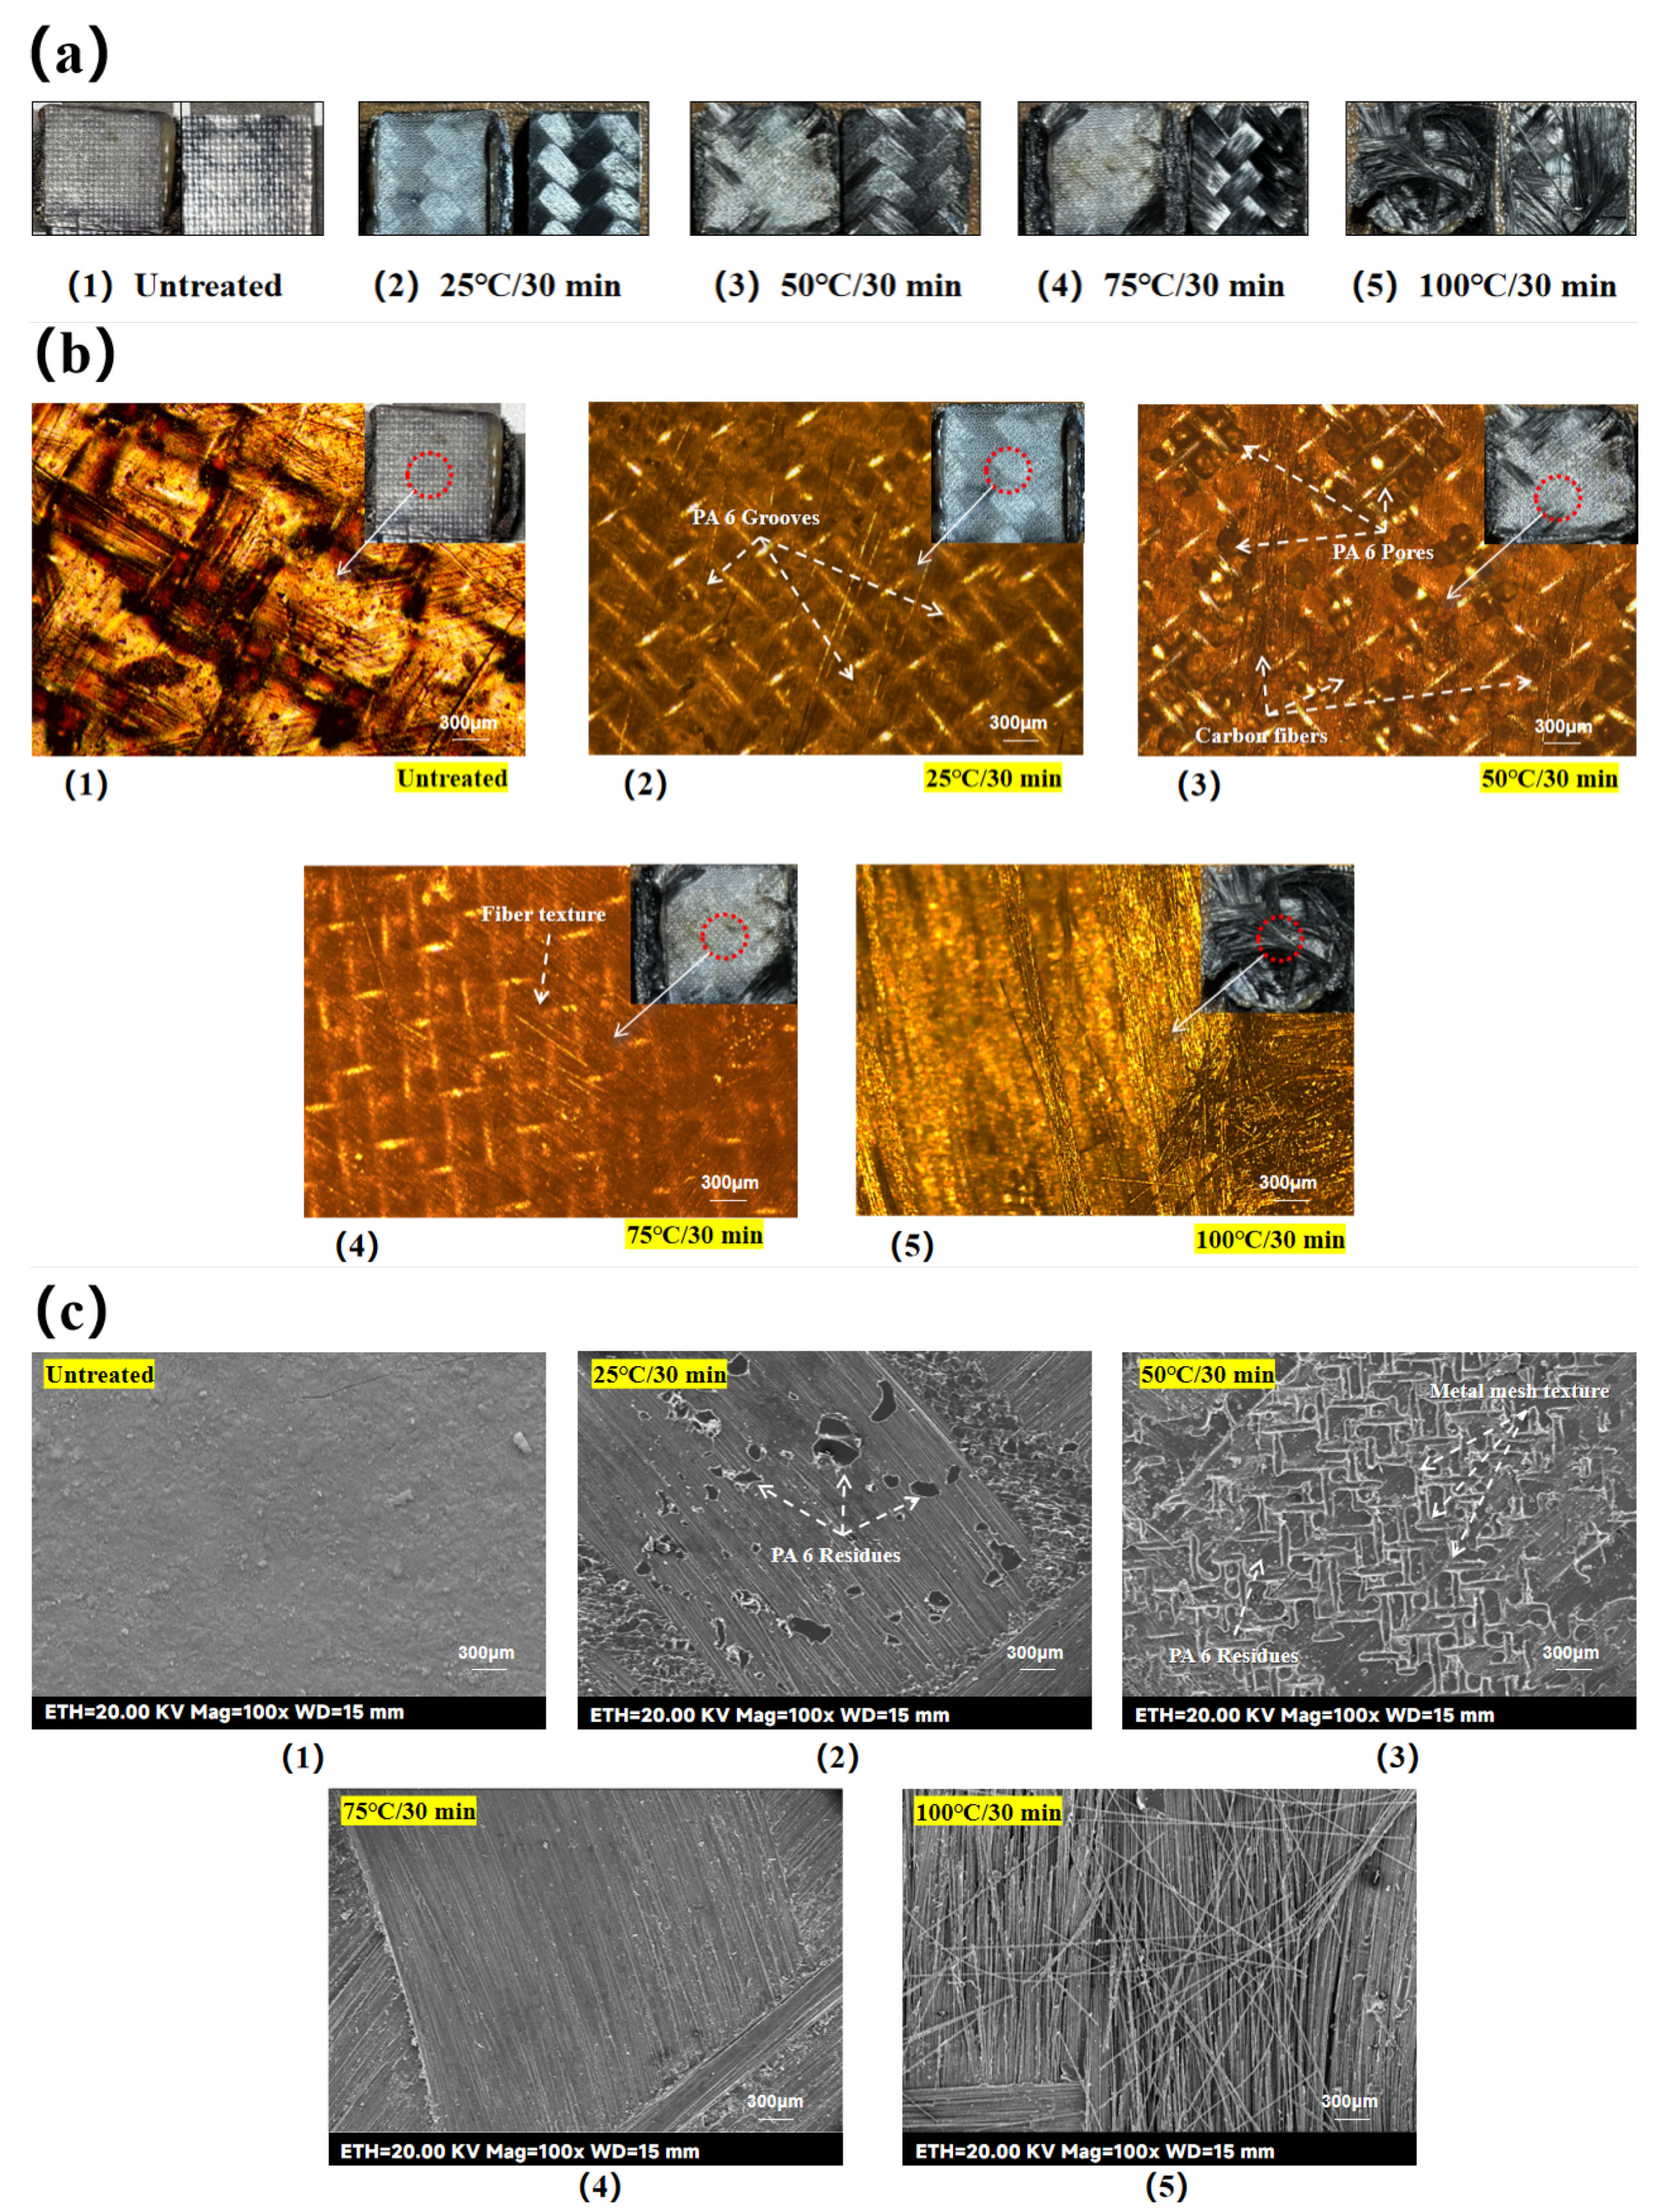
Figure 13.
Morphological observation of welded joint failure interface (Time-variable experimental groups). (a)welded joint failure interface. (b)heating element failure interface. (c)laminate failure interface.
Figure 13.
Morphological observation of welded joint failure interface (Time-variable experimental groups). (a)welded joint failure interface. (b)heating element failure interface. (c)laminate failure interface.
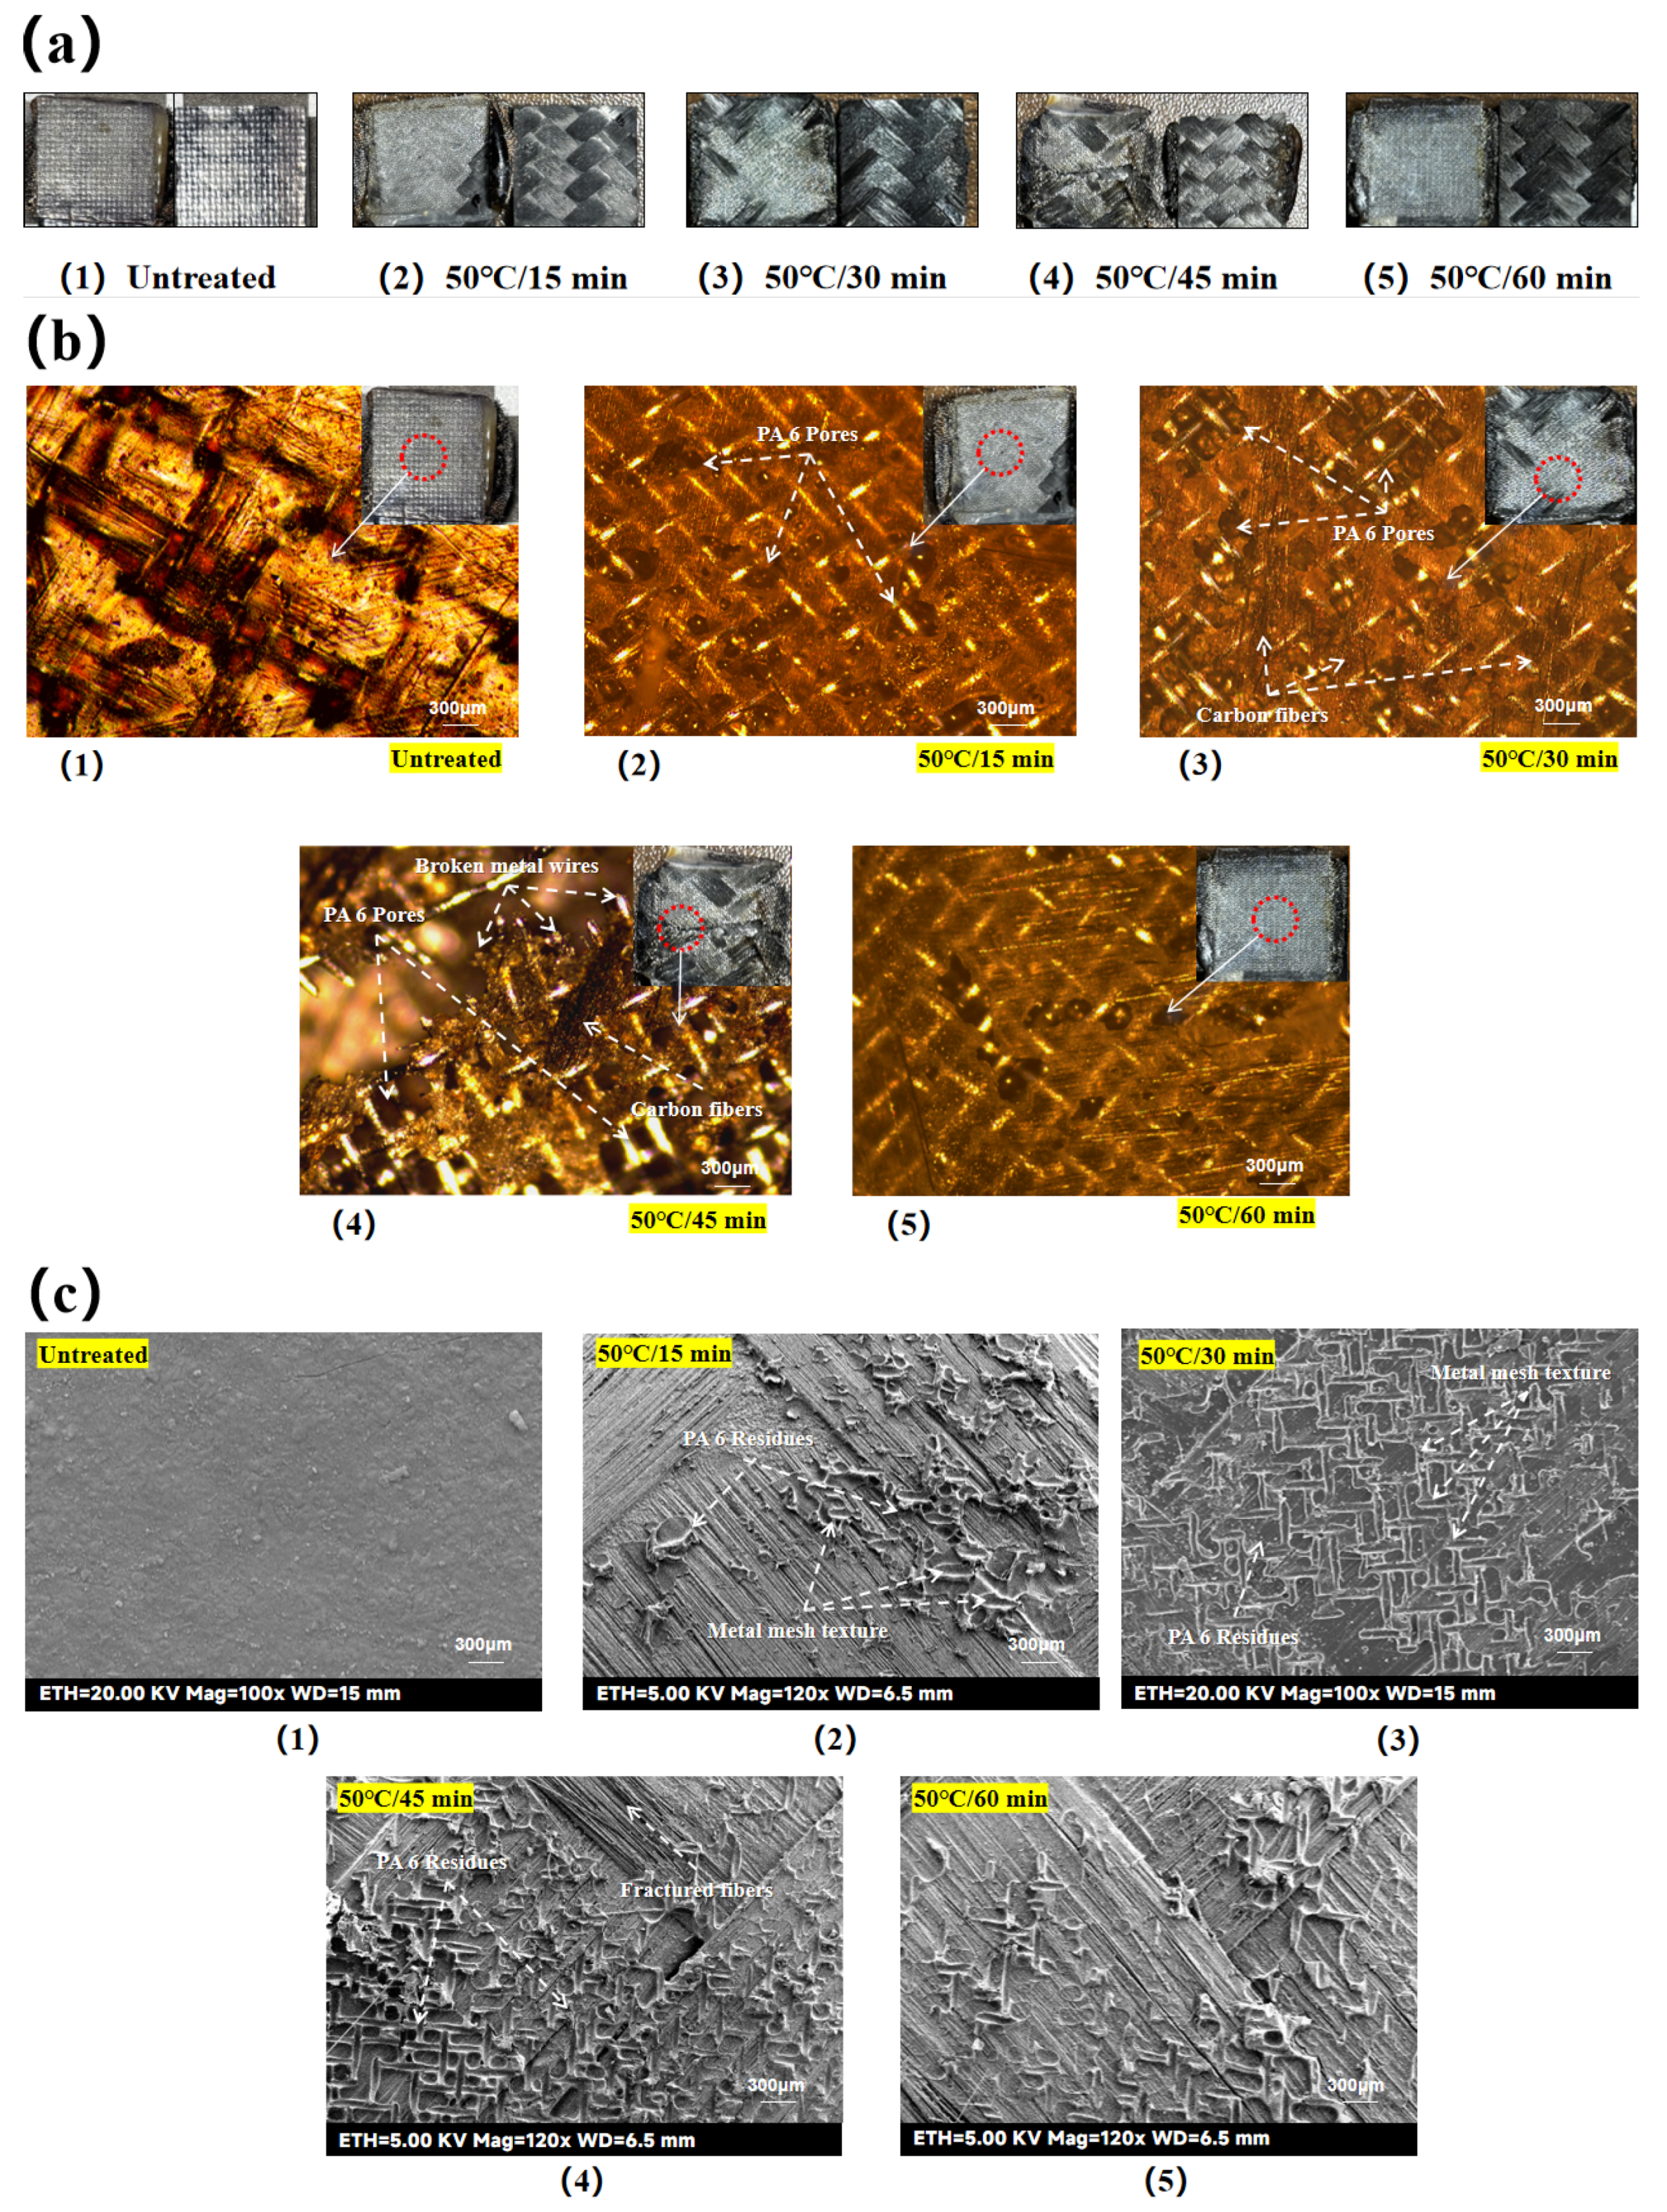

Table 1.
Temperature measurement results in the welding area
| Welding Power | T | T | T | T | |
|---|---|---|---|---|---|
| 270 W | 97.3 S | 186.7 s | 103.3 s | 129.0 s | |
| 300 W | 30.0 s | 27.7 s | 57.3 s | 38.3 s | |
| 330 W | 19.0 s | 22.7 s | 48.3 s | 29.7 s | |
| 360 W | 17.7 s | 13.3 s | 32.3 s | 20.7 s |
T:Time for point 1 to reach 220°C;T:Time for point 2 to reach 220°C;T:Time for point 3 to reach 220°C;T:Time to reach 220°C in the weld area.
Table 2.
Orthogonal experimental factors and levels of the resistance welding
| Welding Parameters | Levels 1 | Levels 2 | Levels 3 | |
|---|---|---|---|---|
| Welding Power | 300 W | 360 W | 390 W | |
| Welding Pressure | 0.7 MPa | 0.8 MPa | 0.9 MPa | |
| Welding Time | 30 s | 45 s | 60 s |
Table 3.
Orthogonal experimental parameters of CF/EP samples
| NO. | Welding Power | Welding Pressure | Welding Time | |
|---|---|---|---|---|
| A | 300 W | 0.7 MPa | 30 s | |
| B | 300 W | 0.8 MPa | 45 s | |
| C | 300 W | 0.9 MPa | 60 s | |
| D | 360 W | 0.7 MPa | 30 s | |
| E | 360 W | 0.8 MPa | 45 s | |
| F | 360 W | 0.9 MPa | 60 s | |
| G | 390 W | 0.7 MPa | 30 s | |
| H | 390 W | 0.8 MPa | 45 s | |
| I | 390 W | 0.9 MPa | 60 s |
Disclaimer/Publisher’s Note: The statements, opinions and data contained in all publications are solely those of the individual author(s) and contributor(s) and not of MDPI and/or the editor(s). MDPI and/or the editor(s) disclaim responsibility for any injury to people or property resulting from any ideas, methods, instructions or products referred to in the content. |
© 2025 by the authors. Licensee MDPI, Basel, Switzerland. This article is an open access article distributed under the terms and conditions of the Creative Commons Attribution (CC BY) license (http://creativecommons.org/licenses/by/4.0/).
Copyright: This open access article is published under a Creative Commons CC BY 4.0 license, which permit the free download, distribution, and reuse, provided that the author and preprint are cited in any reuse.


